Zip Codes with the Highest Percentage of Population Employed in Legal Services & Support in Bowie, MD
RELATED REPORTS & OPTIONS
Legal Services & Support
Bowie
Compare Zip Codes
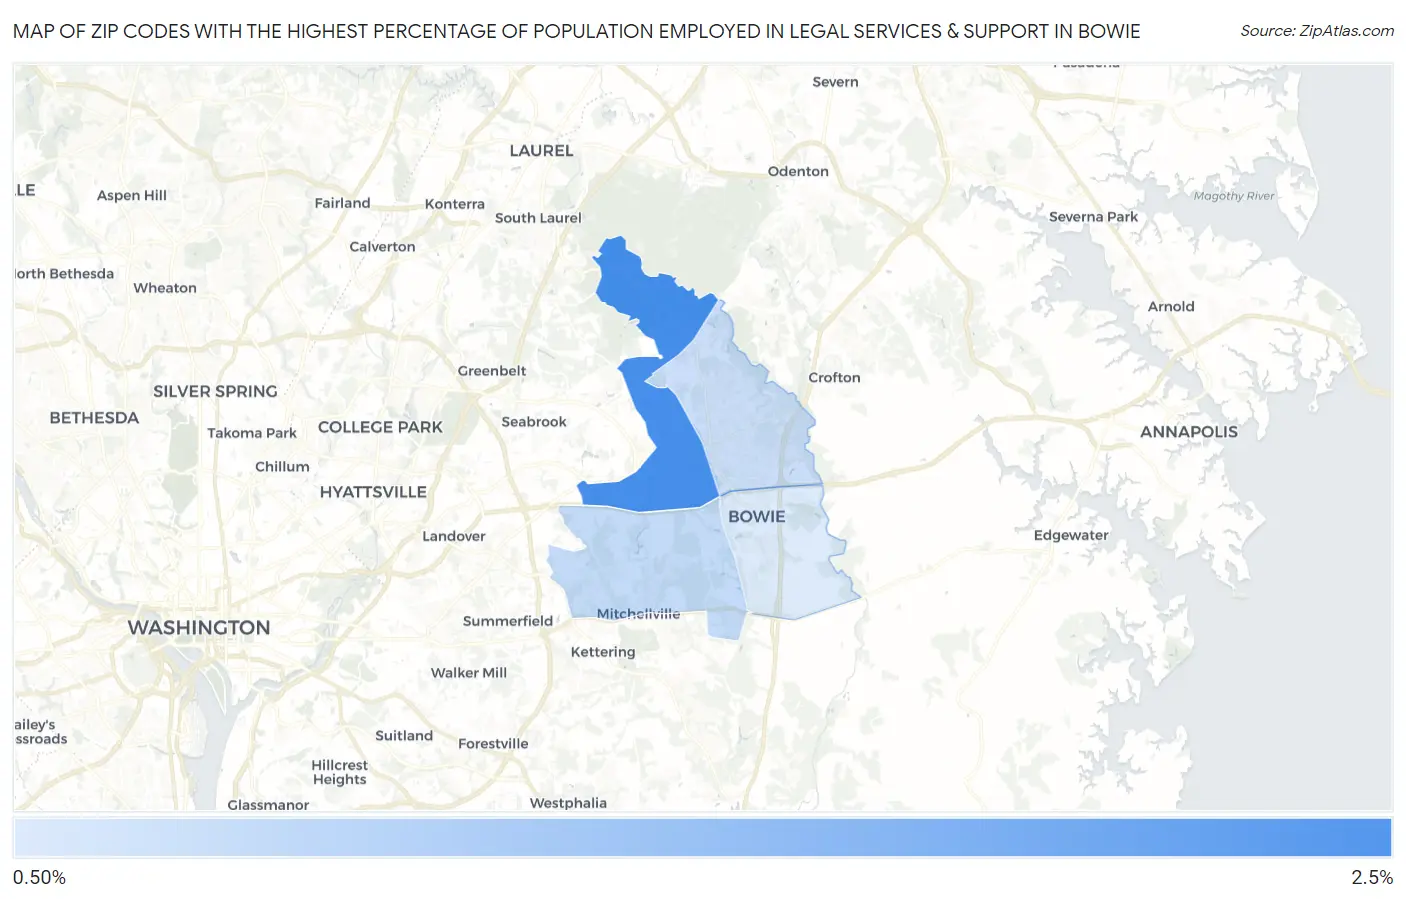
Map of Zip Codes with the Highest Percentage of Population Employed in Legal Services & Support in Bowie
1.1%
2.0%
Zip Codes with the Highest Percentage of Population Employed in Legal Services & Support in Bowie, MD
| Zip Code | % Employed | vs State | vs National | |
| 1. | 20720 | 2.0% | 1.8%(+0.276)#99 | 1.2%(+0.865)#3,340 |
| 2. | 20721 | 1.3% | 1.8%(-0.487)#158 | 1.2%(+0.102)#6,003 |
| 3. | 20715 | 1.3% | 1.8%(-0.521)#163 | 1.2%(+0.069)#6,198 |
| 4. | 20716 | 1.1% | 1.8%(-0.635)#177 | 1.2%(-0.046)#6,902 |
1
Common Questions
What are the Top 3 Zip Codes with the Highest Percentage of Population Employed in Legal Services & Support in Bowie, MD?
Top 3 Zip Codes with the Highest Percentage of Population Employed in Legal Services & Support in Bowie, MD are:
What zip code has the Highest Percentage of Population Employed in Legal Services & Support in Bowie, MD?
20720 has the Highest Percentage of Population Employed in Legal Services & Support in Bowie, MD with 2.0%.
What is the Percentage of Population Employed in Legal Services & Support in Bowie, MD?
Percentage of Population Employed in Legal Services & Support in Bowie is 1.4%.
What is the Percentage of Population Employed in Legal Services & Support in Maryland?
Percentage of Population Employed in Legal Services & Support in Maryland is 1.8%.
What is the Percentage of Population Employed in Legal Services & Support in the United States?
Percentage of Population Employed in Legal Services & Support in the United States is 1.2%.