Riva, MD Map & Demographics
Riva Map
Riva Overview
$66,543
PER CAPITA INCOME
$154,297
AVG FAMILY INCOME
$145,601
AVG HOUSEHOLD INCOME
35.5%
WAGE / INCOME GAP [ % ]
64.5¢/ $1
WAGE / INCOME GAP [ $ ]
0.38
INEQUALITY / GINI INDEX
4,784
TOTAL POPULATION
2,493
MALE POPULATION
2,291
FEMALE POPULATION
108.82
MALES / 100 FEMALES
91.90
FEMALES / 100 MALES
42.4
MEDIAN AGE
3.2
AVG FAMILY SIZE
2.9
AVG HOUSEHOLD SIZE
2,276
LABOR FORCE [ PEOPLE ]
63.0%
PERCENT IN LABOR FORCE
3.3%
UNEMPLOYMENT RATE
Riva Zip Codes
Income in Riva
Income Overview in Riva
Per Capita Income in Riva is $66,543, while median incomes of families and households are $154,297 and $145,601 respectively.
| Characteristic | Number | Measure |
| Per Capita Income | 4,784 | $66,543 |
| Median Family Income | 1,359 | $154,297 |
| Mean Family Income | 1,359 | $194,482 |
| Median Household Income | 1,625 | $145,601 |
| Mean Household Income | 1,625 | $189,501 |
| Income Deficit | 1,359 | $0 |
| Wage / Income Gap (%) | 4,784 | 35.47% |
| Wage / Income Gap ($) | 4,784 | 64.53¢ per $1 |
| Gini / Inequality Index | 4,784 | 0.38 |
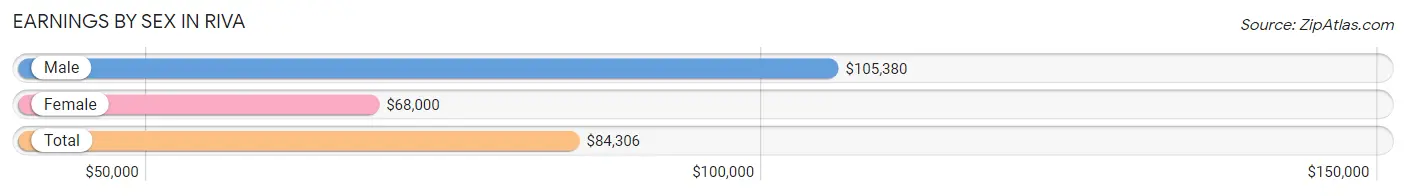
Earnings by Sex in Riva
Average Earnings in Riva are $84,306, $105,380 for men and $68,000 for women, a difference of 35.5%.
| Sex | Number | Average Earnings |
| Male | 1,346 (54.5%) | $105,380 |
| Female | 1,124 (45.5%) | $68,000 |
| Total | 2,470 (100.0%) | $84,306 |
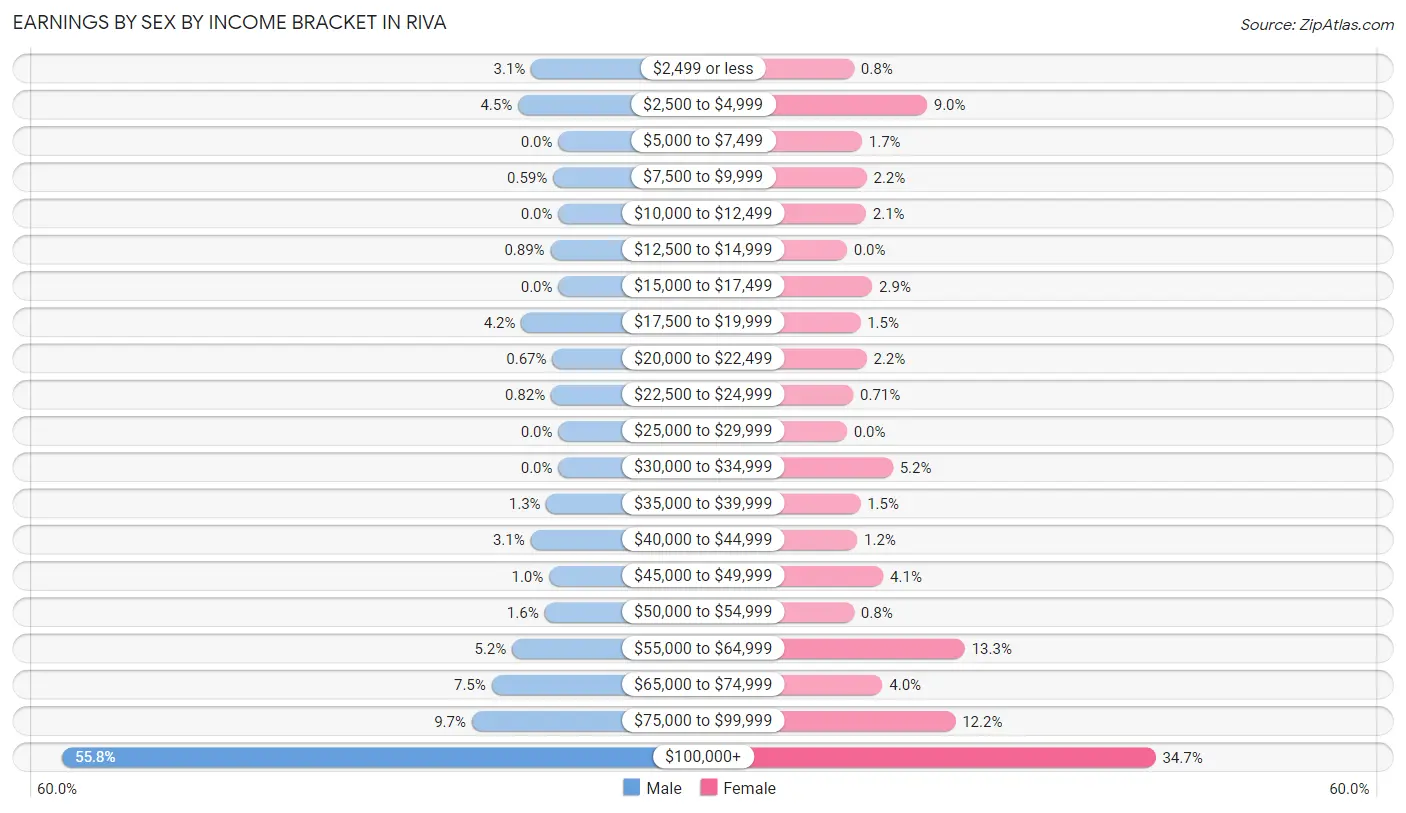
Earnings by Sex by Income Bracket in Riva
The most common earnings brackets in Riva are $100,000+ for men (751 | 55.8%) and $100,000+ for women (390 | 34.7%).
| Income | Male | Female |
| $2,499 or less | 41 (3.0%) | 9 (0.8%) |
| $2,500 to $4,999 | 61 (4.5%) | 101 (9.0%) |
| $5,000 to $7,499 | 0 (0.0%) | 19 (1.7%) |
| $7,500 to $9,999 | 8 (0.6%) | 25 (2.2%) |
| $10,000 to $12,499 | 0 (0.0%) | 24 (2.1%) |
| $12,500 to $14,999 | 12 (0.9%) | 0 (0.0%) |
| $15,000 to $17,499 | 0 (0.0%) | 32 (2.9%) |
| $17,500 to $19,999 | 56 (4.2%) | 17 (1.5%) |
| $20,000 to $22,499 | 9 (0.7%) | 25 (2.2%) |
| $22,500 to $24,999 | 11 (0.8%) | 8 (0.7%) |
| $25,000 to $29,999 | 0 (0.0%) | 0 (0.0%) |
| $30,000 to $34,999 | 0 (0.0%) | 58 (5.2%) |
| $35,000 to $39,999 | 18 (1.3%) | 17 (1.5%) |
| $40,000 to $44,999 | 42 (3.1%) | 13 (1.2%) |
| $45,000 to $49,999 | 14 (1.0%) | 46 (4.1%) |
| $50,000 to $54,999 | 21 (1.6%) | 9 (0.8%) |
| $55,000 to $64,999 | 70 (5.2%) | 149 (13.3%) |
| $65,000 to $74,999 | 101 (7.5%) | 45 (4.0%) |
| $75,000 to $99,999 | 131 (9.7%) | 137 (12.2%) |
| $100,000+ | 751 (55.8%) | 390 (34.7%) |
| Total | 1,346 (100.0%) | 1,124 (100.0%) |
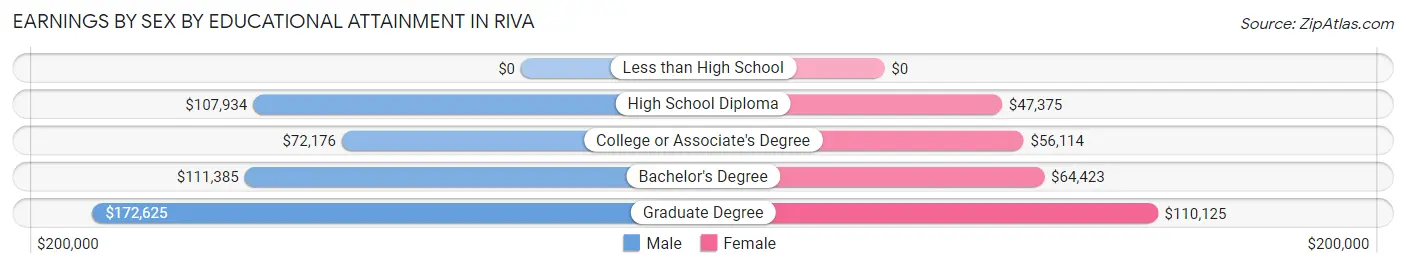
Earnings by Sex by Educational Attainment in Riva
Average earnings in Riva are $108,295 for men and $78,551 for women, a difference of 27.5%. Men with an educational attainment of graduate degree enjoy the highest average annual earnings of $172,625, while those with college or associate's degree education earn the least with $72,176. Women with an educational attainment of graduate degree earn the most with the average annual earnings of $110,125, while those with high school diploma education have the smallest earnings of $47,375.
| Educational Attainment | Male Income | Female Income |
| Less than High School | - | - |
| High School Diploma | $107,934 | $47,375 |
| College or Associate's Degree | $72,176 | $56,114 |
| Bachelor's Degree | $111,385 | $64,423 |
| Graduate Degree | $172,625 | $110,125 |
| Total | $108,295 | $78,551 |
Family Income in Riva
Family Income Brackets in Riva
According to the Riva family income data, there are 601 families falling into the $200,000+ income range, which is the most common income bracket and makes up 44.2% of all families.
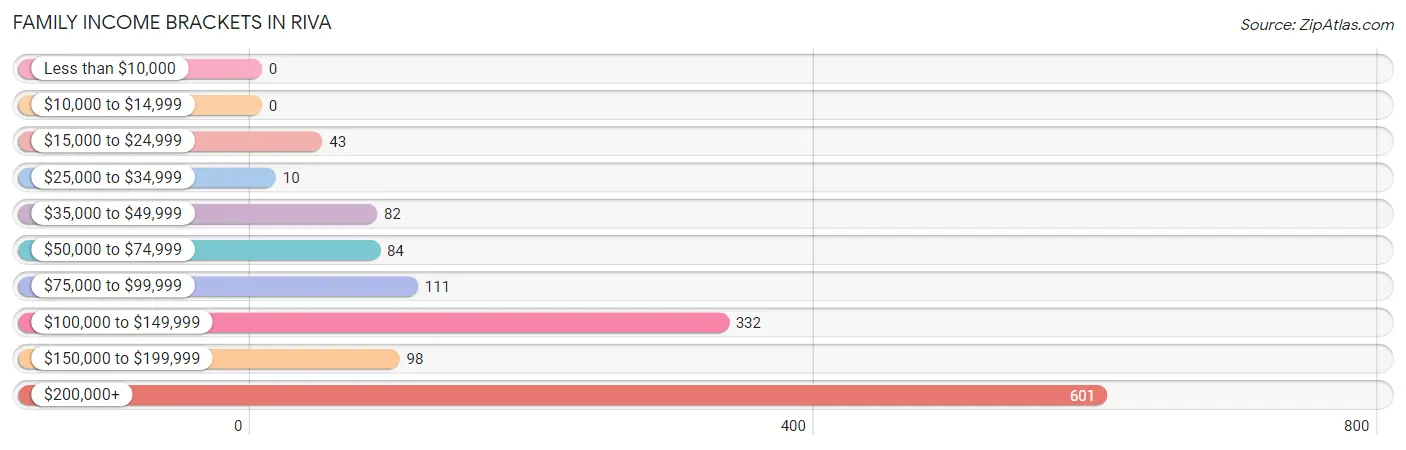
| Income Bracket | # Families | % Families |
| Less than $10,000 | 0 | 0.0% |
| $10,000 to $14,999 | 0 | 0.0% |
| $15,000 to $24,999 | 43 | 3.2% |
| $25,000 to $34,999 | 10 | 0.7% |
| $35,000 to $49,999 | 82 | 6.0% |
| $50,000 to $74,999 | 84 | 6.2% |
| $75,000 to $99,999 | 111 | 8.2% |
| $100,000 to $149,999 | 332 | 24.4% |
| $150,000 to $199,999 | 98 | 7.2% |
| $200,000+ | 601 | 44.2% |
Family Income by Famaliy Size in Riva
6-person families (116 | 8.5%) account for the highest median family income in Riva with $250,001 per family, while 2-person families (617 | 45.4%) have the highest median income of $57,078 per family member.
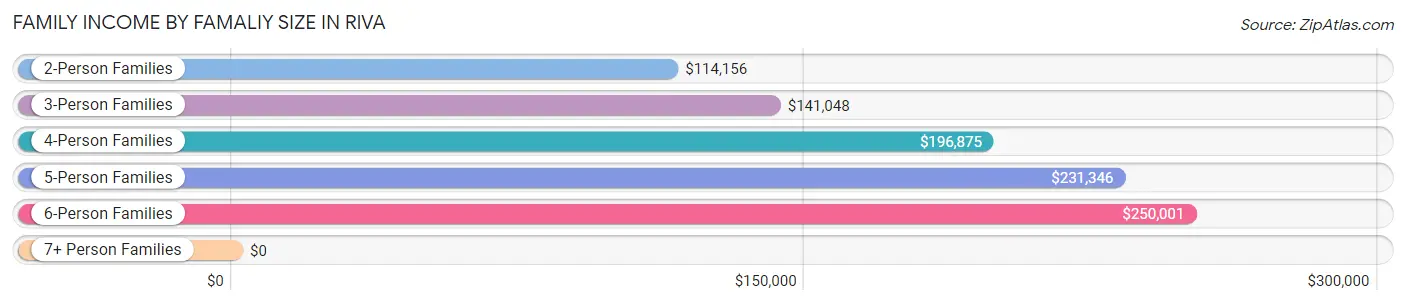
| Income Bracket | # Families | Median Income |
| 2-Person Families | 617 (45.4%) | $114,156 |
| 3-Person Families | 294 (21.6%) | $141,048 |
| 4-Person Families | 269 (19.8%) | $196,875 |
| 5-Person Families | 36 (2.6%) | $231,346 |
| 6-Person Families | 116 (8.5%) | $250,001 |
| 7+ Person Families | 27 (2.0%) | $0 |
| Total | 1,359 (100.0%) | $154,297 |
Family Income by Number of Earners in Riva
The median family income in Riva is $154,297, with families comprising 3+ earners (145) having the highest median family income of $238,102, while families with no earners (241) have the lowest median family income of $87,697, accounting for 10.7% and 17.7% of families, respectively.
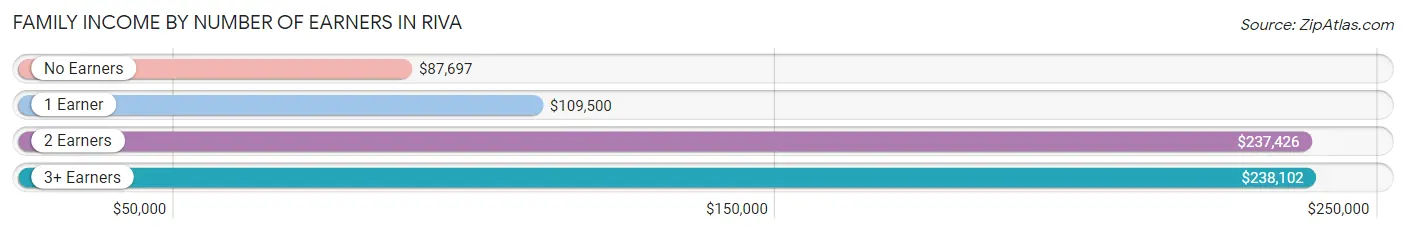
| Number of Earners | # Families | Median Income |
| No Earners | 241 (17.7%) | $87,697 |
| 1 Earner | 312 (23.0%) | $109,500 |
| 2 Earners | 661 (48.6%) | $237,426 |
| 3+ Earners | 145 (10.7%) | $238,102 |
| Total | 1,359 (100.0%) | $154,297 |
Household Income in Riva
Household Income Brackets in Riva
With 645 households falling in the category, the $200,000+ income range is the most frequent in Riva, accounting for 39.7% of all households.
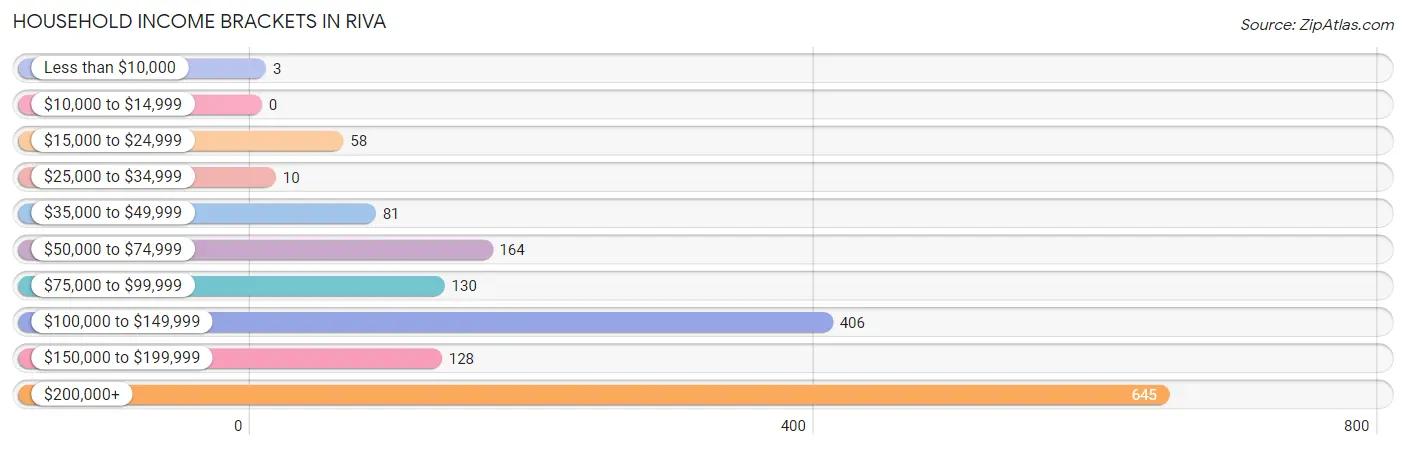
| Income Bracket | # Households | % Households |
| Less than $10,000 | 3 | 0.2% |
| $10,000 to $14,999 | 0 | 0.0% |
| $15,000 to $24,999 | 58 | 3.6% |
| $25,000 to $34,999 | 10 | 0.6% |
| $35,000 to $49,999 | 81 | 5.0% |
| $50,000 to $74,999 | 164 | 10.1% |
| $75,000 to $99,999 | 130 | 8.0% |
| $100,000 to $149,999 | 406 | 25.0% |
| $150,000 to $199,999 | 128 | 7.9% |
| $200,000+ | 645 | 39.7% |
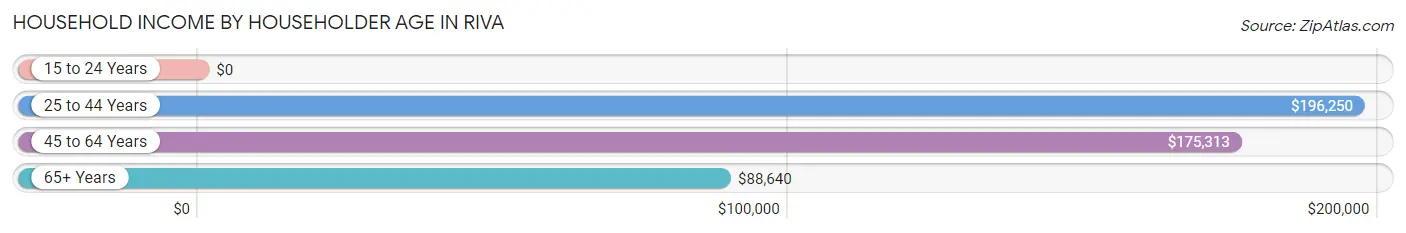
Household Income by Householder Age in Riva
The median household income in Riva is $145,601, with the highest median household income of $196,250 found in the 25 to 44 years age bracket for the primary householder. A total of 468 households (28.8%) fall into this category. Meanwhile, the 15 to 24 years age bracket for the primary householder has the lowest median household income of $0, with 21 households (1.3%) in this group.
| Income Bracket | # Households | Median Income |
| 15 to 24 Years | 21 (1.3%) | $0 |
| 25 to 44 Years | 468 (28.8%) | $196,250 |
| 45 to 64 Years | 672 (41.3%) | $175,313 |
| 65+ Years | 464 (28.5%) | $88,640 |
| Total | 1,625 (100.0%) | $145,601 |
Poverty in Riva
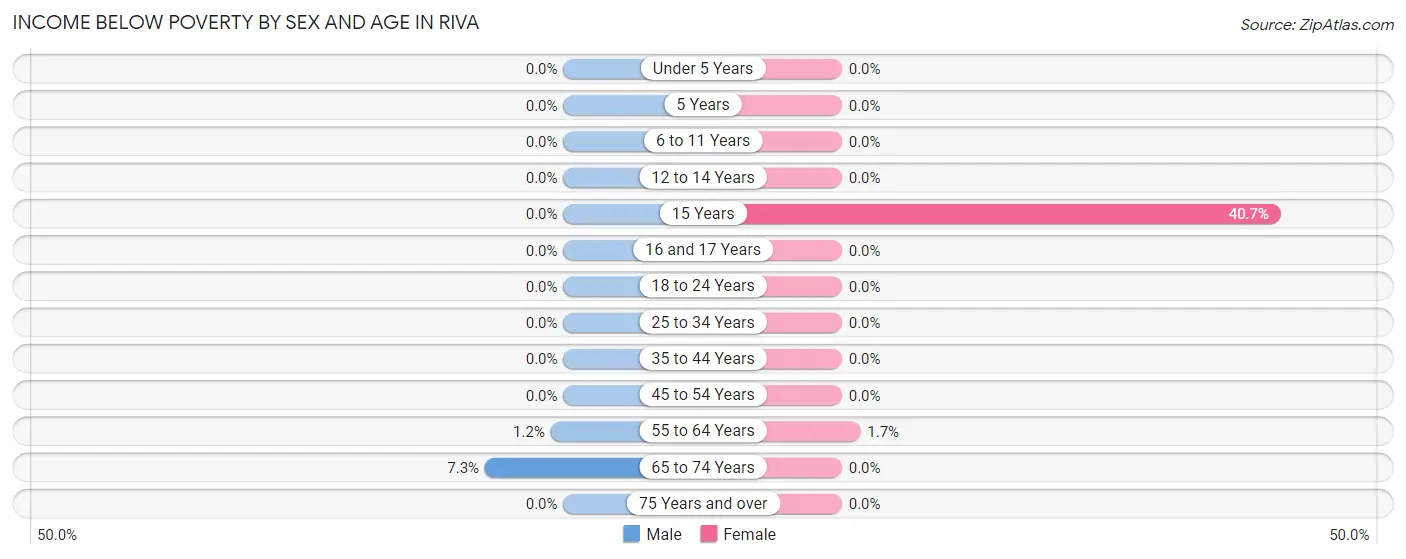
Income Below Poverty by Sex and Age in Riva
With 1.1% poverty level for males and 0.6% for females among the residents of Riva, 65 to 74 year old males and 15 year old females are the most vulnerable to poverty, with 23 males (7.3%) and 11 females (40.7%) in their respective age groups living below the poverty level.
| Age Bracket | Male | Female |
| Under 5 Years | 0 (0.0%) | 0 (0.0%) |
| 5 Years | 0 (0.0%) | 0 (0.0%) |
| 6 to 11 Years | 0 (0.0%) | 0 (0.0%) |
| 12 to 14 Years | 0 (0.0%) | 0 (0.0%) |
| 15 Years | 0 (0.0%) | 11 (40.7%) |
| 16 and 17 Years | 0 (0.0%) | 0 (0.0%) |
| 18 to 24 Years | 0 (0.0%) | 0 (0.0%) |
| 25 to 34 Years | 0 (0.0%) | 0 (0.0%) |
| 35 to 44 Years | 0 (0.0%) | 0 (0.0%) |
| 45 to 54 Years | 0 (0.0%) | 0 (0.0%) |
| 55 to 64 Years | 4 (1.2%) | 4 (1.7%) |
| 65 to 74 Years | 23 (7.3%) | 0 (0.0%) |
| 75 Years and over | 0 (0.0%) | 0 (0.0%) |
| Total | 27 (1.1%) | 15 (0.6%) |
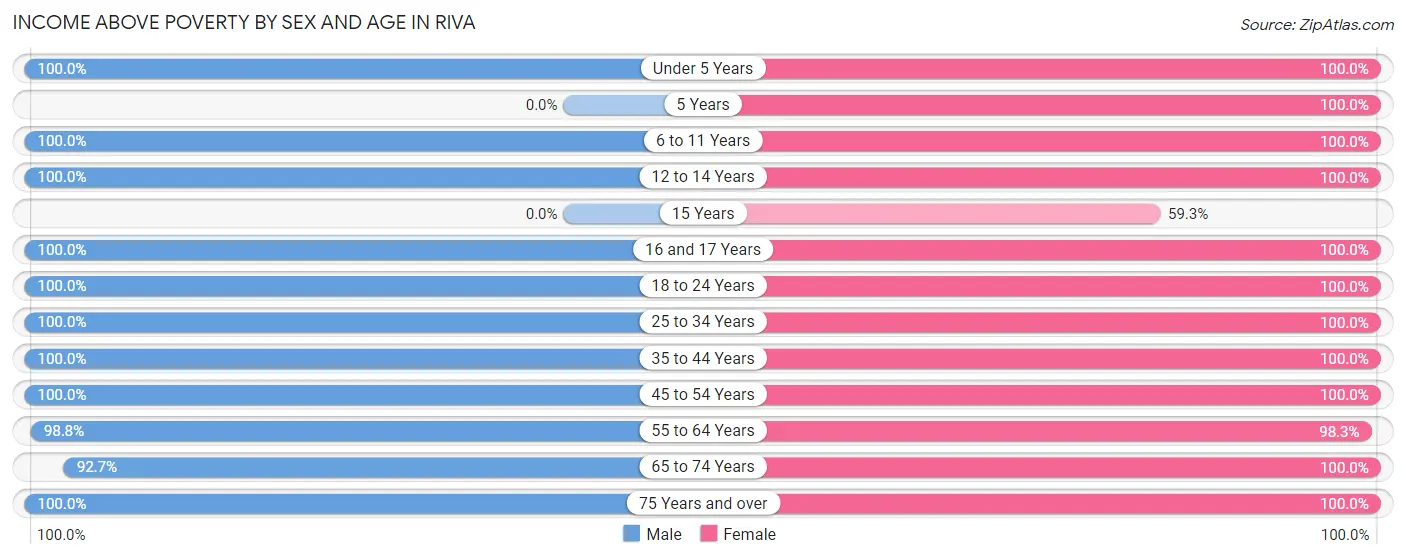
Income Above Poverty by Sex and Age in Riva
According to the poverty statistics in Riva, males aged under 5 years and females aged under 5 years are the age groups that are most secure financially, with 100.0% of males and 100.0% of females in these age groups living above the poverty line.
| Age Bracket | Male | Female |
| Under 5 Years | 184 (100.0%) | 100 (100.0%) |
| 5 Years | 0 (0.0%) | 76 (100.0%) |
| 6 to 11 Years | 389 (100.0%) | 187 (100.0%) |
| 12 to 14 Years | 153 (100.0%) | 56 (100.0%) |
| 15 Years | 0 (0.0%) | 16 (59.3%) |
| 16 and 17 Years | 32 (100.0%) | 53 (100.0%) |
| 18 to 24 Years | 139 (100.0%) | 120 (100.0%) |
| 25 to 34 Years | 122 (100.0%) | 150 (100.0%) |
| 35 to 44 Years | 322 (100.0%) | 451 (100.0%) |
| 45 to 54 Years | 405 (100.0%) | 255 (100.0%) |
| 55 to 64 Years | 339 (98.8%) | 228 (98.3%) |
| 65 to 74 Years | 293 (92.7%) | 420 (100.0%) |
| 75 Years and over | 88 (100.0%) | 164 (100.0%) |
| Total | 2,466 (98.9%) | 2,276 (99.4%) |
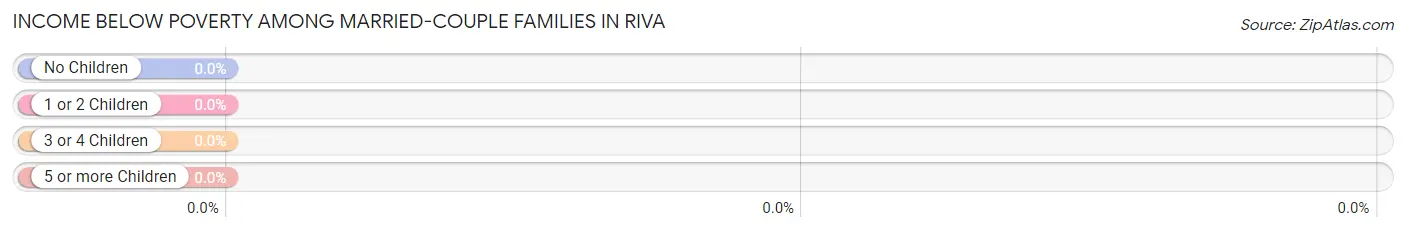
Income Below Poverty Among Married-Couple Families in Riva
| Children | Above Poverty | Below Poverty |
| No Children | 652 (100.0%) | 0 (0.0%) |
| 1 or 2 Children | 374 (100.0%) | 0 (0.0%) |
| 3 or 4 Children | 172 (100.0%) | 0 (0.0%) |
| 5 or more Children | 0 (0.0%) | 0 (0.0%) |
| Total | 1,198 (100.0%) | 0 (0.0%) |
Income Below Poverty Among Single-Parent Households in Riva
| Children | Single Father | Single Mother |
| No Children | 0 (0.0%) | 0 (0.0%) |
| 1 or 2 Children | 0 (0.0%) | 0 (0.0%) |
| 3 or 4 Children | 0 (0.0%) | 0 (0.0%) |
| 5 or more Children | 0 (0.0%) | 0 (0.0%) |
| Total | 0 (0.0%) | 0 (0.0%) |
Income Below Poverty Among Married-Couple vs Single-Parent Households in Riva
| Children | Married-Couple Families | Single-Parent Households |
| No Children | 0 (0.0%) | 0 (0.0%) |
| 1 or 2 Children | 0 (0.0%) | 0 (0.0%) |
| 3 or 4 Children | 0 (0.0%) | 0 (0.0%) |
| 5 or more Children | 0 (0.0%) | 0 (0.0%) |
| Total | 0 (0.0%) | 0 (0.0%) |
Race in Riva
The most populous races in Riva are White / Caucasian (4,432 | 92.6%), Hispanic or Latino (309 | 6.5%), and Two or more Races (216 | 4.5%).
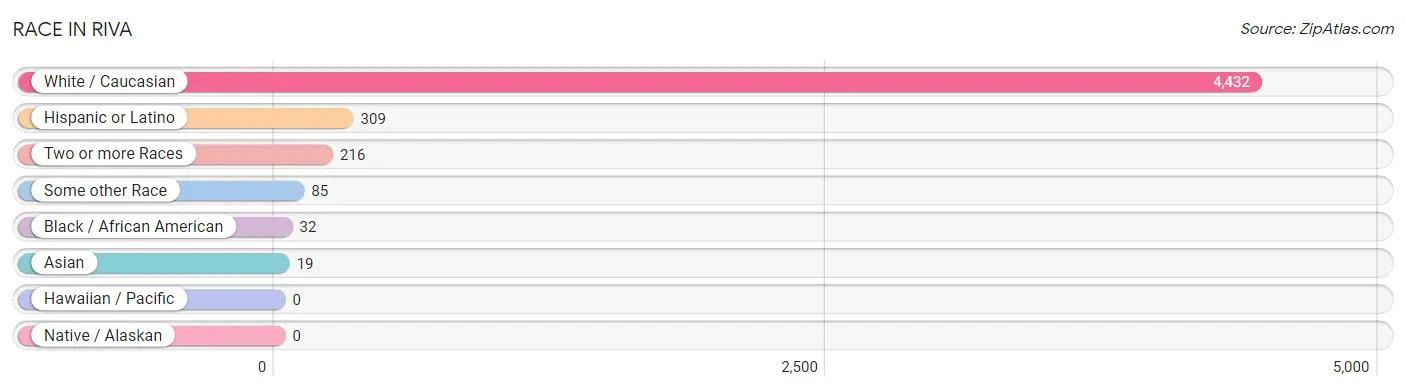
| Race | # Population | % Population |
| Asian | 19 | 0.4% |
| Black / African American | 32 | 0.7% |
| Hawaiian / Pacific | 0 | 0.0% |
| Hispanic or Latino | 309 | 6.5% |
| Native / Alaskan | 0 | 0.0% |
| White / Caucasian | 4,432 | 92.6% |
| Two or more Races | 216 | 4.5% |
| Some other Race | 85 | 1.8% |
| Total | 4,784 | 100.0% |
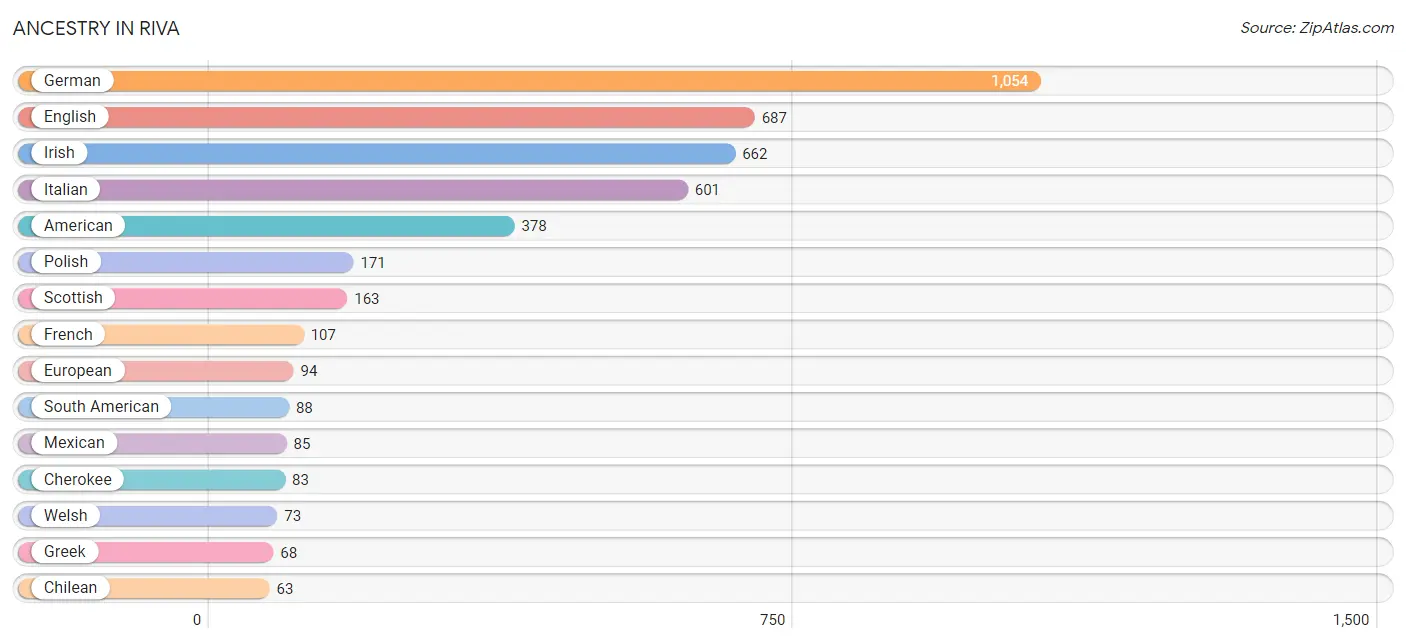
Ancestry in Riva
The most populous ancestries reported in Riva are German (1,054 | 22.0%), English (687 | 14.4%), Irish (662 | 13.8%), Italian (601 | 12.6%), and American (378 | 7.9%), together accounting for 70.7% of all Riva residents.
| Ancestry | # Population | % Population |
| American | 378 | 7.9% |
| Arab | 55 | 1.1% |
| Argentinean | 25 | 0.5% |
| Armenian | 17 | 0.4% |
| Austrian | 10 | 0.2% |
| Bhutanese | 8 | 0.2% |
| Brazilian | 7 | 0.2% |
| British | 40 | 0.8% |
| Burmese | 22 | 0.5% |
| Canadian | 39 | 0.8% |
| Carpatho Rusyn | 7 | 0.2% |
| Central American | 38 | 0.8% |
| Cherokee | 83 | 1.7% |
| Chilean | 63 | 1.3% |
| Cuban | 50 | 1.1% |
| Danish | 33 | 0.7% |
| Dutch | 44 | 0.9% |
| Eastern European | 25 | 0.5% |
| English | 687 | 14.4% |
| European | 94 | 2.0% |
| French | 107 | 2.2% |
| French Canadian | 27 | 0.6% |
| German | 1,054 | 22.0% |
| Greek | 68 | 1.4% |
| Hungarian | 41 | 0.9% |
| Indian (Asian) | 8 | 0.2% |
| Iranian | 42 | 0.9% |
| Irish | 662 | 13.8% |
| Italian | 601 | 12.6% |
| Lithuanian | 18 | 0.4% |
| Mexican | 85 | 1.8% |
| Moroccan | 55 | 1.1% |
| Norwegian | 36 | 0.7% |
| Pakistani | 11 | 0.2% |
| Panamanian | 38 | 0.8% |
| Polish | 171 | 3.6% |
| Puerto Rican | 48 | 1.0% |
| Russian | 34 | 0.7% |
| Scandinavian | 9 | 0.2% |
| Scotch-Irish | 14 | 0.3% |
| Scottish | 163 | 3.4% |
| Slovak | 20 | 0.4% |
| Slovene | 47 | 1.0% |
| South African | 16 | 0.3% |
| South American | 88 | 1.8% |
| Subsaharan African | 16 | 0.3% |
| Swedish | 21 | 0.4% |
| Swiss | 23 | 0.5% |
| Ukrainian | 9 | 0.2% |
| Welsh | 73 | 1.5% | View All 50 Rows |
Immigrants in Riva
The most numerous immigrant groups reported in Riva came from Africa (71 | 1.5%), Morocco (55 | 1.1%), Northern Africa (55 | 1.1%), Latin America (52 | 1.1%), and Europe (51 | 1.1%), together accounting for 5.9% of all Riva residents.
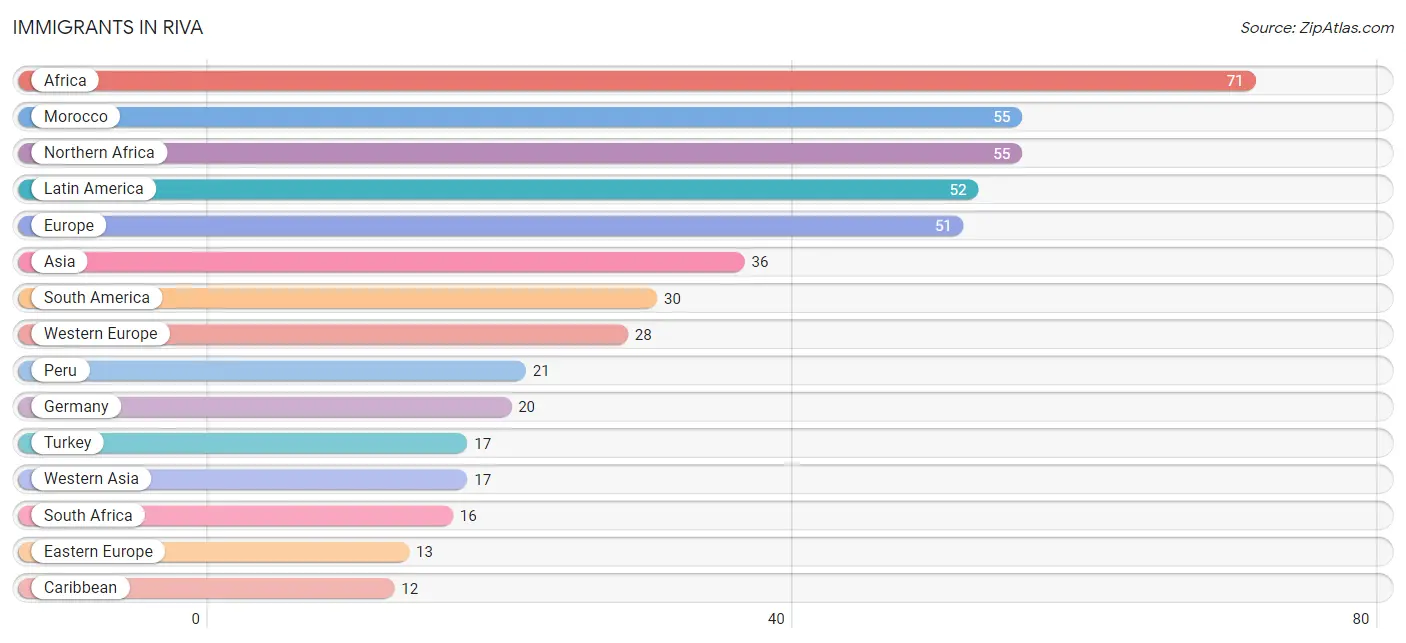
| Immigration Origin | # Population | % Population |
| Africa | 71 | 1.5% |
| Asia | 36 | 0.7% |
| Caribbean | 12 | 0.3% |
| Central America | 10 | 0.2% |
| Chile | 9 | 0.2% |
| Eastern Asia | 8 | 0.2% |
| Eastern Europe | 13 | 0.3% |
| England | 10 | 0.2% |
| Europe | 51 | 1.1% |
| Germany | 20 | 0.4% |
| Jamaica | 12 | 0.3% |
| Korea | 8 | 0.2% |
| Latin America | 52 | 1.1% |
| Mexico | 10 | 0.2% |
| Morocco | 55 | 1.1% |
| Netherlands | 8 | 0.2% |
| Northern Africa | 55 | 1.1% |
| Northern Europe | 10 | 0.2% |
| Peru | 21 | 0.4% |
| South Africa | 16 | 0.3% |
| South America | 30 | 0.6% |
| South Eastern Asia | 11 | 0.2% |
| Thailand | 11 | 0.2% |
| Turkey | 17 | 0.4% |
| Western Asia | 17 | 0.4% |
| Western Europe | 28 | 0.6% | View All 26 Rows |
Sex and Age in Riva
Sex and Age in Riva
The most populous age groups in Riva are 10 to 14 Years (342 | 13.7%) for men and 65 to 69 Years (263 | 11.5%) for women.
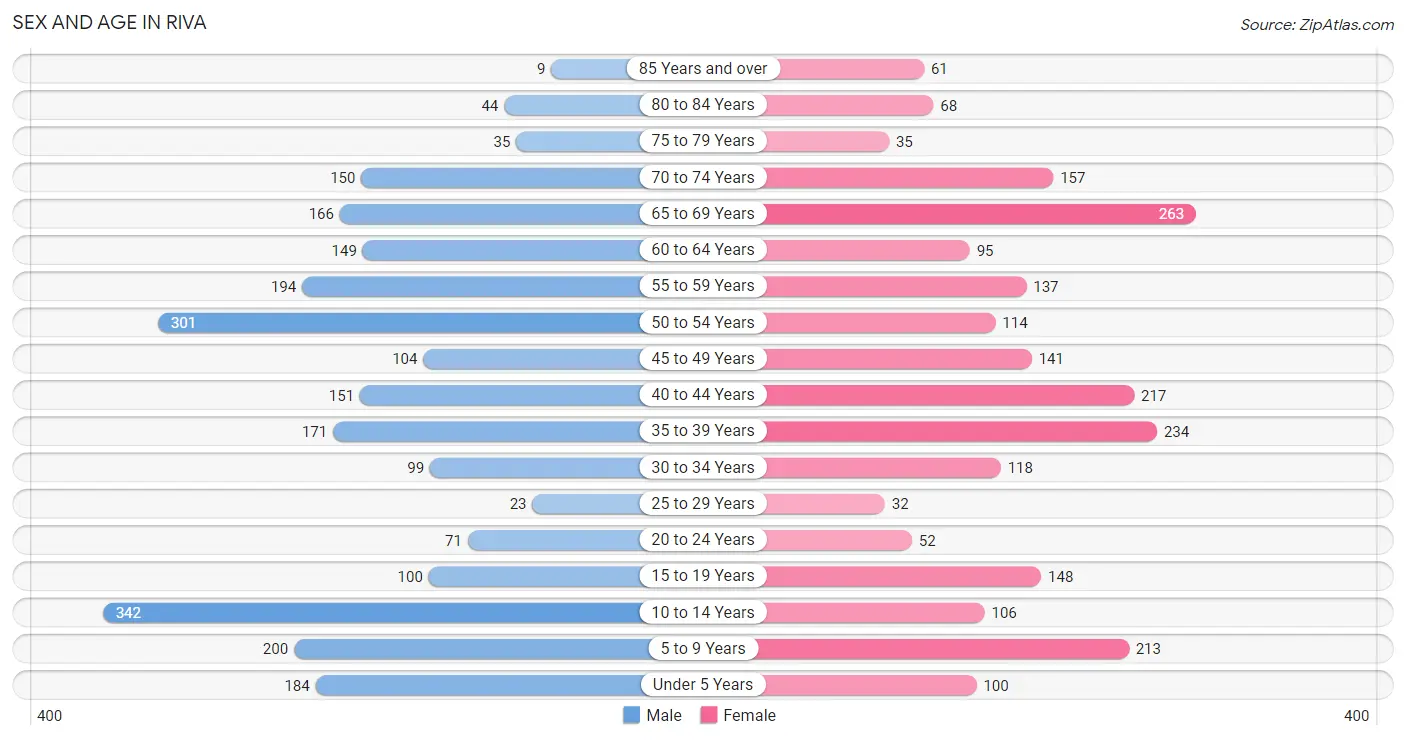
| Age Bracket | Male | Female |
| Under 5 Years | 184 (7.4%) | 100 (4.4%) |
| 5 to 9 Years | 200 (8.0%) | 213 (9.3%) |
| 10 to 14 Years | 342 (13.7%) | 106 (4.6%) |
| 15 to 19 Years | 100 (4.0%) | 148 (6.5%) |
| 20 to 24 Years | 71 (2.9%) | 52 (2.3%) |
| 25 to 29 Years | 23 (0.9%) | 32 (1.4%) |
| 30 to 34 Years | 99 (4.0%) | 118 (5.1%) |
| 35 to 39 Years | 171 (6.9%) | 234 (10.2%) |
| 40 to 44 Years | 151 (6.1%) | 217 (9.5%) |
| 45 to 49 Years | 104 (4.2%) | 141 (6.1%) |
| 50 to 54 Years | 301 (12.1%) | 114 (5.0%) |
| 55 to 59 Years | 194 (7.8%) | 137 (6.0%) |
| 60 to 64 Years | 149 (6.0%) | 95 (4.2%) |
| 65 to 69 Years | 166 (6.7%) | 263 (11.5%) |
| 70 to 74 Years | 150 (6.0%) | 157 (6.9%) |
| 75 to 79 Years | 35 (1.4%) | 35 (1.5%) |
| 80 to 84 Years | 44 (1.8%) | 68 (3.0%) |
| 85 Years and over | 9 (0.4%) | 61 (2.7%) |
| Total | 2,493 (100.0%) | 2,291 (100.0%) |
Families and Households in Riva
Median Family Size in Riva
The median family size in Riva is 3.25 persons per family, with married-couple families (1,198 | 88.1%) accounting for the largest median family size of 3.35 persons per family. On the other hand, single male/father families (67 | 4.9%) represent the smallest median family size with 2.19 persons per family.
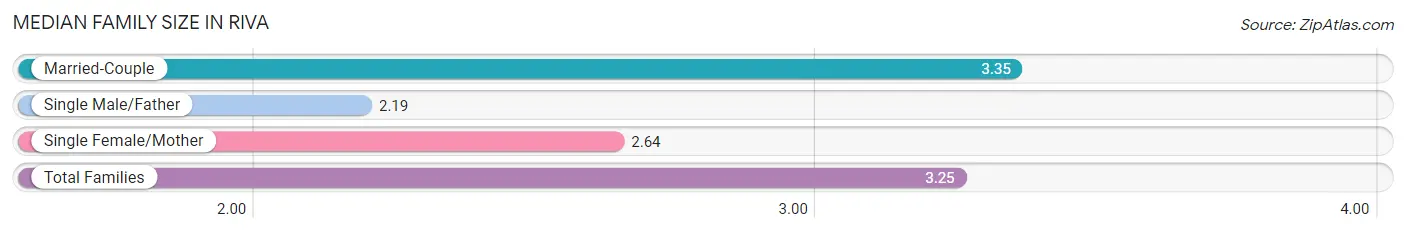
| Family Type | # Families | Family Size |
| Married-Couple | 1,198 (88.1%) | 3.35 |
| Single Male/Father | 67 (4.9%) | 2.19 |
| Single Female/Mother | 94 (6.9%) | 2.64 |
| Total Families | 1,359 (100.0%) | 3.25 |
Median Household Size in Riva
The median household size in Riva is 2.94 persons per household, with married-couple households (1,198 | 73.7%) accounting for the largest median household size of 3.37 persons per household. non-family households (266 | 16.4%) represent the smallest median household size with 1.33 persons per household.
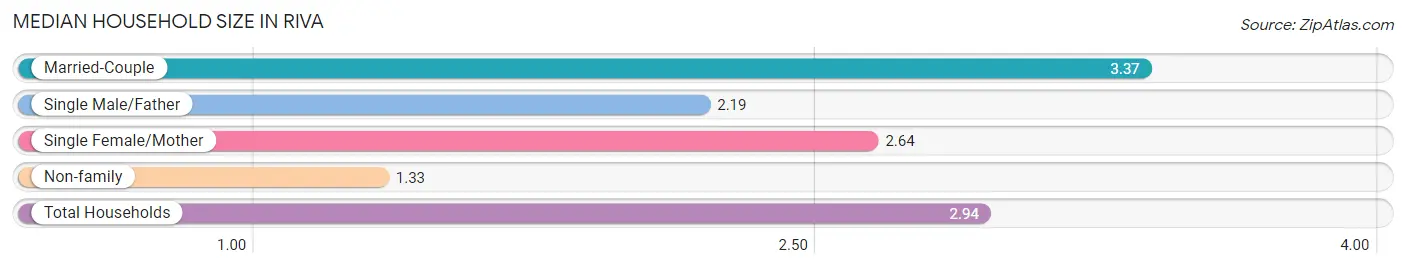
| Household Type | # Households | Household Size |
| Married-Couple | 1,198 (73.7%) | 3.37 |
| Single Male/Father | 67 (4.1%) | 2.19 |
| Single Female/Mother | 94 (5.8%) | 2.64 |
| Non-family | 266 (16.4%) | 1.33 |
| Total Households | 1,625 (100.0%) | 2.94 |
Household Size by Marriage Status in Riva
Out of a total of 1,625 households in Riva, 1,359 (83.6%) are family households, while 266 (16.4%) are nonfamily households. The most numerous type of family households are 2-person households, comprising 611, and the most common type of nonfamily households are 1-person households, comprising 182.
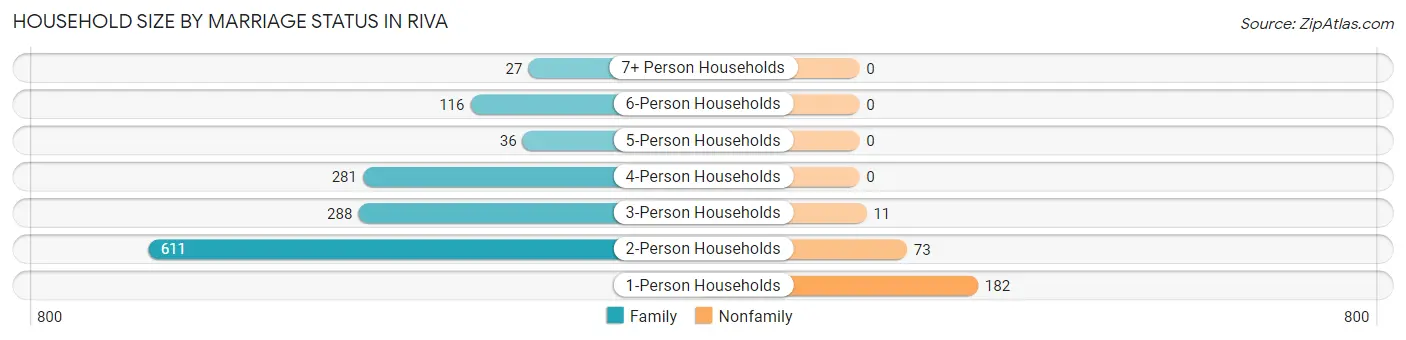
| Household Size | Family Households | Nonfamily Households |
| 1-Person Households | - | 182 (11.2%) |
| 2-Person Households | 611 (37.6%) | 73 (4.5%) |
| 3-Person Households | 288 (17.7%) | 11 (0.7%) |
| 4-Person Households | 281 (17.3%) | 0 (0.0%) |
| 5-Person Households | 36 (2.2%) | 0 (0.0%) |
| 6-Person Households | 116 (7.1%) | 0 (0.0%) |
| 7+ Person Households | 27 (1.7%) | 0 (0.0%) |
| Total | 1,359 (83.6%) | 266 (16.4%) |
Female Fertility in Riva
Fertility by Age in Riva
Average fertility rate in Riva is 24.0 births per 1,000 women. Women in the age bracket of 20 to 34 years have the highest fertility rate with 74.0 births per 1,000 women. Women in the age bracket of 20 to 34 years acount for 65.2% of all women with births.
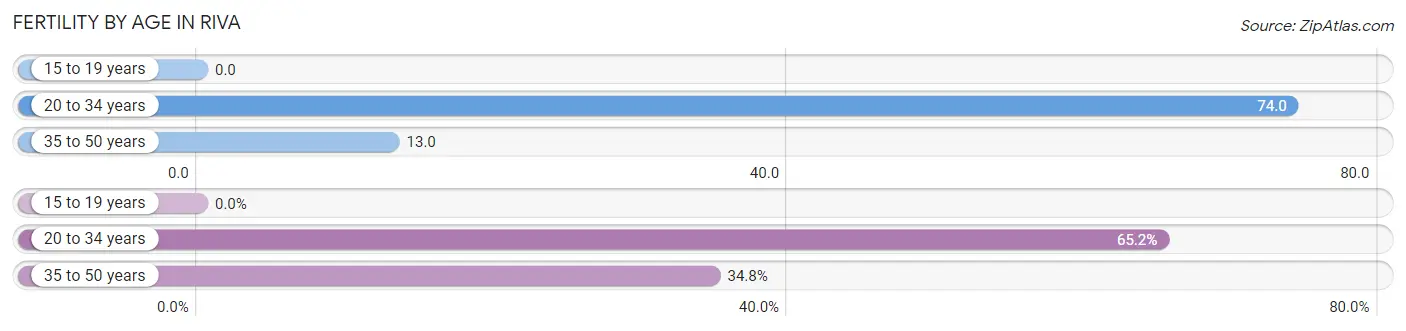
| Age Bracket | Women with Births | Births / 1,000 Women |
| 15 to 19 years | 0 (0.0%) | 0.0 |
| 20 to 34 years | 15 (65.2%) | 74.0 |
| 35 to 50 years | 8 (34.8%) | 13.0 |
| Total | 23 (100.0%) | 24.0 |
Fertility by Age by Marriage Status in Riva
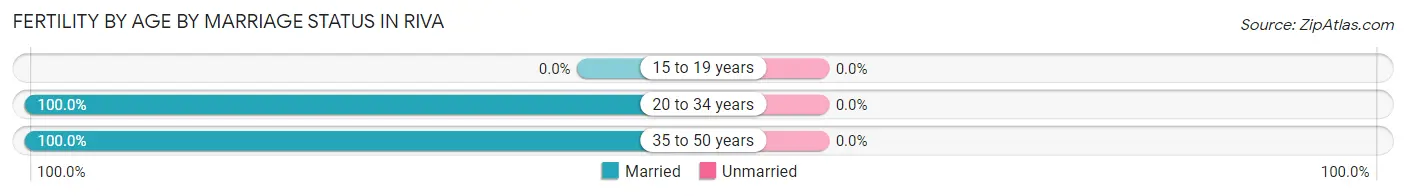
| Age Bracket | Married | Unmarried |
| 15 to 19 years | 0 (0.0%) | 0 (0.0%) |
| 20 to 34 years | 15 (100.0%) | 0 (0.0%) |
| 35 to 50 years | 8 (100.0%) | 0 (0.0%) |
| Total | 23 (100.0%) | 0 (0.0%) |
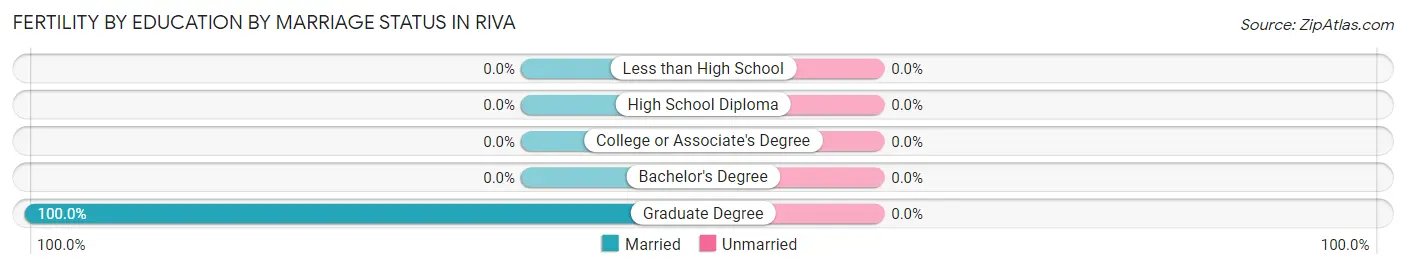
Fertility by Education in Riva
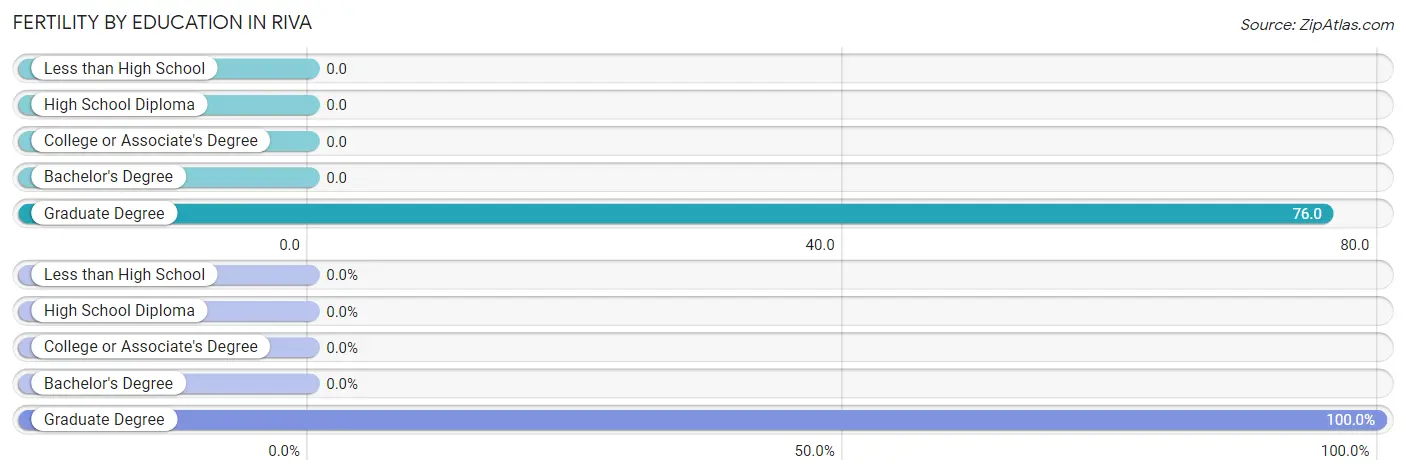
| Educational Attainment | Women with Births | Births / 1,000 Women |
| Less than High School | 0 (0.0%) | 0.0 |
| High School Diploma | 0 (0.0%) | 0.0 |
| College or Associate's Degree | 0 (0.0%) | 0.0 |
| Bachelor's Degree | 0 (0.0%) | 0.0 |
| Graduate Degree | 23 (100.0%) | 76.0 |
| Total | 23 (100.0%) | 24.0 |
Fertility by Education by Marriage Status in Riva
| Educational Attainment | Married | Unmarried |
| Less than High School | 0 (0.0%) | 0 (0.0%) |
| High School Diploma | 0 (0.0%) | 0 (0.0%) |
| College or Associate's Degree | 0 (0.0%) | 0 (0.0%) |
| Bachelor's Degree | 0 (0.0%) | 0 (0.0%) |
| Graduate Degree | 23 (100.0%) | 0 (0.0%) |
| Total | 23 (100.0%) | 0 (0.0%) |
Employment Characteristics in Riva
Employment by Class of Employer in Riva
Among the 2,184 employed individuals in Riva, private company employees (1,296 | 59.3%), federal government employees (269 | 12.3%), and local government employees (195 | 8.9%) make up the most common classes of employment.
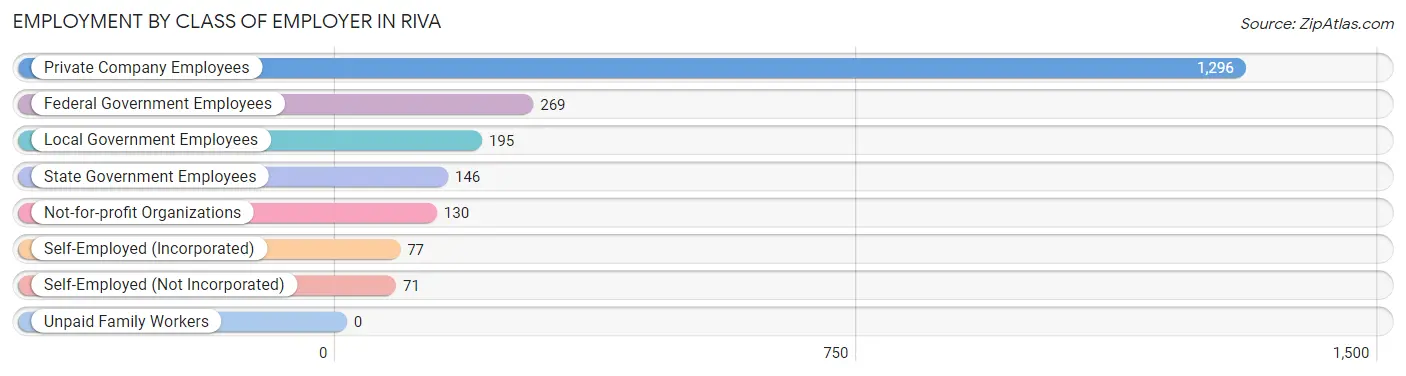
| Employer Class | # Employees | % Employees |
| Private Company Employees | 1,296 | 59.3% |
| Self-Employed (Incorporated) | 77 | 3.5% |
| Self-Employed (Not Incorporated) | 71 | 3.3% |
| Not-for-profit Organizations | 130 | 5.9% |
| Local Government Employees | 195 | 8.9% |
| State Government Employees | 146 | 6.7% |
| Federal Government Employees | 269 | 12.3% |
| Unpaid Family Workers | 0 | 0.0% |
| Total | 2,184 | 100.0% |
Employment Status by Age in Riva
According to the labor force statistics for Riva, out of the total population over 16 years of age (3,612), 63.0% or 2,276 individuals are in the labor force, with 3.3% or 75 of them unemployed. The age group with the highest labor force participation rate is 30 to 34 years, with 96.3% or 209 individuals in the labor force. Within the labor force, the 20 to 24 years age range has the highest percentage of unemployed individuals, with 35.9% or 28 of them being unemployed.
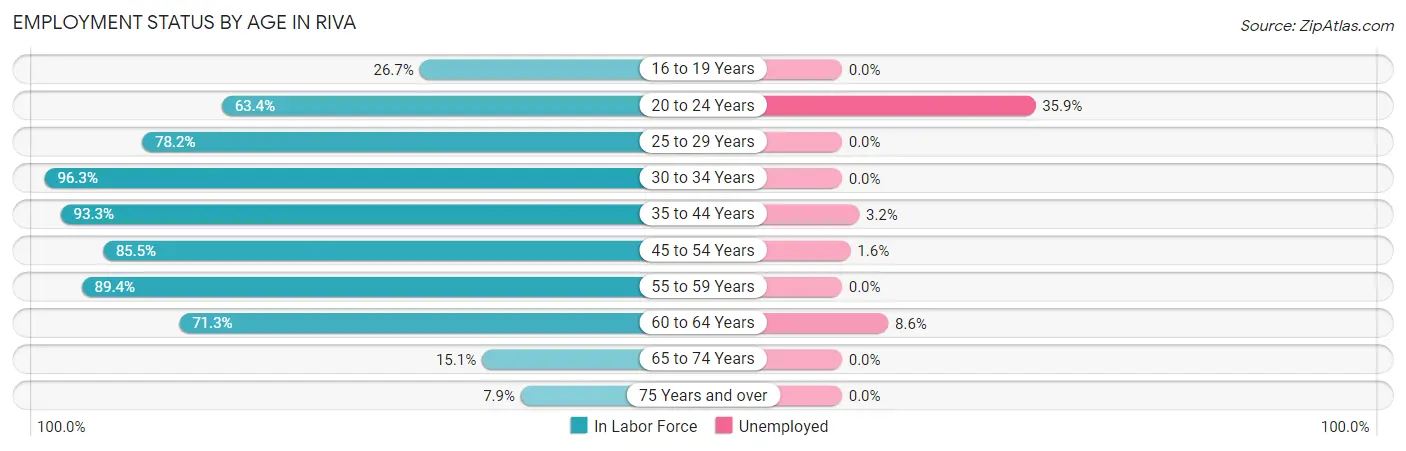
| Age Bracket | In Labor Force | Unemployed |
| 16 to 19 Years | 59 (26.7%) | 0 (0.0%) |
| 20 to 24 Years | 78 (63.4%) | 28 (35.9%) |
| 25 to 29 Years | 43 (78.2%) | 0 (0.0%) |
| 30 to 34 Years | 209 (96.3%) | 0 (0.0%) |
| 35 to 44 Years | 721 (93.3%) | 23 (3.2%) |
| 45 to 54 Years | 564 (85.5%) | 9 (1.6%) |
| 55 to 59 Years | 296 (89.4%) | 0 (0.0%) |
| 60 to 64 Years | 174 (71.3%) | 15 (8.6%) |
| 65 to 74 Years | 111 (15.1%) | 0 (0.0%) |
| 75 Years and over | 20 (7.9%) | 0 (0.0%) |
| Total | 2,276 (63.0%) | 75 (3.3%) |
Employment Status by Educational Attainment in Riva
According to labor force statistics for Riva, 88.0% of individuals (2,006) out of the total population between 25 and 64 years of age (2,280) are in the labor force, with 2.3% or 46 of them being unemployed. The group with the highest labor force participation rate are those with the educational attainment of bachelor's degree or higher, with 96.1% or 1,354 individuals in the labor force. Within the labor force, individuals with bachelor's degree or higher education have the highest percentage of unemployment, with 3.5% or 47 of them being unemployed.
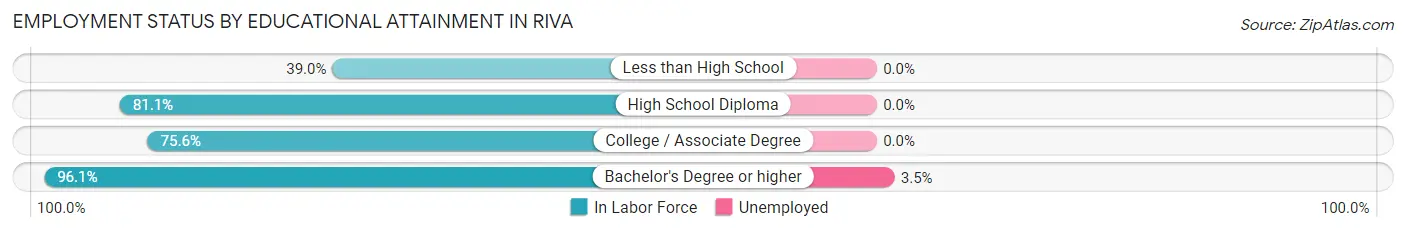
| Educational Attainment | In Labor Force | Unemployed |
| Less than High School | 23 (39.0%) | 0 (0.0%) |
| High School Diploma | 236 (81.1%) | 0 (0.0%) |
| College / Associate Degree | 394 (75.6%) | 0 (0.0%) |
| Bachelor's Degree or higher | 1,354 (96.1%) | 49 (3.5%) |
| Total | 2,006 (88.0%) | 52 (2.3%) |
Employment Occupations by Sex in Riva
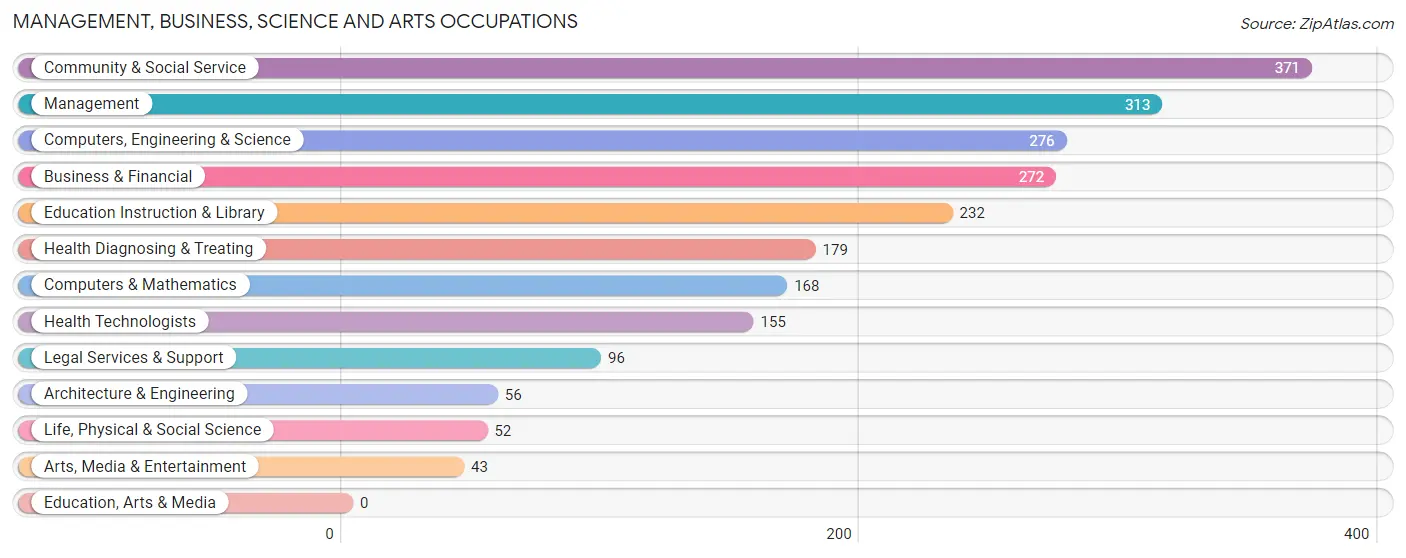
Management, Business, Science and Arts Occupations
The most common Management, Business, Science and Arts occupations in Riva are Community & Social Service (371 | 16.9%), Management (313 | 14.3%), Computers, Engineering & Science (276 | 12.6%), Business & Financial (272 | 12.4%), and Education Instruction & Library (232 | 10.6%).
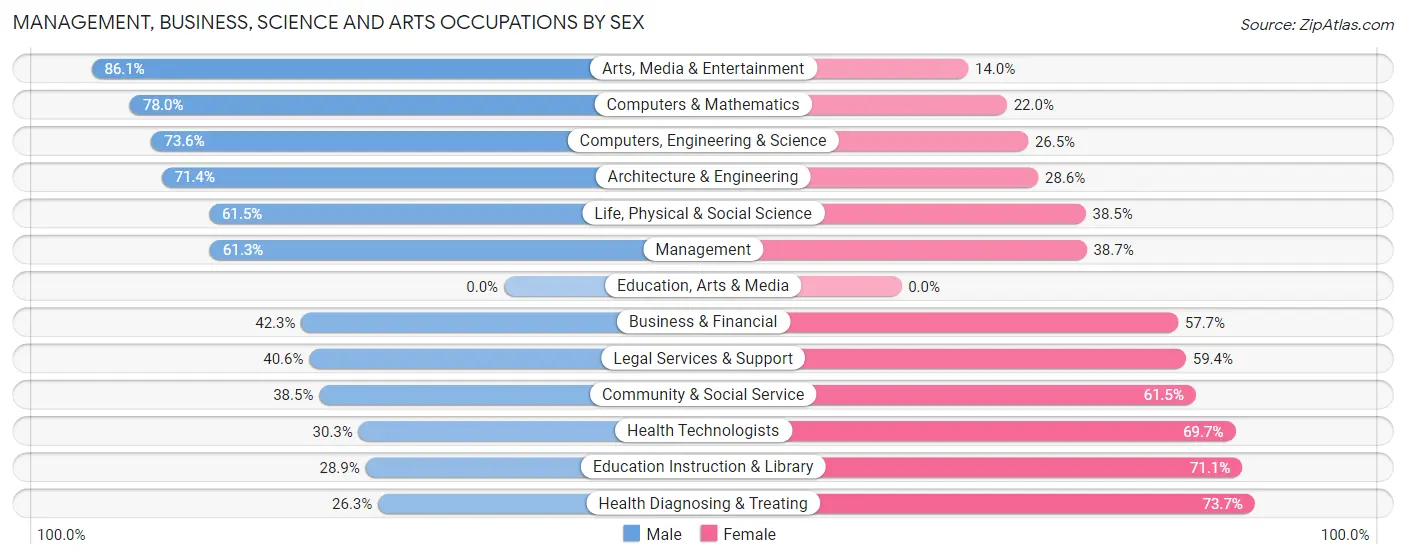
Management, Business, Science and Arts Occupations by Sex
Within the Management, Business, Science and Arts occupations in Riva, the most male-oriented occupations are Arts, Media & Entertainment (86.1%), Computers & Mathematics (78.0%), and Computers, Engineering & Science (73.6%), while the most female-oriented occupations are Health Diagnosing & Treating (73.7%), Education Instruction & Library (71.1%), and Health Technologists (69.7%).
| Occupation | Male | Female |
| Management | 192 (61.3%) | 121 (38.7%) |
| Business & Financial | 115 (42.3%) | 157 (57.7%) |
| Computers, Engineering & Science | 203 (73.6%) | 73 (26.5%) |
| Computers & Mathematics | 131 (78.0%) | 37 (22.0%) |
| Architecture & Engineering | 40 (71.4%) | 16 (28.6%) |
| Life, Physical & Social Science | 32 (61.5%) | 20 (38.5%) |
| Community & Social Service | 143 (38.5%) | 228 (61.5%) |
| Education, Arts & Media | 0 (0.0%) | 0 (0.0%) |
| Legal Services & Support | 39 (40.6%) | 57 (59.4%) |
| Education Instruction & Library | 67 (28.9%) | 165 (71.1%) |
| Arts, Media & Entertainment | 37 (86.1%) | 6 (14.0%) |
| Health Diagnosing & Treating | 47 (26.3%) | 132 (73.7%) |
| Health Technologists | 47 (30.3%) | 108 (69.7%) |
| Total (Category) | 700 (49.6%) | 711 (50.4%) |
| Total (Overall) | 1,196 (54.5%) | 999 (45.5%) |
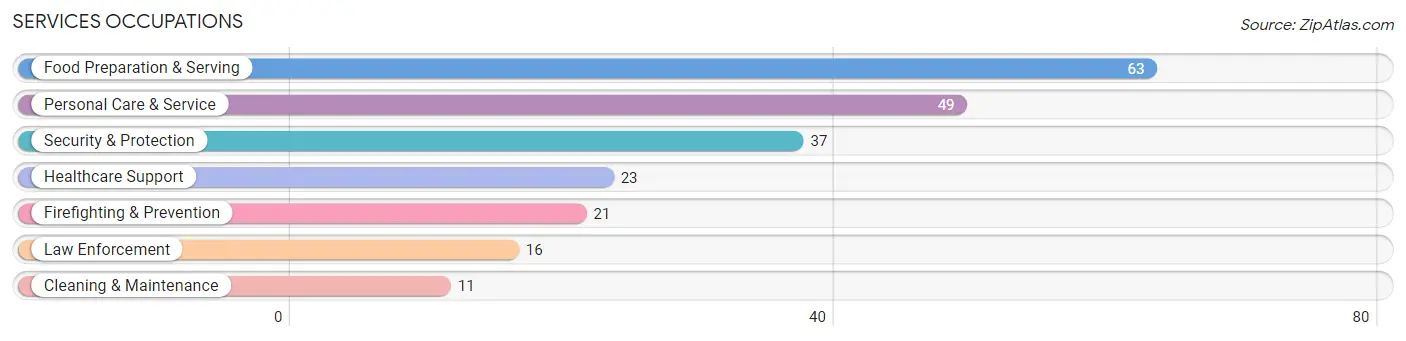
Services Occupations
The most common Services occupations in Riva are Food Preparation & Serving (63 | 2.9%), Personal Care & Service (49 | 2.2%), Security & Protection (37 | 1.7%), Healthcare Support (23 | 1.1%), and Firefighting & Prevention (21 | 1.0%).
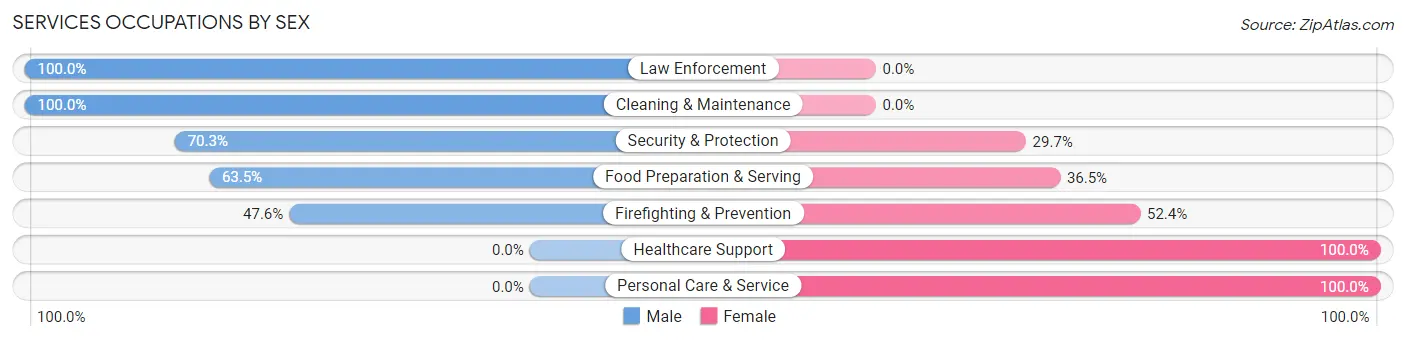
Services Occupations by Sex
Within the Services occupations in Riva, the most male-oriented occupations are Law Enforcement (100.0%), Cleaning & Maintenance (100.0%), and Security & Protection (70.3%), while the most female-oriented occupations are Healthcare Support (100.0%), Personal Care & Service (100.0%), and Firefighting & Prevention (52.4%).
| Occupation | Male | Female |
| Healthcare Support | 0 (0.0%) | 23 (100.0%) |
| Security & Protection | 26 (70.3%) | 11 (29.7%) |
| Firefighting & Prevention | 10 (47.6%) | 11 (52.4%) |
| Law Enforcement | 16 (100.0%) | 0 (0.0%) |
| Food Preparation & Serving | 40 (63.5%) | 23 (36.5%) |
| Cleaning & Maintenance | 11 (100.0%) | 0 (0.0%) |
| Personal Care & Service | 0 (0.0%) | 49 (100.0%) |
| Total (Category) | 77 (42.1%) | 106 (57.9%) |
| Total (Overall) | 1,196 (54.5%) | 999 (45.5%) |
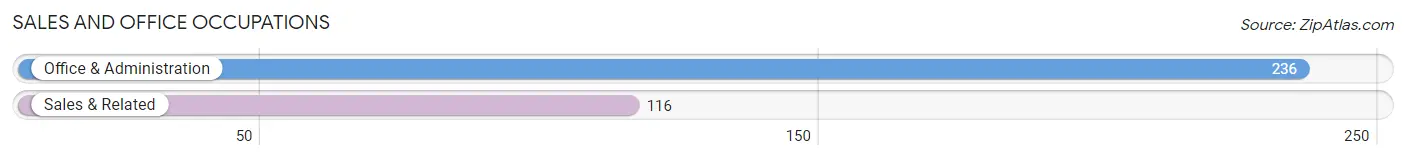
Sales and Office Occupations
The most common Sales and Office occupations in Riva are Office & Administration (236 | 10.7%), and Sales & Related (116 | 5.3%).
Sales and Office Occupations by Sex
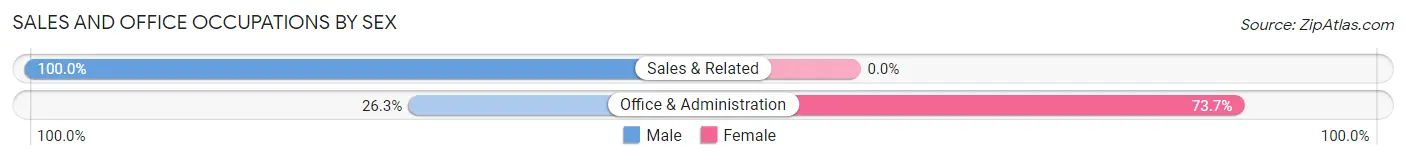
| Occupation | Male | Female |
| Sales & Related | 116 (100.0%) | 0 (0.0%) |
| Office & Administration | 62 (26.3%) | 174 (73.7%) |
| Total (Category) | 178 (50.6%) | 174 (49.4%) |
| Total (Overall) | 1,196 (54.5%) | 999 (45.5%) |
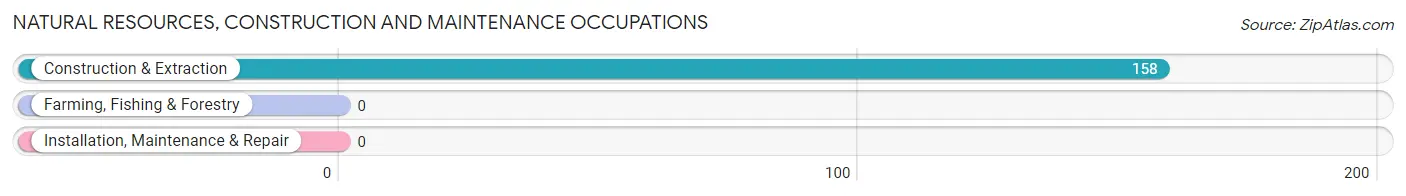
Natural Resources, Construction and Maintenance Occupations
The most common Natural Resources, Construction and Maintenance occupations in Riva are , and Construction & Extraction (158 | 7.2%).
Natural Resources, Construction and Maintenance Occupations by Sex
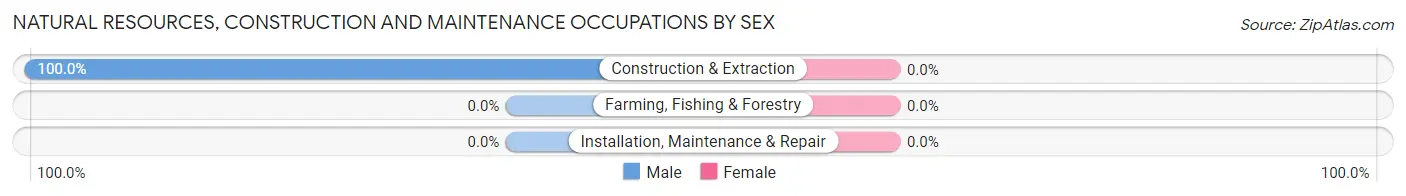
| Occupation | Male | Female |
| Farming, Fishing & Forestry | 0 (0.0%) | 0 (0.0%) |
| Construction & Extraction | 158 (100.0%) | 0 (0.0%) |
| Installation, Maintenance & Repair | 0 (0.0%) | 0 (0.0%) |
| Total (Category) | 158 (100.0%) | 0 (0.0%) |
| Total (Overall) | 1,196 (54.5%) | 999 (45.5%) |
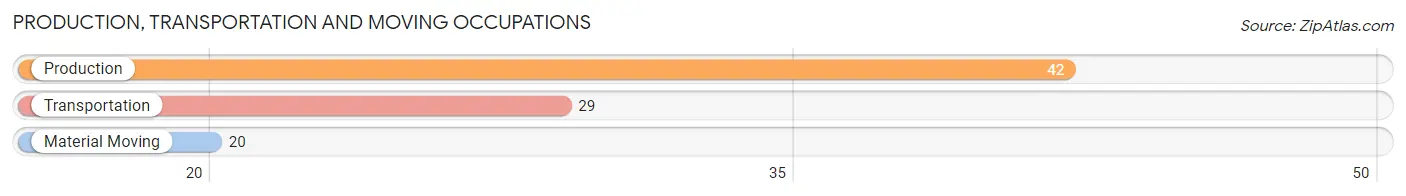
Production, Transportation and Moving Occupations
The most common Production, Transportation and Moving occupations in Riva are Production (42 | 1.9%), Transportation (29 | 1.3%), and Material Moving (20 | 0.9%).
Production, Transportation and Moving Occupations by Sex
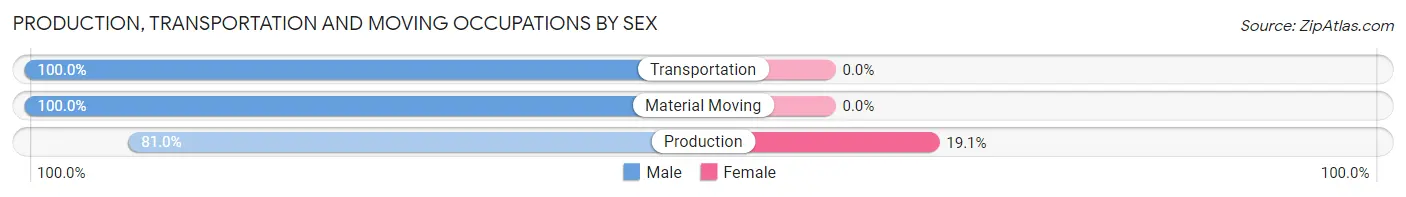
| Occupation | Male | Female |
| Production | 34 (80.9%) | 8 (19.1%) |
| Transportation | 29 (100.0%) | 0 (0.0%) |
| Material Moving | 20 (100.0%) | 0 (0.0%) |
| Total (Category) | 83 (91.2%) | 8 (8.8%) |
| Total (Overall) | 1,196 (54.5%) | 999 (45.5%) |
Employment Industries by Sex in Riva
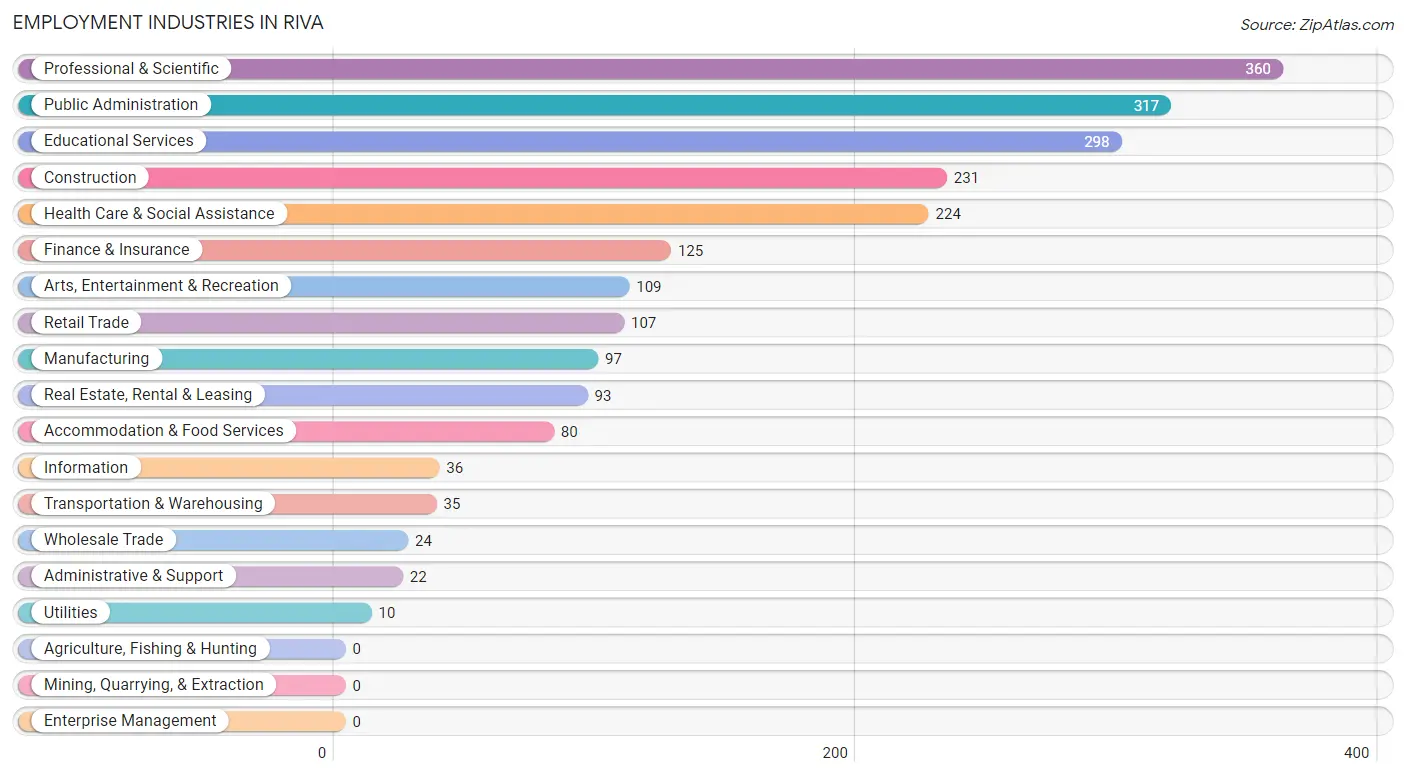
Employment Industries in Riva
The major employment industries in Riva include Professional & Scientific (360 | 16.4%), Public Administration (317 | 14.4%), Educational Services (298 | 13.6%), Construction (231 | 10.5%), and Health Care & Social Assistance (224 | 10.2%).
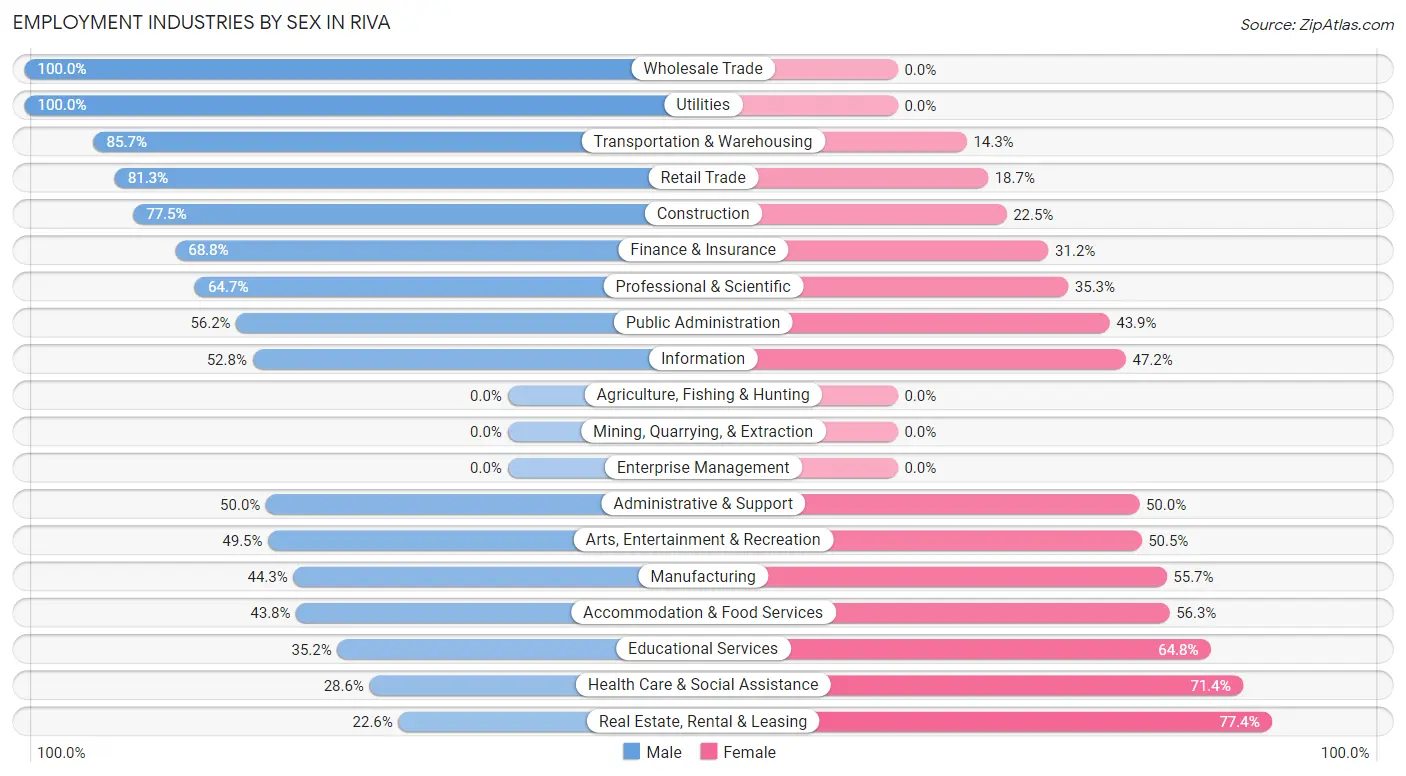
Employment Industries by Sex in Riva
The Riva industries that see more men than women are Wholesale Trade (100.0%), Utilities (100.0%), and Transportation & Warehousing (85.7%), whereas the industries that tend to have a higher number of women are Real Estate, Rental & Leasing (77.4%), Health Care & Social Assistance (71.4%), and Educational Services (64.8%).
| Industry | Male | Female |
| Agriculture, Fishing & Hunting | 0 (0.0%) | 0 (0.0%) |
| Mining, Quarrying, & Extraction | 0 (0.0%) | 0 (0.0%) |
| Construction | 179 (77.5%) | 52 (22.5%) |
| Manufacturing | 43 (44.3%) | 54 (55.7%) |
| Wholesale Trade | 24 (100.0%) | 0 (0.0%) |
| Retail Trade | 87 (81.3%) | 20 (18.7%) |
| Transportation & Warehousing | 30 (85.7%) | 5 (14.3%) |
| Utilities | 10 (100.0%) | 0 (0.0%) |
| Information | 19 (52.8%) | 17 (47.2%) |
| Finance & Insurance | 86 (68.8%) | 39 (31.2%) |
| Real Estate, Rental & Leasing | 21 (22.6%) | 72 (77.4%) |
| Professional & Scientific | 233 (64.7%) | 127 (35.3%) |
| Enterprise Management | 0 (0.0%) | 0 (0.0%) |
| Administrative & Support | 11 (50.0%) | 11 (50.0%) |
| Educational Services | 105 (35.2%) | 193 (64.8%) |
| Health Care & Social Assistance | 64 (28.6%) | 160 (71.4%) |
| Arts, Entertainment & Recreation | 54 (49.5%) | 55 (50.5%) |
| Accommodation & Food Services | 35 (43.8%) | 45 (56.2%) |
| Public Administration | 178 (56.1%) | 139 (43.9%) |
| Total | 1,196 (54.5%) | 999 (45.5%) |
Education in Riva
School Enrollment in Riva
The most common levels of schooling among the 1,338 students in Riva are middle school (403 | 30.1%), elementary school (374 | 28.0%), and college / undergraduate (182 | 13.6%).
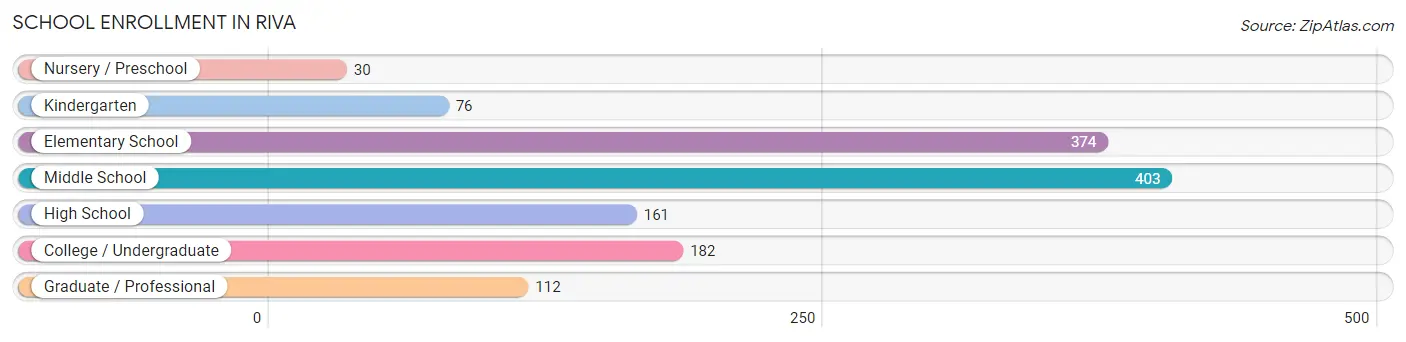
| School Level | # Students | % Students |
| Nursery / Preschool | 30 | 2.2% |
| Kindergarten | 76 | 5.7% |
| Elementary School | 374 | 28.0% |
| Middle School | 403 | 30.1% |
| High School | 161 | 12.0% |
| College / Undergraduate | 182 | 13.6% |
| Graduate / Professional | 112 | 8.4% |
| Total | 1,338 | 100.0% |
School Enrollment by Age by Funding Source in Riva
Out of a total of 1,338 students who are enrolled in schools in Riva, 222 (16.6%) attend a private institution, while the remaining 1,116 (83.4%) are enrolled in public schools. The age group of 3 to 4 year olds has the highest likelihood of being enrolled in private schools, with 18 (60.0% in the age bracket) enrolled. Conversely, the age group of 5 to 9 year old has the lowest likelihood of being enrolled in a private school, with 413 (100.0% in the age bracket) attending a public institution.
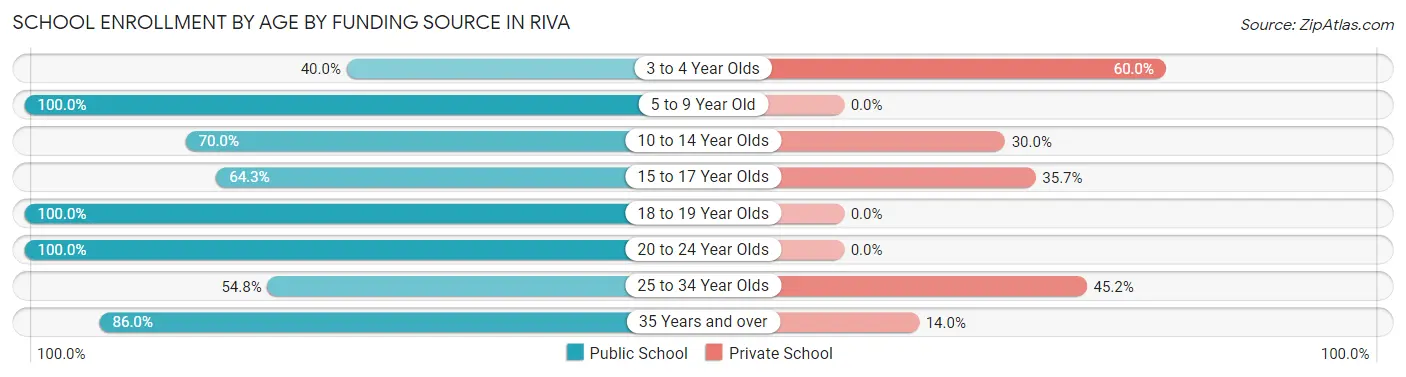
| Age Bracket | Public School | Private School |
| 3 to 4 Year Olds | 12 (40.0%) | 18 (60.0%) |
| 5 to 9 Year Old | 413 (100.0%) | 0 (0.0%) |
| 10 to 14 Year Olds | 308 (70.0%) | 132 (30.0%) |
| 15 to 17 Year Olds | 72 (64.3%) | 40 (35.7%) |
| 18 to 19 Year Olds | 136 (100.0%) | 0 (0.0%) |
| 20 to 24 Year Olds | 72 (100.0%) | 0 (0.0%) |
| 25 to 34 Year Olds | 23 (54.8%) | 19 (45.2%) |
| 35 Years and over | 80 (86.0%) | 13 (14.0%) |
| Total | 1,116 (83.4%) | 222 (16.6%) |
Educational Attainment by Field of Study in Riva
Education (348 | 16.7%), business (312 | 14.9%), science & technology (191 | 9.1%), social sciences (172 | 8.2%), and liberal arts & history (161 | 7.7%) are the most common fields of study among 2,087 individuals in Riva who have obtained a bachelor's degree or higher.
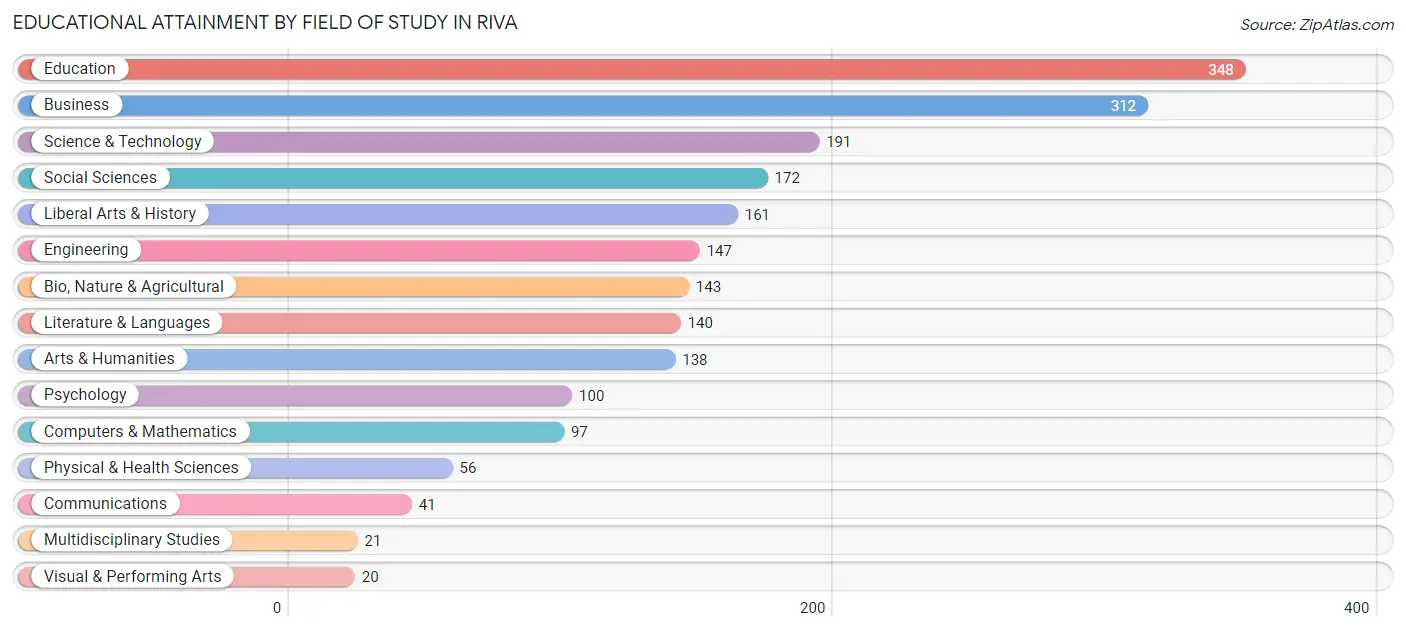
| Field of Study | # Graduates | % Graduates |
| Computers & Mathematics | 97 | 4.6% |
| Bio, Nature & Agricultural | 143 | 6.9% |
| Physical & Health Sciences | 56 | 2.7% |
| Psychology | 100 | 4.8% |
| Social Sciences | 172 | 8.2% |
| Engineering | 147 | 7.0% |
| Multidisciplinary Studies | 21 | 1.0% |
| Science & Technology | 191 | 9.1% |
| Business | 312 | 14.9% |
| Education | 348 | 16.7% |
| Literature & Languages | 140 | 6.7% |
| Liberal Arts & History | 161 | 7.7% |
| Visual & Performing Arts | 20 | 1.0% |
| Communications | 41 | 2.0% |
| Arts & Humanities | 138 | 6.6% |
| Total | 2,087 | 100.0% |
Transportation & Commute in Riva
Vehicle Availability by Sex in Riva
The most prevalent vehicle ownership categories in Riva are males with 2 vehicles (583, accounting for 48.7%) and females with 2 vehicles (383, making up 59.0%).
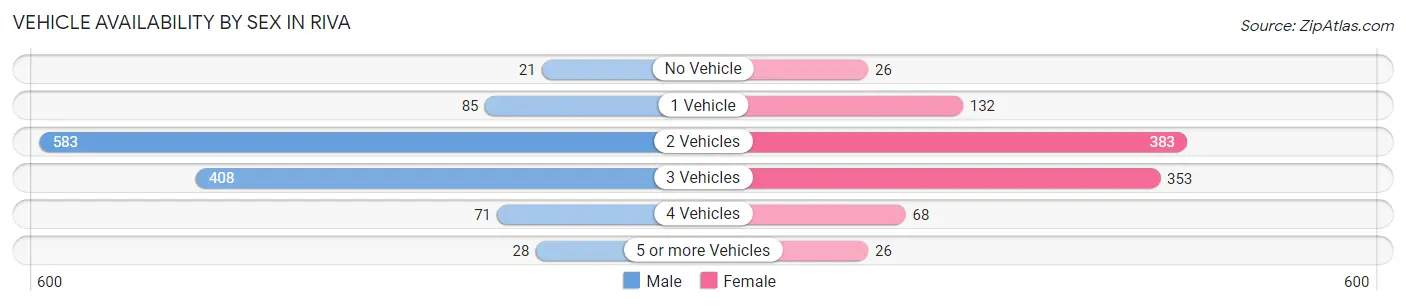
| Vehicles Available | Male | Female |
| No Vehicle | 21 (1.8%) | 26 (2.6%) |
| 1 Vehicle | 85 (7.1%) | 132 (13.4%) |
| 2 Vehicles | 583 (48.7%) | 383 (38.8%) |
| 3 Vehicles | 408 (34.1%) | 353 (35.7%) |
| 4 Vehicles | 71 (5.9%) | 68 (6.9%) |
| 5 or more Vehicles | 28 (2.3%) | 26 (2.6%) |
| Total | 1,196 (100.0%) | 988 (100.0%) |
Commute Time in Riva
The most frequently occuring commute durations in Riva are 10 to 14 minutes (310 commuters, 18.1%), 60 to 89 minutes (257 commuters, 15.0%), and 45 to 59 minutes (217 commuters, 12.7%).
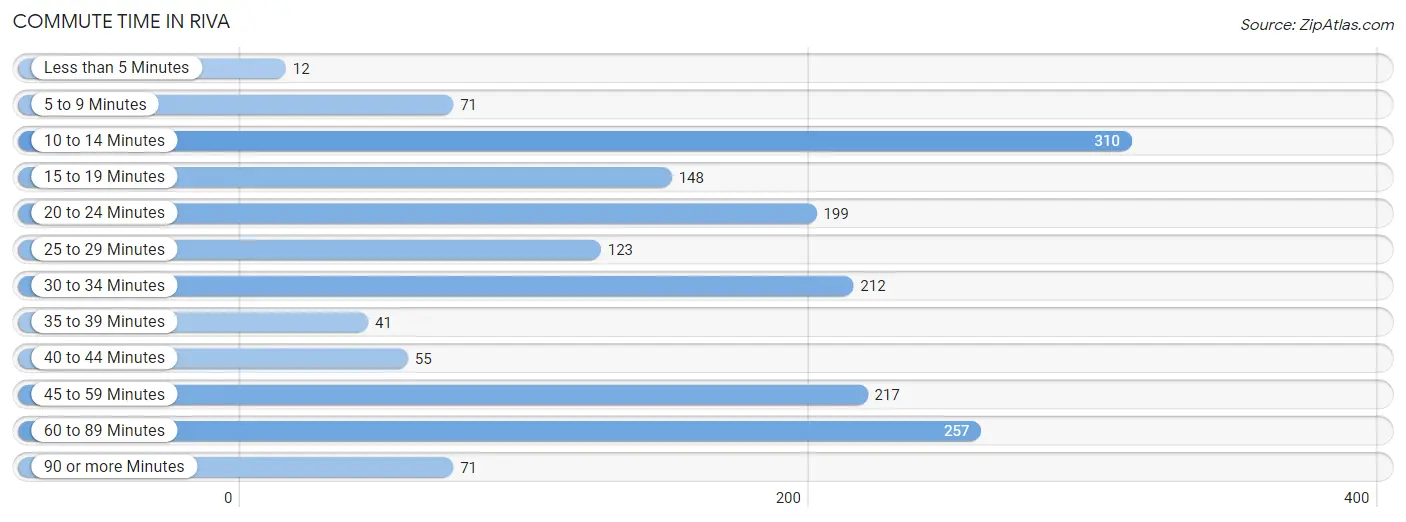
| Commute Time | # Commuters | % Commuters |
| Less than 5 Minutes | 12 | 0.7% |
| 5 to 9 Minutes | 71 | 4.1% |
| 10 to 14 Minutes | 310 | 18.1% |
| 15 to 19 Minutes | 148 | 8.6% |
| 20 to 24 Minutes | 199 | 11.6% |
| 25 to 29 Minutes | 123 | 7.2% |
| 30 to 34 Minutes | 212 | 12.3% |
| 35 to 39 Minutes | 41 | 2.4% |
| 40 to 44 Minutes | 55 | 3.2% |
| 45 to 59 Minutes | 217 | 12.7% |
| 60 to 89 Minutes | 257 | 15.0% |
| 90 or more Minutes | 71 | 4.1% |
Commute Time by Sex in Riva
The most common commute times in Riva are 60 to 89 minutes (171 commuters, 17.1%) for males and 10 to 14 minutes (203 commuters, 28.3%) for females.
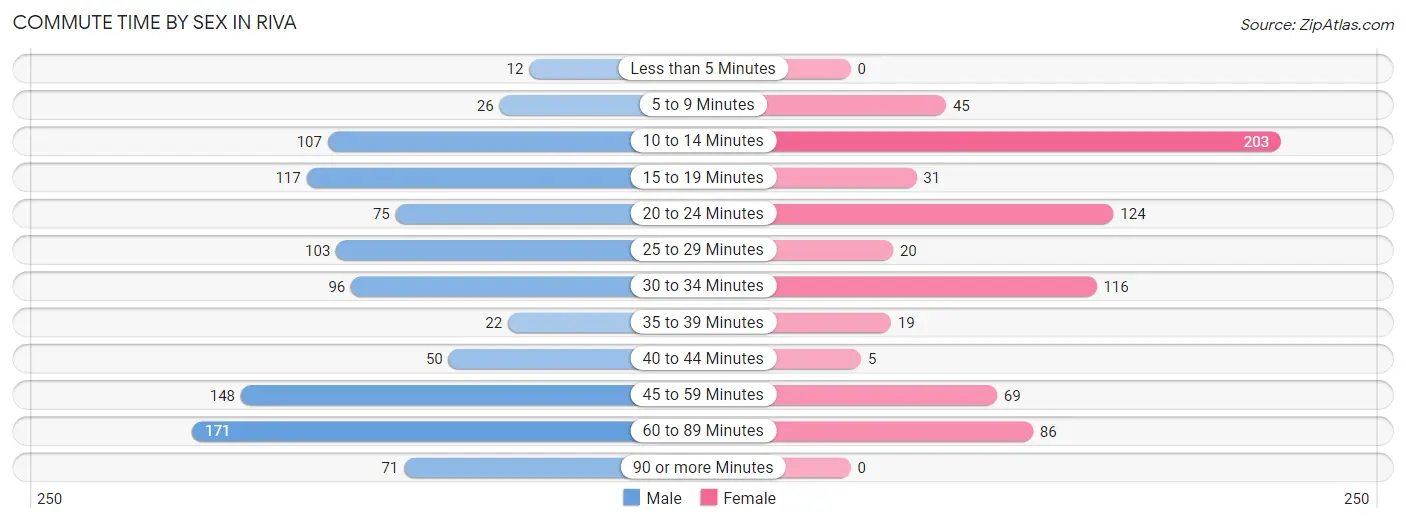
| Commute Time | Male | Female |
| Less than 5 Minutes | 12 (1.2%) | 0 (0.0%) |
| 5 to 9 Minutes | 26 (2.6%) | 45 (6.3%) |
| 10 to 14 Minutes | 107 (10.7%) | 203 (28.3%) |
| 15 to 19 Minutes | 117 (11.7%) | 31 (4.3%) |
| 20 to 24 Minutes | 75 (7.5%) | 124 (17.3%) |
| 25 to 29 Minutes | 103 (10.3%) | 20 (2.8%) |
| 30 to 34 Minutes | 96 (9.6%) | 116 (16.2%) |
| 35 to 39 Minutes | 22 (2.2%) | 19 (2.6%) |
| 40 to 44 Minutes | 50 (5.0%) | 5 (0.7%) |
| 45 to 59 Minutes | 148 (14.8%) | 69 (9.6%) |
| 60 to 89 Minutes | 171 (17.1%) | 86 (12.0%) |
| 90 or more Minutes | 71 (7.1%) | 0 (0.0%) |
Time of Departure to Work by Sex in Riva
The most frequent times of departure to work in Riva are 7:00 AM to 7:29 AM (204, 20.4%) for males and 7:30 AM to 7:59 AM (244, 34.0%) for females.
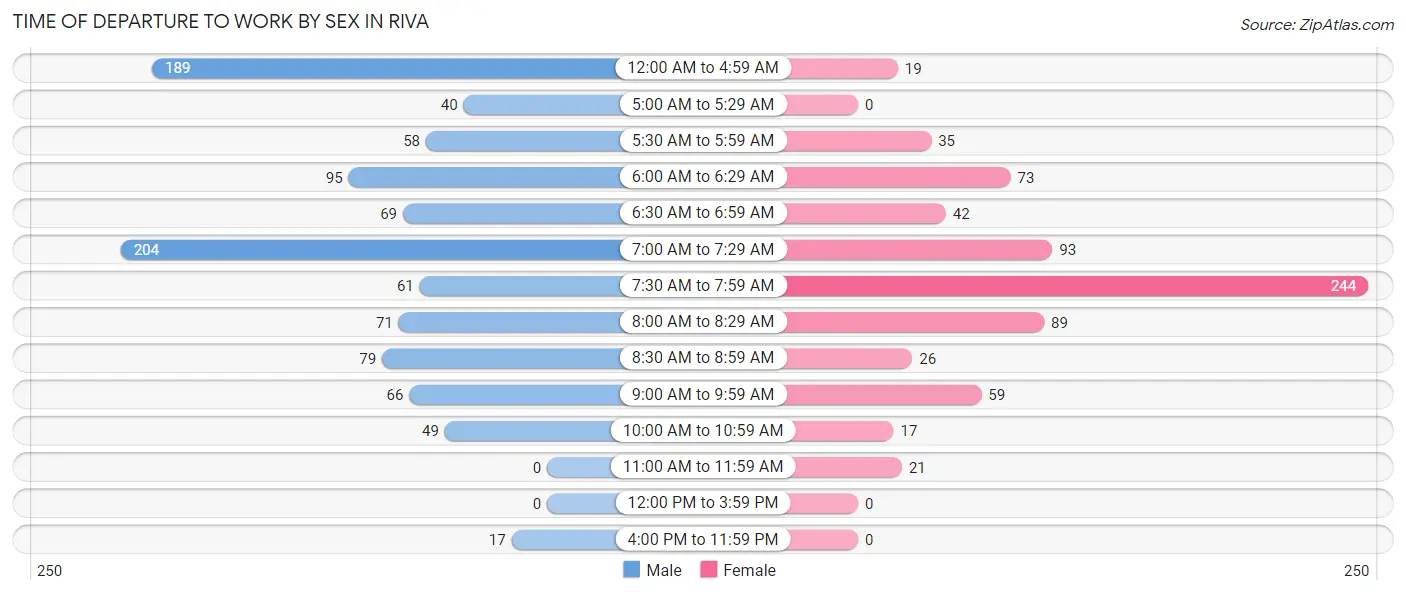
| Time of Departure | Male | Female |
| 12:00 AM to 4:59 AM | 189 (18.9%) | 19 (2.6%) |
| 5:00 AM to 5:29 AM | 40 (4.0%) | 0 (0.0%) |
| 5:30 AM to 5:59 AM | 58 (5.8%) | 35 (4.9%) |
| 6:00 AM to 6:29 AM | 95 (9.5%) | 73 (10.2%) |
| 6:30 AM to 6:59 AM | 69 (6.9%) | 42 (5.9%) |
| 7:00 AM to 7:29 AM | 204 (20.4%) | 93 (13.0%) |
| 7:30 AM to 7:59 AM | 61 (6.1%) | 244 (34.0%) |
| 8:00 AM to 8:29 AM | 71 (7.1%) | 89 (12.4%) |
| 8:30 AM to 8:59 AM | 79 (7.9%) | 26 (3.6%) |
| 9:00 AM to 9:59 AM | 66 (6.6%) | 59 (8.2%) |
| 10:00 AM to 10:59 AM | 49 (4.9%) | 17 (2.4%) |
| 11:00 AM to 11:59 AM | 0 (0.0%) | 21 (2.9%) |
| 12:00 PM to 3:59 PM | 0 (0.0%) | 0 (0.0%) |
| 4:00 PM to 11:59 PM | 17 (1.7%) | 0 (0.0%) |
| Total | 998 (100.0%) | 718 (100.0%) |
Housing Occupancy in Riva
Occupancy by Ownership in Riva
Of the total 1,625 dwellings in Riva, owner-occupied units account for 1,560 (96.0%), while renter-occupied units make up 65 (4.0%).
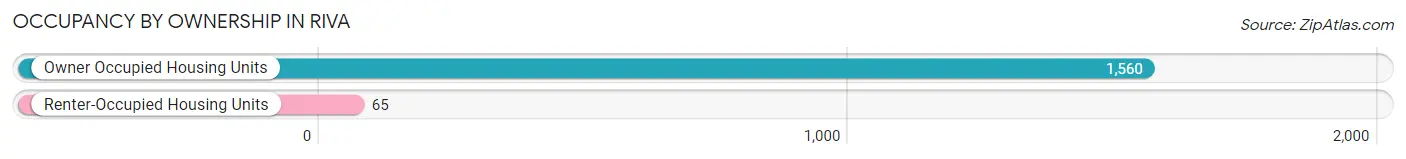
| Occupancy | # Housing Units | % Housing Units |
| Owner Occupied Housing Units | 1,560 | 96.0% |
| Renter-Occupied Housing Units | 65 | 4.0% |
| Total Occupied Housing Units | 1,625 | 100.0% |
Occupancy by Household Size in Riva
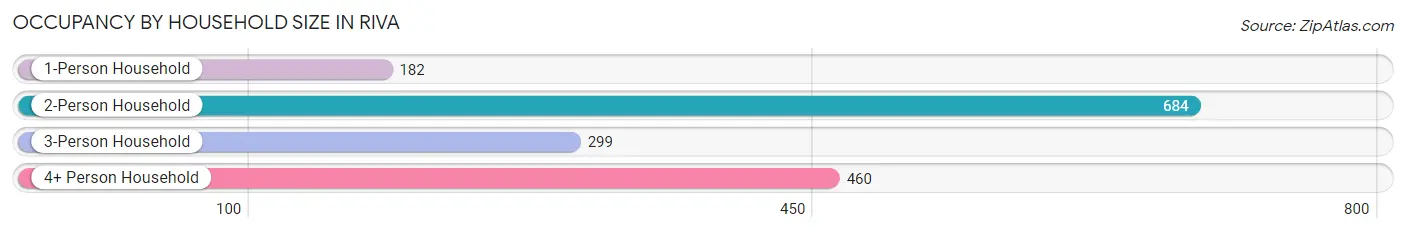
| Household Size | # Housing Units | % Housing Units |
| 1-Person Household | 182 | 11.2% |
| 2-Person Household | 684 | 42.1% |
| 3-Person Household | 299 | 18.4% |
| 4+ Person Household | 460 | 28.3% |
| Total Housing Units | 1,625 | 100.0% |
Occupancy by Ownership by Household Size in Riva
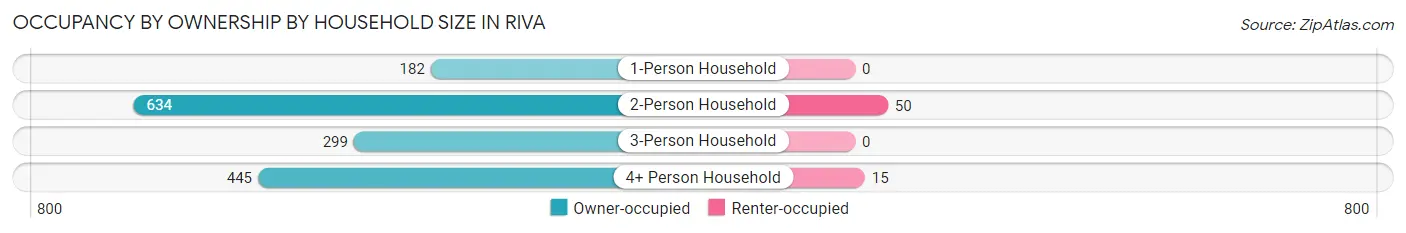
| Household Size | Owner-occupied | Renter-occupied |
| 1-Person Household | 182 (100.0%) | 0 (0.0%) |
| 2-Person Household | 634 (92.7%) | 50 (7.3%) |
| 3-Person Household | 299 (100.0%) | 0 (0.0%) |
| 4+ Person Household | 445 (96.7%) | 15 (3.3%) |
| Total Housing Units | 1,560 (96.0%) | 65 (4.0%) |
Occupancy by Educational Attainment in Riva
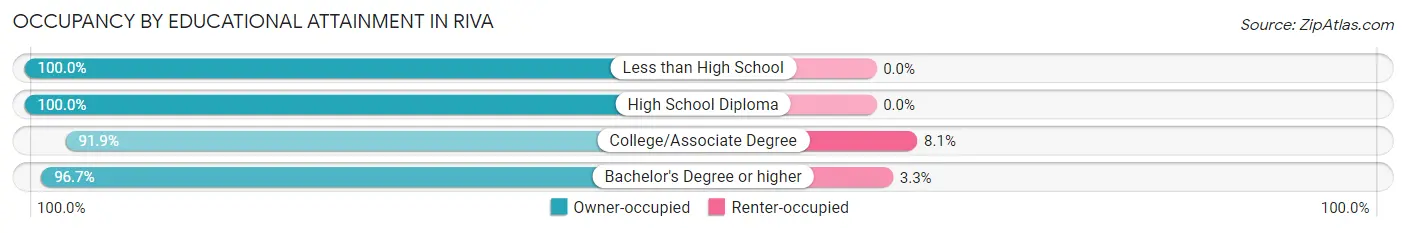
| Household Size | Owner-occupied | Renter-occupied |
| Less than High School | 23 (100.0%) | 0 (0.0%) |
| High School Diploma | 177 (100.0%) | 0 (0.0%) |
| College/Associate Degree | 339 (91.9%) | 30 (8.1%) |
| Bachelor's Degree or higher | 1,021 (96.7%) | 35 (3.3%) |
Occupancy by Age of Householder in Riva
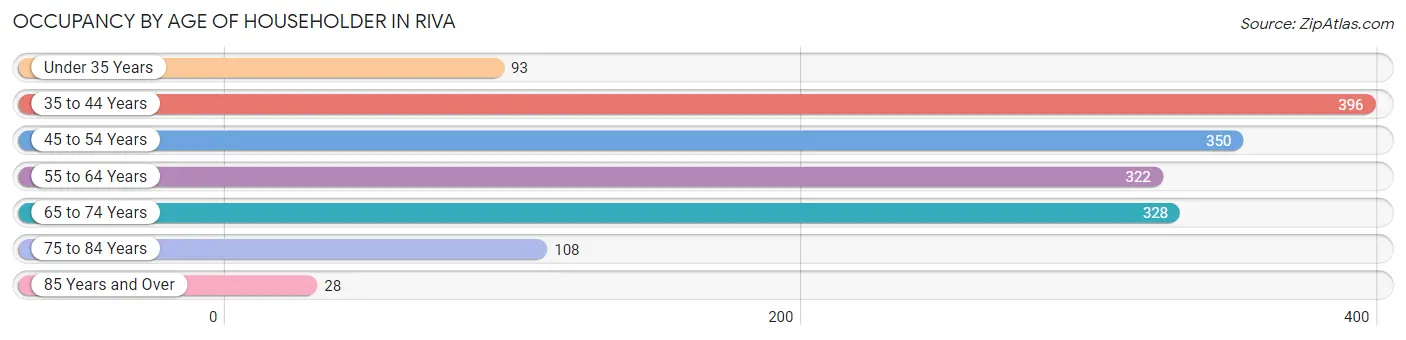
| Age Bracket | # Households | % Households |
| Under 35 Years | 93 | 5.7% |
| 35 to 44 Years | 396 | 24.4% |
| 45 to 54 Years | 350 | 21.5% |
| 55 to 64 Years | 322 | 19.8% |
| 65 to 74 Years | 328 | 20.2% |
| 75 to 84 Years | 108 | 6.7% |
| 85 Years and Over | 28 | 1.7% |
| Total | 1,625 | 100.0% |
Housing Finances in Riva
Median Income by Occupancy in Riva
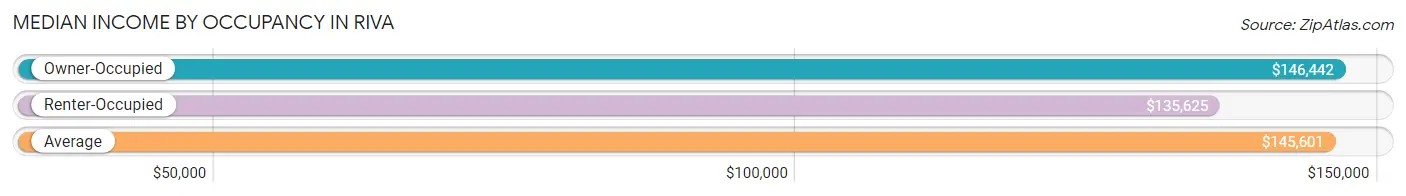
| Occupancy Type | # Households | Median Income |
| Owner-Occupied | 1,560 (96.0%) | $146,442 |
| Renter-Occupied | 65 (4.0%) | $135,625 |
| Average | 1,625 (100.0%) | $145,601 |
Occupancy by Householder Income Bracket in Riva
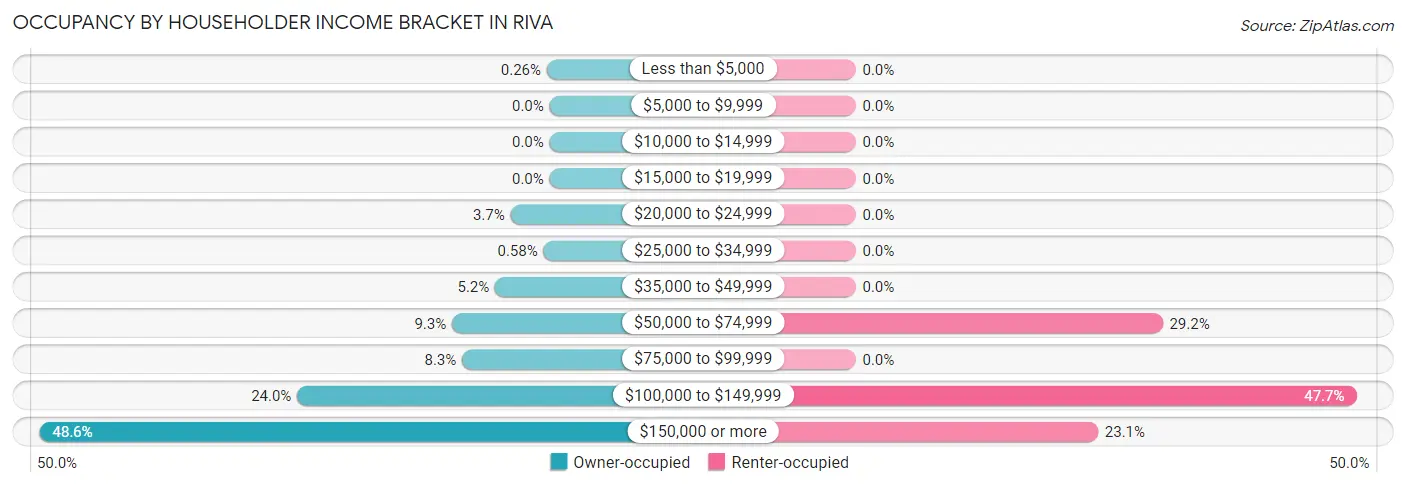
| Income Bracket | Owner-occupied | Renter-occupied |
| Less than $5,000 | 4 (0.3%) | 0 (0.0%) |
| $5,000 to $9,999 | 0 (0.0%) | 0 (0.0%) |
| $10,000 to $14,999 | 0 (0.0%) | 0 (0.0%) |
| $15,000 to $19,999 | 0 (0.0%) | 0 (0.0%) |
| $20,000 to $24,999 | 58 (3.7%) | 0 (0.0%) |
| $25,000 to $34,999 | 9 (0.6%) | 0 (0.0%) |
| $35,000 to $49,999 | 81 (5.2%) | 0 (0.0%) |
| $50,000 to $74,999 | 145 (9.3%) | 19 (29.2%) |
| $75,000 to $99,999 | 130 (8.3%) | 0 (0.0%) |
| $100,000 to $149,999 | 375 (24.0%) | 31 (47.7%) |
| $150,000 or more | 758 (48.6%) | 15 (23.1%) |
| Total | 1,560 (100.0%) | 65 (100.0%) |
Monthly Housing Cost Tiers in Riva
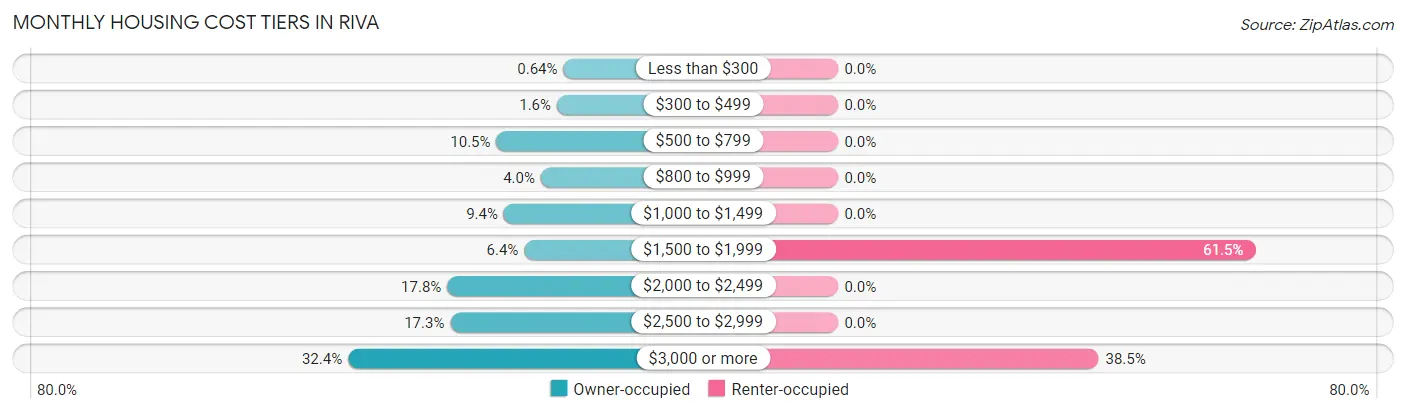
| Monthly Cost | Owner-occupied | Renter-occupied |
| Less than $300 | 10 (0.6%) | 0 (0.0%) |
| $300 to $499 | 25 (1.6%) | 0 (0.0%) |
| $500 to $799 | 164 (10.5%) | 0 (0.0%) |
| $800 to $999 | 62 (4.0%) | 0 (0.0%) |
| $1,000 to $1,499 | 147 (9.4%) | 0 (0.0%) |
| $1,500 to $1,999 | 100 (6.4%) | 40 (61.5%) |
| $2,000 to $2,499 | 277 (17.8%) | 0 (0.0%) |
| $2,500 to $2,999 | 270 (17.3%) | 0 (0.0%) |
| $3,000 or more | 505 (32.4%) | 25 (38.5%) |
| Total | 1,560 (100.0%) | 65 (100.0%) |
Physical Housing Characteristics in Riva
Housing Structures in Riva
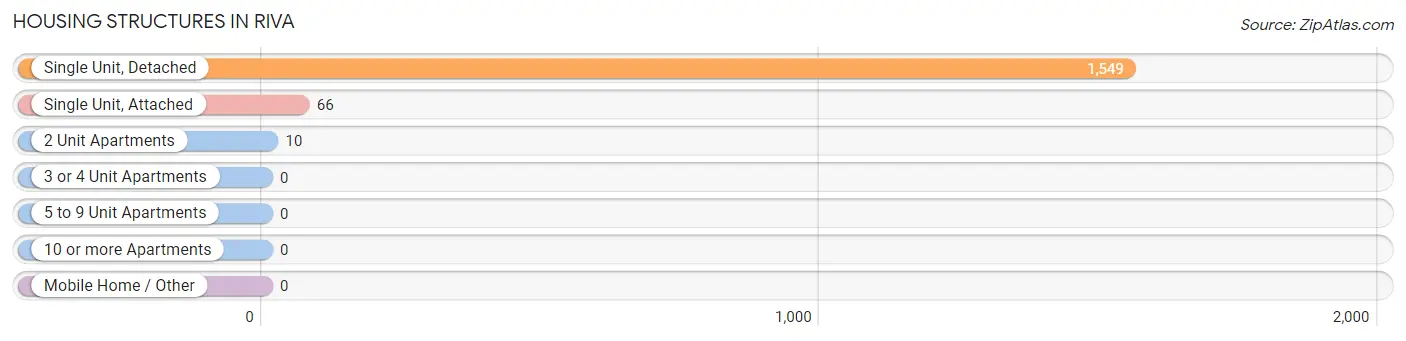
| Structure Type | # Housing Units | % Housing Units |
| Single Unit, Detached | 1,549 | 95.3% |
| Single Unit, Attached | 66 | 4.1% |
| 2 Unit Apartments | 10 | 0.6% |
| 3 or 4 Unit Apartments | 0 | 0.0% |
| 5 to 9 Unit Apartments | 0 | 0.0% |
| 10 or more Apartments | 0 | 0.0% |
| Mobile Home / Other | 0 | 0.0% |
| Total | 1,625 | 100.0% |
Housing Structures by Occupancy in Riva
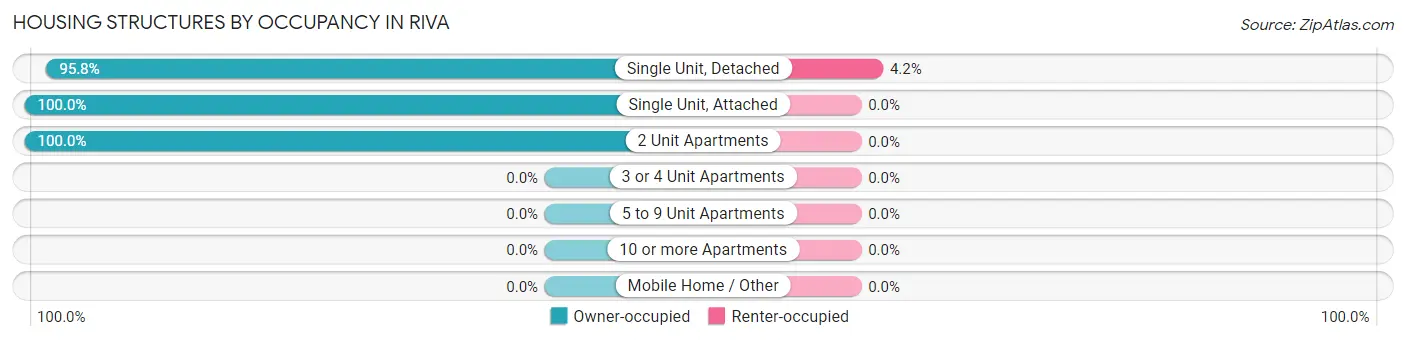
| Structure Type | Owner-occupied | Renter-occupied |
| Single Unit, Detached | 1,484 (95.8%) | 65 (4.2%) |
| Single Unit, Attached | 66 (100.0%) | 0 (0.0%) |
| 2 Unit Apartments | 10 (100.0%) | 0 (0.0%) |
| 3 or 4 Unit Apartments | 0 (0.0%) | 0 (0.0%) |
| 5 to 9 Unit Apartments | 0 (0.0%) | 0 (0.0%) |
| 10 or more Apartments | 0 (0.0%) | 0 (0.0%) |
| Mobile Home / Other | 0 (0.0%) | 0 (0.0%) |
| Total | 1,560 (96.0%) | 65 (4.0%) |
Housing Structures by Number of Rooms in Riva
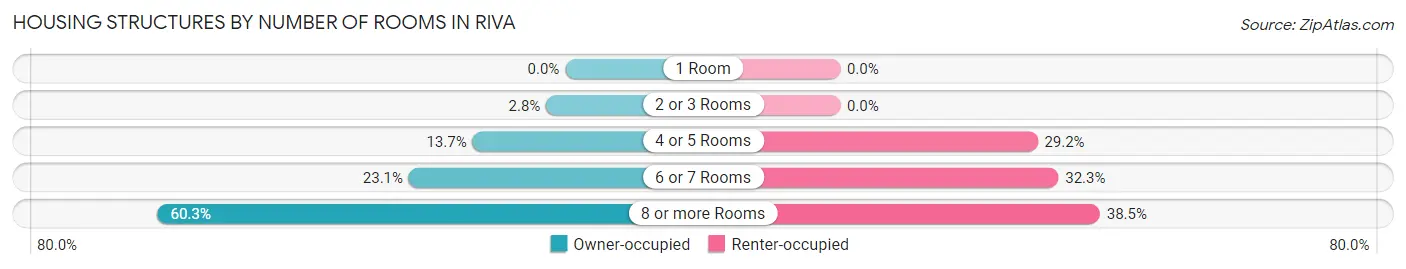
| Number of Rooms | Owner-occupied | Renter-occupied |
| 1 Room | 0 (0.0%) | 0 (0.0%) |
| 2 or 3 Rooms | 44 (2.8%) | 0 (0.0%) |
| 4 or 5 Rooms | 214 (13.7%) | 19 (29.2%) |
| 6 or 7 Rooms | 361 (23.1%) | 21 (32.3%) |
| 8 or more Rooms | 941 (60.3%) | 25 (38.5%) |
| Total | 1,560 (100.0%) | 65 (100.0%) |
Housing Structure by Heating Type in Riva
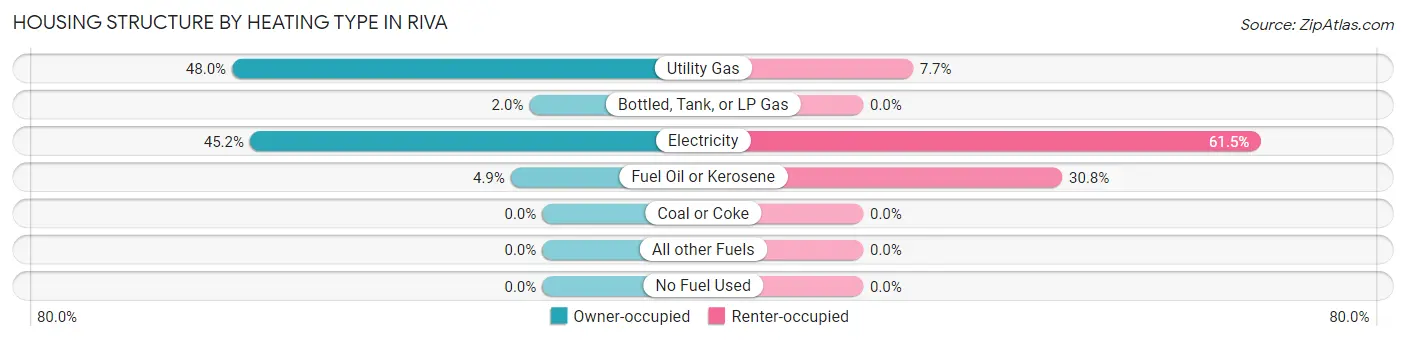
| Heating Type | Owner-occupied | Renter-occupied |
| Utility Gas | 748 (47.9%) | 5 (7.7%) |
| Bottled, Tank, or LP Gas | 31 (2.0%) | 0 (0.0%) |
| Electricity | 705 (45.2%) | 40 (61.5%) |
| Fuel Oil or Kerosene | 76 (4.9%) | 20 (30.8%) |
| Coal or Coke | 0 (0.0%) | 0 (0.0%) |
| All other Fuels | 0 (0.0%) | 0 (0.0%) |
| No Fuel Used | 0 (0.0%) | 0 (0.0%) |
| Total | 1,560 (100.0%) | 65 (100.0%) |
Household Vehicle Usage in Riva
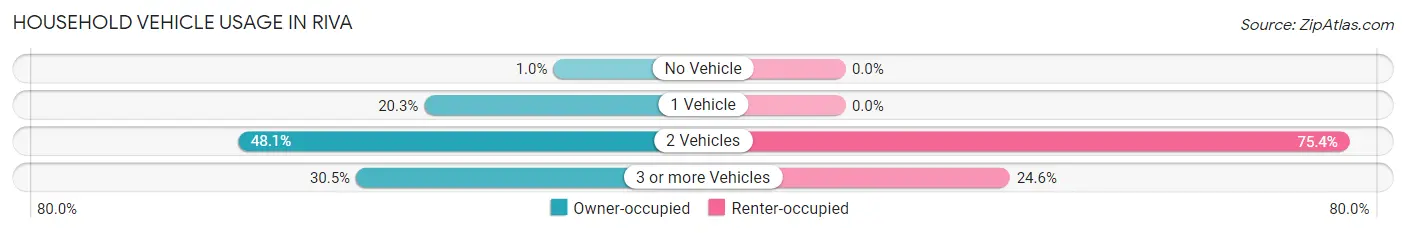
| Vehicles per Household | Owner-occupied | Renter-occupied |
| No Vehicle | 16 (1.0%) | 0 (0.0%) |
| 1 Vehicle | 317 (20.3%) | 0 (0.0%) |
| 2 Vehicles | 751 (48.1%) | 49 (75.4%) |
| 3 or more Vehicles | 476 (30.5%) | 16 (24.6%) |
| Total | 1,560 (100.0%) | 65 (100.0%) |
Real Estate & Mortgages in Riva
Real Estate and Mortgage Overview in Riva
| Characteristic | Without Mortgage | With Mortgage |
| Housing Units | 320 | 1,240 |
| Median Property Value | $564,700 | $567,600 |
| Median Household Income | - | - |
| Monthly Housing Costs | $950 | $505 |
| Real Estate Taxes | $4,705 | $0 |
Property Value by Mortgage Status in Riva
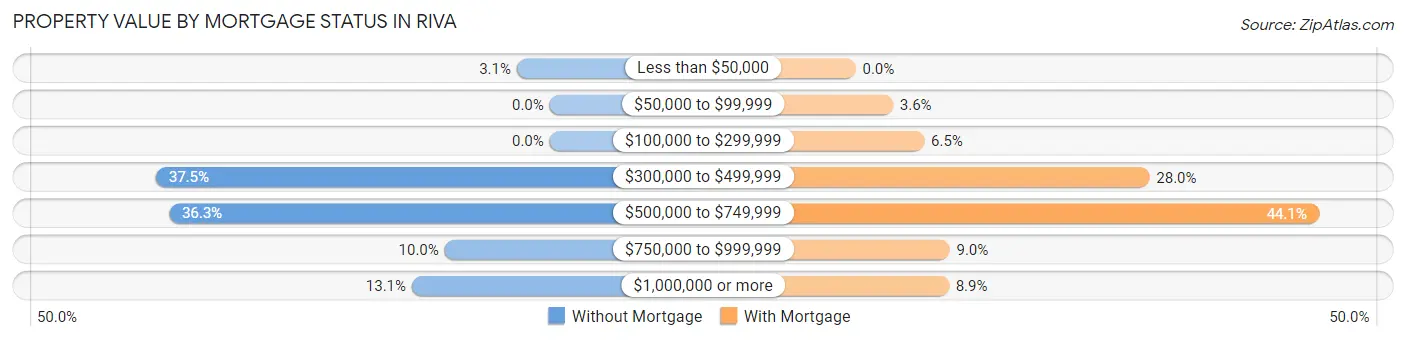
| Property Value | Without Mortgage | With Mortgage |
| Less than $50,000 | 10 (3.1%) | 0 (0.0%) |
| $50,000 to $99,999 | 0 (0.0%) | 44 (3.5%) |
| $100,000 to $299,999 | 0 (0.0%) | 81 (6.5%) |
| $300,000 to $499,999 | 120 (37.5%) | 347 (28.0%) |
| $500,000 to $749,999 | 116 (36.2%) | 547 (44.1%) |
| $750,000 to $999,999 | 32 (10.0%) | 111 (8.9%) |
| $1,000,000 or more | 42 (13.1%) | 110 (8.9%) |
| Total | 320 (100.0%) | 1,240 (100.0%) |
Household Income by Mortgage Status in Riva
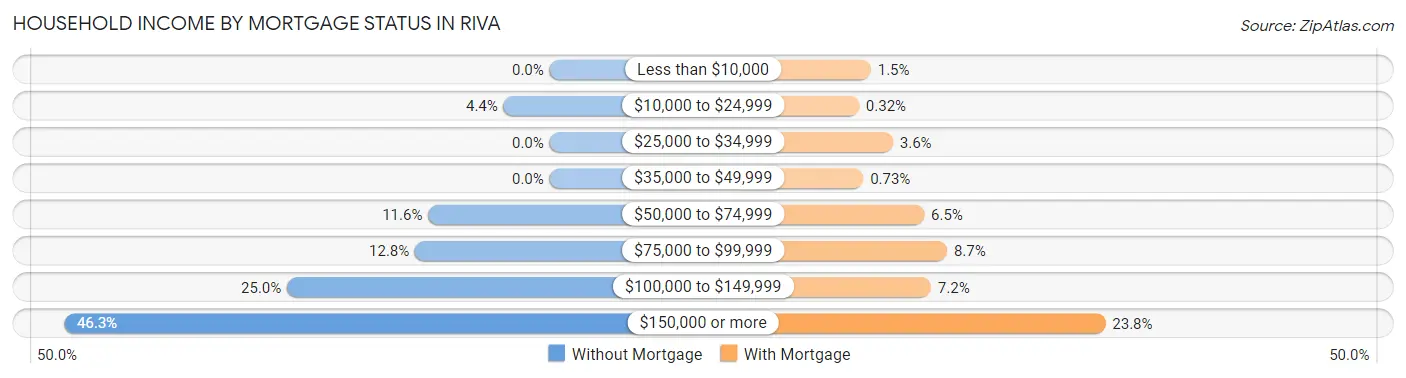
| Household Income | Without Mortgage | With Mortgage |
| Less than $10,000 | 0 (0.0%) | 18 (1.5%) |
| $10,000 to $24,999 | 14 (4.4%) | 4 (0.3%) |
| $25,000 to $34,999 | 0 (0.0%) | 44 (3.5%) |
| $35,000 to $49,999 | 0 (0.0%) | 9 (0.7%) |
| $50,000 to $74,999 | 37 (11.6%) | 81 (6.5%) |
| $75,000 to $99,999 | 41 (12.8%) | 108 (8.7%) |
| $100,000 to $149,999 | 80 (25.0%) | 89 (7.2%) |
| $150,000 or more | 148 (46.3%) | 295 (23.8%) |
| Total | 320 (100.0%) | 1,240 (100.0%) |
Property Value to Household Income Ratio in Riva
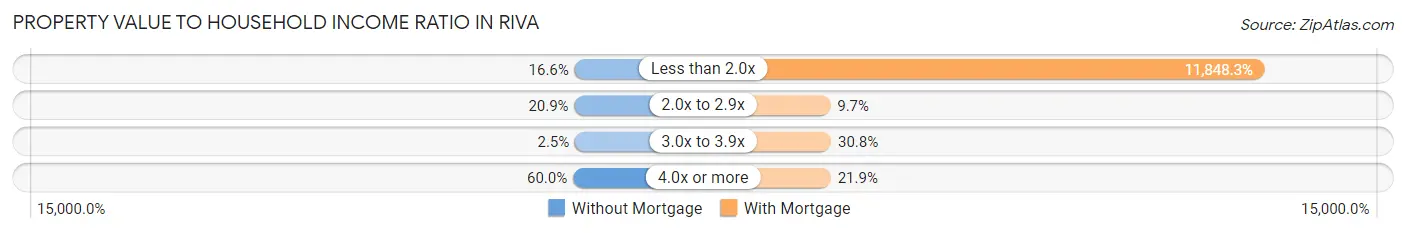
| Value-to-Income Ratio | Without Mortgage | With Mortgage |
| Less than 2.0x | 53 (16.6%) | 146,919 (11,848.3%) |
| 2.0x to 2.9x | 67 (20.9%) | 120 (9.7%) |
| 3.0x to 3.9x | 8 (2.5%) | 382 (30.8%) |
| 4.0x or more | 192 (60.0%) | 272 (21.9%) |
| Total | 320 (100.0%) | 1,240 (100.0%) |
Real Estate Taxes by Mortgage Status in Riva
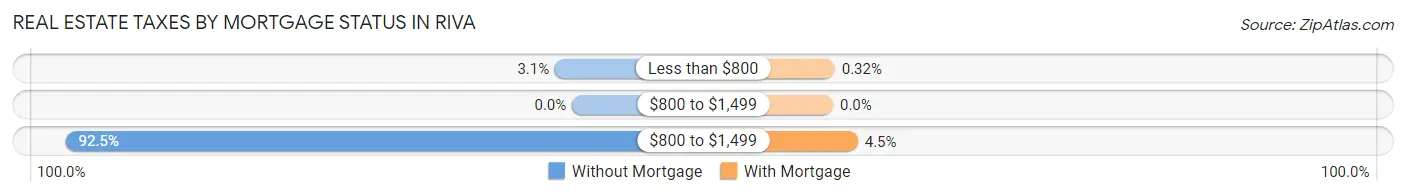
| Property Taxes | Without Mortgage | With Mortgage |
| Less than $800 | 10 (3.1%) | 4 (0.3%) |
| $800 to $1,499 | 0 (0.0%) | 0 (0.0%) |
| $800 to $1,499 | 296 (92.5%) | 56 (4.5%) |
| Total | 320 (100.0%) | 1,240 (100.0%) |
Health & Disability in Riva
Health Insurance Coverage by Age in Riva
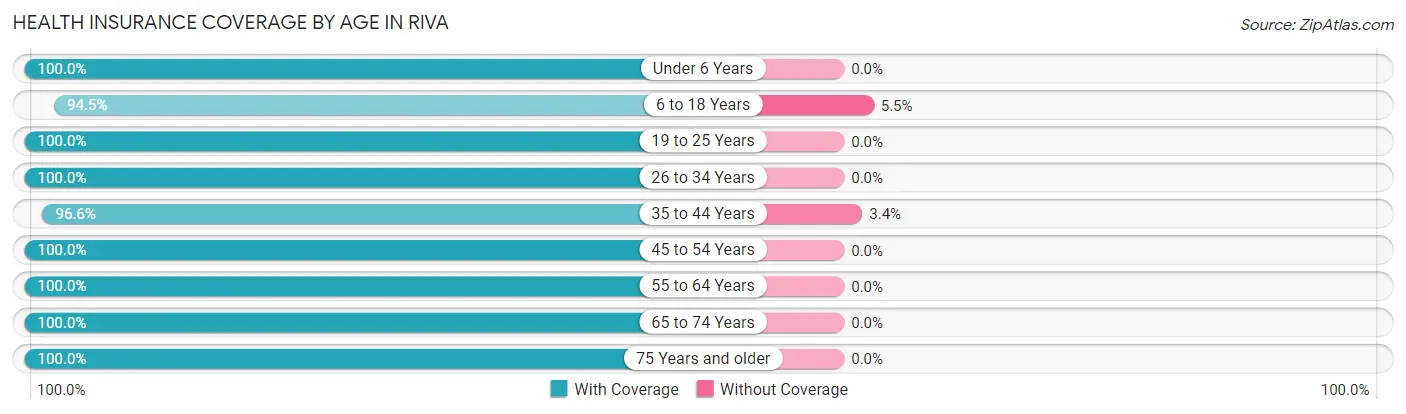
| Age Bracket | With Coverage | Without Coverage |
| Under 6 Years | 360 (100.0%) | 0 (0.0%) |
| 6 to 18 Years | 894 (94.5%) | 52 (5.5%) |
| 19 to 25 Years | 232 (100.0%) | 0 (0.0%) |
| 26 to 34 Years | 250 (100.0%) | 0 (0.0%) |
| 35 to 44 Years | 747 (96.6%) | 26 (3.4%) |
| 45 to 54 Years | 655 (100.0%) | 0 (0.0%) |
| 55 to 64 Years | 575 (100.0%) | 0 (0.0%) |
| 65 to 74 Years | 736 (100.0%) | 0 (0.0%) |
| 75 Years and older | 252 (100.0%) | 0 (0.0%) |
| Total | 4,701 (98.4%) | 78 (1.6%) |
Health Insurance Coverage by Citizenship Status in Riva
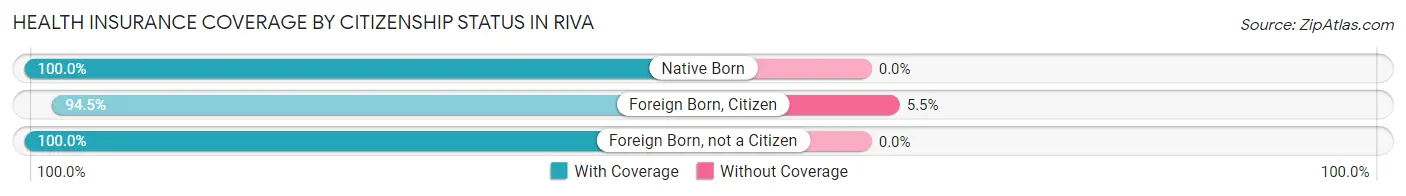
| Citizenship Status | With Coverage | Without Coverage |
| Native Born | 360 (100.0%) | 0 (0.0%) |
| Foreign Born, Citizen | 894 (94.5%) | 52 (5.5%) |
| Foreign Born, not a Citizen | 232 (100.0%) | 0 (0.0%) |
Health Insurance Coverage by Household Income in Riva
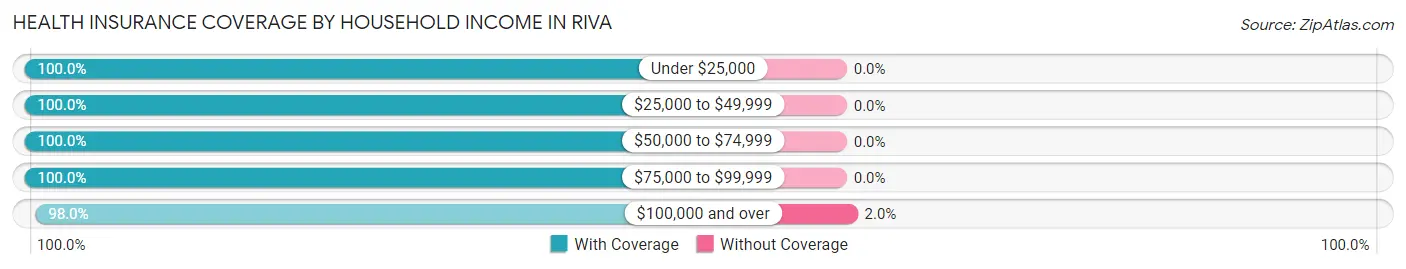
| Household Income | With Coverage | Without Coverage |
| Under $25,000 | 114 (100.0%) | 0 (0.0%) |
| $25,000 to $49,999 | 190 (100.0%) | 0 (0.0%) |
| $50,000 to $74,999 | 335 (100.0%) | 0 (0.0%) |
| $75,000 to $99,999 | 275 (100.0%) | 0 (0.0%) |
| $100,000 and over | 3,787 (98.0%) | 78 (2.0%) |
Public vs Private Health Insurance Coverage by Age in Riva
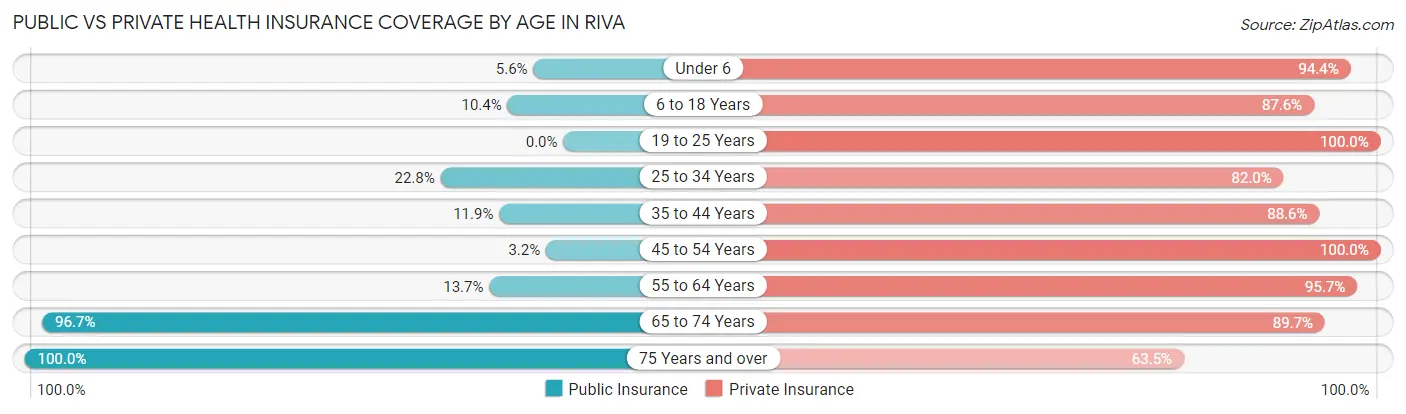
| Age Bracket | Public Insurance | Private Insurance |
| Under 6 | 20 (5.6%) | 340 (94.4%) |
| 6 to 18 Years | 98 (10.4%) | 829 (87.6%) |
| 19 to 25 Years | 0 (0.0%) | 232 (100.0%) |
| 25 to 34 Years | 57 (22.8%) | 205 (82.0%) |
| 35 to 44 Years | 92 (11.9%) | 685 (88.6%) |
| 45 to 54 Years | 21 (3.2%) | 655 (100.0%) |
| 55 to 64 Years | 79 (13.7%) | 550 (95.7%) |
| 65 to 74 Years | 712 (96.7%) | 660 (89.7%) |
| 75 Years and over | 252 (100.0%) | 160 (63.5%) |
| Total | 1,331 (27.9%) | 4,316 (90.3%) |
Disability Status by Sex by Age in Riva
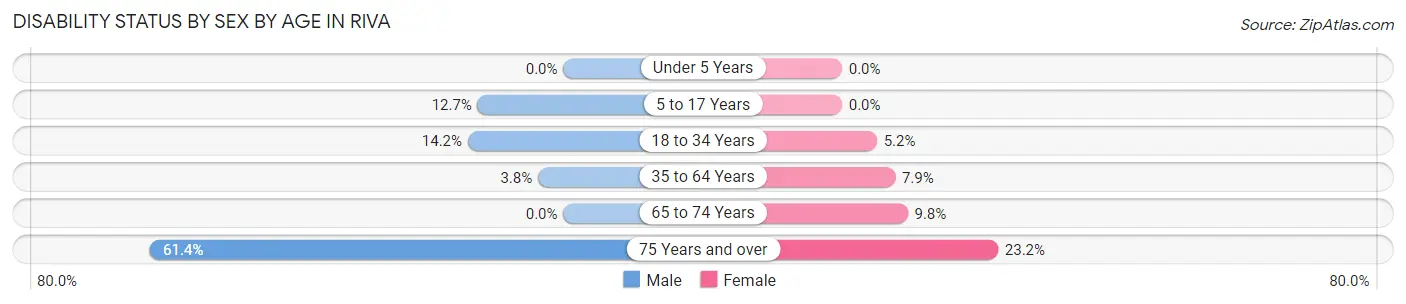
| Age Bracket | Male | Female |
| Under 5 Years | 0 (0.0%) | 0 (0.0%) |
| 5 to 17 Years | 73 (12.7%) | 0 (0.0%) |
| 18 to 34 Years | 37 (14.2%) | 14 (5.2%) |
| 35 to 64 Years | 40 (3.8%) | 74 (7.9%) |
| 65 to 74 Years | 0 (0.0%) | 41 (9.8%) |
| 75 Years and over | 54 (61.4%) | 38 (23.2%) |
Disability Class by Sex by Age in Riva
Disability Class: Hearing Difficulty
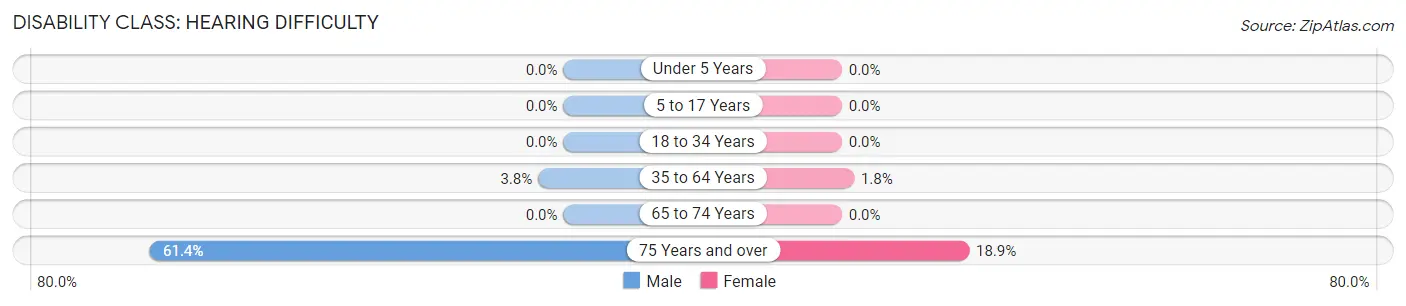
| Age Bracket | Male | Female |
| Under 5 Years | 0 (0.0%) | 0 (0.0%) |
| 5 to 17 Years | 0 (0.0%) | 0 (0.0%) |
| 18 to 34 Years | 0 (0.0%) | 0 (0.0%) |
| 35 to 64 Years | 40 (3.8%) | 17 (1.8%) |
| 65 to 74 Years | 0 (0.0%) | 0 (0.0%) |
| 75 Years and over | 54 (61.4%) | 31 (18.9%) |
Disability Class: Vision Difficulty
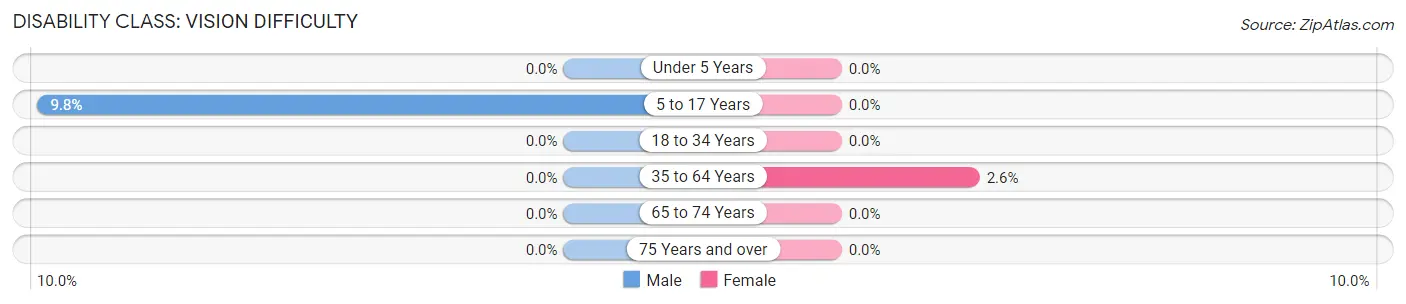
| Age Bracket | Male | Female |
| Under 5 Years | 0 (0.0%) | 0 (0.0%) |
| 5 to 17 Years | 56 (9.8%) | 0 (0.0%) |
| 18 to 34 Years | 0 (0.0%) | 0 (0.0%) |
| 35 to 64 Years | 0 (0.0%) | 24 (2.6%) |
| 65 to 74 Years | 0 (0.0%) | 0 (0.0%) |
| 75 Years and over | 0 (0.0%) | 0 (0.0%) |
Disability Class: Cognitive Difficulty
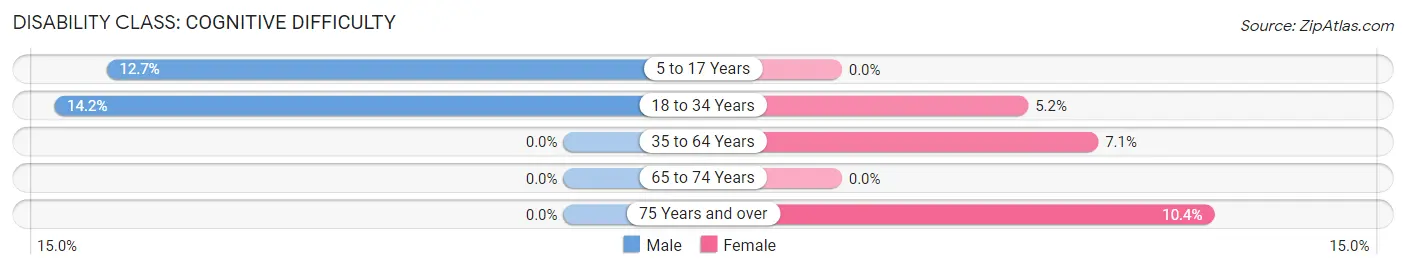
| Age Bracket | Male | Female |
| 5 to 17 Years | 73 (12.7%) | 0 (0.0%) |
| 18 to 34 Years | 37 (14.2%) | 14 (5.2%) |
| 35 to 64 Years | 0 (0.0%) | 67 (7.1%) |
| 65 to 74 Years | 0 (0.0%) | 0 (0.0%) |
| 75 Years and over | 0 (0.0%) | 17 (10.4%) |
Disability Class: Ambulatory Difficulty
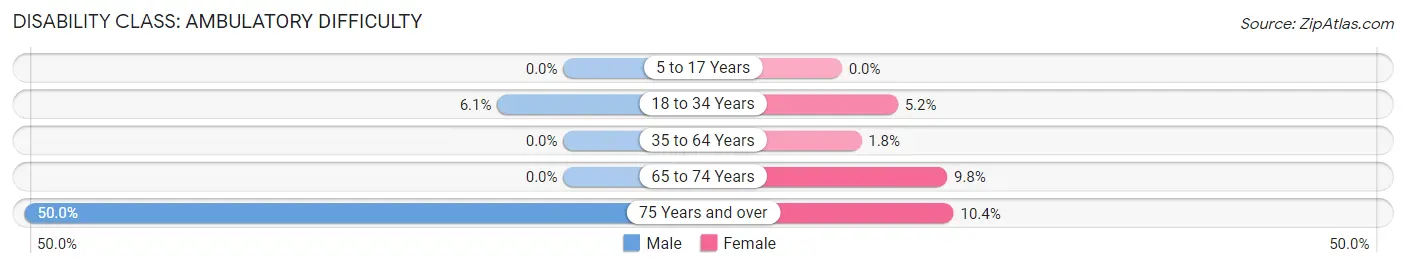
| Age Bracket | Male | Female |
| 5 to 17 Years | 0 (0.0%) | 0 (0.0%) |
| 18 to 34 Years | 16 (6.1%) | 14 (5.2%) |
| 35 to 64 Years | 0 (0.0%) | 17 (1.8%) |
| 65 to 74 Years | 0 (0.0%) | 41 (9.8%) |
| 75 Years and over | 44 (50.0%) | 17 (10.4%) |
Disability Class: Self-Care Difficulty
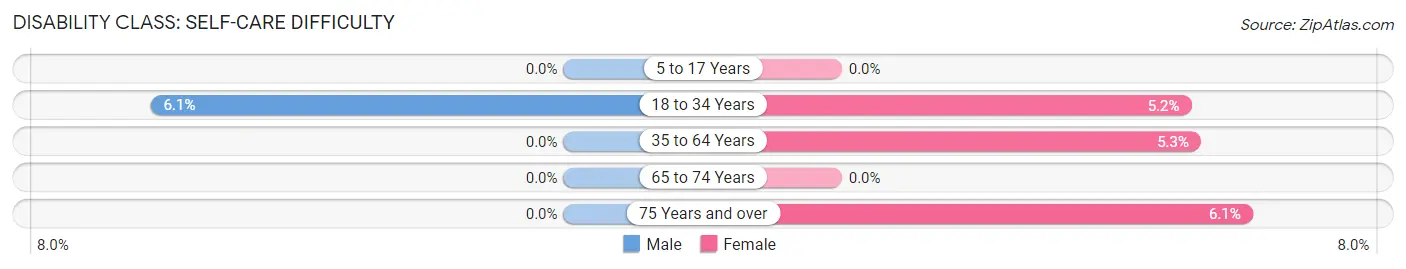
| Age Bracket | Male | Female |
| 5 to 17 Years | 0 (0.0%) | 0 (0.0%) |
| 18 to 34 Years | 16 (6.1%) | 14 (5.2%) |
| 35 to 64 Years | 0 (0.0%) | 50 (5.3%) |
| 65 to 74 Years | 0 (0.0%) | 0 (0.0%) |
| 75 Years and over | 0 (0.0%) | 10 (6.1%) |
Technology Access in Riva
Computing Device Access in Riva
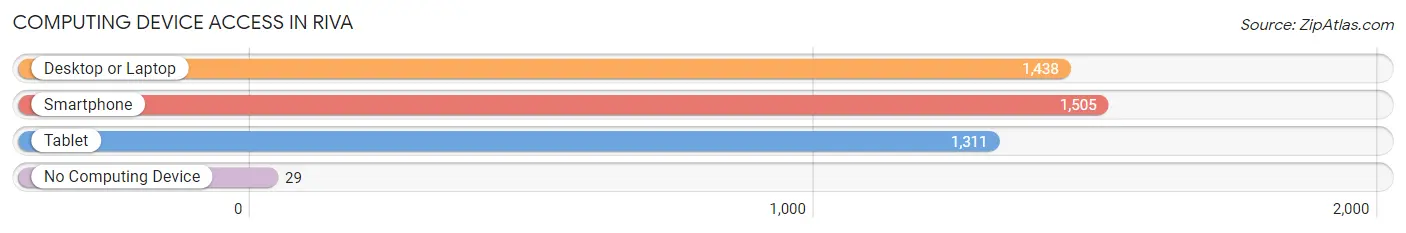
| Device Type | # Households | % Households |
| Desktop or Laptop | 1,438 | 88.5% |
| Smartphone | 1,505 | 92.6% |
| Tablet | 1,311 | 80.7% |
| No Computing Device | 29 | 1.8% |
| Total | 1,625 | 100.0% |
Internet Access in Riva
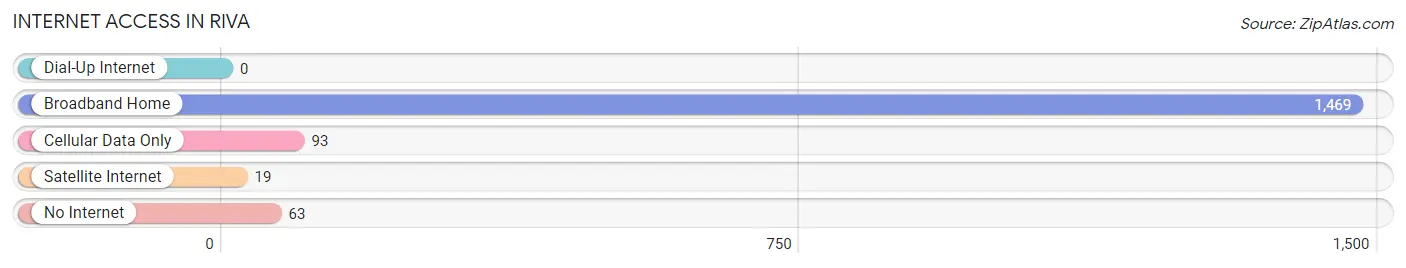
| Internet Type | # Households | % Households |
| Dial-Up Internet | 0 | 0.0% |
| Broadband Home | 1,469 | 90.4% |
| Cellular Data Only | 93 | 5.7% |
| Satellite Internet | 19 | 1.2% |
| No Internet | 63 | 3.9% |
| Total | 1,625 | 100.0% |
Riva Summary
Riva is a small town located in the state of Maryland, United States. It is situated on the western shore of the Chesapeake Bay, about 25 miles south of Annapolis. The town has a population of approximately 1,500 people and covers an area of 1.2 square miles.
History
Riva was first settled in the early 1700s by English settlers. The town was originally known as “Riverside” and was part of Anne Arundel County. In 1868, the town was officially incorporated as “Riva”. The name is derived from the Latin word for “river”.
In the late 1800s, Riva was a popular summer resort destination for wealthy families from Baltimore and Washington, D.C. The town was known for its beautiful beaches and luxurious hotels.
In the early 1900s, the town began to decline in popularity as a resort destination. However, it remained a popular fishing and crabbing destination.
In the 1950s, the town began to experience a resurgence in popularity as a residential community. Many of the old hotels were converted into apartments and condominiums.
Geography
Riva is located on the western shore of the Chesapeake Bay, about 25 miles south of Annapolis. The town is situated on a peninsula, with the Chesapeake Bay to the east and the South River to the west.
The town is bordered by the towns of Edgewater and Mayo to the north, and by the towns of Davidsonville and Harwood to the south.
The town has a total area of 1.2 square miles, all of which is land. The terrain is mostly flat, with some rolling hills.
Economy
Riva’s economy is largely based on tourism and recreation. The town is home to several marinas, which attract visitors from all over the region. The town also has several restaurants, bars, and shops.
The town is also home to several small businesses, including a boat repair shop, a bait and tackle shop, and a seafood market.
Demographics
As of the 2010 census, the population of Riva was 1,500. The racial makeup of the town was 94.7% White, 1.7% African American, 0.7% Native American, 0.7% Asian, 0.3% from other races, and 2.7% from two or more races. Hispanic or Latino of any race were 1.3% of the population.
The median income for a household in the town was $60,000, and the median income for a family was $68,000. The per capita income for the town was $27,000. About 4.7% of families and 6.3% of the population were below the poverty line, including 8.3% of those under age 18 and none of those age 65 or over.
Common Questions
What is Per Capita Income in Riva?
Per Capita income in Riva is $66,543.
What is the Median Family Income in Riva?
Median Family Income in Riva is $154,297.
What is the Median Household income in Riva?
Median Household Income in Riva is $145,601.
What is Income or Wage Gap in Riva?
Income or Wage Gap in Riva is 35.5%.
Women in Riva earn 64.5 cents for every dollar earned by a man.
What is Inequality or Gini Index in Riva?
Inequality or Gini Index in Riva is 0.38.
What is the Total Population of Riva?
Total Population of Riva is 4,784.
What is the Total Male Population of Riva?
Total Male Population of Riva is 2,493.
What is the Total Female Population of Riva?
Total Female Population of Riva is 2,291.
What is the Ratio of Males per 100 Females in Riva?
There are 108.82 Males per 100 Females in Riva.
What is the Ratio of Females per 100 Males in Riva?
There are 91.90 Females per 100 Males in Riva.
What is the Median Population Age in Riva?
Median Population Age in Riva is 42.4 Years.
What is the Average Family Size in Riva
Average Family Size in Riva is 3.2 People.
What is the Average Household Size in Riva
Average Household Size in Riva is 2.9 People.
How Large is the Labor Force in Riva?
There are 2,276 People in the Labor Forcein in Riva.
What is the Percentage of People in the Labor Force in Riva?
63.0% of People are in the Labor Force in Riva.
What is the Unemployment Rate in Riva?
Unemployment Rate in Riva is 3.3%.