Parole, MD Map & Demographics
Parole Map
Parole Overview
$89,110
PER CAPITA INCOME
$156,019
AVG FAMILY INCOME
$117,646
AVG HOUSEHOLD INCOME
29.8%
WAGE / INCOME GAP [ % ]
70.2¢/ $1
WAGE / INCOME GAP [ $ ]
0.47
INEQUALITY / GINI INDEX
18,527
TOTAL POPULATION
8,507
MALE POPULATION
10,020
FEMALE POPULATION
84.90
MALES / 100 FEMALES
117.79
FEMALES / 100 MALES
53.2
MEDIAN AGE
2.5
AVG FAMILY SIZE
1.8
AVG HOUSEHOLD SIZE
9,976
LABOR FORCE [ PEOPLE ]
59.2%
PERCENT IN LABOR FORCE
3.0%
UNEMPLOYMENT RATE
Income in Parole
Income Overview in Parole
Per Capita Income in Parole is $89,110, while median incomes of families and households are $156,019 and $117,646 respectively.
| Characteristic | Number | Measure |
| Per Capita Income | 18,527 | $89,110 |
| Median Family Income | 4,435 | $156,019 |
| Mean Family Income | 4,435 | $221,509 |
| Median Household Income | 9,704 | $117,646 |
| Mean Household Income | 9,704 | $170,076 |
| Income Deficit | 4,435 | $0 |
| Wage / Income Gap (%) | 18,527 | 29.80% |
| Wage / Income Gap ($) | 18,527 | 70.20¢ per $1 |
| Gini / Inequality Index | 18,527 | 0.47 |
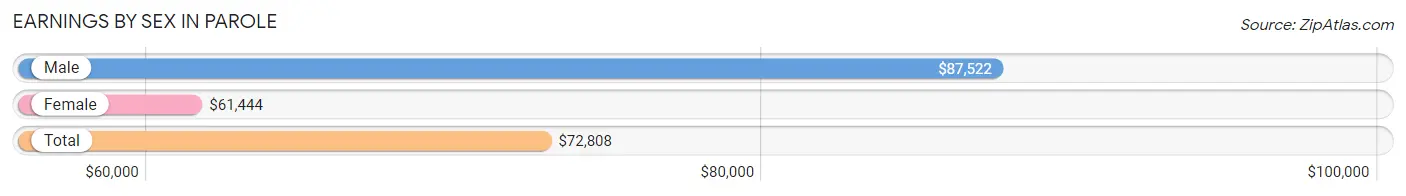
Earnings by Sex in Parole
Average Earnings in Parole are $72,808, $87,522 for men and $61,444 for women, a difference of 29.8%.
| Sex | Number | Average Earnings |
| Male | 5,431 (52.3%) | $87,522 |
| Female | 4,956 (47.7%) | $61,444 |
| Total | 10,387 (100.0%) | $72,808 |
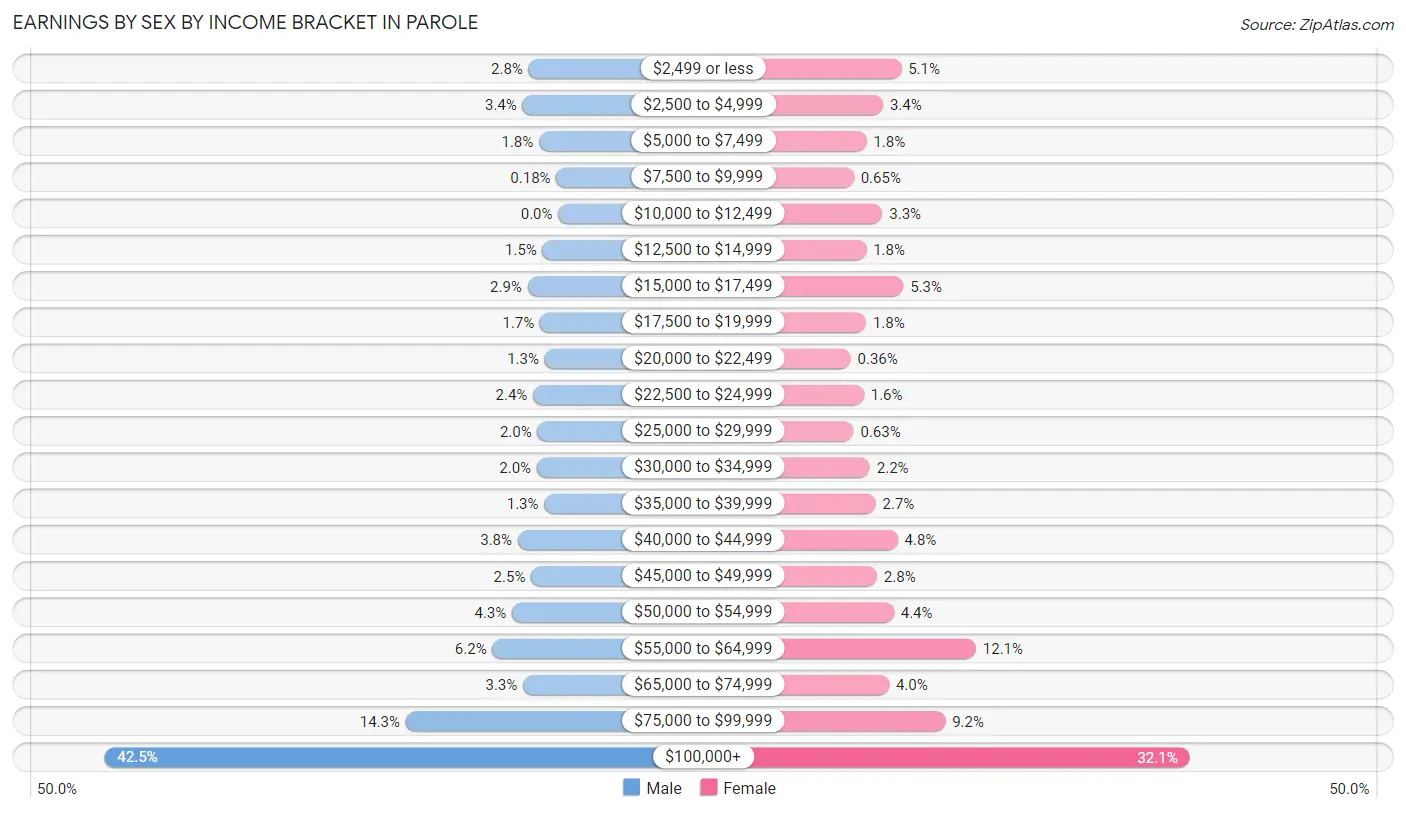
Earnings by Sex by Income Bracket in Parole
The most common earnings brackets in Parole are $100,000+ for men (2,309 | 42.5%) and $100,000+ for women (1,591 | 32.1%).
| Income | Male | Female |
| $2,499 or less | 151 (2.8%) | 253 (5.1%) |
| $2,500 to $4,999 | 182 (3.4%) | 168 (3.4%) |
| $5,000 to $7,499 | 98 (1.8%) | 91 (1.8%) |
| $7,500 to $9,999 | 10 (0.2%) | 32 (0.6%) |
| $10,000 to $12,499 | 0 (0.0%) | 165 (3.3%) |
| $12,500 to $14,999 | 80 (1.5%) | 90 (1.8%) |
| $15,000 to $17,499 | 156 (2.9%) | 262 (5.3%) |
| $17,500 to $19,999 | 93 (1.7%) | 89 (1.8%) |
| $20,000 to $22,499 | 69 (1.3%) | 18 (0.4%) |
| $22,500 to $24,999 | 128 (2.4%) | 79 (1.6%) |
| $25,000 to $29,999 | 106 (1.9%) | 31 (0.6%) |
| $30,000 to $34,999 | 109 (2.0%) | 107 (2.2%) |
| $35,000 to $39,999 | 71 (1.3%) | 134 (2.7%) |
| $40,000 to $44,999 | 206 (3.8%) | 236 (4.8%) |
| $45,000 to $49,999 | 138 (2.5%) | 140 (2.8%) |
| $50,000 to $54,999 | 235 (4.3%) | 218 (4.4%) |
| $55,000 to $64,999 | 335 (6.2%) | 599 (12.1%) |
| $65,000 to $74,999 | 179 (3.3%) | 196 (4.0%) |
| $75,000 to $99,999 | 776 (14.3%) | 457 (9.2%) |
| $100,000+ | 2,309 (42.5%) | 1,591 (32.1%) |
| Total | 5,431 (100.0%) | 4,956 (100.0%) |
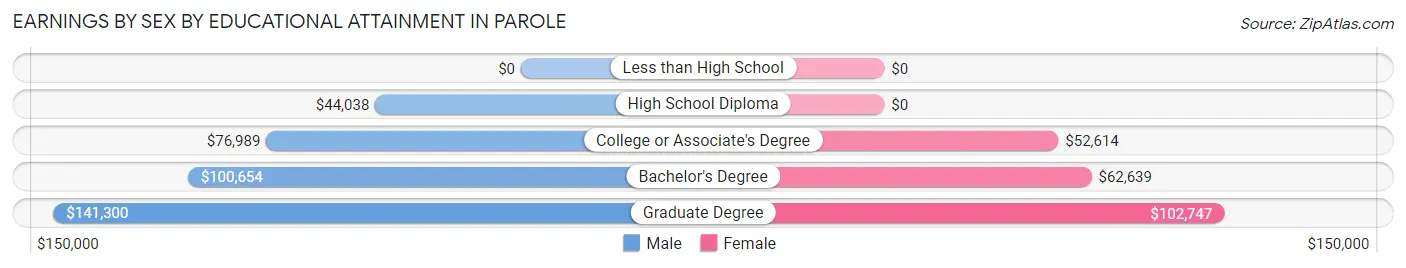
Earnings by Sex by Educational Attainment in Parole
Average earnings in Parole are $97,055 for men and $63,794 for women, a difference of 34.3%. Men with an educational attainment of graduate degree enjoy the highest average annual earnings of $141,300, while those with high school diploma education earn the least with $44,038. Women with an educational attainment of graduate degree earn the most with the average annual earnings of $102,747, while those with college or associate's degree education have the smallest earnings of $52,614.
| Educational Attainment | Male Income | Female Income |
| Less than High School | - | - |
| High School Diploma | $44,038 | $0 |
| College or Associate's Degree | $76,989 | $52,614 |
| Bachelor's Degree | $100,654 | $62,639 |
| Graduate Degree | $141,300 | $102,747 |
| Total | $97,055 | $63,794 |
Family Income in Parole
Family Income Brackets in Parole
According to the Parole family income data, there are 1,539 families falling into the $200,000+ income range, which is the most common income bracket and makes up 34.7% of all families.
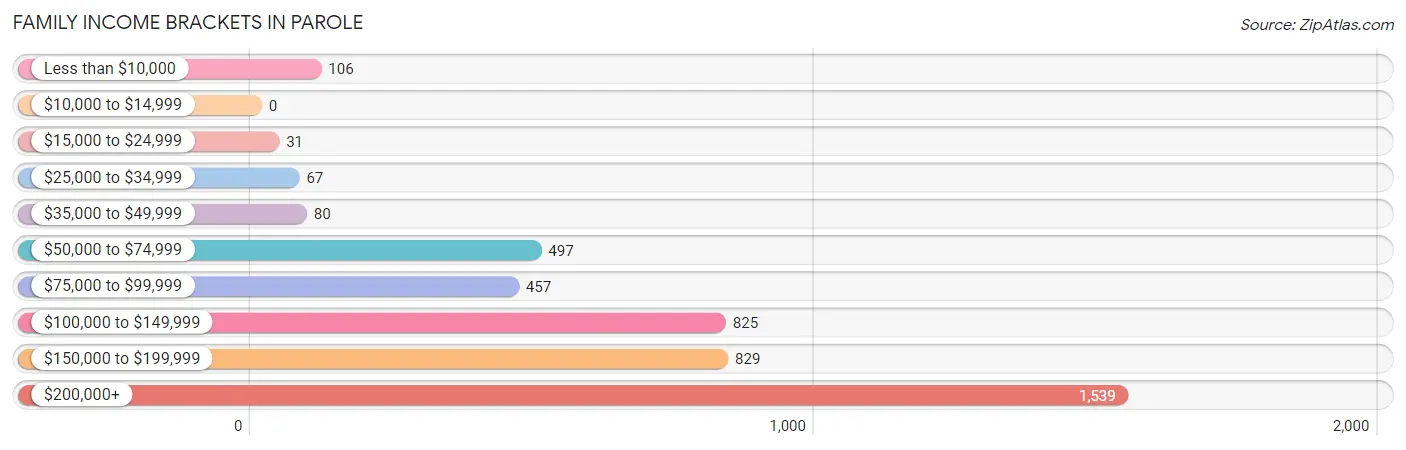
| Income Bracket | # Families | % Families |
| Less than $10,000 | 106 | 2.4% |
| $10,000 to $14,999 | 0 | 0.0% |
| $15,000 to $24,999 | 31 | 0.7% |
| $25,000 to $34,999 | 67 | 1.5% |
| $35,000 to $49,999 | 80 | 1.8% |
| $50,000 to $74,999 | 497 | 11.2% |
| $75,000 to $99,999 | 457 | 10.3% |
| $100,000 to $149,999 | 825 | 18.6% |
| $150,000 to $199,999 | 829 | 18.7% |
| $200,000+ | 1,539 | 34.7% |
Family Income by Famaliy Size in Parole
4-person families (656 | 14.8%) account for the highest median family income in Parole with $214,459 per family, while 2-person families (3,109 | 70.1%) have the highest median income of $70,246 per family member.
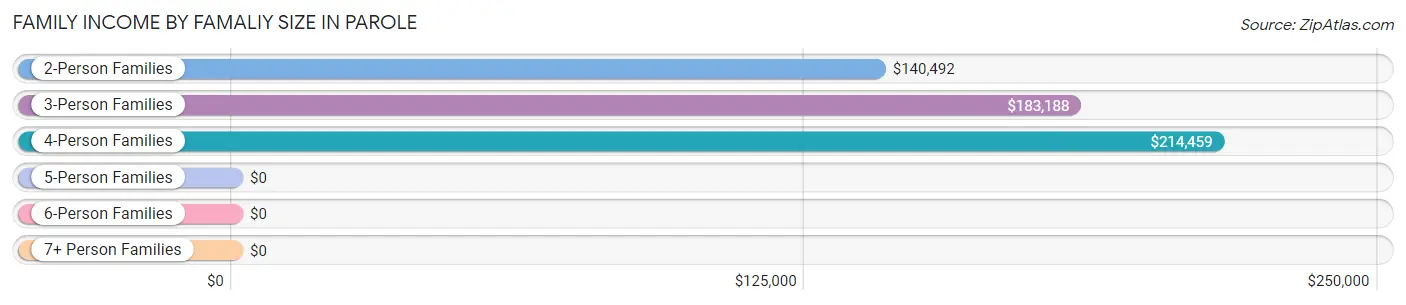
| Income Bracket | # Families | Median Income |
| 2-Person Families | 3,109 (70.1%) | $140,492 |
| 3-Person Families | 481 (10.8%) | $183,188 |
| 4-Person Families | 656 (14.8%) | $214,459 |
| 5-Person Families | 155 (3.5%) | $0 |
| 6-Person Families | 0 (0.0%) | $0 |
| 7+ Person Families | 34 (0.8%) | $0 |
| Total | 4,435 (100.0%) | $156,019 |
Family Income by Number of Earners in Parole
The median family income in Parole is $156,019, with families comprising 3+ earners (359) having the highest median family income of $250,001, while families with no earners (1,163) have the lowest median family income of $101,992, accounting for 8.1% and 26.2% of families, respectively.
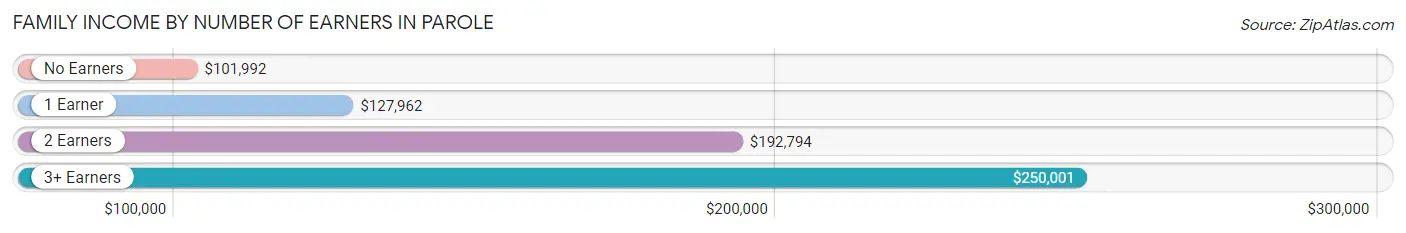
| Number of Earners | # Families | Median Income |
| No Earners | 1,163 (26.2%) | $101,992 |
| 1 Earner | 1,119 (25.2%) | $127,962 |
| 2 Earners | 1,794 (40.5%) | $192,794 |
| 3+ Earners | 359 (8.1%) | $250,001 |
| Total | 4,435 (100.0%) | $156,019 |
Household Income in Parole
Household Income Brackets in Parole
With 2,164 households falling in the category, the $200,000+ income range is the most frequent in Parole, accounting for 22.3% of all households. In contrast, only 49 households (0.5%) fall into the $10,000 to $14,999 income bracket, making it the least populous group.
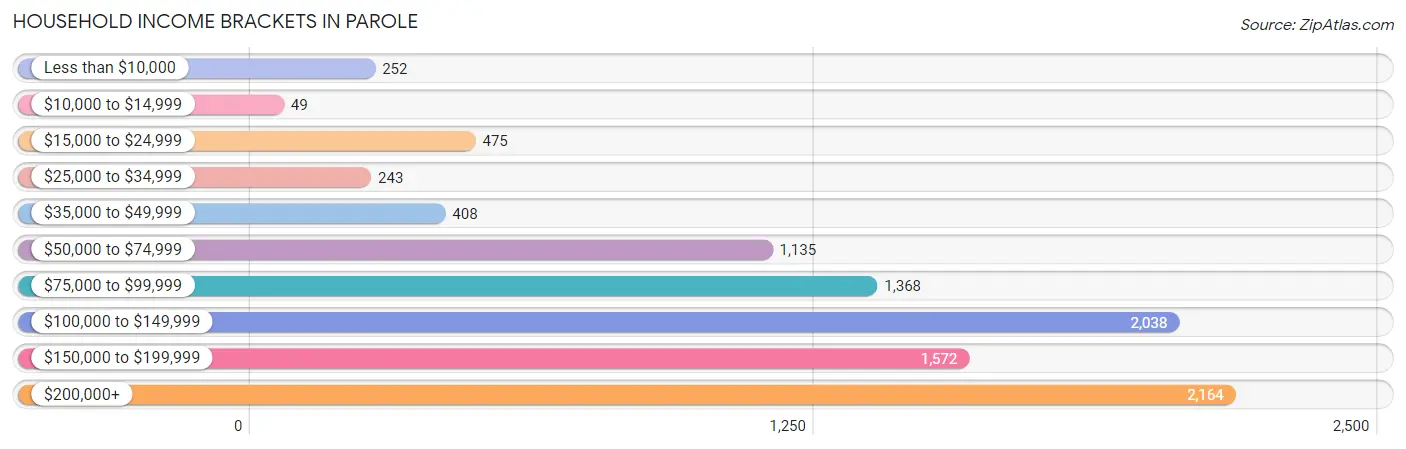
| Income Bracket | # Households | % Households |
| Less than $10,000 | 252 | 2.6% |
| $10,000 to $14,999 | 49 | 0.5% |
| $15,000 to $24,999 | 475 | 4.9% |
| $25,000 to $34,999 | 243 | 2.5% |
| $35,000 to $49,999 | 408 | 4.2% |
| $50,000 to $74,999 | 1,135 | 11.7% |
| $75,000 to $99,999 | 1,368 | 14.1% |
| $100,000 to $149,999 | 2,038 | 21.0% |
| $150,000 to $199,999 | 1,572 | 16.2% |
| $200,000+ | 2,164 | 22.3% |
Household Income by Householder Age in Parole
The median household income in Parole is $117,646, with the highest median household income of $169,973 found in the 45 to 64 years age bracket for the primary householder. A total of 2,871 households (29.6%) fall into this category. Meanwhile, the 15 to 24 years age bracket for the primary householder has the lowest median household income of $86,429, with 160 households (1.7%) in this group.
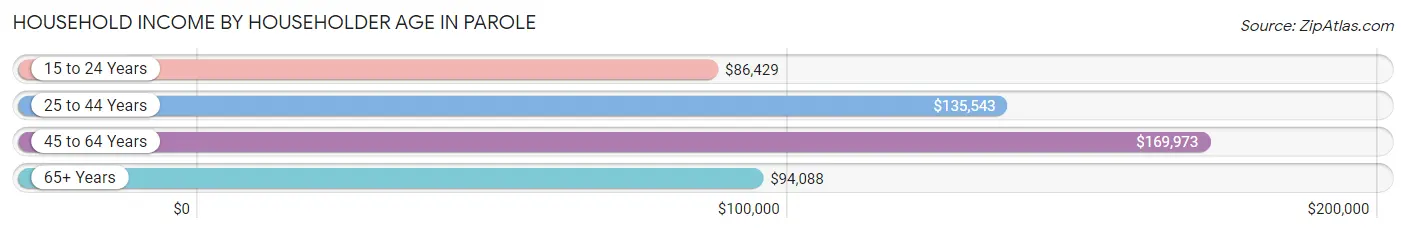
| Income Bracket | # Households | Median Income |
| 15 to 24 Years | 160 (1.7%) | $86,429 |
| 25 to 44 Years | 2,448 (25.2%) | $135,543 |
| 45 to 64 Years | 2,871 (29.6%) | $169,973 |
| 65+ Years | 4,225 (43.5%) | $94,088 |
| Total | 9,704 (100.0%) | $117,646 |
Poverty in Parole
Income Below Poverty by Sex and Age in Parole
With 4.3% poverty level for males and 6.7% for females among the residents of Parole, 6 to 11 year old males and under 5 year old females are the most vulnerable to poverty, with 96 males (28.3%) and 106 females (37.3%) in their respective age groups living below the poverty level.
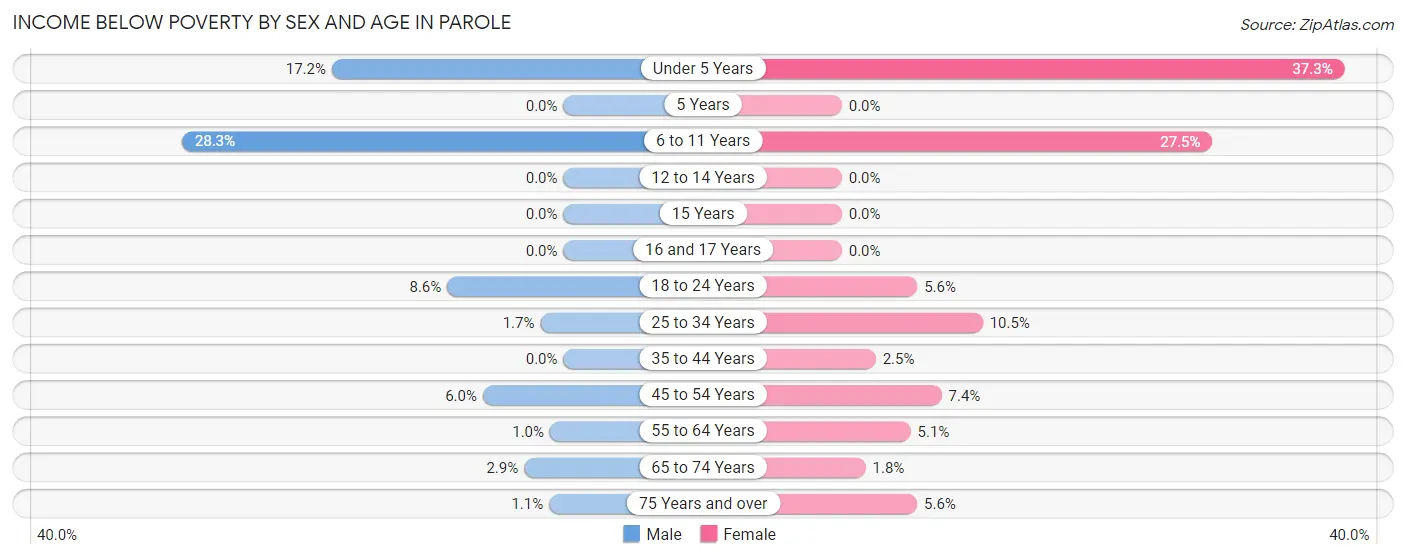
| Age Bracket | Male | Female |
| Under 5 Years | 44 (17.2%) | 106 (37.3%) |
| 5 Years | 0 (0.0%) | 0 (0.0%) |
| 6 to 11 Years | 96 (28.3%) | 96 (27.5%) |
| 12 to 14 Years | 0 (0.0%) | 0 (0.0%) |
| 15 Years | 0 (0.0%) | 0 (0.0%) |
| 16 and 17 Years | 0 (0.0%) | 0 (0.0%) |
| 18 to 24 Years | 54 (8.6%) | 21 (5.6%) |
| 25 to 34 Years | 21 (1.7%) | 115 (10.5%) |
| 35 to 44 Years | 0 (0.0%) | 28 (2.5%) |
| 45 to 54 Years | 79 (6.0%) | 74 (7.4%) |
| 55 to 64 Years | 10 (1.0%) | 77 (5.1%) |
| 65 to 74 Years | 32 (2.9%) | 30 (1.8%) |
| 75 Years and over | 13 (1.1%) | 109 (5.6%) |
| Total | 349 (4.3%) | 656 (6.7%) |
Income Above Poverty by Sex and Age in Parole
According to the poverty statistics in Parole, males aged 5 years and females aged 5 years are the age groups that are most secure financially, with 100.0% of males and 100.0% of females in these age groups living above the poverty line.
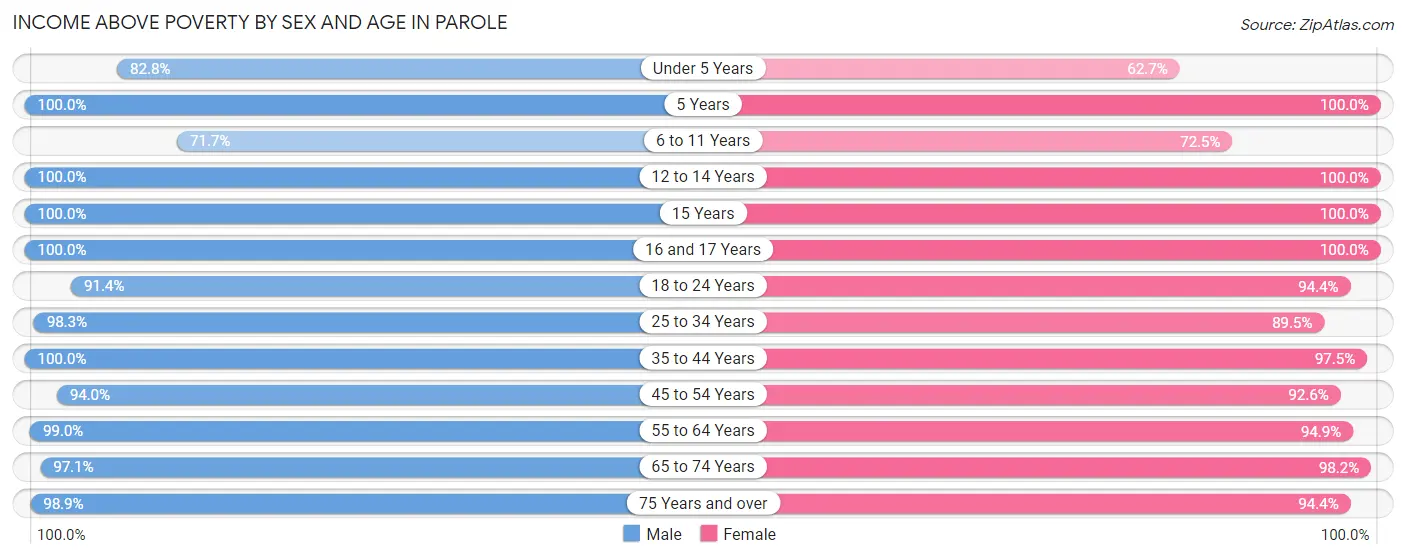
| Age Bracket | Male | Female |
| Under 5 Years | 212 (82.8%) | 178 (62.7%) |
| 5 Years | 13 (100.0%) | 68 (100.0%) |
| 6 to 11 Years | 243 (71.7%) | 253 (72.5%) |
| 12 to 14 Years | 94 (100.0%) | 180 (100.0%) |
| 15 Years | 8 (100.0%) | 67 (100.0%) |
| 16 and 17 Years | 100 (100.0%) | 142 (100.0%) |
| 18 to 24 Years | 572 (91.4%) | 354 (94.4%) |
| 25 to 34 Years | 1,210 (98.3%) | 984 (89.5%) |
| 35 to 44 Years | 758 (100.0%) | 1,084 (97.5%) |
| 45 to 54 Years | 1,243 (94.0%) | 924 (92.6%) |
| 55 to 64 Years | 988 (99.0%) | 1,430 (94.9%) |
| 65 to 74 Years | 1,064 (97.1%) | 1,662 (98.2%) |
| 75 Years and over | 1,209 (98.9%) | 1,840 (94.4%) |
| Total | 7,714 (95.7%) | 9,166 (93.3%) |
Income Below Poverty Among Married-Couple Families in Parole
The poverty statistics for married-couple families in Parole show that 2.2% or 86 of the total 3,960 families live below the poverty line. Families with 1 or 2 children have the highest poverty rate of 8.0%, comprising of 73 families. On the other hand, families with 3 or 4 children have the lowest poverty rate of 0.0%, which includes 0 families.
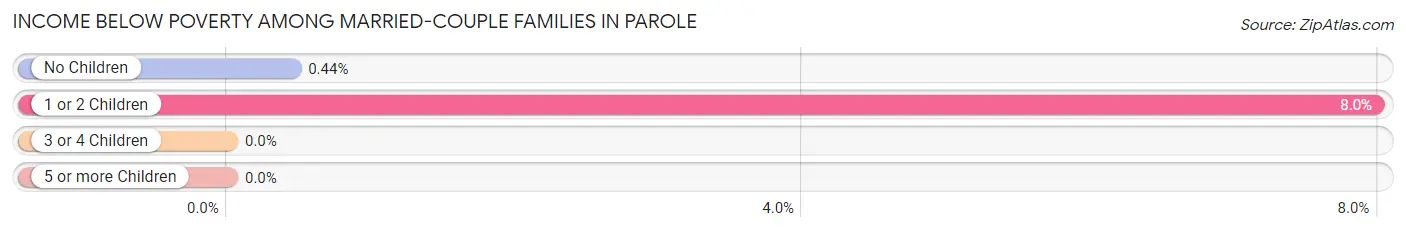
| Children | Above Poverty | Below Poverty |
| No Children | 2,966 (99.6%) | 13 (0.4%) |
| 1 or 2 Children | 842 (92.0%) | 73 (8.0%) |
| 3 or 4 Children | 66 (100.0%) | 0 (0.0%) |
| 5 or more Children | 0 (0.0%) | 0 (0.0%) |
| Total | 3,874 (97.8%) | 86 (2.2%) |
Income Below Poverty Among Single-Parent Households in Parole
According to the poverty data in Parole, 20.3% or 25 single-father households and 20.4% or 72 single-mother households are living below the poverty line. Among single-father households, those with 1 or 2 children have the highest poverty rate, with 16 households (59.3%) experiencing poverty. Likewise, among single-mother households, those with 3 or 4 children have the highest poverty rate, with 72 households (100.0%) falling below the poverty line.
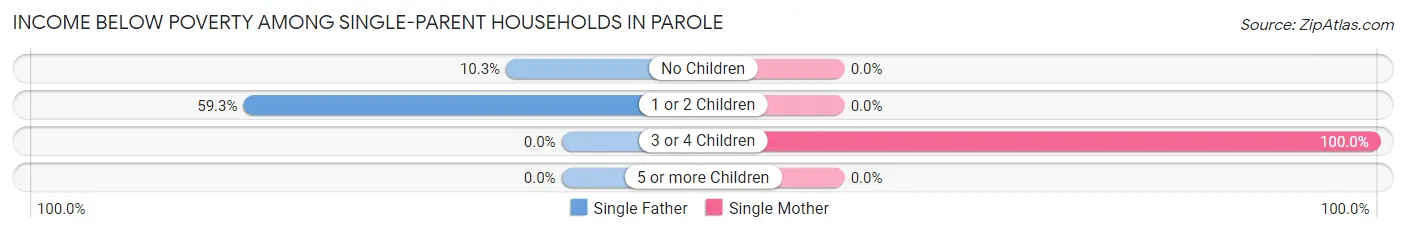
| Children | Single Father | Single Mother |
| No Children | 9 (10.3%) | 0 (0.0%) |
| 1 or 2 Children | 16 (59.3%) | 0 (0.0%) |
| 3 or 4 Children | 0 (0.0%) | 72 (100.0%) |
| 5 or more Children | 0 (0.0%) | 0 (0.0%) |
| Total | 25 (20.3%) | 72 (20.4%) |
Income Below Poverty Among Married-Couple vs Single-Parent Households in Parole
The poverty data for Parole shows that 86 of the married-couple family households (2.2%) and 97 of the single-parent households (20.4%) are living below the poverty level. Within the married-couple family households, those with 1 or 2 children have the highest poverty rate, with 73 households (8.0%) falling below the poverty line. Among the single-parent households, those with 3 or 4 children have the highest poverty rate, with 72 household (88.9%) living below poverty.
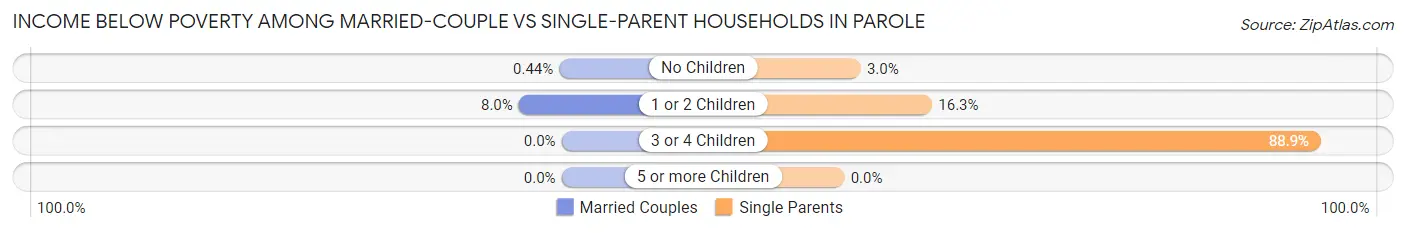
| Children | Married-Couple Families | Single-Parent Households |
| No Children | 13 (0.4%) | 9 (3.0%) |
| 1 or 2 Children | 73 (8.0%) | 16 (16.3%) |
| 3 or 4 Children | 0 (0.0%) | 72 (88.9%) |
| 5 or more Children | 0 (0.0%) | 0 (0.0%) |
| Total | 86 (2.2%) | 97 (20.4%) |
Race in Parole
The most populous races in Parole are White / Caucasian (15,745 | 85.0%), Black / African American (1,142 | 6.2%), and Hispanic or Latino (874 | 4.7%).
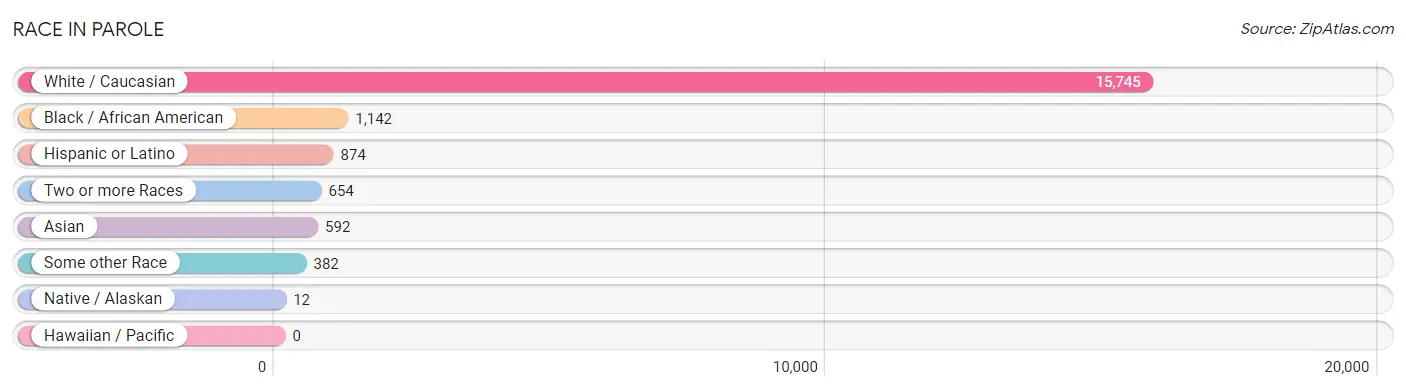
| Race | # Population | % Population |
| Asian | 592 | 3.2% |
| Black / African American | 1,142 | 6.2% |
| Hawaiian / Pacific | 0 | 0.0% |
| Hispanic or Latino | 874 | 4.7% |
| Native / Alaskan | 12 | 0.1% |
| White / Caucasian | 15,745 | 85.0% |
| Two or more Races | 654 | 3.5% |
| Some other Race | 382 | 2.1% |
| Total | 18,527 | 100.0% |
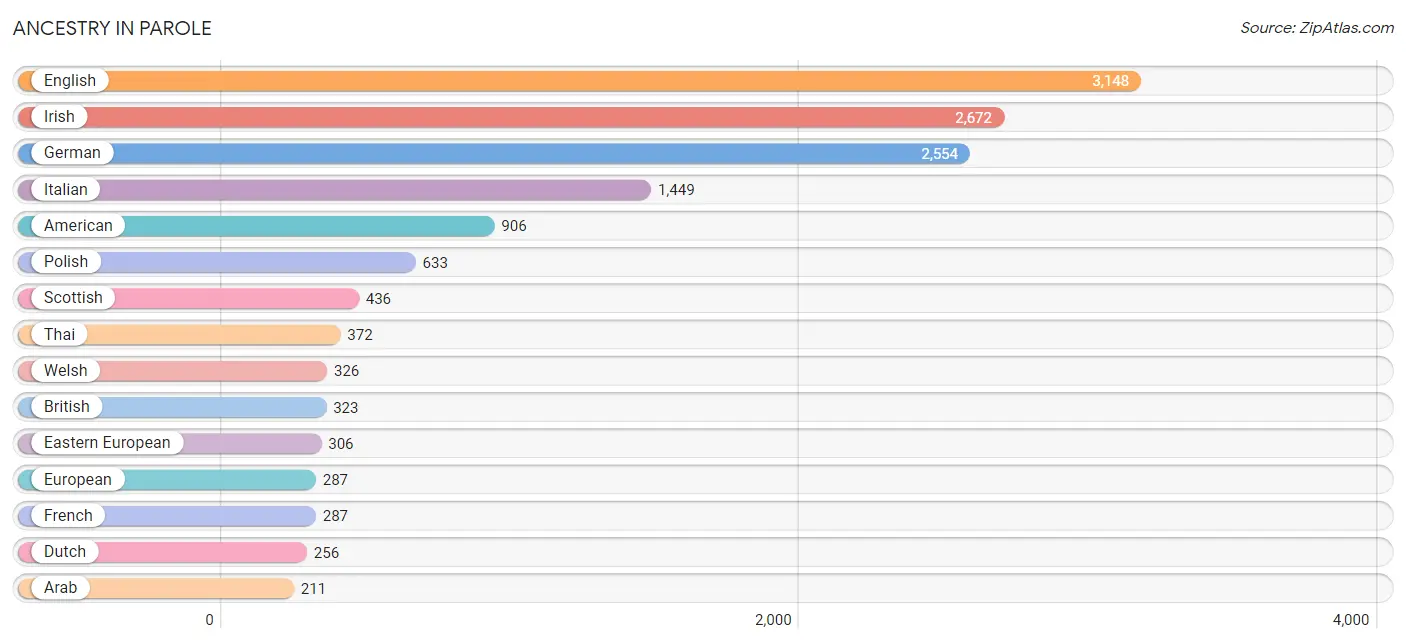
Ancestry in Parole
The most populous ancestries reported in Parole are English (3,148 | 17.0%), Irish (2,672 | 14.4%), German (2,554 | 13.8%), Italian (1,449 | 7.8%), and American (906 | 4.9%), together accounting for 57.9% of all Parole residents.
| Ancestry | # Population | % Population |
| African | 54 | 0.3% |
| American | 906 | 4.9% |
| Arab | 211 | 1.1% |
| Arapaho | 15 | 0.1% |
| Austrian | 165 | 0.9% |
| Barbadian | 7 | 0.0% |
| Basque | 16 | 0.1% |
| Bhutanese | 54 | 0.3% |
| British | 323 | 1.7% |
| Burmese | 94 | 0.5% |
| Canadian | 25 | 0.1% |
| Central American | 203 | 1.1% |
| Cherokee | 18 | 0.1% |
| Colombian | 94 | 0.5% |
| Croatian | 40 | 0.2% |
| Cuban | 23 | 0.1% |
| Czech | 99 | 0.5% |
| Czechoslovakian | 13 | 0.1% |
| Danish | 20 | 0.1% |
| Dutch | 256 | 1.4% |
| Eastern European | 306 | 1.7% |
| Ecuadorian | 24 | 0.1% |
| Egyptian | 48 | 0.3% |
| English | 3,148 | 17.0% |
| Estonian | 35 | 0.2% |
| European | 287 | 1.5% |
| Finnish | 70 | 0.4% |
| French | 287 | 1.5% |
| French Canadian | 86 | 0.5% |
| German | 2,554 | 13.8% |
| Greek | 161 | 0.9% |
| Guatemalan | 22 | 0.1% |
| Honduran | 116 | 0.6% |
| Hungarian | 165 | 0.9% |
| Indian (Asian) | 138 | 0.7% |
| Iranian | 18 | 0.1% |
| Irish | 2,672 | 14.4% |
| Israeli | 119 | 0.6% |
| Italian | 1,449 | 7.8% |
| Jamaican | 20 | 0.1% |
| Korean | 38 | 0.2% |
| Latvian | 28 | 0.2% |
| Lebanese | 60 | 0.3% |
| Lithuanian | 41 | 0.2% |
| Mexican | 77 | 0.4% |
| Nicaraguan | 39 | 0.2% |
| Northern European | 24 | 0.1% |
| Norwegian | 80 | 0.4% |
| Pakistani | 33 | 0.2% |
| Pennsylvania German | 16 | 0.1% |
| Peruvian | 33 | 0.2% |
| Polish | 633 | 3.4% |
| Puerto Rican | 144 | 0.8% |
| Romanian | 47 | 0.3% |
| Russian | 136 | 0.7% |
| Salvadoran | 26 | 0.1% |
| Scandinavian | 91 | 0.5% |
| Scotch-Irish | 172 | 0.9% |
| Scottish | 436 | 2.4% |
| Slavic | 9 | 0.1% |
| Slovak | 23 | 0.1% |
| Slovene | 8 | 0.0% |
| South African | 107 | 0.6% |
| South American | 184 | 1.0% |
| South American Indian | 7 | 0.0% |
| Spaniard | 15 | 0.1% |
| Spanish | 58 | 0.3% |
| Sri Lankan | 17 | 0.1% |
| Subsaharan African | 175 | 0.9% |
| Swedish | 181 | 1.0% |
| Swiss | 49 | 0.3% |
| Syrian | 32 | 0.2% |
| Thai | 372 | 2.0% |
| Turkish | 31 | 0.2% |
| Ukrainian | 148 | 0.8% |
| Venezuelan | 33 | 0.2% |
| Welsh | 326 | 1.8% | View All 77 Rows |
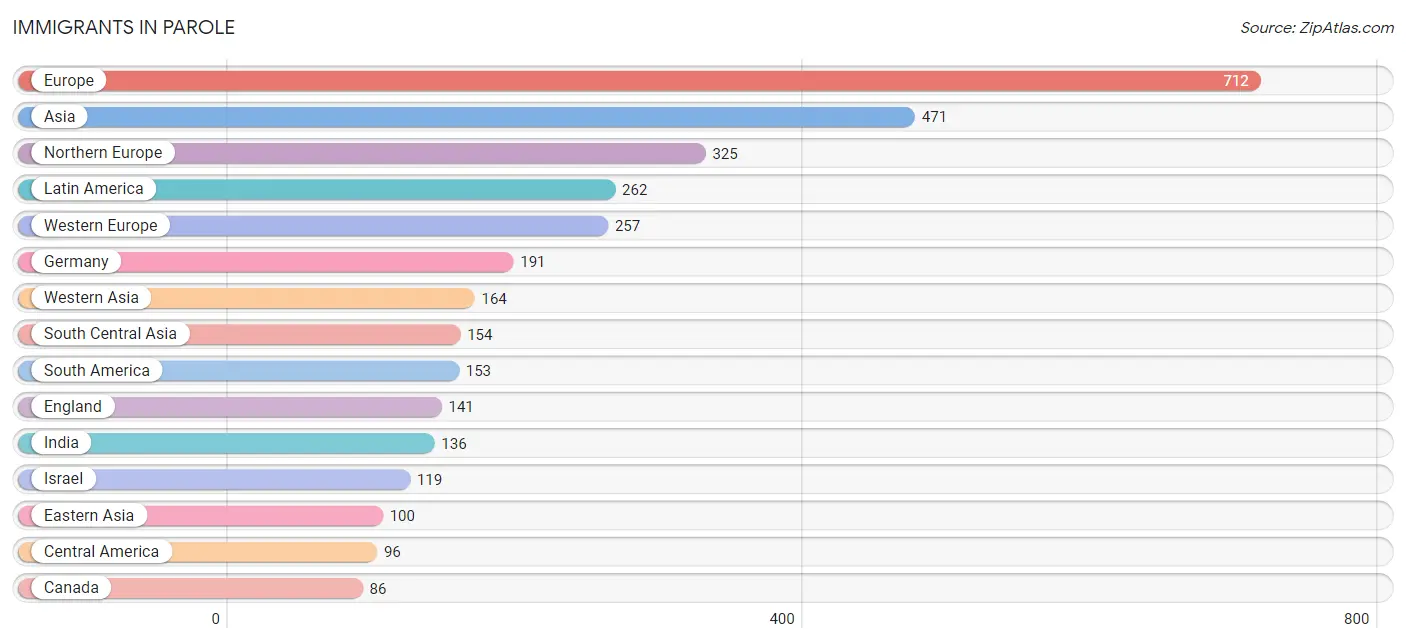
Immigrants in Parole
The most numerous immigrant groups reported in Parole came from Europe (712 | 3.8%), Asia (471 | 2.5%), Northern Europe (325 | 1.8%), Latin America (262 | 1.4%), and Western Europe (257 | 1.4%), together accounting for 10.9% of all Parole residents.
| Immigration Origin | # Population | % Population |
| Africa | 85 | 0.5% |
| Asia | 471 | 2.5% |
| Belgium | 15 | 0.1% |
| Canada | 86 | 0.5% |
| Caribbean | 13 | 0.1% |
| Central America | 96 | 0.5% |
| China | 61 | 0.3% |
| Colombia | 64 | 0.4% |
| Croatia | 14 | 0.1% |
| Eastern Africa | 8 | 0.0% |
| Eastern Asia | 100 | 0.5% |
| Eastern Europe | 79 | 0.4% |
| Egypt | 16 | 0.1% |
| El Salvador | 26 | 0.1% |
| England | 141 | 0.8% |
| Europe | 712 | 3.8% |
| France | 15 | 0.1% |
| Germany | 191 | 1.0% |
| Greece | 10 | 0.1% |
| Guyana | 21 | 0.1% |
| Honduras | 32 | 0.2% |
| Hong Kong | 29 | 0.2% |
| India | 136 | 0.7% |
| Iran | 18 | 0.1% |
| Iraq | 15 | 0.1% |
| Israel | 119 | 0.6% |
| Italy | 41 | 0.2% |
| Korea | 39 | 0.2% |
| Kuwait | 30 | 0.2% |
| Latin America | 262 | 1.4% |
| Mexico | 38 | 0.2% |
| Morocco | 10 | 0.1% |
| Netherlands | 14 | 0.1% |
| Northern Africa | 26 | 0.1% |
| Northern Europe | 325 | 1.8% |
| Oceania | 18 | 0.1% |
| Peru | 27 | 0.2% |
| Philippines | 13 | 0.1% |
| Romania | 22 | 0.1% |
| Russia | 34 | 0.2% |
| Scotland | 15 | 0.1% |
| South Africa | 51 | 0.3% |
| South America | 153 | 0.8% |
| South Central Asia | 154 | 0.8% |
| South Eastern Asia | 53 | 0.3% |
| Southern Europe | 51 | 0.3% |
| Sweden | 22 | 0.1% |
| Switzerland | 22 | 0.1% |
| Thailand | 33 | 0.2% |
| Trinidad and Tobago | 13 | 0.1% |
| Venezuela | 41 | 0.2% |
| Vietnam | 7 | 0.0% |
| Western Asia | 164 | 0.9% |
| Western Europe | 257 | 1.4% | View All 54 Rows |
Sex and Age in Parole
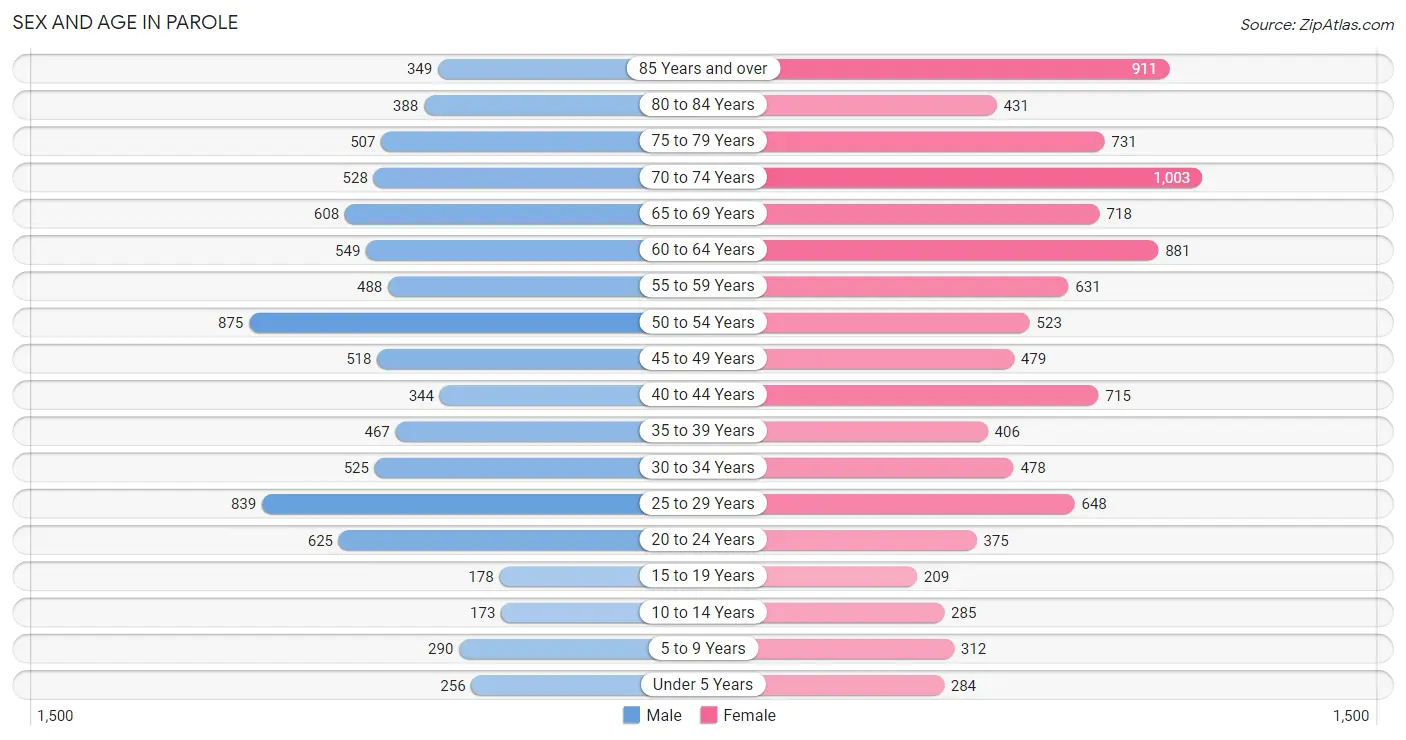
Sex and Age in Parole
The most populous age groups in Parole are 50 to 54 Years (875 | 10.3%) for men and 70 to 74 Years (1,003 | 10.0%) for women.
| Age Bracket | Male | Female |
| Under 5 Years | 256 (3.0%) | 284 (2.8%) |
| 5 to 9 Years | 290 (3.4%) | 312 (3.1%) |
| 10 to 14 Years | 173 (2.0%) | 285 (2.8%) |
| 15 to 19 Years | 178 (2.1%) | 209 (2.1%) |
| 20 to 24 Years | 625 (7.3%) | 375 (3.7%) |
| 25 to 29 Years | 839 (9.9%) | 648 (6.5%) |
| 30 to 34 Years | 525 (6.2%) | 478 (4.8%) |
| 35 to 39 Years | 467 (5.5%) | 406 (4.1%) |
| 40 to 44 Years | 344 (4.0%) | 715 (7.1%) |
| 45 to 49 Years | 518 (6.1%) | 479 (4.8%) |
| 50 to 54 Years | 875 (10.3%) | 523 (5.2%) |
| 55 to 59 Years | 488 (5.7%) | 631 (6.3%) |
| 60 to 64 Years | 549 (6.5%) | 881 (8.8%) |
| 65 to 69 Years | 608 (7.1%) | 718 (7.2%) |
| 70 to 74 Years | 528 (6.2%) | 1,003 (10.0%) |
| 75 to 79 Years | 507 (6.0%) | 731 (7.3%) |
| 80 to 84 Years | 388 (4.6%) | 431 (4.3%) |
| 85 Years and over | 349 (4.1%) | 911 (9.1%) |
| Total | 8,507 (100.0%) | 10,020 (100.0%) |
Families and Households in Parole
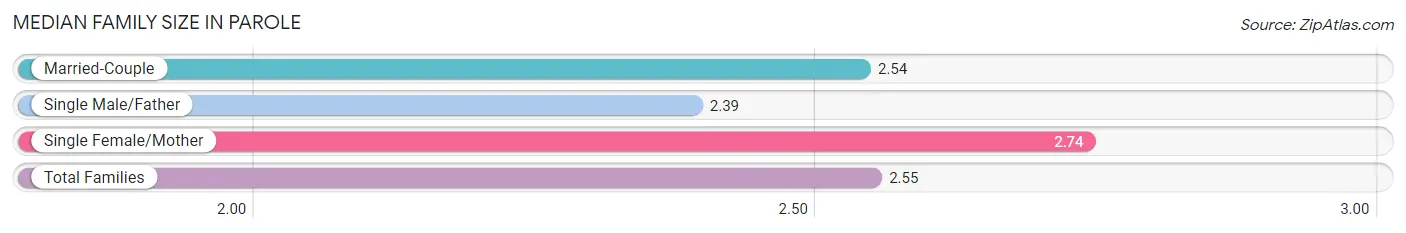
Median Family Size in Parole
The median family size in Parole is 2.55 persons per family, with single female/mother families (352 | 7.9%) accounting for the largest median family size of 2.74 persons per family. On the other hand, single male/father families (123 | 2.8%) represent the smallest median family size with 2.39 persons per family.
| Family Type | # Families | Family Size |
| Married-Couple | 3,960 (89.3%) | 2.54 |
| Single Male/Father | 123 (2.8%) | 2.39 |
| Single Female/Mother | 352 (7.9%) | 2.74 |
| Total Families | 4,435 (100.0%) | 2.55 |
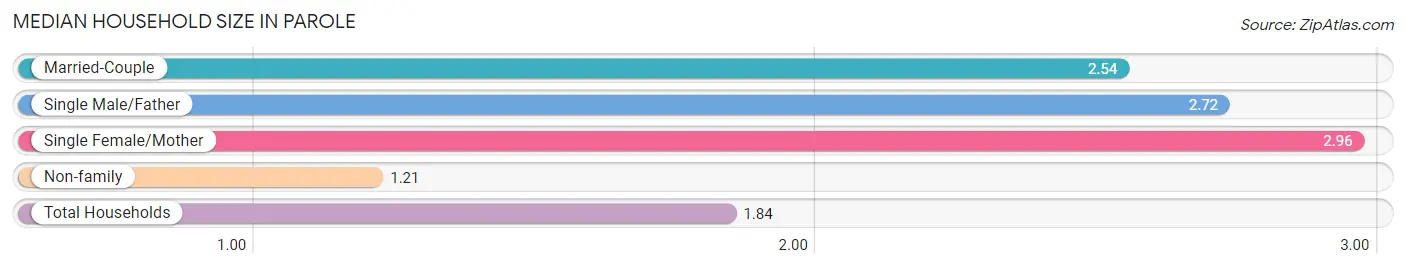
Median Household Size in Parole
The median household size in Parole is 1.84 persons per household, with single female/mother households (352 | 3.6%) accounting for the largest median household size of 2.96 persons per household. non-family households (5,269 | 54.3%) represent the smallest median household size with 1.21 persons per household.
| Household Type | # Households | Household Size |
| Married-Couple | 3,960 (40.8%) | 2.54 |
| Single Male/Father | 123 (1.3%) | 2.72 |
| Single Female/Mother | 352 (3.6%) | 2.96 |
| Non-family | 5,269 (54.3%) | 1.21 |
| Total Households | 9,704 (100.0%) | 1.84 |
Household Size by Marriage Status in Parole
Out of a total of 9,704 households in Parole, 4,435 (45.7%) are family households, while 5,269 (54.3%) are nonfamily households. The most numerous type of family households are 2-person households, comprising 3,078, and the most common type of nonfamily households are 1-person households, comprising 4,421.
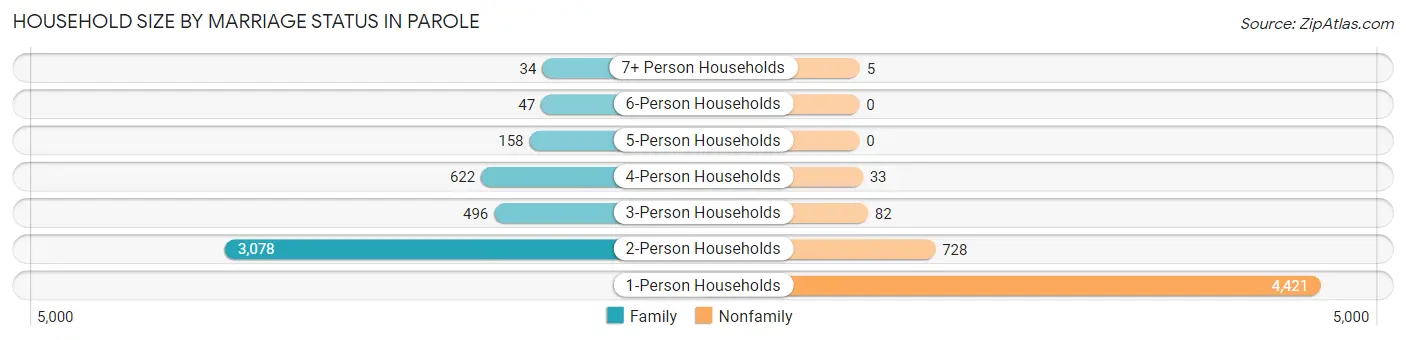
| Household Size | Family Households | Nonfamily Households |
| 1-Person Households | - | 4,421 (45.6%) |
| 2-Person Households | 3,078 (31.7%) | 728 (7.5%) |
| 3-Person Households | 496 (5.1%) | 82 (0.9%) |
| 4-Person Households | 622 (6.4%) | 33 (0.3%) |
| 5-Person Households | 158 (1.6%) | 0 (0.0%) |
| 6-Person Households | 47 (0.5%) | 0 (0.0%) |
| 7+ Person Households | 34 (0.4%) | 5 (0.1%) |
| Total | 4,435 (45.7%) | 5,269 (54.3%) |
Female Fertility in Parole
Fertility by Age in Parole
Average fertility rate in Parole is 15.0 births per 1,000 women. Women in the age bracket of 15 to 19 years have the highest fertility rate with 57.0 births per 1,000 women. Women in the age bracket of 35 to 50 years acount for 58.0% of all women with births.
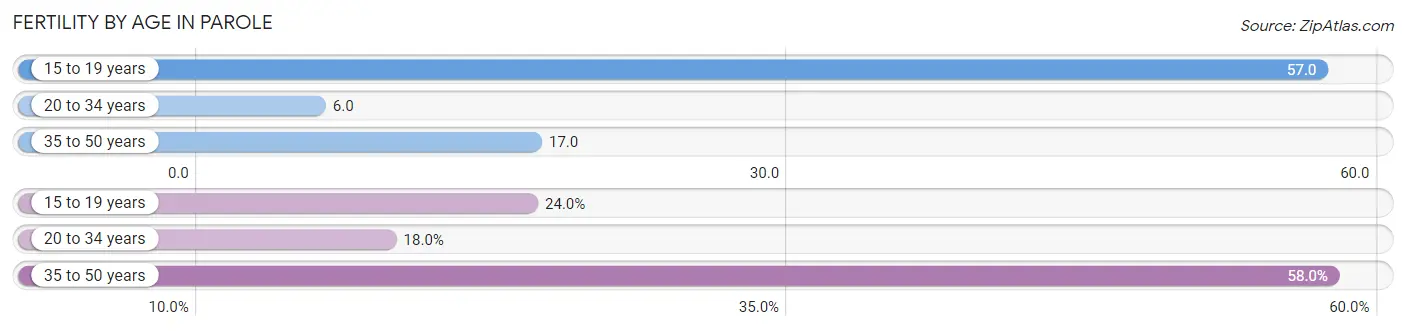
| Age Bracket | Women with Births | Births / 1,000 Women |
| 15 to 19 years | 12 (24.0%) | 57.0 |
| 20 to 34 years | 9 (18.0%) | 6.0 |
| 35 to 50 years | 29 (58.0%) | 17.0 |
| Total | 50 (100.0%) | 15.0 |
Fertility by Age by Marriage Status in Parole
76.0% of women with births (50) in Parole are married. The highest percentage of unmarried women with births falls into 15 to 19 years age bracket with 100.0% of them unmarried at the time of birth, while the lowest percentage of unmarried women with births belong to 20 to 34 years age bracket with 0.0% of them unmarried.
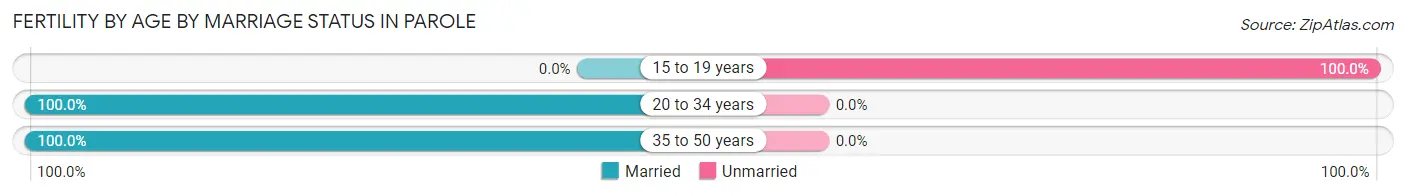
| Age Bracket | Married | Unmarried |
| 15 to 19 years | 0 (0.0%) | 12 (100.0%) |
| 20 to 34 years | 9 (100.0%) | 0 (0.0%) |
| 35 to 50 years | 29 (100.0%) | 0 (0.0%) |
| Total | 38 (76.0%) | 12 (24.0%) |
Fertility by Education in Parole
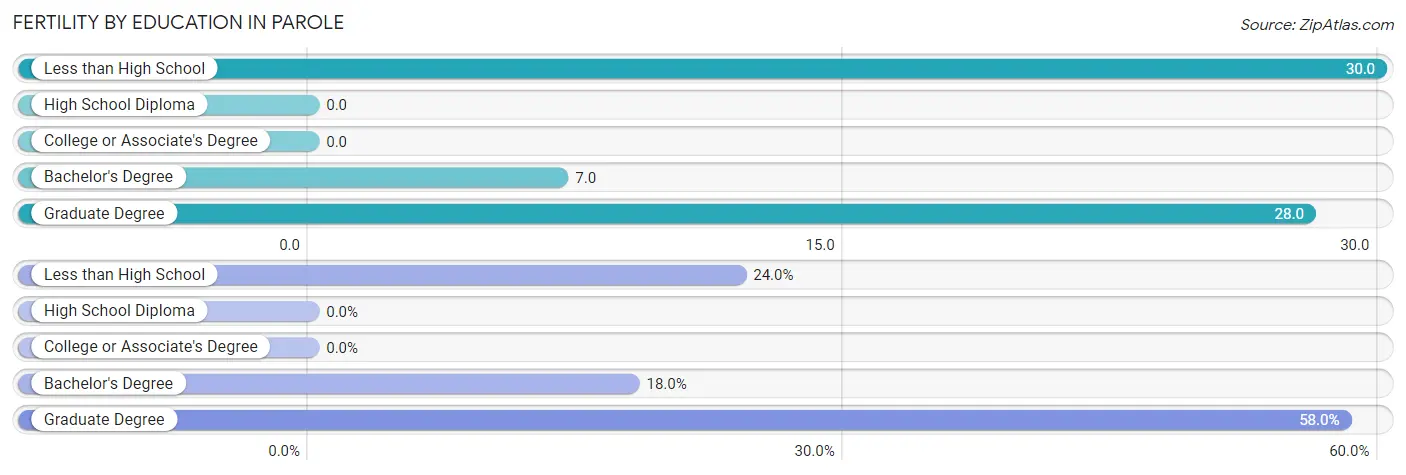
| Educational Attainment | Women with Births | Births / 1,000 Women |
| Less than High School | 12 (24.0%) | 30.0 |
| High School Diploma | 0 (0.0%) | 0.0 |
| College or Associate's Degree | 0 (0.0%) | 0.0 |
| Bachelor's Degree | 9 (18.0%) | 7.0 |
| Graduate Degree | 29 (58.0%) | 28.0 |
| Total | 50 (100.0%) | 15.0 |
Fertility by Education by Marriage Status in Parole
24.0% of women with births in Parole are unmarried. Women with the educational attainment of bachelor's degree are most likely to be married with 100.0% of them married at childbirth, while women with the educational attainment of less than high school are least likely to be married with 100.0% of them unmarried at childbirth.
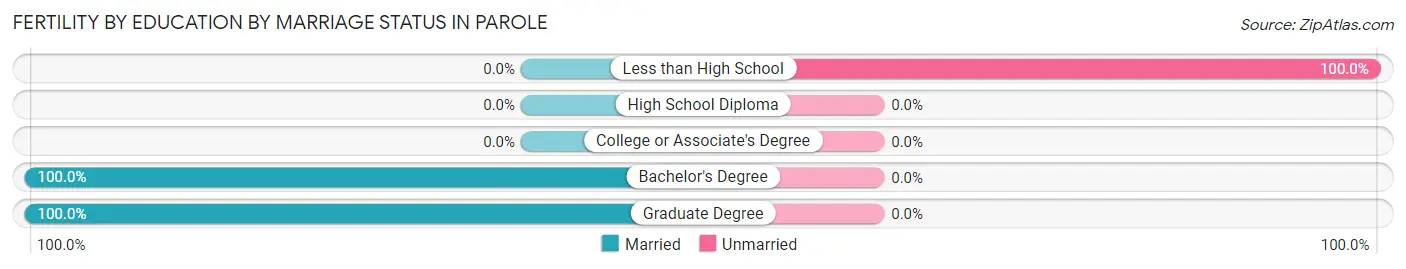
| Educational Attainment | Married | Unmarried |
| Less than High School | 0 (0.0%) | 12 (100.0%) |
| High School Diploma | 0 (0.0%) | 0 (0.0%) |
| College or Associate's Degree | 0 (0.0%) | 0 (0.0%) |
| Bachelor's Degree | 9 (100.0%) | 0 (0.0%) |
| Graduate Degree | 29 (100.0%) | 0 (0.0%) |
| Total | 38 (76.0%) | 12 (24.0%) |
Employment Characteristics in Parole
Employment by Class of Employer in Parole
Among the 9,611 employed individuals in Parole, private company employees (5,541 | 57.7%), federal government employees (1,117 | 11.6%), and not-for-profit organizations (723 | 7.5%) make up the most common classes of employment.
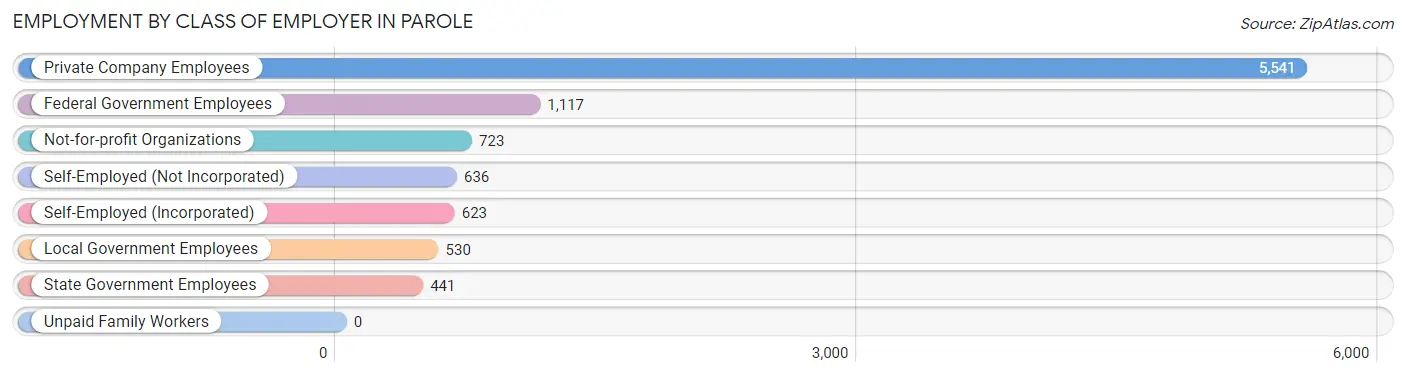
| Employer Class | # Employees | % Employees |
| Private Company Employees | 5,541 | 57.7% |
| Self-Employed (Incorporated) | 623 | 6.5% |
| Self-Employed (Not Incorporated) | 636 | 6.6% |
| Not-for-profit Organizations | 723 | 7.5% |
| Local Government Employees | 530 | 5.5% |
| State Government Employees | 441 | 4.6% |
| Federal Government Employees | 1,117 | 11.6% |
| Unpaid Family Workers | 0 | 0.0% |
| Total | 9,611 | 100.0% |
Employment Status by Age in Parole
According to the labor force statistics for Parole, out of the total population over 16 years of age (16,852), 59.2% or 9,976 individuals are in the labor force, with 3.0% or 299 of them unemployed. The age group with the highest labor force participation rate is 25 to 29 years, with 93.2% or 1,386 individuals in the labor force. Within the labor force, the 16 to 19 years age range has the highest percentage of unemployed individuals, with 11.1% or 11 of them being unemployed.
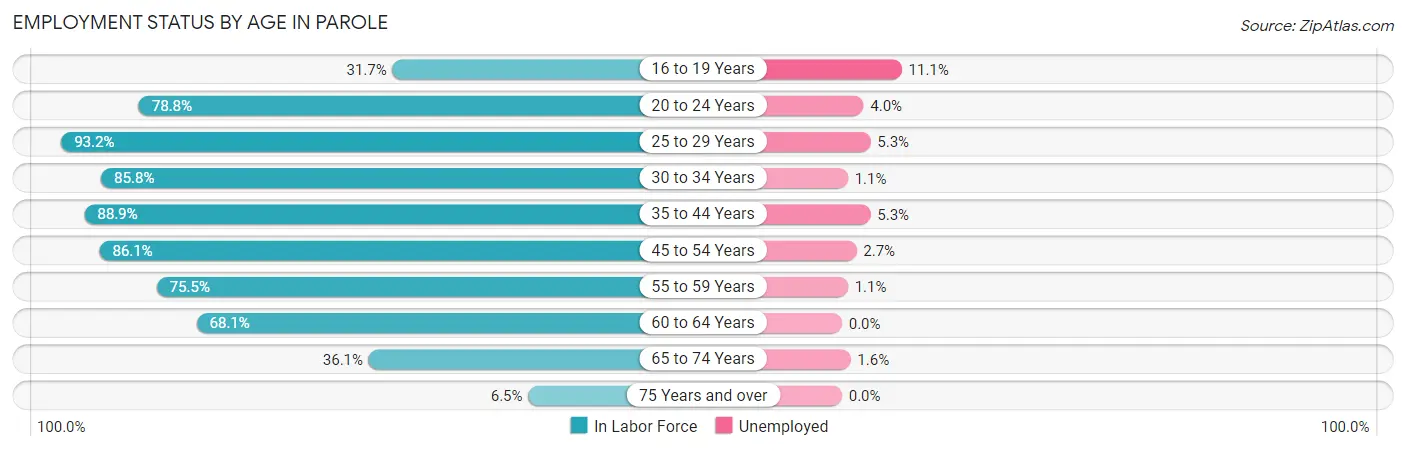
| Age Bracket | In Labor Force | Unemployed |
| 16 to 19 Years | 99 (31.7%) | 11 (11.1%) |
| 20 to 24 Years | 788 (78.8%) | 32 (4.0%) |
| 25 to 29 Years | 1,386 (93.2%) | 73 (5.3%) |
| 30 to 34 Years | 861 (85.8%) | 9 (1.1%) |
| 35 to 44 Years | 1,718 (88.9%) | 91 (5.3%) |
| 45 to 54 Years | 2,062 (86.1%) | 56 (2.7%) |
| 55 to 59 Years | 845 (75.5%) | 9 (1.1%) |
| 60 to 64 Years | 974 (68.1%) | 0 (0.0%) |
| 65 to 74 Years | 1,031 (36.1%) | 16 (1.6%) |
| 75 Years and over | 216 (6.5%) | 0 (0.0%) |
| Total | 9,976 (59.2%) | 299 (3.0%) |
Employment Status by Educational Attainment in Parole
According to labor force statistics for Parole, 83.8% of individuals (7,849) out of the total population between 25 and 64 years of age (9,366) are in the labor force, with 3.0% or 235 of them being unemployed. The group with the highest labor force participation rate are those with the educational attainment of college / associate degree, with 89.1% or 1,746 individuals in the labor force. Within the labor force, individuals with less than high school education have the highest percentage of unemployment, with 3.9% or 9 of them being unemployed.
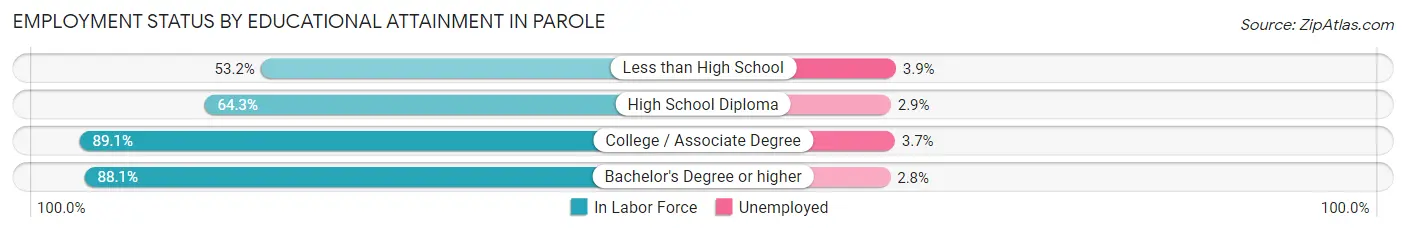
| Educational Attainment | In Labor Force | Unemployed |
| Less than High School | 233 (53.2%) | 17 (3.9%) |
| High School Diploma | 732 (64.3%) | 33 (2.9%) |
| College / Associate Degree | 1,746 (89.1%) | 73 (3.7%) |
| Bachelor's Degree or higher | 5,136 (88.1%) | 163 (2.8%) |
| Total | 7,849 (83.8%) | 281 (3.0%) |
Employment Occupations by Sex in Parole
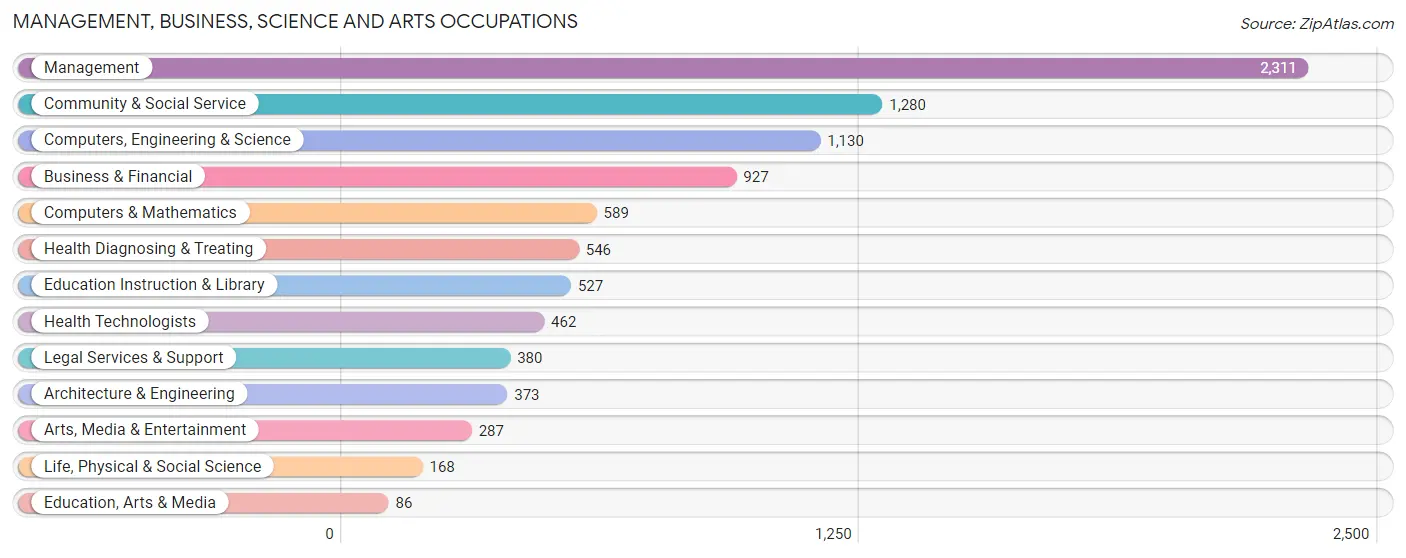
Management, Business, Science and Arts Occupations
The most common Management, Business, Science and Arts occupations in Parole are Management (2,311 | 24.2%), Community & Social Service (1,280 | 13.4%), Computers, Engineering & Science (1,130 | 11.8%), Business & Financial (927 | 9.7%), and Computers & Mathematics (589 | 6.2%).
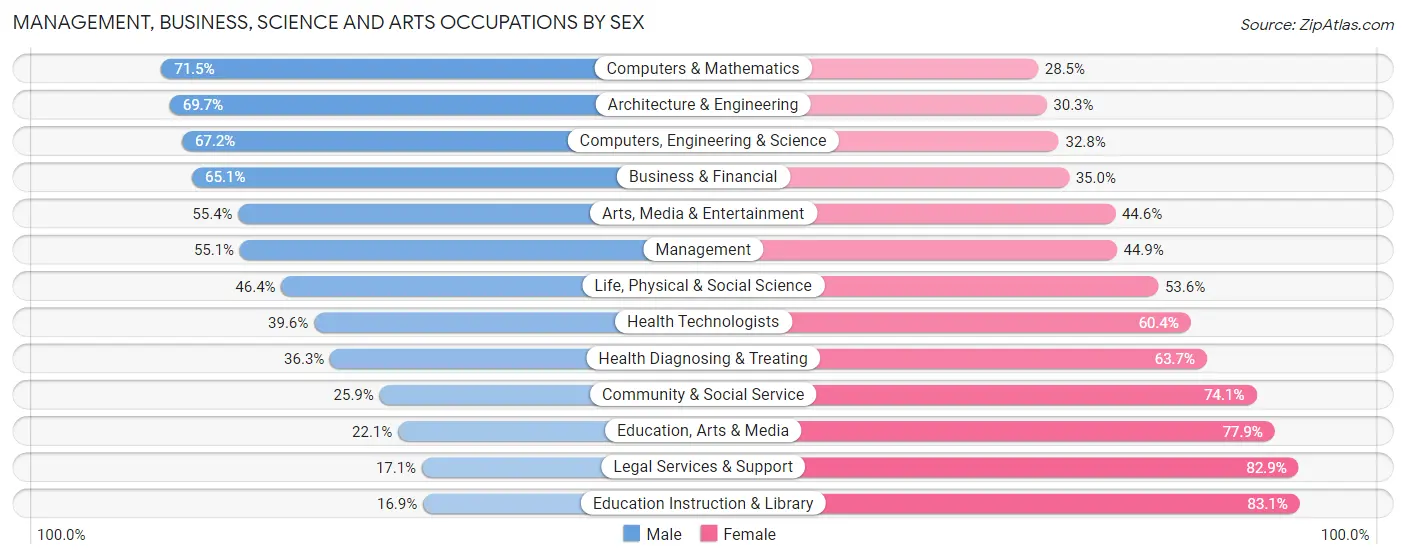
Management, Business, Science and Arts Occupations by Sex
Within the Management, Business, Science and Arts occupations in Parole, the most male-oriented occupations are Computers & Mathematics (71.5%), Architecture & Engineering (69.7%), and Computers, Engineering & Science (67.2%), while the most female-oriented occupations are Education Instruction & Library (83.1%), Legal Services & Support (82.9%), and Education, Arts & Media (77.9%).
| Occupation | Male | Female |
| Management | 1,273 (55.1%) | 1,038 (44.9%) |
| Business & Financial | 603 (65.0%) | 324 (34.9%) |
| Computers, Engineering & Science | 759 (67.2%) | 371 (32.8%) |
| Computers & Mathematics | 421 (71.5%) | 168 (28.5%) |
| Architecture & Engineering | 260 (69.7%) | 113 (30.3%) |
| Life, Physical & Social Science | 78 (46.4%) | 90 (53.6%) |
| Community & Social Service | 332 (25.9%) | 948 (74.1%) |
| Education, Arts & Media | 19 (22.1%) | 67 (77.9%) |
| Legal Services & Support | 65 (17.1%) | 315 (82.9%) |
| Education Instruction & Library | 89 (16.9%) | 438 (83.1%) |
| Arts, Media & Entertainment | 159 (55.4%) | 128 (44.6%) |
| Health Diagnosing & Treating | 198 (36.3%) | 348 (63.7%) |
| Health Technologists | 183 (39.6%) | 279 (60.4%) |
| Total (Category) | 3,165 (51.1%) | 3,029 (48.9%) |
| Total (Overall) | 5,009 (52.4%) | 4,547 (47.6%) |
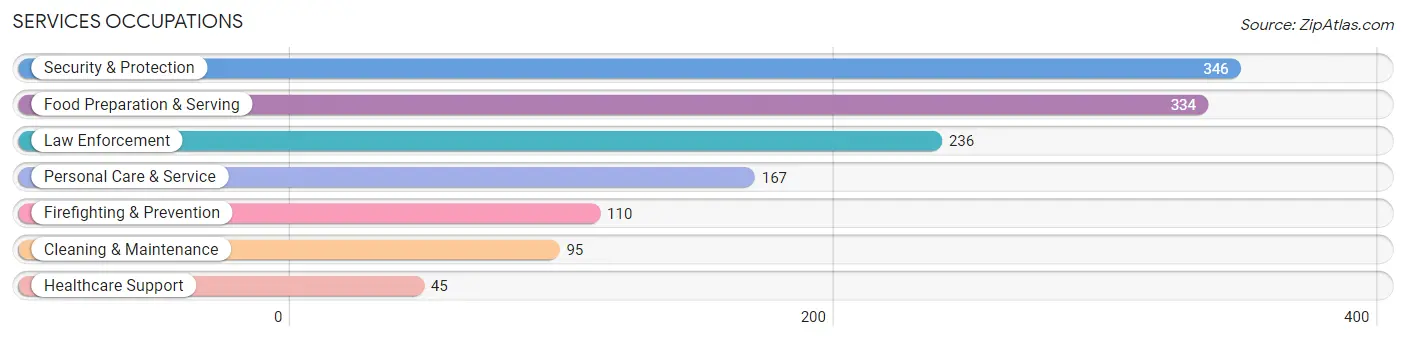
Services Occupations
The most common Services occupations in Parole are Security & Protection (346 | 3.6%), Food Preparation & Serving (334 | 3.5%), Law Enforcement (236 | 2.5%), Personal Care & Service (167 | 1.8%), and Firefighting & Prevention (110 | 1.1%).
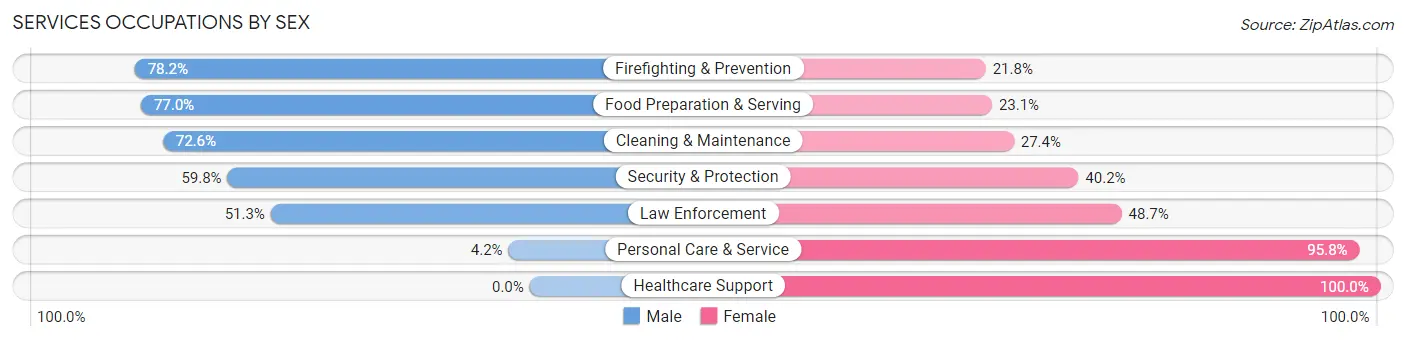
Services Occupations by Sex
Within the Services occupations in Parole, the most male-oriented occupations are Firefighting & Prevention (78.2%), Food Preparation & Serving (76.9%), and Cleaning & Maintenance (72.6%), while the most female-oriented occupations are Healthcare Support (100.0%), Personal Care & Service (95.8%), and Law Enforcement (48.7%).
| Occupation | Male | Female |
| Healthcare Support | 0 (0.0%) | 45 (100.0%) |
| Security & Protection | 207 (59.8%) | 139 (40.2%) |
| Firefighting & Prevention | 86 (78.2%) | 24 (21.8%) |
| Law Enforcement | 121 (51.3%) | 115 (48.7%) |
| Food Preparation & Serving | 257 (76.9%) | 77 (23.1%) |
| Cleaning & Maintenance | 69 (72.6%) | 26 (27.4%) |
| Personal Care & Service | 7 (4.2%) | 160 (95.8%) |
| Total (Category) | 540 (54.7%) | 447 (45.3%) |
| Total (Overall) | 5,009 (52.4%) | 4,547 (47.6%) |
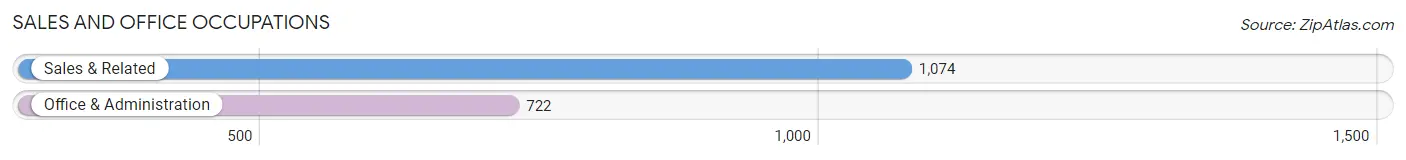
Sales and Office Occupations
The most common Sales and Office occupations in Parole are Sales & Related (1,074 | 11.2%), and Office & Administration (722 | 7.6%).
Sales and Office Occupations by Sex
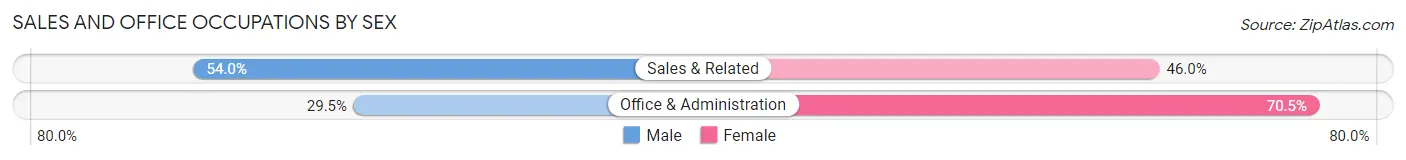
| Occupation | Male | Female |
| Sales & Related | 580 (54.0%) | 494 (46.0%) |
| Office & Administration | 213 (29.5%) | 509 (70.5%) |
| Total (Category) | 793 (44.2%) | 1,003 (55.8%) |
| Total (Overall) | 5,009 (52.4%) | 4,547 (47.6%) |
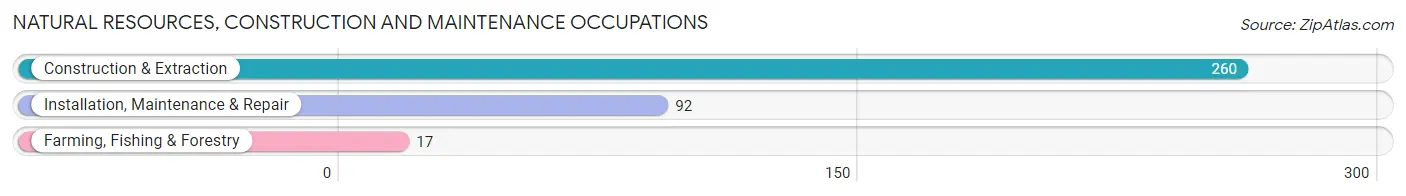
Natural Resources, Construction and Maintenance Occupations
The most common Natural Resources, Construction and Maintenance occupations in Parole are Construction & Extraction (260 | 2.7%), Installation, Maintenance & Repair (92 | 1.0%), and Farming, Fishing & Forestry (17 | 0.2%).
Natural Resources, Construction and Maintenance Occupations by Sex
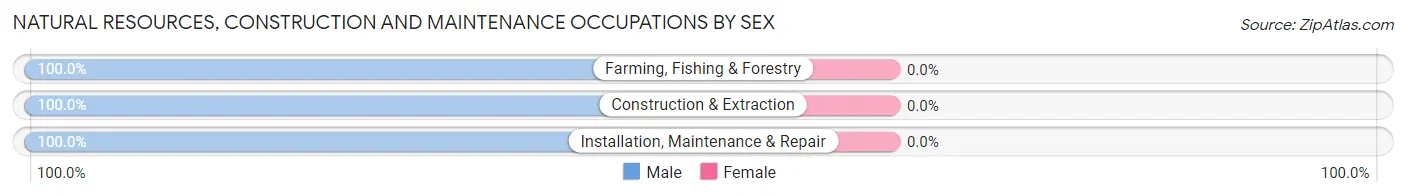
| Occupation | Male | Female |
| Farming, Fishing & Forestry | 17 (100.0%) | 0 (0.0%) |
| Construction & Extraction | 260 (100.0%) | 0 (0.0%) |
| Installation, Maintenance & Repair | 92 (100.0%) | 0 (0.0%) |
| Total (Category) | 369 (100.0%) | 0 (0.0%) |
| Total (Overall) | 5,009 (52.4%) | 4,547 (47.6%) |
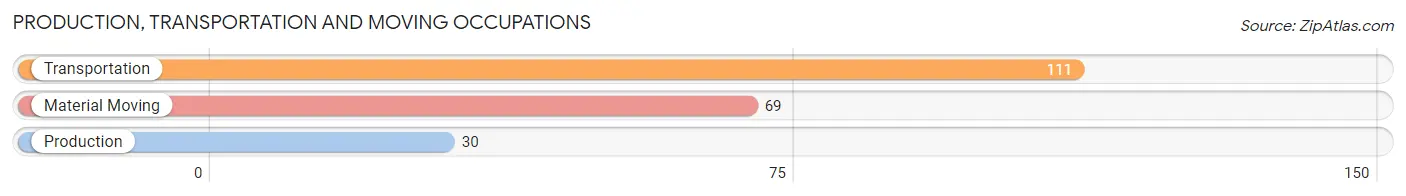
Production, Transportation and Moving Occupations
The most common Production, Transportation and Moving occupations in Parole are Transportation (111 | 1.2%), Material Moving (69 | 0.7%), and Production (30 | 0.3%).
Production, Transportation and Moving Occupations by Sex
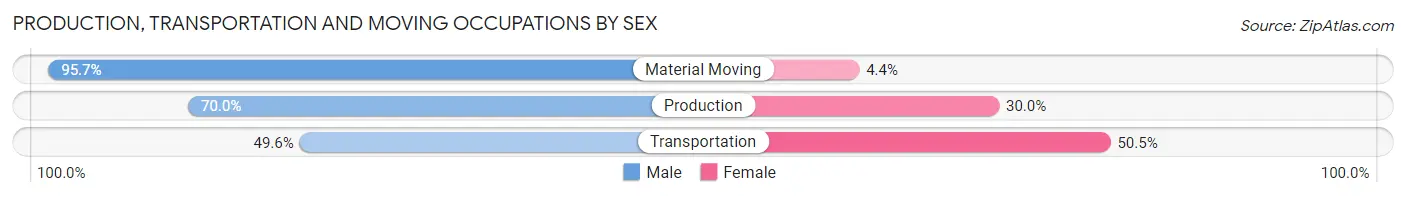
| Occupation | Male | Female |
| Production | 21 (70.0%) | 9 (30.0%) |
| Transportation | 55 (49.5%) | 56 (50.4%) |
| Material Moving | 66 (95.7%) | 3 (4.3%) |
| Total (Category) | 142 (67.6%) | 68 (32.4%) |
| Total (Overall) | 5,009 (52.4%) | 4,547 (47.6%) |
Employment Industries by Sex in Parole
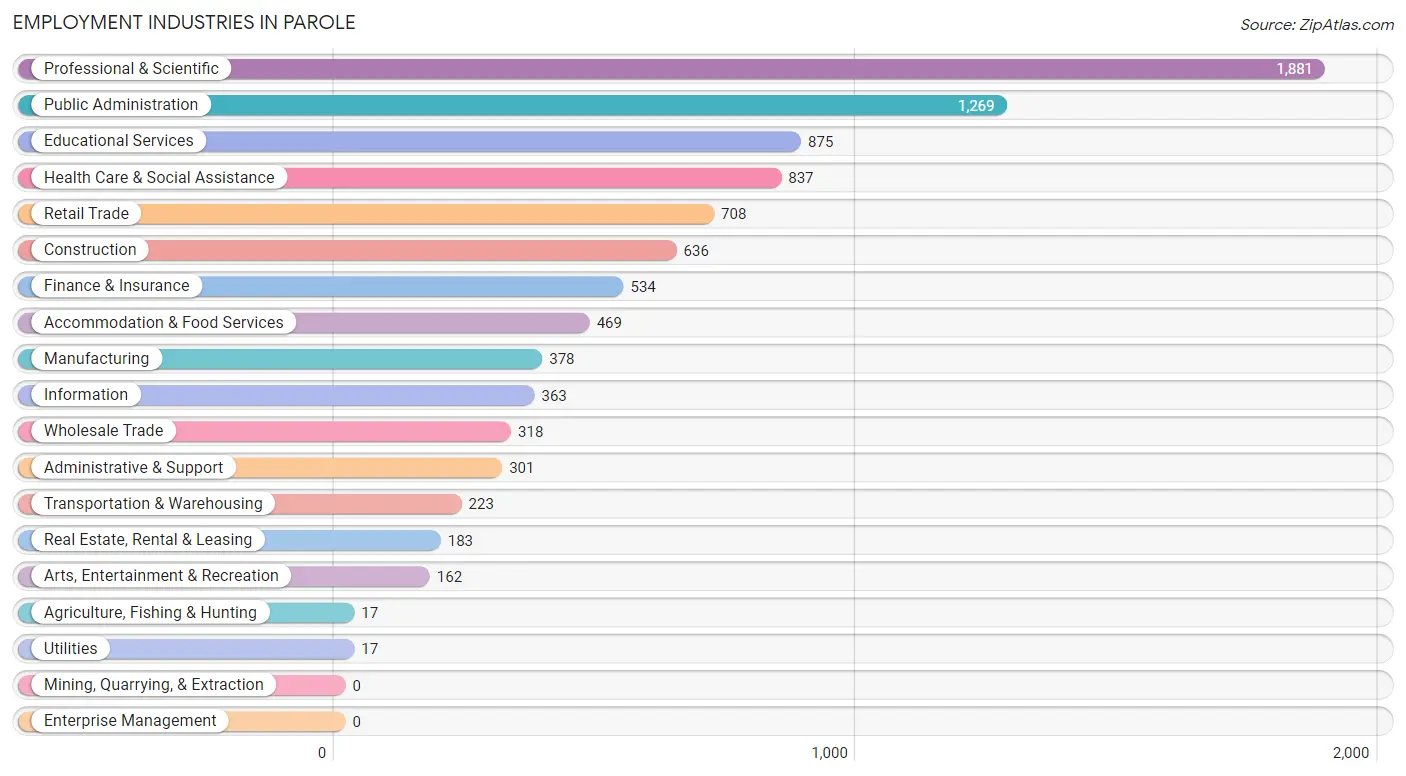
Employment Industries in Parole
The major employment industries in Parole include Professional & Scientific (1,881 | 19.7%), Public Administration (1,269 | 13.3%), Educational Services (875 | 9.2%), Health Care & Social Assistance (837 | 8.8%), and Retail Trade (708 | 7.4%).
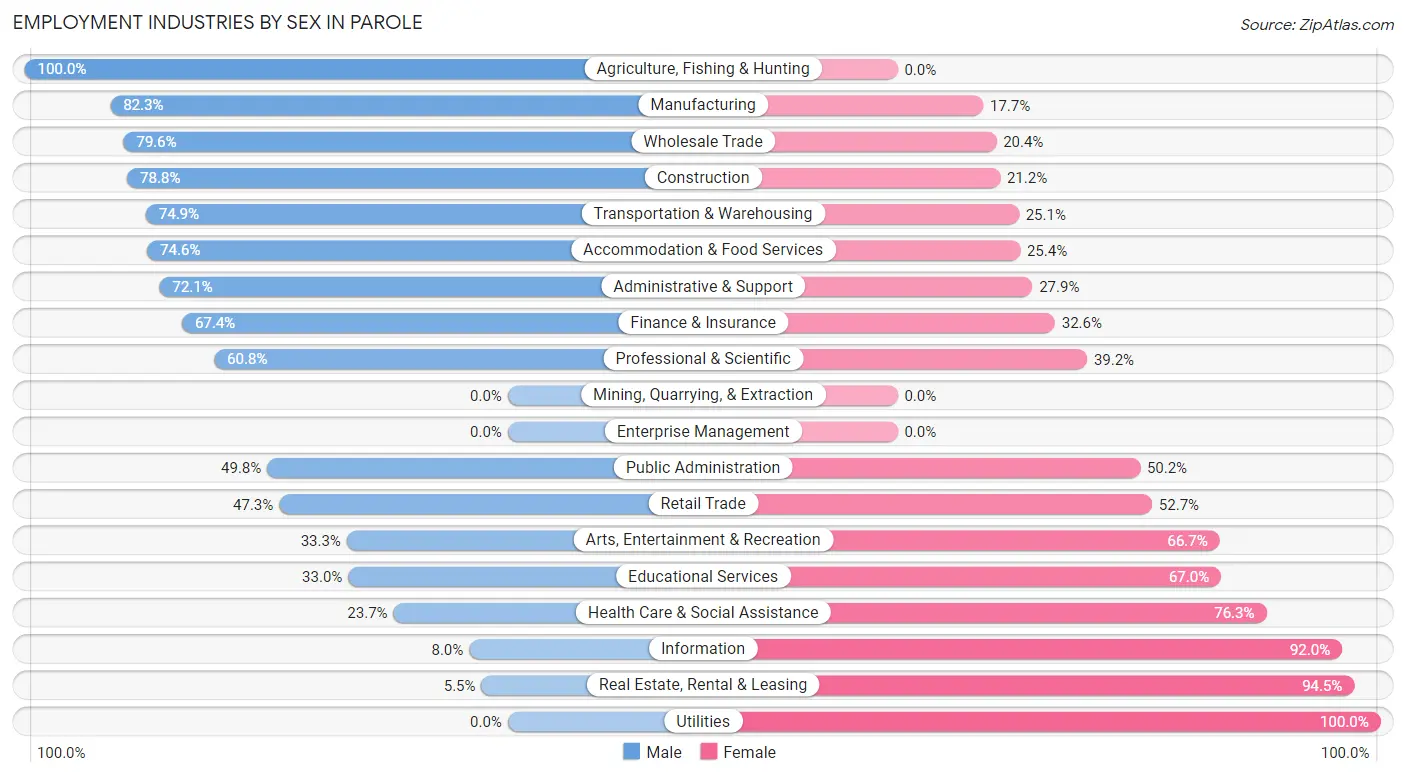
Employment Industries by Sex in Parole
The Parole industries that see more men than women are Agriculture, Fishing & Hunting (100.0%), Manufacturing (82.3%), and Wholesale Trade (79.6%), whereas the industries that tend to have a higher number of women are Utilities (100.0%), Real Estate, Rental & Leasing (94.5%), and Information (92.0%).
| Industry | Male | Female |
| Agriculture, Fishing & Hunting | 17 (100.0%) | 0 (0.0%) |
| Mining, Quarrying, & Extraction | 0 (0.0%) | 0 (0.0%) |
| Construction | 501 (78.8%) | 135 (21.2%) |
| Manufacturing | 311 (82.3%) | 67 (17.7%) |
| Wholesale Trade | 253 (79.6%) | 65 (20.4%) |
| Retail Trade | 335 (47.3%) | 373 (52.7%) |
| Transportation & Warehousing | 167 (74.9%) | 56 (25.1%) |
| Utilities | 0 (0.0%) | 17 (100.0%) |
| Information | 29 (8.0%) | 334 (92.0%) |
| Finance & Insurance | 360 (67.4%) | 174 (32.6%) |
| Real Estate, Rental & Leasing | 10 (5.5%) | 173 (94.5%) |
| Professional & Scientific | 1,143 (60.8%) | 738 (39.2%) |
| Enterprise Management | 0 (0.0%) | 0 (0.0%) |
| Administrative & Support | 217 (72.1%) | 84 (27.9%) |
| Educational Services | 289 (33.0%) | 586 (67.0%) |
| Health Care & Social Assistance | 198 (23.7%) | 639 (76.3%) |
| Arts, Entertainment & Recreation | 54 (33.3%) | 108 (66.7%) |
| Accommodation & Food Services | 350 (74.6%) | 119 (25.4%) |
| Public Administration | 632 (49.8%) | 637 (50.2%) |
| Total | 5,009 (52.4%) | 4,547 (47.6%) |
Education in Parole
School Enrollment in Parole
The most common levels of schooling among the 2,307 students in Parole are college / undergraduate (637 | 27.6%), elementary school (459 | 19.9%), and high school (428 | 18.5%).
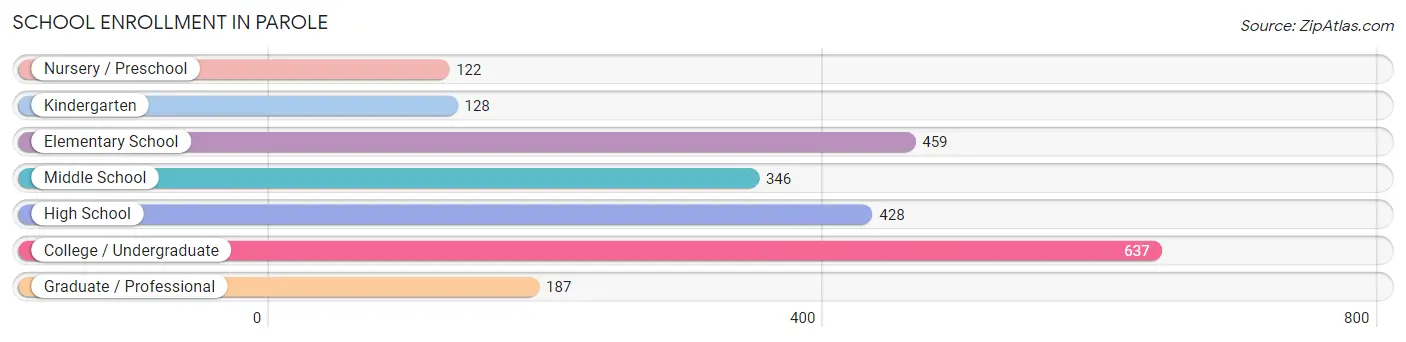
| School Level | # Students | % Students |
| Nursery / Preschool | 122 | 5.3% |
| Kindergarten | 128 | 5.6% |
| Elementary School | 459 | 19.9% |
| Middle School | 346 | 15.0% |
| High School | 428 | 18.5% |
| College / Undergraduate | 637 | 27.6% |
| Graduate / Professional | 187 | 8.1% |
| Total | 2,307 | 100.0% |
School Enrollment by Age by Funding Source in Parole
Out of a total of 2,307 students who are enrolled in schools in Parole, 595 (25.8%) attend a private institution, while the remaining 1,712 (74.2%) are enrolled in public schools. The age group of 18 to 19 year olds has the highest likelihood of being enrolled in private schools, with 42 (100.0% in the age bracket) enrolled. Conversely, the age group of 35 years and over has the lowest likelihood of being enrolled in a private school, with 227 (93.4% in the age bracket) attending a public institution.
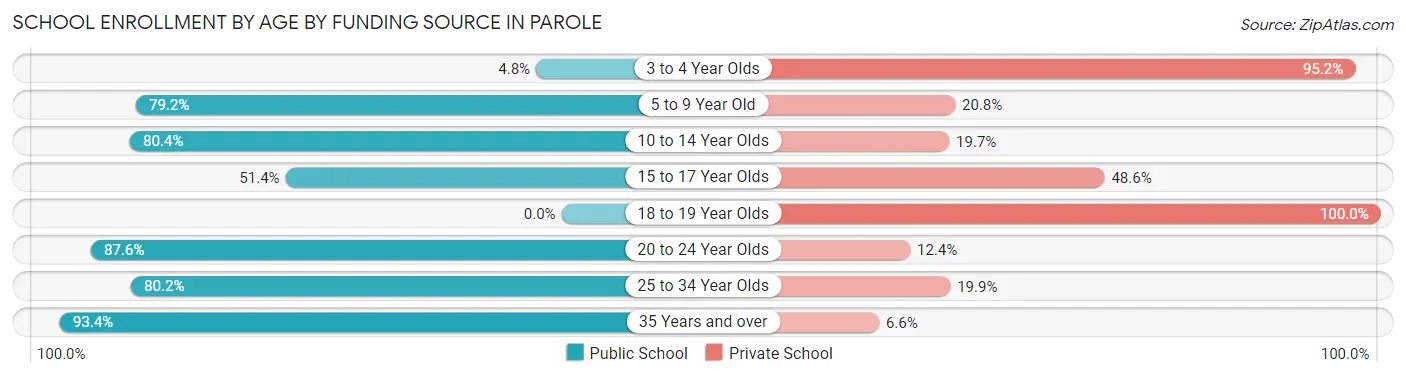
| Age Bracket | Public School | Private School |
| 3 to 4 Year Olds | 4 (4.8%) | 80 (95.2%) |
| 5 to 9 Year Old | 477 (79.2%) | 125 (20.8%) |
| 10 to 14 Year Olds | 368 (80.3%) | 90 (19.7%) |
| 15 to 17 Year Olds | 163 (51.4%) | 154 (48.6%) |
| 18 to 19 Year Olds | 0 (0.0%) | 42 (100.0%) |
| 20 to 24 Year Olds | 262 (87.6%) | 37 (12.4%) |
| 25 to 34 Year Olds | 210 (80.1%) | 52 (19.9%) |
| 35 Years and over | 227 (93.4%) | 16 (6.6%) |
| Total | 1,712 (74.2%) | 595 (25.8%) |
Educational Attainment by Field of Study in Parole
Business (1,573 | 16.0%), social sciences (1,450 | 14.7%), education (1,100 | 11.2%), engineering (1,002 | 10.2%), and liberal arts & history (685 | 6.9%) are the most common fields of study among 9,865 individuals in Parole who have obtained a bachelor's degree or higher.
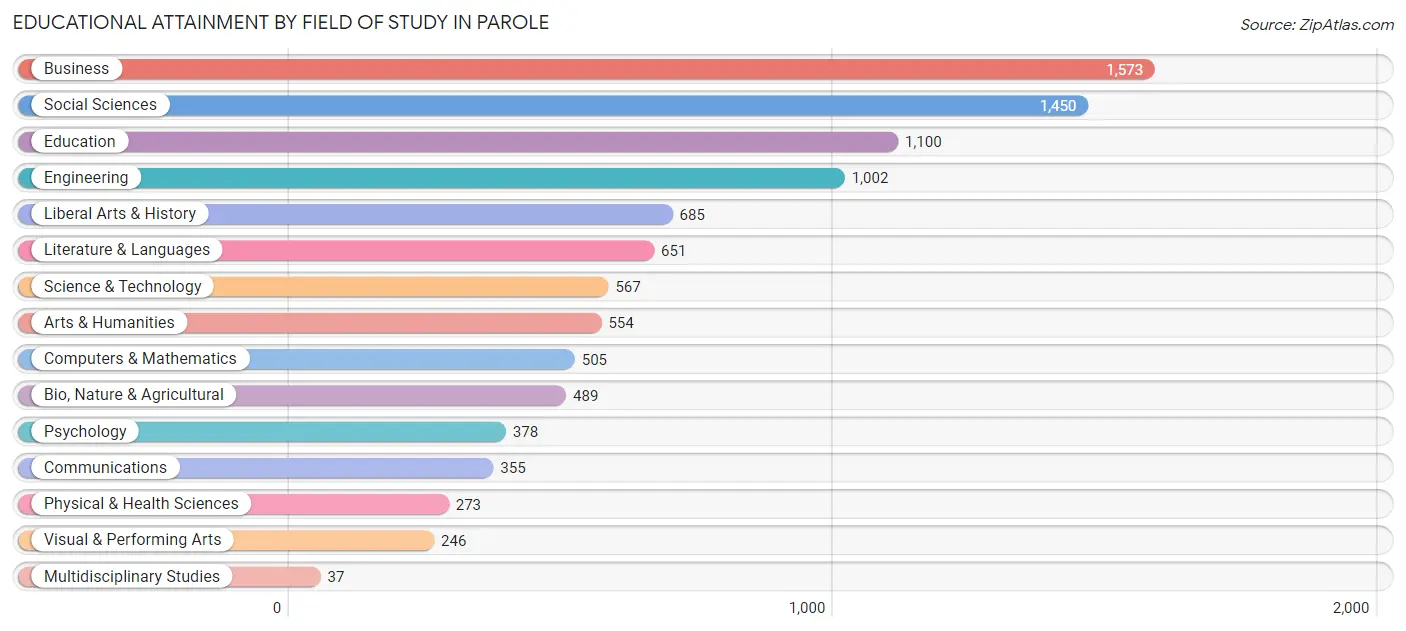
| Field of Study | # Graduates | % Graduates |
| Computers & Mathematics | 505 | 5.1% |
| Bio, Nature & Agricultural | 489 | 5.0% |
| Physical & Health Sciences | 273 | 2.8% |
| Psychology | 378 | 3.8% |
| Social Sciences | 1,450 | 14.7% |
| Engineering | 1,002 | 10.2% |
| Multidisciplinary Studies | 37 | 0.4% |
| Science & Technology | 567 | 5.8% |
| Business | 1,573 | 16.0% |
| Education | 1,100 | 11.2% |
| Literature & Languages | 651 | 6.6% |
| Liberal Arts & History | 685 | 6.9% |
| Visual & Performing Arts | 246 | 2.5% |
| Communications | 355 | 3.6% |
| Arts & Humanities | 554 | 5.6% |
| Total | 9,865 | 100.0% |
Transportation & Commute in Parole
Vehicle Availability by Sex in Parole
The most prevalent vehicle ownership categories in Parole are males with 2 vehicles (2,349, accounting for 46.0%) and females with 2 vehicles (1,787, making up 52.1%).
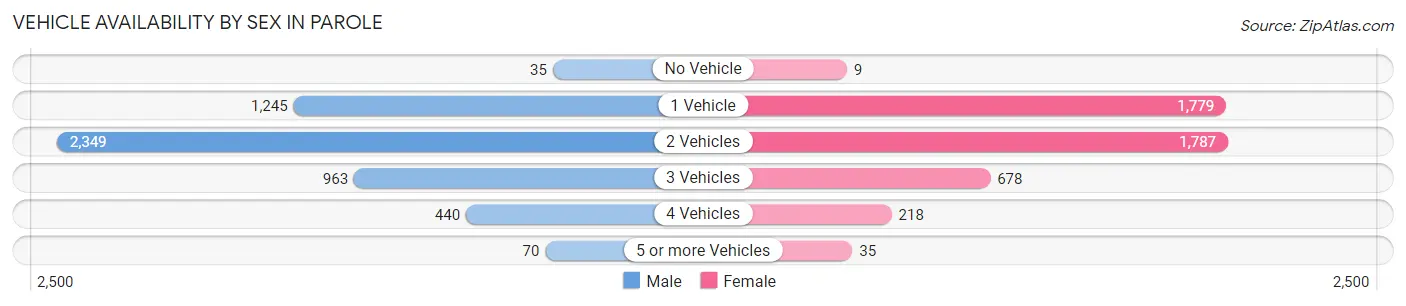
| Vehicles Available | Male | Female |
| No Vehicle | 35 (0.7%) | 9 (0.2%) |
| 1 Vehicle | 1,245 (24.4%) | 1,779 (39.5%) |
| 2 Vehicles | 2,349 (46.0%) | 1,787 (39.7%) |
| 3 Vehicles | 963 (18.9%) | 678 (15.0%) |
| 4 Vehicles | 440 (8.6%) | 218 (4.8%) |
| 5 or more Vehicles | 70 (1.4%) | 35 (0.8%) |
| Total | 5,102 (100.0%) | 4,506 (100.0%) |
Commute Time in Parole
The most frequently occuring commute durations in Parole are 15 to 19 minutes (1,118 commuters, 14.5%), 20 to 24 minutes (892 commuters, 11.6%), and 5 to 9 minutes (876 commuters, 11.4%).
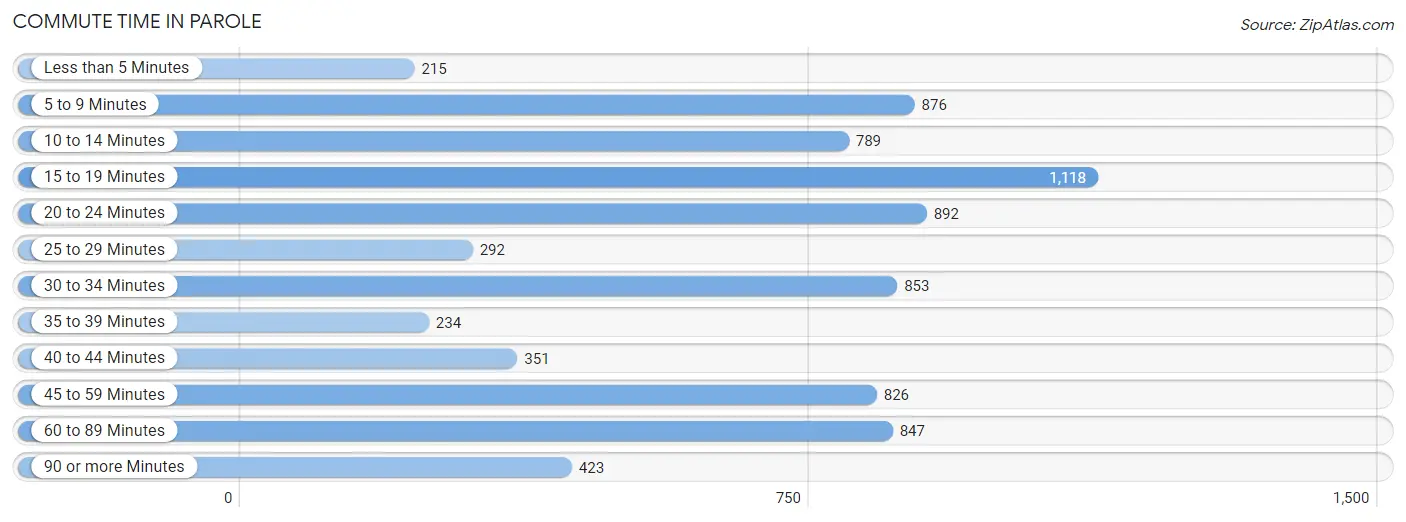
| Commute Time | # Commuters | % Commuters |
| Less than 5 Minutes | 215 | 2.8% |
| 5 to 9 Minutes | 876 | 11.4% |
| 10 to 14 Minutes | 789 | 10.2% |
| 15 to 19 Minutes | 1,118 | 14.5% |
| 20 to 24 Minutes | 892 | 11.6% |
| 25 to 29 Minutes | 292 | 3.8% |
| 30 to 34 Minutes | 853 | 11.1% |
| 35 to 39 Minutes | 234 | 3.0% |
| 40 to 44 Minutes | 351 | 4.5% |
| 45 to 59 Minutes | 826 | 10.7% |
| 60 to 89 Minutes | 847 | 11.0% |
| 90 or more Minutes | 423 | 5.5% |
Commute Time by Sex in Parole
The most common commute times in Parole are 15 to 19 minutes (621 commuters, 14.2%) for males and 15 to 19 minutes (497 commuters, 14.9%) for females.
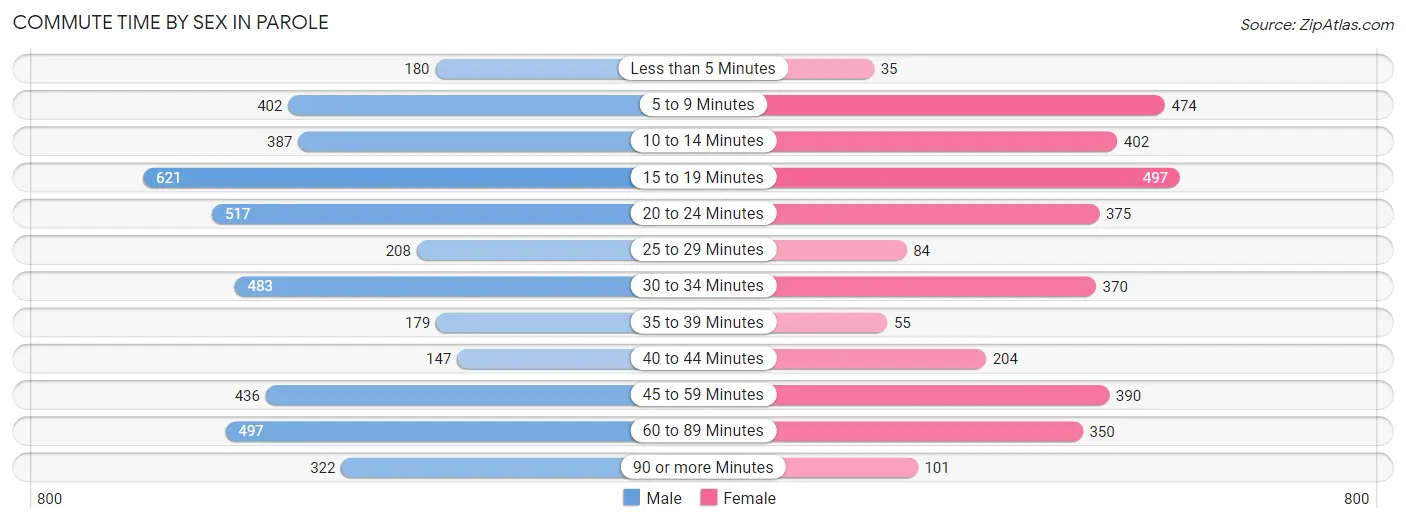
| Commute Time | Male | Female |
| Less than 5 Minutes | 180 (4.1%) | 35 (1.1%) |
| 5 to 9 Minutes | 402 (9.2%) | 474 (14.2%) |
| 10 to 14 Minutes | 387 (8.8%) | 402 (12.0%) |
| 15 to 19 Minutes | 621 (14.2%) | 497 (14.9%) |
| 20 to 24 Minutes | 517 (11.8%) | 375 (11.2%) |
| 25 to 29 Minutes | 208 (4.8%) | 84 (2.5%) |
| 30 to 34 Minutes | 483 (11.0%) | 370 (11.1%) |
| 35 to 39 Minutes | 179 (4.1%) | 55 (1.7%) |
| 40 to 44 Minutes | 147 (3.4%) | 204 (6.1%) |
| 45 to 59 Minutes | 436 (10.0%) | 390 (11.7%) |
| 60 to 89 Minutes | 497 (11.4%) | 350 (10.5%) |
| 90 or more Minutes | 322 (7.3%) | 101 (3.0%) |
Time of Departure to Work by Sex in Parole
The most frequent times of departure to work in Parole are 8:00 AM to 8:29 AM (544, 12.4%) for males and 7:30 AM to 7:59 AM (732, 21.9%) for females.
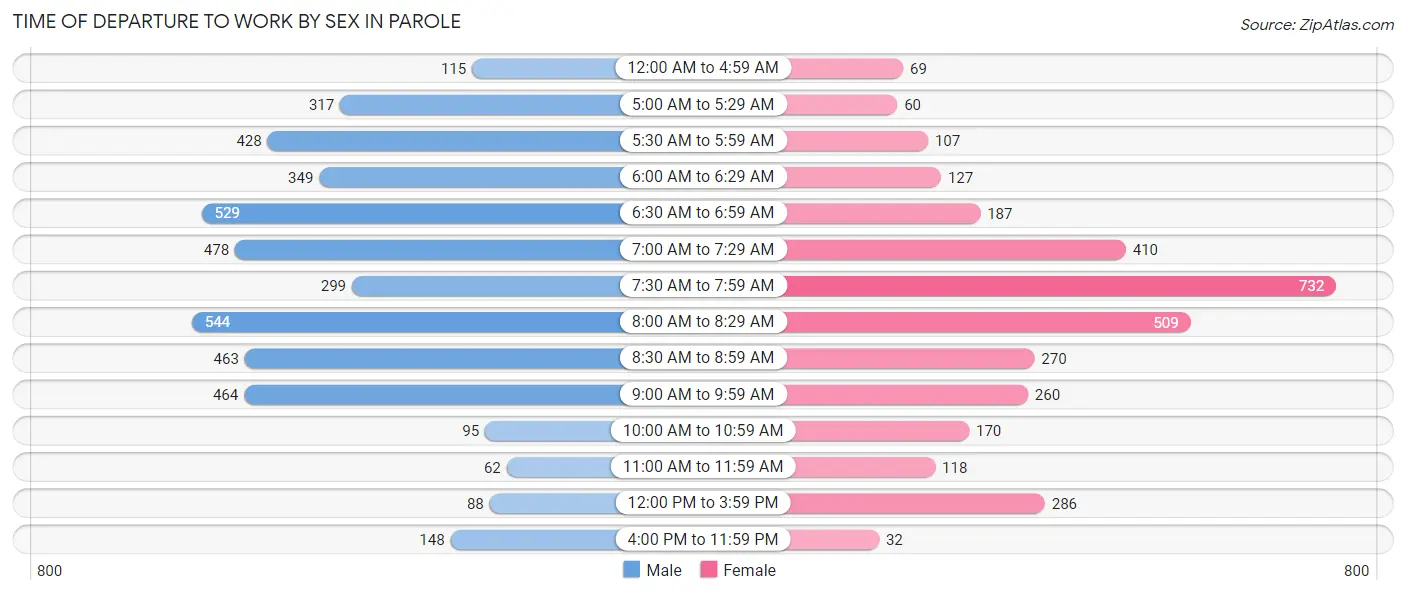
| Time of Departure | Male | Female |
| 12:00 AM to 4:59 AM | 115 (2.6%) | 69 (2.1%) |
| 5:00 AM to 5:29 AM | 317 (7.2%) | 60 (1.8%) |
| 5:30 AM to 5:59 AM | 428 (9.8%) | 107 (3.2%) |
| 6:00 AM to 6:29 AM | 349 (8.0%) | 127 (3.8%) |
| 6:30 AM to 6:59 AM | 529 (12.1%) | 187 (5.6%) |
| 7:00 AM to 7:29 AM | 478 (10.9%) | 410 (12.3%) |
| 7:30 AM to 7:59 AM | 299 (6.8%) | 732 (21.9%) |
| 8:00 AM to 8:29 AM | 544 (12.4%) | 509 (15.2%) |
| 8:30 AM to 8:59 AM | 463 (10.6%) | 270 (8.1%) |
| 9:00 AM to 9:59 AM | 464 (10.6%) | 260 (7.8%) |
| 10:00 AM to 10:59 AM | 95 (2.2%) | 170 (5.1%) |
| 11:00 AM to 11:59 AM | 62 (1.4%) | 118 (3.5%) |
| 12:00 PM to 3:59 PM | 88 (2.0%) | 286 (8.6%) |
| 4:00 PM to 11:59 PM | 148 (3.4%) | 32 (1.0%) |
| Total | 4,379 (100.0%) | 3,337 (100.0%) |
Housing Occupancy in Parole
Occupancy by Ownership in Parole
Of the total 9,704 dwellings in Parole, owner-occupied units account for 6,132 (63.2%), while renter-occupied units make up 3,572 (36.8%).
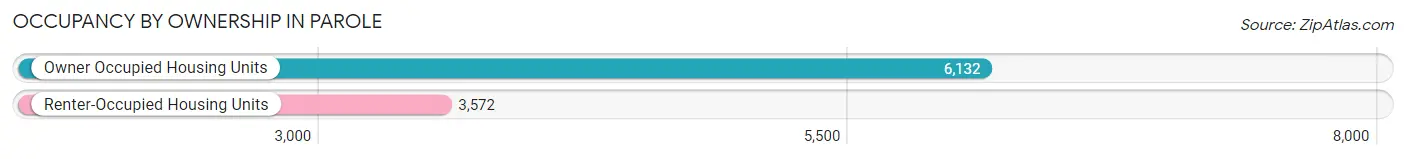
| Occupancy | # Housing Units | % Housing Units |
| Owner Occupied Housing Units | 6,132 | 63.2% |
| Renter-Occupied Housing Units | 3,572 | 36.8% |
| Total Occupied Housing Units | 9,704 | 100.0% |
Occupancy by Household Size in Parole
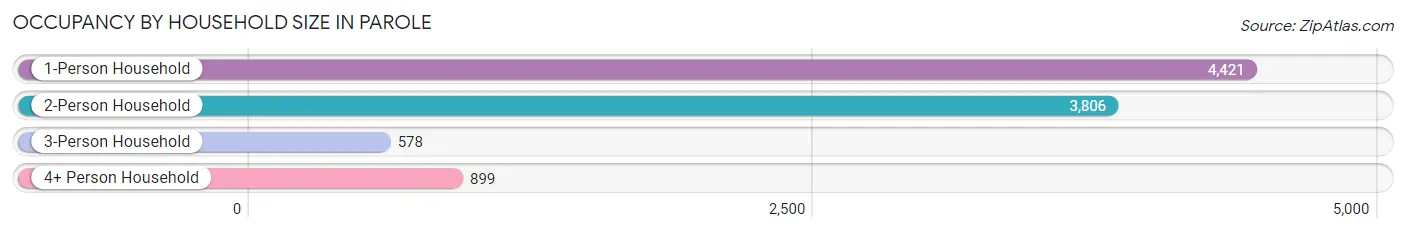
| Household Size | # Housing Units | % Housing Units |
| 1-Person Household | 4,421 | 45.6% |
| 2-Person Household | 3,806 | 39.2% |
| 3-Person Household | 578 | 6.0% |
| 4+ Person Household | 899 | 9.3% |
| Total Housing Units | 9,704 | 100.0% |
Occupancy by Ownership by Household Size in Parole
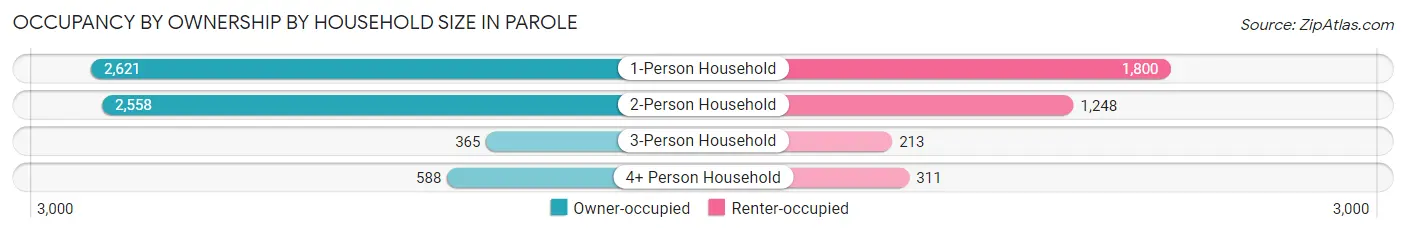
| Household Size | Owner-occupied | Renter-occupied |
| 1-Person Household | 2,621 (59.3%) | 1,800 (40.7%) |
| 2-Person Household | 2,558 (67.2%) | 1,248 (32.8%) |
| 3-Person Household | 365 (63.1%) | 213 (36.8%) |
| 4+ Person Household | 588 (65.4%) | 311 (34.6%) |
| Total Housing Units | 6,132 (63.2%) | 3,572 (36.8%) |
Occupancy by Educational Attainment in Parole
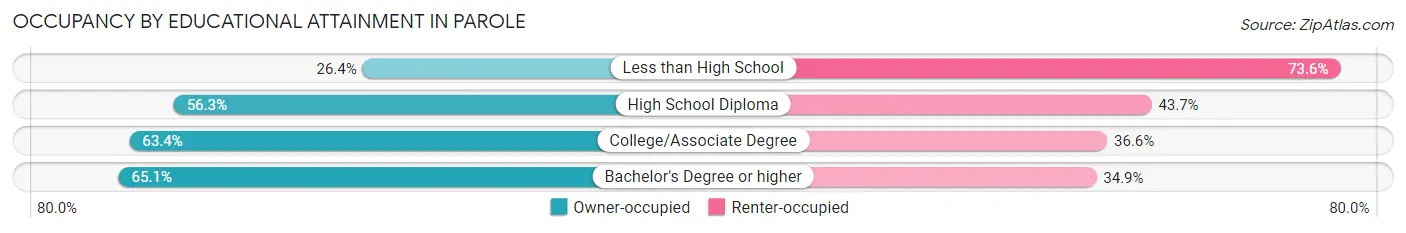
| Household Size | Owner-occupied | Renter-occupied |
| Less than High School | 33 (26.4%) | 92 (73.6%) |
| High School Diploma | 649 (56.3%) | 503 (43.7%) |
| College/Associate Degree | 1,263 (63.4%) | 730 (36.6%) |
| Bachelor's Degree or higher | 4,187 (65.1%) | 2,247 (34.9%) |
Occupancy by Age of Householder in Parole
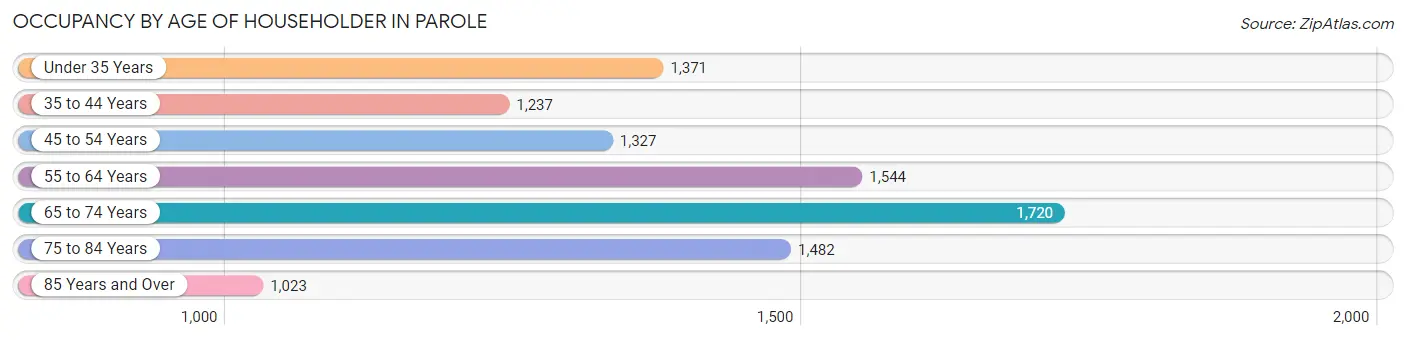
| Age Bracket | # Households | % Households |
| Under 35 Years | 1,371 | 14.1% |
| 35 to 44 Years | 1,237 | 12.8% |
| 45 to 54 Years | 1,327 | 13.7% |
| 55 to 64 Years | 1,544 | 15.9% |
| 65 to 74 Years | 1,720 | 17.7% |
| 75 to 84 Years | 1,482 | 15.3% |
| 85 Years and Over | 1,023 | 10.5% |
| Total | 9,704 | 100.0% |
Housing Finances in Parole
Median Income by Occupancy in Parole
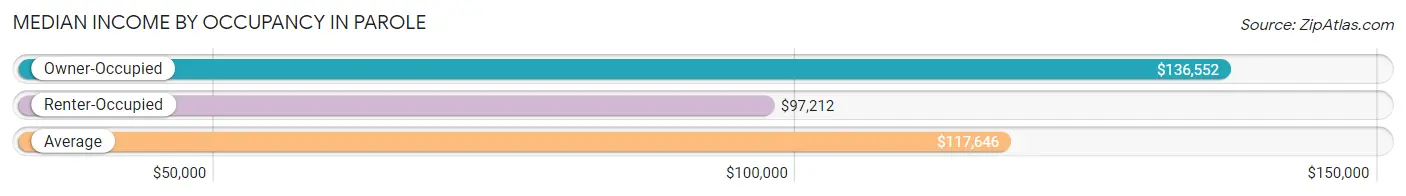
| Occupancy Type | # Households | Median Income |
| Owner-Occupied | 6,132 (63.2%) | $136,552 |
| Renter-Occupied | 3,572 (36.8%) | $97,212 |
| Average | 9,704 (100.0%) | $117,646 |
Occupancy by Householder Income Bracket in Parole
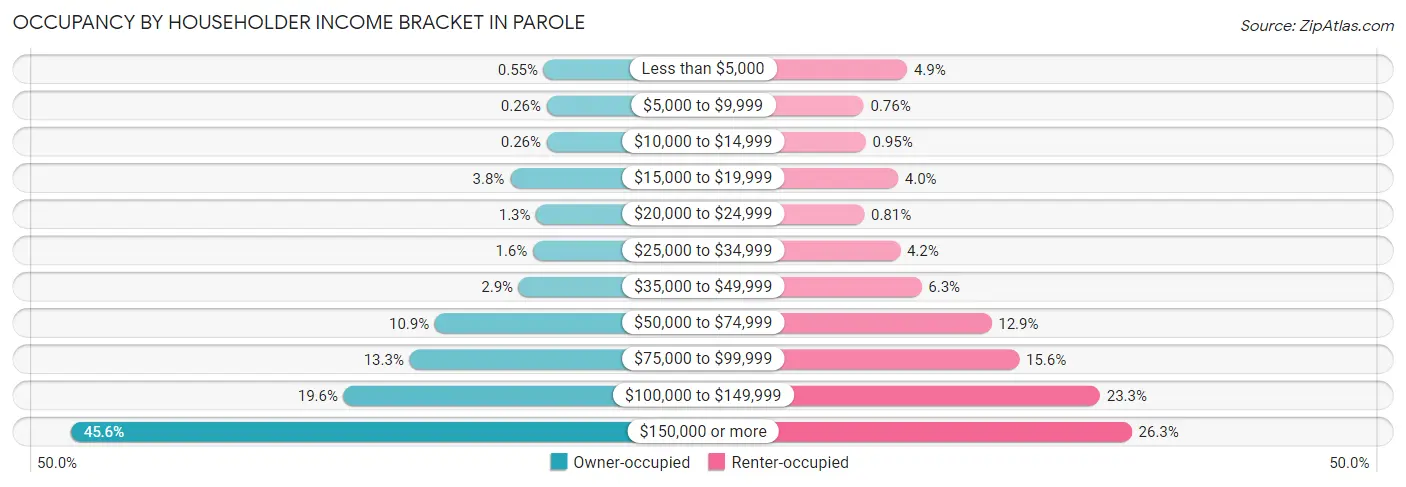
| Income Bracket | Owner-occupied | Renter-occupied |
| Less than $5,000 | 34 (0.5%) | 175 (4.9%) |
| $5,000 to $9,999 | 16 (0.3%) | 27 (0.8%) |
| $10,000 to $14,999 | 16 (0.3%) | 34 (0.9%) |
| $15,000 to $19,999 | 230 (3.7%) | 144 (4.0%) |
| $20,000 to $24,999 | 77 (1.3%) | 29 (0.8%) |
| $25,000 to $34,999 | 96 (1.6%) | 151 (4.2%) |
| $35,000 to $49,999 | 179 (2.9%) | 224 (6.3%) |
| $50,000 to $74,999 | 669 (10.9%) | 462 (12.9%) |
| $75,000 to $99,999 | 817 (13.3%) | 556 (15.6%) |
| $100,000 to $149,999 | 1,202 (19.6%) | 831 (23.3%) |
| $150,000 or more | 2,796 (45.6%) | 939 (26.3%) |
| Total | 6,132 (100.0%) | 3,572 (100.0%) |
Monthly Housing Cost Tiers in Parole
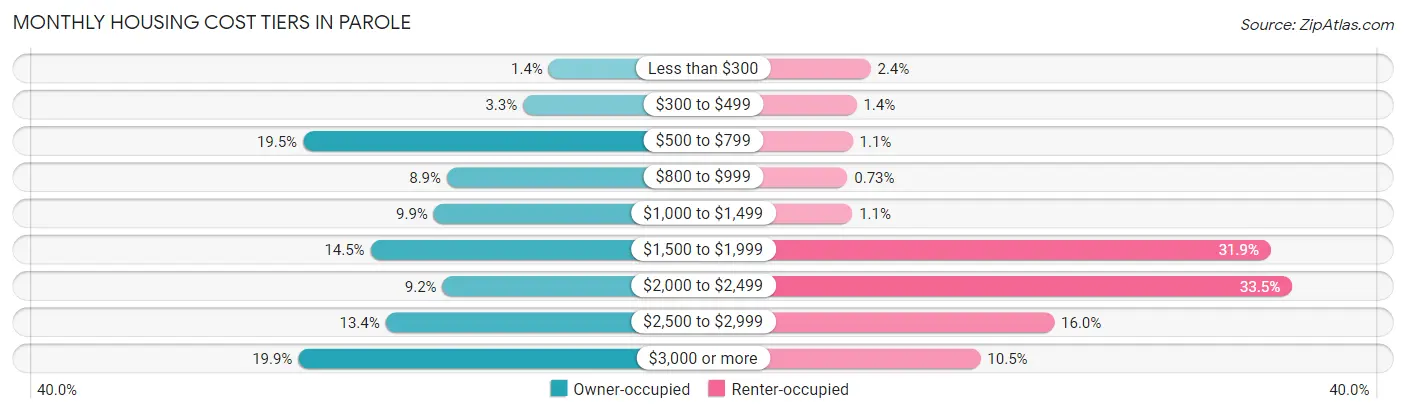
| Monthly Cost | Owner-occupied | Renter-occupied |
| Less than $300 | 86 (1.4%) | 87 (2.4%) |
| $300 to $499 | 202 (3.3%) | 50 (1.4%) |
| $500 to $799 | 1,196 (19.5%) | 40 (1.1%) |
| $800 to $999 | 546 (8.9%) | 26 (0.7%) |
| $1,000 to $1,499 | 605 (9.9%) | 39 (1.1%) |
| $1,500 to $1,999 | 891 (14.5%) | 1,140 (31.9%) |
| $2,000 to $2,499 | 566 (9.2%) | 1,196 (33.5%) |
| $2,500 to $2,999 | 823 (13.4%) | 570 (16.0%) |
| $3,000 or more | 1,217 (19.9%) | 376 (10.5%) |
| Total | 6,132 (100.0%) | 3,572 (100.0%) |
Physical Housing Characteristics in Parole
Housing Structures in Parole
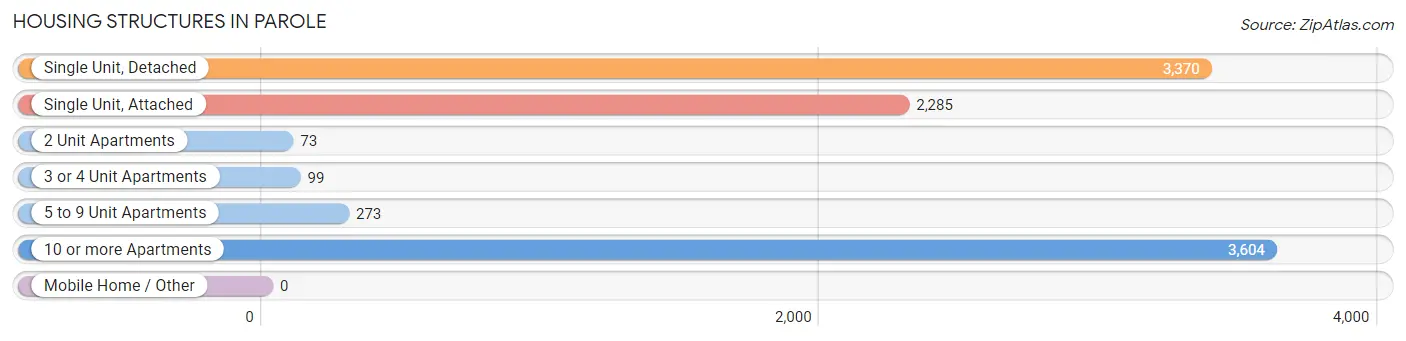
| Structure Type | # Housing Units | % Housing Units |
| Single Unit, Detached | 3,370 | 34.7% |
| Single Unit, Attached | 2,285 | 23.5% |
| 2 Unit Apartments | 73 | 0.7% |
| 3 or 4 Unit Apartments | 99 | 1.0% |
| 5 to 9 Unit Apartments | 273 | 2.8% |
| 10 or more Apartments | 3,604 | 37.1% |
| Mobile Home / Other | 0 | 0.0% |
| Total | 9,704 | 100.0% |
Housing Structures by Occupancy in Parole
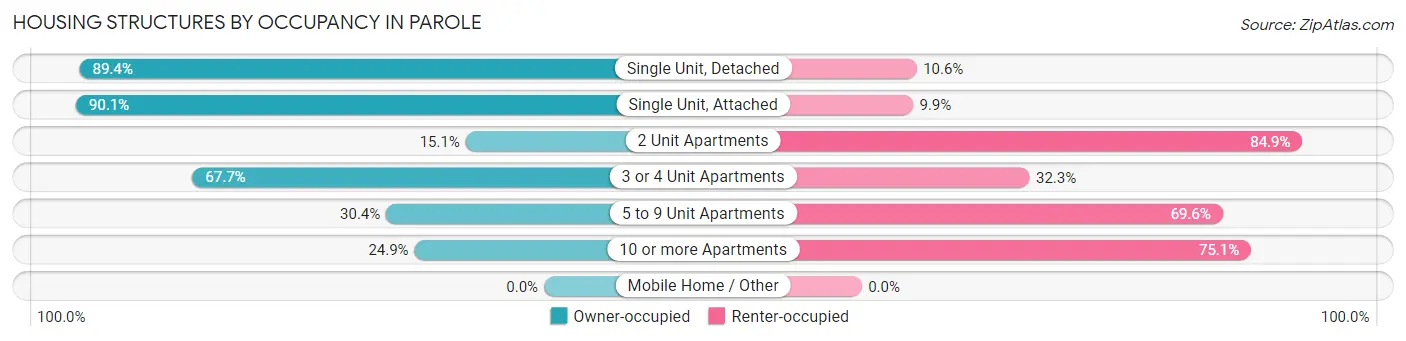
| Structure Type | Owner-occupied | Renter-occupied |
| Single Unit, Detached | 3,013 (89.4%) | 357 (10.6%) |
| Single Unit, Attached | 2,059 (90.1%) | 226 (9.9%) |
| 2 Unit Apartments | 11 (15.1%) | 62 (84.9%) |
| 3 or 4 Unit Apartments | 67 (67.7%) | 32 (32.3%) |
| 5 to 9 Unit Apartments | 83 (30.4%) | 190 (69.6%) |
| 10 or more Apartments | 899 (24.9%) | 2,705 (75.1%) |
| Mobile Home / Other | 0 (0.0%) | 0 (0.0%) |
| Total | 6,132 (63.2%) | 3,572 (36.8%) |
Housing Structures by Number of Rooms in Parole
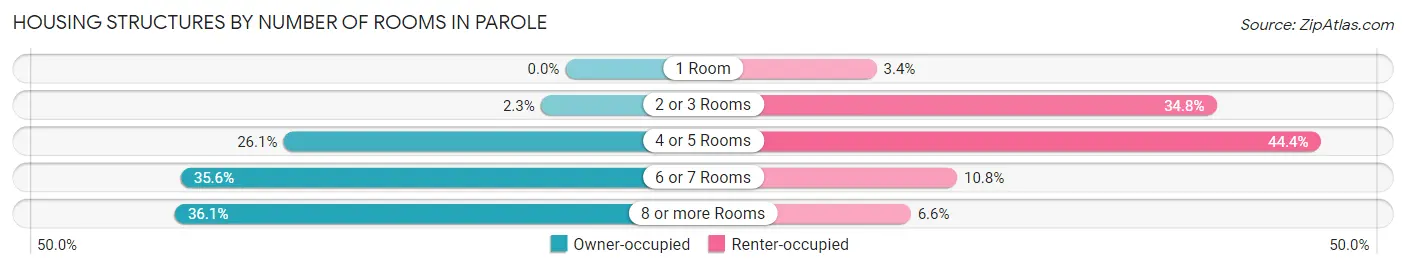
| Number of Rooms | Owner-occupied | Renter-occupied |
| 1 Room | 0 (0.0%) | 121 (3.4%) |
| 2 or 3 Rooms | 140 (2.3%) | 1,243 (34.8%) |
| 4 or 5 Rooms | 1,599 (26.1%) | 1,587 (44.4%) |
| 6 or 7 Rooms | 2,180 (35.5%) | 387 (10.8%) |
| 8 or more Rooms | 2,213 (36.1%) | 234 (6.6%) |
| Total | 6,132 (100.0%) | 3,572 (100.0%) |
Housing Structure by Heating Type in Parole
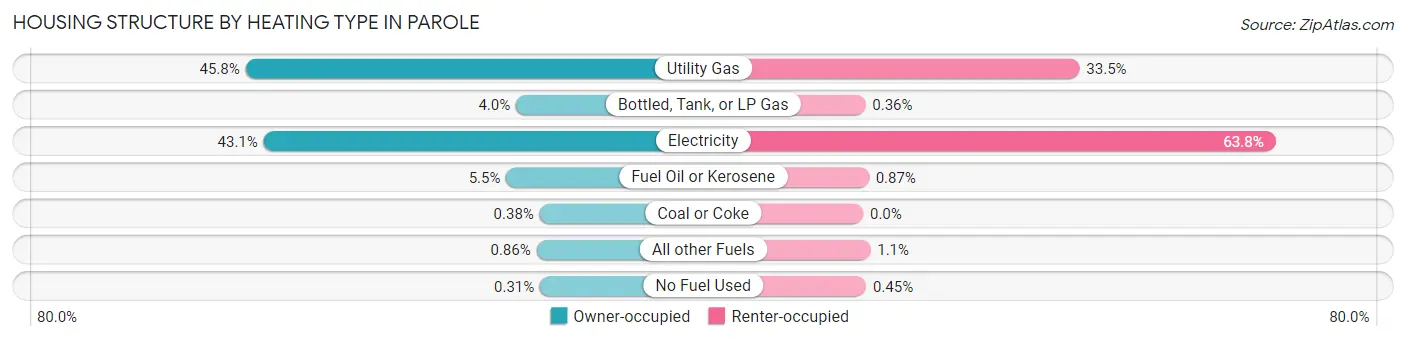
| Heating Type | Owner-occupied | Renter-occupied |
| Utility Gas | 2,811 (45.8%) | 1,195 (33.5%) |
| Bottled, Tank, or LP Gas | 247 (4.0%) | 13 (0.4%) |
| Electricity | 2,640 (43.0%) | 2,277 (63.7%) |
| Fuel Oil or Kerosene | 339 (5.5%) | 31 (0.9%) |
| Coal or Coke | 23 (0.4%) | 0 (0.0%) |
| All other Fuels | 53 (0.9%) | 40 (1.1%) |
| No Fuel Used | 19 (0.3%) | 16 (0.4%) |
| Total | 6,132 (100.0%) | 3,572 (100.0%) |
Household Vehicle Usage in Parole
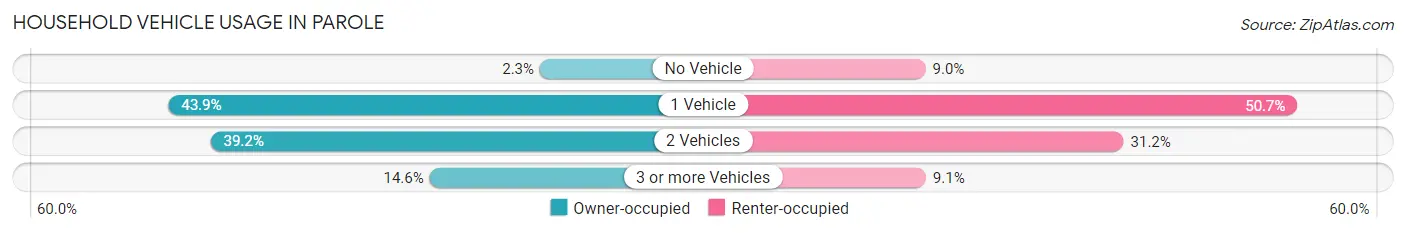
| Vehicles per Household | Owner-occupied | Renter-occupied |
| No Vehicle | 140 (2.3%) | 323 (9.0%) |
| 1 Vehicle | 2,692 (43.9%) | 1,810 (50.7%) |
| 2 Vehicles | 2,402 (39.2%) | 1,115 (31.2%) |
| 3 or more Vehicles | 898 (14.6%) | 324 (9.1%) |
| Total | 6,132 (100.0%) | 3,572 (100.0%) |
Real Estate & Mortgages in Parole
Real Estate and Mortgage Overview in Parole
| Characteristic | Without Mortgage | With Mortgage |
| Housing Units | 2,381 | 3,751 |
| Median Property Value | $473,400 | $518,700 |
| Median Household Income | $95,795 | $2,084 |
| Monthly Housing Costs | $737 | $1,173 |
| Real Estate Taxes | $4,119 | $54 |
Property Value by Mortgage Status in Parole
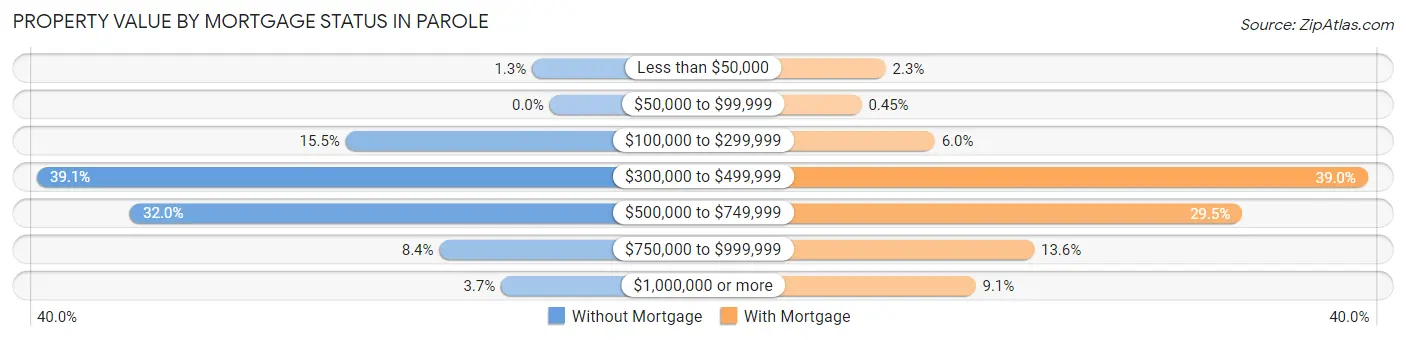
| Property Value | Without Mortgage | With Mortgage |
| Less than $50,000 | 32 (1.3%) | 86 (2.3%) |
| $50,000 to $99,999 | 0 (0.0%) | 17 (0.4%) |
| $100,000 to $299,999 | 370 (15.5%) | 226 (6.0%) |
| $300,000 to $499,999 | 930 (39.1%) | 1,464 (39.0%) |
| $500,000 to $749,999 | 761 (32.0%) | 1,105 (29.5%) |
| $750,000 to $999,999 | 200 (8.4%) | 510 (13.6%) |
| $1,000,000 or more | 88 (3.7%) | 343 (9.1%) |
| Total | 2,381 (100.0%) | 3,751 (100.0%) |
Household Income by Mortgage Status in Parole
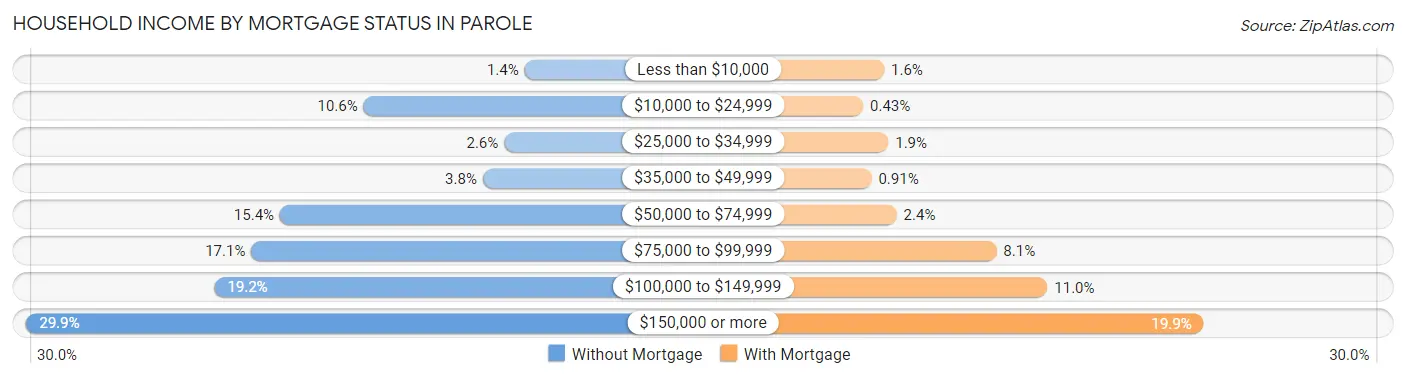
| Household Income | Without Mortgage | With Mortgage |
| Less than $10,000 | 34 (1.4%) | 61 (1.6%) |
| $10,000 to $24,999 | 253 (10.6%) | 16 (0.4%) |
| $25,000 to $34,999 | 62 (2.6%) | 70 (1.9%) |
| $35,000 to $49,999 | 91 (3.8%) | 34 (0.9%) |
| $50,000 to $74,999 | 367 (15.4%) | 88 (2.4%) |
| $75,000 to $99,999 | 406 (17.1%) | 302 (8.1%) |
| $100,000 to $149,999 | 456 (19.2%) | 411 (11.0%) |
| $150,000 or more | 712 (29.9%) | 746 (19.9%) |
| Total | 2,381 (100.0%) | 3,751 (100.0%) |
Property Value to Household Income Ratio in Parole
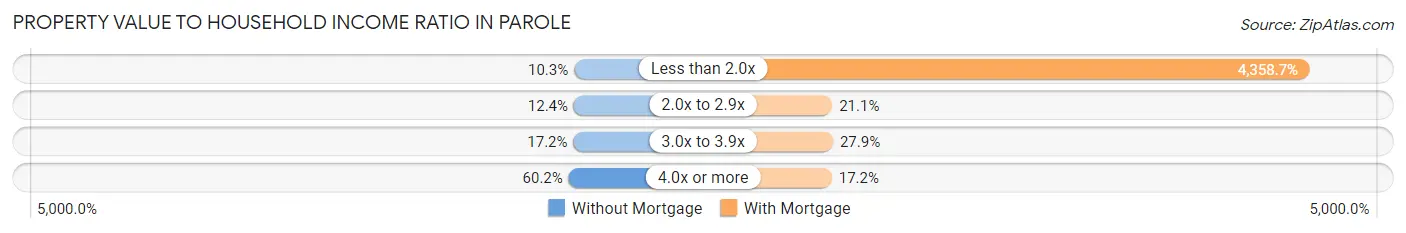
| Value-to-Income Ratio | Without Mortgage | With Mortgage |
| Less than 2.0x | 245 (10.3%) | 163,494 (4,358.7%) |
| 2.0x to 2.9x | 294 (12.3%) | 792 (21.1%) |
| 3.0x to 3.9x | 409 (17.2%) | 1,047 (27.9%) |
| 4.0x or more | 1,433 (60.2%) | 644 (17.2%) |
| Total | 2,381 (100.0%) | 3,751 (100.0%) |
Real Estate Taxes by Mortgage Status in Parole
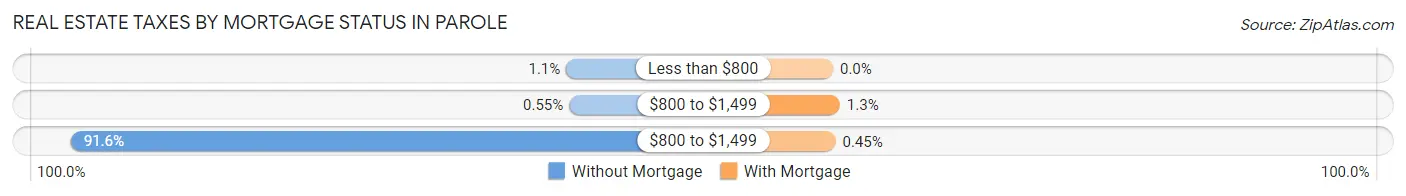
| Property Taxes | Without Mortgage | With Mortgage |
| Less than $800 | 26 (1.1%) | 0 (0.0%) |
| $800 to $1,499 | 13 (0.5%) | 47 (1.3%) |
| $800 to $1,499 | 2,180 (91.6%) | 17 (0.4%) |
| Total | 2,381 (100.0%) | 3,751 (100.0%) |
Health & Disability in Parole
Health Insurance Coverage by Age in Parole
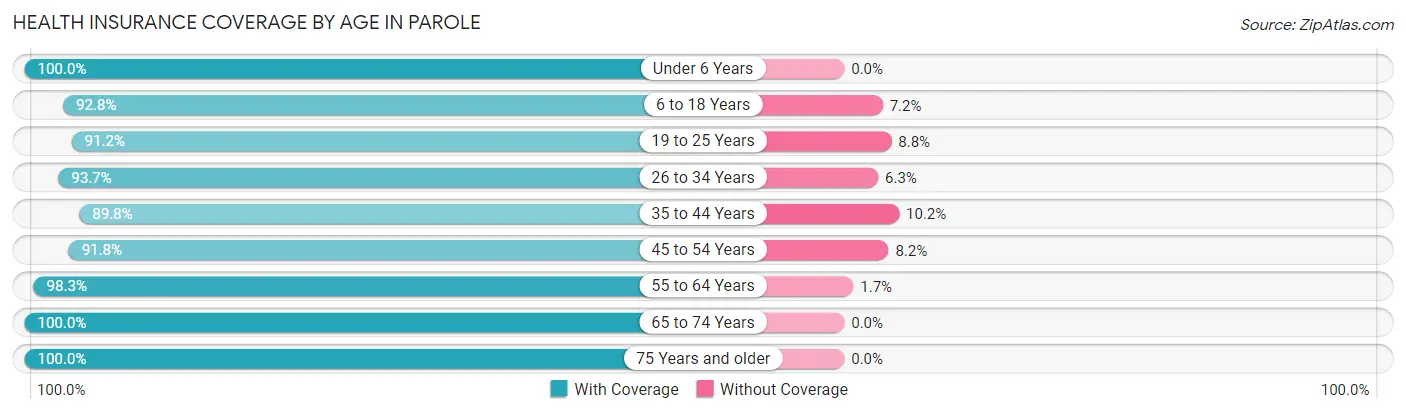
| Age Bracket | With Coverage | Without Coverage |
| Under 6 Years | 621 (100.0%) | 0 (0.0%) |
| 6 to 18 Years | 1,242 (92.8%) | 96 (7.2%) |
| 19 to 25 Years | 1,101 (91.2%) | 106 (8.8%) |
| 26 to 34 Years | 1,889 (93.7%) | 127 (6.3%) |
| 35 to 44 Years | 1,661 (89.8%) | 189 (10.2%) |
| 45 to 54 Years | 2,105 (91.8%) | 189 (8.2%) |
| 55 to 64 Years | 2,445 (98.3%) | 42 (1.7%) |
| 65 to 74 Years | 2,788 (100.0%) | 0 (0.0%) |
| 75 Years and older | 3,171 (100.0%) | 0 (0.0%) |
| Total | 17,023 (95.8%) | 749 (4.2%) |
Health Insurance Coverage by Citizenship Status in Parole
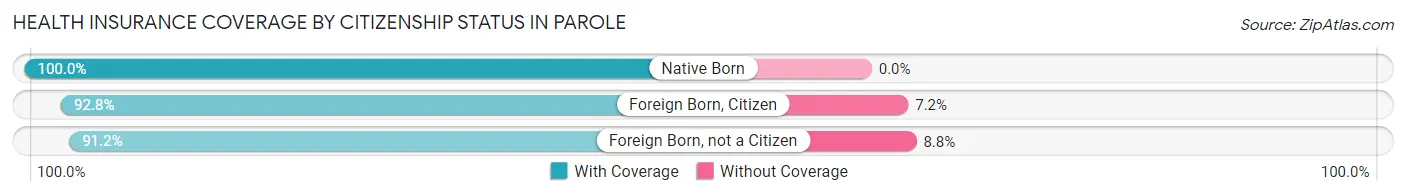
| Citizenship Status | With Coverage | Without Coverage |
| Native Born | 621 (100.0%) | 0 (0.0%) |
| Foreign Born, Citizen | 1,242 (92.8%) | 96 (7.2%) |
| Foreign Born, not a Citizen | 1,101 (91.2%) | 106 (8.8%) |
Health Insurance Coverage by Household Income in Parole
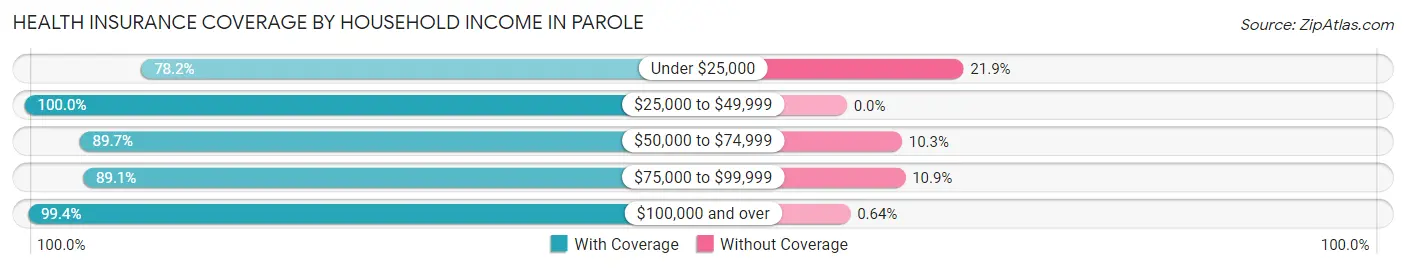
| Household Income | With Coverage | Without Coverage |
| Under $25,000 | 801 (78.1%) | 224 (21.8%) |
| $25,000 to $49,999 | 756 (100.0%) | 0 (0.0%) |
| $50,000 to $74,999 | 1,610 (89.7%) | 185 (10.3%) |
| $75,000 to $99,999 | 2,157 (89.1%) | 265 (10.9%) |
| $100,000 and over | 11,640 (99.4%) | 75 (0.6%) |
Public vs Private Health Insurance Coverage by Age in Parole
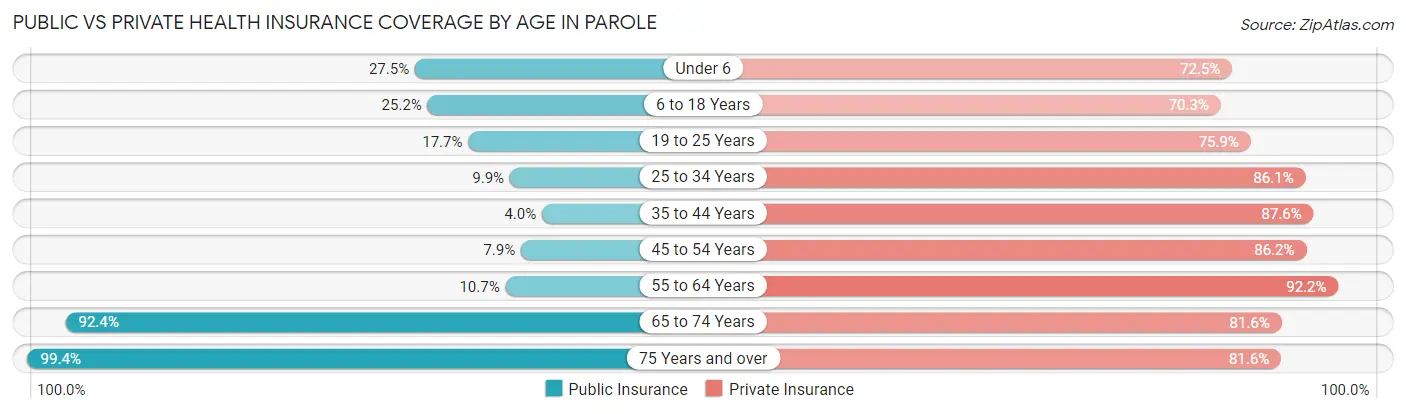
| Age Bracket | Public Insurance | Private Insurance |
| Under 6 | 171 (27.5%) | 450 (72.5%) |
| 6 to 18 Years | 337 (25.2%) | 941 (70.3%) |
| 19 to 25 Years | 213 (17.6%) | 916 (75.9%) |
| 25 to 34 Years | 200 (9.9%) | 1,735 (86.1%) |
| 35 to 44 Years | 73 (4.0%) | 1,620 (87.6%) |
| 45 to 54 Years | 180 (7.9%) | 1,978 (86.2%) |
| 55 to 64 Years | 267 (10.7%) | 2,292 (92.2%) |
| 65 to 74 Years | 2,576 (92.4%) | 2,276 (81.6%) |
| 75 Years and over | 3,153 (99.4%) | 2,586 (81.6%) |
| Total | 7,170 (40.3%) | 14,794 (83.2%) |
Disability Status by Sex by Age in Parole
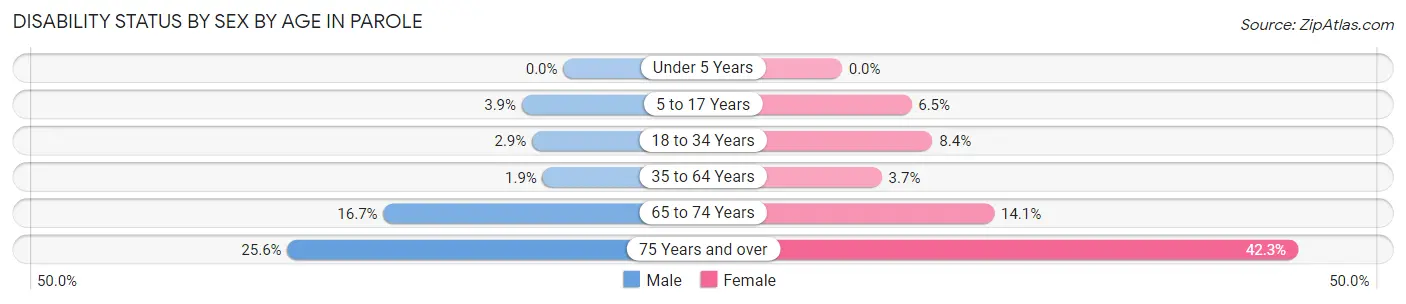
| Age Bracket | Male | Female |
| Under 5 Years | 0 (0.0%) | 0 (0.0%) |
| 5 to 17 Years | 22 (3.8%) | 52 (6.5%) |
| 18 to 34 Years | 52 (2.9%) | 124 (8.4%) |
| 35 to 64 Years | 58 (1.9%) | 134 (3.7%) |
| 65 to 74 Years | 183 (16.7%) | 239 (14.1%) |
| 75 Years and over | 313 (25.6%) | 825 (42.3%) |
Disability Class by Sex by Age in Parole
Disability Class: Hearing Difficulty
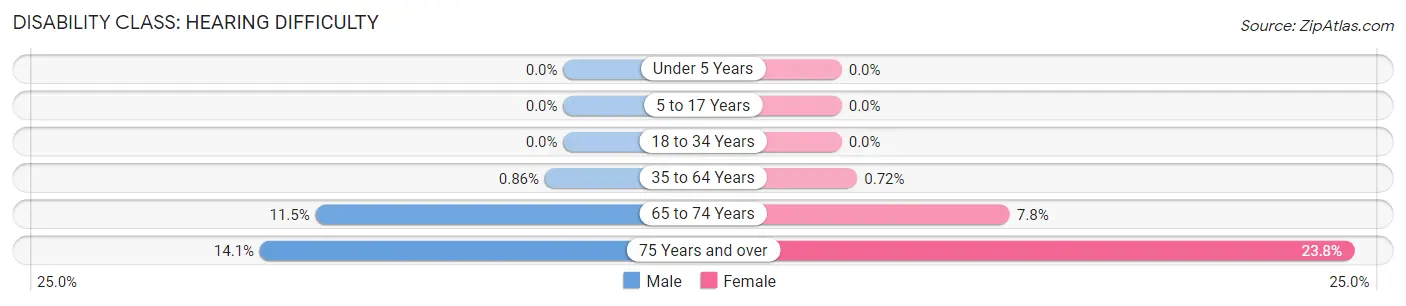
| Age Bracket | Male | Female |
| Under 5 Years | 0 (0.0%) | 0 (0.0%) |
| 5 to 17 Years | 0 (0.0%) | 0 (0.0%) |
| 18 to 34 Years | 0 (0.0%) | 0 (0.0%) |
| 35 to 64 Years | 26 (0.9%) | 26 (0.7%) |
| 65 to 74 Years | 126 (11.5%) | 132 (7.8%) |
| 75 Years and over | 172 (14.1%) | 463 (23.8%) |
Disability Class: Vision Difficulty
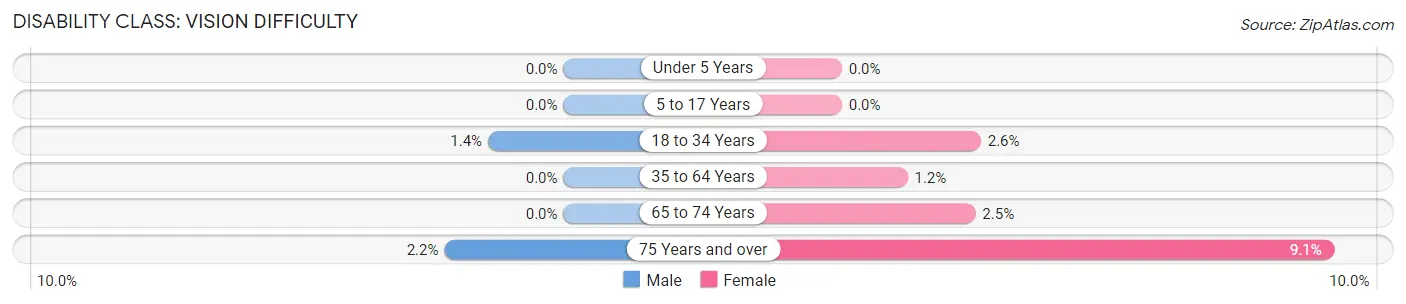
| Age Bracket | Male | Female |
| Under 5 Years | 0 (0.0%) | 0 (0.0%) |
| 5 to 17 Years | 0 (0.0%) | 0 (0.0%) |
| 18 to 34 Years | 25 (1.4%) | 38 (2.6%) |
| 35 to 64 Years | 0 (0.0%) | 44 (1.2%) |
| 65 to 74 Years | 0 (0.0%) | 42 (2.5%) |
| 75 Years and over | 27 (2.2%) | 178 (9.1%) |
Disability Class: Cognitive Difficulty
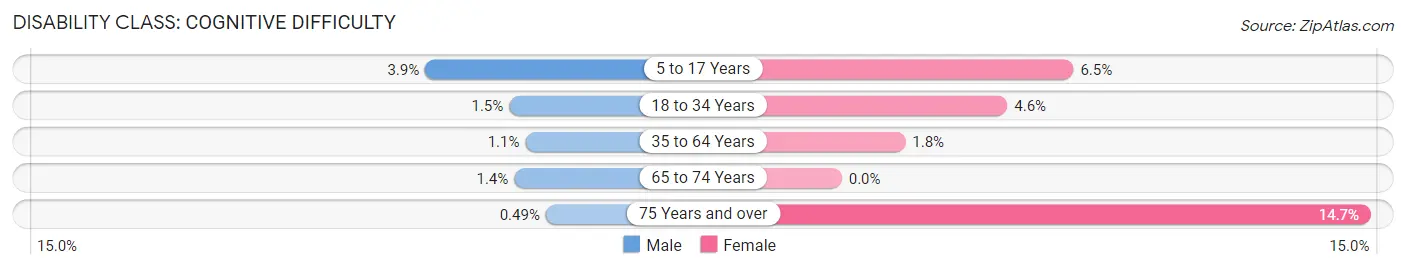
| Age Bracket | Male | Female |
| 5 to 17 Years | 22 (3.8%) | 52 (6.5%) |
| 18 to 34 Years | 27 (1.5%) | 68 (4.6%) |
| 35 to 64 Years | 32 (1.1%) | 64 (1.8%) |
| 65 to 74 Years | 15 (1.4%) | 0 (0.0%) |
| 75 Years and over | 6 (0.5%) | 287 (14.7%) |
Disability Class: Ambulatory Difficulty
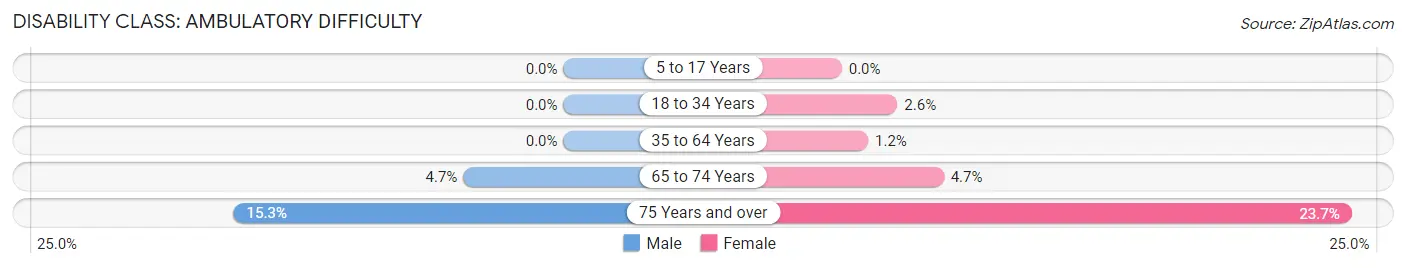
| Age Bracket | Male | Female |
| 5 to 17 Years | 0 (0.0%) | 0 (0.0%) |
| 18 to 34 Years | 0 (0.0%) | 38 (2.6%) |
| 35 to 64 Years | 0 (0.0%) | 44 (1.2%) |
| 65 to 74 Years | 51 (4.6%) | 80 (4.7%) |
| 75 Years and over | 187 (15.3%) | 461 (23.6%) |
Disability Class: Self-Care Difficulty
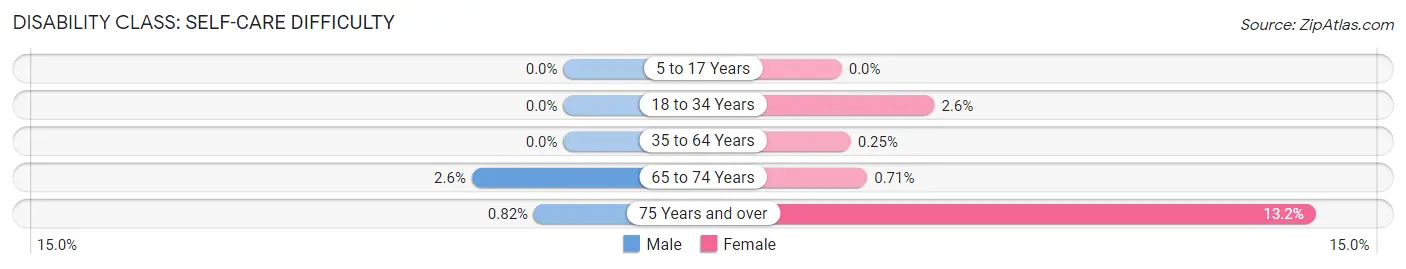
| Age Bracket | Male | Female |
| 5 to 17 Years | 0 (0.0%) | 0 (0.0%) |
| 18 to 34 Years | 0 (0.0%) | 38 (2.6%) |
| 35 to 64 Years | 0 (0.0%) | 9 (0.3%) |
| 65 to 74 Years | 28 (2.5%) | 12 (0.7%) |
| 75 Years and over | 10 (0.8%) | 257 (13.2%) |
Technology Access in Parole
Computing Device Access in Parole
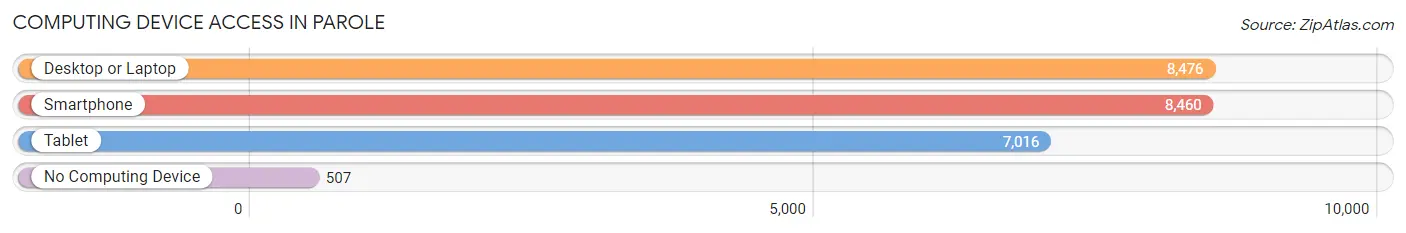
| Device Type | # Households | % Households |
| Desktop or Laptop | 8,476 | 87.4% |
| Smartphone | 8,460 | 87.2% |
| Tablet | 7,016 | 72.3% |
| No Computing Device | 507 | 5.2% |
| Total | 9,704 | 100.0% |
Internet Access in Parole
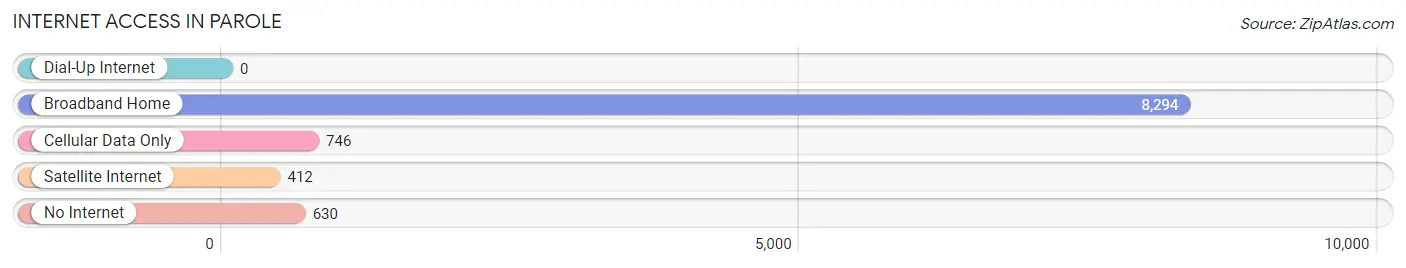
| Internet Type | # Households | % Households |
| Dial-Up Internet | 0 | 0.0% |
| Broadband Home | 8,294 | 85.5% |
| Cellular Data Only | 746 | 7.7% |
| Satellite Internet | 412 | 4.3% |
| No Internet | 630 | 6.5% |
| Total | 9,704 | 100.0% |
Parole Summary
Parole is an unincorporated community located in Anne Arundel County, Maryland. It is located just north of Annapolis, the state capital, and is part of the Baltimore-Washington metropolitan area. The community is bordered by the Severn River to the east, the Chesapeake Bay to the south, and the Patuxent River to the west.
History
Parole was first settled in the early 1700s by English colonists. The area was originally known as “The Parole”, which was derived from the French phrase “parole de guerre”, meaning “word of war”. The name was likely given to the area due to its proximity to the British fortifications at Annapolis.
In the late 1700s, the area was home to a large number of tobacco plantations. The plantations were owned by wealthy families, such as the Ridouts, the Hammonds, and the Carters. The plantations were worked by enslaved African Americans, and the area was known for its large slave population.
In the early 1800s, the area was home to a number of shipbuilding yards. The yards were used to build ships for the War of 1812, and the area was known for its skilled shipwrights.
In the late 1800s, the area was home to a number of large estates. The estates were owned by wealthy families, such as the Ridouts, the Hammonds, and the Carters. The estates were used for leisure activities, such as horse racing and fox hunting.
In the early 1900s, the area was home to a number of large farms. The farms were used to grow tobacco, corn, and other crops. The area was also home to a number of small businesses, such as general stores and blacksmiths.
In the mid-1900s, the area was home to a number of large housing developments. The developments were built to accommodate the growing population of the area.
Geography
Parole is located in Anne Arundel County, Maryland. It is located just north of Annapolis, the state capital, and is part of the Baltimore-Washington metropolitan area. The community is bordered by the Severn River to the east, the Chesapeake Bay to the south, and the Patuxent River to the west.
The area is mostly flat, with some rolling hills. The climate is humid subtropical, with hot, humid summers and mild winters. The average annual temperature is around 60 degrees Fahrenheit.
Economy
Parole is home to a number of businesses, including retail stores, restaurants, and professional services. The area is also home to a number of government offices, including the Anne Arundel County Courthouse and the Maryland State Police Barracks.
The area is also home to a number of large employers, such as the Anne Arundel Medical Center, the University of Maryland Medical Center, and the Naval Academy.
Demographics
As of the 2010 census, the population of Parole was 8,945. The racial makeup of the area was 79.3% White, 11.3% African American, 4.2% Asian, and 4.2% Hispanic or Latino.
The median household income in Parole was $68,945, and the median family income was $77,945. The per capita income was $30,945.
Parole is home to a number of churches, including the Church of the Redeemer, the Church of the Ascension, and the Church of the Good Shepherd. The area is also home to a number of schools, including the Parole Elementary School, the Parole Middle School, and the Parole High School.
Common Questions
What is Per Capita Income in Parole?
Per Capita income in Parole is $89,110.
What is the Median Family Income in Parole?
Median Family Income in Parole is $156,019.
What is the Median Household income in Parole?
Median Household Income in Parole is $117,646.
What is Income or Wage Gap in Parole?
Income or Wage Gap in Parole is 29.8%.
Women in Parole earn 70.2 cents for every dollar earned by a man.
What is Inequality or Gini Index in Parole?
Inequality or Gini Index in Parole is 0.47.
What is the Total Population of Parole?
Total Population of Parole is 18,527.
What is the Total Male Population of Parole?
Total Male Population of Parole is 8,507.
What is the Total Female Population of Parole?
Total Female Population of Parole is 10,020.
What is the Ratio of Males per 100 Females in Parole?
There are 84.90 Males per 100 Females in Parole.
What is the Ratio of Females per 100 Males in Parole?
There are 117.79 Females per 100 Males in Parole.
What is the Median Population Age in Parole?
Median Population Age in Parole is 53.2 Years.
What is the Average Family Size in Parole
Average Family Size in Parole is 2.5 People.
What is the Average Household Size in Parole
Average Household Size in Parole is 1.8 People.
How Large is the Labor Force in Parole?
There are 9,976 People in the Labor Forcein in Parole.
What is the Percentage of People in the Labor Force in Parole?
59.2% of People are in the Labor Force in Parole.
What is the Unemployment Rate in Parole?
Unemployment Rate in Parole is 3.0%.