Arbutus, MD Map & Demographics
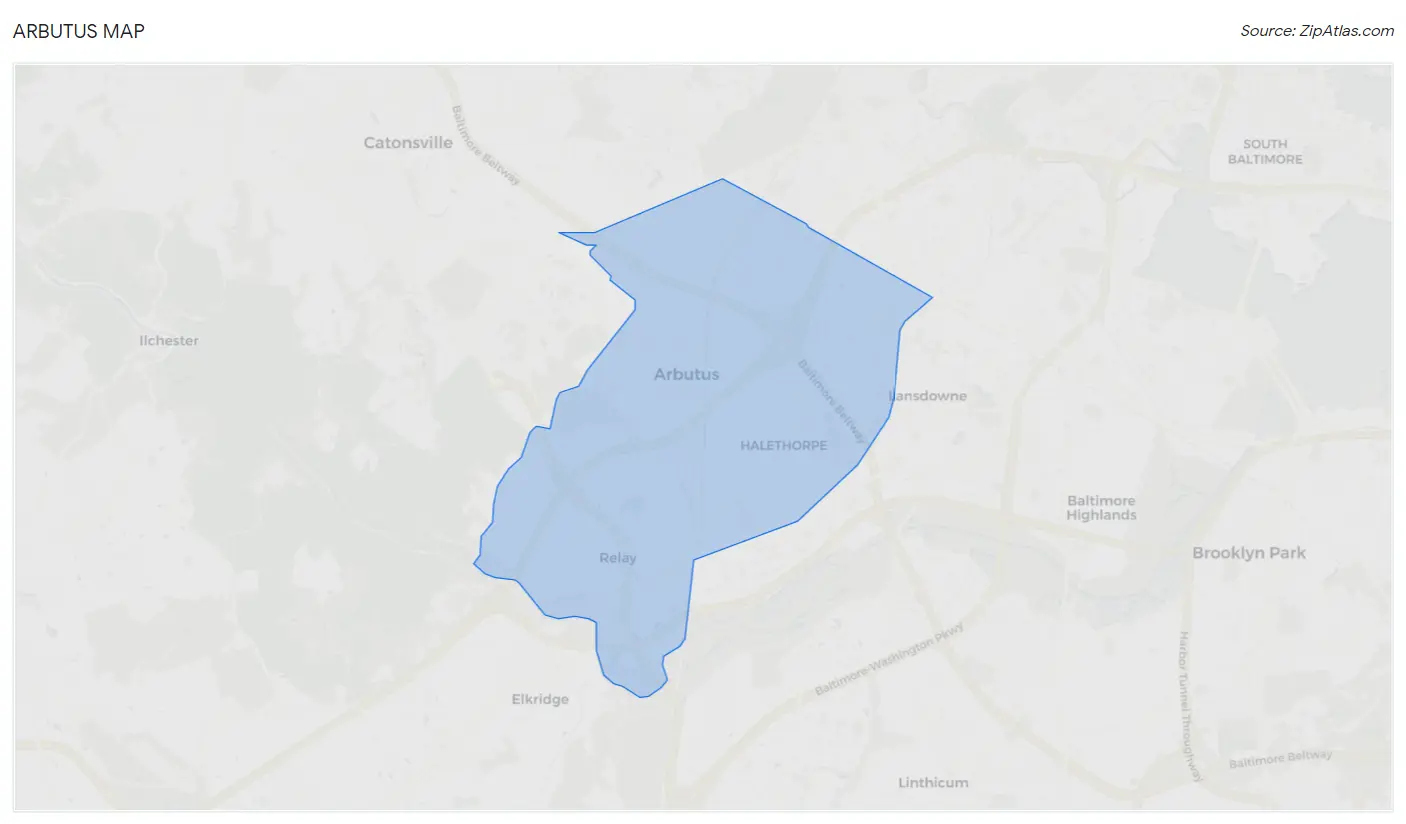
Arbutus Map
Arbutus Overview
$47,163
PER CAPITA INCOME
$132,377
AVG FAMILY INCOME
$98,886
AVG HOUSEHOLD INCOME
20.3%
WAGE / INCOME GAP [ % ]
79.7¢/ $1
WAGE / INCOME GAP [ $ ]
$13,331
FAMILY INCOME DEFICIT
0.41
INEQUALITY / GINI INDEX
20,135
TOTAL POPULATION
10,417
MALE POPULATION
9,718
FEMALE POPULATION
107.19
MALES / 100 FEMALES
93.29
FEMALES / 100 MALES
37.1
MEDIAN AGE
3.2
AVG FAMILY SIZE
2.5
AVG HOUSEHOLD SIZE
11,896
LABOR FORCE [ PEOPLE ]
71.9%
PERCENT IN LABOR FORCE
6.1%
UNEMPLOYMENT RATE
Income in Arbutus
Income Overview in Arbutus
Per Capita Income in Arbutus is $47,163, while median incomes of families and households are $132,377 and $98,886 respectively.
| Characteristic | Number | Measure |
| Per Capita Income | 20,135 | $47,163 |
| Median Family Income | 4,915 | $132,377 |
| Mean Family Income | 4,915 | $134,651 |
| Median Household Income | 7,976 | $98,886 |
| Mean Household Income | 7,976 | $116,773 |
| Income Deficit | 4,915 | $13,331 |
| Wage / Income Gap (%) | 20,135 | 20.29% |
| Wage / Income Gap ($) | 20,135 | 79.71¢ per $1 |
| Gini / Inequality Index | 20,135 | 0.41 |
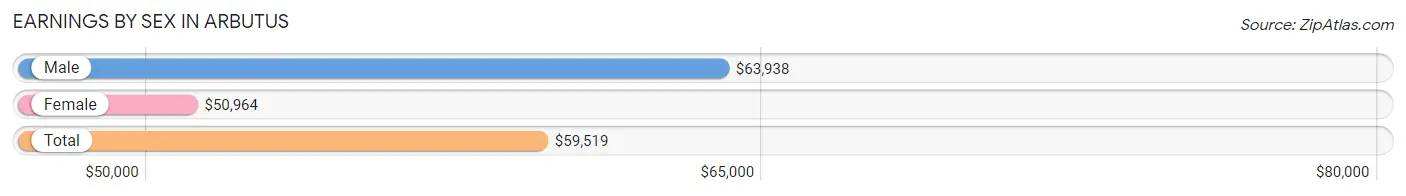
Earnings by Sex in Arbutus
Average Earnings in Arbutus are $59,519, $63,938 for men and $50,964 for women, a difference of 20.3%.
| Sex | Number | Average Earnings |
| Male | 6,561 (53.5%) | $63,938 |
| Female | 5,696 (46.5%) | $50,964 |
| Total | 12,257 (100.0%) | $59,519 |
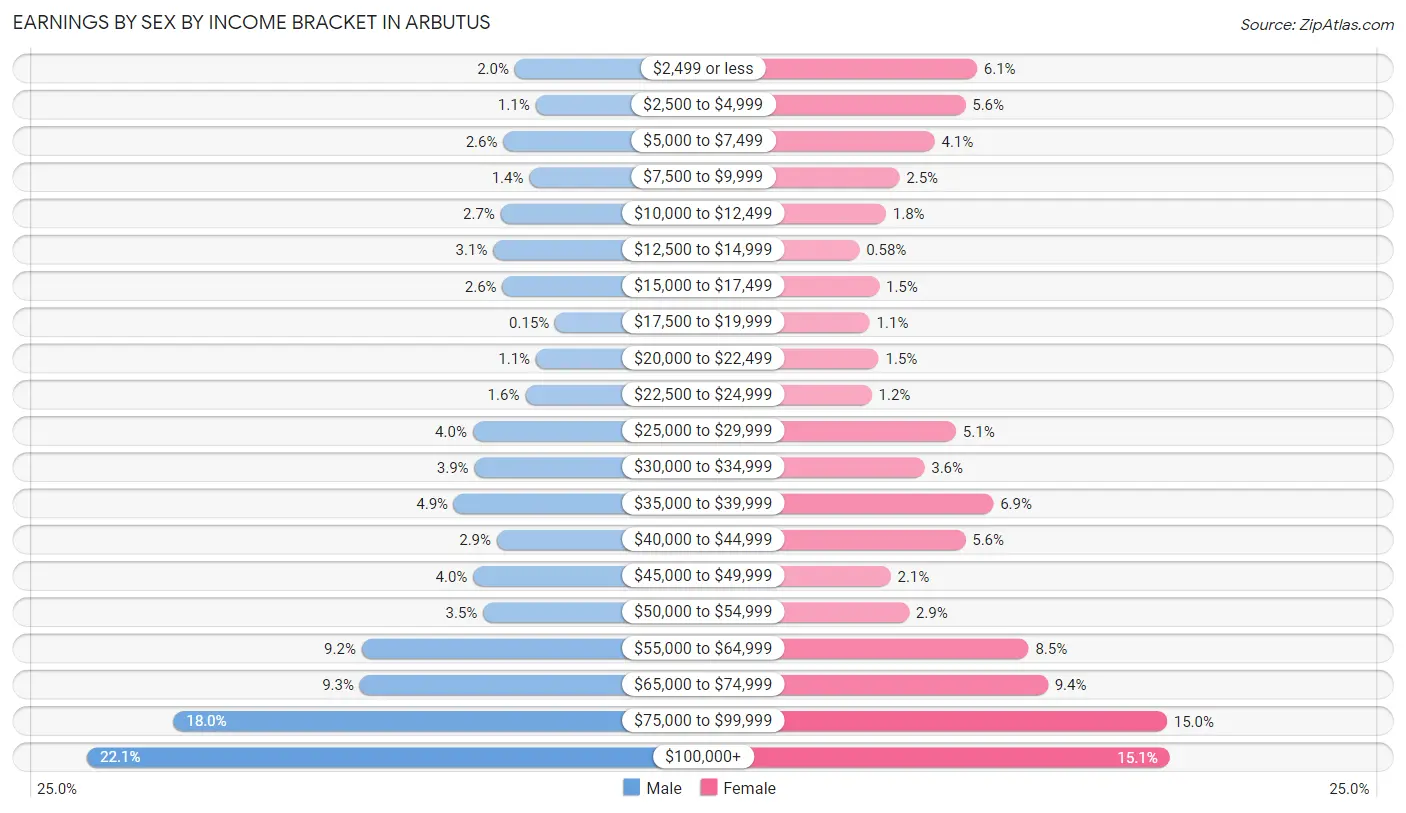
Earnings by Sex by Income Bracket in Arbutus
The most common earnings brackets in Arbutus are $100,000+ for men (1,448 | 22.1%) and $100,000+ for women (861 | 15.1%).
| Income | Male | Female |
| $2,499 or less | 134 (2.0%) | 347 (6.1%) |
| $2,500 to $4,999 | 70 (1.1%) | 316 (5.6%) |
| $5,000 to $7,499 | 169 (2.6%) | 234 (4.1%) |
| $7,500 to $9,999 | 89 (1.4%) | 140 (2.5%) |
| $10,000 to $12,499 | 177 (2.7%) | 104 (1.8%) |
| $12,500 to $14,999 | 200 (3.0%) | 33 (0.6%) |
| $15,000 to $17,499 | 172 (2.6%) | 86 (1.5%) |
| $17,500 to $19,999 | 10 (0.2%) | 61 (1.1%) |
| $20,000 to $22,499 | 69 (1.1%) | 85 (1.5%) |
| $22,500 to $24,999 | 102 (1.5%) | 66 (1.2%) |
| $25,000 to $29,999 | 263 (4.0%) | 291 (5.1%) |
| $30,000 to $34,999 | 258 (3.9%) | 207 (3.6%) |
| $35,000 to $39,999 | 321 (4.9%) | 391 (6.9%) |
| $40,000 to $44,999 | 189 (2.9%) | 316 (5.6%) |
| $45,000 to $49,999 | 262 (4.0%) | 117 (2.1%) |
| $50,000 to $54,999 | 231 (3.5%) | 166 (2.9%) |
| $55,000 to $64,999 | 604 (9.2%) | 485 (8.5%) |
| $65,000 to $74,999 | 610 (9.3%) | 536 (9.4%) |
| $75,000 to $99,999 | 1,183 (18.0%) | 854 (15.0%) |
| $100,000+ | 1,448 (22.1%) | 861 (15.1%) |
| Total | 6,561 (100.0%) | 5,696 (100.0%) |
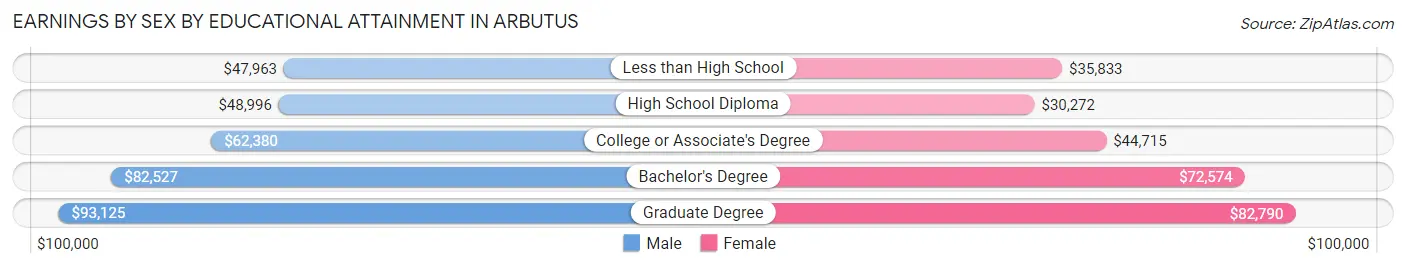
Earnings by Sex by Educational Attainment in Arbutus
Average earnings in Arbutus are $69,559 for men and $59,830 for women, a difference of 14.0%. Men with an educational attainment of graduate degree enjoy the highest average annual earnings of $93,125, while those with less than high school education earn the least with $47,963. Women with an educational attainment of graduate degree earn the most with the average annual earnings of $82,790, while those with high school diploma education have the smallest earnings of $30,272.
| Educational Attainment | Male Income | Female Income |
| Less than High School | $47,963 | $35,833 |
| High School Diploma | $48,996 | $30,272 |
| College or Associate's Degree | $62,380 | $44,715 |
| Bachelor's Degree | $82,527 | $72,574 |
| Graduate Degree | $93,125 | $82,790 |
| Total | $69,559 | $59,830 |
Family Income in Arbutus
Family Income Brackets in Arbutus
According to the Arbutus family income data, there are 1,219 families falling into the $100,000 to $149,999 income range, which is the most common income bracket and makes up 24.8% of all families. Conversely, the $10,000 to $14,999 income bracket is the least frequent group with only 44 families (0.9%) belonging to this category.
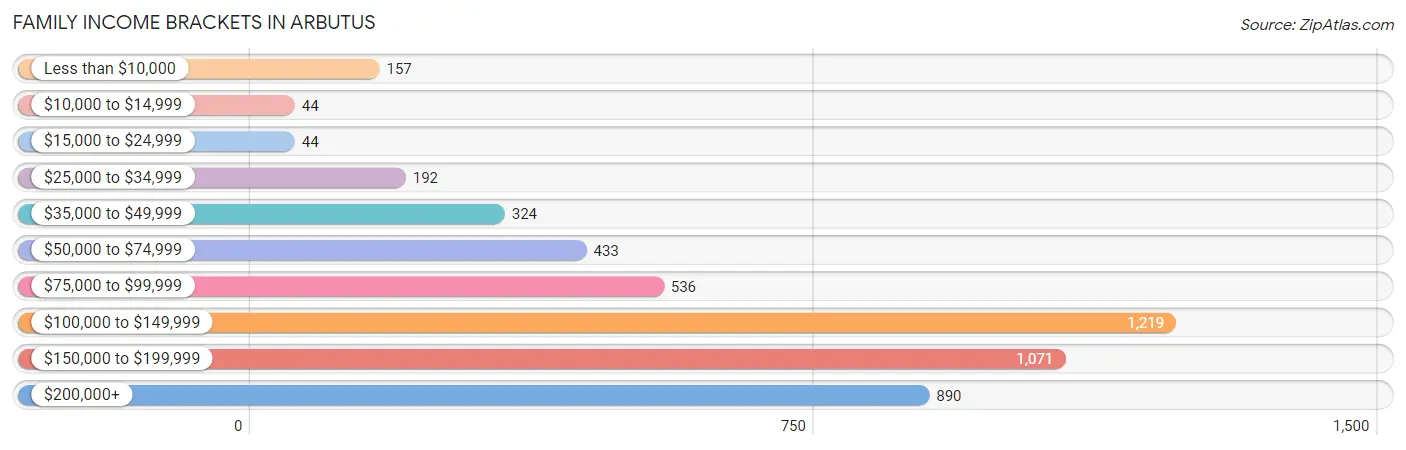
| Income Bracket | # Families | % Families |
| Less than $10,000 | 157 | 3.2% |
| $10,000 to $14,999 | 44 | 0.9% |
| $15,000 to $24,999 | 44 | 0.9% |
| $25,000 to $34,999 | 192 | 3.9% |
| $35,000 to $49,999 | 324 | 6.6% |
| $50,000 to $74,999 | 433 | 8.8% |
| $75,000 to $99,999 | 536 | 10.9% |
| $100,000 to $149,999 | 1,219 | 24.8% |
| $150,000 to $199,999 | 1,071 | 21.8% |
| $200,000+ | 890 | 18.1% |
Family Income by Famaliy Size in Arbutus
5-person families (493 | 10.0%) account for the highest median family income in Arbutus with $174,116 per family, while 2-person families (2,039 | 41.5%) have the highest median income of $64,764 per family member.
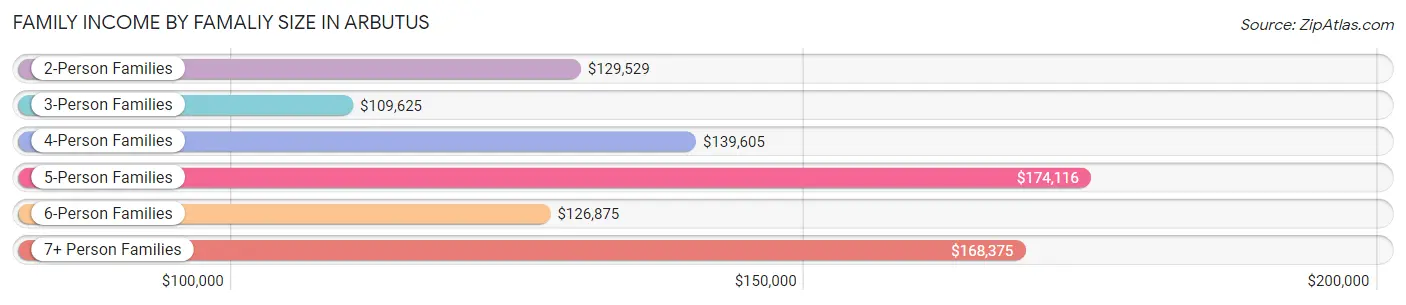
| Income Bracket | # Families | Median Income |
| 2-Person Families | 2,039 (41.5%) | $129,529 |
| 3-Person Families | 1,345 (27.4%) | $109,625 |
| 4-Person Families | 842 (17.1%) | $139,605 |
| 5-Person Families | 493 (10.0%) | $174,116 |
| 6-Person Families | 144 (2.9%) | $126,875 |
| 7+ Person Families | 52 (1.1%) | $168,375 |
| Total | 4,915 (100.0%) | $132,377 |
Family Income by Number of Earners in Arbutus
The median family income in Arbutus is $132,377, with families comprising 3+ earners (780) having the highest median family income of $168,813, while families with no earners (398) have the lowest median family income of $40,625, accounting for 15.9% and 8.1% of families, respectively.
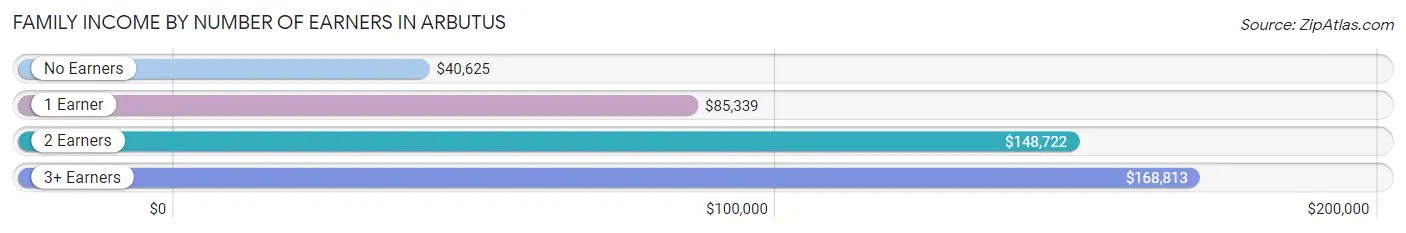
| Number of Earners | # Families | Median Income |
| No Earners | 398 (8.1%) | $40,625 |
| 1 Earner | 1,151 (23.4%) | $85,339 |
| 2 Earners | 2,586 (52.6%) | $148,722 |
| 3+ Earners | 780 (15.9%) | $168,813 |
| Total | 4,915 (100.0%) | $132,377 |
Household Income in Arbutus
Household Income Brackets in Arbutus
With 1,611 households falling in the category, the $100,000 to $149,999 income range is the most frequent in Arbutus, accounting for 20.2% of all households. In contrast, only 223 households (2.8%) fall into the $10,000 to $14,999 income bracket, making it the least populous group.
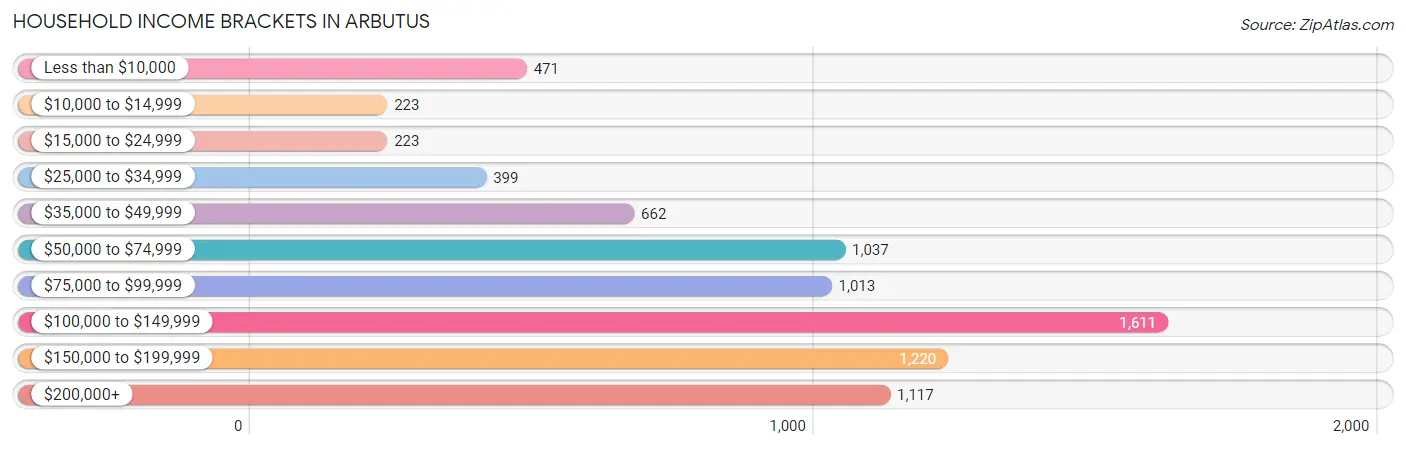
| Income Bracket | # Households | % Households |
| Less than $10,000 | 471 | 5.9% |
| $10,000 to $14,999 | 223 | 2.8% |
| $15,000 to $24,999 | 223 | 2.8% |
| $25,000 to $34,999 | 399 | 5.0% |
| $35,000 to $49,999 | 662 | 8.3% |
| $50,000 to $74,999 | 1,037 | 13.0% |
| $75,000 to $99,999 | 1,013 | 12.7% |
| $100,000 to $149,999 | 1,611 | 20.2% |
| $150,000 to $199,999 | 1,220 | 15.3% |
| $200,000+ | 1,117 | 14.0% |
Household Income by Householder Age in Arbutus
The median household income in Arbutus is $98,886, with the highest median household income of $121,101 found in the 45 to 64 years age bracket for the primary householder. A total of 2,615 households (32.8%) fall into this category. Meanwhile, the 15 to 24 years age bracket for the primary householder has the lowest median household income of $50,583, with 281 households (3.5%) in this group.
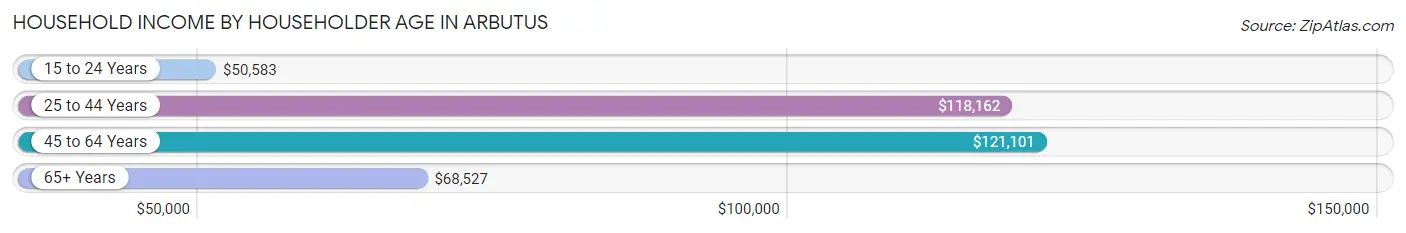
| Income Bracket | # Households | Median Income |
| 15 to 24 Years | 281 (3.5%) | $50,583 |
| 25 to 44 Years | 3,453 (43.3%) | $118,162 |
| 45 to 64 Years | 2,615 (32.8%) | $121,101 |
| 65+ Years | 1,627 (20.4%) | $68,527 |
| Total | 7,976 (100.0%) | $98,886 |
Poverty in Arbutus
Income Below Poverty by Sex and Age in Arbutus
With 8.1% poverty level for males and 8.5% for females among the residents of Arbutus, 55 to 64 year old males and 18 to 24 year old females are the most vulnerable to poverty, with 211 males (15.5%) and 110 females (12.9%) in their respective age groups living below the poverty level.
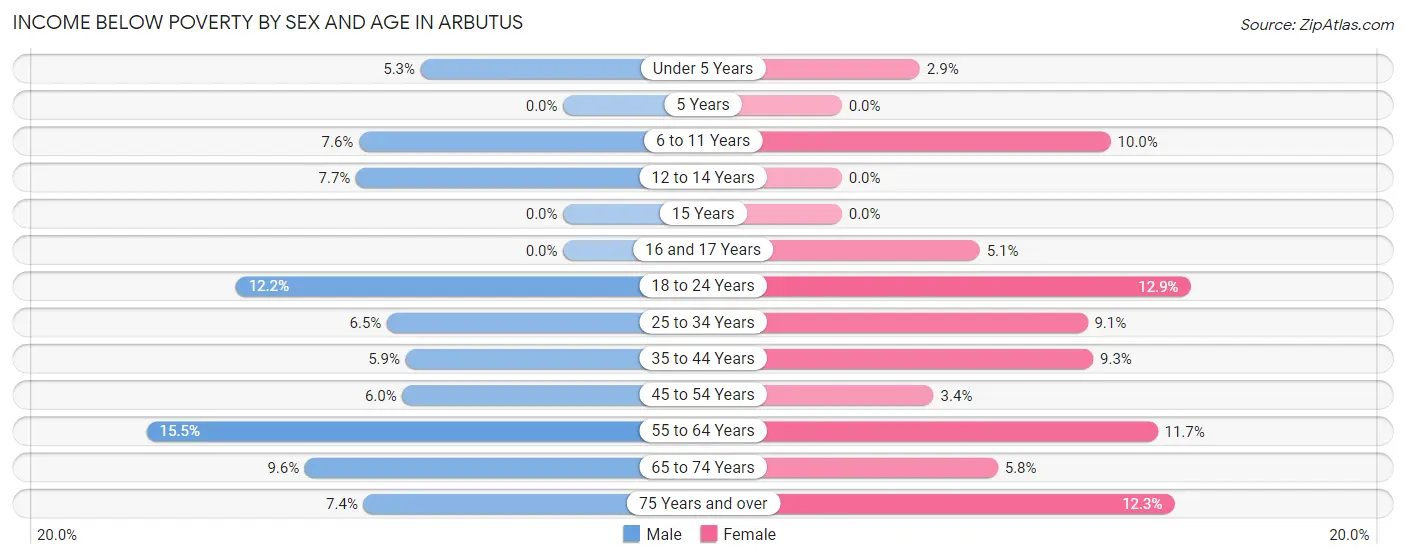
| Age Bracket | Male | Female |
| Under 5 Years | 32 (5.3%) | 21 (2.9%) |
| 5 Years | 0 (0.0%) | 0 (0.0%) |
| 6 to 11 Years | 61 (7.6%) | 64 (10.0%) |
| 12 to 14 Years | 25 (7.7%) | 0 (0.0%) |
| 15 Years | 0 (0.0%) | 0 (0.0%) |
| 16 and 17 Years | 0 (0.0%) | 11 (5.1%) |
| 18 to 24 Years | 111 (12.2%) | 110 (12.9%) |
| 25 to 34 Years | 124 (6.5%) | 137 (9.1%) |
| 35 to 44 Years | 102 (5.9%) | 153 (9.3%) |
| 45 to 54 Years | 76 (6.0%) | 34 (3.4%) |
| 55 to 64 Years | 211 (15.5%) | 163 (11.7%) |
| 65 to 74 Years | 66 (9.6%) | 51 (5.8%) |
| 75 Years and over | 22 (7.4%) | 79 (12.3%) |
| Total | 830 (8.1%) | 823 (8.5%) |
Income Above Poverty by Sex and Age in Arbutus
According to the poverty statistics in Arbutus, males aged 5 years and females aged 5 years are the age groups that are most secure financially, with 100.0% of males and 100.0% of females in these age groups living above the poverty line.
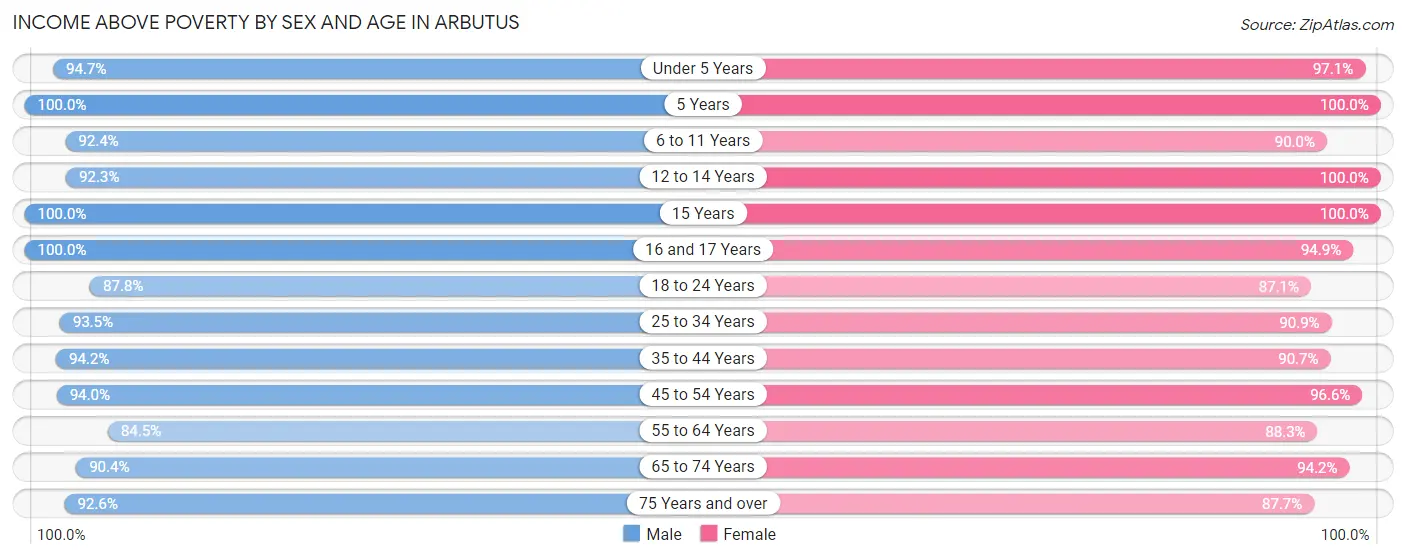
| Age Bracket | Male | Female |
| Under 5 Years | 573 (94.7%) | 704 (97.1%) |
| 5 Years | 83 (100.0%) | 87 (100.0%) |
| 6 to 11 Years | 744 (92.4%) | 577 (90.0%) |
| 12 to 14 Years | 300 (92.3%) | 94 (100.0%) |
| 15 Years | 62 (100.0%) | 34 (100.0%) |
| 16 and 17 Years | 246 (100.0%) | 204 (94.9%) |
| 18 to 24 Years | 802 (87.8%) | 740 (87.1%) |
| 25 to 34 Years | 1,772 (93.5%) | 1,365 (90.9%) |
| 35 to 44 Years | 1,642 (94.2%) | 1,487 (90.7%) |
| 45 to 54 Years | 1,196 (94.0%) | 962 (96.6%) |
| 55 to 64 Years | 1,153 (84.5%) | 1,228 (88.3%) |
| 65 to 74 Years | 622 (90.4%) | 830 (94.2%) |
| 75 Years and over | 275 (92.6%) | 561 (87.7%) |
| Total | 9,470 (91.9%) | 8,873 (91.5%) |
Income Below Poverty Among Married-Couple Families in Arbutus
The poverty statistics for married-couple families in Arbutus show that 2.5% or 95 of the total 3,815 families live below the poverty line. Families with 3 or 4 children have the highest poverty rate of 3.5%, comprising of 13 families. On the other hand, families with 5 or more children have the lowest poverty rate of 0.0%, which includes 0 families.
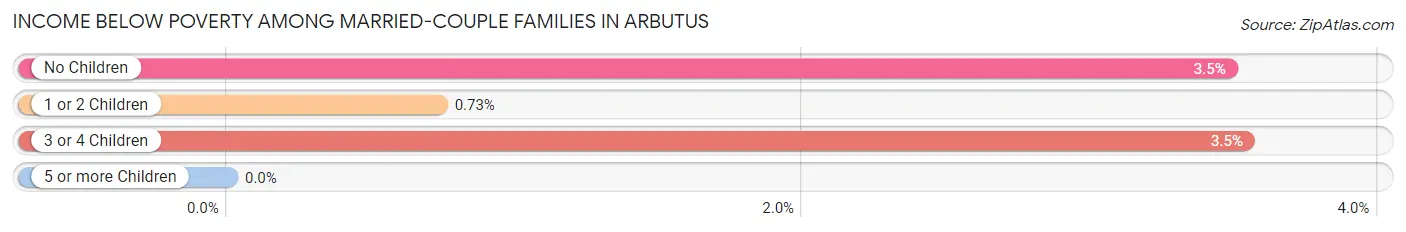
| Children | Above Poverty | Below Poverty |
| No Children | 1,994 (96.5%) | 72 (3.5%) |
| 1 or 2 Children | 1,361 (99.3%) | 10 (0.7%) |
| 3 or 4 Children | 354 (96.5%) | 13 (3.5%) |
| 5 or more Children | 11 (100.0%) | 0 (0.0%) |
| Total | 3,720 (97.5%) | 95 (2.5%) |
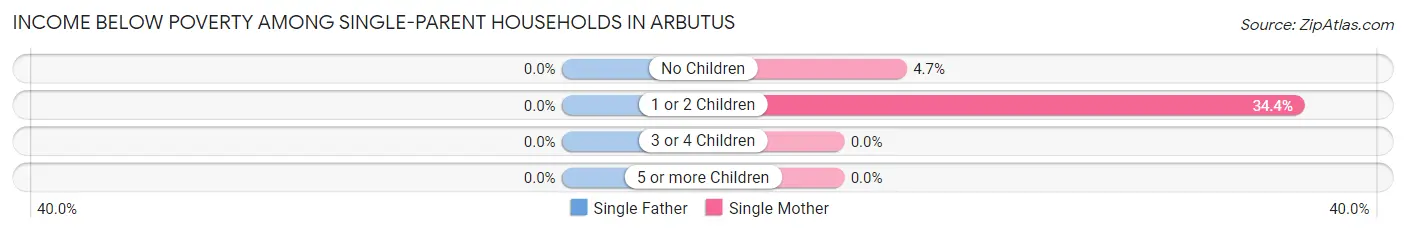
Income Below Poverty Among Single-Parent Households in Arbutus
| Children | Single Father | Single Mother |
| No Children | 0 (0.0%) | 15 (4.7%) |
| 1 or 2 Children | 0 (0.0%) | 135 (34.4%) |
| 3 or 4 Children | 0 (0.0%) | 0 (0.0%) |
| 5 or more Children | 0 (0.0%) | 0 (0.0%) |
| Total | 0 (0.0%) | 150 (20.5%) |
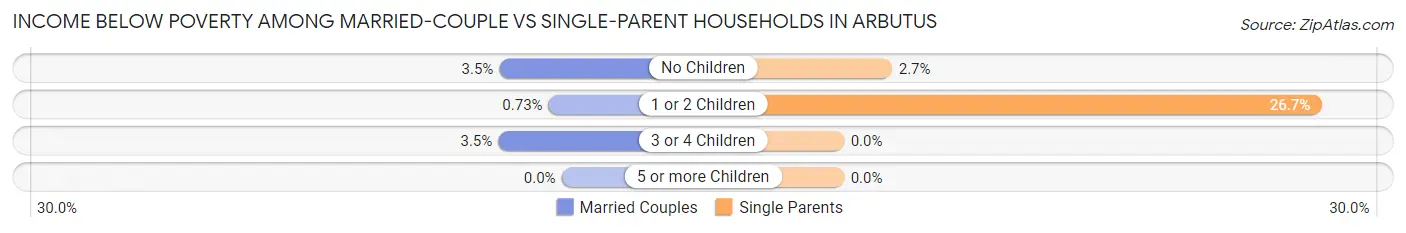
Income Below Poverty Among Married-Couple vs Single-Parent Households in Arbutus
The poverty data for Arbutus shows that 95 of the married-couple family households (2.5%) and 150 of the single-parent households (13.6%) are living below the poverty level. Within the married-couple family households, those with 3 or 4 children have the highest poverty rate, with 13 households (3.5%) falling below the poverty line. Among the single-parent households, those with 1 or 2 children have the highest poverty rate, with 135 household (26.7%) living below poverty.
| Children | Married-Couple Families | Single-Parent Households |
| No Children | 72 (3.5%) | 15 (2.7%) |
| 1 or 2 Children | 10 (0.7%) | 135 (26.7%) |
| 3 or 4 Children | 13 (3.5%) | 0 (0.0%) |
| 5 or more Children | 0 (0.0%) | 0 (0.0%) |
| Total | 95 (2.5%) | 150 (13.6%) |
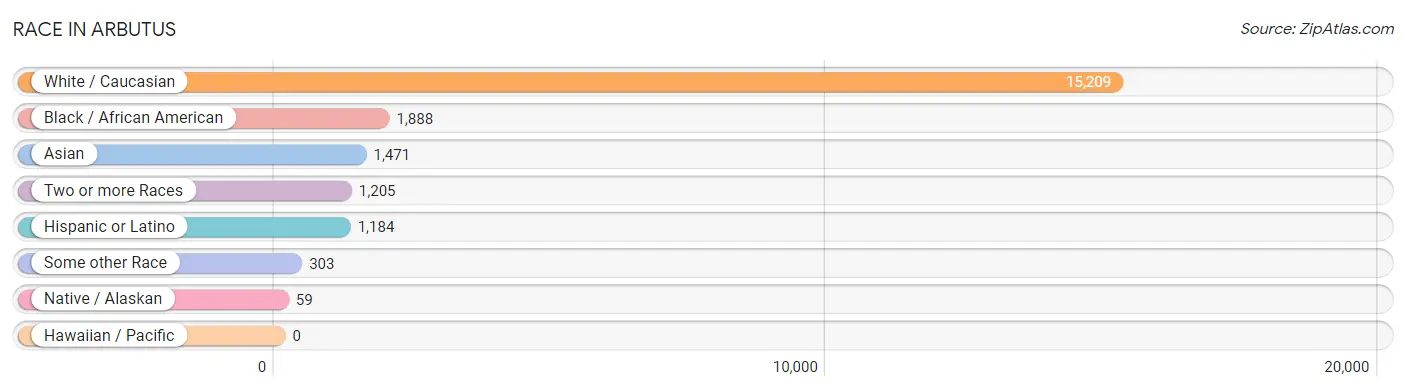
Race in Arbutus
The most populous races in Arbutus are White / Caucasian (15,209 | 75.5%), Black / African American (1,888 | 9.4%), and Asian (1,471 | 7.3%).
| Race | # Population | % Population |
| Asian | 1,471 | 7.3% |
| Black / African American | 1,888 | 9.4% |
| Hawaiian / Pacific | 0 | 0.0% |
| Hispanic or Latino | 1,184 | 5.9% |
| Native / Alaskan | 59 | 0.3% |
| White / Caucasian | 15,209 | 75.5% |
| Two or more Races | 1,205 | 6.0% |
| Some other Race | 303 | 1.5% |
| Total | 20,135 | 100.0% |
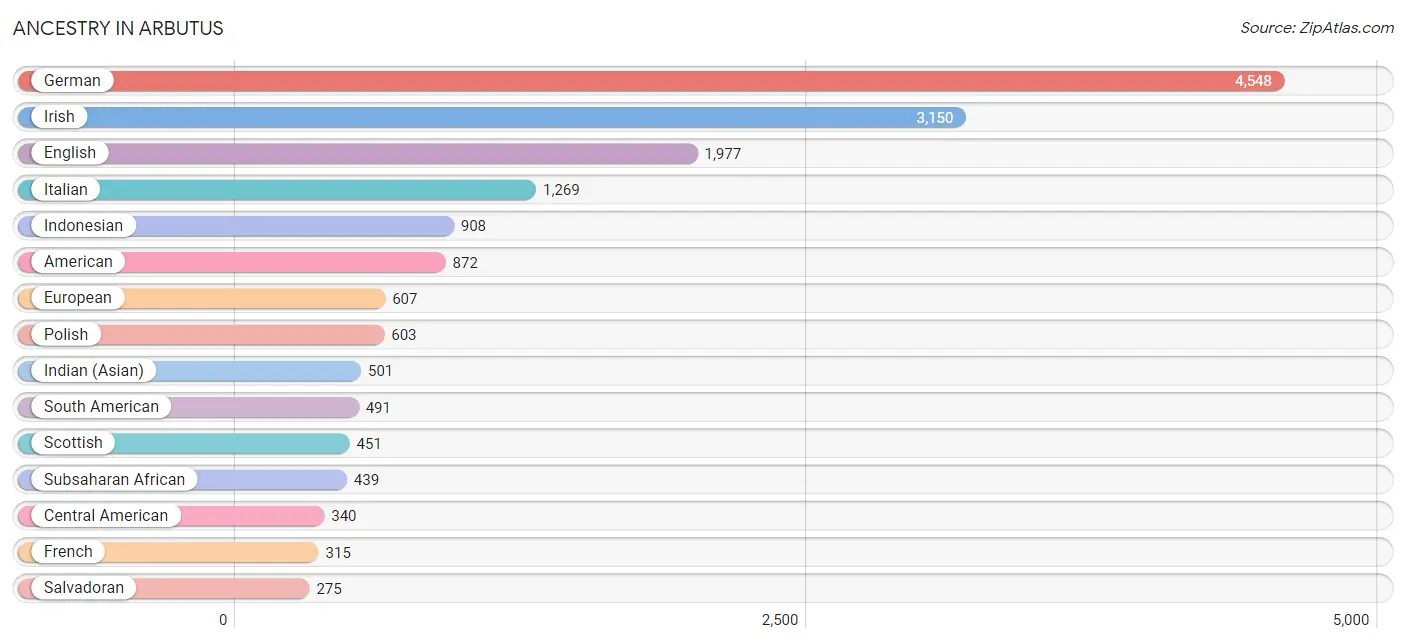
Ancestry in Arbutus
The most populous ancestries reported in Arbutus are German (4,548 | 22.6%), Irish (3,150 | 15.6%), English (1,977 | 9.8%), Italian (1,269 | 6.3%), and Indonesian (908 | 4.5%), together accounting for 58.9% of all Arbutus residents.
| Ancestry | # Population | % Population |
| African | 186 | 0.9% |
| American | 872 | 4.3% |
| Austrian | 27 | 0.1% |
| Belizean | 3 | 0.0% |
| Bhutanese | 9 | 0.0% |
| Bolivian | 149 | 0.7% |
| British | 66 | 0.3% |
| Burmese | 64 | 0.3% |
| Canadian | 37 | 0.2% |
| Central American | 340 | 1.7% |
| Central American Indian | 17 | 0.1% |
| Cherokee | 18 | 0.1% |
| Chilean | 25 | 0.1% |
| Colombian | 196 | 1.0% |
| Costa Rican | 4 | 0.0% |
| Cuban | 5 | 0.0% |
| Czech | 50 | 0.3% |
| Czechoslovakian | 24 | 0.1% |
| Danish | 52 | 0.3% |
| Dominican | 49 | 0.2% |
| Dutch | 223 | 1.1% |
| Eastern European | 79 | 0.4% |
| English | 1,977 | 9.8% |
| Ethiopian | 84 | 0.4% |
| European | 607 | 3.0% |
| French | 315 | 1.6% |
| French Canadian | 149 | 0.7% |
| German | 4,548 | 22.6% |
| Ghanaian | 96 | 0.5% |
| Greek | 114 | 0.6% |
| Guatemalan | 22 | 0.1% |
| Honduran | 39 | 0.2% |
| Hungarian | 56 | 0.3% |
| Indian (Asian) | 501 | 2.5% |
| Indonesian | 908 | 4.5% |
| Iranian | 62 | 0.3% |
| Irish | 3,150 | 15.6% |
| Iroquois | 5 | 0.0% |
| Italian | 1,269 | 6.3% |
| Jamaican | 10 | 0.1% |
| Korean | 154 | 0.8% |
| Lithuanian | 119 | 0.6% |
| Mexican | 35 | 0.2% |
| Native Hawaiian | 100 | 0.5% |
| Northern European | 8 | 0.0% |
| Norwegian | 34 | 0.2% |
| Polish | 603 | 3.0% |
| Portuguese | 9 | 0.0% |
| Puerto Rican | 242 | 1.2% |
| Russian | 243 | 1.2% |
| Salvadoran | 275 | 1.4% |
| Scotch-Irish | 230 | 1.1% |
| Scottish | 451 | 2.2% |
| Serbian | 9 | 0.0% |
| Slavic | 74 | 0.4% |
| Slovak | 10 | 0.1% |
| Slovene | 6 | 0.0% |
| South American | 491 | 2.4% |
| South American Indian | 149 | 0.7% |
| Spaniard | 18 | 0.1% |
| Sri Lankan | 10 | 0.1% |
| Subsaharan African | 439 | 2.2% |
| Swedish | 108 | 0.5% |
| Swiss | 27 | 0.1% |
| Thai | 238 | 1.2% |
| Trinidadian and Tobagonian | 121 | 0.6% |
| Ugandan | 3 | 0.0% |
| Ukrainian | 103 | 0.5% |
| Venezuelan | 121 | 0.6% |
| Welsh | 77 | 0.4% |
| West Indian | 5 | 0.0% | View All 71 Rows |
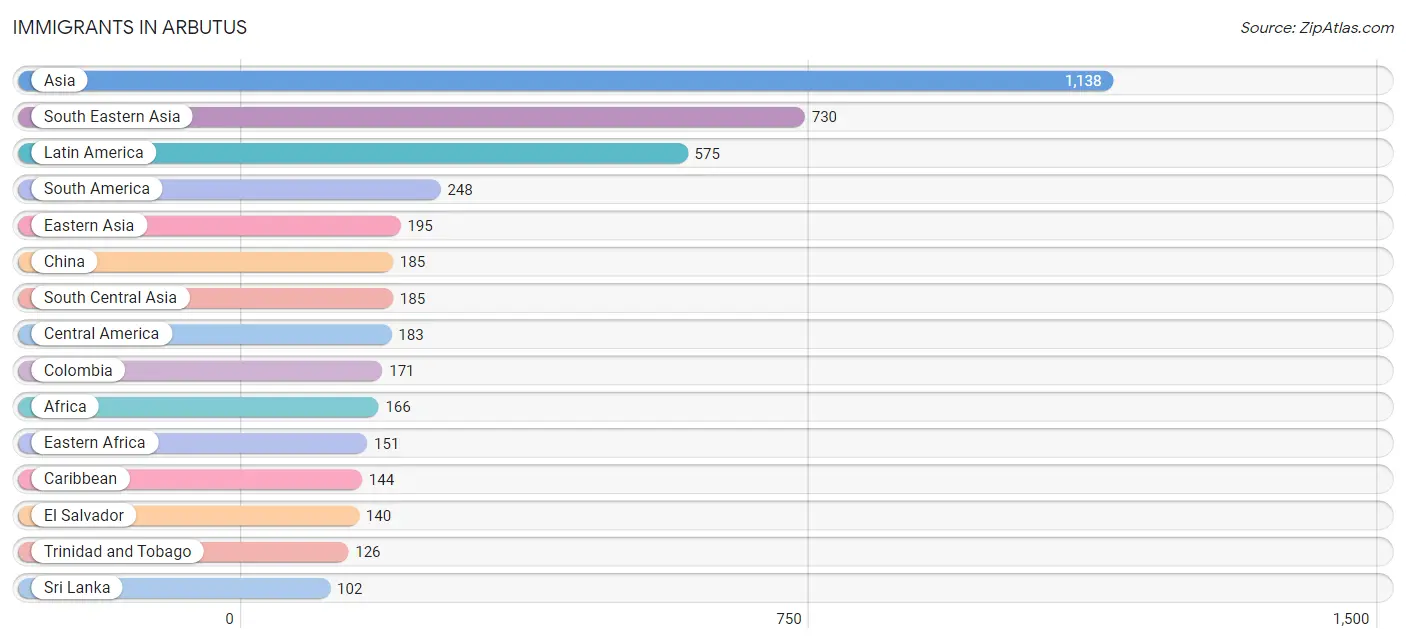
Immigrants in Arbutus
The most numerous immigrant groups reported in Arbutus came from Asia (1,138 | 5.7%), South Eastern Asia (730 | 3.6%), Latin America (575 | 2.9%), South America (248 | 1.2%), and Eastern Asia (195 | 1.0%), together accounting for 14.3% of all Arbutus residents.
| Immigration Origin | # Population | % Population |
| Africa | 166 | 0.8% |
| Asia | 1,138 | 5.7% |
| Belize | 3 | 0.0% |
| Bolivia | 52 | 0.3% |
| Cameroon | 12 | 0.1% |
| Canada | 10 | 0.1% |
| Caribbean | 144 | 0.7% |
| Central America | 183 | 0.9% |
| Chile | 25 | 0.1% |
| China | 185 | 0.9% |
| Colombia | 171 | 0.9% |
| Costa Rica | 4 | 0.0% |
| Cuba | 8 | 0.0% |
| Eastern Africa | 151 | 0.7% |
| Eastern Asia | 195 | 1.0% |
| El Salvador | 140 | 0.7% |
| Ethiopia | 84 | 0.4% |
| Europe | 23 | 0.1% |
| Ghana | 3 | 0.0% |
| Honduras | 36 | 0.2% |
| India | 65 | 0.3% |
| Israel | 28 | 0.1% |
| Jamaica | 10 | 0.1% |
| Kenya | 3 | 0.0% |
| Korea | 10 | 0.1% |
| Latin America | 575 | 2.9% |
| Malaysia | 12 | 0.1% |
| Middle Africa | 12 | 0.1% |
| Nepal | 18 | 0.1% |
| Northern Europe | 23 | 0.1% |
| Philippines | 64 | 0.3% |
| South America | 248 | 1.2% |
| South Central Asia | 185 | 0.9% |
| South Eastern Asia | 730 | 3.6% |
| Sri Lanka | 102 | 0.5% |
| Trinidad and Tobago | 126 | 0.6% |
| Uganda | 3 | 0.0% |
| Vietnam | 10 | 0.1% |
| Western Africa | 3 | 0.0% |
| Western Asia | 28 | 0.1% | View All 40 Rows |
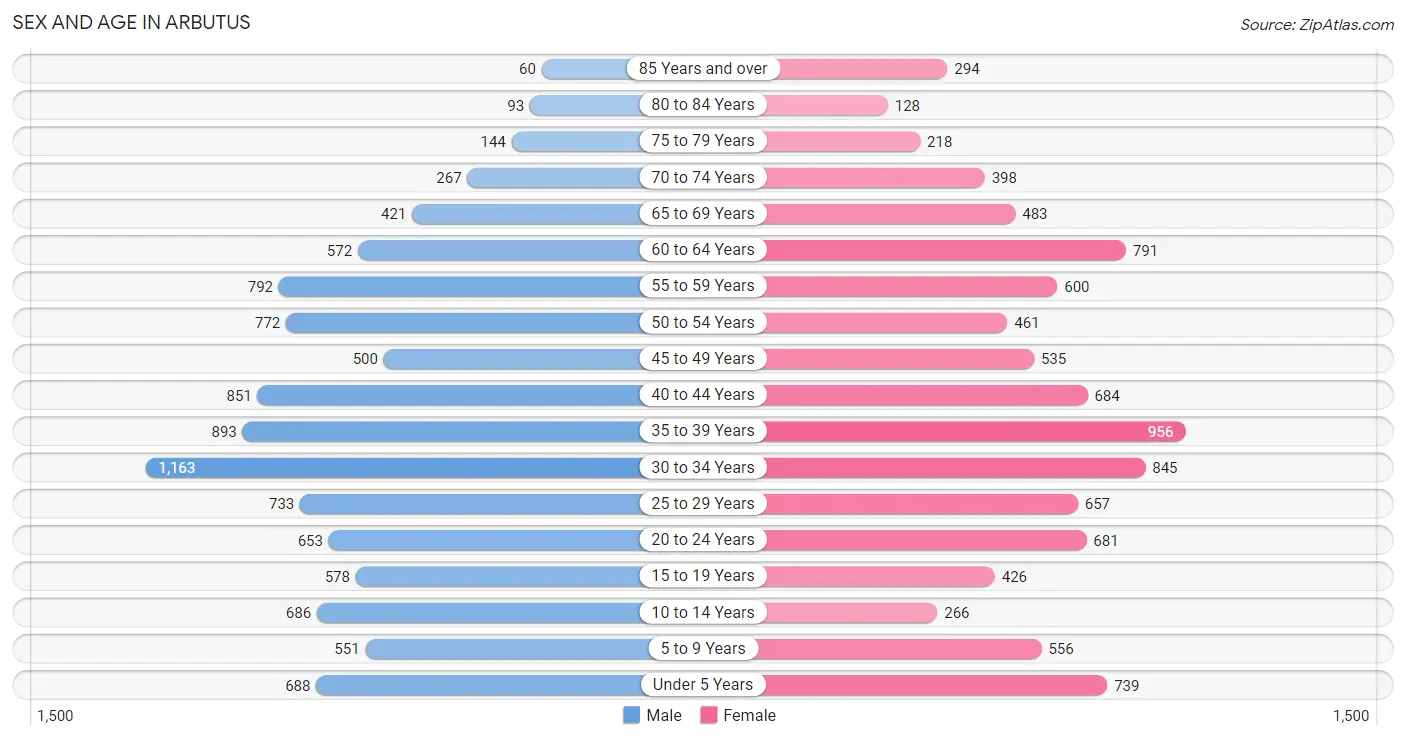
Sex and Age in Arbutus
Sex and Age in Arbutus
The most populous age groups in Arbutus are 30 to 34 Years (1,163 | 11.2%) for men and 35 to 39 Years (956 | 9.8%) for women.
| Age Bracket | Male | Female |
| Under 5 Years | 688 (6.6%) | 739 (7.6%) |
| 5 to 9 Years | 551 (5.3%) | 556 (5.7%) |
| 10 to 14 Years | 686 (6.6%) | 266 (2.7%) |
| 15 to 19 Years | 578 (5.6%) | 426 (4.4%) |
| 20 to 24 Years | 653 (6.3%) | 681 (7.0%) |
| 25 to 29 Years | 733 (7.0%) | 657 (6.8%) |
| 30 to 34 Years | 1,163 (11.2%) | 845 (8.7%) |
| 35 to 39 Years | 893 (8.6%) | 956 (9.8%) |
| 40 to 44 Years | 851 (8.2%) | 684 (7.0%) |
| 45 to 49 Years | 500 (4.8%) | 535 (5.5%) |
| 50 to 54 Years | 772 (7.4%) | 461 (4.7%) |
| 55 to 59 Years | 792 (7.6%) | 600 (6.2%) |
| 60 to 64 Years | 572 (5.5%) | 791 (8.1%) |
| 65 to 69 Years | 421 (4.0%) | 483 (5.0%) |
| 70 to 74 Years | 267 (2.6%) | 398 (4.1%) |
| 75 to 79 Years | 144 (1.4%) | 218 (2.2%) |
| 80 to 84 Years | 93 (0.9%) | 128 (1.3%) |
| 85 Years and over | 60 (0.6%) | 294 (3.0%) |
| Total | 10,417 (100.0%) | 9,718 (100.0%) |
Families and Households in Arbutus
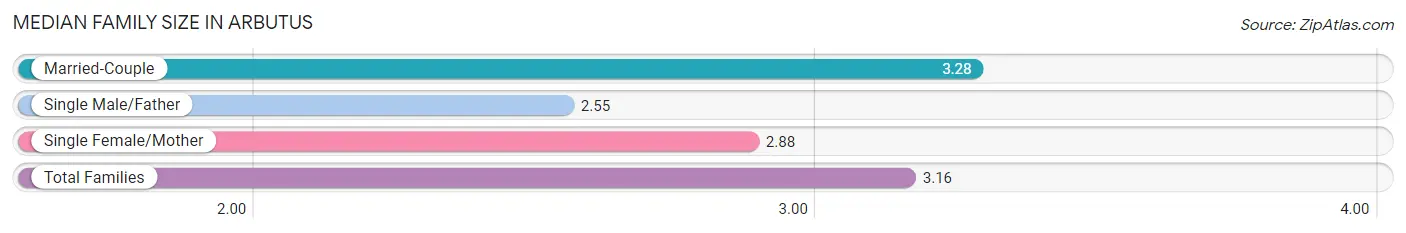
Median Family Size in Arbutus
The median family size in Arbutus is 3.16 persons per family, with married-couple families (3,815 | 77.6%) accounting for the largest median family size of 3.28 persons per family. On the other hand, single male/father families (370 | 7.5%) represent the smallest median family size with 2.55 persons per family.
| Family Type | # Families | Family Size |
| Married-Couple | 3,815 (77.6%) | 3.28 |
| Single Male/Father | 370 (7.5%) | 2.55 |
| Single Female/Mother | 730 (14.8%) | 2.88 |
| Total Families | 4,915 (100.0%) | 3.16 |
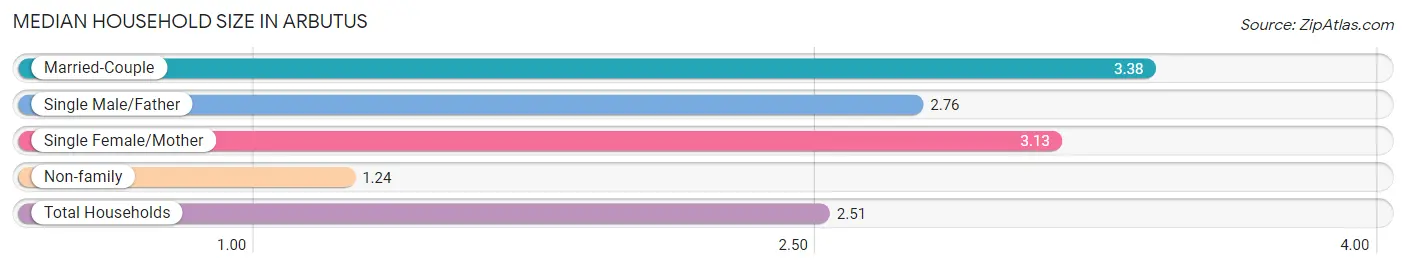
Median Household Size in Arbutus
The median household size in Arbutus is 2.51 persons per household, with married-couple households (3,815 | 47.8%) accounting for the largest median household size of 3.38 persons per household. non-family households (3,061 | 38.4%) represent the smallest median household size with 1.24 persons per household.
| Household Type | # Households | Household Size |
| Married-Couple | 3,815 (47.8%) | 3.38 |
| Single Male/Father | 370 (4.6%) | 2.76 |
| Single Female/Mother | 730 (9.1%) | 3.13 |
| Non-family | 3,061 (38.4%) | 1.24 |
| Total Households | 7,976 (100.0%) | 2.51 |
Household Size by Marriage Status in Arbutus
Out of a total of 7,976 households in Arbutus, 4,915 (61.6%) are family households, while 3,061 (38.4%) are nonfamily households. The most numerous type of family households are 2-person households, comprising 1,757, and the most common type of nonfamily households are 1-person households, comprising 2,519.
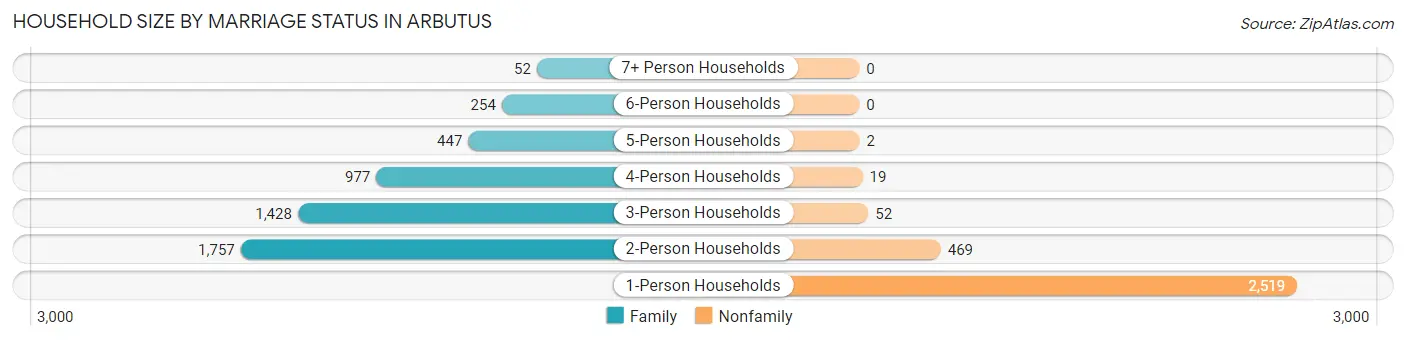
| Household Size | Family Households | Nonfamily Households |
| 1-Person Households | - | 2,519 (31.6%) |
| 2-Person Households | 1,757 (22.0%) | 469 (5.9%) |
| 3-Person Households | 1,428 (17.9%) | 52 (0.6%) |
| 4-Person Households | 977 (12.2%) | 19 (0.2%) |
| 5-Person Households | 447 (5.6%) | 2 (0.0%) |
| 6-Person Households | 254 (3.2%) | 0 (0.0%) |
| 7+ Person Households | 52 (0.6%) | 0 (0.0%) |
| Total | 4,915 (61.6%) | 3,061 (38.4%) |
Female Fertility in Arbutus
Fertility by Age in Arbutus
Average fertility rate in Arbutus is 96.0 births per 1,000 women. Women in the age bracket of 20 to 34 years have the highest fertility rate with 145.0 births per 1,000 women. Women in the age bracket of 20 to 34 years acount for 67.7% of all women with births.
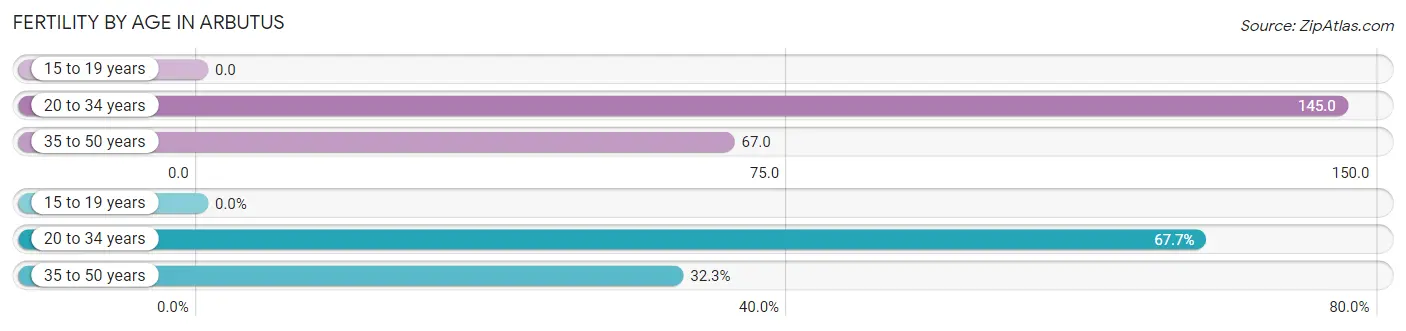
| Age Bracket | Women with Births | Births / 1,000 Women |
| 15 to 19 years | 0 (0.0%) | 0.0 |
| 20 to 34 years | 317 (67.7%) | 145.0 |
| 35 to 50 years | 151 (32.3%) | 67.0 |
| Total | 468 (100.0%) | 96.0 |
Fertility by Age by Marriage Status in Arbutus
77.6% of women with births (468) in Arbutus are married. The highest percentage of unmarried women with births falls into 20 to 34 years age bracket with 33.1% of them unmarried at the time of birth, while the lowest percentage of unmarried women with births belong to 35 to 50 years age bracket with 0.0% of them unmarried.
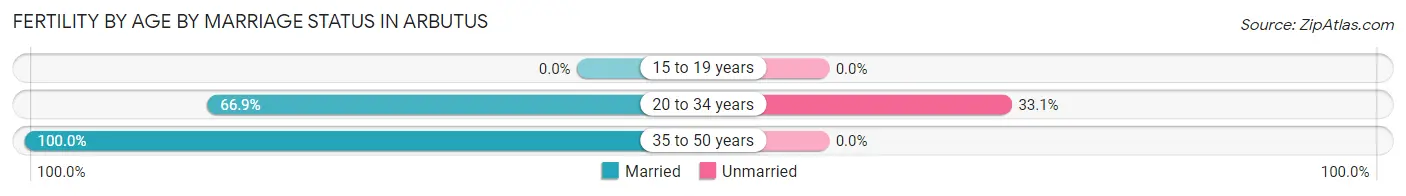
| Age Bracket | Married | Unmarried |
| 15 to 19 years | 0 (0.0%) | 0 (0.0%) |
| 20 to 34 years | 212 (66.9%) | 105 (33.1%) |
| 35 to 50 years | 151 (100.0%) | 0 (0.0%) |
| Total | 363 (77.6%) | 105 (22.4%) |
Fertility by Education in Arbutus
Average fertility rate in Arbutus is 96.0 births per 1,000 women. Women with the education attainment of bachelor's degree have the highest fertility rate of 137.0 births per 1,000 women, while women with the education attainment of high school diploma have the lowest fertility at 63.0 births per 1,000 women. Women with the education attainment of bachelor's degree represent 32.5% of all women with births.
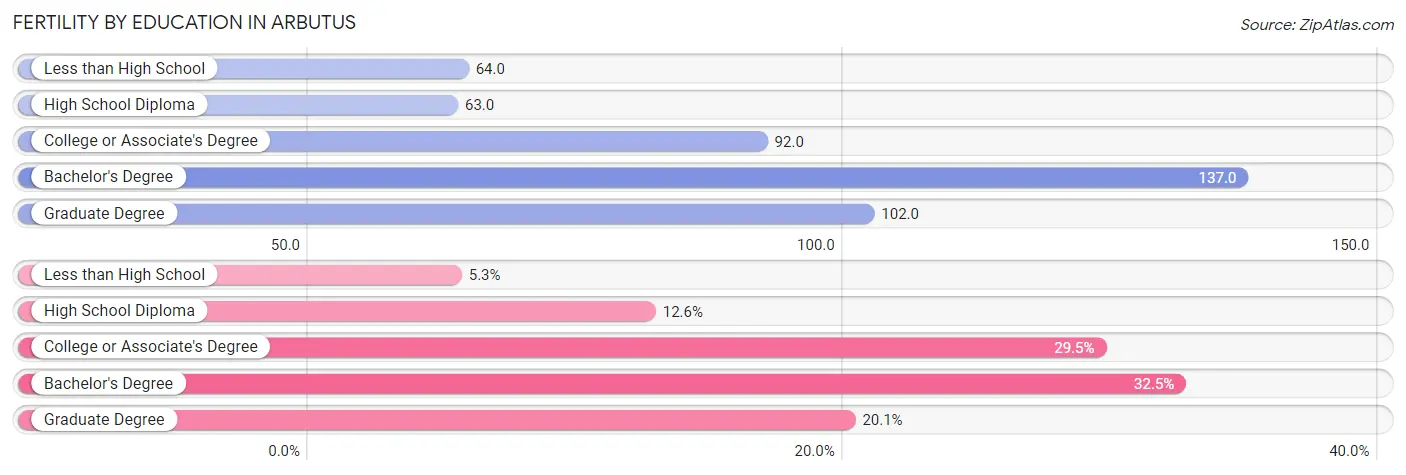
| Educational Attainment | Women with Births | Births / 1,000 Women |
| Less than High School | 25 (5.3%) | 64.0 |
| High School Diploma | 59 (12.6%) | 63.0 |
| College or Associate's Degree | 138 (29.5%) | 92.0 |
| Bachelor's Degree | 152 (32.5%) | 137.0 |
| Graduate Degree | 94 (20.1%) | 102.0 |
| Total | 468 (100.0%) | 96.0 |
Fertility by Education by Marriage Status in Arbutus
22.4% of women with births in Arbutus are unmarried. Women with the educational attainment of less than high school are most likely to be married with 100.0% of them married at childbirth, while women with the educational attainment of college or associate's degree are least likely to be married with 76.1% of them unmarried at childbirth.
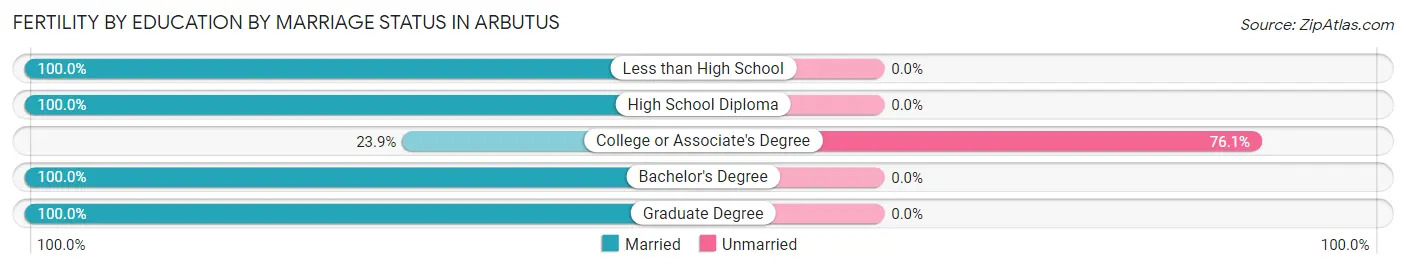
| Educational Attainment | Married | Unmarried |
| Less than High School | 25 (100.0%) | 0 (0.0%) |
| High School Diploma | 59 (100.0%) | 0 (0.0%) |
| College or Associate's Degree | 33 (23.9%) | 105 (76.1%) |
| Bachelor's Degree | 152 (100.0%) | 0 (0.0%) |
| Graduate Degree | 94 (100.0%) | 0 (0.0%) |
| Total | 363 (77.6%) | 105 (22.4%) |
Employment Characteristics in Arbutus
Employment by Class of Employer in Arbutus
Among the 10,956 employed individuals in Arbutus, private company employees (6,998 | 63.9%), local government employees (946 | 8.6%), and not-for-profit organizations (847 | 7.7%) make up the most common classes of employment.
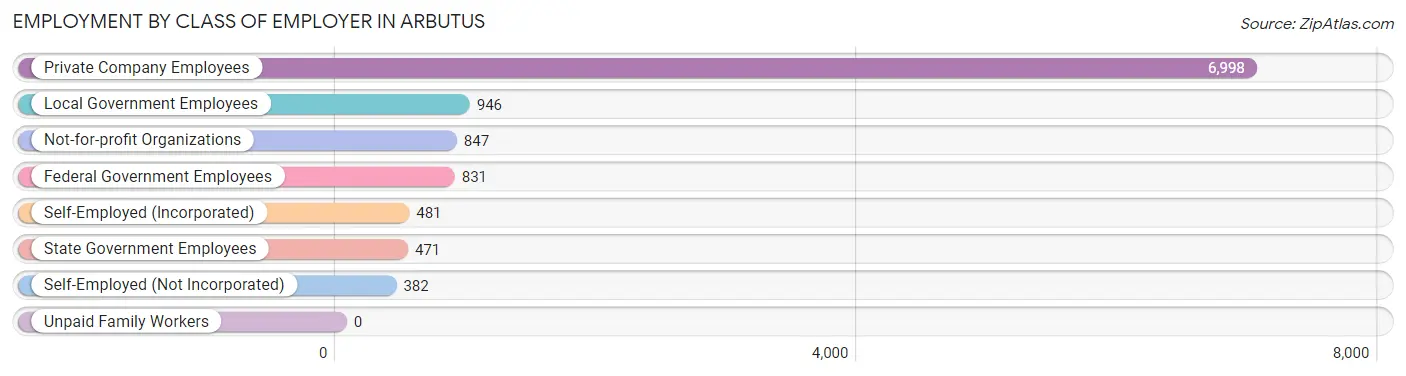
| Employer Class | # Employees | % Employees |
| Private Company Employees | 6,998 | 63.9% |
| Self-Employed (Incorporated) | 481 | 4.4% |
| Self-Employed (Not Incorporated) | 382 | 3.5% |
| Not-for-profit Organizations | 847 | 7.7% |
| Local Government Employees | 946 | 8.6% |
| State Government Employees | 471 | 4.3% |
| Federal Government Employees | 831 | 7.6% |
| Unpaid Family Workers | 0 | 0.0% |
| Total | 10,956 | 100.0% |
Employment Status by Age in Arbutus
According to the labor force statistics for Arbutus, out of the total population over 16 years of age (16,545), 71.9% or 11,896 individuals are in the labor force, with 6.1% or 726 of them unemployed. The age group with the highest labor force participation rate is 30 to 34 years, with 95.2% or 1,912 individuals in the labor force. Within the labor force, the 45 to 54 years age range has the highest percentage of unemployed individuals, with 11.8% or 239 of them being unemployed.
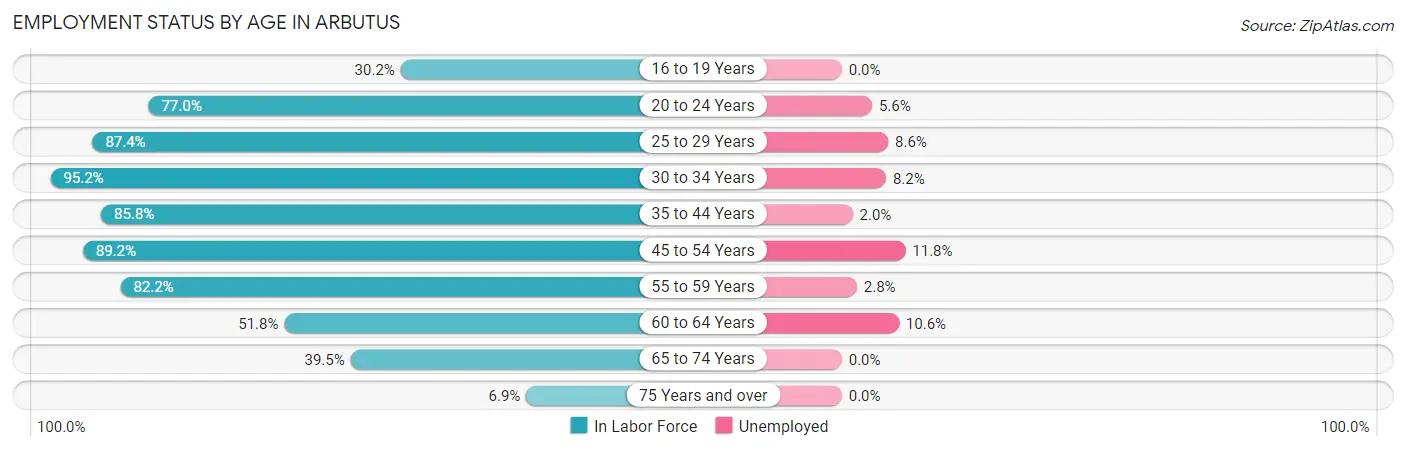
| Age Bracket | In Labor Force | Unemployed |
| 16 to 19 Years | 272 (30.2%) | 0 (0.0%) |
| 20 to 24 Years | 1,027 (77.0%) | 58 (5.6%) |
| 25 to 29 Years | 1,215 (87.4%) | 104 (8.6%) |
| 30 to 34 Years | 1,912 (95.2%) | 157 (8.2%) |
| 35 to 44 Years | 2,903 (85.8%) | 58 (2.0%) |
| 45 to 54 Years | 2,023 (89.2%) | 239 (11.8%) |
| 55 to 59 Years | 1,144 (82.2%) | 32 (2.8%) |
| 60 to 64 Years | 706 (51.8%) | 75 (10.6%) |
| 65 to 74 Years | 620 (39.5%) | 0 (0.0%) |
| 75 Years and over | 65 (6.9%) | 0 (0.0%) |
| Total | 11,896 (71.9%) | 726 (6.1%) |
Employment Status by Educational Attainment in Arbutus
According to labor force statistics for Arbutus, 83.9% of individuals (9,904) out of the total population between 25 and 64 years of age (11,805) are in the labor force, with 6.7% or 664 of them being unemployed. The group with the highest labor force participation rate are those with the educational attainment of bachelor's degree or higher, with 94.0% or 4,546 individuals in the labor force. Within the labor force, individuals with high school diploma education have the highest percentage of unemployment, with 13.7% or 303 of them being unemployed.
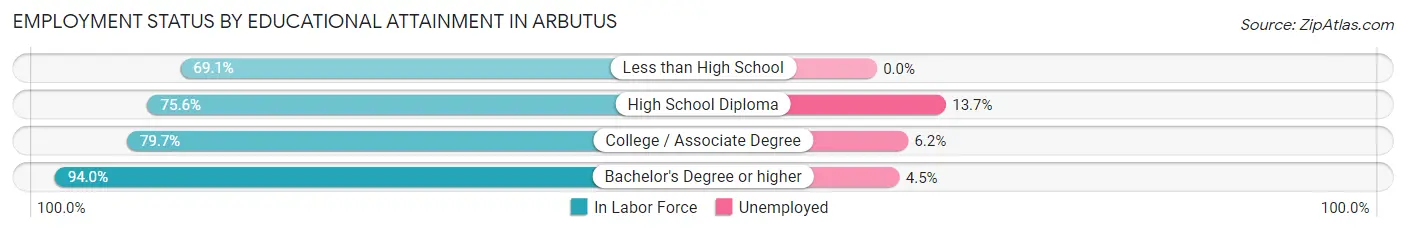
| Educational Attainment | In Labor Force | Unemployed |
| Less than High School | 510 (69.1%) | 0 (0.0%) |
| High School Diploma | 2,211 (75.6%) | 401 (13.7%) |
| College / Associate Degree | 2,635 (79.7%) | 205 (6.2%) |
| Bachelor's Degree or higher | 4,546 (94.0%) | 218 (4.5%) |
| Total | 9,904 (83.9%) | 791 (6.7%) |
Employment Occupations by Sex in Arbutus
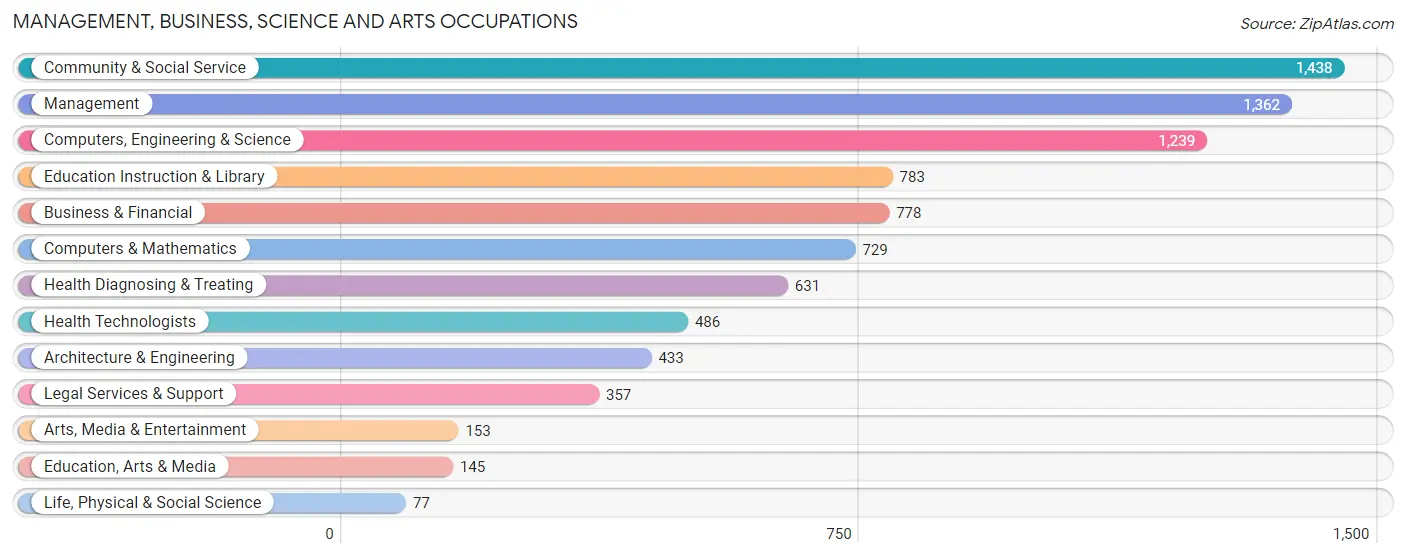
Management, Business, Science and Arts Occupations
The most common Management, Business, Science and Arts occupations in Arbutus are Community & Social Service (1,438 | 13.0%), Management (1,362 | 12.3%), Computers, Engineering & Science (1,239 | 11.2%), Education Instruction & Library (783 | 7.1%), and Business & Financial (778 | 7.0%).
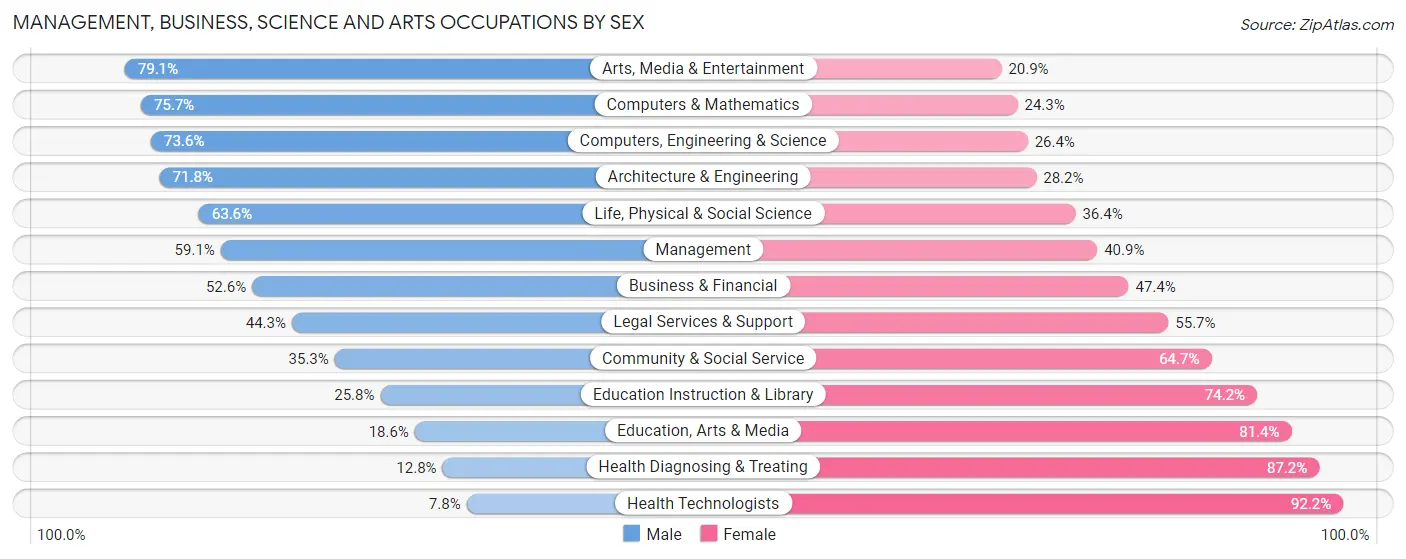
Management, Business, Science and Arts Occupations by Sex
Within the Management, Business, Science and Arts occupations in Arbutus, the most male-oriented occupations are Arts, Media & Entertainment (79.1%), Computers & Mathematics (75.7%), and Computers, Engineering & Science (73.6%), while the most female-oriented occupations are Health Technologists (92.2%), Health Diagnosing & Treating (87.2%), and Education, Arts & Media (81.4%).
| Occupation | Male | Female |
| Management | 805 (59.1%) | 557 (40.9%) |
| Business & Financial | 409 (52.6%) | 369 (47.4%) |
| Computers, Engineering & Science | 912 (73.6%) | 327 (26.4%) |
| Computers & Mathematics | 552 (75.7%) | 177 (24.3%) |
| Architecture & Engineering | 311 (71.8%) | 122 (28.2%) |
| Life, Physical & Social Science | 49 (63.6%) | 28 (36.4%) |
| Community & Social Service | 508 (35.3%) | 930 (64.7%) |
| Education, Arts & Media | 27 (18.6%) | 118 (81.4%) |
| Legal Services & Support | 158 (44.3%) | 199 (55.7%) |
| Education Instruction & Library | 202 (25.8%) | 581 (74.2%) |
| Arts, Media & Entertainment | 121 (79.1%) | 32 (20.9%) |
| Health Diagnosing & Treating | 81 (12.8%) | 550 (87.2%) |
| Health Technologists | 38 (7.8%) | 448 (92.2%) |
| Total (Category) | 2,715 (49.8%) | 2,733 (50.2%) |
| Total (Overall) | 5,986 (54.0%) | 5,097 (46.0%) |
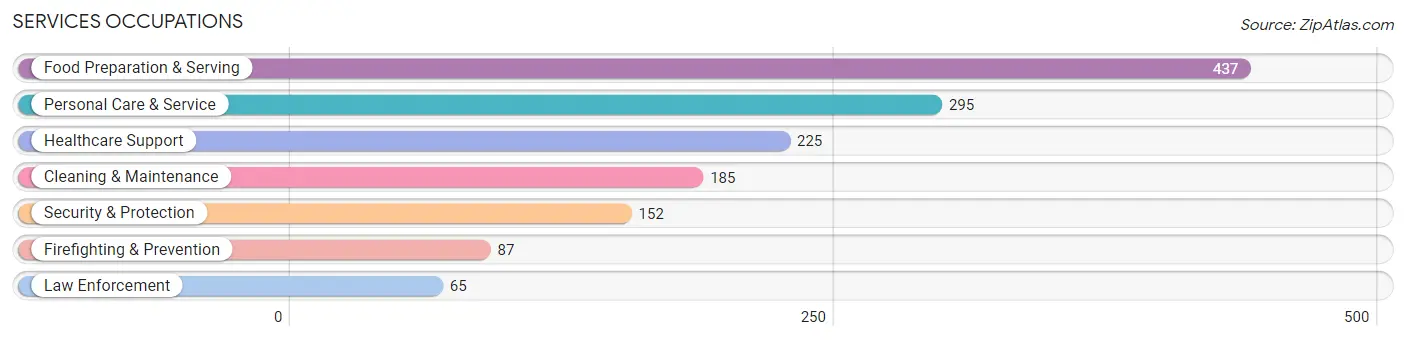
Services Occupations
The most common Services occupations in Arbutus are Food Preparation & Serving (437 | 3.9%), Personal Care & Service (295 | 2.7%), Healthcare Support (225 | 2.0%), Cleaning & Maintenance (185 | 1.7%), and Security & Protection (152 | 1.4%).
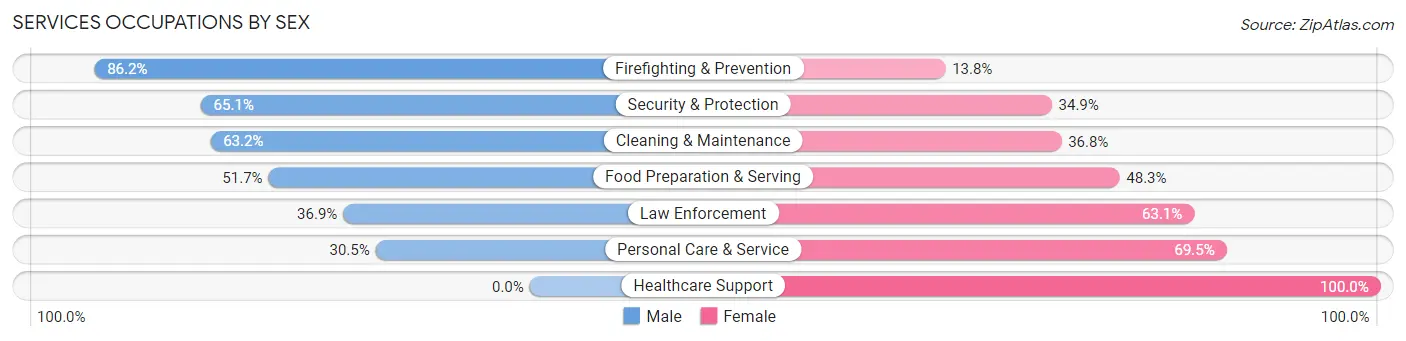
Services Occupations by Sex
Within the Services occupations in Arbutus, the most male-oriented occupations are Firefighting & Prevention (86.2%), Security & Protection (65.1%), and Cleaning & Maintenance (63.2%), while the most female-oriented occupations are Healthcare Support (100.0%), Personal Care & Service (69.5%), and Law Enforcement (63.1%).
| Occupation | Male | Female |
| Healthcare Support | 0 (0.0%) | 225 (100.0%) |
| Security & Protection | 99 (65.1%) | 53 (34.9%) |
| Firefighting & Prevention | 75 (86.2%) | 12 (13.8%) |
| Law Enforcement | 24 (36.9%) | 41 (63.1%) |
| Food Preparation & Serving | 226 (51.7%) | 211 (48.3%) |
| Cleaning & Maintenance | 117 (63.2%) | 68 (36.8%) |
| Personal Care & Service | 90 (30.5%) | 205 (69.5%) |
| Total (Category) | 532 (41.1%) | 762 (58.9%) |
| Total (Overall) | 5,986 (54.0%) | 5,097 (46.0%) |
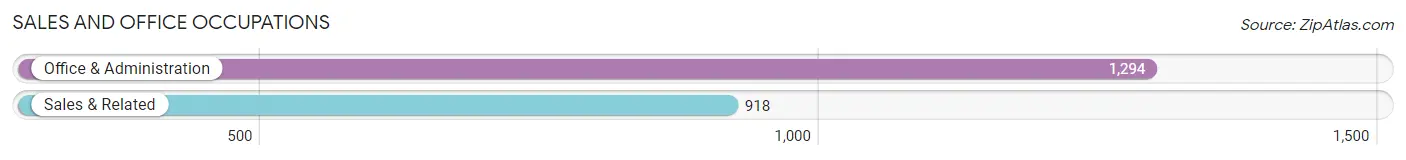
Sales and Office Occupations
The most common Sales and Office occupations in Arbutus are Office & Administration (1,294 | 11.7%), and Sales & Related (918 | 8.3%).
Sales and Office Occupations by Sex
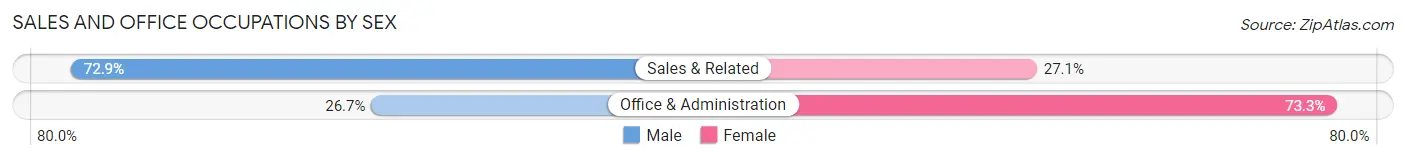
| Occupation | Male | Female |
| Sales & Related | 669 (72.9%) | 249 (27.1%) |
| Office & Administration | 345 (26.7%) | 949 (73.3%) |
| Total (Category) | 1,014 (45.8%) | 1,198 (54.2%) |
| Total (Overall) | 5,986 (54.0%) | 5,097 (46.0%) |
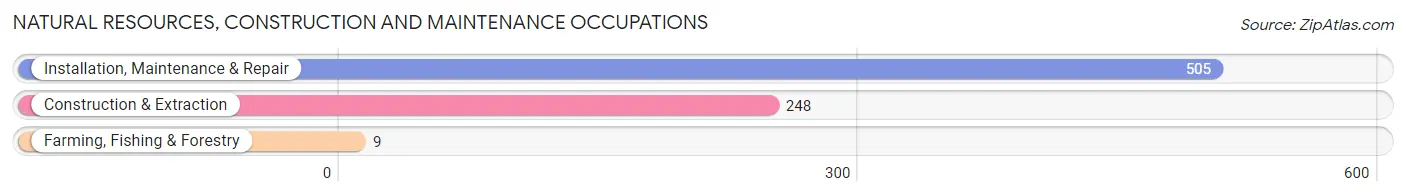
Natural Resources, Construction and Maintenance Occupations
The most common Natural Resources, Construction and Maintenance occupations in Arbutus are Installation, Maintenance & Repair (505 | 4.6%), Construction & Extraction (248 | 2.2%), and Farming, Fishing & Forestry (9 | 0.1%).
Natural Resources, Construction and Maintenance Occupations by Sex
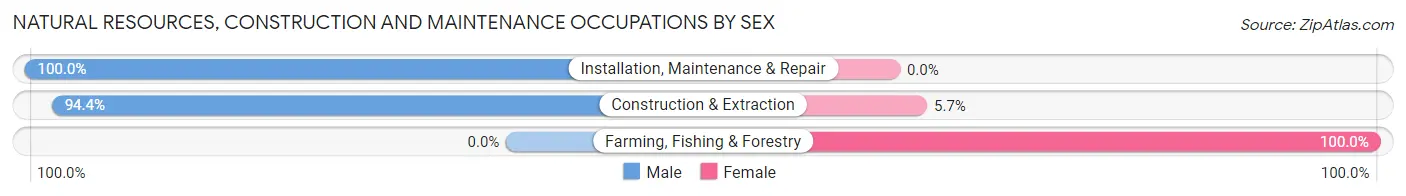
| Occupation | Male | Female |
| Farming, Fishing & Forestry | 0 (0.0%) | 9 (100.0%) |
| Construction & Extraction | 234 (94.4%) | 14 (5.7%) |
| Installation, Maintenance & Repair | 505 (100.0%) | 0 (0.0%) |
| Total (Category) | 739 (97.0%) | 23 (3.0%) |
| Total (Overall) | 5,986 (54.0%) | 5,097 (46.0%) |
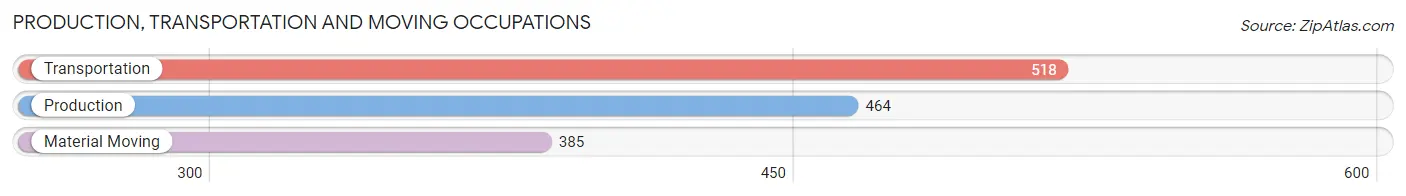
Production, Transportation and Moving Occupations
The most common Production, Transportation and Moving occupations in Arbutus are Transportation (518 | 4.7%), Production (464 | 4.2%), and Material Moving (385 | 3.5%).
Production, Transportation and Moving Occupations by Sex
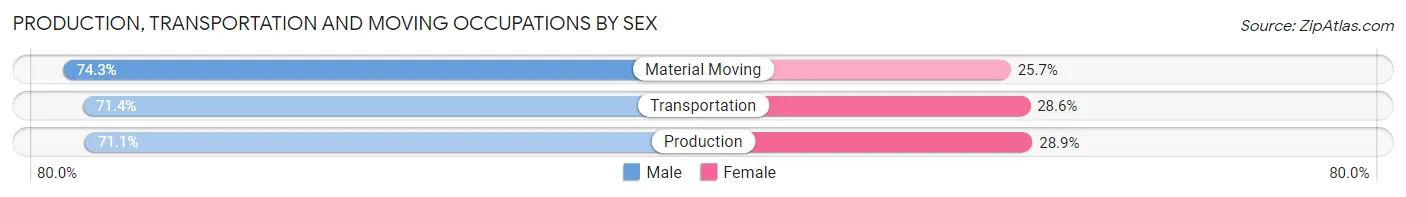
| Occupation | Male | Female |
| Production | 330 (71.1%) | 134 (28.9%) |
| Transportation | 370 (71.4%) | 148 (28.6%) |
| Material Moving | 286 (74.3%) | 99 (25.7%) |
| Total (Category) | 986 (72.1%) | 381 (27.9%) |
| Total (Overall) | 5,986 (54.0%) | 5,097 (46.0%) |
Employment Industries by Sex in Arbutus
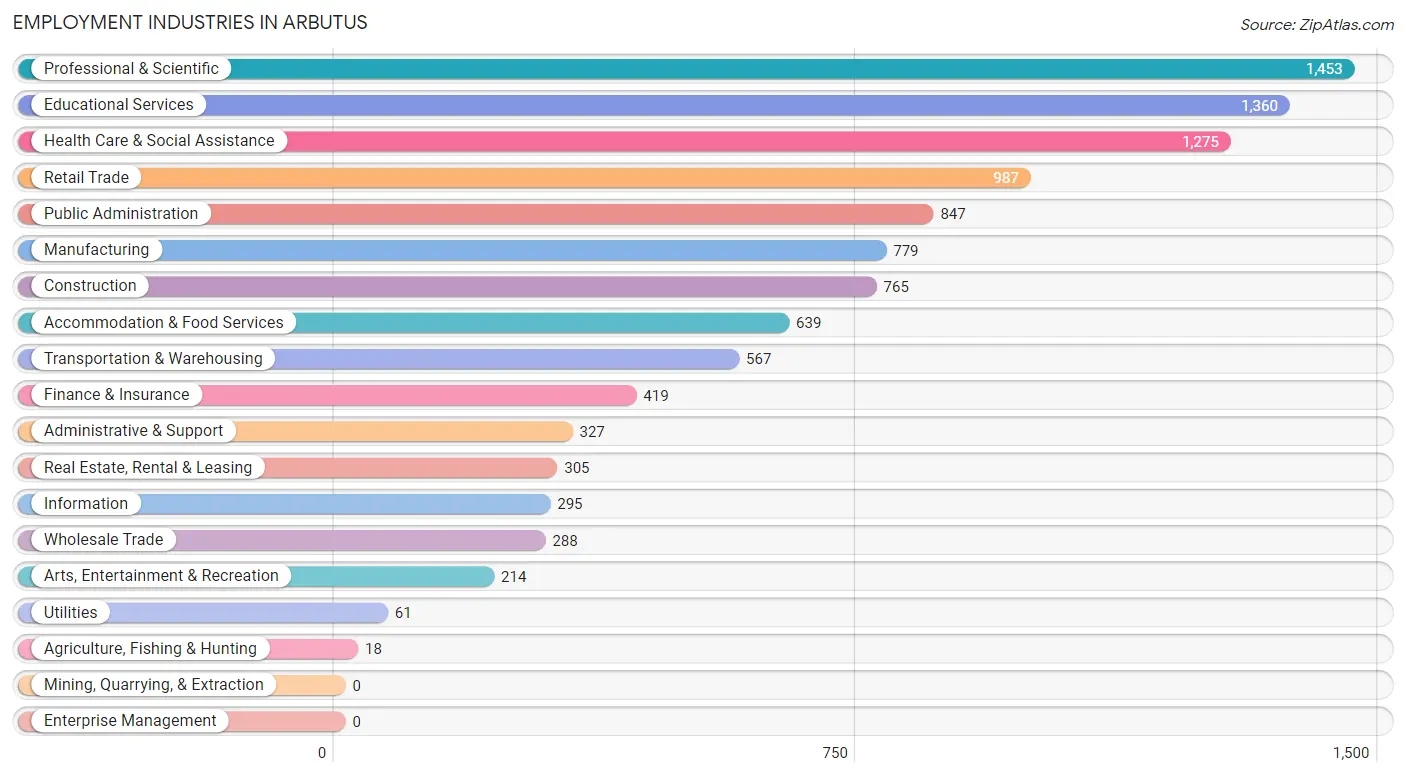
Employment Industries in Arbutus
The major employment industries in Arbutus include Professional & Scientific (1,453 | 13.1%), Educational Services (1,360 | 12.3%), Health Care & Social Assistance (1,275 | 11.5%), Retail Trade (987 | 8.9%), and Public Administration (847 | 7.6%).
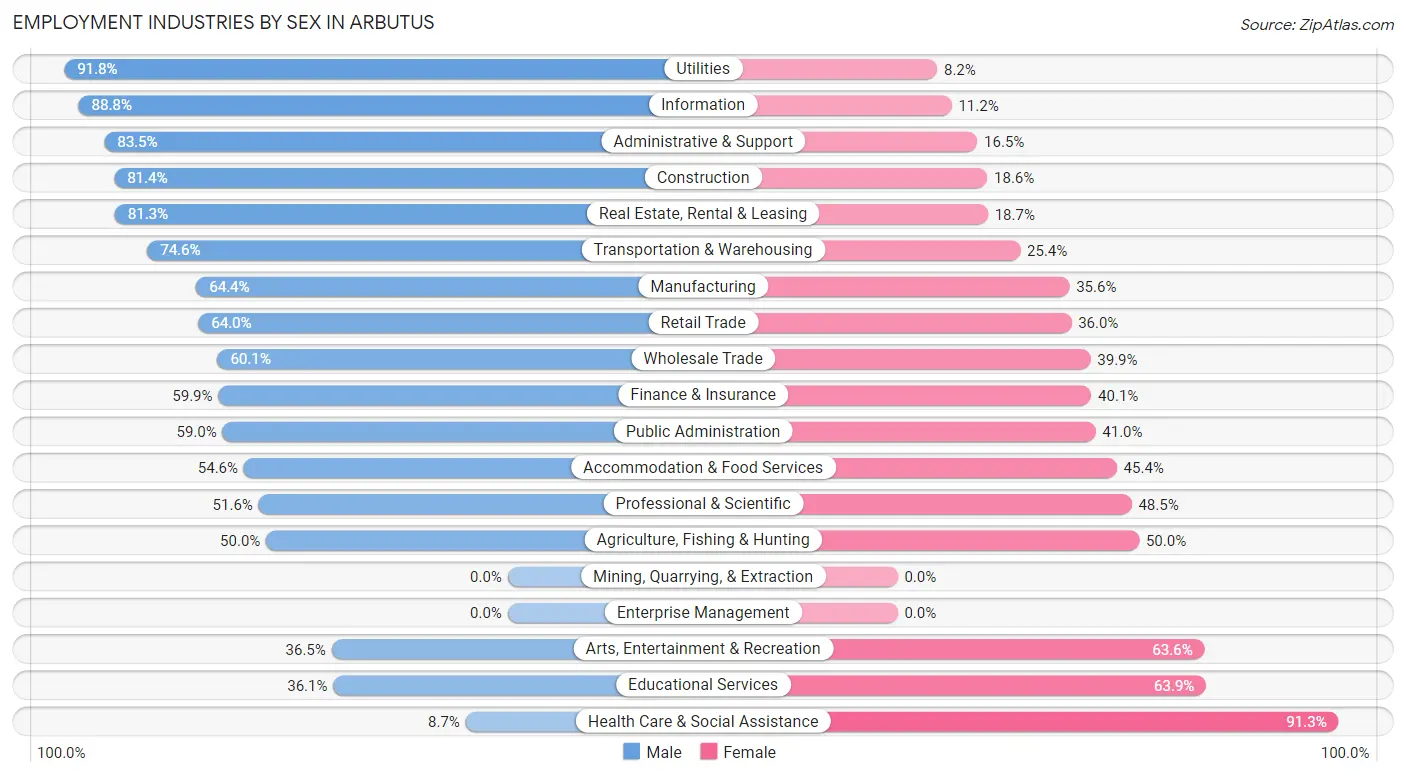
Employment Industries by Sex in Arbutus
The Arbutus industries that see more men than women are Utilities (91.8%), Information (88.8%), and Administrative & Support (83.5%), whereas the industries that tend to have a higher number of women are Health Care & Social Assistance (91.3%), Educational Services (63.9%), and Arts, Entertainment & Recreation (63.5%).
| Industry | Male | Female |
| Agriculture, Fishing & Hunting | 9 (50.0%) | 9 (50.0%) |
| Mining, Quarrying, & Extraction | 0 (0.0%) | 0 (0.0%) |
| Construction | 623 (81.4%) | 142 (18.6%) |
| Manufacturing | 502 (64.4%) | 277 (35.6%) |
| Wholesale Trade | 173 (60.1%) | 115 (39.9%) |
| Retail Trade | 632 (64.0%) | 355 (36.0%) |
| Transportation & Warehousing | 423 (74.6%) | 144 (25.4%) |
| Utilities | 56 (91.8%) | 5 (8.2%) |
| Information | 262 (88.8%) | 33 (11.2%) |
| Finance & Insurance | 251 (59.9%) | 168 (40.1%) |
| Real Estate, Rental & Leasing | 248 (81.3%) | 57 (18.7%) |
| Professional & Scientific | 749 (51.5%) | 704 (48.4%) |
| Enterprise Management | 0 (0.0%) | 0 (0.0%) |
| Administrative & Support | 273 (83.5%) | 54 (16.5%) |
| Educational Services | 491 (36.1%) | 869 (63.9%) |
| Health Care & Social Assistance | 111 (8.7%) | 1,164 (91.3%) |
| Arts, Entertainment & Recreation | 78 (36.4%) | 136 (63.5%) |
| Accommodation & Food Services | 349 (54.6%) | 290 (45.4%) |
| Public Administration | 500 (59.0%) | 347 (41.0%) |
| Total | 5,986 (54.0%) | 5,097 (46.0%) |
Education in Arbutus
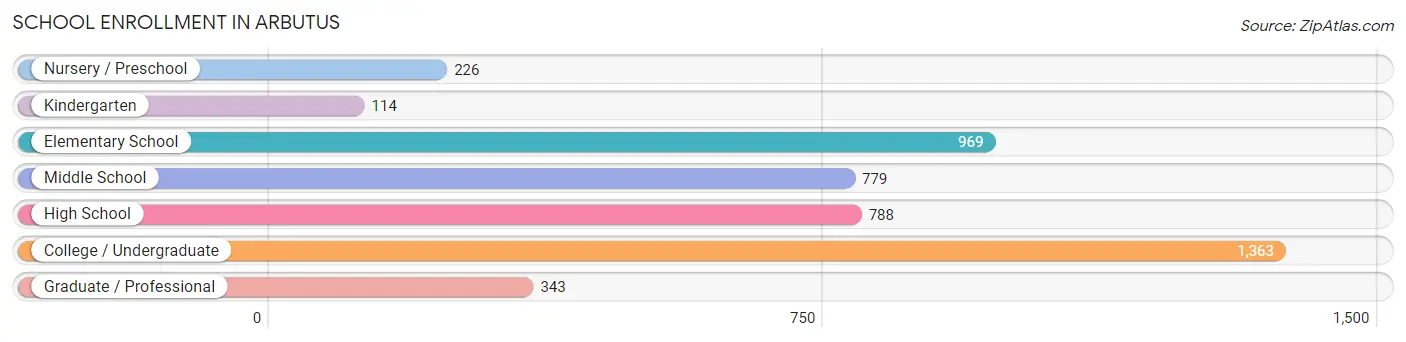
School Enrollment in Arbutus
The most common levels of schooling among the 4,582 students in Arbutus are college / undergraduate (1,363 | 29.7%), elementary school (969 | 21.1%), and high school (788 | 17.2%).
| School Level | # Students | % Students |
| Nursery / Preschool | 226 | 4.9% |
| Kindergarten | 114 | 2.5% |
| Elementary School | 969 | 21.1% |
| Middle School | 779 | 17.0% |
| High School | 788 | 17.2% |
| College / Undergraduate | 1,363 | 29.7% |
| Graduate / Professional | 343 | 7.5% |
| Total | 4,582 | 100.0% |
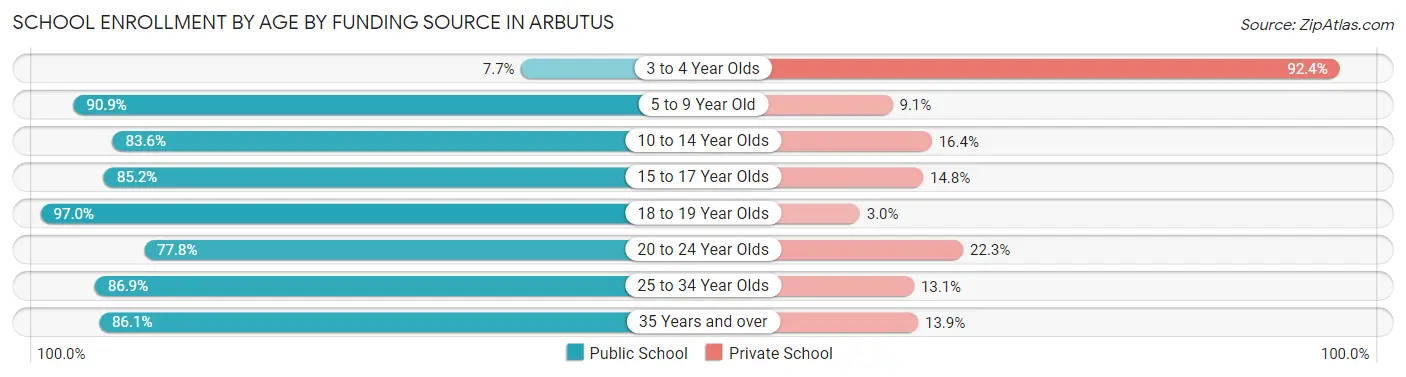
School Enrollment by Age by Funding Source in Arbutus
Out of a total of 4,582 students who are enrolled in schools in Arbutus, 779 (17.0%) attend a private institution, while the remaining 3,803 (83.0%) are enrolled in public schools. The age group of 3 to 4 year olds has the highest likelihood of being enrolled in private schools, with 169 (92.3% in the age bracket) enrolled. Conversely, the age group of 18 to 19 year olds has the lowest likelihood of being enrolled in a private school, with 356 (97.0% in the age bracket) attending a public institution.
| Age Bracket | Public School | Private School |
| 3 to 4 Year Olds | 14 (7.6%) | 169 (92.3%) |
| 5 to 9 Year Old | 919 (90.9%) | 92 (9.1%) |
| 10 to 14 Year Olds | 790 (83.6%) | 155 (16.4%) |
| 15 to 17 Year Olds | 490 (85.2%) | 85 (14.8%) |
| 18 to 19 Year Olds | 356 (97.0%) | 11 (3.0%) |
| 20 to 24 Year Olds | 587 (77.7%) | 168 (22.3%) |
| 25 to 34 Year Olds | 385 (86.9%) | 58 (13.1%) |
| 35 Years and over | 261 (86.1%) | 42 (13.9%) |
| Total | 3,803 (83.0%) | 779 (17.0%) |
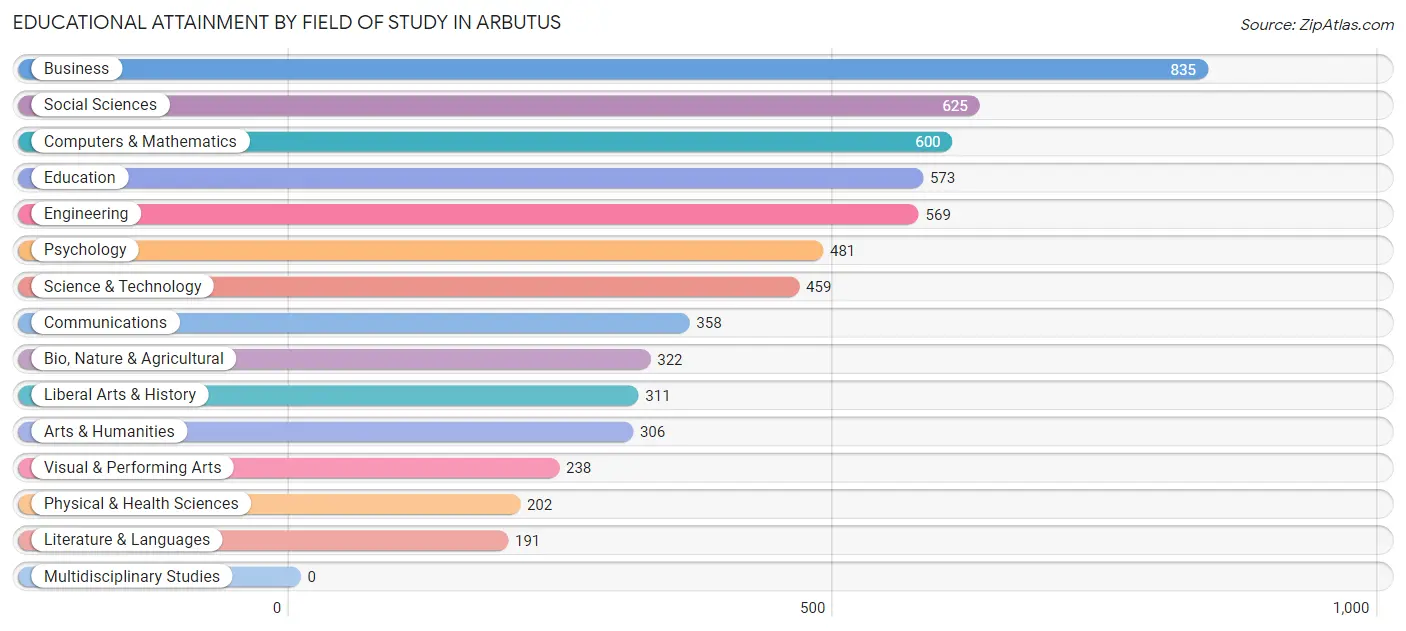
Educational Attainment by Field of Study in Arbutus
Business (835 | 13.8%), social sciences (625 | 10.3%), computers & mathematics (600 | 9.9%), education (573 | 9.4%), and engineering (569 | 9.4%) are the most common fields of study among 6,070 individuals in Arbutus who have obtained a bachelor's degree or higher.
| Field of Study | # Graduates | % Graduates |
| Computers & Mathematics | 600 | 9.9% |
| Bio, Nature & Agricultural | 322 | 5.3% |
| Physical & Health Sciences | 202 | 3.3% |
| Psychology | 481 | 7.9% |
| Social Sciences | 625 | 10.3% |
| Engineering | 569 | 9.4% |
| Multidisciplinary Studies | 0 | 0.0% |
| Science & Technology | 459 | 7.6% |
| Business | 835 | 13.8% |
| Education | 573 | 9.4% |
| Literature & Languages | 191 | 3.2% |
| Liberal Arts & History | 311 | 5.1% |
| Visual & Performing Arts | 238 | 3.9% |
| Communications | 358 | 5.9% |
| Arts & Humanities | 306 | 5.0% |
| Total | 6,070 | 100.0% |
Transportation & Commute in Arbutus
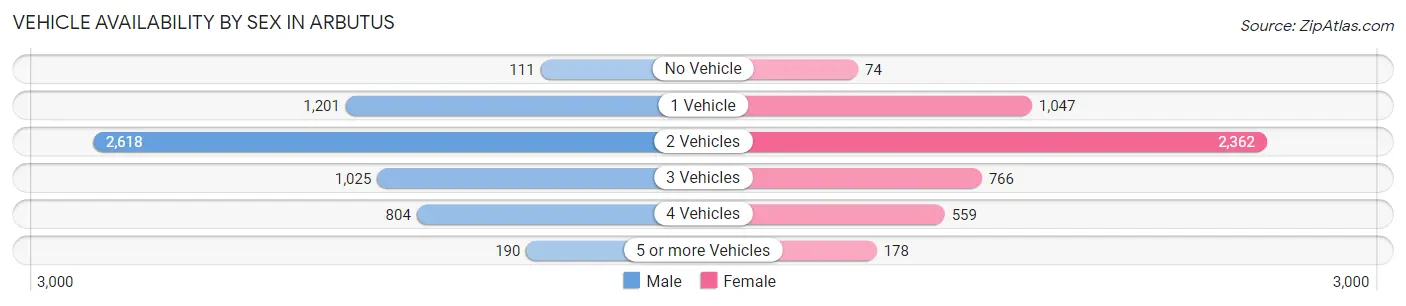
Vehicle Availability by Sex in Arbutus
The most prevalent vehicle ownership categories in Arbutus are males with 2 vehicles (2,618, accounting for 44.0%) and females with 2 vehicles (2,362, making up 52.5%).
| Vehicles Available | Male | Female |
| No Vehicle | 111 (1.9%) | 74 (1.5%) |
| 1 Vehicle | 1,201 (20.2%) | 1,047 (21.0%) |
| 2 Vehicles | 2,618 (44.0%) | 2,362 (47.4%) |
| 3 Vehicles | 1,025 (17.2%) | 766 (15.4%) |
| 4 Vehicles | 804 (13.5%) | 559 (11.2%) |
| 5 or more Vehicles | 190 (3.2%) | 178 (3.6%) |
| Total | 5,949 (100.0%) | 4,986 (100.0%) |
Commute Time in Arbutus
The most frequently occuring commute durations in Arbutus are 15 to 19 minutes (1,965 commuters, 20.3%), 20 to 24 minutes (1,816 commuters, 18.7%), and 30 to 34 minutes (1,763 commuters, 18.2%).
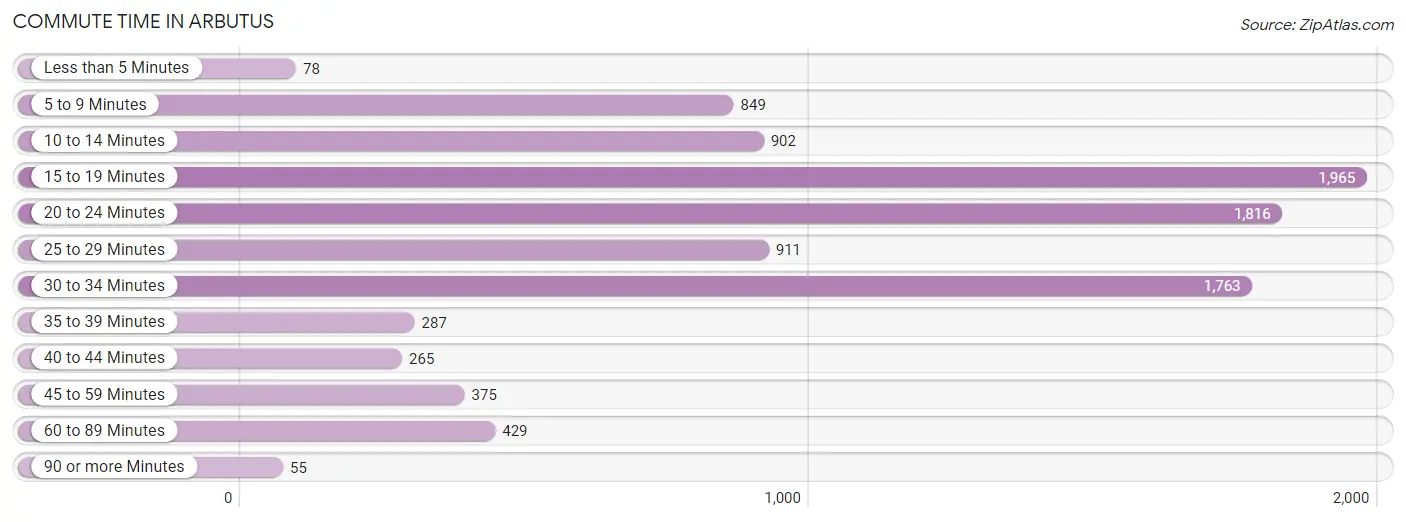
| Commute Time | # Commuters | % Commuters |
| Less than 5 Minutes | 78 | 0.8% |
| 5 to 9 Minutes | 849 | 8.8% |
| 10 to 14 Minutes | 902 | 9.3% |
| 15 to 19 Minutes | 1,965 | 20.3% |
| 20 to 24 Minutes | 1,816 | 18.7% |
| 25 to 29 Minutes | 911 | 9.4% |
| 30 to 34 Minutes | 1,763 | 18.2% |
| 35 to 39 Minutes | 287 | 3.0% |
| 40 to 44 Minutes | 265 | 2.7% |
| 45 to 59 Minutes | 375 | 3.9% |
| 60 to 89 Minutes | 429 | 4.4% |
| 90 or more Minutes | 55 | 0.6% |
Commute Time by Sex in Arbutus
The most common commute times in Arbutus are 20 to 24 minutes (1,069 commuters, 19.8%) for males and 15 to 19 minutes (976 commuters, 22.7%) for females.
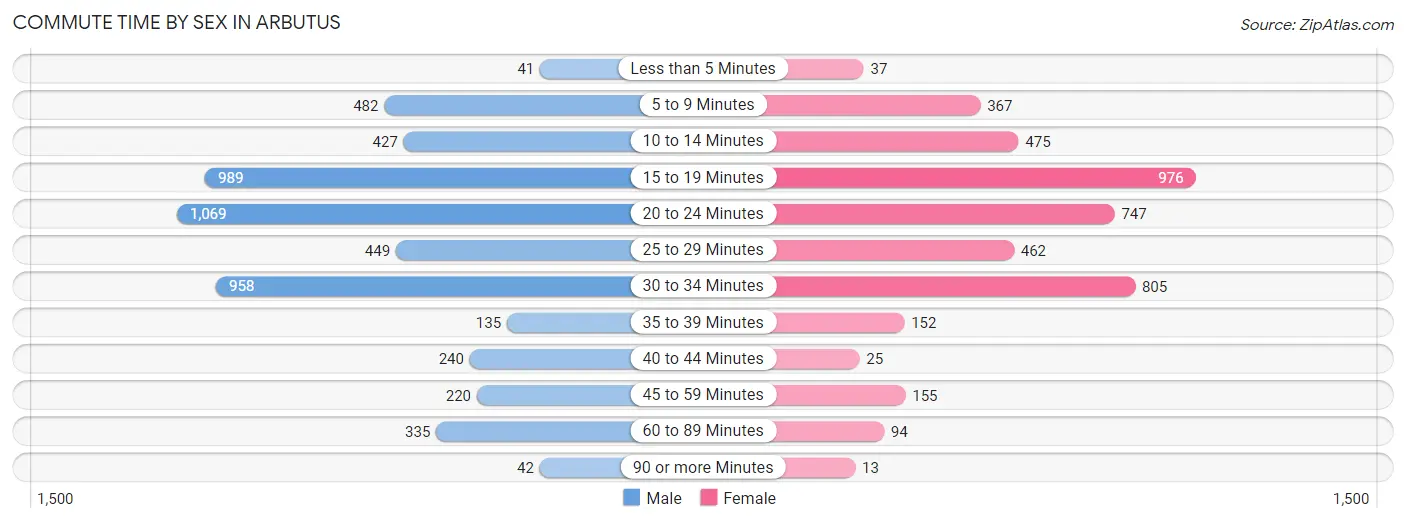
| Commute Time | Male | Female |
| Less than 5 Minutes | 41 (0.8%) | 37 (0.9%) |
| 5 to 9 Minutes | 482 (8.9%) | 367 (8.5%) |
| 10 to 14 Minutes | 427 (7.9%) | 475 (11.0%) |
| 15 to 19 Minutes | 989 (18.4%) | 976 (22.7%) |
| 20 to 24 Minutes | 1,069 (19.8%) | 747 (17.3%) |
| 25 to 29 Minutes | 449 (8.3%) | 462 (10.7%) |
| 30 to 34 Minutes | 958 (17.8%) | 805 (18.7%) |
| 35 to 39 Minutes | 135 (2.5%) | 152 (3.5%) |
| 40 to 44 Minutes | 240 (4.5%) | 25 (0.6%) |
| 45 to 59 Minutes | 220 (4.1%) | 155 (3.6%) |
| 60 to 89 Minutes | 335 (6.2%) | 94 (2.2%) |
| 90 or more Minutes | 42 (0.8%) | 13 (0.3%) |
Time of Departure to Work by Sex in Arbutus
The most frequent times of departure to work in Arbutus are 7:30 AM to 7:59 AM (829, 15.4%) for males and 7:00 AM to 7:29 AM (913, 21.2%) for females.
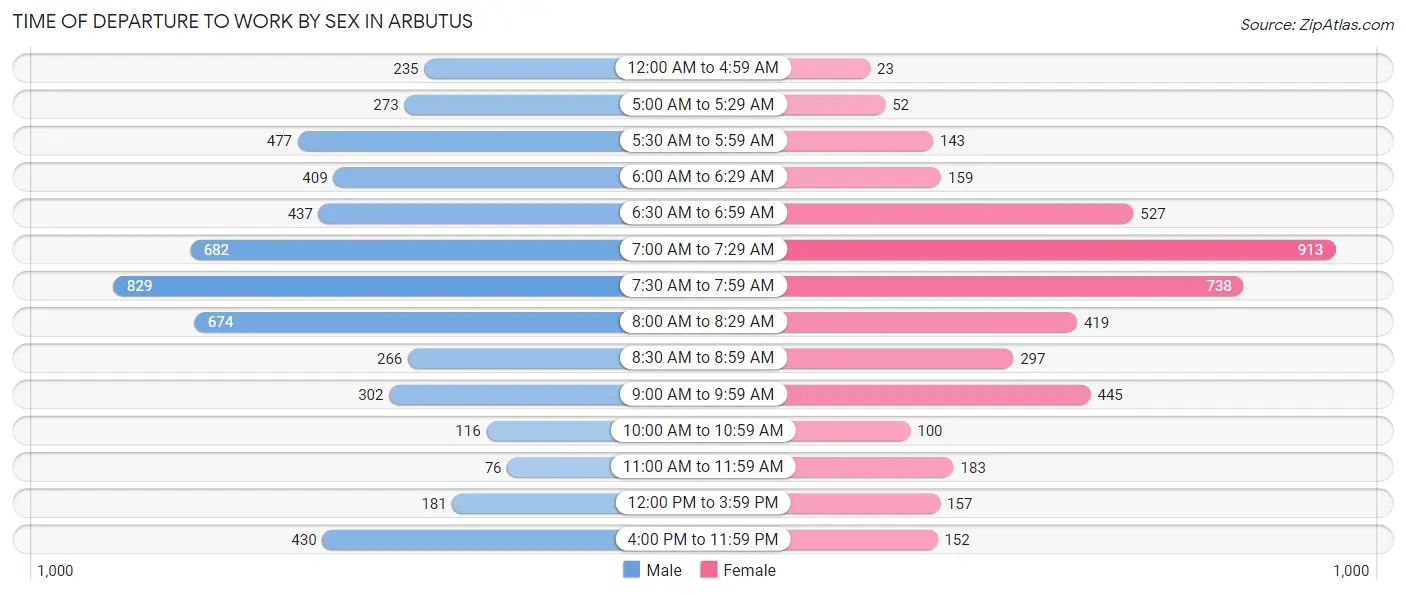
| Time of Departure | Male | Female |
| 12:00 AM to 4:59 AM | 235 (4.4%) | 23 (0.5%) |
| 5:00 AM to 5:29 AM | 273 (5.1%) | 52 (1.2%) |
| 5:30 AM to 5:59 AM | 477 (8.8%) | 143 (3.3%) |
| 6:00 AM to 6:29 AM | 409 (7.6%) | 159 (3.7%) |
| 6:30 AM to 6:59 AM | 437 (8.1%) | 527 (12.2%) |
| 7:00 AM to 7:29 AM | 682 (12.7%) | 913 (21.2%) |
| 7:30 AM to 7:59 AM | 829 (15.4%) | 738 (17.1%) |
| 8:00 AM to 8:29 AM | 674 (12.5%) | 419 (9.7%) |
| 8:30 AM to 8:59 AM | 266 (4.9%) | 297 (6.9%) |
| 9:00 AM to 9:59 AM | 302 (5.6%) | 445 (10.3%) |
| 10:00 AM to 10:59 AM | 116 (2.1%) | 100 (2.3%) |
| 11:00 AM to 11:59 AM | 76 (1.4%) | 183 (4.3%) |
| 12:00 PM to 3:59 PM | 181 (3.4%) | 157 (3.6%) |
| 4:00 PM to 11:59 PM | 430 (8.0%) | 152 (3.5%) |
| Total | 5,387 (100.0%) | 4,308 (100.0%) |
Housing Occupancy in Arbutus
Occupancy by Ownership in Arbutus
Of the total 7,976 dwellings in Arbutus, owner-occupied units account for 5,970 (74.9%), while renter-occupied units make up 2,006 (25.2%).
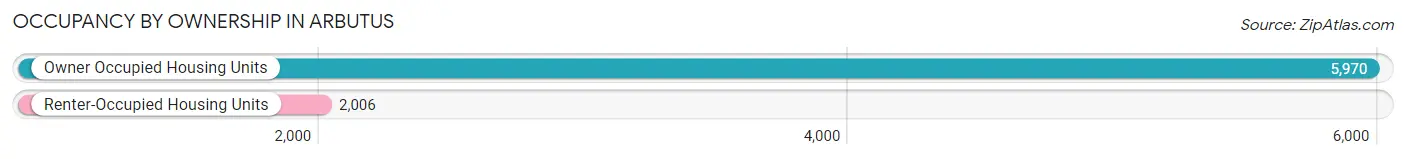
| Occupancy | # Housing Units | % Housing Units |
| Owner Occupied Housing Units | 5,970 | 74.9% |
| Renter-Occupied Housing Units | 2,006 | 25.2% |
| Total Occupied Housing Units | 7,976 | 100.0% |
Occupancy by Household Size in Arbutus
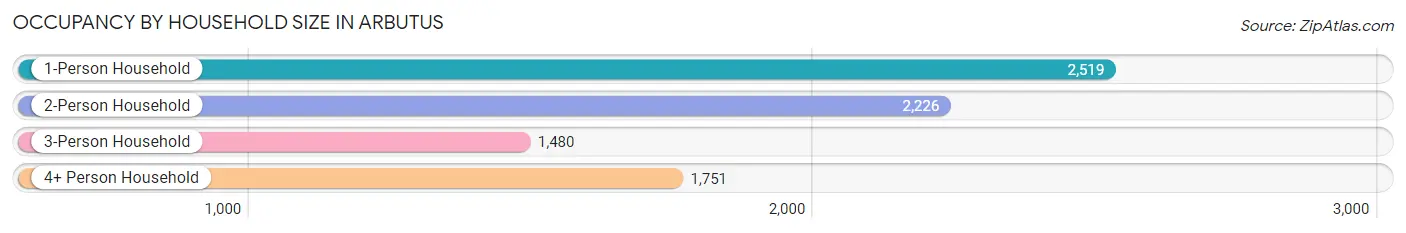
| Household Size | # Housing Units | % Housing Units |
| 1-Person Household | 2,519 | 31.6% |
| 2-Person Household | 2,226 | 27.9% |
| 3-Person Household | 1,480 | 18.6% |
| 4+ Person Household | 1,751 | 22.0% |
| Total Housing Units | 7,976 | 100.0% |
Occupancy by Ownership by Household Size in Arbutus
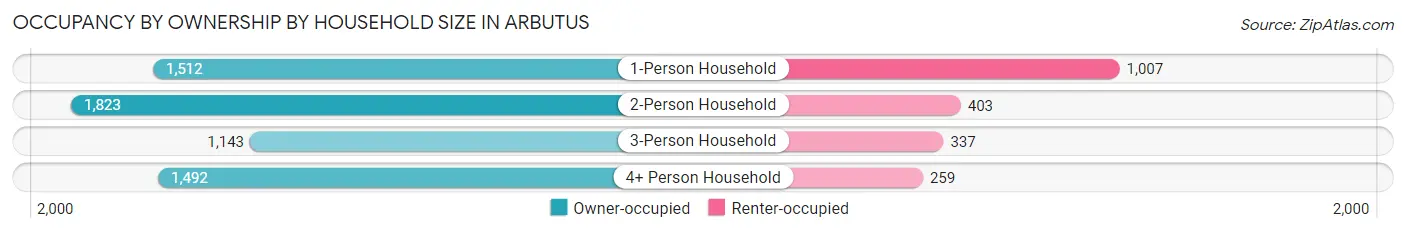
| Household Size | Owner-occupied | Renter-occupied |
| 1-Person Household | 1,512 (60.0%) | 1,007 (40.0%) |
| 2-Person Household | 1,823 (81.9%) | 403 (18.1%) |
| 3-Person Household | 1,143 (77.2%) | 337 (22.8%) |
| 4+ Person Household | 1,492 (85.2%) | 259 (14.8%) |
| Total Housing Units | 5,970 (74.9%) | 2,006 (25.2%) |
Occupancy by Educational Attainment in Arbutus
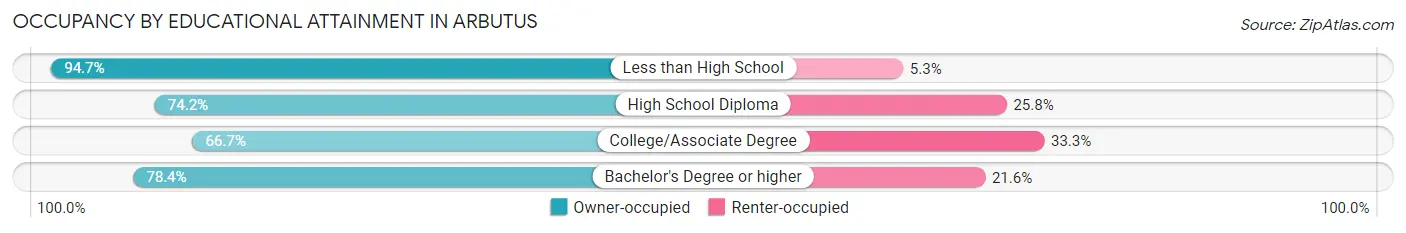
| Household Size | Owner-occupied | Renter-occupied |
| Less than High School | 482 (94.7%) | 27 (5.3%) |
| High School Diploma | 1,185 (74.2%) | 413 (25.8%) |
| College/Associate Degree | 1,707 (66.7%) | 852 (33.3%) |
| Bachelor's Degree or higher | 2,596 (78.4%) | 714 (21.6%) |
Occupancy by Age of Householder in Arbutus
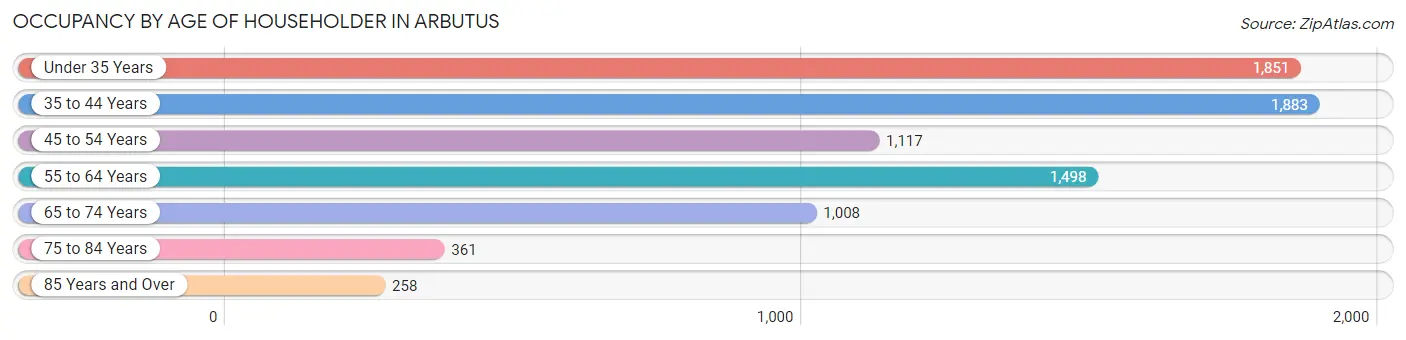
| Age Bracket | # Households | % Households |
| Under 35 Years | 1,851 | 23.2% |
| 35 to 44 Years | 1,883 | 23.6% |
| 45 to 54 Years | 1,117 | 14.0% |
| 55 to 64 Years | 1,498 | 18.8% |
| 65 to 74 Years | 1,008 | 12.6% |
| 75 to 84 Years | 361 | 4.5% |
| 85 Years and Over | 258 | 3.2% |
| Total | 7,976 | 100.0% |
Housing Finances in Arbutus
Median Income by Occupancy in Arbutus
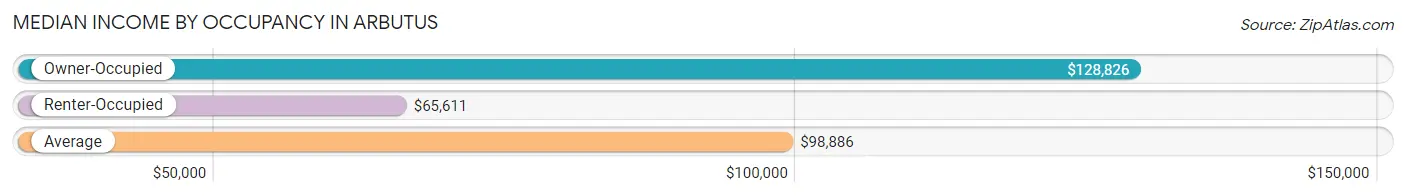
| Occupancy Type | # Households | Median Income |
| Owner-Occupied | 5,970 (74.9%) | $128,826 |
| Renter-Occupied | 2,006 (25.2%) | $65,611 |
| Average | 7,976 (100.0%) | $98,886 |
Occupancy by Householder Income Bracket in Arbutus
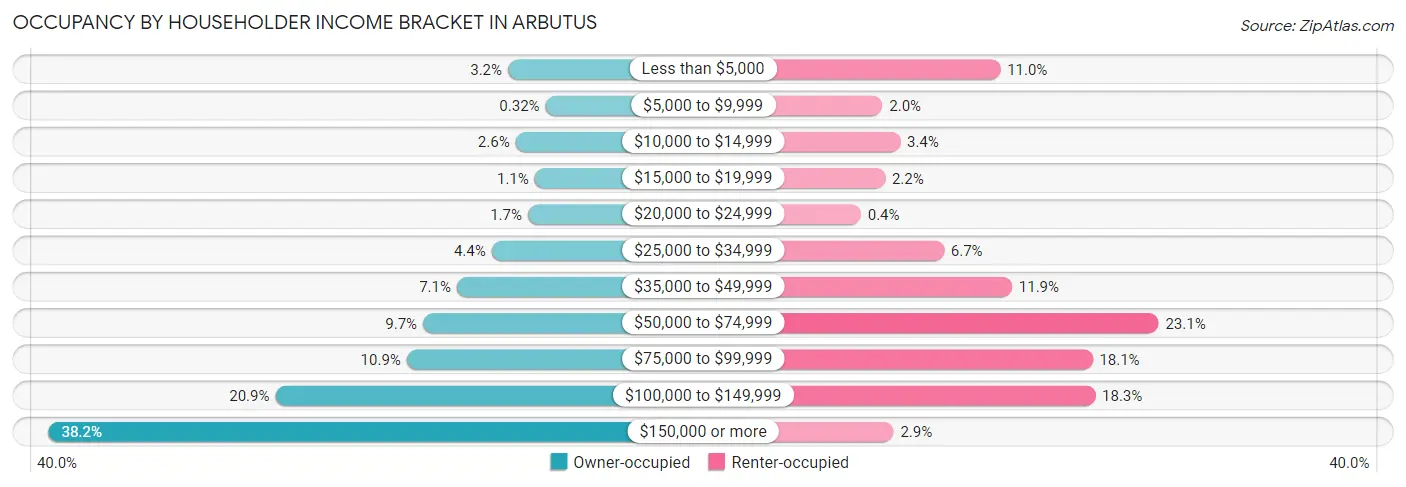
| Income Bracket | Owner-occupied | Renter-occupied |
| Less than $5,000 | 190 (3.2%) | 221 (11.0%) |
| $5,000 to $9,999 | 19 (0.3%) | 41 (2.0%) |
| $10,000 to $14,999 | 155 (2.6%) | 68 (3.4%) |
| $15,000 to $19,999 | 68 (1.1%) | 45 (2.2%) |
| $20,000 to $24,999 | 99 (1.7%) | 8 (0.4%) |
| $25,000 to $34,999 | 264 (4.4%) | 135 (6.7%) |
| $35,000 to $49,999 | 422 (7.1%) | 239 (11.9%) |
| $50,000 to $74,999 | 576 (9.7%) | 463 (23.1%) |
| $75,000 to $99,999 | 650 (10.9%) | 362 (18.0%) |
| $100,000 to $149,999 | 1,248 (20.9%) | 366 (18.2%) |
| $150,000 or more | 2,279 (38.2%) | 58 (2.9%) |
| Total | 5,970 (100.0%) | 2,006 (100.0%) |
Monthly Housing Cost Tiers in Arbutus
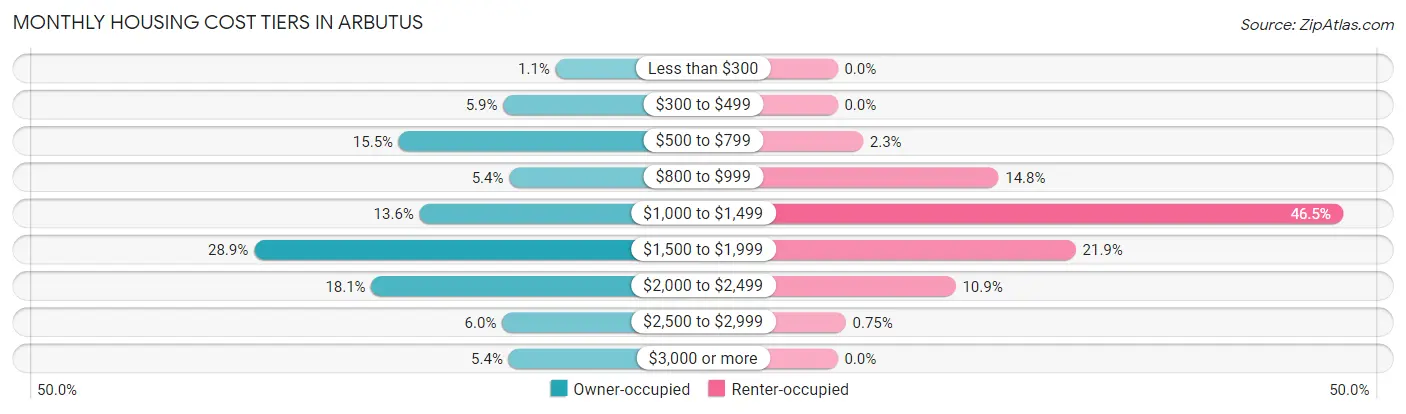
| Monthly Cost | Owner-occupied | Renter-occupied |
| Less than $300 | 66 (1.1%) | 0 (0.0%) |
| $300 to $499 | 354 (5.9%) | 0 (0.0%) |
| $500 to $799 | 928 (15.5%) | 47 (2.3%) |
| $800 to $999 | 321 (5.4%) | 297 (14.8%) |
| $1,000 to $1,499 | 814 (13.6%) | 933 (46.5%) |
| $1,500 to $1,999 | 1,724 (28.9%) | 440 (21.9%) |
| $2,000 to $2,499 | 1,079 (18.1%) | 218 (10.9%) |
| $2,500 to $2,999 | 360 (6.0%) | 15 (0.7%) |
| $3,000 or more | 324 (5.4%) | 0 (0.0%) |
| Total | 5,970 (100.0%) | 2,006 (100.0%) |
Physical Housing Characteristics in Arbutus
Housing Structures in Arbutus
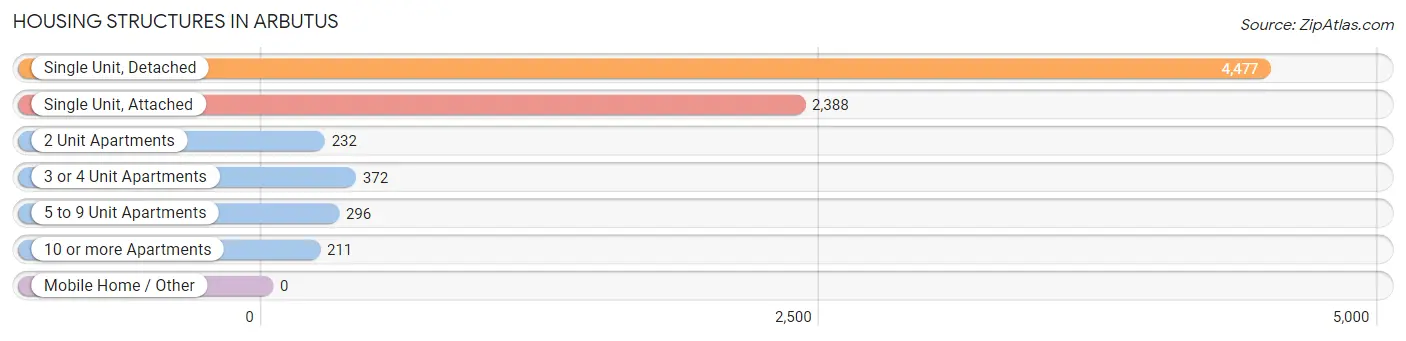
| Structure Type | # Housing Units | % Housing Units |
| Single Unit, Detached | 4,477 | 56.1% |
| Single Unit, Attached | 2,388 | 29.9% |
| 2 Unit Apartments | 232 | 2.9% |
| 3 or 4 Unit Apartments | 372 | 4.7% |
| 5 to 9 Unit Apartments | 296 | 3.7% |
| 10 or more Apartments | 211 | 2.6% |
| Mobile Home / Other | 0 | 0.0% |
| Total | 7,976 | 100.0% |
Housing Structures by Occupancy in Arbutus
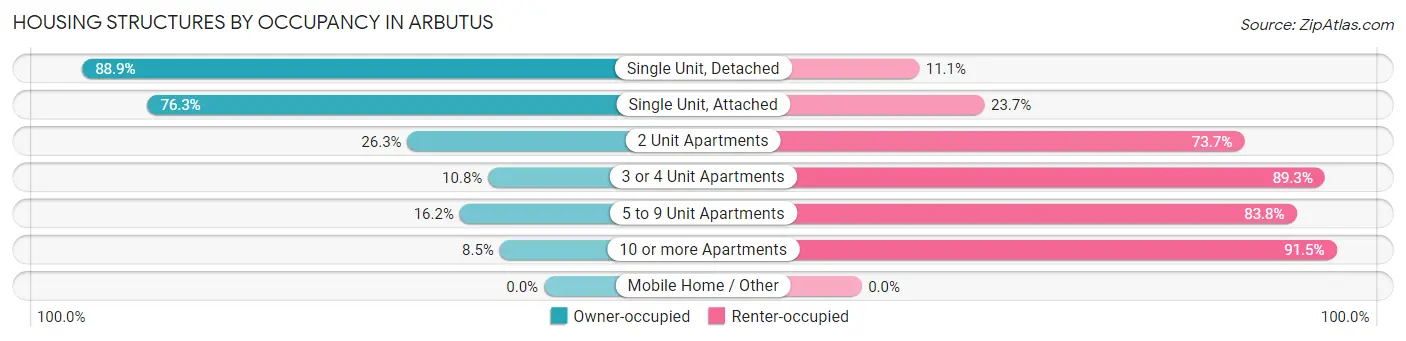
| Structure Type | Owner-occupied | Renter-occupied |
| Single Unit, Detached | 3,980 (88.9%) | 497 (11.1%) |
| Single Unit, Attached | 1,823 (76.3%) | 565 (23.7%) |
| 2 Unit Apartments | 61 (26.3%) | 171 (73.7%) |
| 3 or 4 Unit Apartments | 40 (10.7%) | 332 (89.2%) |
| 5 to 9 Unit Apartments | 48 (16.2%) | 248 (83.8%) |
| 10 or more Apartments | 18 (8.5%) | 193 (91.5%) |
| Mobile Home / Other | 0 (0.0%) | 0 (0.0%) |
| Total | 5,970 (74.9%) | 2,006 (25.2%) |
Housing Structures by Number of Rooms in Arbutus
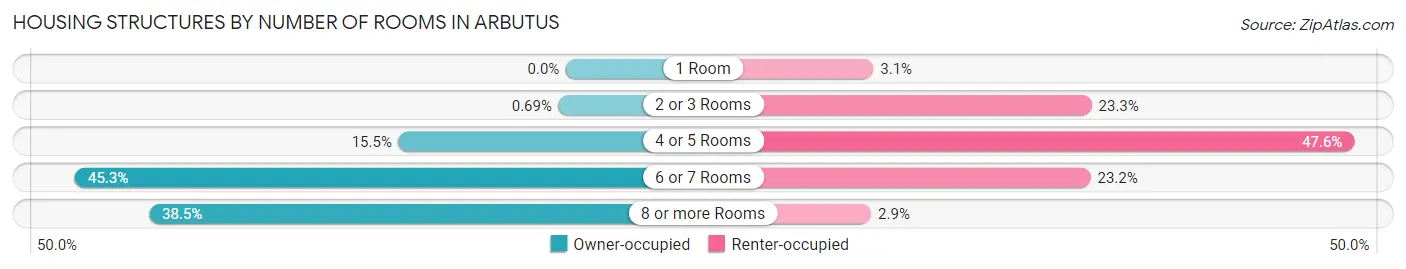
| Number of Rooms | Owner-occupied | Renter-occupied |
| 1 Room | 0 (0.0%) | 62 (3.1%) |
| 2 or 3 Rooms | 41 (0.7%) | 467 (23.3%) |
| 4 or 5 Rooms | 925 (15.5%) | 954 (47.6%) |
| 6 or 7 Rooms | 2,706 (45.3%) | 465 (23.2%) |
| 8 or more Rooms | 2,298 (38.5%) | 58 (2.9%) |
| Total | 5,970 (100.0%) | 2,006 (100.0%) |
Housing Structure by Heating Type in Arbutus
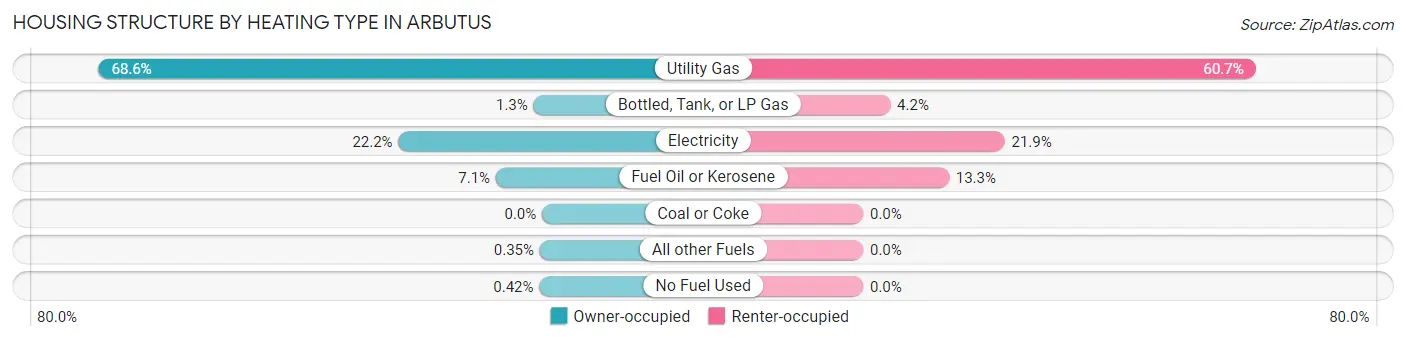
| Heating Type | Owner-occupied | Renter-occupied |
| Utility Gas | 4,094 (68.6%) | 1,217 (60.7%) |
| Bottled, Tank, or LP Gas | 78 (1.3%) | 84 (4.2%) |
| Electricity | 1,326 (22.2%) | 439 (21.9%) |
| Fuel Oil or Kerosene | 426 (7.1%) | 266 (13.3%) |
| Coal or Coke | 0 (0.0%) | 0 (0.0%) |
| All other Fuels | 21 (0.4%) | 0 (0.0%) |
| No Fuel Used | 25 (0.4%) | 0 (0.0%) |
| Total | 5,970 (100.0%) | 2,006 (100.0%) |
Household Vehicle Usage in Arbutus
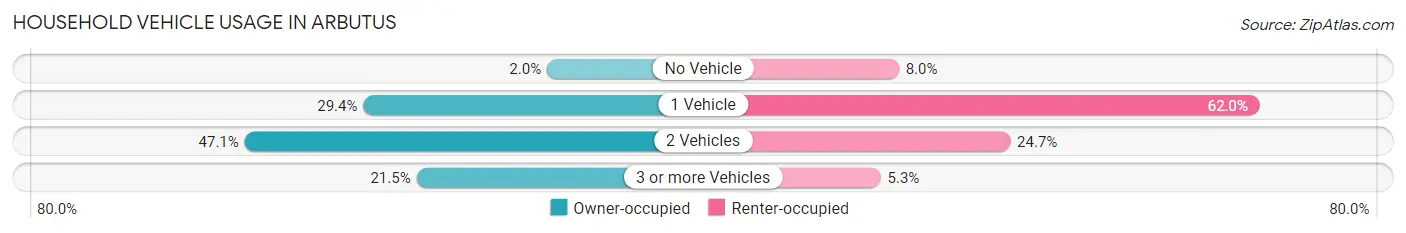
| Vehicles per Household | Owner-occupied | Renter-occupied |
| No Vehicle | 118 (2.0%) | 161 (8.0%) |
| 1 Vehicle | 1,756 (29.4%) | 1,243 (62.0%) |
| 2 Vehicles | 2,814 (47.1%) | 495 (24.7%) |
| 3 or more Vehicles | 1,282 (21.5%) | 107 (5.3%) |
| Total | 5,970 (100.0%) | 2,006 (100.0%) |
Real Estate & Mortgages in Arbutus
Real Estate and Mortgage Overview in Arbutus
| Characteristic | Without Mortgage | With Mortgage |
| Housing Units | 1,505 | 4,465 |
| Median Property Value | $276,900 | $284,800 |
| Median Household Income | $82,689 | $1,760 |
| Monthly Housing Costs | $636 | $324 |
| Real Estate Taxes | $3,117 | $193 |
Property Value by Mortgage Status in Arbutus
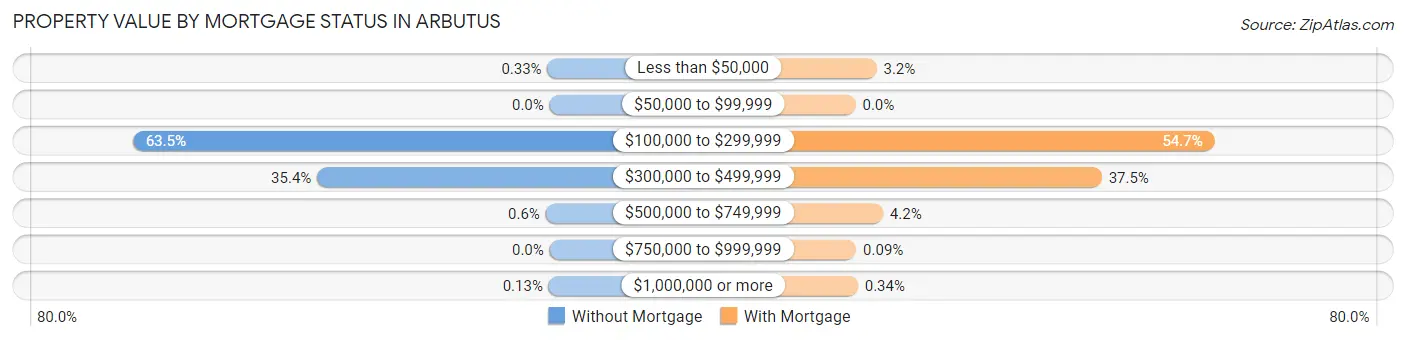
| Property Value | Without Mortgage | With Mortgage |
| Less than $50,000 | 5 (0.3%) | 143 (3.2%) |
| $50,000 to $99,999 | 0 (0.0%) | 0 (0.0%) |
| $100,000 to $299,999 | 956 (63.5%) | 2,442 (54.7%) |
| $300,000 to $499,999 | 533 (35.4%) | 1,675 (37.5%) |
| $500,000 to $749,999 | 9 (0.6%) | 186 (4.2%) |
| $750,000 to $999,999 | 0 (0.0%) | 4 (0.1%) |
| $1,000,000 or more | 2 (0.1%) | 15 (0.3%) |
| Total | 1,505 (100.0%) | 4,465 (100.0%) |
Household Income by Mortgage Status in Arbutus
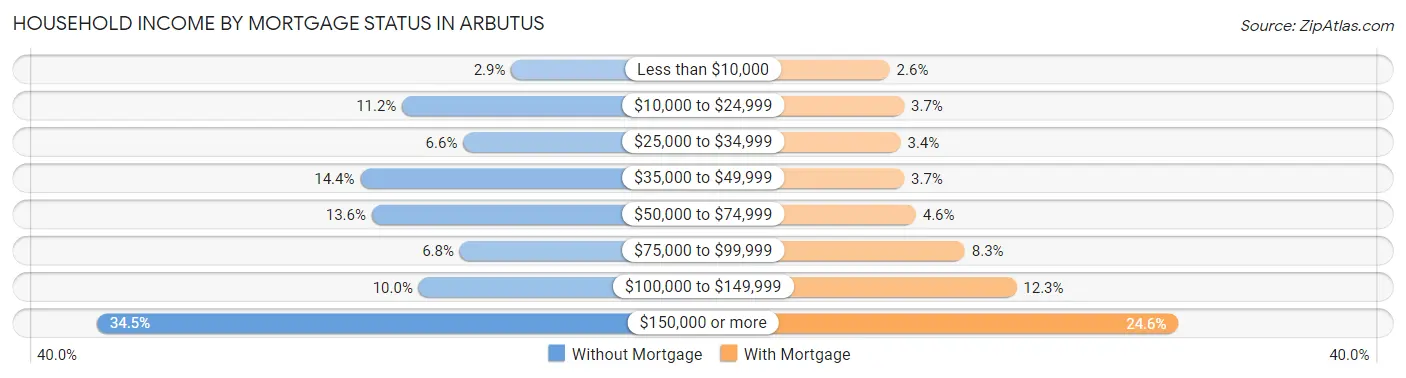
| Household Income | Without Mortgage | With Mortgage |
| Less than $10,000 | 44 (2.9%) | 116 (2.6%) |
| $10,000 to $24,999 | 169 (11.2%) | 165 (3.7%) |
| $25,000 to $34,999 | 99 (6.6%) | 153 (3.4%) |
| $35,000 to $49,999 | 217 (14.4%) | 165 (3.7%) |
| $50,000 to $74,999 | 204 (13.6%) | 205 (4.6%) |
| $75,000 to $99,999 | 103 (6.8%) | 372 (8.3%) |
| $100,000 to $149,999 | 150 (10.0%) | 547 (12.2%) |
| $150,000 or more | 519 (34.5%) | 1,098 (24.6%) |
| Total | 1,505 (100.0%) | 4,465 (100.0%) |
Property Value to Household Income Ratio in Arbutus
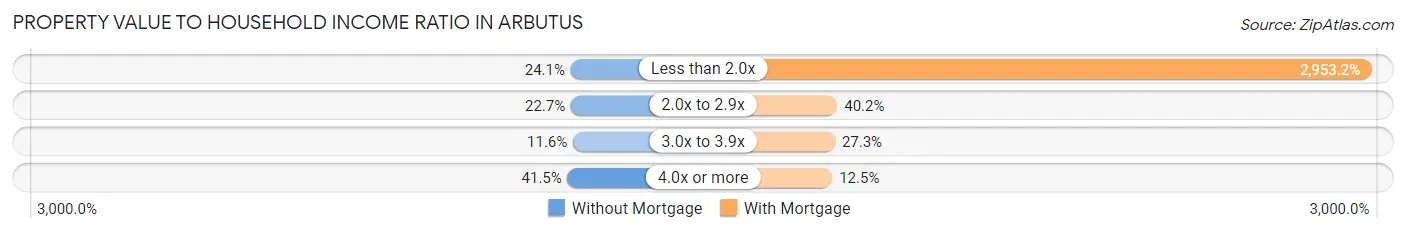
| Value-to-Income Ratio | Without Mortgage | With Mortgage |
| Less than 2.0x | 363 (24.1%) | 131,860 (2,953.2%) |
| 2.0x to 2.9x | 342 (22.7%) | 1,793 (40.2%) |
| 3.0x to 3.9x | 175 (11.6%) | 1,218 (27.3%) |
| 4.0x or more | 625 (41.5%) | 559 (12.5%) |
| Total | 1,505 (100.0%) | 4,465 (100.0%) |
Real Estate Taxes by Mortgage Status in Arbutus
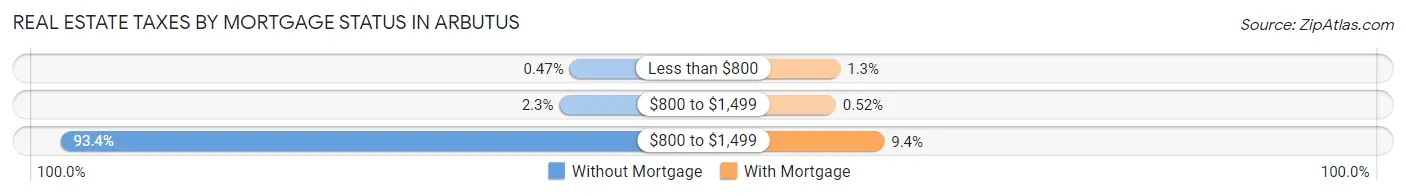
| Property Taxes | Without Mortgage | With Mortgage |
| Less than $800 | 7 (0.5%) | 59 (1.3%) |
| $800 to $1,499 | 35 (2.3%) | 23 (0.5%) |
| $800 to $1,499 | 1,406 (93.4%) | 418 (9.4%) |
| Total | 1,505 (100.0%) | 4,465 (100.0%) |
Health & Disability in Arbutus
Health Insurance Coverage by Age in Arbutus
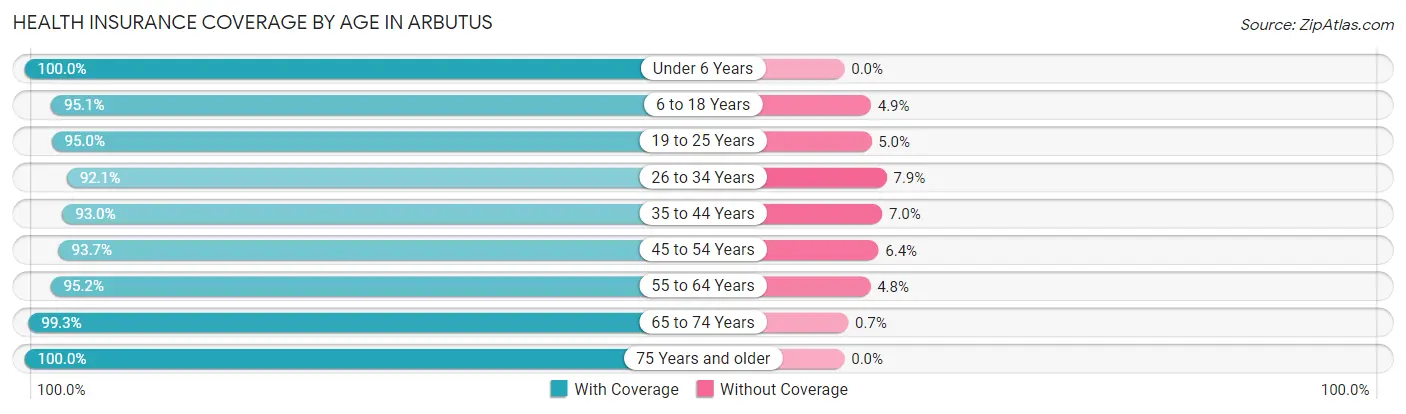
| Age Bracket | With Coverage | Without Coverage |
| Under 6 Years | 1,597 (100.0%) | 0 (0.0%) |
| 6 to 18 Years | 2,634 (95.1%) | 137 (4.9%) |
| 19 to 25 Years | 1,549 (95.0%) | 82 (5.0%) |
| 26 to 34 Years | 2,910 (92.1%) | 249 (7.9%) |
| 35 to 44 Years | 3,102 (93.0%) | 235 (7.0%) |
| 45 to 54 Years | 2,124 (93.6%) | 144 (6.4%) |
| 55 to 64 Years | 2,622 (95.2%) | 133 (4.8%) |
| 65 to 74 Years | 1,558 (99.3%) | 11 (0.7%) |
| 75 Years and older | 937 (100.0%) | 0 (0.0%) |
| Total | 19,033 (95.1%) | 991 (5.0%) |
Health Insurance Coverage by Citizenship Status in Arbutus
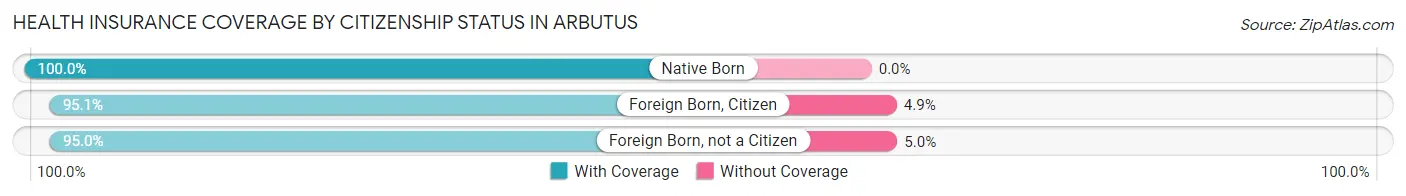
| Citizenship Status | With Coverage | Without Coverage |
| Native Born | 1,597 (100.0%) | 0 (0.0%) |
| Foreign Born, Citizen | 2,634 (95.1%) | 137 (4.9%) |
| Foreign Born, not a Citizen | 1,549 (95.0%) | 82 (5.0%) |
Health Insurance Coverage by Household Income in Arbutus
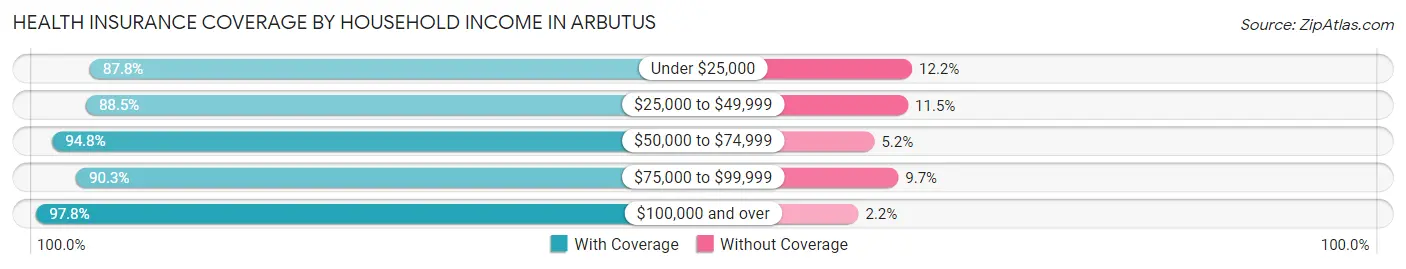
| Household Income | With Coverage | Without Coverage |
| Under $25,000 | 1,040 (87.8%) | 145 (12.2%) |
| $25,000 to $49,999 | 1,755 (88.5%) | 228 (11.5%) |
| $50,000 to $74,999 | 2,011 (94.8%) | 110 (5.2%) |
| $75,000 to $99,999 | 2,217 (90.3%) | 237 (9.7%) |
| $100,000 and over | 11,912 (97.8%) | 268 (2.2%) |
Public vs Private Health Insurance Coverage by Age in Arbutus
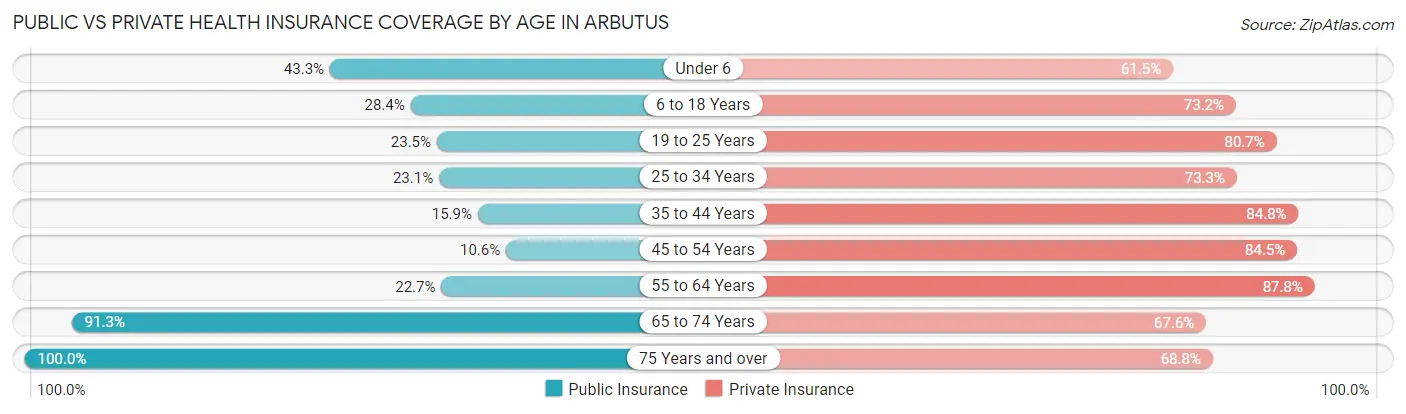
| Age Bracket | Public Insurance | Private Insurance |
| Under 6 | 692 (43.3%) | 982 (61.5%) |
| 6 to 18 Years | 786 (28.4%) | 2,027 (73.2%) |
| 19 to 25 Years | 383 (23.5%) | 1,316 (80.7%) |
| 25 to 34 Years | 729 (23.1%) | 2,316 (73.3%) |
| 35 to 44 Years | 530 (15.9%) | 2,828 (84.8%) |
| 45 to 54 Years | 241 (10.6%) | 1,917 (84.5%) |
| 55 to 64 Years | 624 (22.7%) | 2,418 (87.8%) |
| 65 to 74 Years | 1,432 (91.3%) | 1,061 (67.6%) |
| 75 Years and over | 937 (100.0%) | 645 (68.8%) |
| Total | 6,354 (31.7%) | 15,510 (77.5%) |
Disability Status by Sex by Age in Arbutus
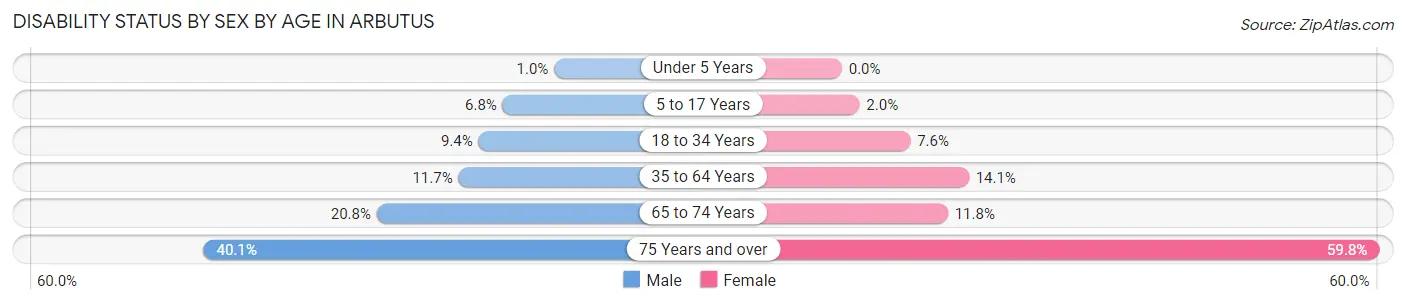
| Age Bracket | Male | Female |
| Under 5 Years | 7 (1.0%) | 0 (0.0%) |
| 5 to 17 Years | 104 (6.8%) | 21 (2.0%) |
| 18 to 34 Years | 263 (9.4%) | 178 (7.6%) |
| 35 to 64 Years | 506 (11.7%) | 569 (14.1%) |
| 65 to 74 Years | 143 (20.8%) | 104 (11.8%) |
| 75 Years and over | 119 (40.1%) | 383 (59.8%) |
Disability Class by Sex by Age in Arbutus
Disability Class: Hearing Difficulty
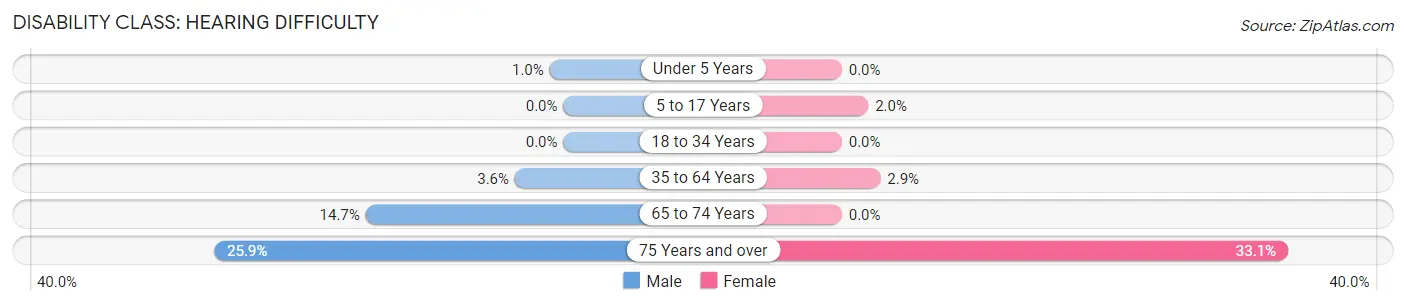
| Age Bracket | Male | Female |
| Under 5 Years | 7 (1.0%) | 0 (0.0%) |
| 5 to 17 Years | 0 (0.0%) | 21 (2.0%) |
| 18 to 34 Years | 0 (0.0%) | 0 (0.0%) |
| 35 to 64 Years | 156 (3.6%) | 115 (2.9%) |
| 65 to 74 Years | 101 (14.7%) | 0 (0.0%) |
| 75 Years and over | 77 (25.9%) | 212 (33.1%) |
Disability Class: Vision Difficulty
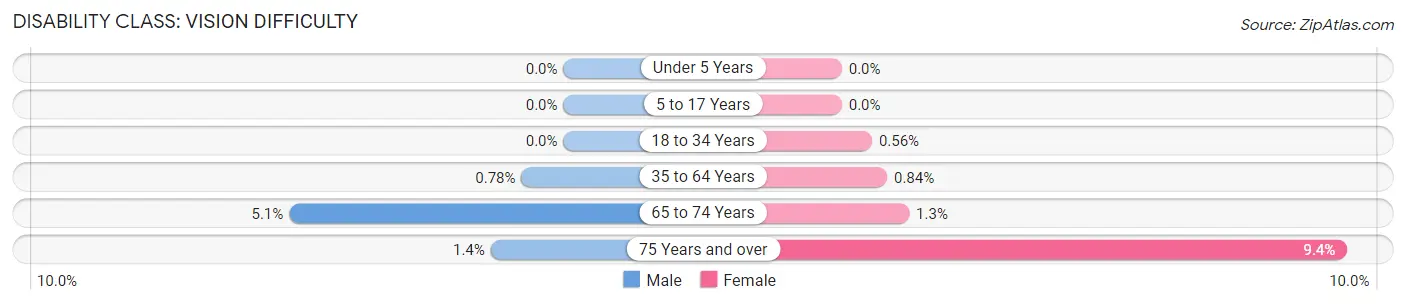
| Age Bracket | Male | Female |
| Under 5 Years | 0 (0.0%) | 0 (0.0%) |
| 5 to 17 Years | 0 (0.0%) | 0 (0.0%) |
| 18 to 34 Years | 0 (0.0%) | 13 (0.6%) |
| 35 to 64 Years | 34 (0.8%) | 34 (0.8%) |
| 65 to 74 Years | 35 (5.1%) | 11 (1.3%) |
| 75 Years and over | 4 (1.3%) | 60 (9.4%) |
Disability Class: Cognitive Difficulty
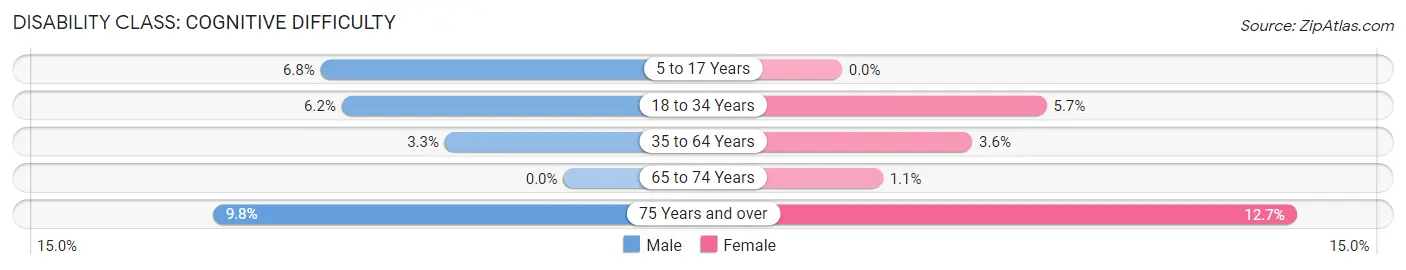
| Age Bracket | Male | Female |
| 5 to 17 Years | 104 (6.8%) | 0 (0.0%) |
| 18 to 34 Years | 172 (6.2%) | 133 (5.7%) |
| 35 to 64 Years | 143 (3.3%) | 146 (3.6%) |
| 65 to 74 Years | 0 (0.0%) | 10 (1.1%) |
| 75 Years and over | 29 (9.8%) | 81 (12.7%) |
Disability Class: Ambulatory Difficulty
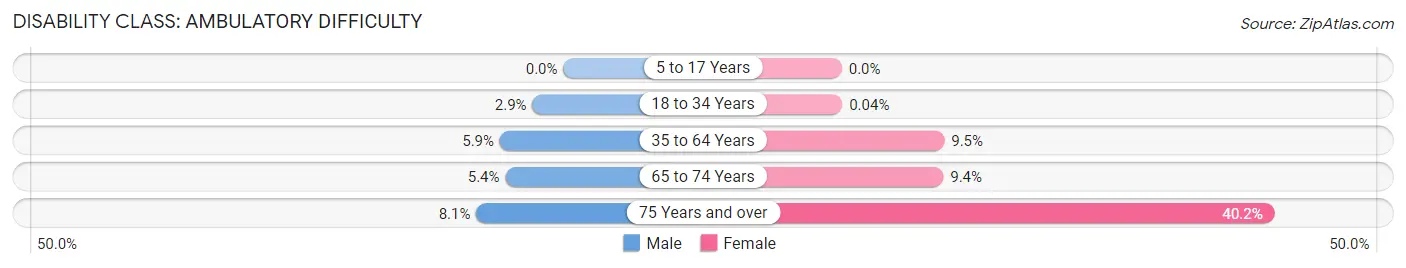
| Age Bracket | Male | Female |
| 5 to 17 Years | 0 (0.0%) | 0 (0.0%) |
| 18 to 34 Years | 80 (2.9%) | 1 (0.0%) |
| 35 to 64 Years | 255 (5.9%) | 383 (9.5%) |
| 65 to 74 Years | 37 (5.4%) | 83 (9.4%) |
| 75 Years and over | 24 (8.1%) | 257 (40.2%) |
Disability Class: Self-Care Difficulty
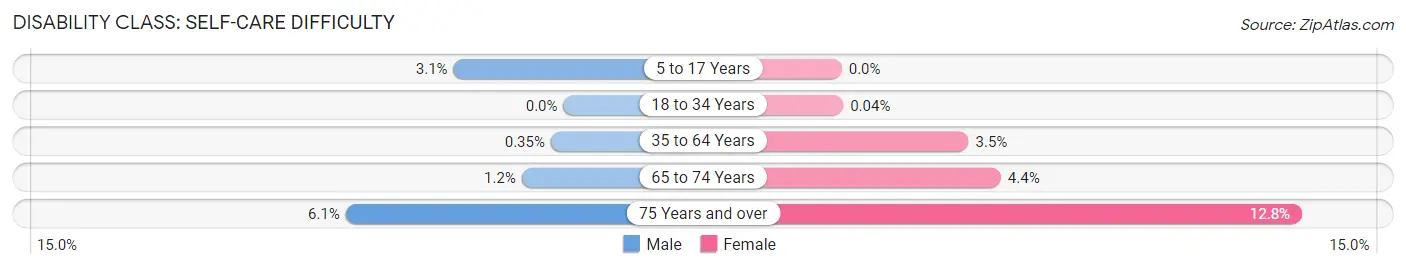
| Age Bracket | Male | Female |
| 5 to 17 Years | 47 (3.1%) | 0 (0.0%) |
| 18 to 34 Years | 0 (0.0%) | 1 (0.0%) |
| 35 to 64 Years | 15 (0.4%) | 142 (3.5%) |
| 65 to 74 Years | 8 (1.2%) | 39 (4.4%) |
| 75 Years and over | 18 (6.1%) | 82 (12.8%) |
Technology Access in Arbutus
Computing Device Access in Arbutus
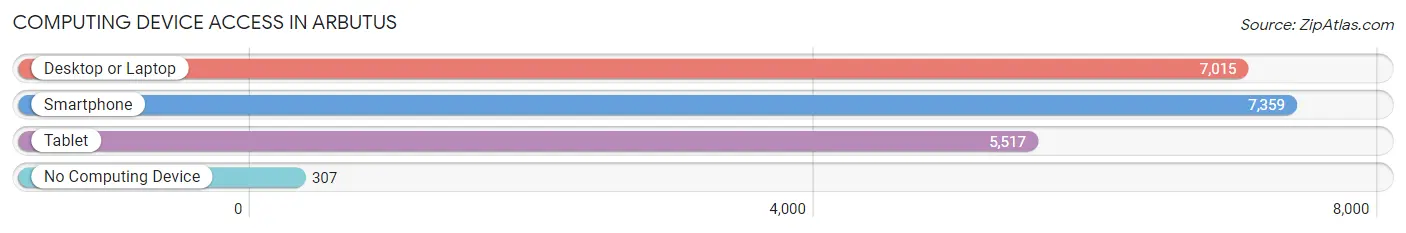
| Device Type | # Households | % Households |
| Desktop or Laptop | 7,015 | 87.9% |
| Smartphone | 7,359 | 92.3% |
| Tablet | 5,517 | 69.2% |
| No Computing Device | 307 | 3.8% |
| Total | 7,976 | 100.0% |
Internet Access in Arbutus
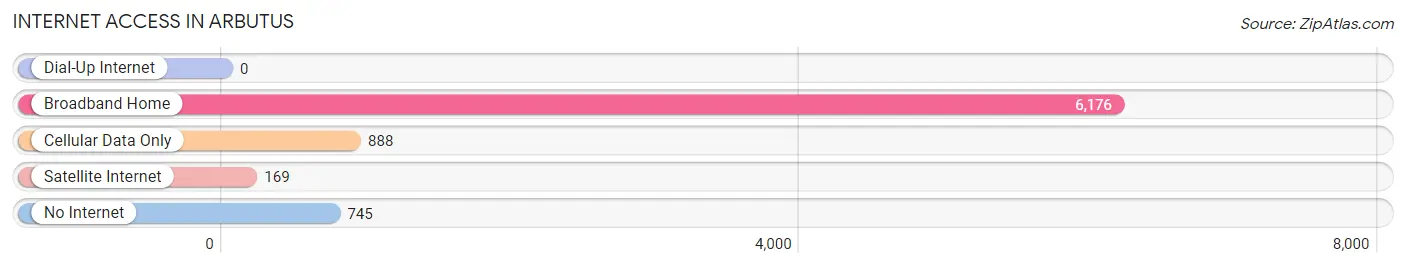
| Internet Type | # Households | % Households |
| Dial-Up Internet | 0 | 0.0% |
| Broadband Home | 6,176 | 77.4% |
| Cellular Data Only | 888 | 11.1% |
| Satellite Internet | 169 | 2.1% |
| No Internet | 745 | 9.3% |
| Total | 7,976 | 100.0% |
Arbutus Summary
Arbutus is a census-designated place (CDP) located in Baltimore County, Maryland. It is situated just southwest of the city of Baltimore and is part of the Baltimore-Washington metropolitan area. The population of Arbutus was 20,483 at the 2000 census.
History
Arbutus was first settled in the late 19th century by German and Irish immigrants. The area was originally known as Relay, after the nearby Relay House, which served as a stop on the Baltimore and Ohio Railroad. The name was changed to Arbutus in 1894, after the Latin name for the strawberry tree, which was abundant in the area.
The area remained largely rural until the 1950s, when suburban development began to spread from Baltimore. The population of Arbutus grew rapidly in the following decades, and the area was officially designated as a CDP in 1980.
Geography
Arbutus is located at 39°14'45" North, 76°41'17" West (39.245833, -76.688056). According to the United States Census Bureau, the CDP has a total area of 4.2 square miles (10.8 km2), all of it land.
Economy
The economy of Arbutus is largely based on retail and services. The area is home to several shopping centers, including the Arbutus Town Center and the Arbutus Village Shopping Center. There are also several restaurants and other businesses in the area.
Demographics
As of the 2000 census, there were 20,483 people, 8,717 households, and 5,717 families residing in the CDP. The population density was 4,867.3 people per square mile (1,878.2/km2). There were 8,945 housing units at an average density of 2,118.3/sq mi (817.3/km2). The racial makeup of the CDP was 87.45% White, 8.45% African American, 0.17% Native American, 1.90% Asian, 0.03% Pacific Islander, 0.63% from other races, and 1.37% from two or more races. Hispanic or Latino of any race were 1.90% of the population.
There were 8,717 households, out of which 28.2% had children under the age of 18 living with them, 51.2% were married couples living together, 11.2% had a female householder with no husband present, and 33.7% were non-families. 28.2% of all households were made up of individuals, and 11.2% had someone living alone who was 65 years of age or older. The average household size was 2.33 and the average family size was 2.86.
In the CDP, the population was spread out, with 21.2% under the age of 18, 6.7% from 18 to 24, 30.2% from 25 to 44, 24.2% from 45 to 64, and 17.7% who were 65 years of age or older. The median age was 40 years. For every 100 females, there were 91.2 males. For every 100 females age 18 and over, there were 87.7 males.
The median income for a household in the CDP was $50,945, and the median income for a family was $60,945. Males had a median income of $41,945 versus $30,945 for females. The per capita income for the CDP was $24,945. About 3.7% of families and 5.2% of the population were below the poverty line, including 6.7% of those under age 18 and 5.2% of those age 65 or over.
Common Questions
What is Per Capita Income in Arbutus?
Per Capita income in Arbutus is $47,163.
What is the Median Family Income in Arbutus?
Median Family Income in Arbutus is $132,377.
What is the Median Household income in Arbutus?
Median Household Income in Arbutus is $98,886.
What is Income or Wage Gap in Arbutus?
Income or Wage Gap in Arbutus is 20.3%.
Women in Arbutus earn 79.7 cents for every dollar earned by a man.
What is Family Income Deficit in Arbutus?
Family Income Deficit in Arbutus is $13,331.
Families that are below poverty line in Arbutus earn $13,331 less on average than the poverty threshold level.
What is Inequality or Gini Index in Arbutus?
Inequality or Gini Index in Arbutus is 0.41.
What is the Total Population of Arbutus?
Total Population of Arbutus is 20,135.
What is the Total Male Population of Arbutus?
Total Male Population of Arbutus is 10,417.
What is the Total Female Population of Arbutus?
Total Female Population of Arbutus is 9,718.
What is the Ratio of Males per 100 Females in Arbutus?
There are 107.19 Males per 100 Females in Arbutus.
What is the Ratio of Females per 100 Males in Arbutus?
There are 93.29 Females per 100 Males in Arbutus.
What is the Median Population Age in Arbutus?
Median Population Age in Arbutus is 37.1 Years.
What is the Average Family Size in Arbutus
Average Family Size in Arbutus is 3.2 People.
What is the Average Household Size in Arbutus
Average Household Size in Arbutus is 2.5 People.
How Large is the Labor Force in Arbutus?
There are 11,896 People in the Labor Forcein in Arbutus.
What is the Percentage of People in the Labor Force in Arbutus?
71.9% of People are in the Labor Force in Arbutus.
What is the Unemployment Rate in Arbutus?
Unemployment Rate in Arbutus is 6.1%.