Hampton, MD Map & Demographics
Hampton Map
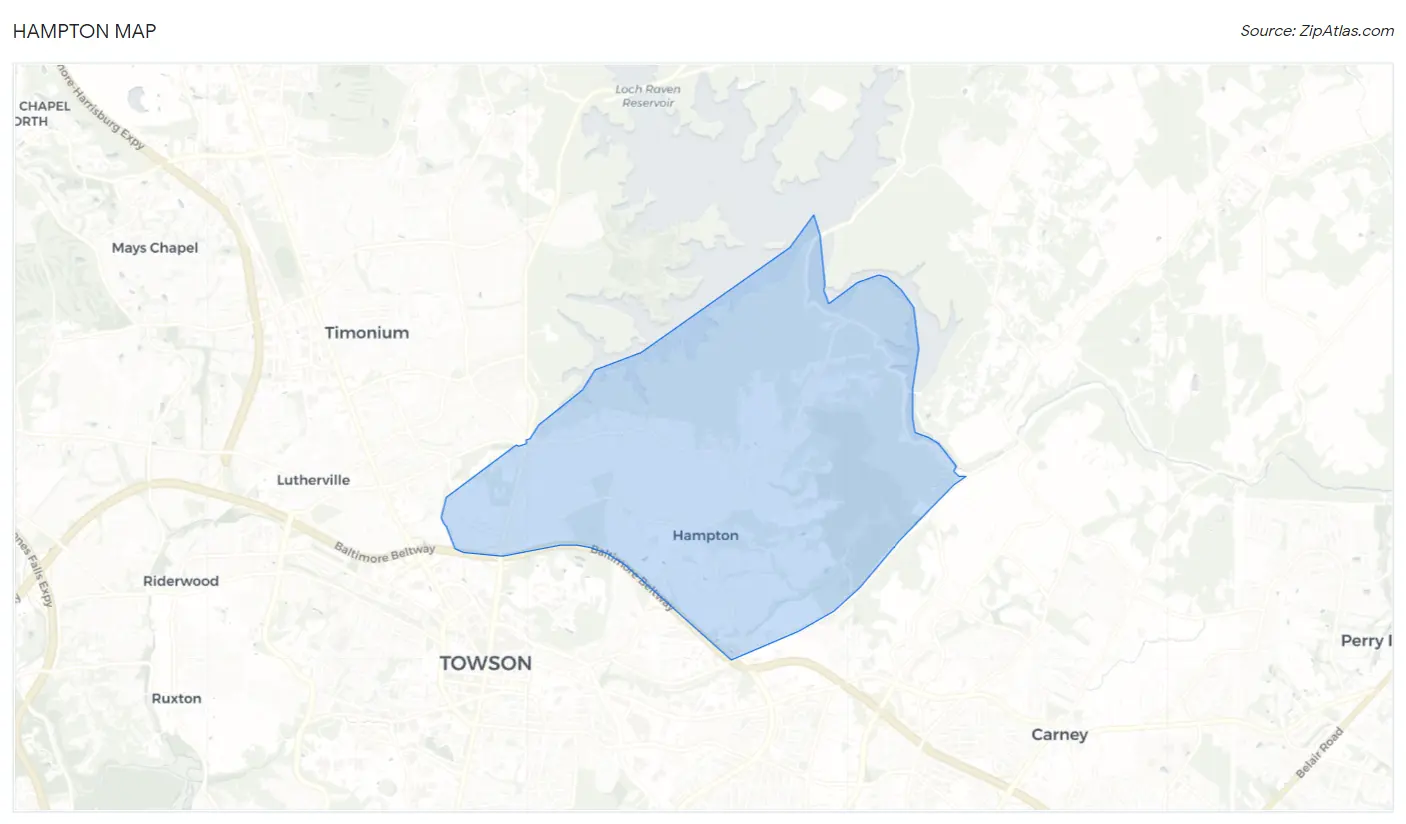
Hampton Overview
$77,207
PER CAPITA INCOME
$180,000
AVG FAMILY INCOME
$169,405
AVG HOUSEHOLD INCOME
32.2%
WAGE / INCOME GAP [ % ]
67.8¢/ $1
WAGE / INCOME GAP [ $ ]
0.40
INEQUALITY / GINI INDEX
5,080
TOTAL POPULATION
2,486
MALE POPULATION
2,594
FEMALE POPULATION
95.84
MALES / 100 FEMALES
104.34
FEMALES / 100 MALES
47.7
MEDIAN AGE
3.0
AVG FAMILY SIZE
2.9
AVG HOUSEHOLD SIZE
2,645
LABOR FORCE [ PEOPLE ]
65.6%
PERCENT IN LABOR FORCE
0.9%
UNEMPLOYMENT RATE
Income in Hampton
Income Overview in Hampton
Per Capita Income in Hampton is $77,207, while median incomes of families and households are $180,000 and $169,405 respectively.
| Characteristic | Number | Measure |
| Per Capita Income | 5,080 | $77,207 |
| Median Family Income | 1,502 | $180,000 |
| Mean Family Income | 1,502 | $233,380 |
| Median Household Income | 1,760 | $169,405 |
| Mean Household Income | 1,760 | $216,463 |
| Income Deficit | 1,502 | $0 |
| Wage / Income Gap (%) | 5,080 | 32.21% |
| Wage / Income Gap ($) | 5,080 | 67.79¢ per $1 |
| Gini / Inequality Index | 5,080 | 0.40 |
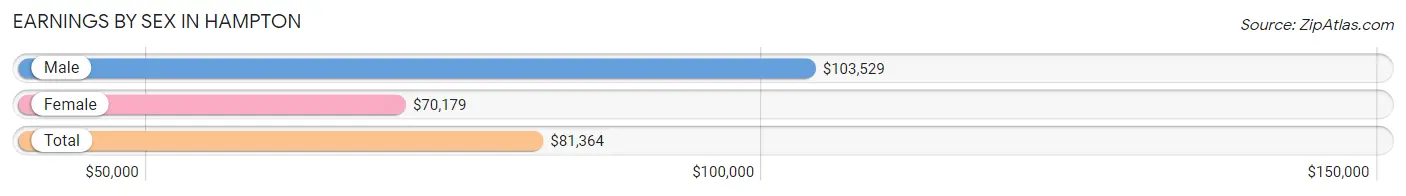
Earnings by Sex in Hampton
Average Earnings in Hampton are $81,364, $103,529 for men and $70,179 for women, a difference of 32.2%.
| Sex | Number | Average Earnings |
| Male | 1,448 (51.1%) | $103,529 |
| Female | 1,388 (48.9%) | $70,179 |
| Total | 2,836 (100.0%) | $81,364 |
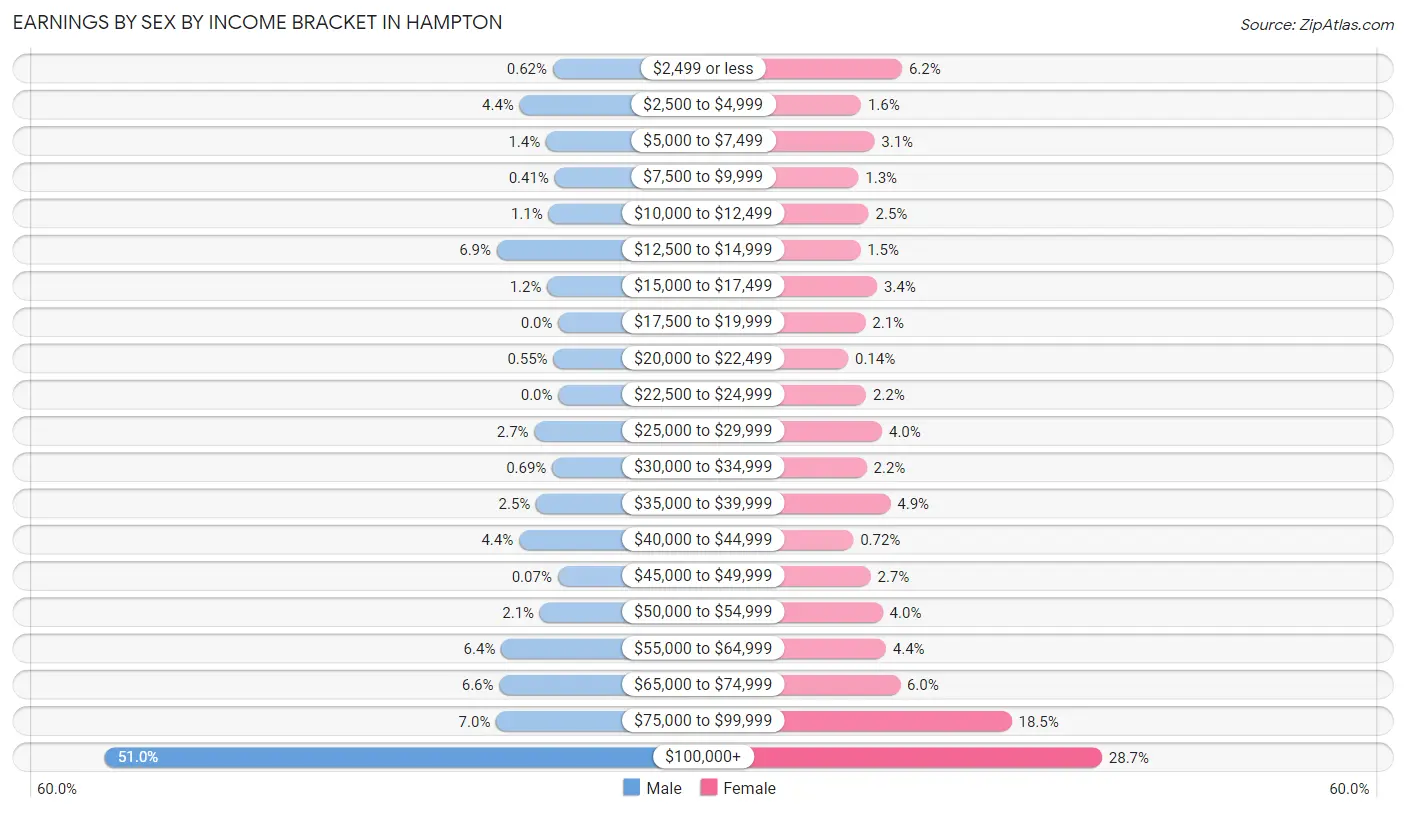
Earnings by Sex by Income Bracket in Hampton
The most common earnings brackets in Hampton are $100,000+ for men (738 | 51.0%) and $100,000+ for women (398 | 28.7%).
| Income | Male | Female |
| $2,499 or less | 9 (0.6%) | 86 (6.2%) |
| $2,500 to $4,999 | 63 (4.3%) | 22 (1.6%) |
| $5,000 to $7,499 | 20 (1.4%) | 43 (3.1%) |
| $7,500 to $9,999 | 6 (0.4%) | 18 (1.3%) |
| $10,000 to $12,499 | 16 (1.1%) | 34 (2.5%) |
| $12,500 to $14,999 | 100 (6.9%) | 21 (1.5%) |
| $15,000 to $17,499 | 18 (1.2%) | 47 (3.4%) |
| $17,500 to $19,999 | 0 (0.0%) | 29 (2.1%) |
| $20,000 to $22,499 | 8 (0.5%) | 2 (0.1%) |
| $22,500 to $24,999 | 0 (0.0%) | 30 (2.2%) |
| $25,000 to $29,999 | 39 (2.7%) | 55 (4.0%) |
| $30,000 to $34,999 | 10 (0.7%) | 31 (2.2%) |
| $35,000 to $39,999 | 36 (2.5%) | 68 (4.9%) |
| $40,000 to $44,999 | 64 (4.4%) | 10 (0.7%) |
| $45,000 to $49,999 | 1 (0.1%) | 37 (2.7%) |
| $50,000 to $54,999 | 30 (2.1%) | 56 (4.0%) |
| $55,000 to $64,999 | 93 (6.4%) | 61 (4.4%) |
| $65,000 to $74,999 | 96 (6.6%) | 83 (6.0%) |
| $75,000 to $99,999 | 101 (7.0%) | 257 (18.5%) |
| $100,000+ | 738 (51.0%) | 398 (28.7%) |
| Total | 1,448 (100.0%) | 1,388 (100.0%) |
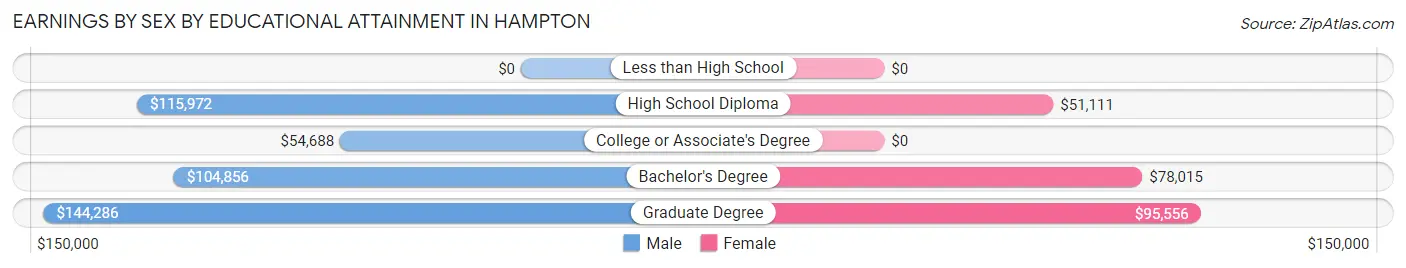
Earnings by Sex by Educational Attainment in Hampton
Average earnings in Hampton are $113,190 for men and $80,398 for women, a difference of 29.0%. Men with an educational attainment of graduate degree enjoy the highest average annual earnings of $144,286, while those with college or associate's degree education earn the least with $54,688. Women with an educational attainment of graduate degree earn the most with the average annual earnings of $95,556, while those with high school diploma education have the smallest earnings of $51,111.
| Educational Attainment | Male Income | Female Income |
| Less than High School | - | - |
| High School Diploma | $115,972 | $51,111 |
| College or Associate's Degree | $54,688 | $0 |
| Bachelor's Degree | $104,856 | $78,015 |
| Graduate Degree | $144,286 | $95,556 |
| Total | $113,190 | $80,398 |
Family Income in Hampton
Family Income Brackets in Hampton
According to the Hampton family income data, there are 700 families falling into the $200,000+ income range, which is the most common income bracket and makes up 46.6% of all families.
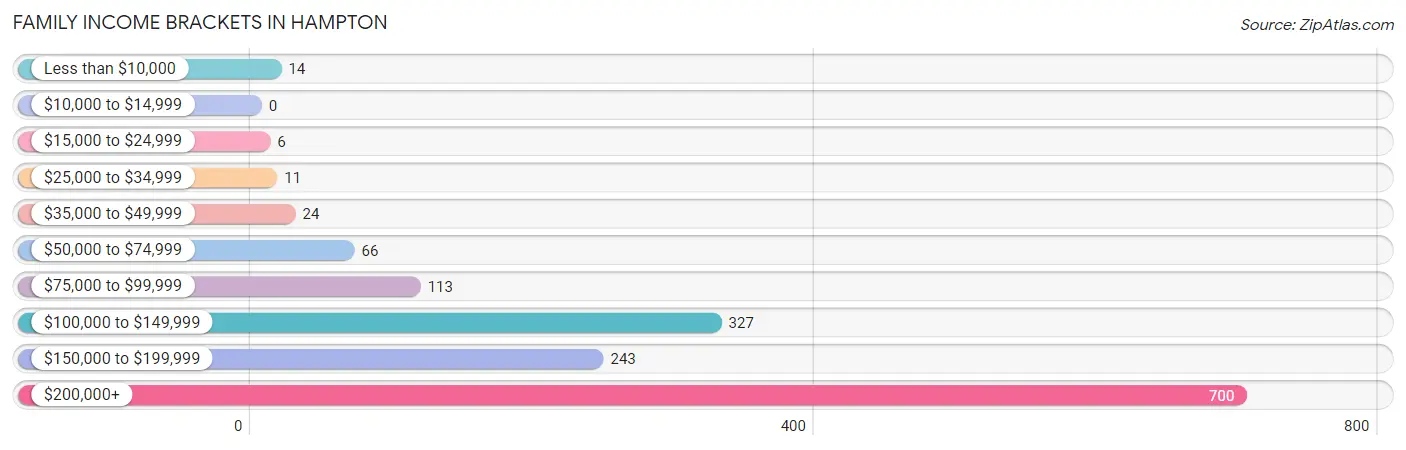
| Income Bracket | # Families | % Families |
| Less than $10,000 | 14 | 0.9% |
| $10,000 to $14,999 | 0 | 0.0% |
| $15,000 to $24,999 | 6 | 0.4% |
| $25,000 to $34,999 | 11 | 0.7% |
| $35,000 to $49,999 | 24 | 1.6% |
| $50,000 to $74,999 | 66 | 4.4% |
| $75,000 to $99,999 | 113 | 7.5% |
| $100,000 to $149,999 | 327 | 21.8% |
| $150,000 to $199,999 | 243 | 16.2% |
| $200,000+ | 700 | 46.6% |
Family Income by Famaliy Size in Hampton
5-person families (68 | 4.5%) account for the highest median family income in Hampton with $250,001 per family, while 2-person families (635 | 42.3%) have the highest median income of $67,266 per family member.
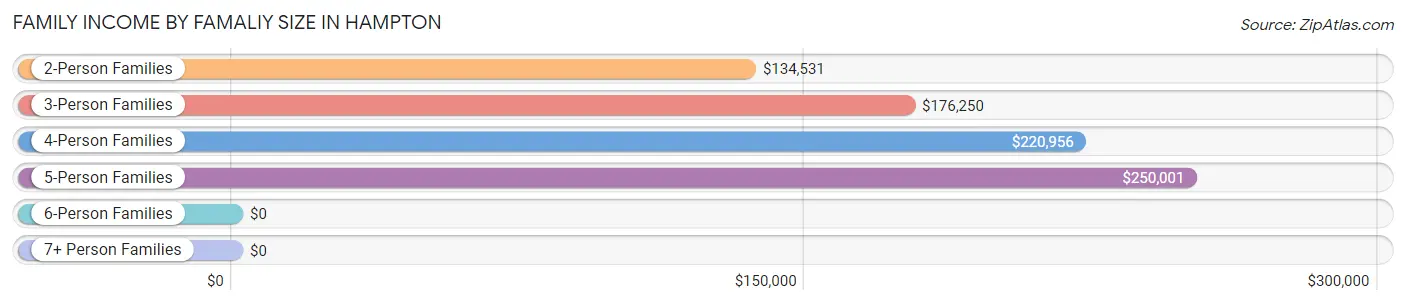
| Income Bracket | # Families | Median Income |
| 2-Person Families | 635 (42.3%) | $134,531 |
| 3-Person Families | 347 (23.1%) | $176,250 |
| 4-Person Families | 437 (29.1%) | $220,956 |
| 5-Person Families | 68 (4.5%) | $250,001 |
| 6-Person Families | 15 (1.0%) | $0 |
| 7+ Person Families | 0 (0.0%) | $0 |
| Total | 1,502 (100.0%) | $180,000 |
Family Income by Number of Earners in Hampton
The median family income in Hampton is $180,000, with families comprising 2 earners (579) having the highest median family income of $232,697, while families with no earners (182) have the lowest median family income of $90,313, accounting for 38.6% and 12.1% of families, respectively.
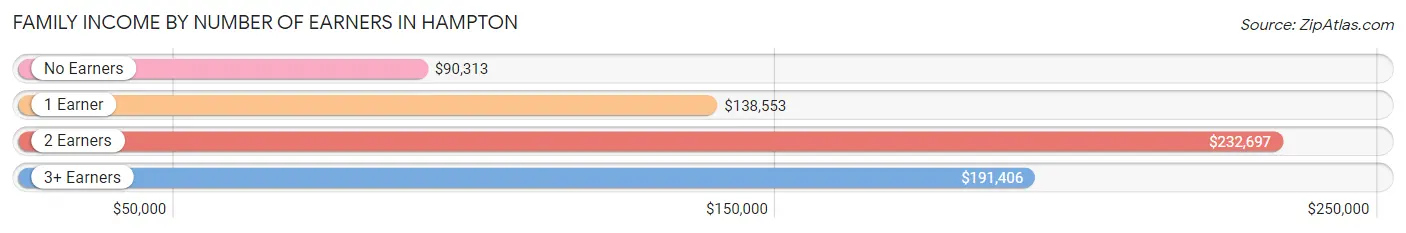
| Number of Earners | # Families | Median Income |
| No Earners | 182 (12.1%) | $90,313 |
| 1 Earner | 472 (31.4%) | $138,553 |
| 2 Earners | 579 (38.6%) | $232,697 |
| 3+ Earners | 269 (17.9%) | $191,406 |
| Total | 1,502 (100.0%) | $180,000 |
Household Income in Hampton
Household Income Brackets in Hampton
With 732 households falling in the category, the $200,000+ income range is the most frequent in Hampton, accounting for 41.6% of all households. In contrast, only 11 households (0.6%) fall into the $10,000 to $14,999 income bracket, making it the least populous group.
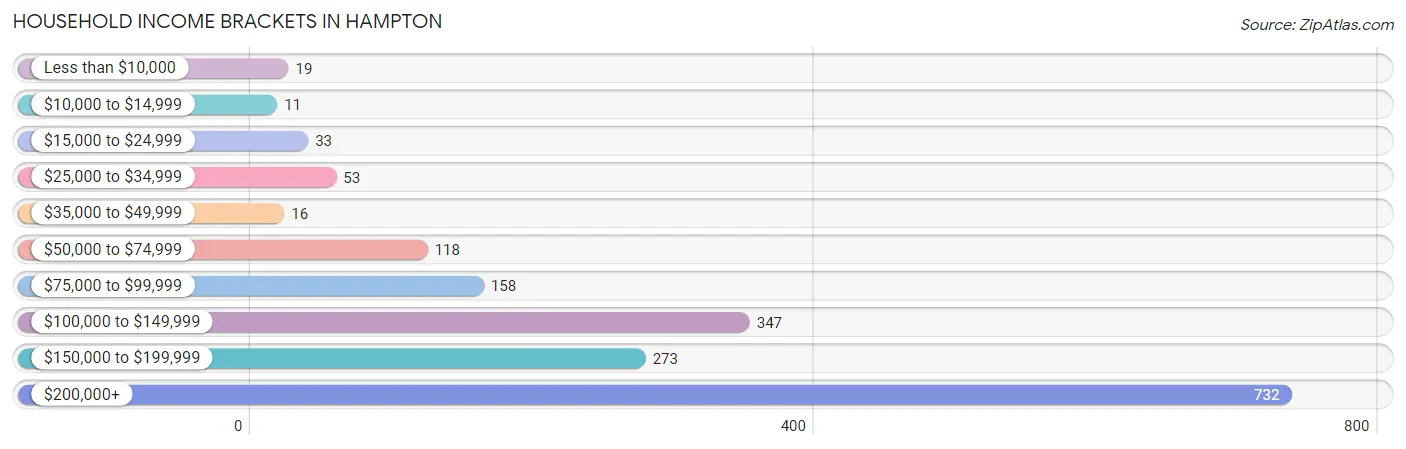
| Income Bracket | # Households | % Households |
| Less than $10,000 | 19 | 1.1% |
| $10,000 to $14,999 | 11 | 0.6% |
| $15,000 to $24,999 | 33 | 1.9% |
| $25,000 to $34,999 | 53 | 3.0% |
| $35,000 to $49,999 | 16 | 0.9% |
| $50,000 to $74,999 | 118 | 6.7% |
| $75,000 to $99,999 | 158 | 9.0% |
| $100,000 to $149,999 | 347 | 19.7% |
| $150,000 to $199,999 | 273 | 15.5% |
| $200,000+ | 732 | 41.6% |
Household Income by Householder Age in Hampton
The median household income in Hampton is $169,405, with the highest median household income of $211,563 found in the 45 to 64 years age bracket for the primary householder. A total of 864 households (49.1%) fall into this category.
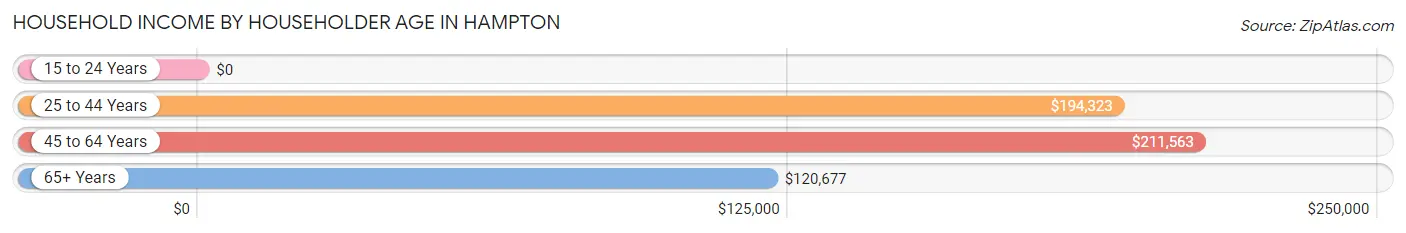
| Income Bracket | # Households | Median Income |
| 15 to 24 Years | 0 (0.0%) | $0 |
| 25 to 44 Years | 335 (19.0%) | $194,323 |
| 45 to 64 Years | 864 (49.1%) | $211,563 |
| 65+ Years | 561 (31.9%) | $120,677 |
| Total | 1,760 (100.0%) | $169,405 |
Poverty in Hampton
Income Below Poverty by Sex and Age in Hampton
With 2.1% poverty level for males and 5.2% for females among the residents of Hampton, 18 to 24 year old males and 16 and 17 year old females are the most vulnerable to poverty, with 30 males (23.4%) and 17 females (20.0%) in their respective age groups living below the poverty level.
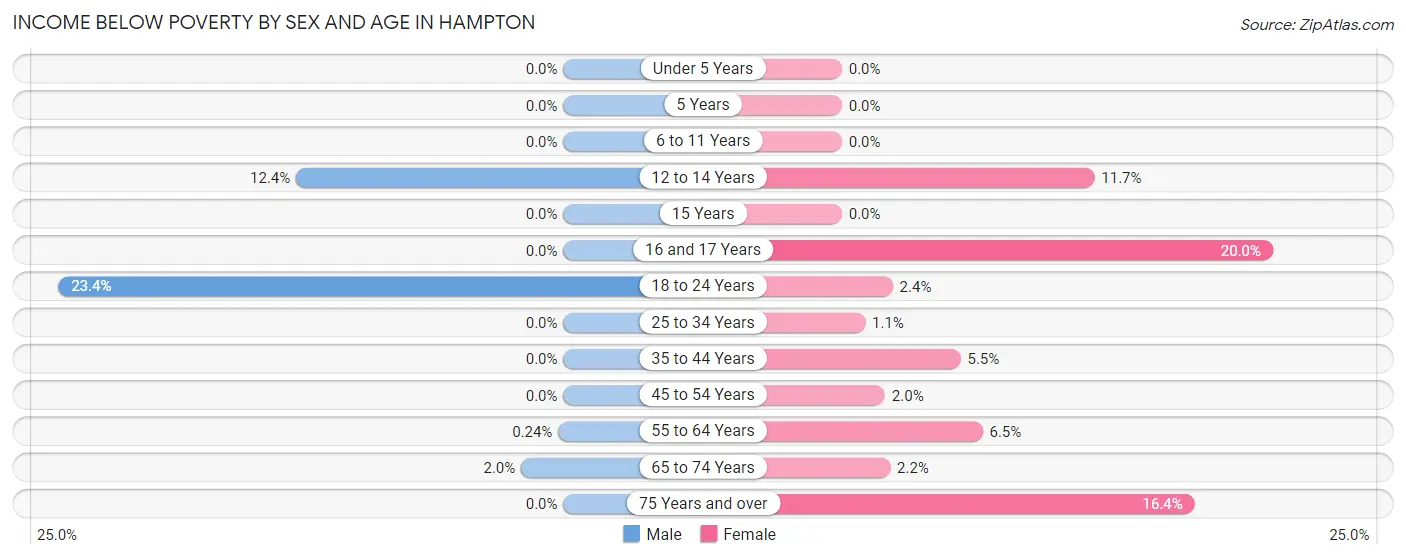
| Age Bracket | Male | Female |
| Under 5 Years | 0 (0.0%) | 0 (0.0%) |
| 5 Years | 0 (0.0%) | 0 (0.0%) |
| 6 to 11 Years | 0 (0.0%) | 0 (0.0%) |
| 12 to 14 Years | 15 (12.4%) | 15 (11.7%) |
| 15 Years | 0 (0.0%) | 0 (0.0%) |
| 16 and 17 Years | 0 (0.0%) | 17 (20.0%) |
| 18 to 24 Years | 30 (23.4%) | 3 (2.4%) |
| 25 to 34 Years | 0 (0.0%) | 2 (1.1%) |
| 35 to 44 Years | 0 (0.0%) | 14 (5.5%) |
| 45 to 54 Years | 0 (0.0%) | 9 (2.0%) |
| 55 to 64 Years | 1 (0.2%) | 31 (6.5%) |
| 65 to 74 Years | 6 (2.0%) | 6 (2.2%) |
| 75 Years and over | 0 (0.0%) | 37 (16.4%) |
| Total | 52 (2.1%) | 134 (5.2%) |
Income Above Poverty by Sex and Age in Hampton
According to the poverty statistics in Hampton, males aged under 5 years and females aged under 5 years are the age groups that are most secure financially, with 100.0% of males and 100.0% of females in these age groups living above the poverty line.
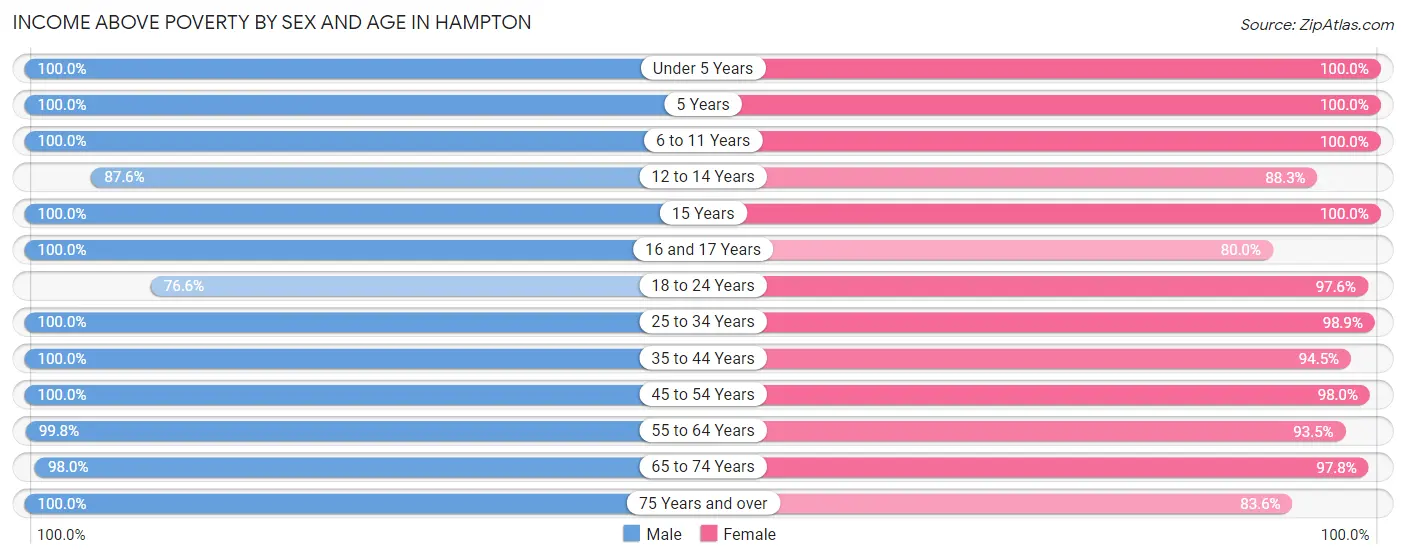
| Age Bracket | Male | Female |
| Under 5 Years | 98 (100.0%) | 111 (100.0%) |
| 5 Years | 65 (100.0%) | 16 (100.0%) |
| 6 to 11 Years | 187 (100.0%) | 163 (100.0%) |
| 12 to 14 Years | 106 (87.6%) | 113 (88.3%) |
| 15 Years | 53 (100.0%) | 106 (100.0%) |
| 16 and 17 Years | 153 (100.0%) | 68 (80.0%) |
| 18 to 24 Years | 98 (76.6%) | 124 (97.6%) |
| 25 to 34 Years | 119 (100.0%) | 183 (98.9%) |
| 35 to 44 Years | 215 (100.0%) | 240 (94.5%) |
| 45 to 54 Years | 409 (100.0%) | 440 (98.0%) |
| 55 to 64 Years | 413 (99.8%) | 444 (93.5%) |
| 65 to 74 Years | 300 (98.0%) | 262 (97.8%) |
| 75 Years and over | 215 (100.0%) | 189 (83.6%) |
| Total | 2,431 (97.9%) | 2,459 (94.8%) |
Income Below Poverty Among Married-Couple Families in Hampton
The poverty statistics for married-couple families in Hampton show that 0.5% or 6 of the total 1,288 families live below the poverty line. Families with no children have the highest poverty rate of 0.8%, comprising of 6 families. On the other hand, families with 1 or 2 children have the lowest poverty rate of 0.0%, which includes 0 families.
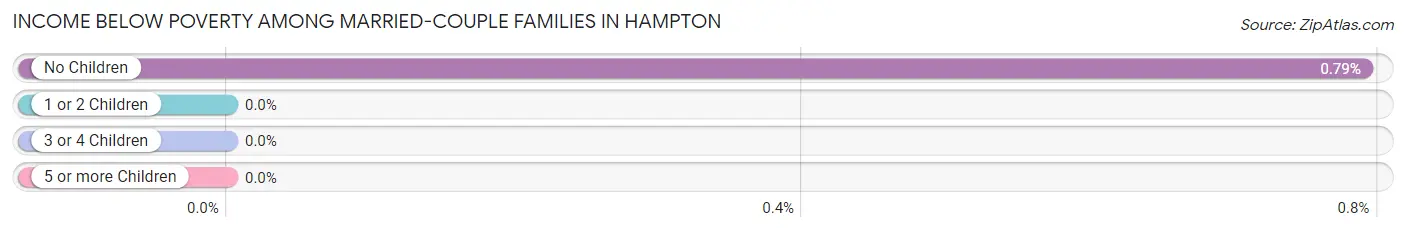
| Children | Above Poverty | Below Poverty |
| No Children | 752 (99.2%) | 6 (0.8%) |
| 1 or 2 Children | 456 (100.0%) | 0 (0.0%) |
| 3 or 4 Children | 74 (100.0%) | 0 (0.0%) |
| 5 or more Children | 0 (0.0%) | 0 (0.0%) |
| Total | 1,282 (99.5%) | 6 (0.5%) |
Income Below Poverty Among Single-Parent Households in Hampton
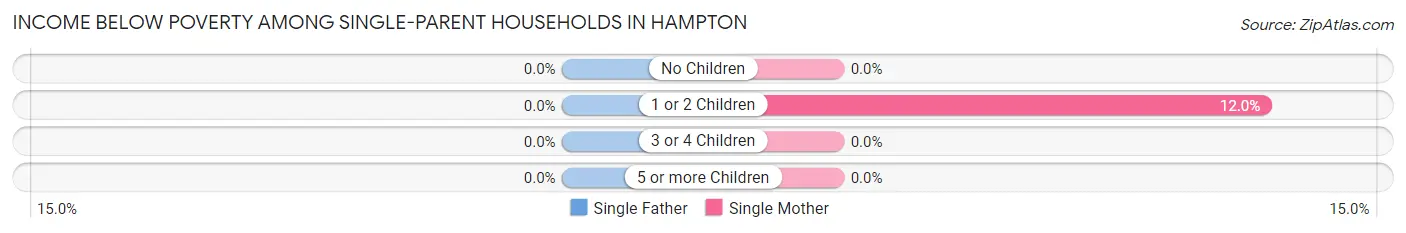
| Children | Single Father | Single Mother |
| No Children | 0 (0.0%) | 0 (0.0%) |
| 1 or 2 Children | 0 (0.0%) | 14 (12.0%) |
| 3 or 4 Children | 0 (0.0%) | 0 (0.0%) |
| 5 or more Children | 0 (0.0%) | 0 (0.0%) |
| Total | 0 (0.0%) | 14 (8.0%) |
Income Below Poverty Among Married-Couple vs Single-Parent Households in Hampton
The poverty data for Hampton shows that 6 of the married-couple family households (0.5%) and 14 of the single-parent households (6.5%) are living below the poverty level. Within the married-couple family households, those with no children have the highest poverty rate, with 6 households (0.8%) falling below the poverty line. Among the single-parent households, those with 1 or 2 children have the highest poverty rate, with 14 household (11.5%) living below poverty.
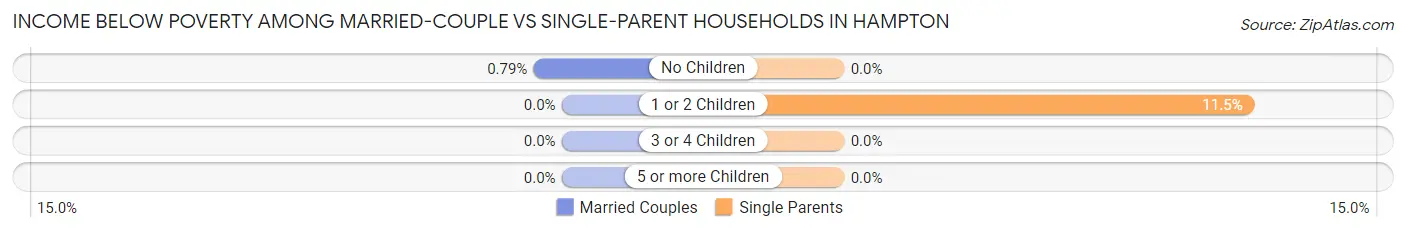
| Children | Married-Couple Families | Single-Parent Households |
| No Children | 6 (0.8%) | 0 (0.0%) |
| 1 or 2 Children | 0 (0.0%) | 14 (11.5%) |
| 3 or 4 Children | 0 (0.0%) | 0 (0.0%) |
| 5 or more Children | 0 (0.0%) | 0 (0.0%) |
| Total | 6 (0.5%) | 14 (6.5%) |
Race in Hampton
The most populous races in Hampton are White / Caucasian (4,249 | 83.6%), Two or more Races (325 | 6.4%), and Asian (304 | 6.0%).
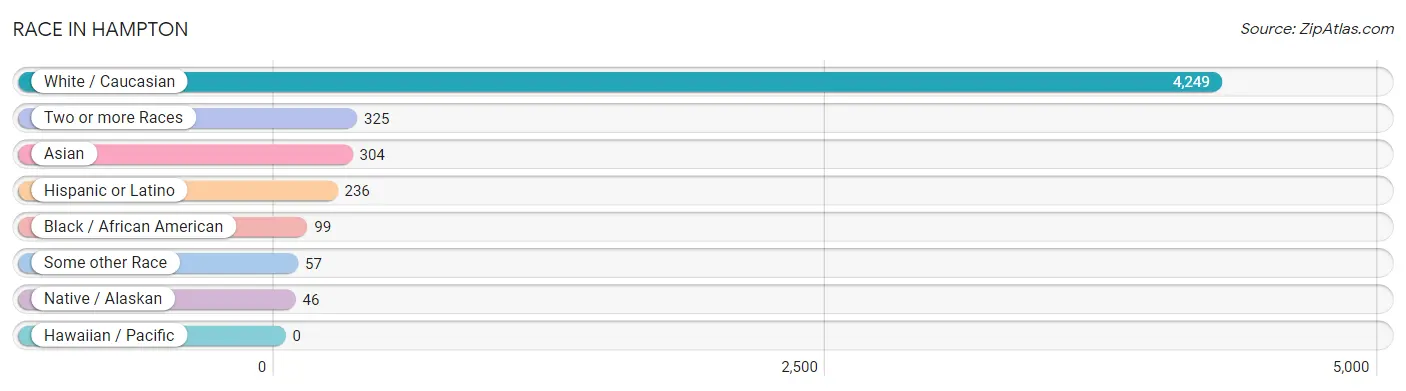
| Race | # Population | % Population |
| Asian | 304 | 6.0% |
| Black / African American | 99 | 1.9% |
| Hawaiian / Pacific | 0 | 0.0% |
| Hispanic or Latino | 236 | 4.6% |
| Native / Alaskan | 46 | 0.9% |
| White / Caucasian | 4,249 | 83.6% |
| Two or more Races | 325 | 6.4% |
| Some other Race | 57 | 1.1% |
| Total | 5,080 | 100.0% |
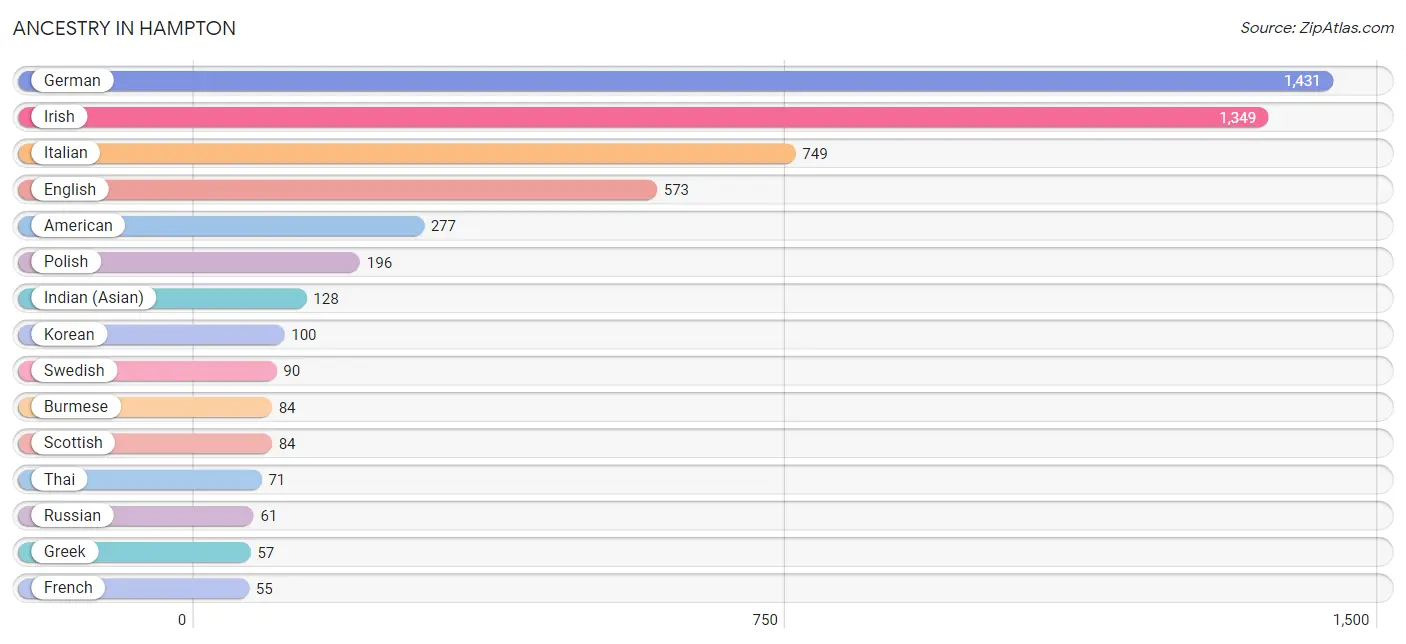
Ancestry in Hampton
The most populous ancestries reported in Hampton are German (1,431 | 28.2%), Irish (1,349 | 26.6%), Italian (749 | 14.7%), English (573 | 11.3%), and American (277 | 5.4%), together accounting for 86.2% of all Hampton residents.
| Ancestry | # Population | % Population |
| American | 277 | 5.4% |
| Arab | 7 | 0.1% |
| Argentinean | 11 | 0.2% |
| Armenian | 27 | 0.5% |
| Austrian | 2 | 0.0% |
| British | 47 | 0.9% |
| Burmese | 84 | 1.7% |
| Colombian | 43 | 0.9% |
| Creek | 7 | 0.1% |
| Cuban | 5 | 0.1% |
| Czech | 45 | 0.9% |
| Czechoslovakian | 37 | 0.7% |
| Danish | 20 | 0.4% |
| Dominican | 20 | 0.4% |
| Dutch | 26 | 0.5% |
| Eastern European | 29 | 0.6% |
| English | 573 | 11.3% |
| European | 50 | 1.0% |
| French | 55 | 1.1% |
| French Canadian | 7 | 0.1% |
| German | 1,431 | 28.2% |
| Greek | 57 | 1.1% |
| Hungarian | 8 | 0.2% |
| Indian (Asian) | 128 | 2.5% |
| Iranian | 27 | 0.5% |
| Irish | 1,349 | 26.6% |
| Italian | 749 | 14.7% |
| Korean | 100 | 2.0% |
| Latvian | 7 | 0.1% |
| Lebanese | 7 | 0.1% |
| Lithuanian | 7 | 0.1% |
| Mexican | 46 | 0.9% |
| Norwegian | 52 | 1.0% |
| Polish | 196 | 3.9% |
| Puerto Rican | 27 | 0.5% |
| Russian | 61 | 1.2% |
| Scandinavian | 10 | 0.2% |
| Scotch-Irish | 33 | 0.6% |
| Scottish | 84 | 1.7% |
| Sioux | 46 | 0.9% |
| Slovak | 17 | 0.3% |
| South American | 54 | 1.1% |
| Spaniard | 54 | 1.1% |
| Spanish | 30 | 0.6% |
| Swedish | 90 | 1.8% |
| Swiss | 9 | 0.2% |
| Thai | 71 | 1.4% |
| Ukrainian | 43 | 0.9% |
| Welsh | 19 | 0.4% | View All 49 Rows |
Immigrants in Hampton
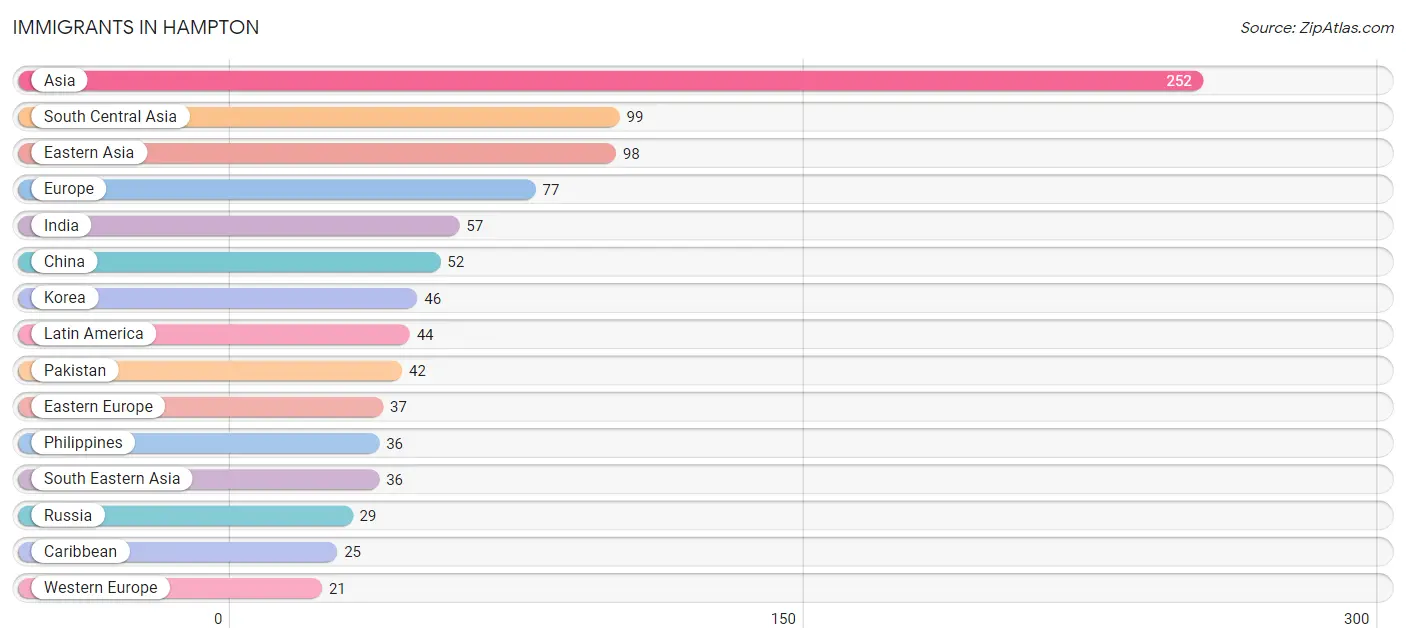
The most numerous immigrant groups reported in Hampton came from Asia (252 | 5.0%), South Central Asia (99 | 1.9%), Eastern Asia (98 | 1.9%), Europe (77 | 1.5%), and India (57 | 1.1%), together accounting for 11.5% of all Hampton residents.
| Immigration Origin | # Population | % Population |
| Argentina | 11 | 0.2% |
| Asia | 252 | 5.0% |
| Austria | 12 | 0.2% |
| Belarus | 8 | 0.2% |
| Canada | 8 | 0.2% |
| Caribbean | 25 | 0.5% |
| Central America | 8 | 0.2% |
| China | 52 | 1.0% |
| Cuba | 3 | 0.1% |
| Dominican Republic | 20 | 0.4% |
| Eastern Asia | 98 | 1.9% |
| Eastern Europe | 37 | 0.7% |
| Europe | 77 | 1.5% |
| Germany | 9 | 0.2% |
| Greece | 19 | 0.4% |
| India | 57 | 1.1% |
| Iraq | 12 | 0.2% |
| Jamaica | 2 | 0.0% |
| Korea | 46 | 0.9% |
| Latin America | 44 | 0.9% |
| Mexico | 8 | 0.2% |
| Pakistan | 42 | 0.8% |
| Philippines | 36 | 0.7% |
| Russia | 29 | 0.6% |
| South America | 11 | 0.2% |
| South Central Asia | 99 | 1.9% |
| South Eastern Asia | 36 | 0.7% |
| Southern Europe | 19 | 0.4% |
| Syria | 7 | 0.1% |
| Western Asia | 19 | 0.4% |
| Western Europe | 21 | 0.4% | View All 31 Rows |
Sex and Age in Hampton
Sex and Age in Hampton
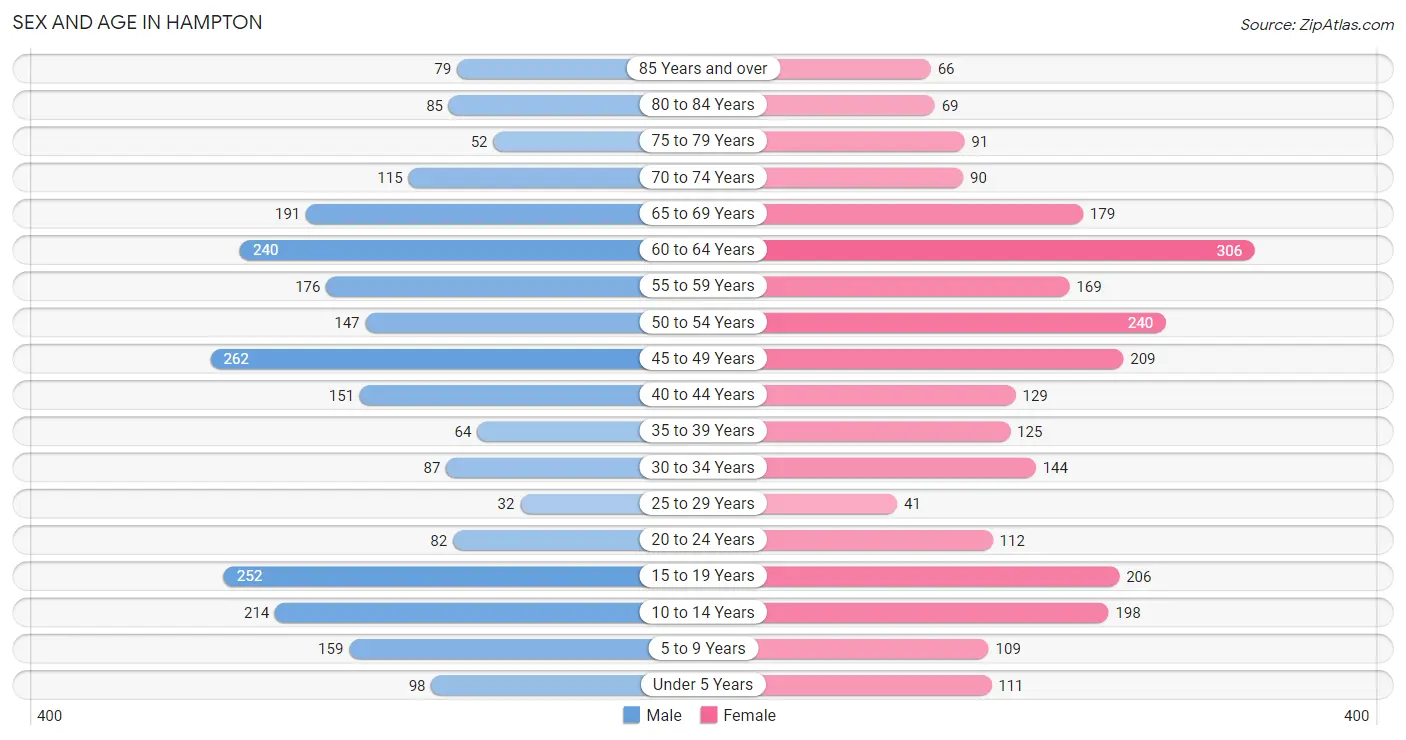
The most populous age groups in Hampton are 45 to 49 Years (262 | 10.5%) for men and 60 to 64 Years (306 | 11.8%) for women.
| Age Bracket | Male | Female |
| Under 5 Years | 98 (3.9%) | 111 (4.3%) |
| 5 to 9 Years | 159 (6.4%) | 109 (4.2%) |
| 10 to 14 Years | 214 (8.6%) | 198 (7.6%) |
| 15 to 19 Years | 252 (10.1%) | 206 (7.9%) |
| 20 to 24 Years | 82 (3.3%) | 112 (4.3%) |
| 25 to 29 Years | 32 (1.3%) | 41 (1.6%) |
| 30 to 34 Years | 87 (3.5%) | 144 (5.6%) |
| 35 to 39 Years | 64 (2.6%) | 125 (4.8%) |
| 40 to 44 Years | 151 (6.1%) | 129 (5.0%) |
| 45 to 49 Years | 262 (10.5%) | 209 (8.1%) |
| 50 to 54 Years | 147 (5.9%) | 240 (9.2%) |
| 55 to 59 Years | 176 (7.1%) | 169 (6.5%) |
| 60 to 64 Years | 240 (9.7%) | 306 (11.8%) |
| 65 to 69 Years | 191 (7.7%) | 179 (6.9%) |
| 70 to 74 Years | 115 (4.6%) | 90 (3.5%) |
| 75 to 79 Years | 52 (2.1%) | 91 (3.5%) |
| 80 to 84 Years | 85 (3.4%) | 69 (2.7%) |
| 85 Years and over | 79 (3.2%) | 66 (2.5%) |
| Total | 2,486 (100.0%) | 2,594 (100.0%) |
Families and Households in Hampton
Median Family Size in Hampton
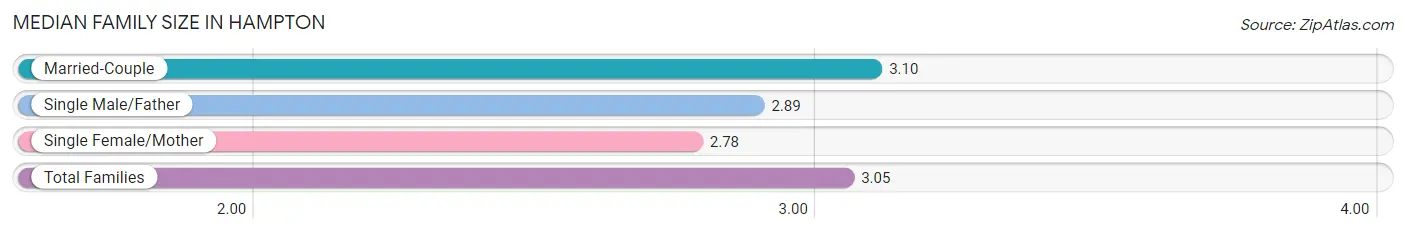
The median family size in Hampton is 3.05 persons per family, with married-couple families (1,288 | 85.8%) accounting for the largest median family size of 3.1 persons per family. On the other hand, single female/mother families (176 | 11.7%) represent the smallest median family size with 2.78 persons per family.
| Family Type | # Families | Family Size |
| Married-Couple | 1,288 (85.8%) | 3.10 |
| Single Male/Father | 38 (2.5%) | 2.89 |
| Single Female/Mother | 176 (11.7%) | 2.78 |
| Total Families | 1,502 (100.0%) | 3.05 |
Median Household Size in Hampton
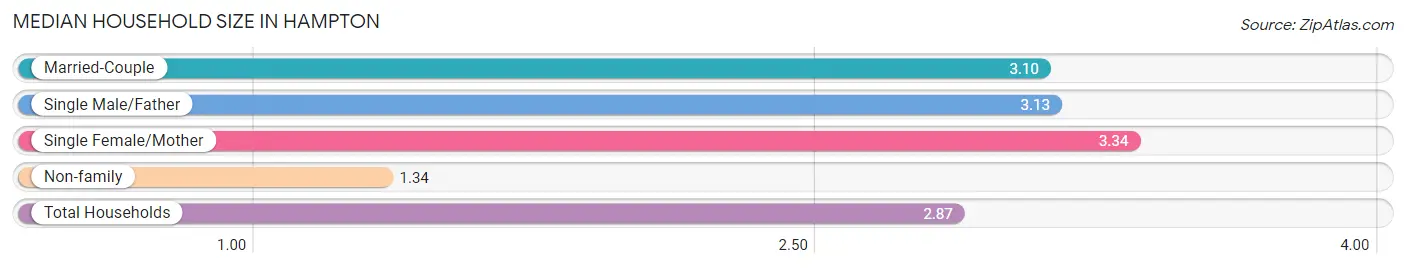
The median household size in Hampton is 2.87 persons per household, with single female/mother households (176 | 10.0%) accounting for the largest median household size of 3.34 persons per household. non-family households (258 | 14.7%) represent the smallest median household size with 1.34 persons per household.
| Household Type | # Households | Household Size |
| Married-Couple | 1,288 (73.2%) | 3.10 |
| Single Male/Father | 38 (2.2%) | 3.13 |
| Single Female/Mother | 176 (10.0%) | 3.34 |
| Non-family | 258 (14.7%) | 1.34 |
| Total Households | 1,760 (100.0%) | 2.87 |
Household Size by Marriage Status in Hampton
Out of a total of 1,760 households in Hampton, 1,502 (85.3%) are family households, while 258 (14.7%) are nonfamily households. The most numerous type of family households are 2-person households, comprising 610, and the most common type of nonfamily households are 1-person households, comprising 177.
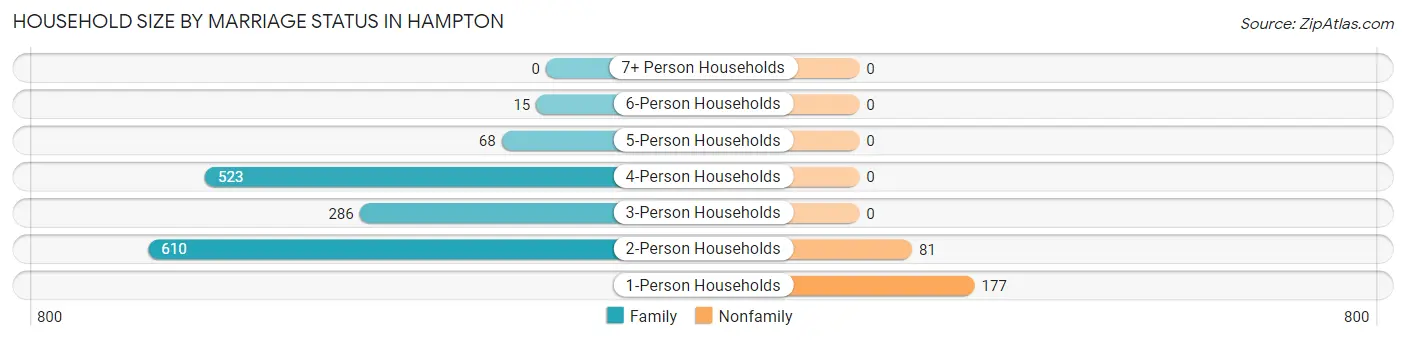
| Household Size | Family Households | Nonfamily Households |
| 1-Person Households | - | 177 (10.1%) |
| 2-Person Households | 610 (34.7%) | 81 (4.6%) |
| 3-Person Households | 286 (16.3%) | 0 (0.0%) |
| 4-Person Households | 523 (29.7%) | 0 (0.0%) |
| 5-Person Households | 68 (3.9%) | 0 (0.0%) |
| 6-Person Households | 15 (0.9%) | 0 (0.0%) |
| 7+ Person Households | 0 (0.0%) | 0 (0.0%) |
| Total | 1,502 (85.3%) | 258 (14.7%) |
Female Fertility in Hampton
Fertility by Age in Hampton
Average fertility rate in Hampton is 50.0 births per 1,000 women. Women in the age bracket of 35 to 50 years have the highest fertility rate with 78.0 births per 1,000 women. Women in the age bracket of 35 to 50 years acount for 83.0% of all women with births.
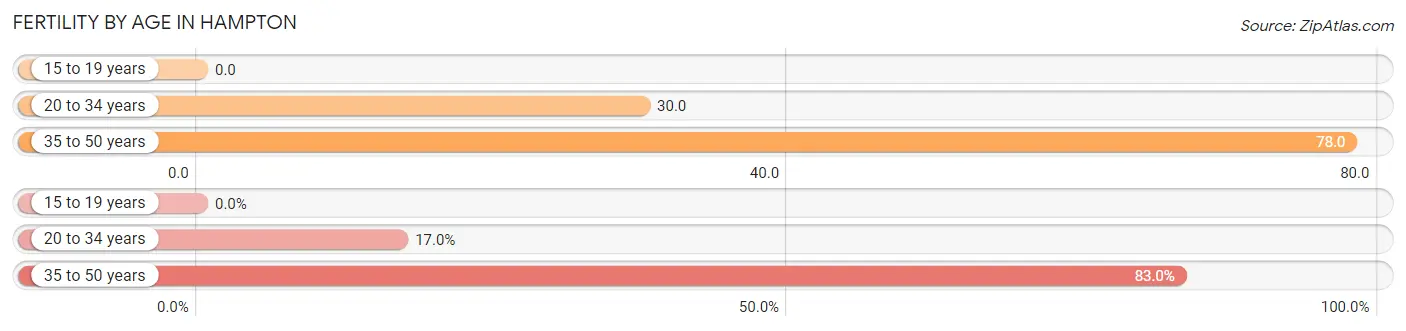
| Age Bracket | Women with Births | Births / 1,000 Women |
| 15 to 19 years | 0 (0.0%) | 0.0 |
| 20 to 34 years | 9 (17.0%) | 30.0 |
| 35 to 50 years | 44 (83.0%) | 78.0 |
| Total | 53 (100.0%) | 50.0 |
Fertility by Age by Marriage Status in Hampton
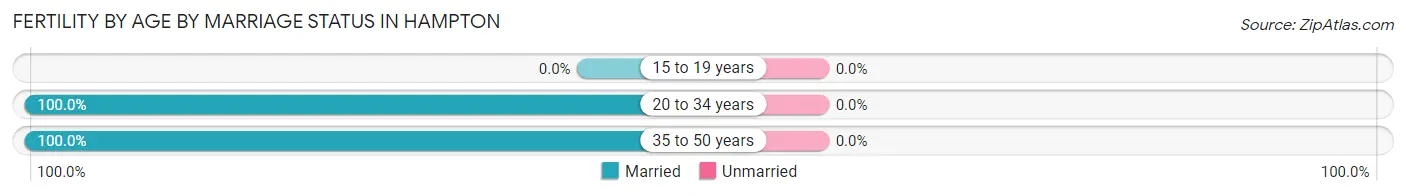
| Age Bracket | Married | Unmarried |
| 15 to 19 years | 0 (0.0%) | 0 (0.0%) |
| 20 to 34 years | 9 (100.0%) | 0 (0.0%) |
| 35 to 50 years | 44 (100.0%) | 0 (0.0%) |
| Total | 53 (100.0%) | 0 (0.0%) |
Fertility by Education in Hampton
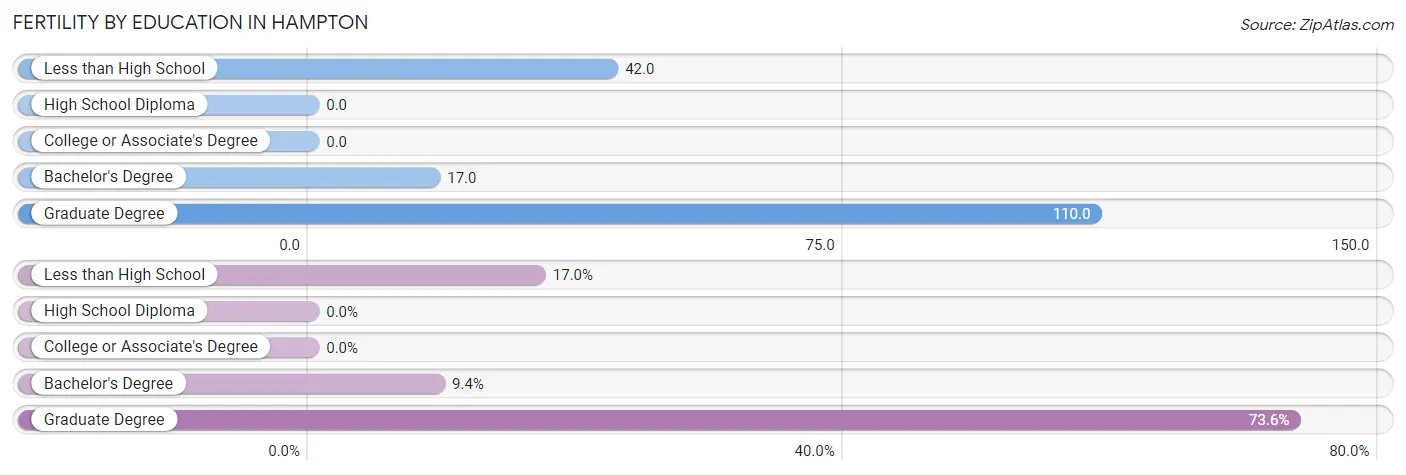
| Educational Attainment | Women with Births | Births / 1,000 Women |
| Less than High School | 9 (17.0%) | 42.0 |
| High School Diploma | 0 (0.0%) | 0.0 |
| College or Associate's Degree | 0 (0.0%) | 0.0 |
| Bachelor's Degree | 5 (9.4%) | 17.0 |
| Graduate Degree | 39 (73.6%) | 110.0 |
| Total | 53 (100.0%) | 50.0 |
Fertility by Education by Marriage Status in Hampton
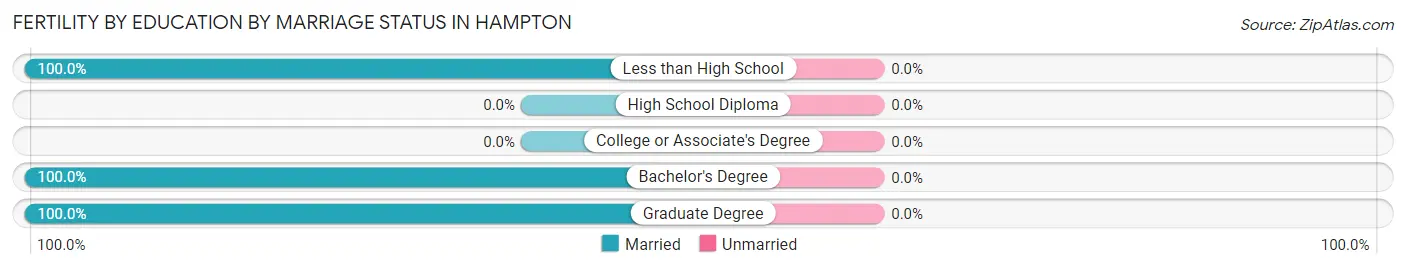
| Educational Attainment | Married | Unmarried |
| Less than High School | 9 (100.0%) | 0 (0.0%) |
| High School Diploma | 0 (0.0%) | 0 (0.0%) |
| College or Associate's Degree | 0 (0.0%) | 0 (0.0%) |
| Bachelor's Degree | 5 (100.0%) | 0 (0.0%) |
| Graduate Degree | 39 (100.0%) | 0 (0.0%) |
| Total | 53 (100.0%) | 0 (0.0%) |
Employment Characteristics in Hampton
Employment by Class of Employer in Hampton
Among the 2,520 employed individuals in Hampton, private company employees (1,308 | 51.9%), not-for-profit organizations (337 | 13.4%), and self-employed (incorporated) (288 | 11.4%) make up the most common classes of employment.
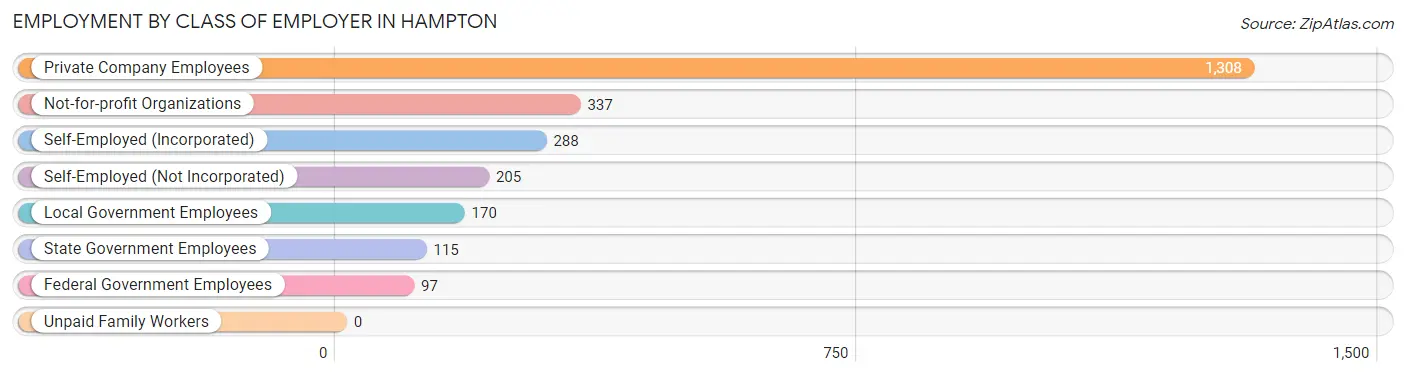
| Employer Class | # Employees | % Employees |
| Private Company Employees | 1,308 | 51.9% |
| Self-Employed (Incorporated) | 288 | 11.4% |
| Self-Employed (Not Incorporated) | 205 | 8.1% |
| Not-for-profit Organizations | 337 | 13.4% |
| Local Government Employees | 170 | 6.8% |
| State Government Employees | 115 | 4.6% |
| Federal Government Employees | 97 | 3.8% |
| Unpaid Family Workers | 0 | 0.0% |
| Total | 2,520 | 100.0% |
Employment Status by Age in Hampton
According to the labor force statistics for Hampton, out of the total population over 16 years of age (4,032), 65.6% or 2,645 individuals are in the labor force, with 0.9% or 24 of them unemployed. The age group with the highest labor force participation rate is 45 to 54 years, with 92.1% or 790 individuals in the labor force. Within the labor force, the 35 to 44 years age range has the highest percentage of unemployed individuals, with 4.2% or 18 of them being unemployed.
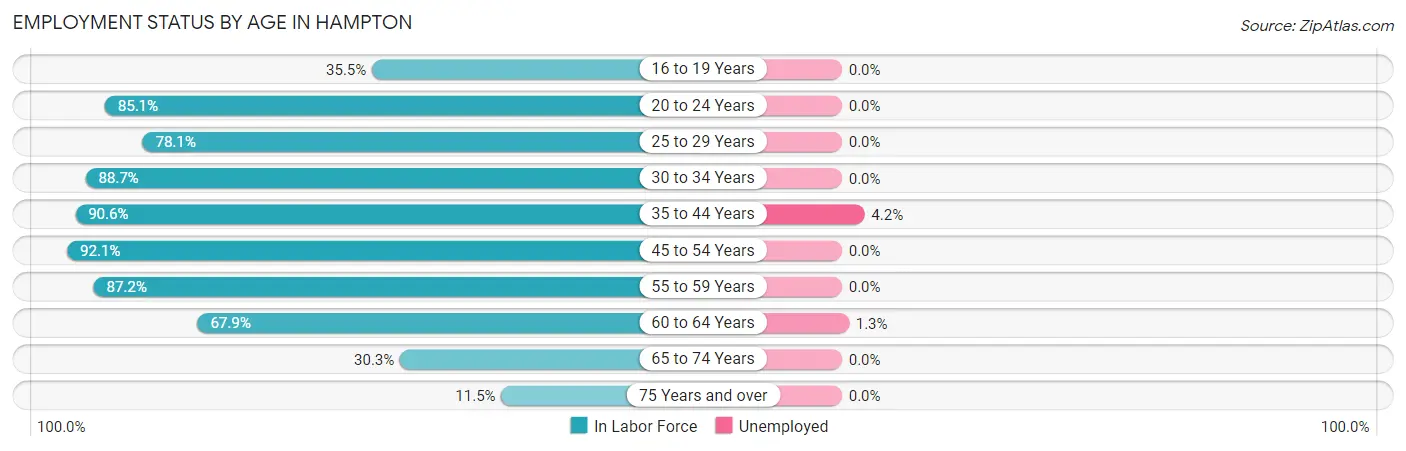
| Age Bracket | In Labor Force | Unemployed |
| 16 to 19 Years | 106 (35.5%) | 0 (0.0%) |
| 20 to 24 Years | 165 (85.1%) | 0 (0.0%) |
| 25 to 29 Years | 57 (78.1%) | 0 (0.0%) |
| 30 to 34 Years | 205 (88.7%) | 0 (0.0%) |
| 35 to 44 Years | 425 (90.6%) | 18 (4.2%) |
| 45 to 54 Years | 790 (92.1%) | 0 (0.0%) |
| 55 to 59 Years | 301 (87.2%) | 0 (0.0%) |
| 60 to 64 Years | 371 (67.9%) | 5 (1.3%) |
| 65 to 74 Years | 174 (30.3%) | 0 (0.0%) |
| 75 Years and over | 51 (11.5%) | 0 (0.0%) |
| Total | 2,645 (65.6%) | 24 (0.9%) |
Employment Status by Educational Attainment in Hampton
According to labor force statistics for Hampton, 85.2% of individuals (2,149) out of the total population between 25 and 64 years of age (2,522) are in the labor force, with 1.1% or 24 of them being unemployed. The group with the highest labor force participation rate are those with the educational attainment of bachelor's degree or higher, with 87.1% or 1,766 individuals in the labor force. Within the labor force, individuals with high school diploma education have the highest percentage of unemployment, with 3.2% or 5 of them being unemployed.
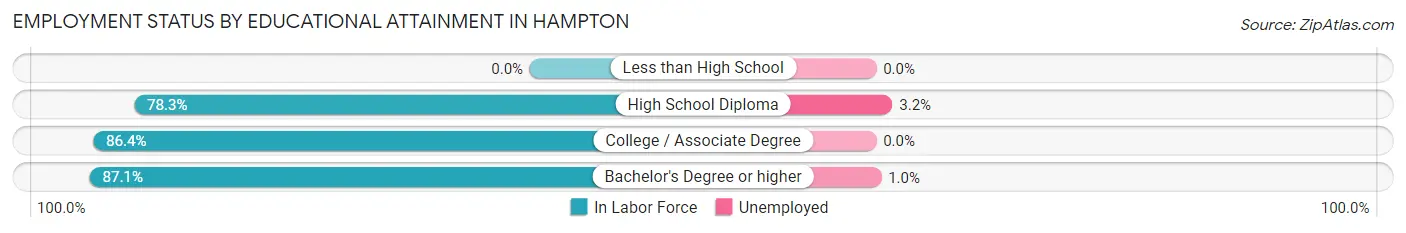
| Educational Attainment | In Labor Force | Unemployed |
| Less than High School | 0 (0.0%) | 0 (0.0%) |
| High School Diploma | 155 (78.3%) | 6 (3.2%) |
| College / Associate Degree | 228 (86.4%) | 0 (0.0%) |
| Bachelor's Degree or higher | 1,766 (87.1%) | 20 (1.0%) |
| Total | 2,149 (85.2%) | 28 (1.1%) |
Employment Occupations by Sex in Hampton
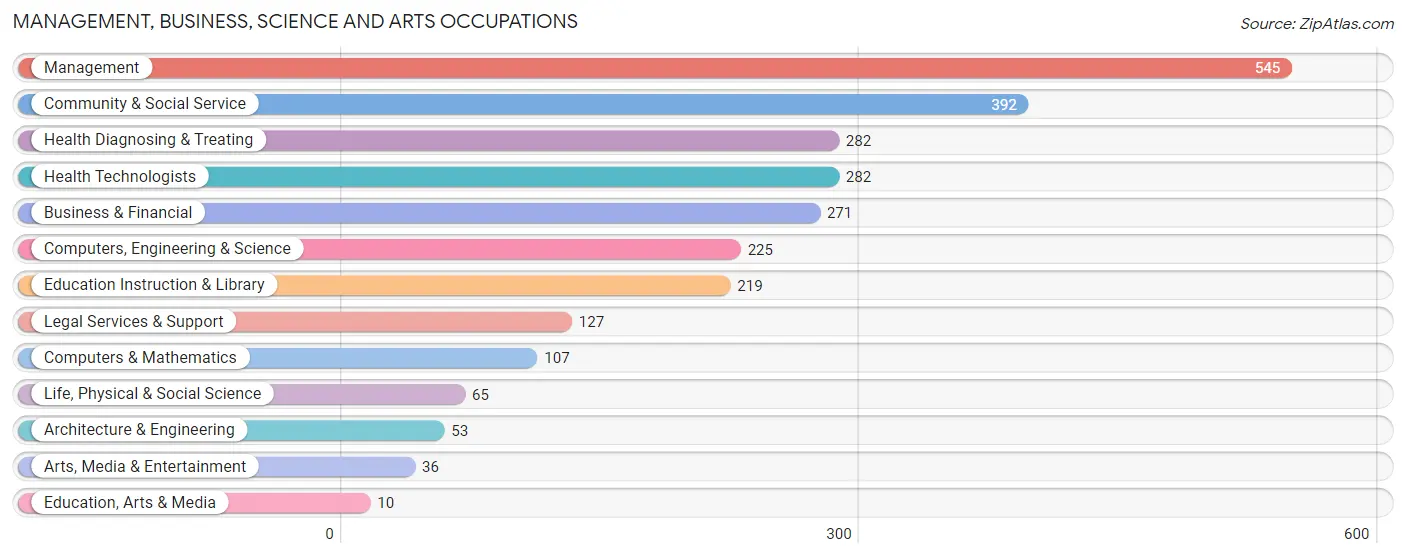
Management, Business, Science and Arts Occupations
The most common Management, Business, Science and Arts occupations in Hampton are Management (545 | 20.8%), Community & Social Service (392 | 14.9%), Health Diagnosing & Treating (282 | 10.8%), Health Technologists (282 | 10.8%), and Business & Financial (271 | 10.3%).
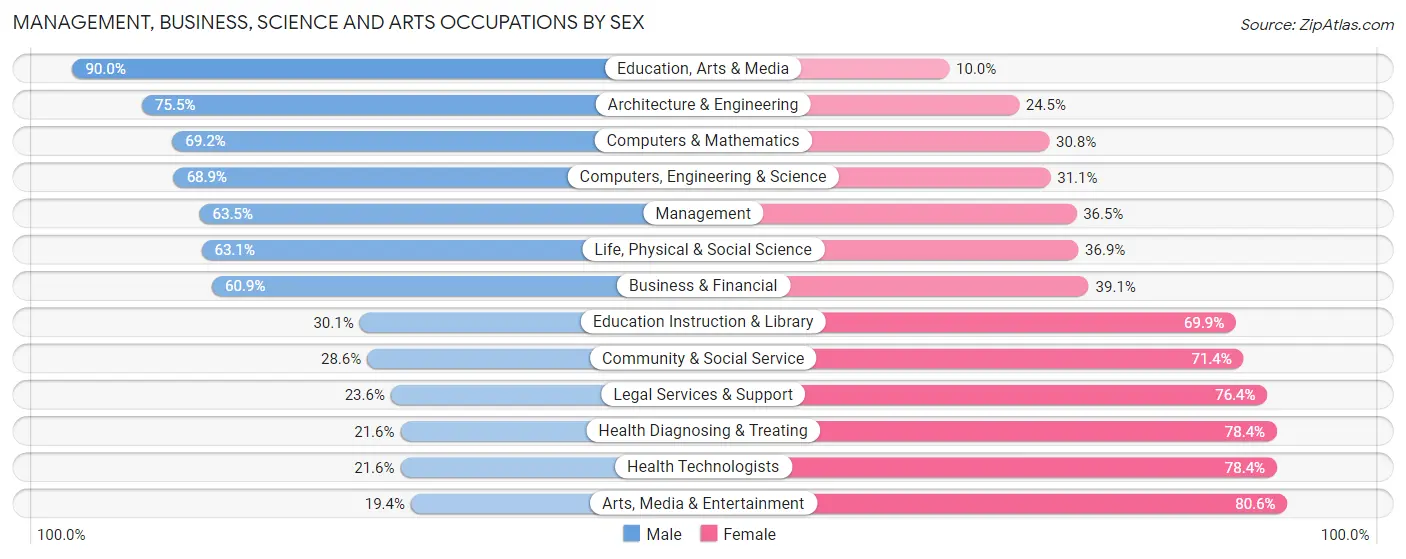
Management, Business, Science and Arts Occupations by Sex
Within the Management, Business, Science and Arts occupations in Hampton, the most male-oriented occupations are Education, Arts & Media (90.0%), Architecture & Engineering (75.5%), and Computers & Mathematics (69.2%), while the most female-oriented occupations are Arts, Media & Entertainment (80.6%), Health Diagnosing & Treating (78.4%), and Health Technologists (78.4%).
| Occupation | Male | Female |
| Management | 346 (63.5%) | 199 (36.5%) |
| Business & Financial | 165 (60.9%) | 106 (39.1%) |
| Computers, Engineering & Science | 155 (68.9%) | 70 (31.1%) |
| Computers & Mathematics | 74 (69.2%) | 33 (30.8%) |
| Architecture & Engineering | 40 (75.5%) | 13 (24.5%) |
| Life, Physical & Social Science | 41 (63.1%) | 24 (36.9%) |
| Community & Social Service | 112 (28.6%) | 280 (71.4%) |
| Education, Arts & Media | 9 (90.0%) | 1 (10.0%) |
| Legal Services & Support | 30 (23.6%) | 97 (76.4%) |
| Education Instruction & Library | 66 (30.1%) | 153 (69.9%) |
| Arts, Media & Entertainment | 7 (19.4%) | 29 (80.6%) |
| Health Diagnosing & Treating | 61 (21.6%) | 221 (78.4%) |
| Health Technologists | 61 (21.6%) | 221 (78.4%) |
| Total (Category) | 839 (48.9%) | 876 (51.1%) |
| Total (Overall) | 1,334 (50.9%) | 1,288 (49.1%) |
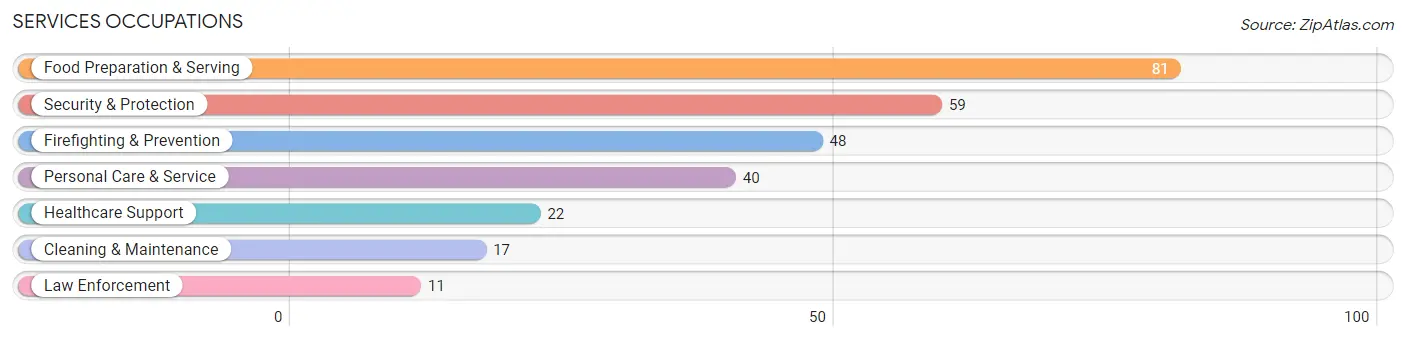
Services Occupations
The most common Services occupations in Hampton are Food Preparation & Serving (81 | 3.1%), Security & Protection (59 | 2.2%), Firefighting & Prevention (48 | 1.8%), Personal Care & Service (40 | 1.5%), and Healthcare Support (22 | 0.8%).
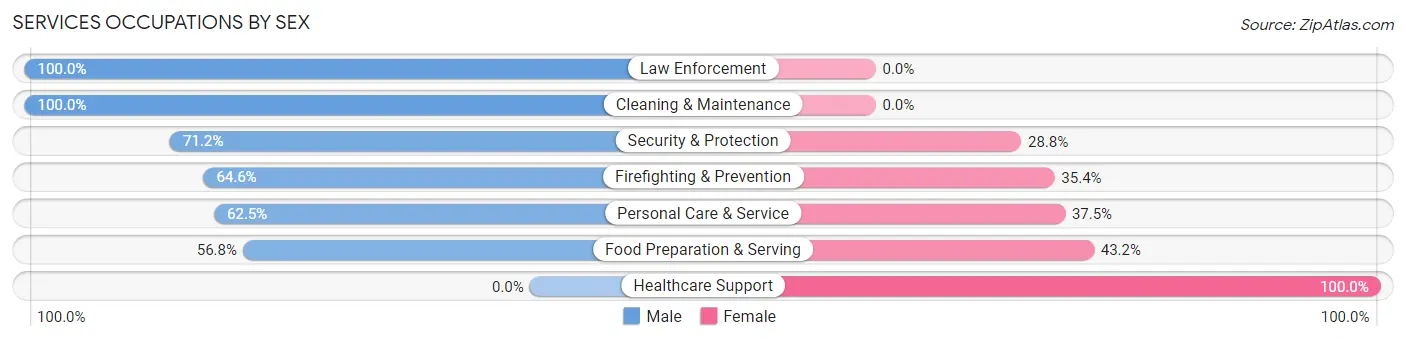
Services Occupations by Sex
Within the Services occupations in Hampton, the most male-oriented occupations are Law Enforcement (100.0%), Cleaning & Maintenance (100.0%), and Security & Protection (71.2%), while the most female-oriented occupations are Healthcare Support (100.0%), Food Preparation & Serving (43.2%), and Personal Care & Service (37.5%).
| Occupation | Male | Female |
| Healthcare Support | 0 (0.0%) | 22 (100.0%) |
| Security & Protection | 42 (71.2%) | 17 (28.8%) |
| Firefighting & Prevention | 31 (64.6%) | 17 (35.4%) |
| Law Enforcement | 11 (100.0%) | 0 (0.0%) |
| Food Preparation & Serving | 46 (56.8%) | 35 (43.2%) |
| Cleaning & Maintenance | 17 (100.0%) | 0 (0.0%) |
| Personal Care & Service | 25 (62.5%) | 15 (37.5%) |
| Total (Category) | 130 (59.4%) | 89 (40.6%) |
| Total (Overall) | 1,334 (50.9%) | 1,288 (49.1%) |
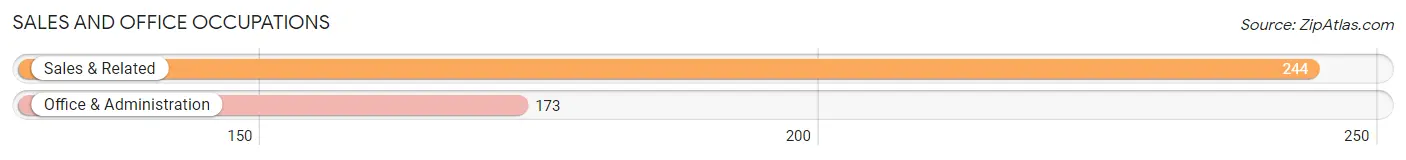
Sales and Office Occupations
The most common Sales and Office occupations in Hampton are Sales & Related (244 | 9.3%), and Office & Administration (173 | 6.6%).
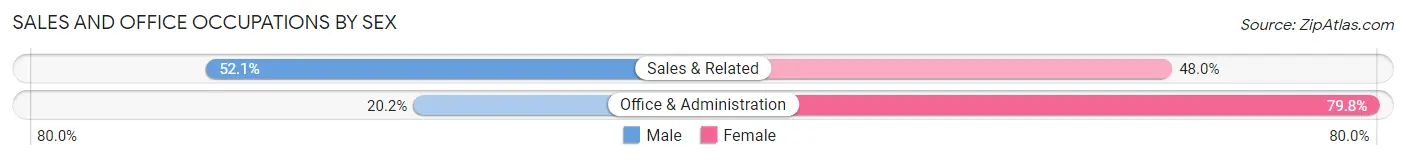
Sales and Office Occupations by Sex
| Occupation | Male | Female |
| Sales & Related | 127 (52.0%) | 117 (47.9%) |
| Office & Administration | 35 (20.2%) | 138 (79.8%) |
| Total (Category) | 162 (38.9%) | 255 (61.2%) |
| Total (Overall) | 1,334 (50.9%) | 1,288 (49.1%) |
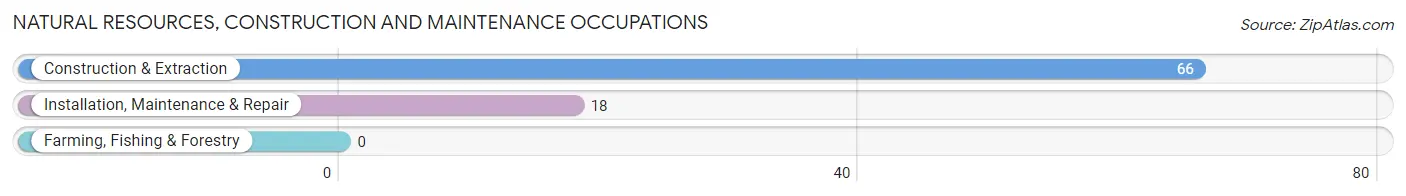
Natural Resources, Construction and Maintenance Occupations
The most common Natural Resources, Construction and Maintenance occupations in Hampton are Construction & Extraction (66 | 2.5%), and Installation, Maintenance & Repair (18 | 0.7%).
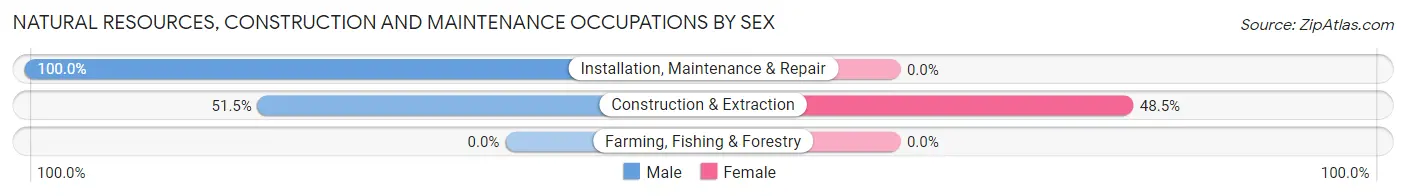
Natural Resources, Construction and Maintenance Occupations by Sex
| Occupation | Male | Female |
| Farming, Fishing & Forestry | 0 (0.0%) | 0 (0.0%) |
| Construction & Extraction | 34 (51.5%) | 32 (48.5%) |
| Installation, Maintenance & Repair | 18 (100.0%) | 0 (0.0%) |
| Total (Category) | 52 (61.9%) | 32 (38.1%) |
| Total (Overall) | 1,334 (50.9%) | 1,288 (49.1%) |
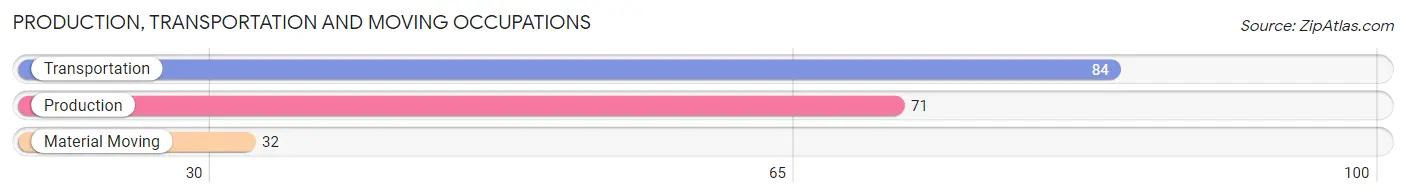
Production, Transportation and Moving Occupations
The most common Production, Transportation and Moving occupations in Hampton are Transportation (84 | 3.2%), Production (71 | 2.7%), and Material Moving (32 | 1.2%).
Production, Transportation and Moving Occupations by Sex
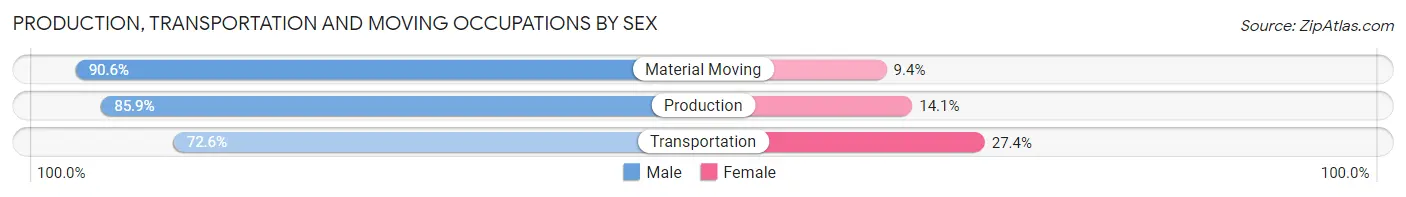
| Occupation | Male | Female |
| Production | 61 (85.9%) | 10 (14.1%) |
| Transportation | 61 (72.6%) | 23 (27.4%) |
| Material Moving | 29 (90.6%) | 3 (9.4%) |
| Total (Category) | 151 (80.7%) | 36 (19.3%) |
| Total (Overall) | 1,334 (50.9%) | 1,288 (49.1%) |
Employment Industries by Sex in Hampton
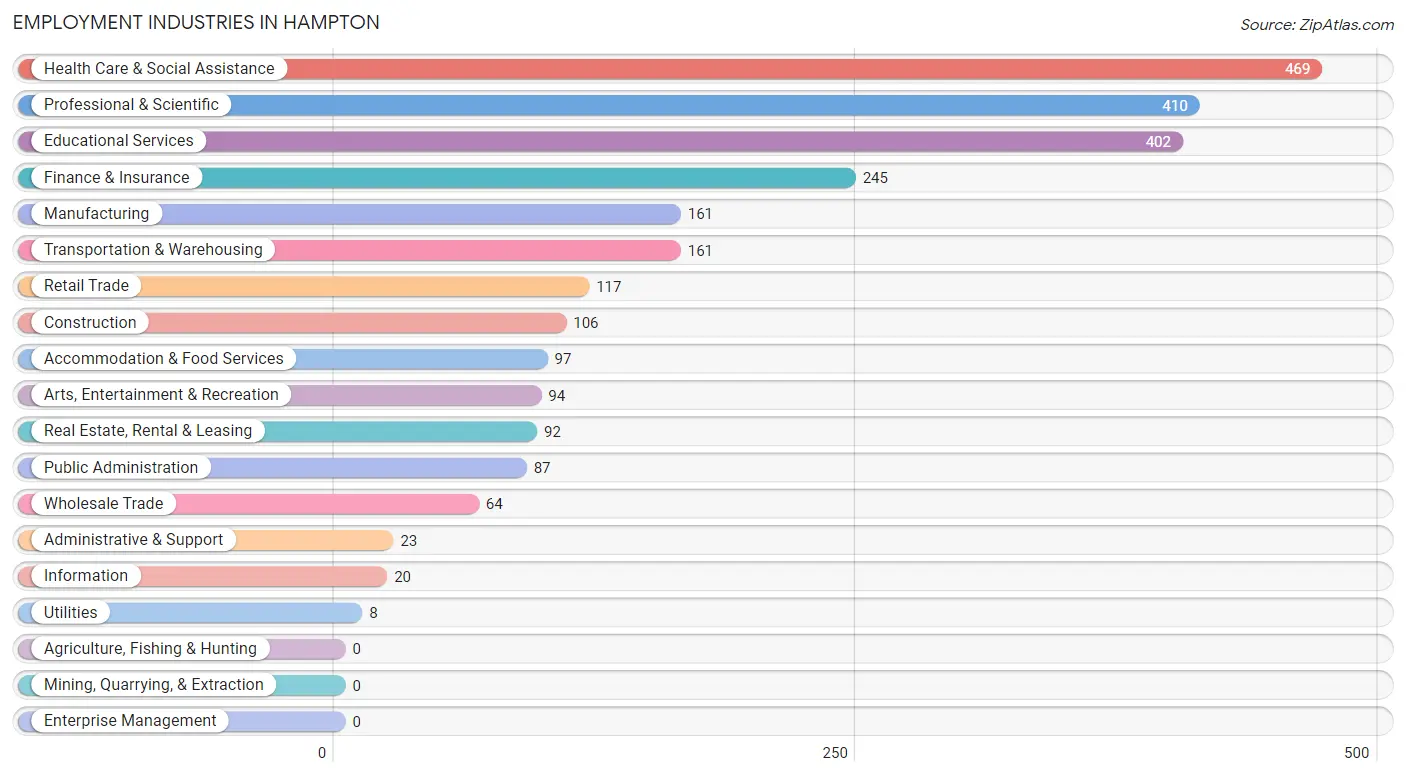
Employment Industries in Hampton
The major employment industries in Hampton include Health Care & Social Assistance (469 | 17.9%), Professional & Scientific (410 | 15.6%), Educational Services (402 | 15.3%), Finance & Insurance (245 | 9.3%), and Manufacturing (161 | 6.1%).
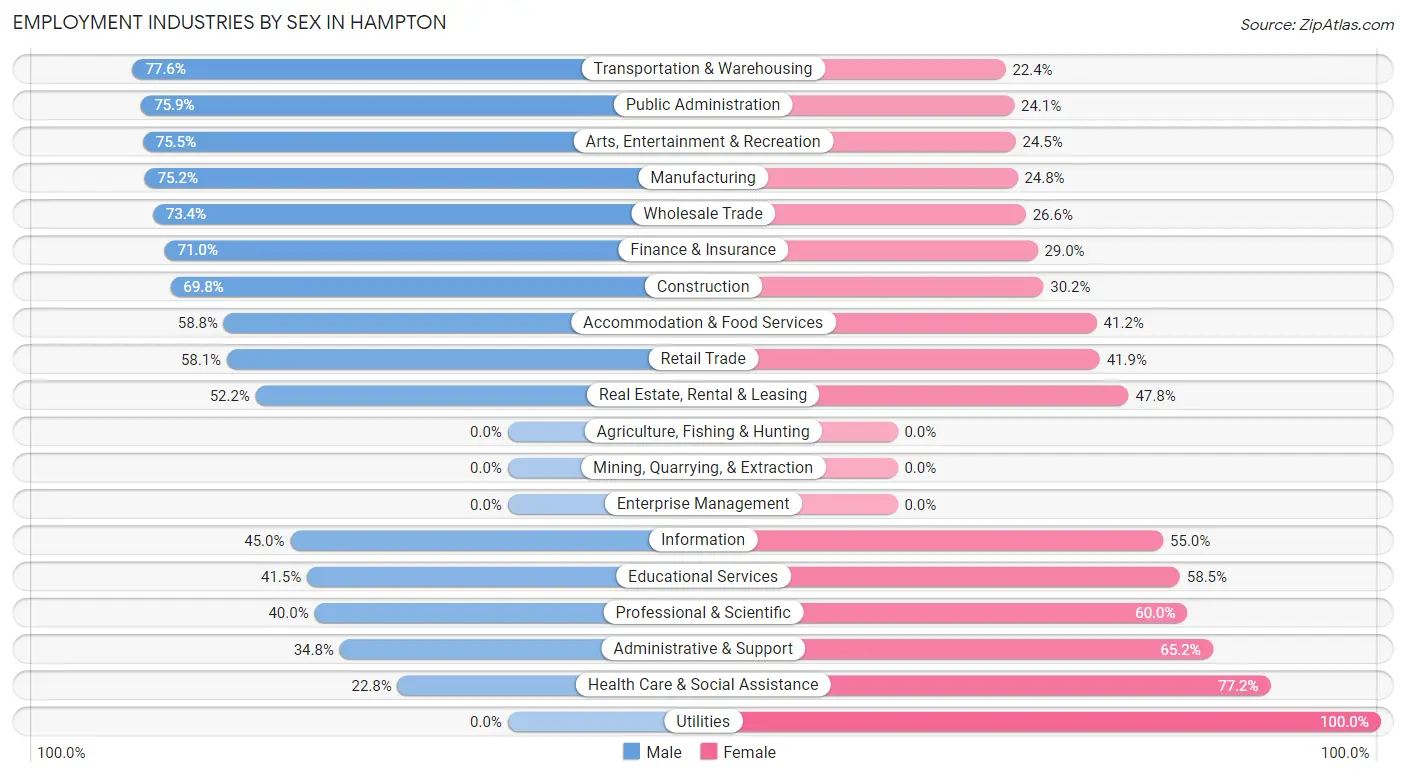
Employment Industries by Sex in Hampton
The Hampton industries that see more men than women are Transportation & Warehousing (77.6%), Public Administration (75.9%), and Arts, Entertainment & Recreation (75.5%), whereas the industries that tend to have a higher number of women are Utilities (100.0%), Health Care & Social Assistance (77.2%), and Administrative & Support (65.2%).
| Industry | Male | Female |
| Agriculture, Fishing & Hunting | 0 (0.0%) | 0 (0.0%) |
| Mining, Quarrying, & Extraction | 0 (0.0%) | 0 (0.0%) |
| Construction | 74 (69.8%) | 32 (30.2%) |
| Manufacturing | 121 (75.2%) | 40 (24.8%) |
| Wholesale Trade | 47 (73.4%) | 17 (26.6%) |
| Retail Trade | 68 (58.1%) | 49 (41.9%) |
| Transportation & Warehousing | 125 (77.6%) | 36 (22.4%) |
| Utilities | 0 (0.0%) | 8 (100.0%) |
| Information | 9 (45.0%) | 11 (55.0%) |
| Finance & Insurance | 174 (71.0%) | 71 (29.0%) |
| Real Estate, Rental & Leasing | 48 (52.2%) | 44 (47.8%) |
| Professional & Scientific | 164 (40.0%) | 246 (60.0%) |
| Enterprise Management | 0 (0.0%) | 0 (0.0%) |
| Administrative & Support | 8 (34.8%) | 15 (65.2%) |
| Educational Services | 167 (41.5%) | 235 (58.5%) |
| Health Care & Social Assistance | 107 (22.8%) | 362 (77.2%) |
| Arts, Entertainment & Recreation | 71 (75.5%) | 23 (24.5%) |
| Accommodation & Food Services | 57 (58.8%) | 40 (41.2%) |
| Public Administration | 66 (75.9%) | 21 (24.1%) |
| Total | 1,334 (50.9%) | 1,288 (49.1%) |
Education in Hampton
School Enrollment in Hampton
The most common levels of schooling among the 1,290 students in Hampton are high school (538 | 41.7%), middle school (219 | 17.0%), and elementary school (174 | 13.5%).
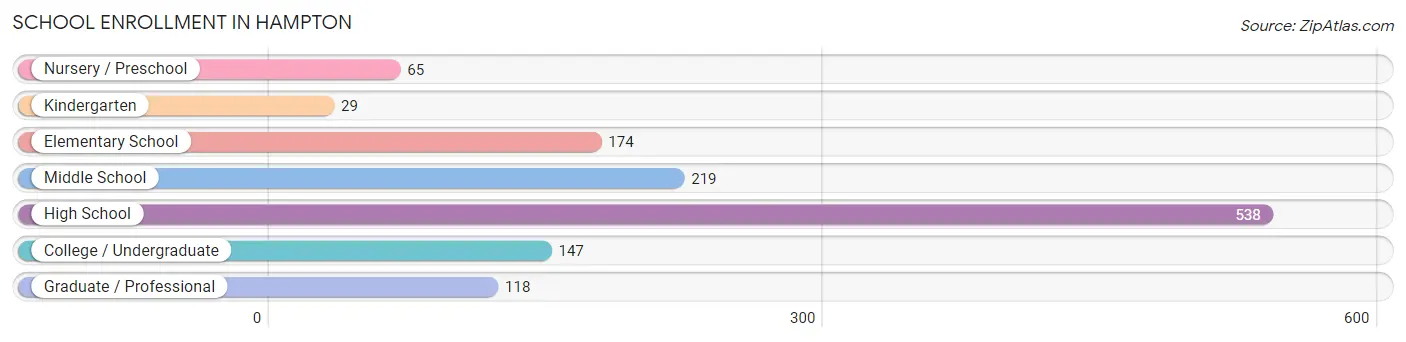
| School Level | # Students | % Students |
| Nursery / Preschool | 65 | 5.0% |
| Kindergarten | 29 | 2.2% |
| Elementary School | 174 | 13.5% |
| Middle School | 219 | 17.0% |
| High School | 538 | 41.7% |
| College / Undergraduate | 147 | 11.4% |
| Graduate / Professional | 118 | 9.1% |
| Total | 1,290 | 100.0% |
School Enrollment by Age by Funding Source in Hampton
Out of a total of 1,290 students who are enrolled in schools in Hampton, 574 (44.5%) attend a private institution, while the remaining 716 (55.5%) are enrolled in public schools. The age group of 25 to 34 year olds has the highest likelihood of being enrolled in private schools, with 14 (100.0% in the age bracket) enrolled. Conversely, the age group of 5 to 9 year old has the lowest likelihood of being enrolled in a private school, with 124 (74.3% in the age bracket) attending a public institution.
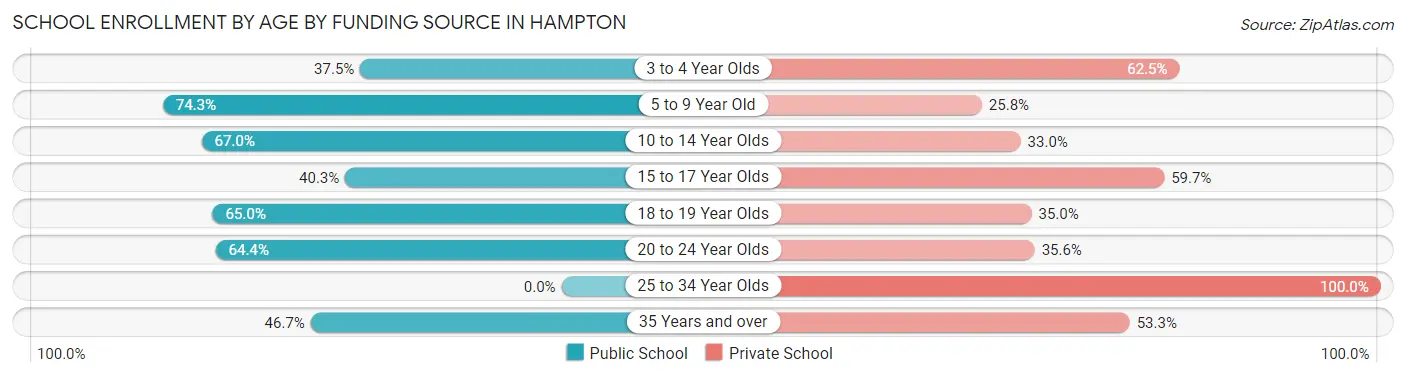
| Age Bracket | Public School | Private School |
| 3 to 4 Year Olds | 21 (37.5%) | 35 (62.5%) |
| 5 to 9 Year Old | 124 (74.3%) | 43 (25.8%) |
| 10 to 14 Year Olds | 248 (67.0%) | 122 (33.0%) |
| 15 to 17 Year Olds | 160 (40.3%) | 237 (59.7%) |
| 18 to 19 Year Olds | 39 (65.0%) | 21 (35.0%) |
| 20 to 24 Year Olds | 67 (64.4%) | 37 (35.6%) |
| 25 to 34 Year Olds | 0 (0.0%) | 14 (100.0%) |
| 35 Years and over | 57 (46.7%) | 65 (53.3%) |
| Total | 716 (55.5%) | 574 (44.5%) |
Educational Attainment by Field of Study in Hampton
Business (716 | 23.3%), social sciences (366 | 11.9%), science & technology (318 | 10.4%), liberal arts & history (227 | 7.4%), and education (203 | 6.6%) are the most common fields of study among 3,068 individuals in Hampton who have obtained a bachelor's degree or higher.
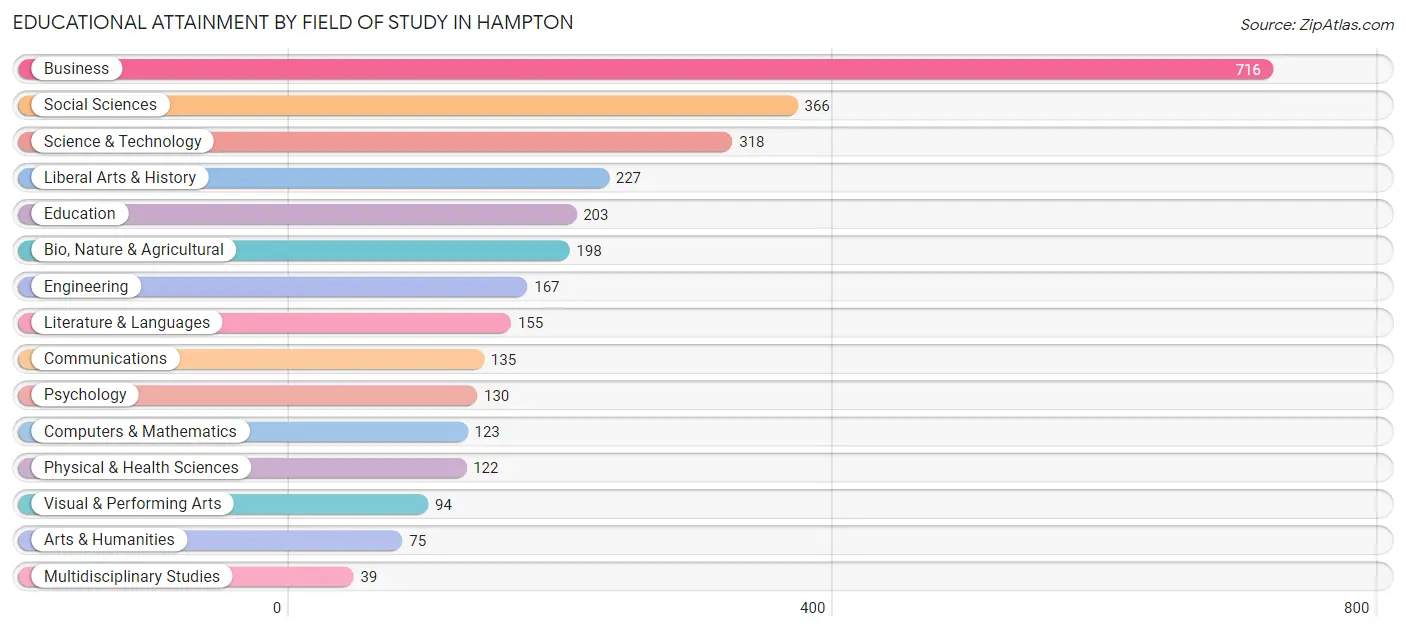
| Field of Study | # Graduates | % Graduates |
| Computers & Mathematics | 123 | 4.0% |
| Bio, Nature & Agricultural | 198 | 6.5% |
| Physical & Health Sciences | 122 | 4.0% |
| Psychology | 130 | 4.2% |
| Social Sciences | 366 | 11.9% |
| Engineering | 167 | 5.4% |
| Multidisciplinary Studies | 39 | 1.3% |
| Science & Technology | 318 | 10.4% |
| Business | 716 | 23.3% |
| Education | 203 | 6.6% |
| Literature & Languages | 155 | 5.1% |
| Liberal Arts & History | 227 | 7.4% |
| Visual & Performing Arts | 94 | 3.1% |
| Communications | 135 | 4.4% |
| Arts & Humanities | 75 | 2.4% |
| Total | 3,068 | 100.0% |
Transportation & Commute in Hampton
Vehicle Availability by Sex in Hampton
The most prevalent vehicle ownership categories in Hampton are males with 2 vehicles (657, accounting for 51.4%) and females with 2 vehicles (503, making up 53.3%).
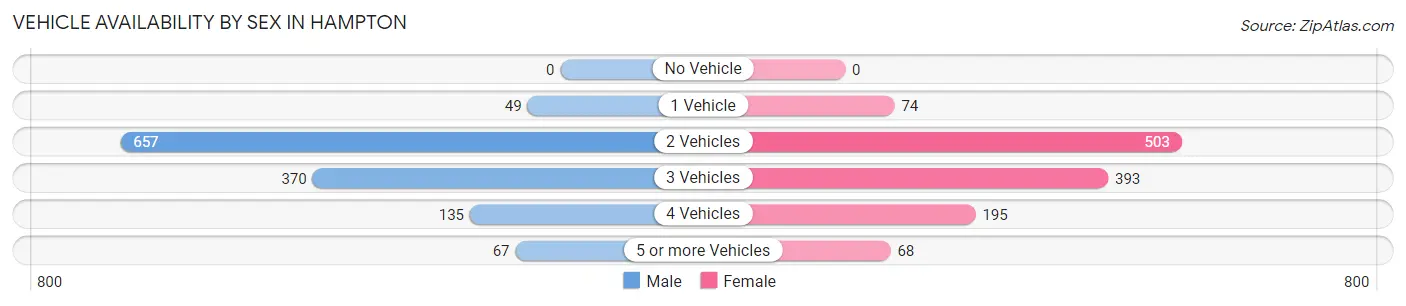
| Vehicles Available | Male | Female |
| No Vehicle | 0 (0.0%) | 0 (0.0%) |
| 1 Vehicle | 49 (3.8%) | 74 (6.0%) |
| 2 Vehicles | 657 (51.4%) | 503 (40.8%) |
| 3 Vehicles | 370 (28.9%) | 393 (31.9%) |
| 4 Vehicles | 135 (10.6%) | 195 (15.8%) |
| 5 or more Vehicles | 67 (5.2%) | 68 (5.5%) |
| Total | 1,278 (100.0%) | 1,233 (100.0%) |
Commute Time in Hampton
The most frequently occuring commute durations in Hampton are 15 to 19 minutes (430 commuters, 20.7%), 20 to 24 minutes (314 commuters, 15.1%), and 5 to 9 minutes (257 commuters, 12.4%).
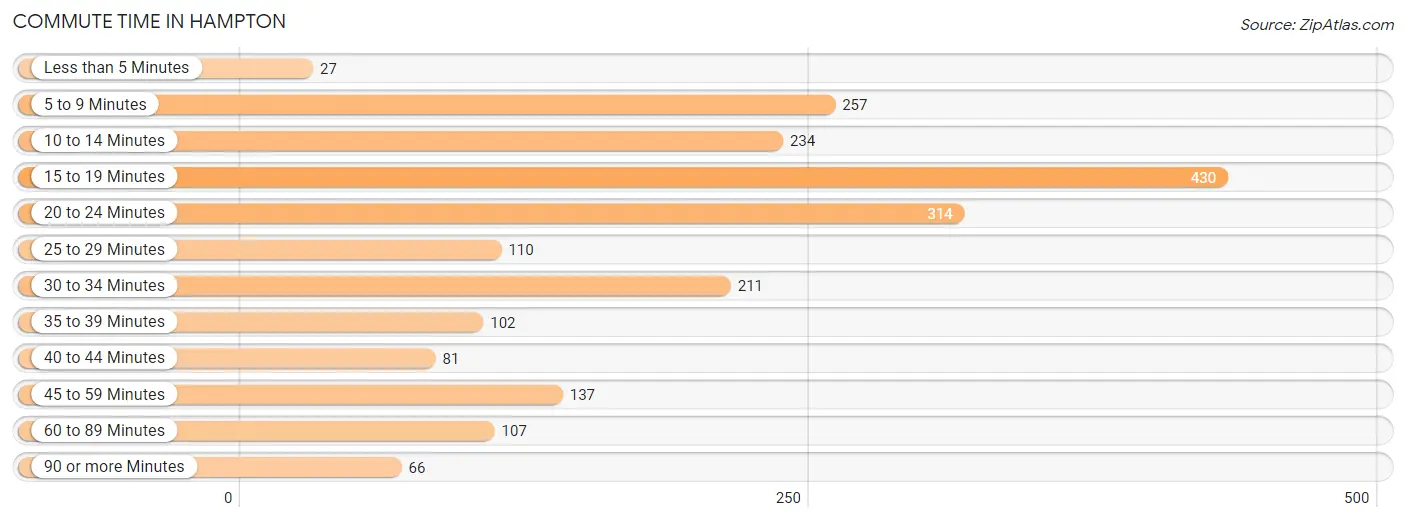
| Commute Time | # Commuters | % Commuters |
| Less than 5 Minutes | 27 | 1.3% |
| 5 to 9 Minutes | 257 | 12.4% |
| 10 to 14 Minutes | 234 | 11.3% |
| 15 to 19 Minutes | 430 | 20.7% |
| 20 to 24 Minutes | 314 | 15.1% |
| 25 to 29 Minutes | 110 | 5.3% |
| 30 to 34 Minutes | 211 | 10.2% |
| 35 to 39 Minutes | 102 | 4.9% |
| 40 to 44 Minutes | 81 | 3.9% |
| 45 to 59 Minutes | 137 | 6.6% |
| 60 to 89 Minutes | 107 | 5.1% |
| 90 or more Minutes | 66 | 3.2% |
Commute Time by Sex in Hampton
The most common commute times in Hampton are 15 to 19 minutes (193 commuters, 18.6%) for males and 15 to 19 minutes (237 commuters, 22.9%) for females.
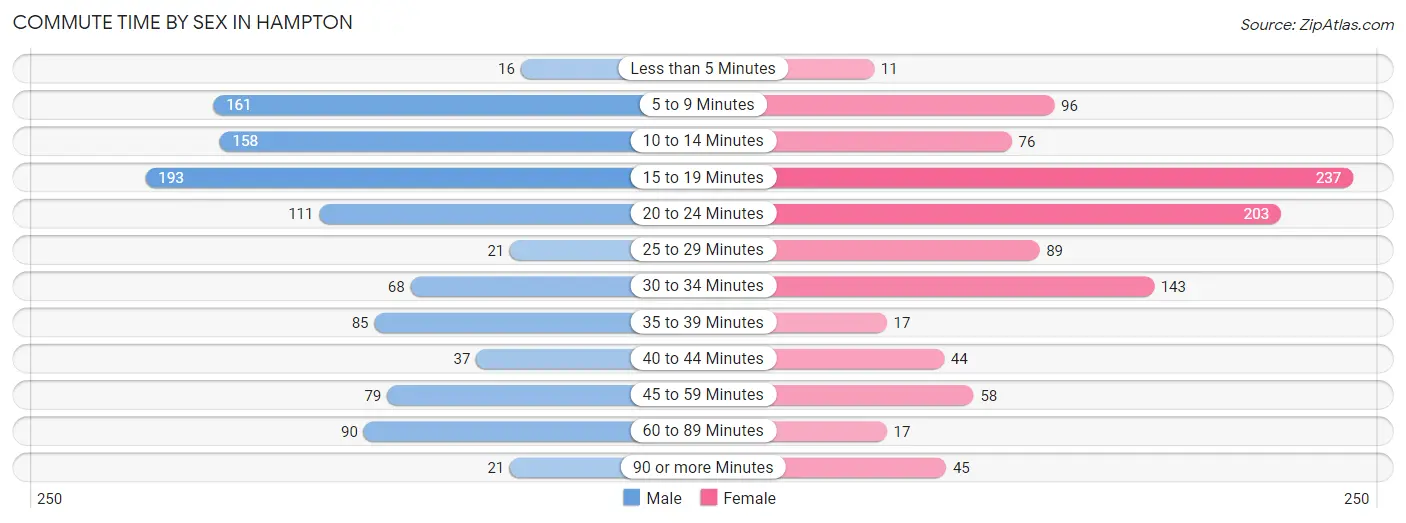
| Commute Time | Male | Female |
| Less than 5 Minutes | 16 (1.5%) | 11 (1.1%) |
| 5 to 9 Minutes | 161 (15.5%) | 96 (9.3%) |
| 10 to 14 Minutes | 158 (15.2%) | 76 (7.3%) |
| 15 to 19 Minutes | 193 (18.6%) | 237 (22.9%) |
| 20 to 24 Minutes | 111 (10.7%) | 203 (19.6%) |
| 25 to 29 Minutes | 21 (2.0%) | 89 (8.6%) |
| 30 to 34 Minutes | 68 (6.5%) | 143 (13.8%) |
| 35 to 39 Minutes | 85 (8.2%) | 17 (1.6%) |
| 40 to 44 Minutes | 37 (3.6%) | 44 (4.3%) |
| 45 to 59 Minutes | 79 (7.6%) | 58 (5.6%) |
| 60 to 89 Minutes | 90 (8.6%) | 17 (1.6%) |
| 90 or more Minutes | 21 (2.0%) | 45 (4.3%) |
Time of Departure to Work by Sex in Hampton
The most frequent times of departure to work in Hampton are 8:00 AM to 8:29 AM (266, 25.6%) for males and 8:00 AM to 8:29 AM (235, 22.7%) for females.
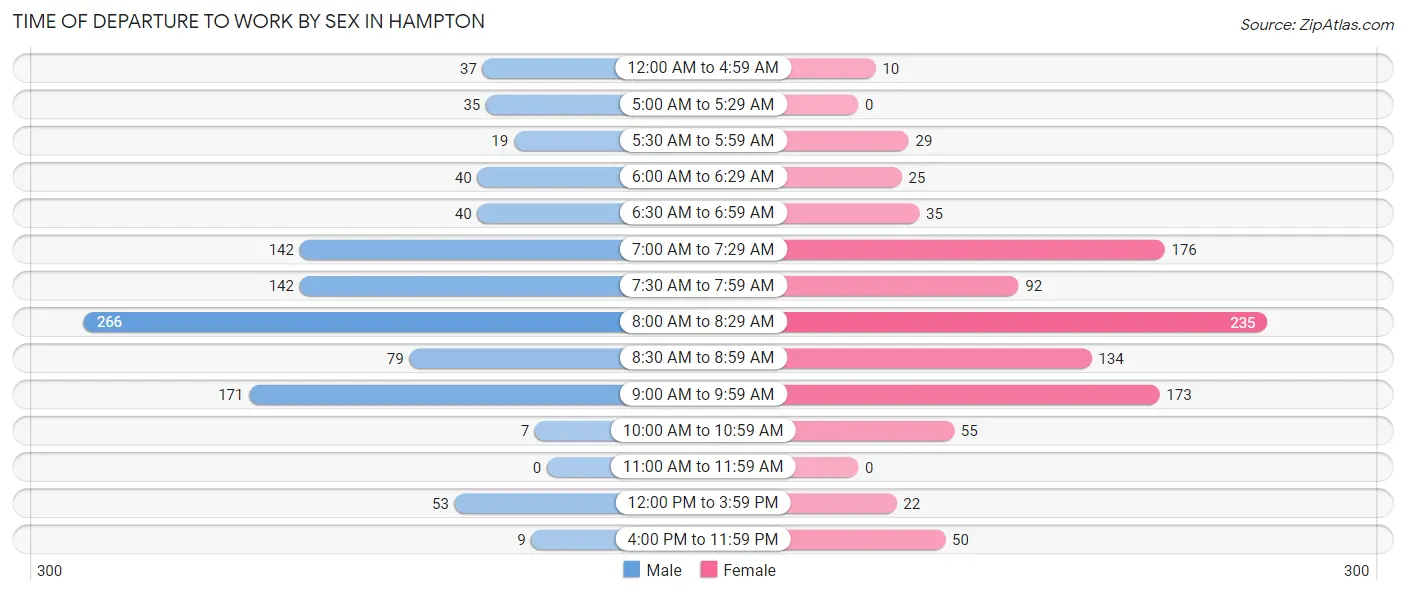
| Time of Departure | Male | Female |
| 12:00 AM to 4:59 AM | 37 (3.6%) | 10 (1.0%) |
| 5:00 AM to 5:29 AM | 35 (3.4%) | 0 (0.0%) |
| 5:30 AM to 5:59 AM | 19 (1.8%) | 29 (2.8%) |
| 6:00 AM to 6:29 AM | 40 (3.8%) | 25 (2.4%) |
| 6:30 AM to 6:59 AM | 40 (3.8%) | 35 (3.4%) |
| 7:00 AM to 7:29 AM | 142 (13.7%) | 176 (17.0%) |
| 7:30 AM to 7:59 AM | 142 (13.7%) | 92 (8.9%) |
| 8:00 AM to 8:29 AM | 266 (25.6%) | 235 (22.7%) |
| 8:30 AM to 8:59 AM | 79 (7.6%) | 134 (12.9%) |
| 9:00 AM to 9:59 AM | 171 (16.4%) | 173 (16.7%) |
| 10:00 AM to 10:59 AM | 7 (0.7%) | 55 (5.3%) |
| 11:00 AM to 11:59 AM | 0 (0.0%) | 0 (0.0%) |
| 12:00 PM to 3:59 PM | 53 (5.1%) | 22 (2.1%) |
| 4:00 PM to 11:59 PM | 9 (0.9%) | 50 (4.8%) |
| Total | 1,040 (100.0%) | 1,036 (100.0%) |
Housing Occupancy in Hampton
Occupancy by Ownership in Hampton
Of the total 1,760 dwellings in Hampton, owner-occupied units account for 1,754 (99.7%), while renter-occupied units make up 6 (0.3%).
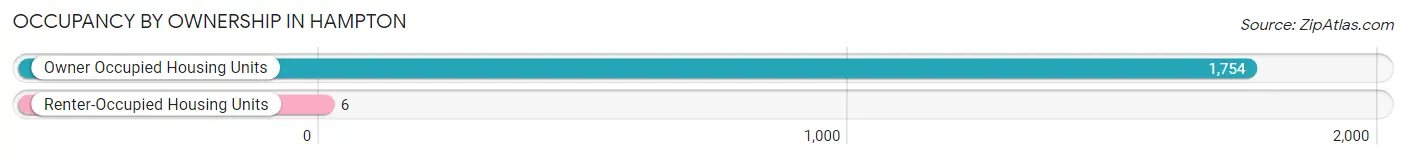
| Occupancy | # Housing Units | % Housing Units |
| Owner Occupied Housing Units | 1,754 | 99.7% |
| Renter-Occupied Housing Units | 6 | 0.3% |
| Total Occupied Housing Units | 1,760 | 100.0% |
Occupancy by Household Size in Hampton
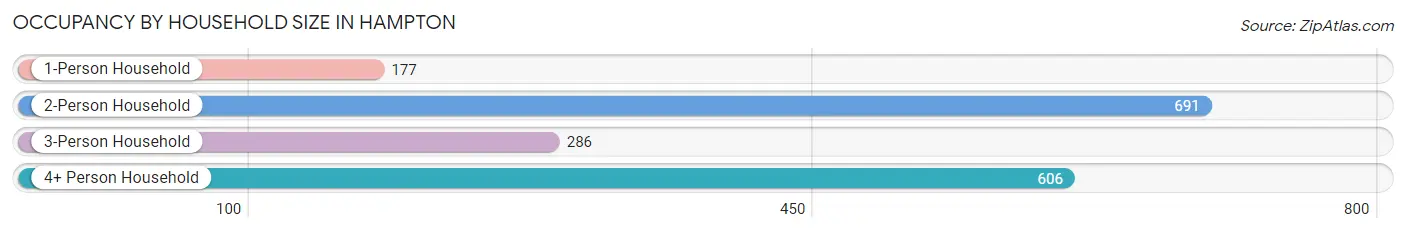
| Household Size | # Housing Units | % Housing Units |
| 1-Person Household | 177 | 10.1% |
| 2-Person Household | 691 | 39.3% |
| 3-Person Household | 286 | 16.3% |
| 4+ Person Household | 606 | 34.4% |
| Total Housing Units | 1,760 | 100.0% |
Occupancy by Ownership by Household Size in Hampton
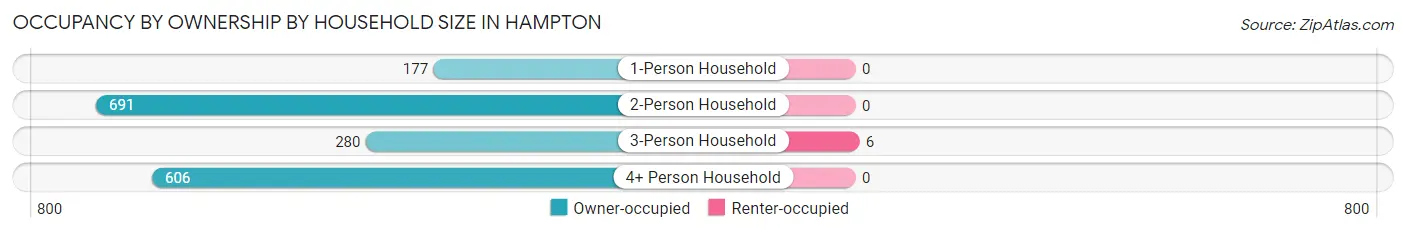
| Household Size | Owner-occupied | Renter-occupied |
| 1-Person Household | 177 (100.0%) | 0 (0.0%) |
| 2-Person Household | 691 (100.0%) | 0 (0.0%) |
| 3-Person Household | 280 (97.9%) | 6 (2.1%) |
| 4+ Person Household | 606 (100.0%) | 0 (0.0%) |
| Total Housing Units | 1,754 (99.7%) | 6 (0.3%) |
Occupancy by Educational Attainment in Hampton
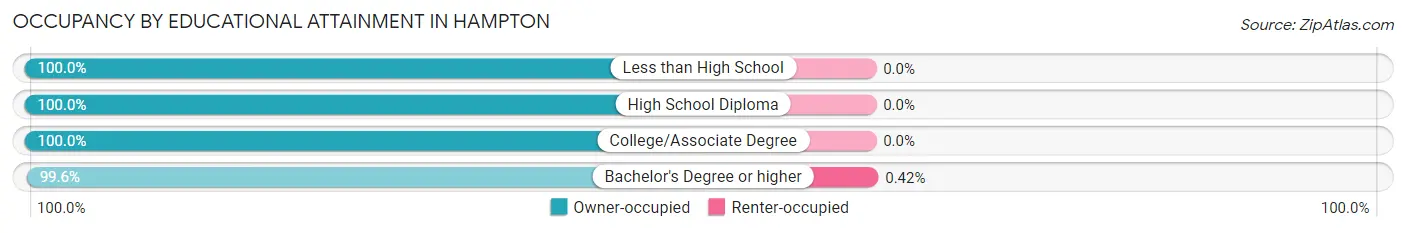
| Household Size | Owner-occupied | Renter-occupied |
| Less than High School | 23 (100.0%) | 0 (0.0%) |
| High School Diploma | 121 (100.0%) | 0 (0.0%) |
| College/Associate Degree | 203 (100.0%) | 0 (0.0%) |
| Bachelor's Degree or higher | 1,407 (99.6%) | 6 (0.4%) |
Occupancy by Age of Householder in Hampton
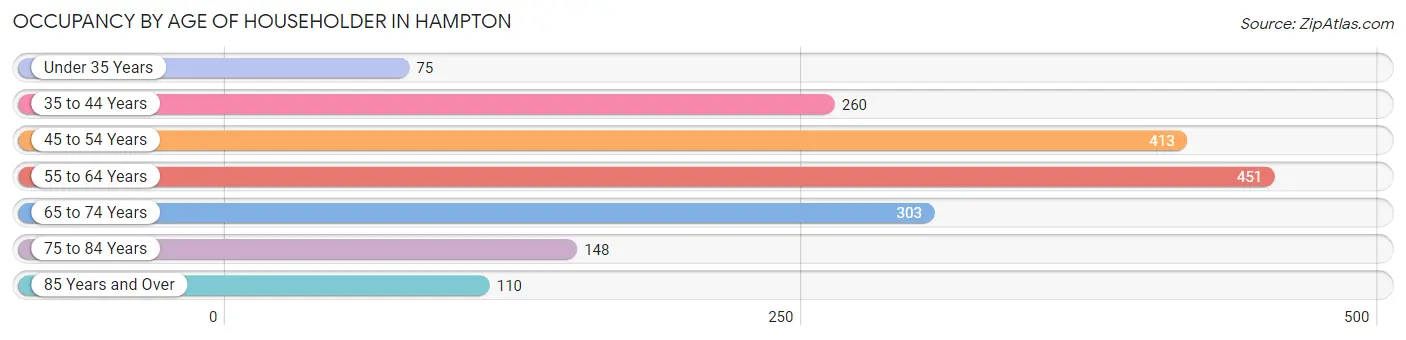
| Age Bracket | # Households | % Households |
| Under 35 Years | 75 | 4.3% |
| 35 to 44 Years | 260 | 14.8% |
| 45 to 54 Years | 413 | 23.5% |
| 55 to 64 Years | 451 | 25.6% |
| 65 to 74 Years | 303 | 17.2% |
| 75 to 84 Years | 148 | 8.4% |
| 85 Years and Over | 110 | 6.2% |
| Total | 1,760 | 100.0% |
Housing Finances in Hampton
Median Income by Occupancy in Hampton
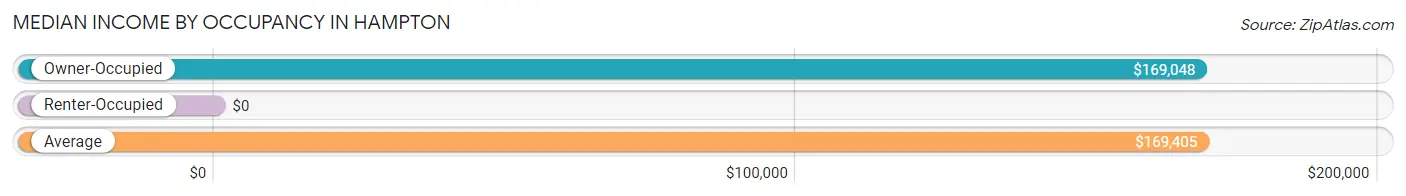
| Occupancy Type | # Households | Median Income |
| Owner-Occupied | 1,754 (99.7%) | $169,048 |
| Renter-Occupied | 6 (0.3%) | $0 |
| Average | 1,760 (100.0%) | $169,405 |
Occupancy by Householder Income Bracket in Hampton
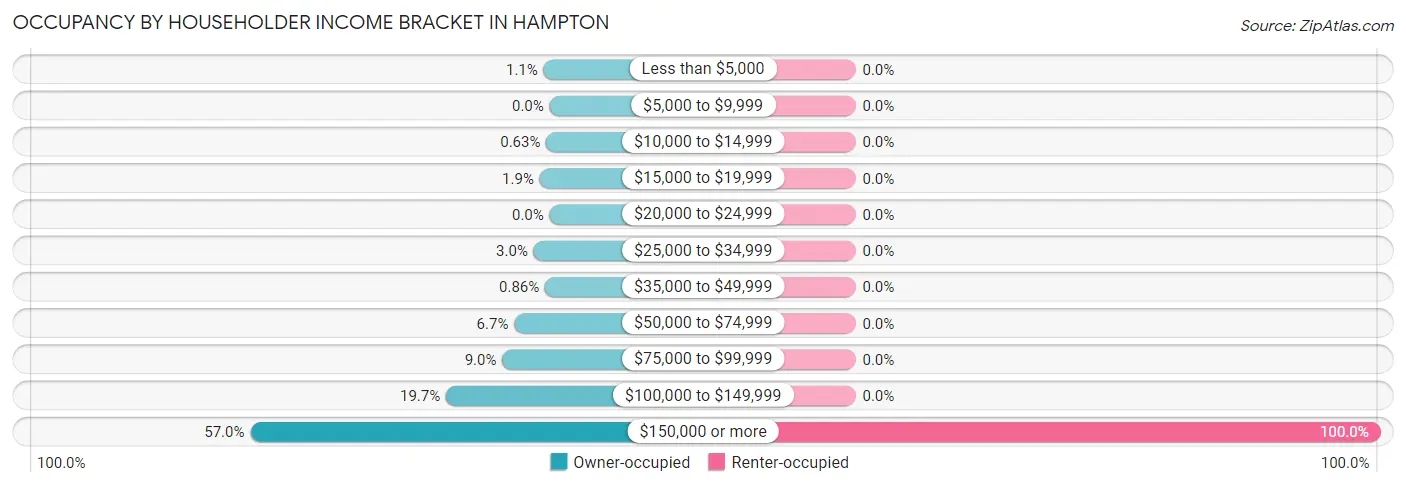
| Income Bracket | Owner-occupied | Renter-occupied |
| Less than $5,000 | 20 (1.1%) | 0 (0.0%) |
| $5,000 to $9,999 | 0 (0.0%) | 0 (0.0%) |
| $10,000 to $14,999 | 11 (0.6%) | 0 (0.0%) |
| $15,000 to $19,999 | 33 (1.9%) | 0 (0.0%) |
| $20,000 to $24,999 | 0 (0.0%) | 0 (0.0%) |
| $25,000 to $34,999 | 53 (3.0%) | 0 (0.0%) |
| $35,000 to $49,999 | 15 (0.9%) | 0 (0.0%) |
| $50,000 to $74,999 | 118 (6.7%) | 0 (0.0%) |
| $75,000 to $99,999 | 158 (9.0%) | 0 (0.0%) |
| $100,000 to $149,999 | 346 (19.7%) | 0 (0.0%) |
| $150,000 or more | 1,000 (57.0%) | 6 (100.0%) |
| Total | 1,754 (100.0%) | 6 (100.0%) |
Monthly Housing Cost Tiers in Hampton
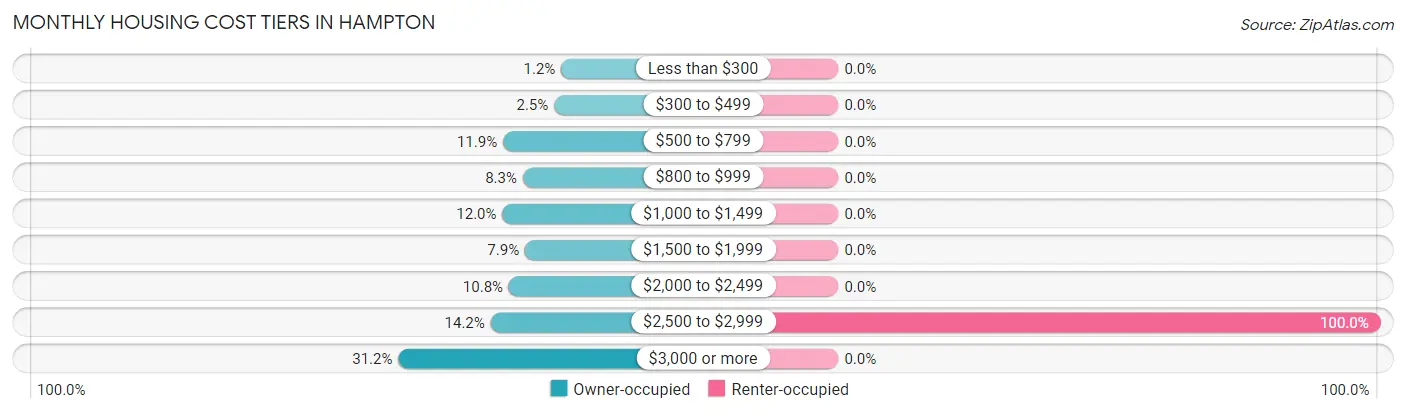
| Monthly Cost | Owner-occupied | Renter-occupied |
| Less than $300 | 21 (1.2%) | 0 (0.0%) |
| $300 to $499 | 44 (2.5%) | 0 (0.0%) |
| $500 to $799 | 209 (11.9%) | 0 (0.0%) |
| $800 to $999 | 145 (8.3%) | 0 (0.0%) |
| $1,000 to $1,499 | 211 (12.0%) | 0 (0.0%) |
| $1,500 to $1,999 | 138 (7.9%) | 0 (0.0%) |
| $2,000 to $2,499 | 190 (10.8%) | 0 (0.0%) |
| $2,500 to $2,999 | 249 (14.2%) | 6 (100.0%) |
| $3,000 or more | 547 (31.2%) | 0 (0.0%) |
| Total | 1,754 (100.0%) | 6 (100.0%) |
Physical Housing Characteristics in Hampton
Housing Structures in Hampton
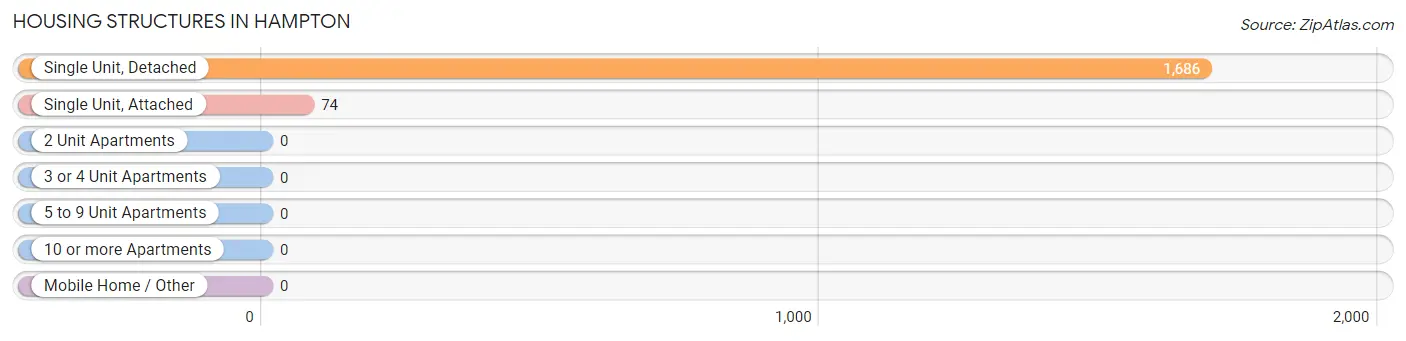
| Structure Type | # Housing Units | % Housing Units |
| Single Unit, Detached | 1,686 | 95.8% |
| Single Unit, Attached | 74 | 4.2% |
| 2 Unit Apartments | 0 | 0.0% |
| 3 or 4 Unit Apartments | 0 | 0.0% |
| 5 to 9 Unit Apartments | 0 | 0.0% |
| 10 or more Apartments | 0 | 0.0% |
| Mobile Home / Other | 0 | 0.0% |
| Total | 1,760 | 100.0% |
Housing Structures by Occupancy in Hampton
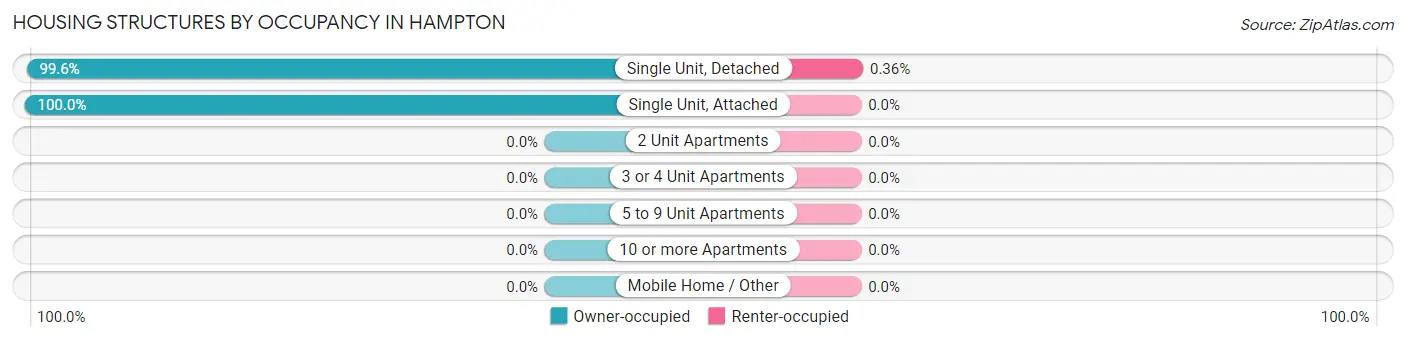
| Structure Type | Owner-occupied | Renter-occupied |
| Single Unit, Detached | 1,680 (99.6%) | 6 (0.4%) |
| Single Unit, Attached | 74 (100.0%) | 0 (0.0%) |
| 2 Unit Apartments | 0 (0.0%) | 0 (0.0%) |
| 3 or 4 Unit Apartments | 0 (0.0%) | 0 (0.0%) |
| 5 to 9 Unit Apartments | 0 (0.0%) | 0 (0.0%) |
| 10 or more Apartments | 0 (0.0%) | 0 (0.0%) |
| Mobile Home / Other | 0 (0.0%) | 0 (0.0%) |
| Total | 1,754 (99.7%) | 6 (0.3%) |
Housing Structures by Number of Rooms in Hampton
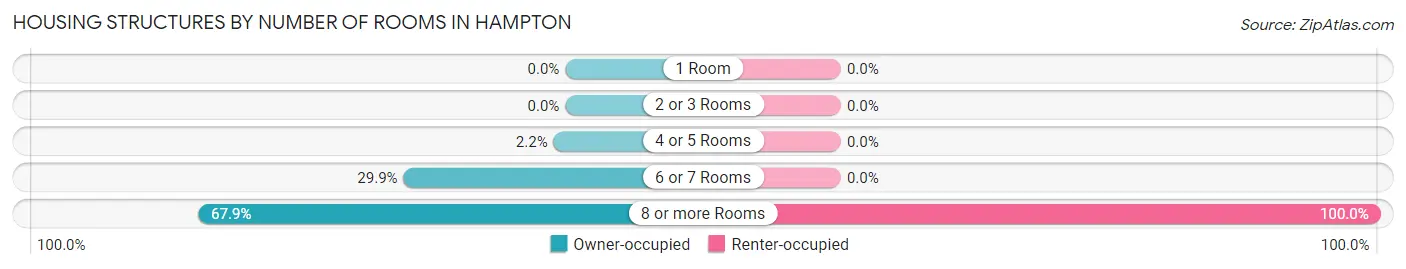
| Number of Rooms | Owner-occupied | Renter-occupied |
| 1 Room | 0 (0.0%) | 0 (0.0%) |
| 2 or 3 Rooms | 0 (0.0%) | 0 (0.0%) |
| 4 or 5 Rooms | 38 (2.2%) | 0 (0.0%) |
| 6 or 7 Rooms | 525 (29.9%) | 0 (0.0%) |
| 8 or more Rooms | 1,191 (67.9%) | 6 (100.0%) |
| Total | 1,754 (100.0%) | 6 (100.0%) |
Housing Structure by Heating Type in Hampton
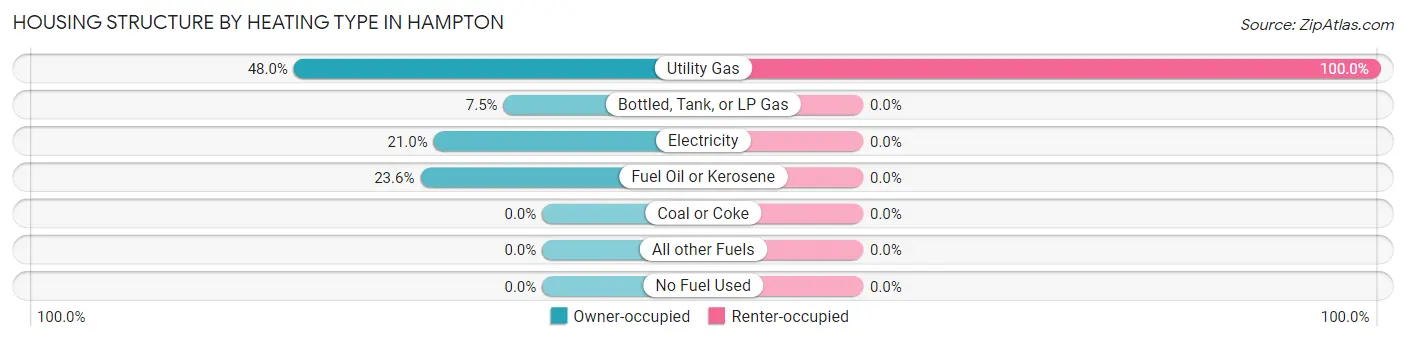
| Heating Type | Owner-occupied | Renter-occupied |
| Utility Gas | 842 (48.0%) | 6 (100.0%) |
| Bottled, Tank, or LP Gas | 131 (7.5%) | 0 (0.0%) |
| Electricity | 368 (21.0%) | 0 (0.0%) |
| Fuel Oil or Kerosene | 413 (23.5%) | 0 (0.0%) |
| Coal or Coke | 0 (0.0%) | 0 (0.0%) |
| All other Fuels | 0 (0.0%) | 0 (0.0%) |
| No Fuel Used | 0 (0.0%) | 0 (0.0%) |
| Total | 1,754 (100.0%) | 6 (100.0%) |
Household Vehicle Usage in Hampton
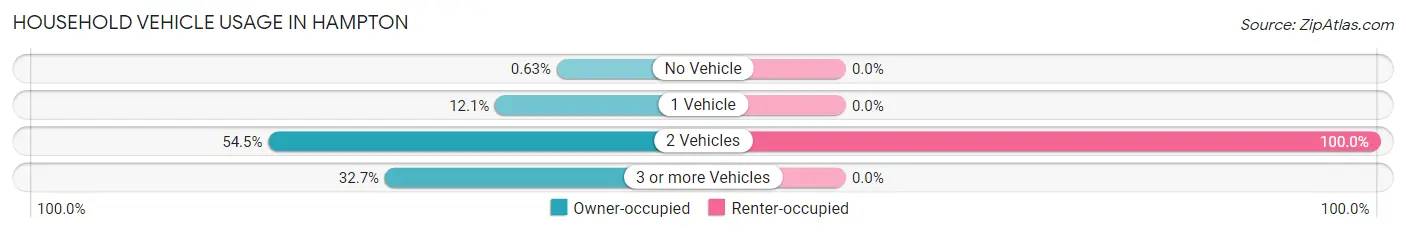
| Vehicles per Household | Owner-occupied | Renter-occupied |
| No Vehicle | 11 (0.6%) | 0 (0.0%) |
| 1 Vehicle | 213 (12.1%) | 0 (0.0%) |
| 2 Vehicles | 956 (54.5%) | 6 (100.0%) |
| 3 or more Vehicles | 574 (32.7%) | 0 (0.0%) |
| Total | 1,754 (100.0%) | 6 (100.0%) |
Real Estate & Mortgages in Hampton
Real Estate and Mortgage Overview in Hampton
| Characteristic | Without Mortgage | With Mortgage |
| Housing Units | 648 | 1,106 |
| Median Property Value | $544,900 | $583,500 |
| Median Household Income | $112,400 | $739 |
| Monthly Housing Costs | $863 | $547 |
| Real Estate Taxes | $5,175 | $0 |
Property Value by Mortgage Status in Hampton
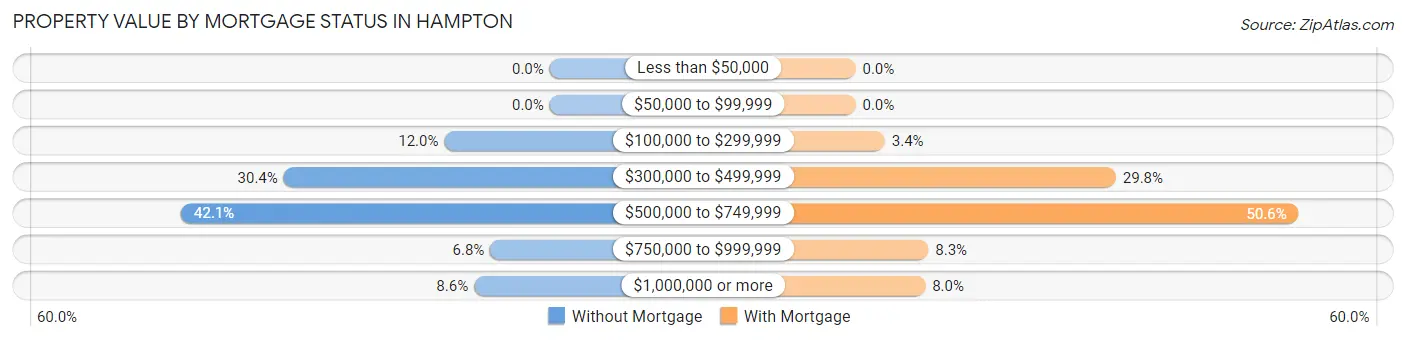
| Property Value | Without Mortgage | With Mortgage |
| Less than $50,000 | 0 (0.0%) | 0 (0.0%) |
| $50,000 to $99,999 | 0 (0.0%) | 0 (0.0%) |
| $100,000 to $299,999 | 78 (12.0%) | 37 (3.4%) |
| $300,000 to $499,999 | 197 (30.4%) | 329 (29.7%) |
| $500,000 to $749,999 | 273 (42.1%) | 560 (50.6%) |
| $750,000 to $999,999 | 44 (6.8%) | 92 (8.3%) |
| $1,000,000 or more | 56 (8.6%) | 88 (8.0%) |
| Total | 648 (100.0%) | 1,106 (100.0%) |
Household Income by Mortgage Status in Hampton
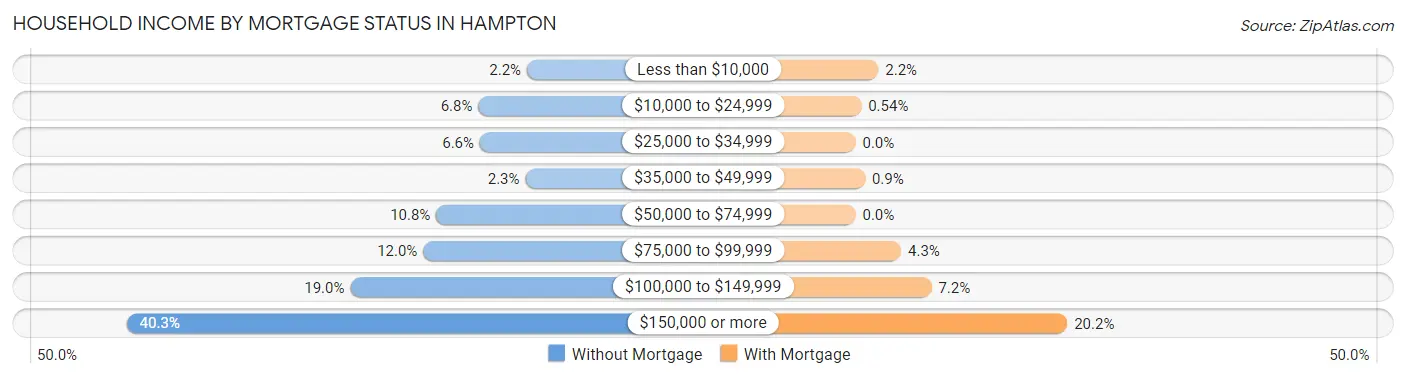
| Household Income | Without Mortgage | With Mortgage |
| Less than $10,000 | 14 (2.2%) | 24 (2.2%) |
| $10,000 to $24,999 | 44 (6.8%) | 6 (0.5%) |
| $25,000 to $34,999 | 43 (6.6%) | 0 (0.0%) |
| $35,000 to $49,999 | 15 (2.3%) | 10 (0.9%) |
| $50,000 to $74,999 | 70 (10.8%) | 0 (0.0%) |
| $75,000 to $99,999 | 78 (12.0%) | 48 (4.3%) |
| $100,000 to $149,999 | 123 (19.0%) | 80 (7.2%) |
| $150,000 or more | 261 (40.3%) | 223 (20.2%) |
| Total | 648 (100.0%) | 1,106 (100.0%) |
Property Value to Household Income Ratio in Hampton
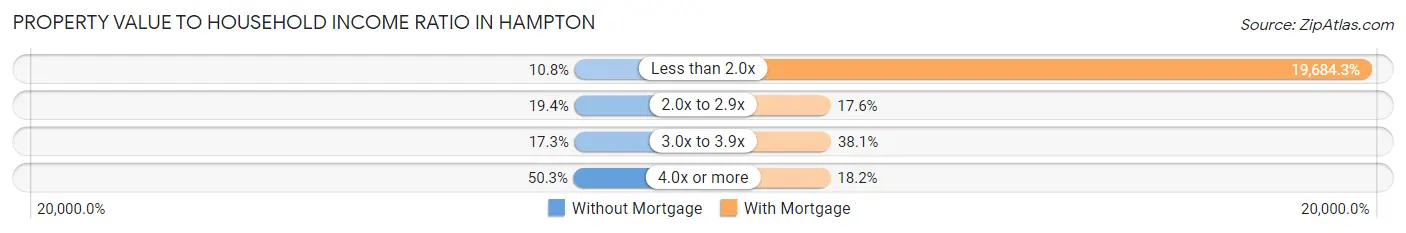
| Value-to-Income Ratio | Without Mortgage | With Mortgage |
| Less than 2.0x | 70 (10.8%) | 217,708 (19,684.3%) |
| 2.0x to 2.9x | 126 (19.4%) | 195 (17.6%) |
| 3.0x to 3.9x | 112 (17.3%) | 421 (38.1%) |
| 4.0x or more | 326 (50.3%) | 201 (18.2%) |
| Total | 648 (100.0%) | 1,106 (100.0%) |
Real Estate Taxes by Mortgage Status in Hampton
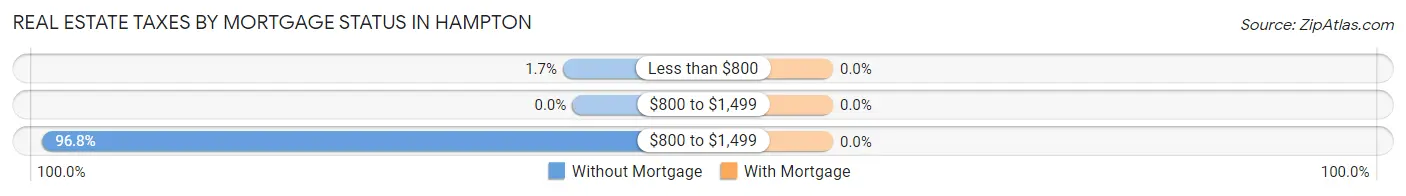
| Property Taxes | Without Mortgage | With Mortgage |
| Less than $800 | 11 (1.7%) | 0 (0.0%) |
| $800 to $1,499 | 0 (0.0%) | 0 (0.0%) |
| $800 to $1,499 | 627 (96.8%) | 0 (0.0%) |
| Total | 648 (100.0%) | 1,106 (100.0%) |
Health & Disability in Hampton
Health Insurance Coverage by Age in Hampton
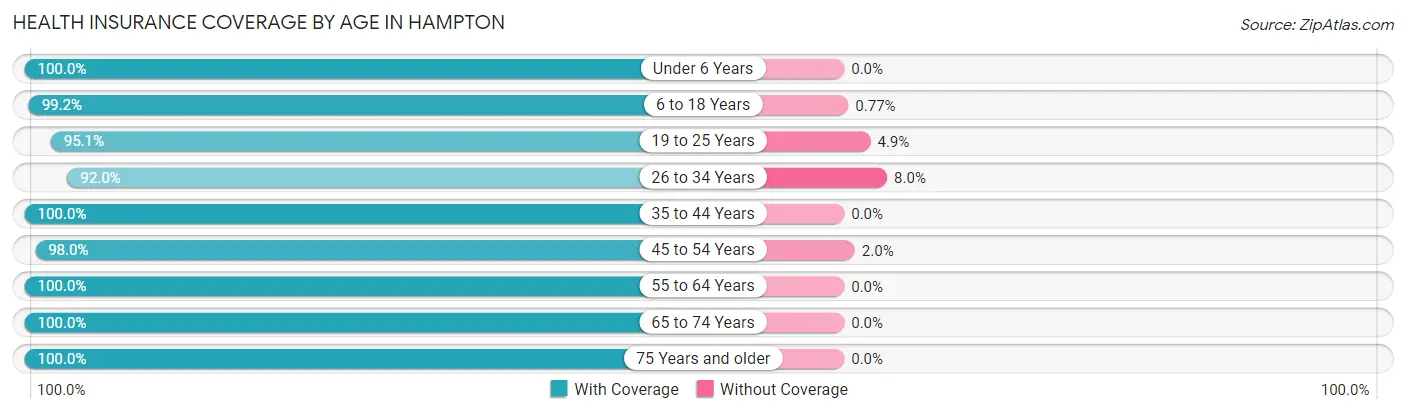
| Age Bracket | With Coverage | Without Coverage |
| Under 6 Years | 290 (100.0%) | 0 (0.0%) |
| 6 to 18 Years | 1,034 (99.2%) | 8 (0.8%) |
| 19 to 25 Years | 214 (95.1%) | 11 (4.9%) |
| 26 to 34 Years | 265 (92.0%) | 23 (8.0%) |
| 35 to 44 Years | 469 (100.0%) | 0 (0.0%) |
| 45 to 54 Years | 841 (98.0%) | 17 (2.0%) |
| 55 to 64 Years | 889 (100.0%) | 0 (0.0%) |
| 65 to 74 Years | 574 (100.0%) | 0 (0.0%) |
| 75 Years and older | 441 (100.0%) | 0 (0.0%) |
| Total | 5,017 (98.8%) | 59 (1.2%) |
Health Insurance Coverage by Citizenship Status in Hampton
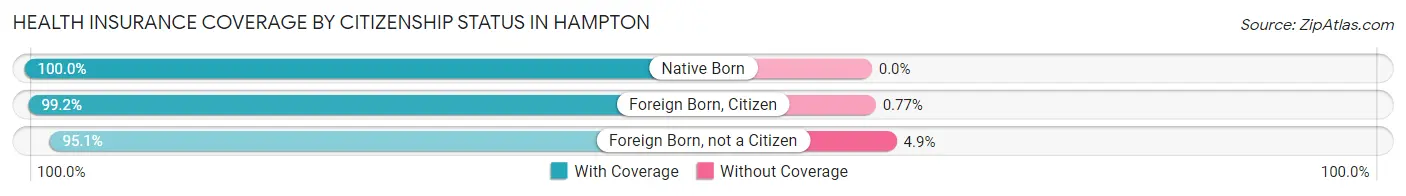
| Citizenship Status | With Coverage | Without Coverage |
| Native Born | 290 (100.0%) | 0 (0.0%) |
| Foreign Born, Citizen | 1,034 (99.2%) | 8 (0.8%) |
| Foreign Born, not a Citizen | 214 (95.1%) | 11 (4.9%) |
Health Insurance Coverage by Household Income in Hampton
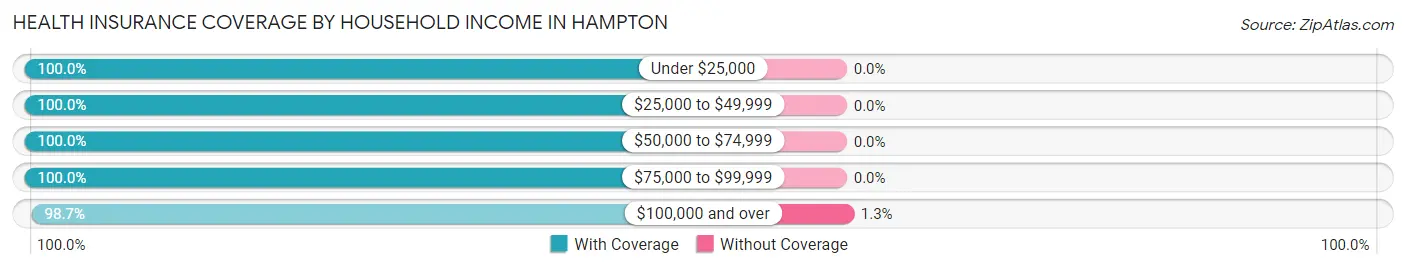
| Household Income | With Coverage | Without Coverage |
| Under $25,000 | 100 (100.0%) | 0 (0.0%) |
| $25,000 to $49,999 | 123 (100.0%) | 0 (0.0%) |
| $50,000 to $74,999 | 190 (100.0%) | 0 (0.0%) |
| $75,000 to $99,999 | 406 (100.0%) | 0 (0.0%) |
| $100,000 and over | 4,175 (98.7%) | 56 (1.3%) |
Public vs Private Health Insurance Coverage by Age in Hampton
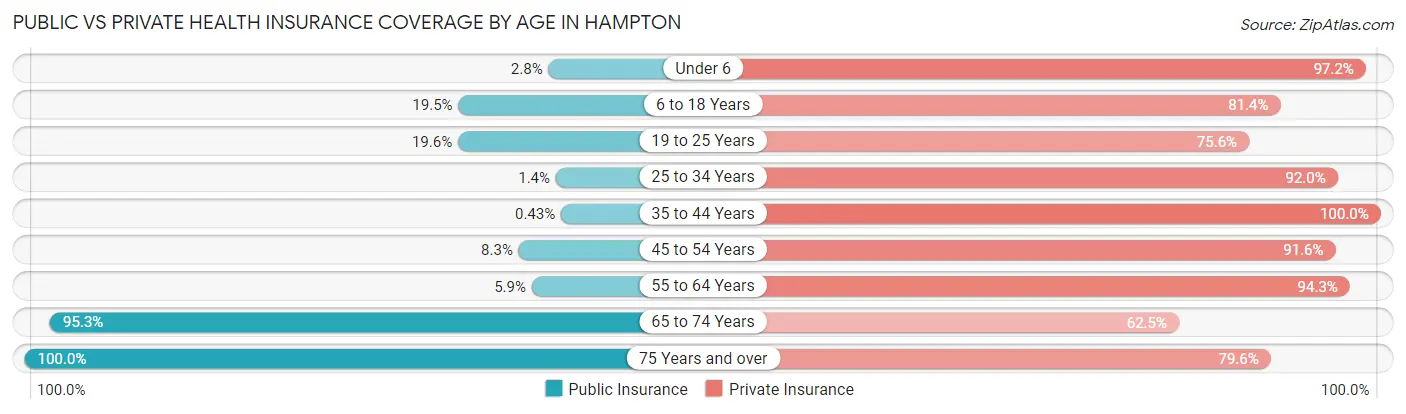
| Age Bracket | Public Insurance | Private Insurance |
| Under 6 | 8 (2.8%) | 282 (97.2%) |
| 6 to 18 Years | 203 (19.5%) | 848 (81.4%) |
| 19 to 25 Years | 44 (19.6%) | 170 (75.6%) |
| 25 to 34 Years | 4 (1.4%) | 265 (92.0%) |
| 35 to 44 Years | 2 (0.4%) | 469 (100.0%) |
| 45 to 54 Years | 71 (8.3%) | 786 (91.6%) |
| 55 to 64 Years | 52 (5.9%) | 838 (94.3%) |
| 65 to 74 Years | 547 (95.3%) | 359 (62.5%) |
| 75 Years and over | 441 (100.0%) | 351 (79.6%) |
| Total | 1,372 (27.0%) | 4,368 (86.1%) |
Disability Status by Sex by Age in Hampton
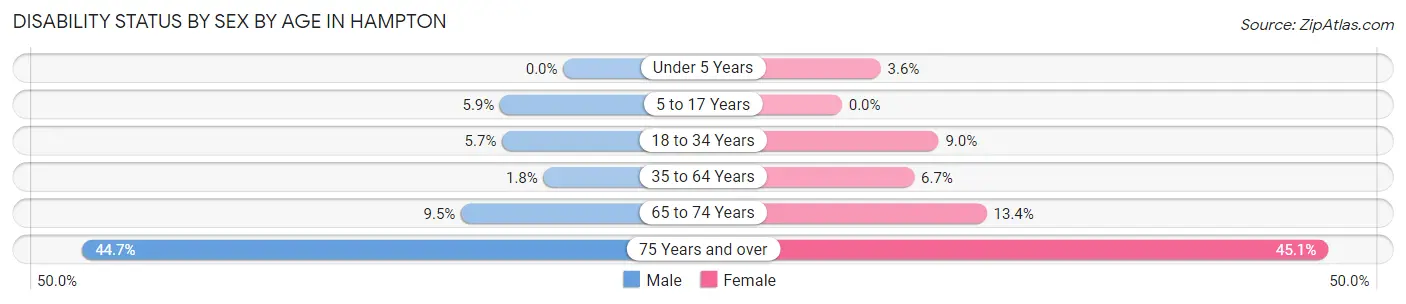
| Age Bracket | Male | Female |
| Under 5 Years | 0 (0.0%) | 4 (3.6%) |
| 5 to 17 Years | 34 (5.9%) | 0 (0.0%) |
| 18 to 34 Years | 14 (5.7%) | 28 (9.0%) |
| 35 to 64 Years | 19 (1.8%) | 79 (6.7%) |
| 65 to 74 Years | 29 (9.5%) | 36 (13.4%) |
| 75 Years and over | 96 (44.7%) | 102 (45.1%) |
Disability Class by Sex by Age in Hampton
Disability Class: Hearing Difficulty
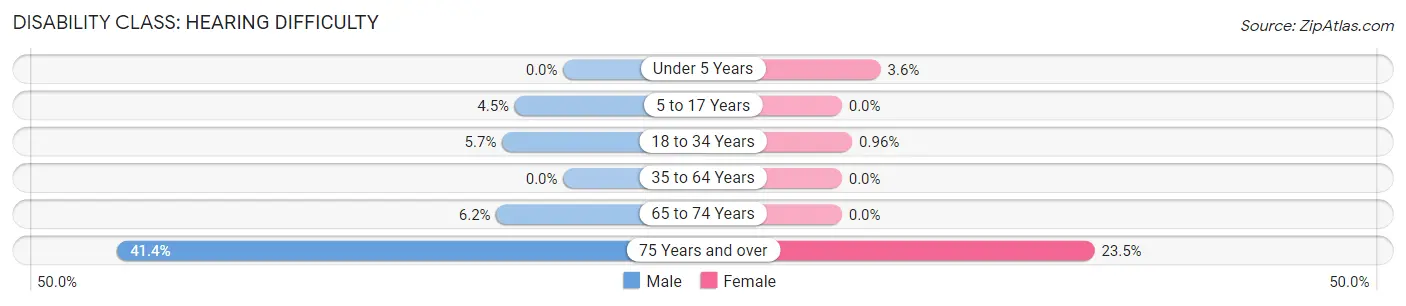
| Age Bracket | Male | Female |
| Under 5 Years | 0 (0.0%) | 4 (3.6%) |
| 5 to 17 Years | 26 (4.5%) | 0 (0.0%) |
| 18 to 34 Years | 14 (5.7%) | 3 (1.0%) |
| 35 to 64 Years | 0 (0.0%) | 0 (0.0%) |
| 65 to 74 Years | 19 (6.2%) | 0 (0.0%) |
| 75 Years and over | 89 (41.4%) | 53 (23.4%) |
Disability Class: Vision Difficulty
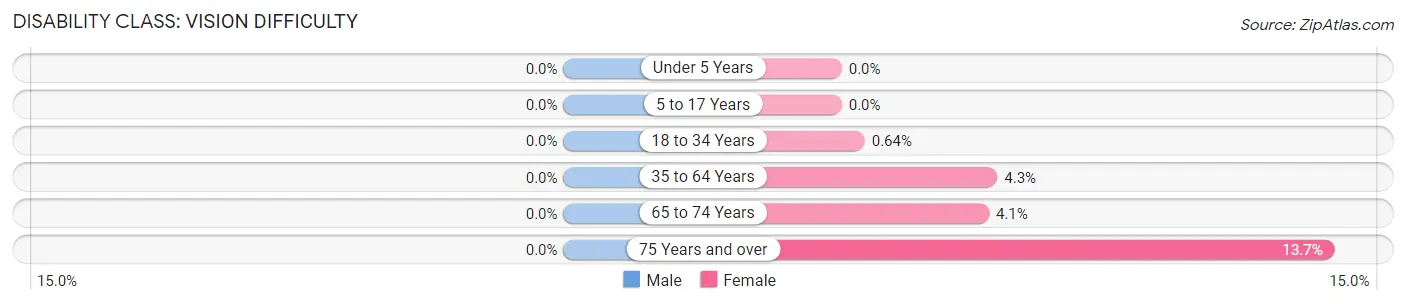
| Age Bracket | Male | Female |
| Under 5 Years | 0 (0.0%) | 0 (0.0%) |
| 5 to 17 Years | 0 (0.0%) | 0 (0.0%) |
| 18 to 34 Years | 0 (0.0%) | 2 (0.6%) |
| 35 to 64 Years | 0 (0.0%) | 51 (4.3%) |
| 65 to 74 Years | 0 (0.0%) | 11 (4.1%) |
| 75 Years and over | 0 (0.0%) | 31 (13.7%) |
Disability Class: Cognitive Difficulty
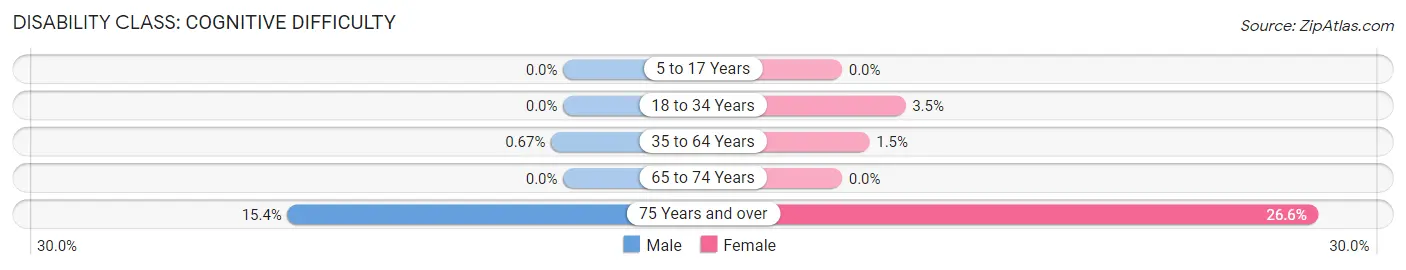
| Age Bracket | Male | Female |
| 5 to 17 Years | 0 (0.0%) | 0 (0.0%) |
| 18 to 34 Years | 0 (0.0%) | 11 (3.5%) |
| 35 to 64 Years | 7 (0.7%) | 18 (1.5%) |
| 65 to 74 Years | 0 (0.0%) | 0 (0.0%) |
| 75 Years and over | 33 (15.3%) | 60 (26.6%) |
Disability Class: Ambulatory Difficulty
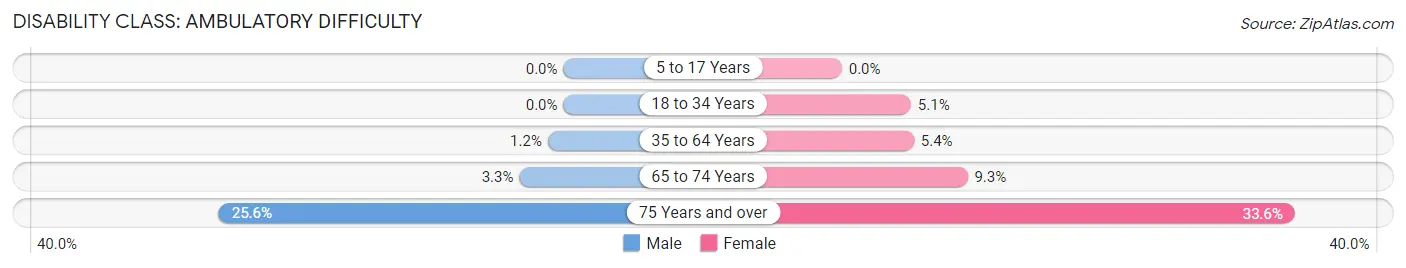
| Age Bracket | Male | Female |
| 5 to 17 Years | 0 (0.0%) | 0 (0.0%) |
| 18 to 34 Years | 0 (0.0%) | 16 (5.1%) |
| 35 to 64 Years | 12 (1.2%) | 63 (5.3%) |
| 65 to 74 Years | 10 (3.3%) | 25 (9.3%) |
| 75 Years and over | 55 (25.6%) | 76 (33.6%) |
Disability Class: Self-Care Difficulty
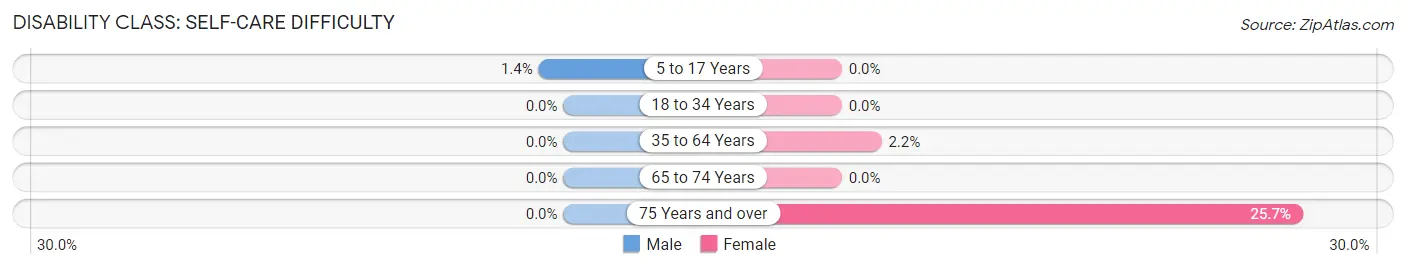
| Age Bracket | Male | Female |
| 5 to 17 Years | 8 (1.4%) | 0 (0.0%) |
| 18 to 34 Years | 0 (0.0%) | 0 (0.0%) |
| 35 to 64 Years | 0 (0.0%) | 26 (2.2%) |
| 65 to 74 Years | 0 (0.0%) | 0 (0.0%) |
| 75 Years and over | 0 (0.0%) | 58 (25.7%) |
Technology Access in Hampton
Computing Device Access in Hampton
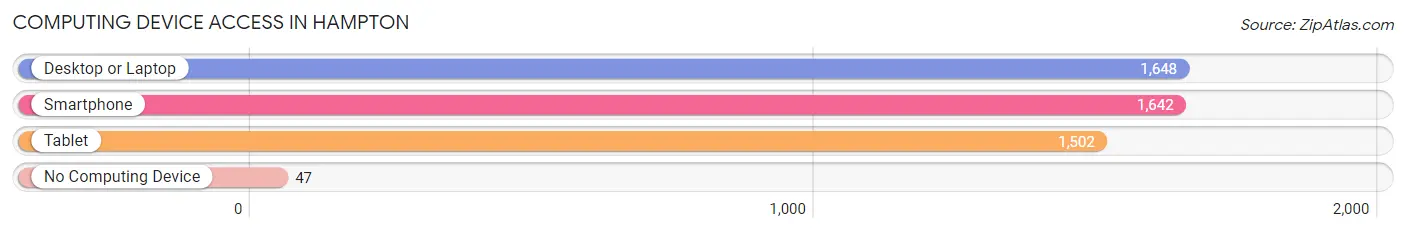
| Device Type | # Households | % Households |
| Desktop or Laptop | 1,648 | 93.6% |
| Smartphone | 1,642 | 93.3% |
| Tablet | 1,502 | 85.3% |
| No Computing Device | 47 | 2.7% |
| Total | 1,760 | 100.0% |
Internet Access in Hampton
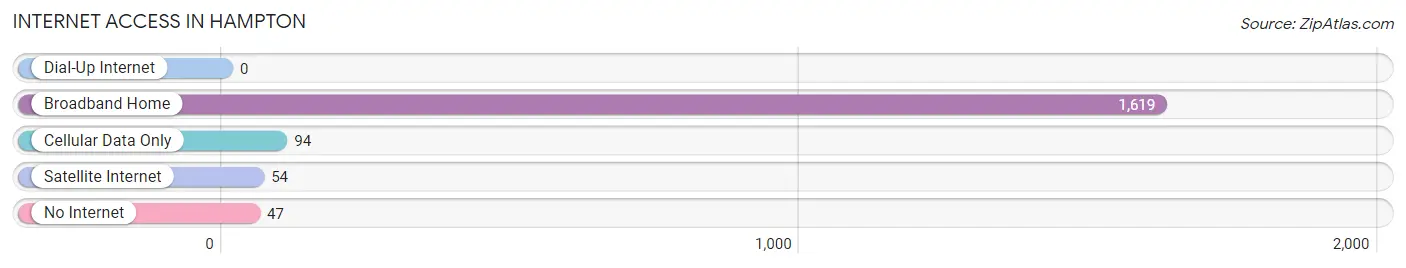
| Internet Type | # Households | % Households |
| Dial-Up Internet | 0 | 0.0% |
| Broadband Home | 1,619 | 92.0% |
| Cellular Data Only | 94 | 5.3% |
| Satellite Internet | 54 | 3.1% |
| No Internet | 47 | 2.7% |
| Total | 1,760 | 100.0% |
Hampton Summary
Hampton is a small town located in the state of Maryland, United States. It is situated in the northern part of the state, in the county of Cecil. The town has a population of approximately 1,000 people, and is located about 30 miles from Baltimore.
Geography
Hampton is located in the northern part of Cecil County, Maryland. It is situated on the banks of the Susquehanna River, and is surrounded by rolling hills and farmland. The town is located about 30 miles from Baltimore, and is accessible by car or train. The town is also close to the Pennsylvania border, and is about an hour away from Philadelphia.
The town is divided into two sections, the north and south sides. The north side is mainly residential, while the south side is mainly commercial. The town is also home to a few small businesses, including a grocery store, a hardware store, and a few restaurants.
Economy
The economy of Hampton is largely based on agriculture. The town is home to several farms, which produce a variety of crops, including corn, soybeans, and wheat. The town also has a few small businesses, including a grocery store, a hardware store, and a few restaurants.
The town is also home to a few manufacturing companies, which produce a variety of products, including furniture, clothing, and electronics. The town is also home to a few small businesses, which provide services such as auto repair, landscaping, and home repair.
Demographics
As of the 2010 census, the population of Hampton was 1,000 people. The town is predominantly white, with a small African American population. The median age of the town is 44 years old, and the median household income is $50,000.
The town is home to a few churches, including the First Baptist Church of Hampton, and the Church of the Nazarene. The town also has a few schools, including the Hampton Elementary School, and the Hampton High School.
Conclusion
Hampton is a small town located in the northern part of Cecil County, Maryland. The town has a population of approximately 1,000 people, and is mainly a residential and agricultural community. The town is home to a few small businesses, and is also home to a few manufacturing companies. The town is predominantly white, with a small African American population. The median age of the town is 44 years old, and the median household income is $50,000.
Common Questions
What is Per Capita Income in Hampton?
Per Capita income in Hampton is $77,207.
What is the Median Family Income in Hampton?
Median Family Income in Hampton is $180,000.
What is the Median Household income in Hampton?
Median Household Income in Hampton is $169,405.
What is Income or Wage Gap in Hampton?
Income or Wage Gap in Hampton is 32.2%.
Women in Hampton earn 67.8 cents for every dollar earned by a man.
What is Inequality or Gini Index in Hampton?
Inequality or Gini Index in Hampton is 0.40.
What is the Total Population of Hampton?
Total Population of Hampton is 5,080.
What is the Total Male Population of Hampton?
Total Male Population of Hampton is 2,486.
What is the Total Female Population of Hampton?
Total Female Population of Hampton is 2,594.
What is the Ratio of Males per 100 Females in Hampton?
There are 95.84 Males per 100 Females in Hampton.
What is the Ratio of Females per 100 Males in Hampton?
There are 104.34 Females per 100 Males in Hampton.
What is the Median Population Age in Hampton?
Median Population Age in Hampton is 47.7 Years.
What is the Average Family Size in Hampton
Average Family Size in Hampton is 3.0 People.
What is the Average Household Size in Hampton
Average Household Size in Hampton is 2.9 People.
How Large is the Labor Force in Hampton?
There are 2,645 People in the Labor Forcein in Hampton.
What is the Percentage of People in the Labor Force in Hampton?
65.6% of People are in the Labor Force in Hampton.
What is the Unemployment Rate in Hampton?
Unemployment Rate in Hampton is 0.9%.