Leisure World, MD Map & Demographics
Leisure World Map
Leisure World Overview
$62,959
PER CAPITA INCOME
$79,477
AVG FAMILY INCOME
$61,679
AVG HOUSEHOLD INCOME
10.0%
WAGE / INCOME GAP [ % ]
90.0¢/ $1
WAGE / INCOME GAP [ $ ]
$4,682
FAMILY INCOME DEFICIT
0.50
INEQUALITY / GINI INDEX
8,975
TOTAL POPULATION
3,489
MALE POPULATION
5,486
FEMALE POPULATION
63.60
MALES / 100 FEMALES
157.24
FEMALES / 100 MALES
76.4
MEDIAN AGE
2.2
AVG FAMILY SIZE
1.5
AVG HOUSEHOLD SIZE
2,026
LABOR FORCE [ PEOPLE ]
23.3%
PERCENT IN LABOR FORCE
14.6%
UNEMPLOYMENT RATE
Income in Leisure World
Income Overview in Leisure World
Per Capita Income in Leisure World is $62,959, while median incomes of families and households are $79,477 and $61,679 respectively.
| Characteristic | Number | Measure |
| Per Capita Income | 8,975 | $62,959 |
| Median Family Income | 2,136 | $79,477 |
| Mean Family Income | 2,136 | $112,799 |
| Median Household Income | 6,034 | $61,679 |
| Mean Household Income | 6,034 | $92,735 |
| Income Deficit | 2,136 | $4,682 |
| Wage / Income Gap (%) | 8,975 | 9.98% |
| Wage / Income Gap ($) | 8,975 | 90.02¢ per $1 |
| Gini / Inequality Index | 8,975 | 0.50 |
Earnings by Sex in Leisure World
Average Earnings in Leisure World are $34,960, $36,788 for men and $33,115 for women, a difference of 10.0%.
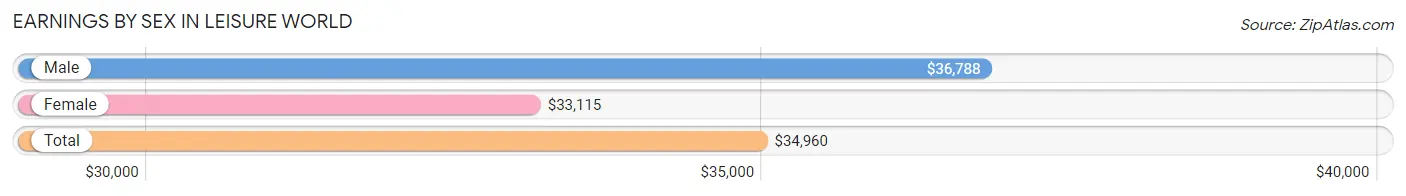
| Sex | Number | Average Earnings |
| Male | 807 (38.8%) | $36,788 |
| Female | 1,275 (61.2%) | $33,115 |
| Total | 2,082 (100.0%) | $34,960 |
Earnings by Sex by Income Bracket in Leisure World
The most common earnings brackets in Leisure World are $100,000+ for men (141 | 17.5%) and $100,000+ for women (186 | 14.6%).
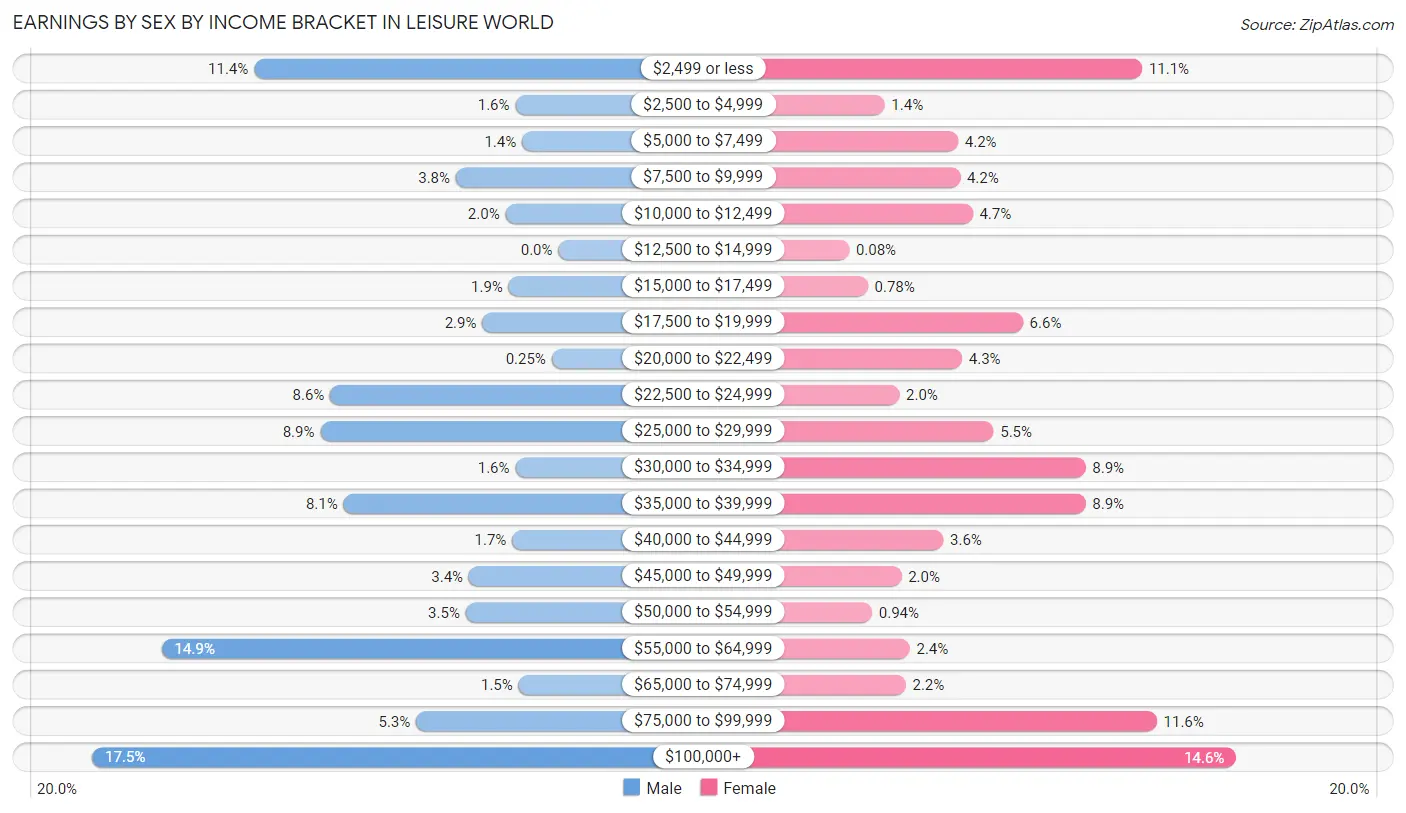
| Income | Male | Female |
| $2,499 or less | 92 (11.4%) | 141 (11.1%) |
| $2,500 to $4,999 | 13 (1.6%) | 18 (1.4%) |
| $5,000 to $7,499 | 11 (1.4%) | 53 (4.2%) |
| $7,500 to $9,999 | 31 (3.8%) | 54 (4.2%) |
| $10,000 to $12,499 | 16 (2.0%) | 60 (4.7%) |
| $12,500 to $14,999 | 0 (0.0%) | 1 (0.1%) |
| $15,000 to $17,499 | 15 (1.9%) | 10 (0.8%) |
| $17,500 to $19,999 | 23 (2.9%) | 84 (6.6%) |
| $20,000 to $22,499 | 2 (0.3%) | 55 (4.3%) |
| $22,500 to $24,999 | 69 (8.6%) | 25 (2.0%) |
| $25,000 to $29,999 | 72 (8.9%) | 70 (5.5%) |
| $30,000 to $34,999 | 13 (1.6%) | 114 (8.9%) |
| $35,000 to $39,999 | 65 (8.1%) | 114 (8.9%) |
| $40,000 to $44,999 | 14 (1.7%) | 46 (3.6%) |
| $45,000 to $49,999 | 27 (3.4%) | 26 (2.0%) |
| $50,000 to $54,999 | 28 (3.5%) | 12 (0.9%) |
| $55,000 to $64,999 | 120 (14.9%) | 30 (2.4%) |
| $65,000 to $74,999 | 12 (1.5%) | 28 (2.2%) |
| $75,000 to $99,999 | 43 (5.3%) | 148 (11.6%) |
| $100,000+ | 141 (17.5%) | 186 (14.6%) |
| Total | 807 (100.0%) | 1,275 (100.0%) |
Earnings by Sex by Educational Attainment in Leisure World
Average earnings in Leisure World are $41,518 for men and $34,940 for women, a difference of 15.8%. Men with an educational attainment of college or associate's degree enjoy the highest average annual earnings of $35,938, while those with college or associate's degree education earn the least with $35,938. Women with an educational attainment of graduate degree earn the most with the average annual earnings of $70,357, while those with high school diploma education have the smallest earnings of $35,950.
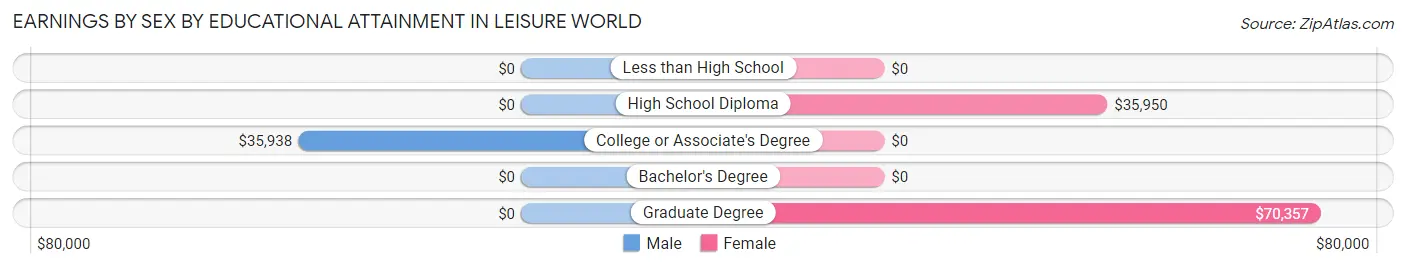
| Educational Attainment | Male Income | Female Income |
| Less than High School | - | - |
| High School Diploma | - | - |
| College or Associate's Degree | $35,938 | $0 |
| Bachelor's Degree | - | - |
| Graduate Degree | - | - |
| Total | $41,518 | $34,940 |
Family Income in Leisure World
Family Income Brackets in Leisure World
According to the Leisure World family income data, there are 408 families falling into the $100,000 to $149,999 income range, which is the most common income bracket and makes up 19.1% of all families. Conversely, the $10,000 to $14,999 income bracket is the least frequent group with only 15 families (0.7%) belonging to this category.
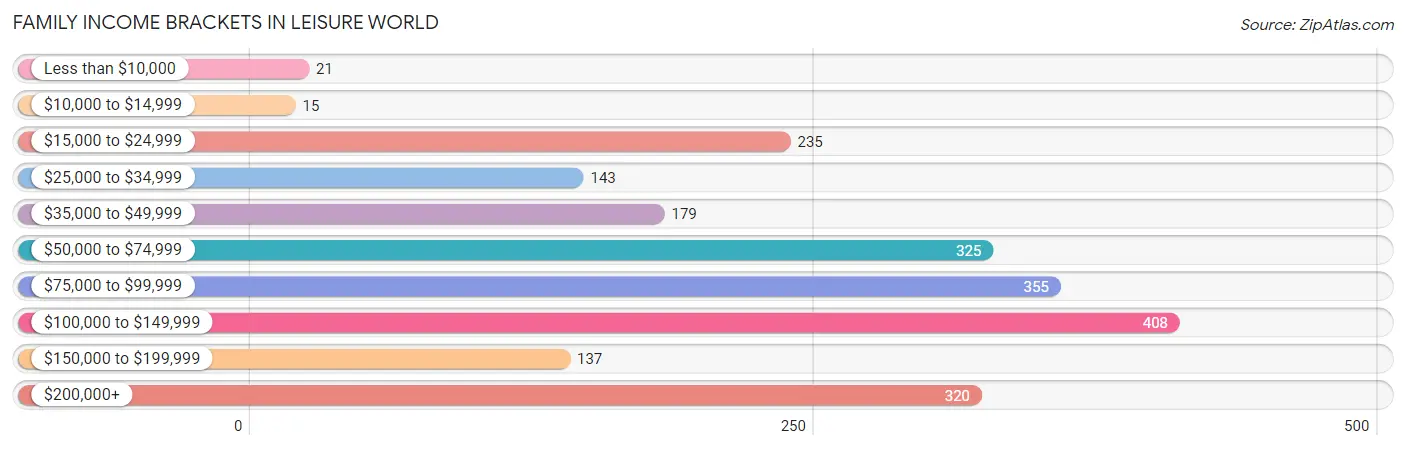
| Income Bracket | # Families | % Families |
| Less than $10,000 | 21 | 1.0% |
| $10,000 to $14,999 | 15 | 0.7% |
| $15,000 to $24,999 | 235 | 11.0% |
| $25,000 to $34,999 | 143 | 6.7% |
| $35,000 to $49,999 | 179 | 8.4% |
| $50,000 to $74,999 | 325 | 15.2% |
| $75,000 to $99,999 | 355 | 16.6% |
| $100,000 to $149,999 | 408 | 19.1% |
| $150,000 to $199,999 | 137 | 6.4% |
| $200,000+ | 320 | 15.0% |
Family Income by Famaliy Size in Leisure World
2-person families (1,887 | 88.3%) account for the highest median family income in Leisure World with $80,027 per family, while 2-person families (1,887 | 88.3%) have the highest median income of $40,014 per family member.
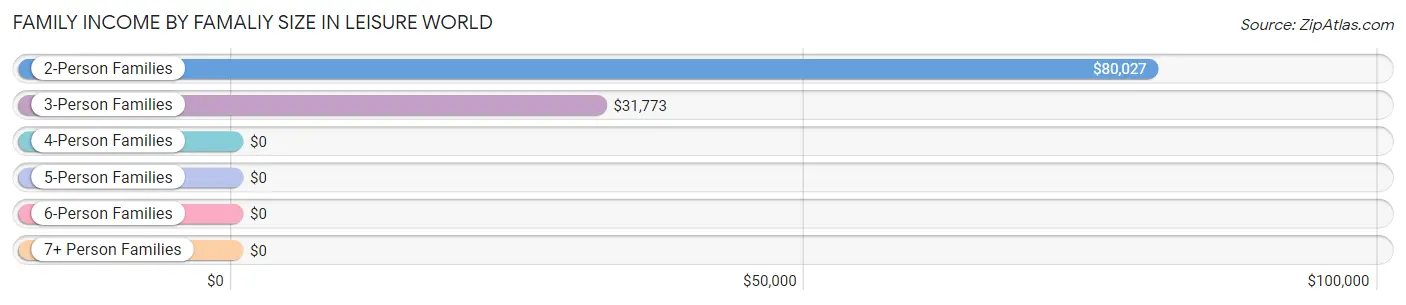
| Income Bracket | # Families | Median Income |
| 2-Person Families | 1,887 (88.3%) | $80,027 |
| 3-Person Families | 78 (3.6%) | $31,773 |
| 4-Person Families | 104 (4.9%) | $0 |
| 5-Person Families | 67 (3.1%) | $0 |
| 6-Person Families | 0 (0.0%) | $0 |
| 7+ Person Families | 0 (0.0%) | $0 |
| Total | 2,136 (100.0%) | $79,477 |
Family Income by Number of Earners in Leisure World
The median family income in Leisure World is $79,477, with families comprising 2 earners (205) having the highest median family income of $101,083, while families with no earners (1,355) have the lowest median family income of $77,610, accounting for 9.6% and 63.4% of families, respectively.
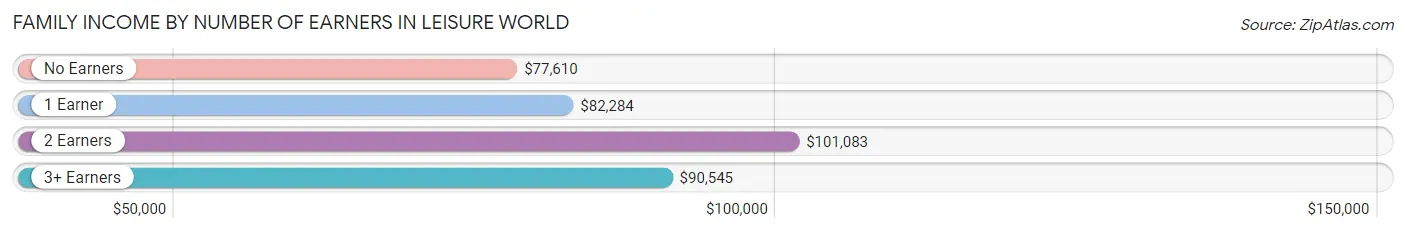
| Number of Earners | # Families | Median Income |
| No Earners | 1,355 (63.4%) | $77,610 |
| 1 Earner | 493 (23.1%) | $82,284 |
| 2 Earners | 205 (9.6%) | $101,083 |
| 3+ Earners | 83 (3.9%) | $90,545 |
| Total | 2,136 (100.0%) | $79,477 |
Household Income in Leisure World
Household Income Brackets in Leisure World
With 899 households falling in the category, the $50,000 to $74,999 income range is the most frequent in Leisure World, accounting for 14.9% of all households. In contrast, only 211 households (3.5%) fall into the less than $10,000 income bracket, making it the least populous group.
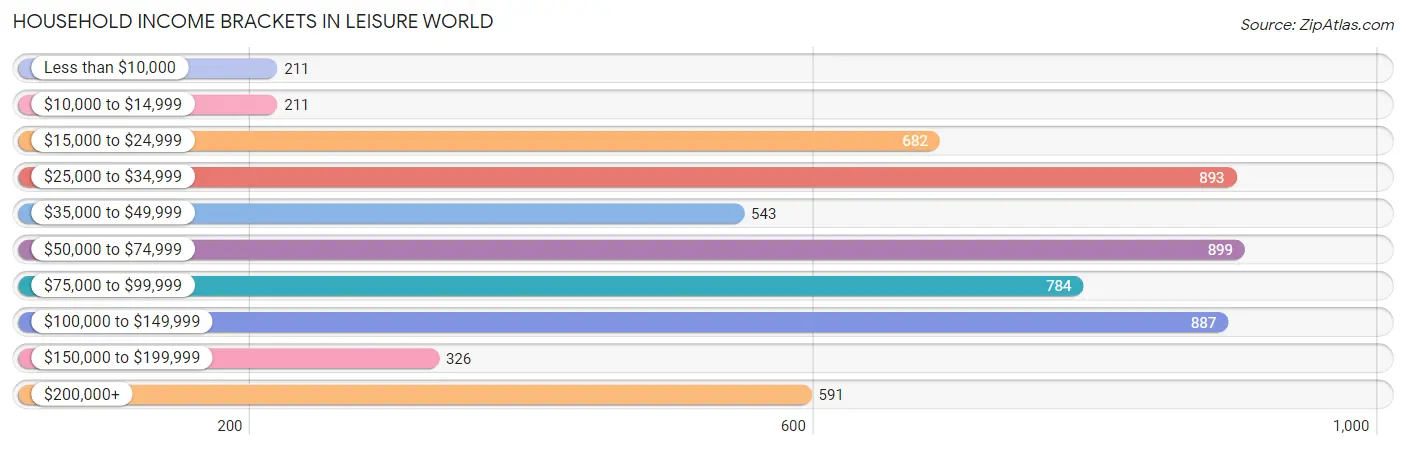
| Income Bracket | # Households | % Households |
| Less than $10,000 | 211 | 3.5% |
| $10,000 to $14,999 | 211 | 3.5% |
| $15,000 to $24,999 | 682 | 11.3% |
| $25,000 to $34,999 | 893 | 14.8% |
| $35,000 to $49,999 | 543 | 9.0% |
| $50,000 to $74,999 | 899 | 14.9% |
| $75,000 to $99,999 | 784 | 13.0% |
| $100,000 to $149,999 | 887 | 14.7% |
| $150,000 to $199,999 | 326 | 5.4% |
| $200,000+ | 591 | 9.8% |
Household Income by Householder Age in Leisure World
The median household income in Leisure World is $61,679, with the highest median household income of $76,587 found in the 45 to 64 years age bracket for the primary householder. A total of 642 households (10.6%) fall into this category.
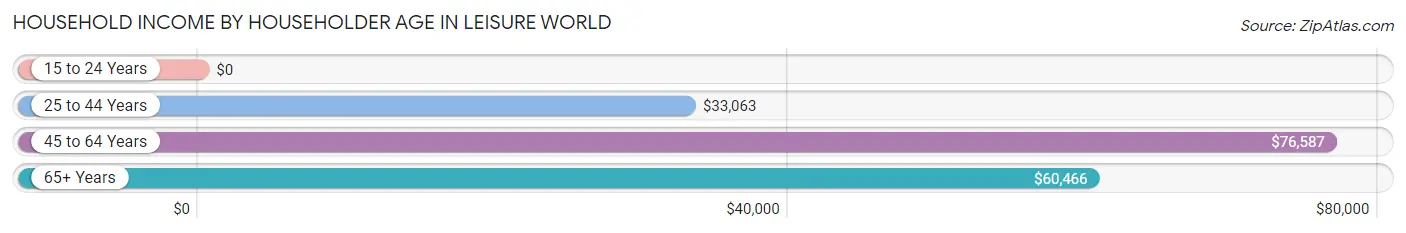
| Income Bracket | # Households | Median Income |
| 15 to 24 Years | 0 (0.0%) | $0 |
| 25 to 44 Years | 132 (2.2%) | $33,063 |
| 45 to 64 Years | 642 (10.6%) | $76,587 |
| 65+ Years | 5,260 (87.2%) | $60,466 |
| Total | 6,034 (100.0%) | $61,679 |
Poverty in Leisure World
Income Below Poverty by Sex and Age in Leisure World
With 4.8% poverty level for males and 6.3% for females among the residents of Leisure World, 75 year old and over males and 35 to 44 year old females are the most vulnerable to poverty, with 125 males (6.8%) and 21 females (15.9%) in their respective age groups living below the poverty level.
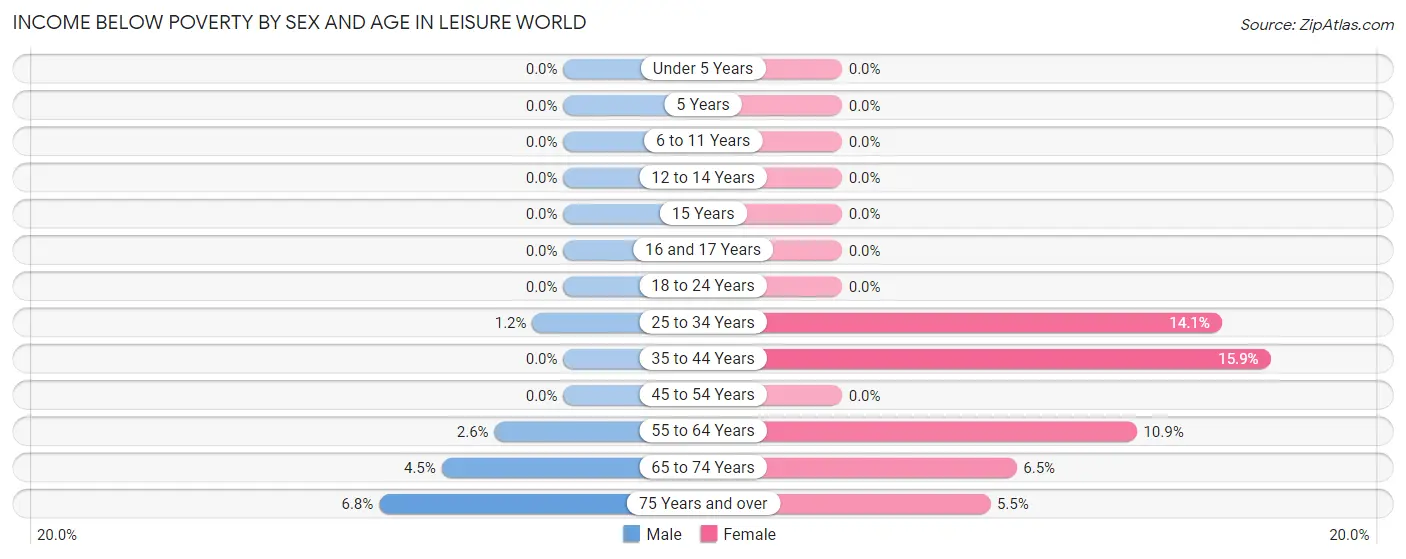
| Age Bracket | Male | Female |
| Under 5 Years | 0 (0.0%) | 0 (0.0%) |
| 5 Years | 0 (0.0%) | 0 (0.0%) |
| 6 to 11 Years | 0 (0.0%) | 0 (0.0%) |
| 12 to 14 Years | 0 (0.0%) | 0 (0.0%) |
| 15 Years | 0 (0.0%) | 0 (0.0%) |
| 16 and 17 Years | 0 (0.0%) | 0 (0.0%) |
| 18 to 24 Years | 0 (0.0%) | 0 (0.0%) |
| 25 to 34 Years | 1 (1.1%) | 11 (14.1%) |
| 35 to 44 Years | 0 (0.0%) | 21 (15.9%) |
| 45 to 54 Years | 0 (0.0%) | 0 (0.0%) |
| 55 to 64 Years | 9 (2.6%) | 51 (10.9%) |
| 65 to 74 Years | 29 (4.5%) | 88 (6.5%) |
| 75 Years and over | 125 (6.8%) | 171 (5.5%) |
| Total | 164 (4.8%) | 342 (6.3%) |
Income Above Poverty by Sex and Age in Leisure World
According to the poverty statistics in Leisure World, males aged 6 to 11 years and females aged 6 to 11 years are the age groups that are most secure financially, with 100.0% of males and 100.0% of females in these age groups living above the poverty line.
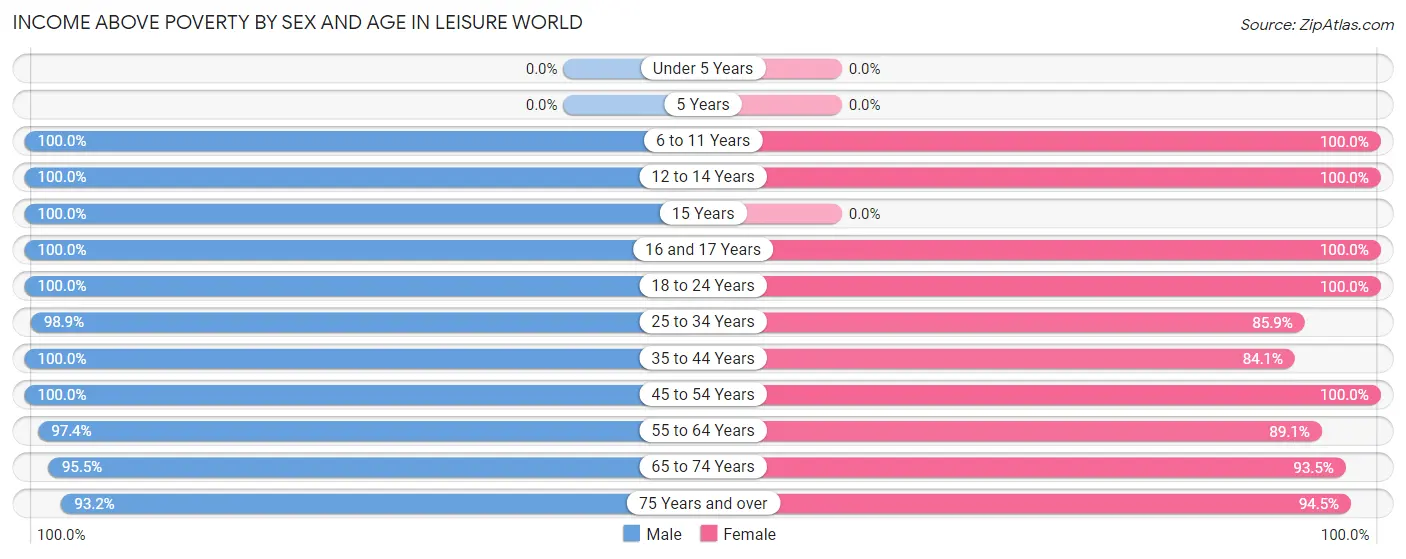
| Age Bracket | Male | Female |
| Under 5 Years | 0 (0.0%) | 0 (0.0%) |
| 5 Years | 0 (0.0%) | 0 (0.0%) |
| 6 to 11 Years | 31 (100.0%) | 41 (100.0%) |
| 12 to 14 Years | 125 (100.0%) | 37 (100.0%) |
| 15 Years | 16 (100.0%) | 0 (0.0%) |
| 16 and 17 Years | 25 (100.0%) | 28 (100.0%) |
| 18 to 24 Years | 97 (100.0%) | 92 (100.0%) |
| 25 to 34 Years | 86 (98.9%) | 67 (85.9%) |
| 35 to 44 Years | 136 (100.0%) | 111 (84.1%) |
| 45 to 54 Years | 100 (100.0%) | 122 (100.0%) |
| 55 to 64 Years | 342 (97.4%) | 415 (89.1%) |
| 65 to 74 Years | 612 (95.5%) | 1,269 (93.5%) |
| 75 Years and over | 1,702 (93.2%) | 2,940 (94.5%) |
| Total | 3,272 (95.2%) | 5,122 (93.7%) |
Income Below Poverty Among Married-Couple Families in Leisure World
The poverty statistics for married-couple families in Leisure World show that 2.9% or 51 of the total 1,731 families live below the poverty line. Families with no children have the highest poverty rate of 3.1%, comprising of 51 families. On the other hand, families with 1 or 2 children have the lowest poverty rate of 0.0%, which includes 0 families.
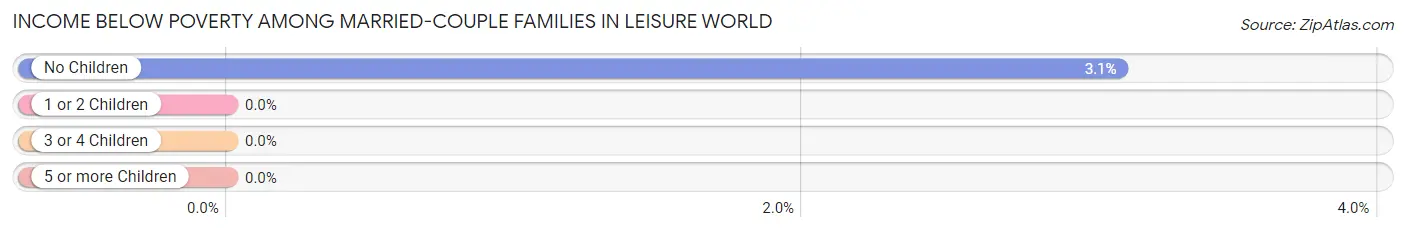
| Children | Above Poverty | Below Poverty |
| No Children | 1,593 (96.9%) | 51 (3.1%) |
| 1 or 2 Children | 59 (100.0%) | 0 (0.0%) |
| 3 or 4 Children | 28 (100.0%) | 0 (0.0%) |
| 5 or more Children | 0 (0.0%) | 0 (0.0%) |
| Total | 1,680 (97.1%) | 51 (2.9%) |
Income Below Poverty Among Single-Parent Households in Leisure World
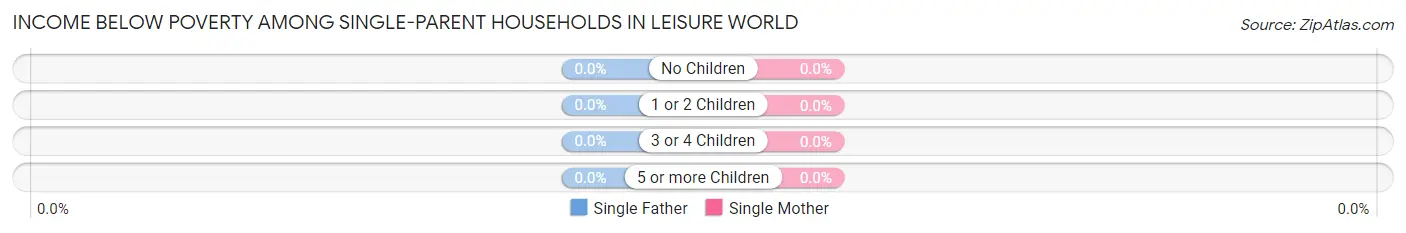
| Children | Single Father | Single Mother |
| No Children | 0 (0.0%) | 0 (0.0%) |
| 1 or 2 Children | 0 (0.0%) | 0 (0.0%) |
| 3 or 4 Children | 0 (0.0%) | 0 (0.0%) |
| 5 or more Children | 0 (0.0%) | 0 (0.0%) |
| Total | 0 (0.0%) | 0 (0.0%) |
Income Below Poverty Among Married-Couple vs Single-Parent Households in Leisure World
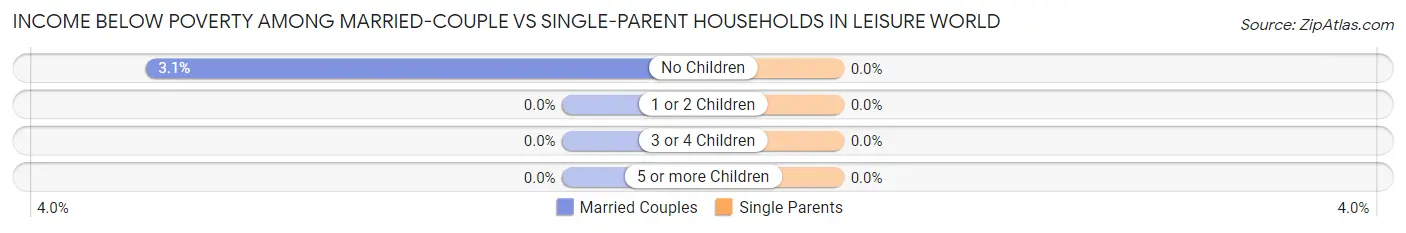
| Children | Married-Couple Families | Single-Parent Households |
| No Children | 51 (3.1%) | 0 (0.0%) |
| 1 or 2 Children | 0 (0.0%) | 0 (0.0%) |
| 3 or 4 Children | 0 (0.0%) | 0 (0.0%) |
| 5 or more Children | 0 (0.0%) | 0 (0.0%) |
| Total | 51 (2.9%) | 0 (0.0%) |
Race in Leisure World
The most populous races in Leisure World are White / Caucasian (5,872 | 65.4%), Black / African American (1,741 | 19.4%), and Asian (816 | 9.1%).
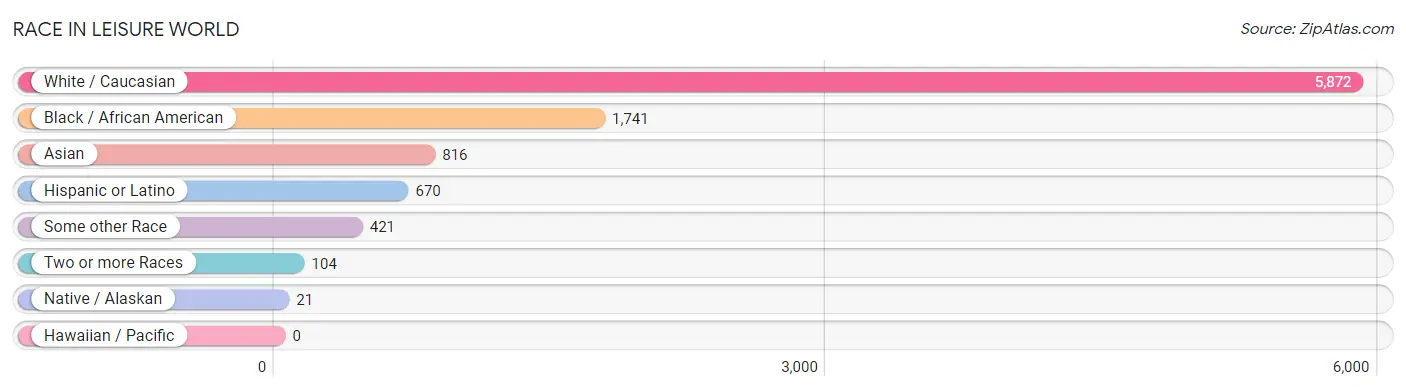
| Race | # Population | % Population |
| Asian | 816 | 9.1% |
| Black / African American | 1,741 | 19.4% |
| Hawaiian / Pacific | 0 | 0.0% |
| Hispanic or Latino | 670 | 7.5% |
| Native / Alaskan | 21 | 0.2% |
| White / Caucasian | 5,872 | 65.4% |
| Two or more Races | 104 | 1.2% |
| Some other Race | 421 | 4.7% |
| Total | 8,975 | 100.0% |
Ancestry in Leisure World
The most populous ancestries reported in Leisure World are German (1,001 | 11.2%), Irish (970 | 10.8%), English (659 | 7.3%), South American (502 | 5.6%), and Burmese (483 | 5.4%), together accounting for 40.3% of all Leisure World residents.
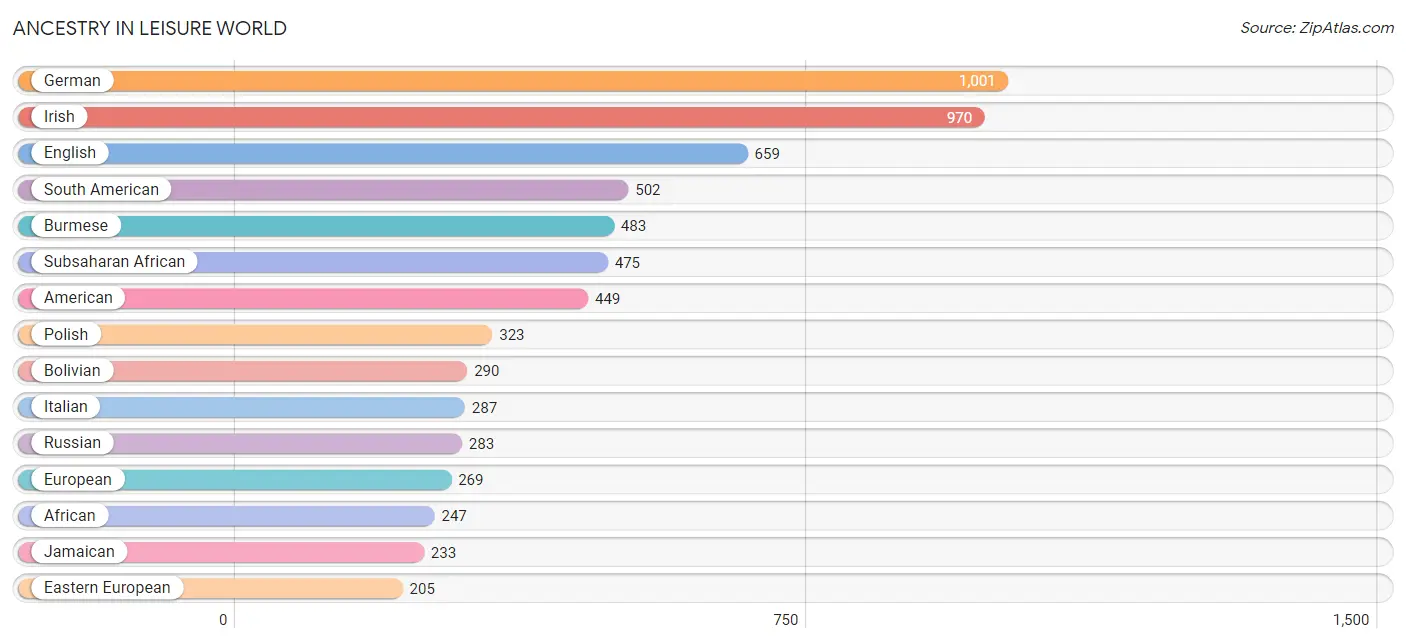
| Ancestry | # Population | % Population |
| African | 247 | 2.8% |
| American | 449 | 5.0% |
| Arab | 28 | 0.3% |
| Armenian | 29 | 0.3% |
| Austrian | 34 | 0.4% |
| Bhutanese | 13 | 0.1% |
| Blackfeet | 21 | 0.2% |
| Bolivian | 290 | 3.2% |
| British | 56 | 0.6% |
| Burmese | 483 | 5.4% |
| Canadian | 8 | 0.1% |
| Central American | 38 | 0.4% |
| Cherokee | 18 | 0.2% |
| Colombian | 34 | 0.4% |
| Czech | 44 | 0.5% |
| Danish | 93 | 1.0% |
| Dominican | 62 | 0.7% |
| Dutch | 47 | 0.5% |
| Eastern European | 205 | 2.3% |
| English | 659 | 7.3% |
| Ethiopian | 70 | 0.8% |
| European | 269 | 3.0% |
| Filipino | 33 | 0.4% |
| French | 98 | 1.1% |
| French Canadian | 18 | 0.2% |
| German | 1,001 | 11.2% |
| Ghanaian | 44 | 0.5% |
| Greek | 170 | 1.9% |
| Guyanese | 15 | 0.2% |
| Haitian | 28 | 0.3% |
| Hungarian | 132 | 1.5% |
| Indian (Asian) | 192 | 2.1% |
| Irish | 970 | 10.8% |
| Italian | 287 | 3.2% |
| Jamaican | 233 | 2.6% |
| Korean | 17 | 0.2% |
| Latvian | 14 | 0.2% |
| Lebanese | 14 | 0.2% |
| Lithuanian | 15 | 0.2% |
| Mexican | 42 | 0.5% |
| Northern European | 13 | 0.1% |
| Norwegian | 43 | 0.5% |
| Palestinian | 11 | 0.1% |
| Peruvian | 136 | 1.5% |
| Polish | 323 | 3.6% |
| Portuguese | 28 | 0.3% |
| Puerto Rican | 13 | 0.1% |
| Romanian | 28 | 0.3% |
| Russian | 283 | 3.2% |
| Salvadoran | 38 | 0.4% |
| Scandinavian | 22 | 0.3% |
| Scotch-Irish | 49 | 0.5% |
| Scottish | 118 | 1.3% |
| Senegalese | 116 | 1.3% |
| Slovak | 8 | 0.1% |
| South American | 502 | 5.6% |
| Soviet Union | 36 | 0.4% |
| Spaniard | 13 | 0.1% |
| Sri Lankan | 2 | 0.0% |
| Subsaharan African | 475 | 5.3% |
| Swedish | 25 | 0.3% |
| Swiss | 13 | 0.1% |
| Thai | 67 | 0.7% |
| Trinidadian and Tobagonian | 18 | 0.2% |
| Ukrainian | 99 | 1.1% |
| Uruguayan | 42 | 0.5% |
| Welsh | 25 | 0.3% |
| West Indian | 10 | 0.1% | View All 68 Rows |
Immigrants in Leisure World
The most numerous immigrant groups reported in Leisure World came from Asia (850 | 9.5%), Eastern Asia (694 | 7.7%), Latin America (671 | 7.5%), Korea (466 | 5.2%), and Europe (427 | 4.8%), together accounting for 34.6% of all Leisure World residents.
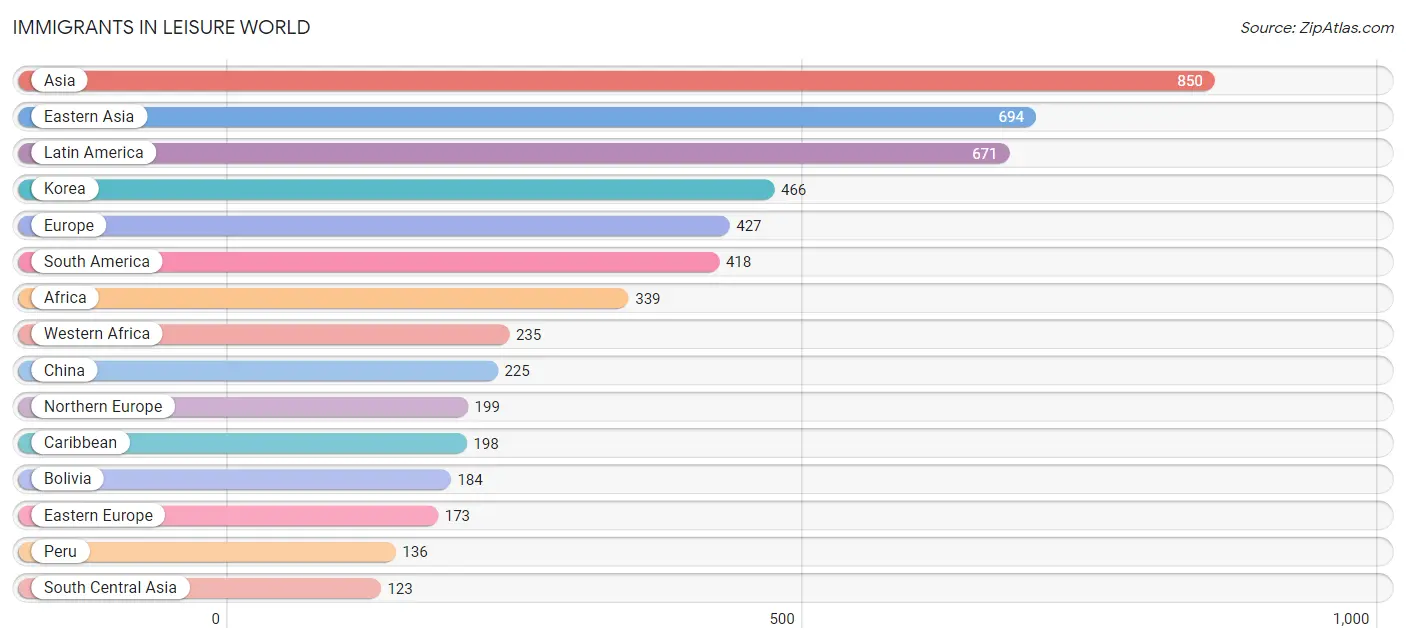
| Immigration Origin | # Population | % Population |
| Africa | 339 | 3.8% |
| Asia | 850 | 9.5% |
| Bolivia | 184 | 2.1% |
| Brazil | 12 | 0.1% |
| Canada | 33 | 0.4% |
| Caribbean | 198 | 2.2% |
| Central America | 55 | 0.6% |
| China | 225 | 2.5% |
| Colombia | 34 | 0.4% |
| Denmark | 55 | 0.6% |
| Dominican Republic | 46 | 0.5% |
| Eastern Africa | 37 | 0.4% |
| Eastern Asia | 694 | 7.7% |
| Eastern Europe | 173 | 1.9% |
| Egypt | 33 | 0.4% |
| El Salvador | 55 | 0.6% |
| England | 18 | 0.2% |
| Ethiopia | 37 | 0.4% |
| Europe | 427 | 4.8% |
| France | 16 | 0.2% |
| Ghana | 95 | 1.1% |
| Greece | 10 | 0.1% |
| Guyana | 10 | 0.1% |
| Haiti | 28 | 0.3% |
| India | 67 | 0.7% |
| Iran | 30 | 0.3% |
| Ireland | 17 | 0.2% |
| Jamaica | 100 | 1.1% |
| Japan | 3 | 0.0% |
| Jordan | 11 | 0.1% |
| Korea | 466 | 5.2% |
| Latin America | 671 | 7.5% |
| Netherlands | 17 | 0.2% |
| Nigeria | 25 | 0.3% |
| Northern Africa | 33 | 0.4% |
| Northern Europe | 199 | 2.2% |
| Peru | 136 | 1.5% |
| Poland | 27 | 0.3% |
| Portugal | 12 | 0.1% |
| Senegal | 45 | 0.5% |
| Sierra Leone | 70 | 0.8% |
| South America | 418 | 4.7% |
| South Central Asia | 123 | 1.4% |
| South Eastern Asia | 19 | 0.2% |
| Southern Europe | 22 | 0.3% |
| Sri Lanka | 26 | 0.3% |
| Taiwan | 114 | 1.3% |
| Trinidad and Tobago | 10 | 0.1% |
| Ukraine | 93 | 1.0% |
| Uruguay | 42 | 0.5% |
| Vietnam | 19 | 0.2% |
| Western Africa | 235 | 2.6% |
| Western Asia | 11 | 0.1% |
| Western Europe | 33 | 0.4% | View All 54 Rows |
Sex and Age in Leisure World
Sex and Age in Leisure World
The most populous age groups in Leisure World are 85 Years and over (785 | 22.5%) for men and 85 Years and over (1,160 | 21.1%) for women.
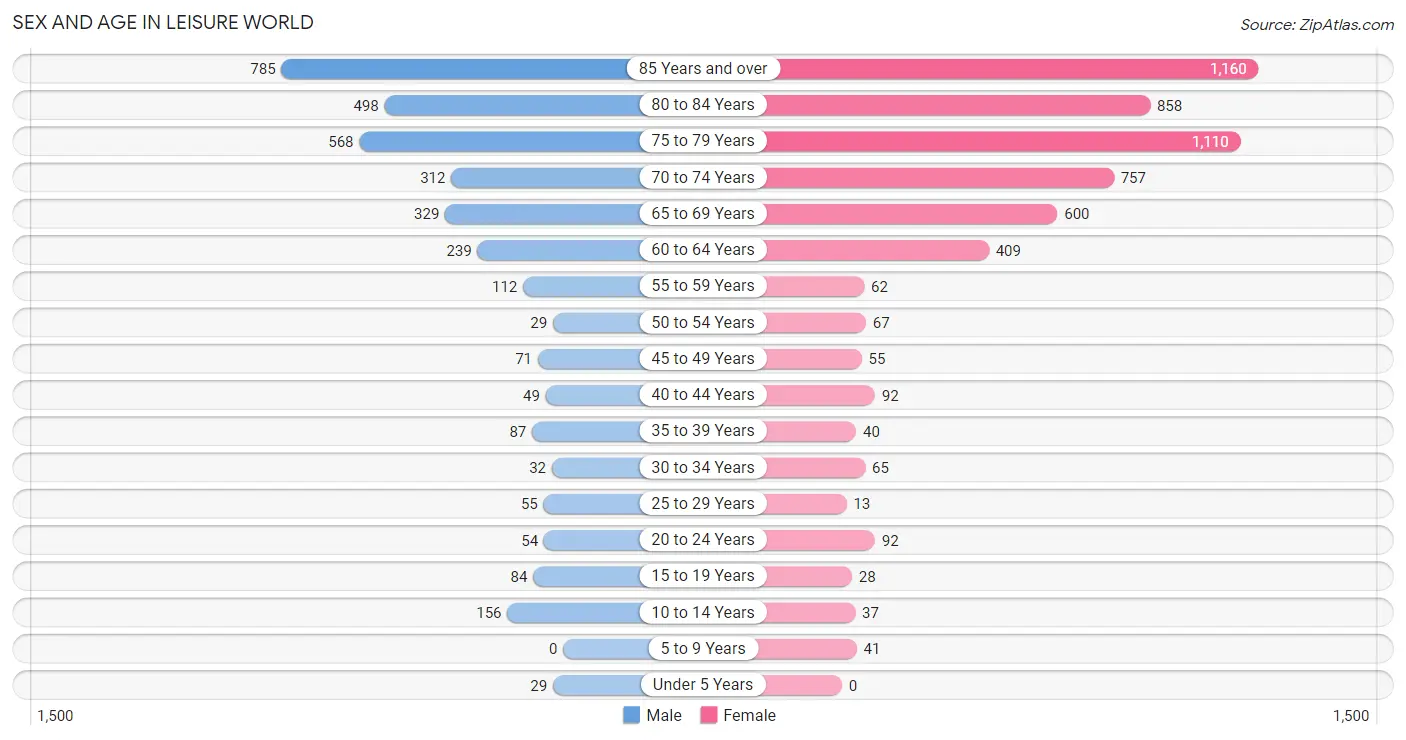
| Age Bracket | Male | Female |
| Under 5 Years | 29 (0.8%) | 0 (0.0%) |
| 5 to 9 Years | 0 (0.0%) | 41 (0.7%) |
| 10 to 14 Years | 156 (4.5%) | 37 (0.7%) |
| 15 to 19 Years | 84 (2.4%) | 28 (0.5%) |
| 20 to 24 Years | 54 (1.5%) | 92 (1.7%) |
| 25 to 29 Years | 55 (1.6%) | 13 (0.2%) |
| 30 to 34 Years | 32 (0.9%) | 65 (1.2%) |
| 35 to 39 Years | 87 (2.5%) | 40 (0.7%) |
| 40 to 44 Years | 49 (1.4%) | 92 (1.7%) |
| 45 to 49 Years | 71 (2.0%) | 55 (1.0%) |
| 50 to 54 Years | 29 (0.8%) | 67 (1.2%) |
| 55 to 59 Years | 112 (3.2%) | 62 (1.1%) |
| 60 to 64 Years | 239 (6.9%) | 409 (7.5%) |
| 65 to 69 Years | 329 (9.4%) | 600 (10.9%) |
| 70 to 74 Years | 312 (8.9%) | 757 (13.8%) |
| 75 to 79 Years | 568 (16.3%) | 1,110 (20.2%) |
| 80 to 84 Years | 498 (14.3%) | 858 (15.6%) |
| 85 Years and over | 785 (22.5%) | 1,160 (21.1%) |
| Total | 3,489 (100.0%) | 5,486 (100.0%) |
Families and Households in Leisure World
Median Family Size in Leisure World
The median family size in Leisure World is 2.25 persons per family, with single female/mother families (233 | 10.9%) accounting for the largest median family size of 2.93 persons per family. On the other hand, single male/father families (172 | 8.1%) represent the smallest median family size with 2.13 persons per family.
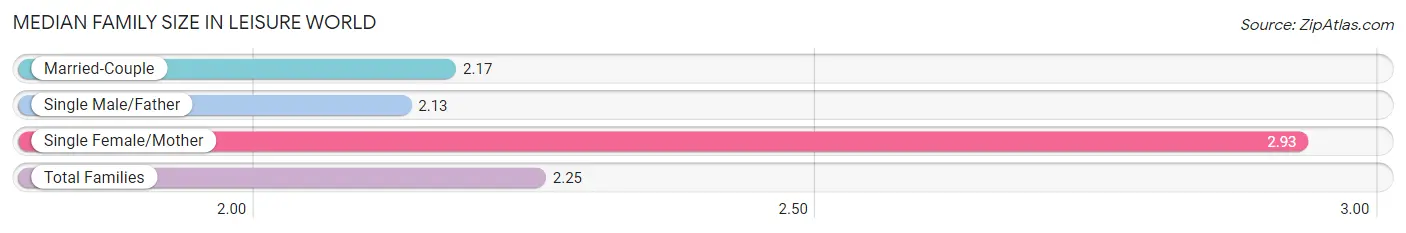
| Family Type | # Families | Family Size |
| Married-Couple | 1,731 (81.0%) | 2.17 |
| Single Male/Father | 172 (8.1%) | 2.13 |
| Single Female/Mother | 233 (10.9%) | 2.93 |
| Total Families | 2,136 (100.0%) | 2.25 |
Median Household Size in Leisure World
The median household size in Leisure World is 1.48 persons per household, with single female/mother households (233 | 3.9%) accounting for the largest median household size of 3.18 persons per household. non-family households (3,898 | 64.6%) represent the smallest median household size with 1.04 persons per household.
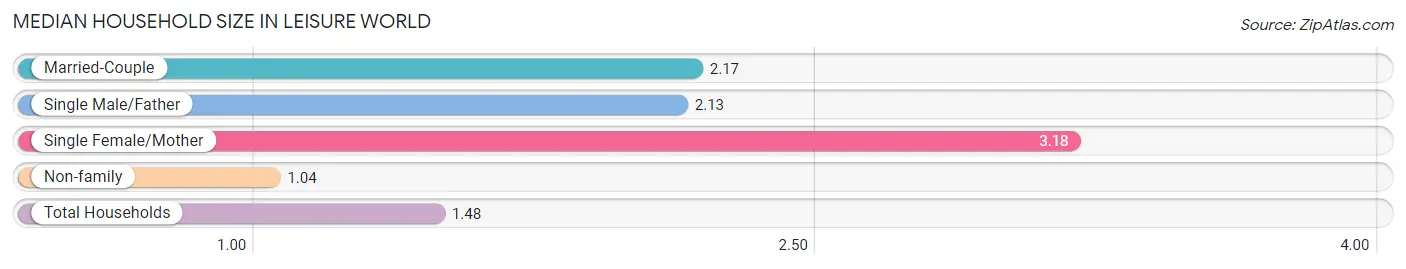
| Household Type | # Households | Household Size |
| Married-Couple | 1,731 (28.7%) | 2.17 |
| Single Male/Father | 172 (2.9%) | 2.13 |
| Single Female/Mother | 233 (3.9%) | 3.18 |
| Non-family | 3,898 (64.6%) | 1.04 |
| Total Households | 6,034 (100.0%) | 1.48 |
Household Size by Marriage Status in Leisure World
Out of a total of 6,034 households in Leisure World, 2,136 (35.4%) are family households, while 3,898 (64.6%) are nonfamily households. The most numerous type of family households are 2-person households, comprising 1,861, and the most common type of nonfamily households are 1-person households, comprising 3,750.
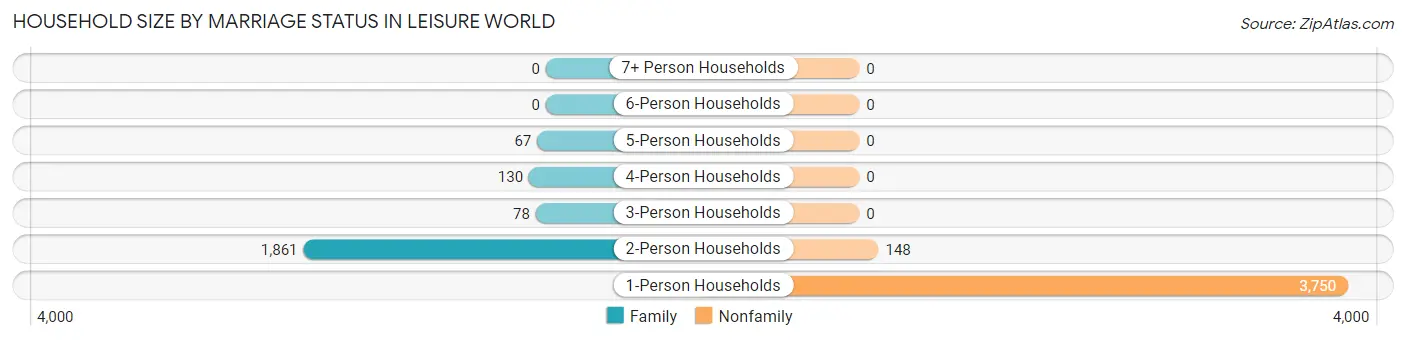
| Household Size | Family Households | Nonfamily Households |
| 1-Person Households | - | 3,750 (62.2%) |
| 2-Person Households | 1,861 (30.8%) | 148 (2.5%) |
| 3-Person Households | 78 (1.3%) | 0 (0.0%) |
| 4-Person Households | 130 (2.1%) | 0 (0.0%) |
| 5-Person Households | 67 (1.1%) | 0 (0.0%) |
| 6-Person Households | 0 (0.0%) | 0 (0.0%) |
| 7+ Person Households | 0 (0.0%) | 0 (0.0%) |
| Total | 2,136 (35.4%) | 3,898 (64.6%) |
Female Fertility in Leisure World
Fertility by Age in Leisure World
| Age Bracket | Women with Births | Births / 1,000 Women |
| 15 to 19 years | 0 (0.0%) | 0.0 |
| 20 to 34 years | 0 (0.0%) | 0.0 |
| 35 to 50 years | 0 (0.0%) | 0.0 |
| Total | 0 (0.0%) | 0.0 |
Fertility by Age by Marriage Status in Leisure World
| Age Bracket | Married | Unmarried |
| 15 to 19 years | 0 (0.0%) | 0 (0.0%) |
| 20 to 34 years | 0 (0.0%) | 0 (0.0%) |
| 35 to 50 years | 0 (0.0%) | 0 (0.0%) |
| Total | 0 (0.0%) | 0 (0.0%) |
Fertility by Education in Leisure World
| Educational Attainment | Women with Births | Births / 1,000 Women |
| Less than High School | 0 (0.0%) | 0.0 |
| High School Diploma | 0 (0.0%) | 0.0 |
| College or Associate's Degree | 0 (0.0%) | 0.0 |
| Bachelor's Degree | 0 (0.0%) | 0.0 |
| Graduate Degree | 0 (0.0%) | 0.0 |
| Total | 0 (0.0%) | 0.0 |
Fertility by Education by Marriage Status in Leisure World
| Educational Attainment | Married | Unmarried |
| Less than High School | 0 (0.0%) | 0 (0.0%) |
| High School Diploma | 0 (0.0%) | 0 (0.0%) |
| College or Associate's Degree | 0 (0.0%) | 0 (0.0%) |
| Bachelor's Degree | 0 (0.0%) | 0 (0.0%) |
| Graduate Degree | 0 (0.0%) | 0 (0.0%) |
| Total | 0 (0.0%) | 0 (0.0%) |
Employment Characteristics in Leisure World
Employment by Class of Employer in Leisure World
Among the 1,603 employed individuals in Leisure World, private company employees (927 | 57.8%), self-employed (not incorporated) (258 | 16.1%), and federal government employees (143 | 8.9%) make up the most common classes of employment.
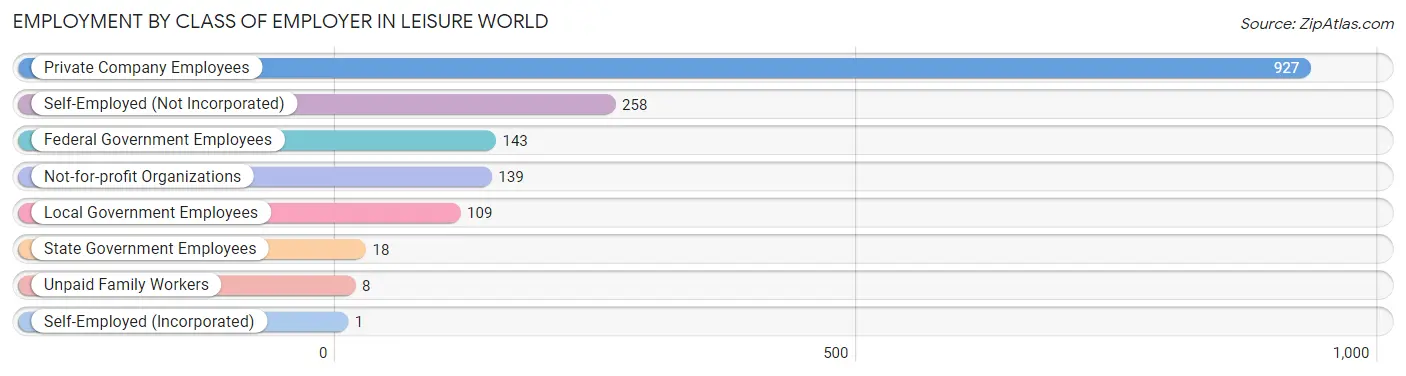
| Employer Class | # Employees | % Employees |
| Private Company Employees | 927 | 57.8% |
| Self-Employed (Incorporated) | 1 | 0.1% |
| Self-Employed (Not Incorporated) | 258 | 16.1% |
| Not-for-profit Organizations | 139 | 8.7% |
| Local Government Employees | 109 | 6.8% |
| State Government Employees | 18 | 1.1% |
| Federal Government Employees | 143 | 8.9% |
| Unpaid Family Workers | 8 | 0.5% |
| Total | 1,603 | 100.0% |
Employment Status by Age in Leisure World
According to the labor force statistics for Leisure World, out of the total population over 16 years of age (8,696), 23.3% or 2,026 individuals are in the labor force, with 14.6% or 296 of them unemployed. The age group with the highest labor force participation rate is 20 to 24 years, with 100.0% or 146 individuals in the labor force. Within the labor force, the 16 to 19 years age range has the highest percentage of unemployed individuals, with 100.0% or 43 of them being unemployed.
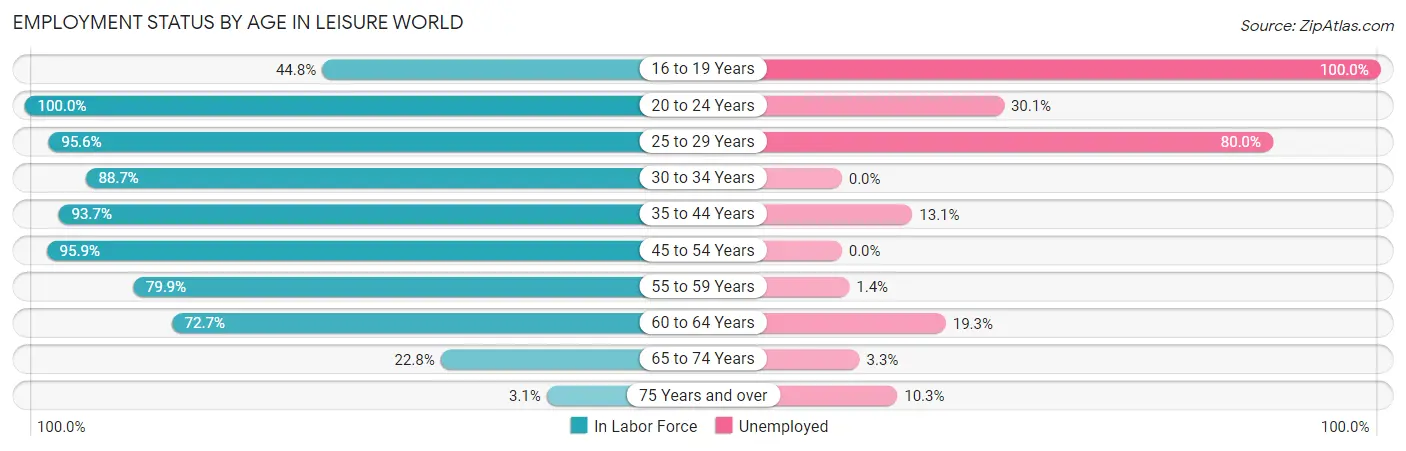
| Age Bracket | In Labor Force | Unemployed |
| 16 to 19 Years | 43 (44.8%) | 43 (100.0%) |
| 20 to 24 Years | 146 (100.0%) | 44 (30.1%) |
| 25 to 29 Years | 65 (95.6%) | 52 (80.0%) |
| 30 to 34 Years | 86 (88.7%) | 0 (0.0%) |
| 35 to 44 Years | 251 (93.7%) | 33 (13.1%) |
| 45 to 54 Years | 213 (95.9%) | 0 (0.0%) |
| 55 to 59 Years | 139 (79.9%) | 2 (1.4%) |
| 60 to 64 Years | 471 (72.7%) | 91 (19.3%) |
| 65 to 74 Years | 456 (22.8%) | 15 (3.3%) |
| 75 Years and over | 154 (3.1%) | 16 (10.3%) |
| Total | 2,026 (23.3%) | 296 (14.6%) |
Employment Status by Educational Attainment in Leisure World
According to labor force statistics for Leisure World, 82.9% of individuals (1,224) out of the total population between 25 and 64 years of age (1,477) are in the labor force, with 14.5% or 177 of them being unemployed. The group with the highest labor force participation rate are those with the educational attainment of less than high school, with 98.1% or 52 individuals in the labor force. Within the labor force, individuals with less than high school education have the highest percentage of unemployment, with 100.0% or 52 of them being unemployed.
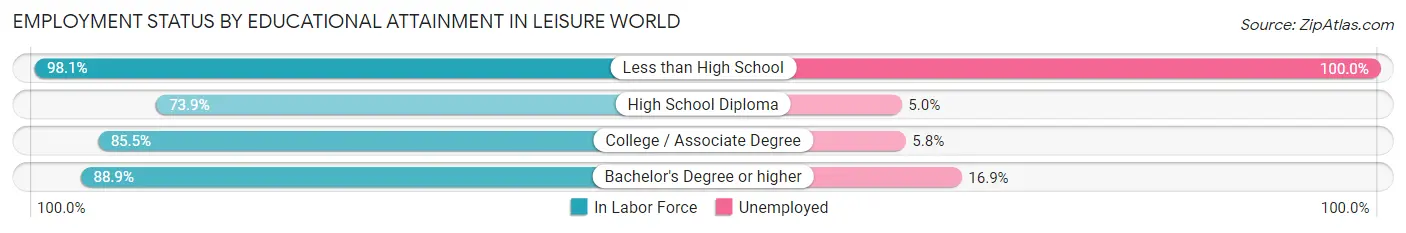
| Educational Attainment | In Labor Force | Unemployed |
| Less than High School | 52 (98.1%) | 53 (100.0%) |
| High School Diploma | 416 (73.9%) | 28 (5.0%) |
| College / Associate Degree | 206 (85.5%) | 14 (5.8%) |
| Bachelor's Degree or higher | 551 (88.9%) | 105 (16.9%) |
| Total | 1,224 (82.9%) | 214 (14.5%) |
Employment Occupations by Sex in Leisure World
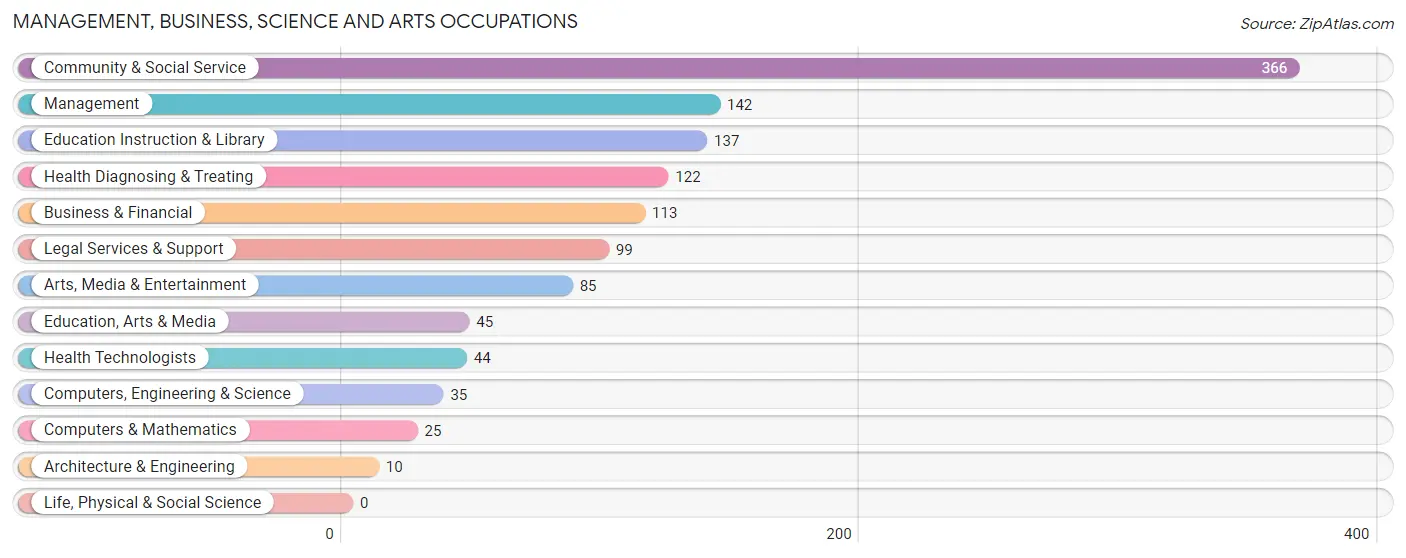
Management, Business, Science and Arts Occupations
The most common Management, Business, Science and Arts occupations in Leisure World are Community & Social Service (366 | 21.2%), Management (142 | 8.2%), Education Instruction & Library (137 | 7.9%), Health Diagnosing & Treating (122 | 7.1%), and Business & Financial (113 | 6.5%).
Management, Business, Science and Arts Occupations by Sex
Within the Management, Business, Science and Arts occupations in Leisure World, the most male-oriented occupations are Architecture & Engineering (100.0%), Management (76.8%), and Computers, Engineering & Science (60.0%), while the most female-oriented occupations are Education, Arts & Media (100.0%), Health Diagnosing & Treating (100.0%), and Health Technologists (100.0%).
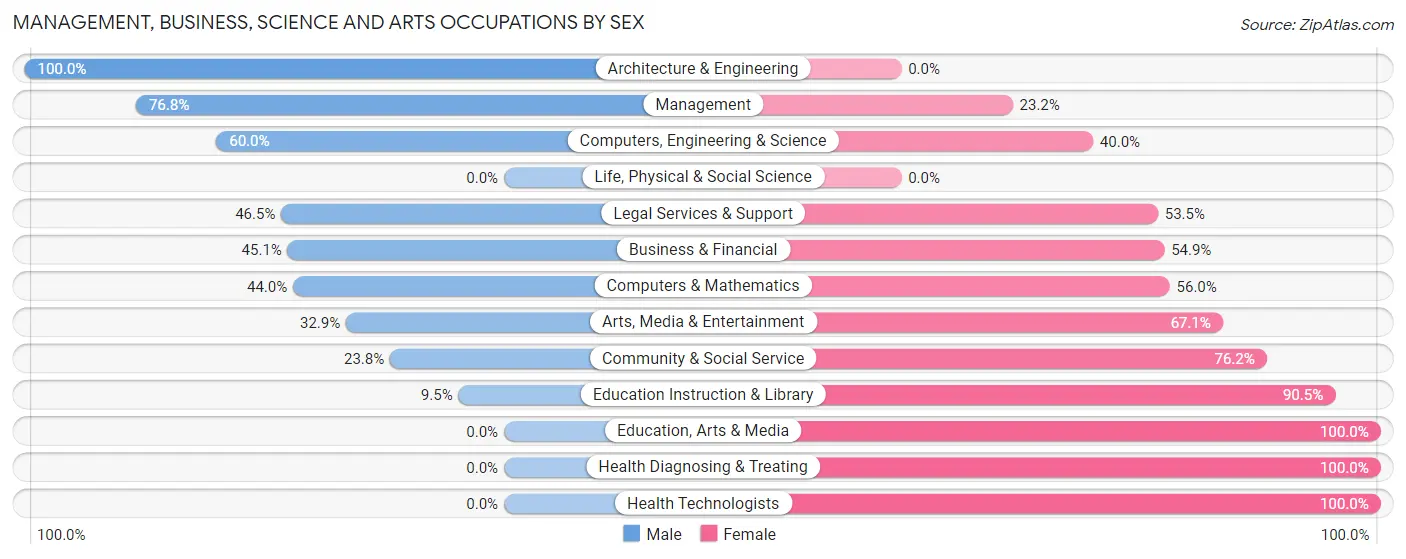
| Occupation | Male | Female |
| Management | 109 (76.8%) | 33 (23.2%) |
| Business & Financial | 51 (45.1%) | 62 (54.9%) |
| Computers, Engineering & Science | 21 (60.0%) | 14 (40.0%) |
| Computers & Mathematics | 11 (44.0%) | 14 (56.0%) |
| Architecture & Engineering | 10 (100.0%) | 0 (0.0%) |
| Life, Physical & Social Science | 0 (0.0%) | 0 (0.0%) |
| Community & Social Service | 87 (23.8%) | 279 (76.2%) |
| Education, Arts & Media | 0 (0.0%) | 45 (100.0%) |
| Legal Services & Support | 46 (46.5%) | 53 (53.5%) |
| Education Instruction & Library | 13 (9.5%) | 124 (90.5%) |
| Arts, Media & Entertainment | 28 (32.9%) | 57 (67.1%) |
| Health Diagnosing & Treating | 0 (0.0%) | 122 (100.0%) |
| Health Technologists | 0 (0.0%) | 44 (100.0%) |
| Total (Category) | 268 (34.4%) | 510 (65.5%) |
| Total (Overall) | 674 (39.0%) | 1,055 (61.0%) |
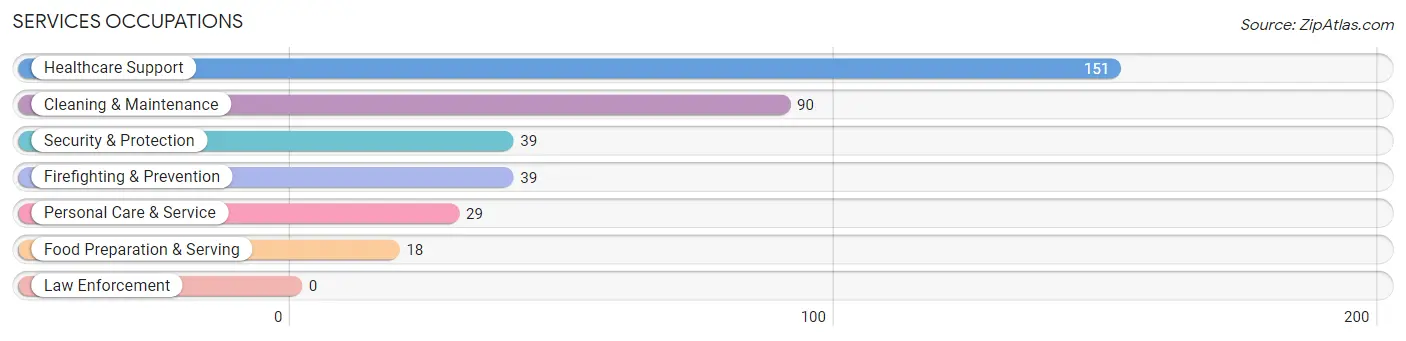
Services Occupations
The most common Services occupations in Leisure World are Healthcare Support (151 | 8.7%), Cleaning & Maintenance (90 | 5.2%), Security & Protection (39 | 2.3%), Firefighting & Prevention (39 | 2.3%), and Personal Care & Service (29 | 1.7%).
Services Occupations by Sex
Within the Services occupations in Leisure World, the most male-oriented occupations are Security & Protection (100.0%), Firefighting & Prevention (100.0%), and Cleaning & Maintenance (100.0%), while the most female-oriented occupations are Food Preparation & Serving (100.0%), Personal Care & Service (100.0%), and Healthcare Support (78.8%).
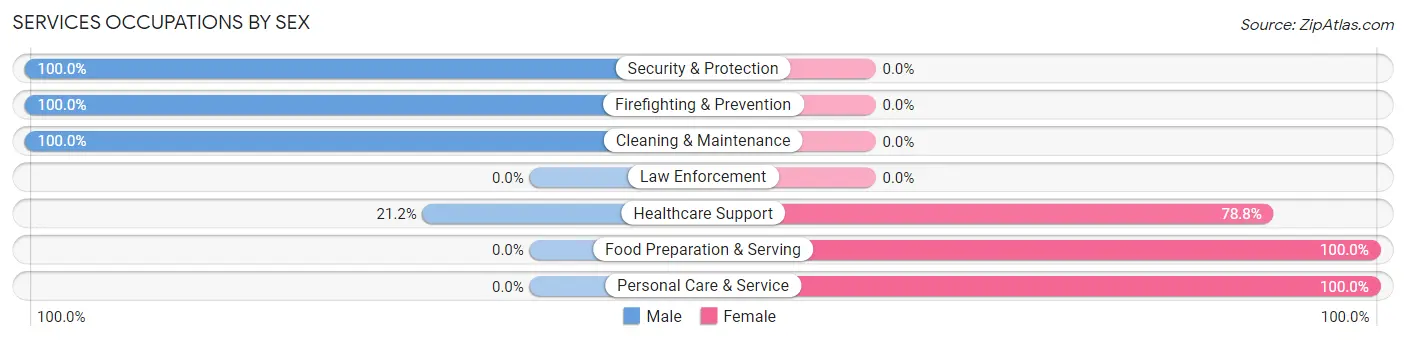
| Occupation | Male | Female |
| Healthcare Support | 32 (21.2%) | 119 (78.8%) |
| Security & Protection | 39 (100.0%) | 0 (0.0%) |
| Firefighting & Prevention | 39 (100.0%) | 0 (0.0%) |
| Law Enforcement | 0 (0.0%) | 0 (0.0%) |
| Food Preparation & Serving | 0 (0.0%) | 18 (100.0%) |
| Cleaning & Maintenance | 90 (100.0%) | 0 (0.0%) |
| Personal Care & Service | 0 (0.0%) | 29 (100.0%) |
| Total (Category) | 161 (49.2%) | 166 (50.8%) |
| Total (Overall) | 674 (39.0%) | 1,055 (61.0%) |
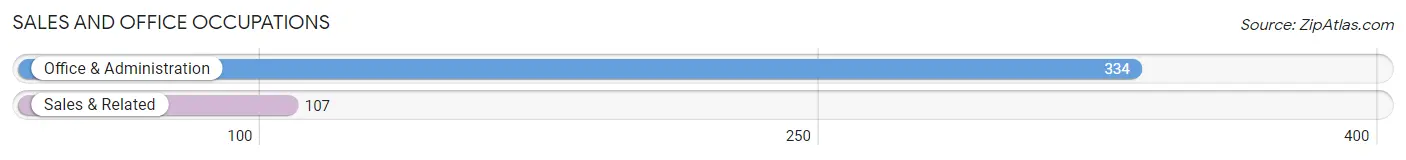
Sales and Office Occupations
The most common Sales and Office occupations in Leisure World are Office & Administration (334 | 19.3%), and Sales & Related (107 | 6.2%).
Sales and Office Occupations by Sex
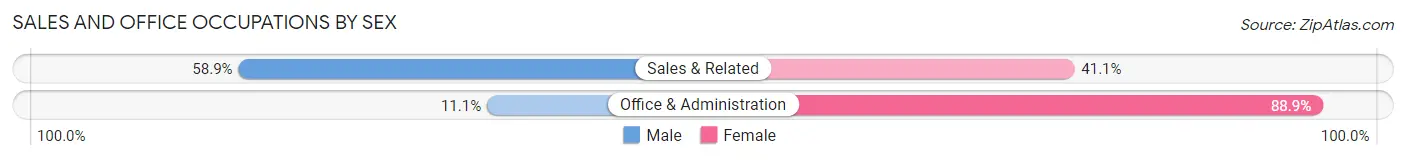
| Occupation | Male | Female |
| Sales & Related | 63 (58.9%) | 44 (41.1%) |
| Office & Administration | 37 (11.1%) | 297 (88.9%) |
| Total (Category) | 100 (22.7%) | 341 (77.3%) |
| Total (Overall) | 674 (39.0%) | 1,055 (61.0%) |
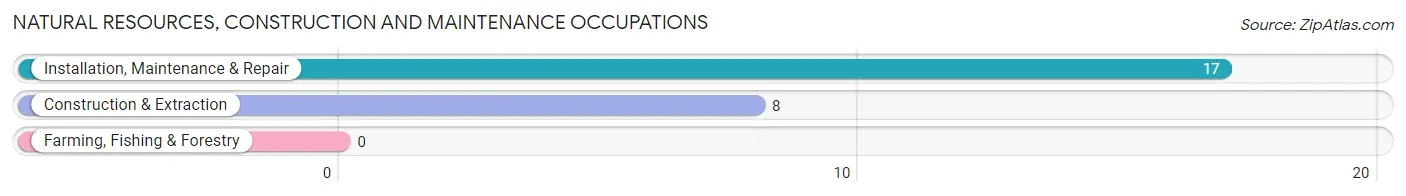
Natural Resources, Construction and Maintenance Occupations
The most common Natural Resources, Construction and Maintenance occupations in Leisure World are Installation, Maintenance & Repair (17 | 1.0%), and Construction & Extraction (8 | 0.5%).
Natural Resources, Construction and Maintenance Occupations by Sex
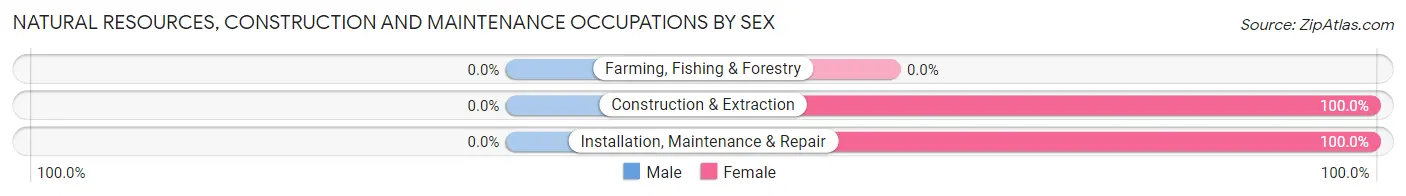
| Occupation | Male | Female |
| Farming, Fishing & Forestry | 0 (0.0%) | 0 (0.0%) |
| Construction & Extraction | 0 (0.0%) | 8 (100.0%) |
| Installation, Maintenance & Repair | 0 (0.0%) | 17 (100.0%) |
| Total (Category) | 0 (0.0%) | 25 (100.0%) |
| Total (Overall) | 674 (39.0%) | 1,055 (61.0%) |
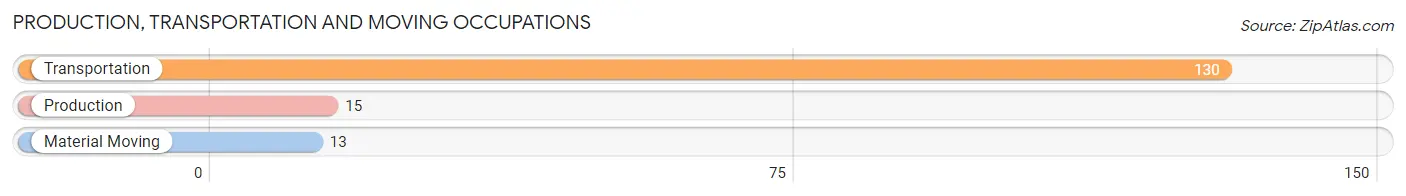
Production, Transportation and Moving Occupations
The most common Production, Transportation and Moving occupations in Leisure World are Transportation (130 | 7.5%), Production (15 | 0.9%), and Material Moving (13 | 0.7%).
Production, Transportation and Moving Occupations by Sex
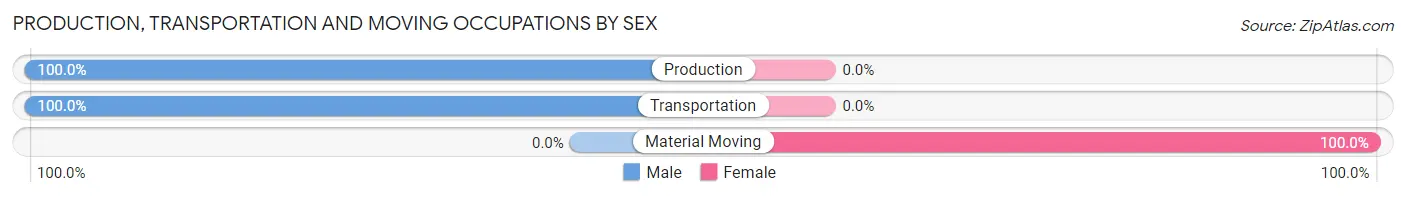
| Occupation | Male | Female |
| Production | 15 (100.0%) | 0 (0.0%) |
| Transportation | 130 (100.0%) | 0 (0.0%) |
| Material Moving | 0 (0.0%) | 13 (100.0%) |
| Total (Category) | 145 (91.8%) | 13 (8.2%) |
| Total (Overall) | 674 (39.0%) | 1,055 (61.0%) |
Employment Industries by Sex in Leisure World
Employment Industries in Leisure World
The major employment industries in Leisure World include Health Care & Social Assistance (326 | 18.9%), Retail Trade (293 | 17.0%), Professional & Scientific (265 | 15.3%), Public Administration (200 | 11.6%), and Educational Services (125 | 7.2%).
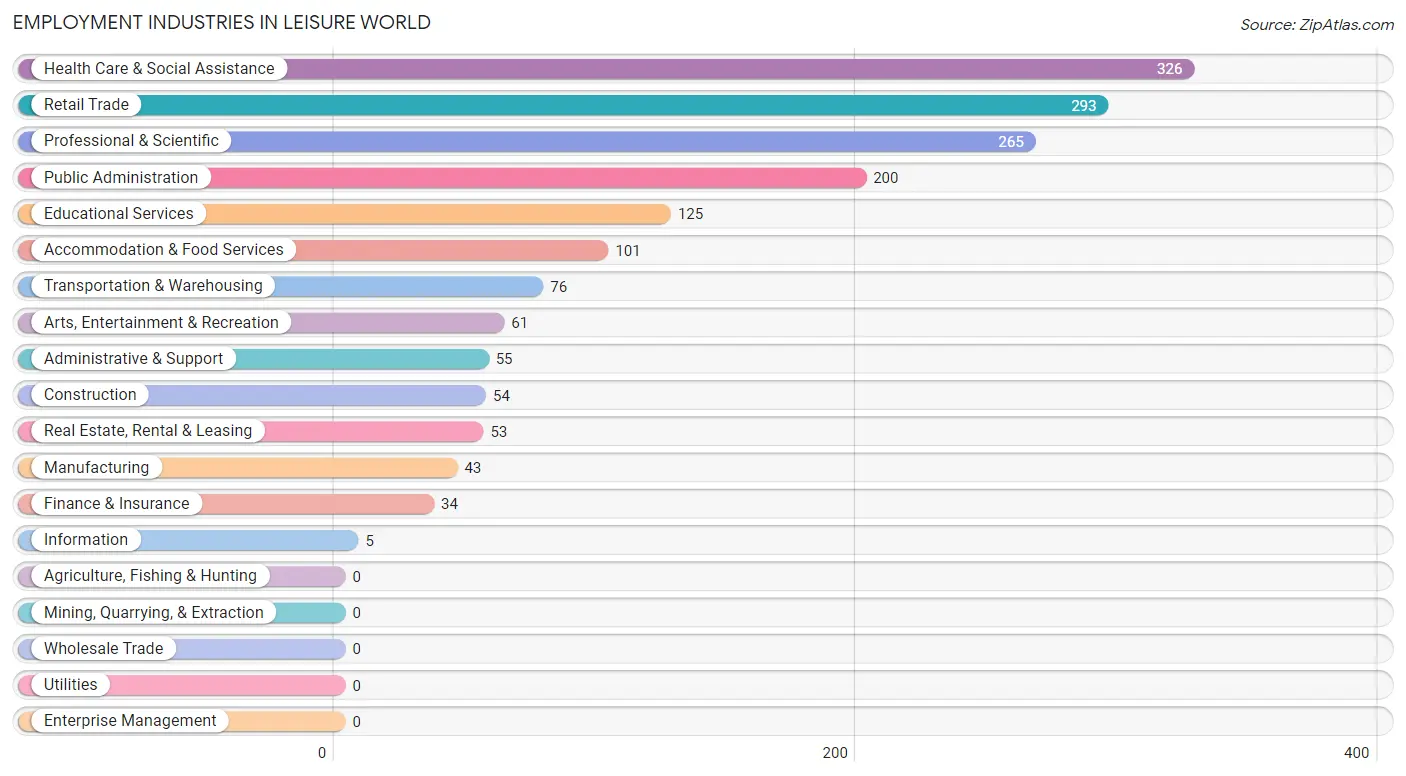
Employment Industries by Sex in Leisure World
The Leisure World industries that see more men than women are Manufacturing (100.0%), Transportation & Warehousing (100.0%), and Arts, Entertainment & Recreation (100.0%), whereas the industries that tend to have a higher number of women are Information (100.0%), Educational Services (100.0%), and Health Care & Social Assistance (89.9%).
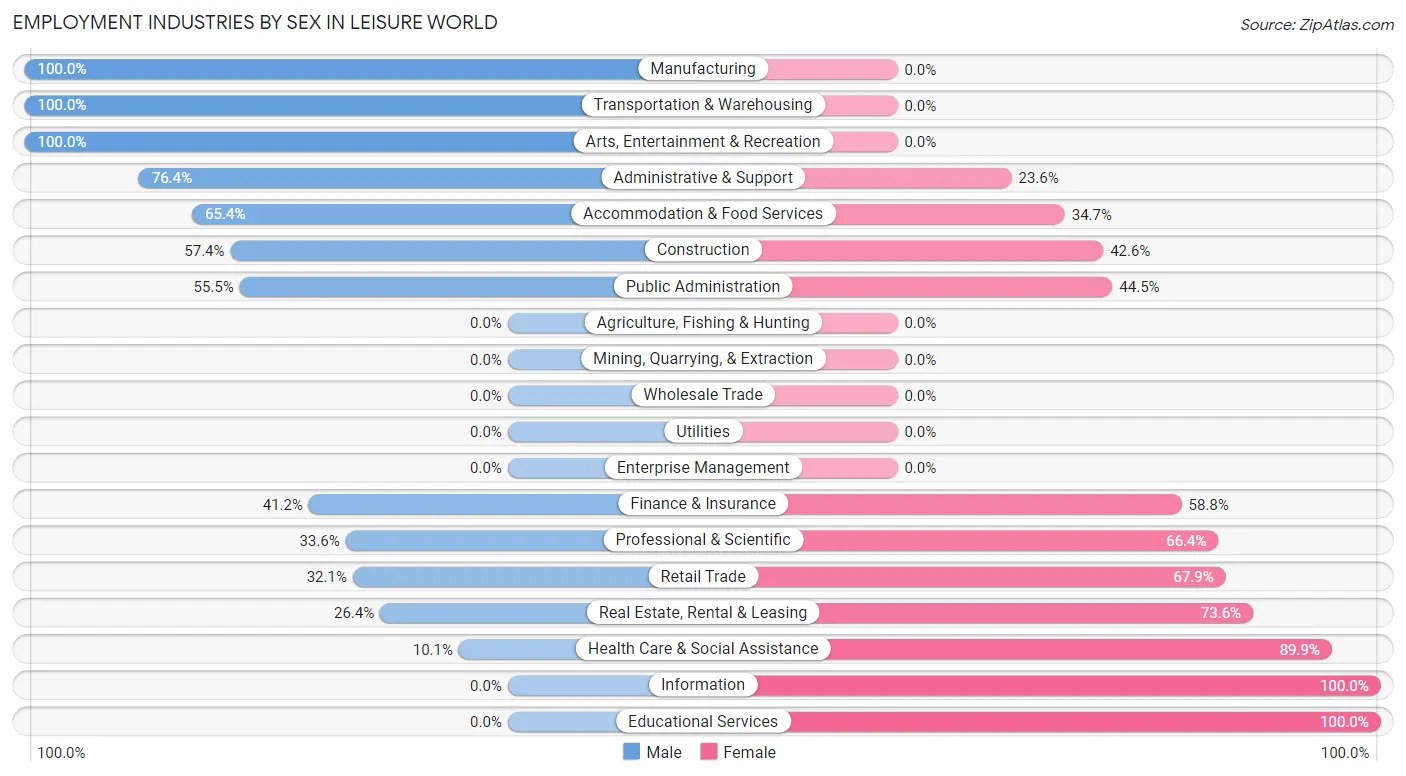
| Industry | Male | Female |
| Agriculture, Fishing & Hunting | 0 (0.0%) | 0 (0.0%) |
| Mining, Quarrying, & Extraction | 0 (0.0%) | 0 (0.0%) |
| Construction | 31 (57.4%) | 23 (42.6%) |
| Manufacturing | 43 (100.0%) | 0 (0.0%) |
| Wholesale Trade | 0 (0.0%) | 0 (0.0%) |
| Retail Trade | 94 (32.1%) | 199 (67.9%) |
| Transportation & Warehousing | 76 (100.0%) | 0 (0.0%) |
| Utilities | 0 (0.0%) | 0 (0.0%) |
| Information | 0 (0.0%) | 5 (100.0%) |
| Finance & Insurance | 14 (41.2%) | 20 (58.8%) |
| Real Estate, Rental & Leasing | 14 (26.4%) | 39 (73.6%) |
| Professional & Scientific | 89 (33.6%) | 176 (66.4%) |
| Enterprise Management | 0 (0.0%) | 0 (0.0%) |
| Administrative & Support | 42 (76.4%) | 13 (23.6%) |
| Educational Services | 0 (0.0%) | 125 (100.0%) |
| Health Care & Social Assistance | 33 (10.1%) | 293 (89.9%) |
| Arts, Entertainment & Recreation | 61 (100.0%) | 0 (0.0%) |
| Accommodation & Food Services | 66 (65.3%) | 35 (34.6%) |
| Public Administration | 111 (55.5%) | 89 (44.5%) |
| Total | 674 (39.0%) | 1,055 (61.0%) |
Education in Leisure World
School Enrollment in Leisure World
The most common levels of schooling among the 557 students in Leisure World are college / undergraduate (211 | 37.9%), middle school (193 | 34.6%), and high school (112 | 20.1%).
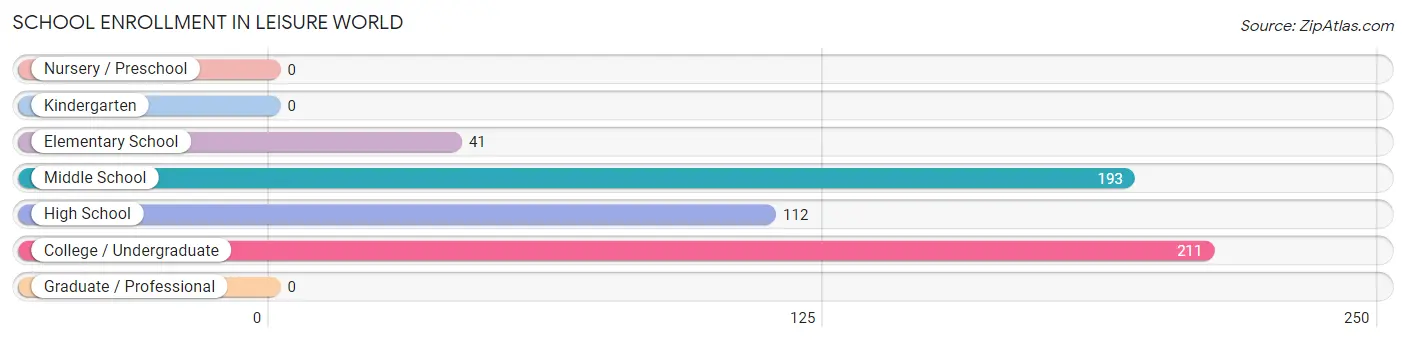
| School Level | # Students | % Students |
| Nursery / Preschool | 0 | 0.0% |
| Kindergarten | 0 | 0.0% |
| Elementary School | 41 | 7.4% |
| Middle School | 193 | 34.6% |
| High School | 112 | 20.1% |
| College / Undergraduate | 211 | 37.9% |
| Graduate / Professional | 0 | 0.0% |
| Total | 557 | 100.0% |
School Enrollment by Age by Funding Source in Leisure World
Out of a total of 557 students who are enrolled in schools in Leisure World, 41 (7.4%) attend a private institution, while the remaining 516 (92.6%) are enrolled in public schools. The age group of 25 to 34 year olds has the highest likelihood of being enrolled in private schools, with 28 (53.8% in the age bracket) enrolled. Conversely, the age group of 5 to 9 year old has the lowest likelihood of being enrolled in a private school, with 41 (100.0% in the age bracket) attending a public institution.
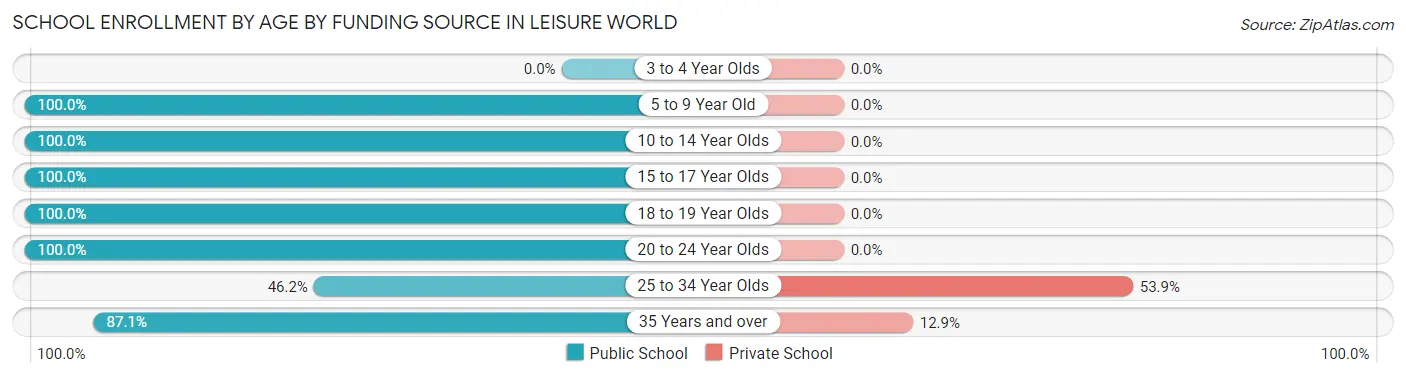
| Age Bracket | Public School | Private School |
| 3 to 4 Year Olds | 0 (0.0%) | 0 (0.0%) |
| 5 to 9 Year Old | 41 (100.0%) | 0 (0.0%) |
| 10 to 14 Year Olds | 193 (100.0%) | 0 (0.0%) |
| 15 to 17 Year Olds | 69 (100.0%) | 0 (0.0%) |
| 18 to 19 Year Olds | 43 (100.0%) | 0 (0.0%) |
| 20 to 24 Year Olds | 58 (100.0%) | 0 (0.0%) |
| 25 to 34 Year Olds | 24 (46.2%) | 28 (53.8%) |
| 35 Years and over | 88 (87.1%) | 13 (12.9%) |
| Total | 516 (92.6%) | 41 (7.4%) |
Educational Attainment by Field of Study in Leisure World
Education (787 | 16.2%), business (582 | 12.0%), social sciences (496 | 10.2%), literature & languages (455 | 9.4%), and engineering (397 | 8.2%) are the most common fields of study among 4,855 individuals in Leisure World who have obtained a bachelor's degree or higher.
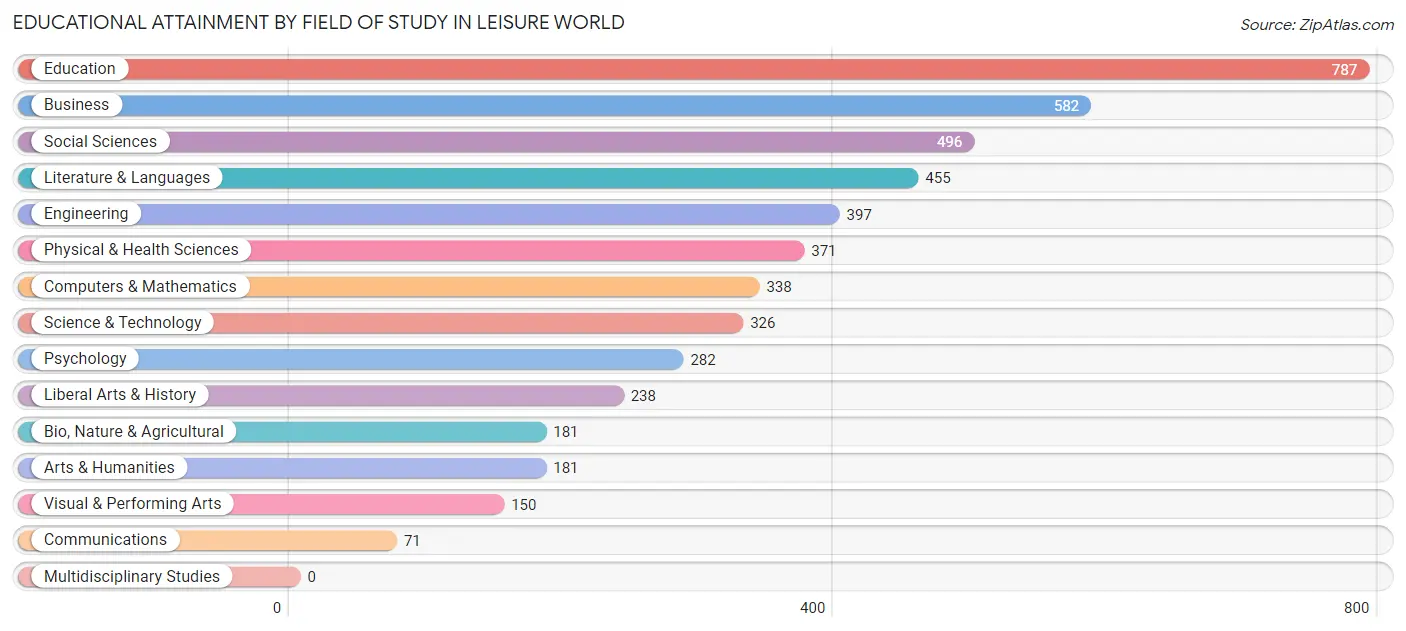
| Field of Study | # Graduates | % Graduates |
| Computers & Mathematics | 338 | 7.0% |
| Bio, Nature & Agricultural | 181 | 3.7% |
| Physical & Health Sciences | 371 | 7.6% |
| Psychology | 282 | 5.8% |
| Social Sciences | 496 | 10.2% |
| Engineering | 397 | 8.2% |
| Multidisciplinary Studies | 0 | 0.0% |
| Science & Technology | 326 | 6.7% |
| Business | 582 | 12.0% |
| Education | 787 | 16.2% |
| Literature & Languages | 455 | 9.4% |
| Liberal Arts & History | 238 | 4.9% |
| Visual & Performing Arts | 150 | 3.1% |
| Communications | 71 | 1.5% |
| Arts & Humanities | 181 | 3.7% |
| Total | 4,855 | 100.0% |
Transportation & Commute in Leisure World
Vehicle Availability by Sex in Leisure World
The most prevalent vehicle ownership categories in Leisure World are males with 1 vehicle (316, accounting for 48.0%) and females with 1 vehicle (545, making up 33.4%).
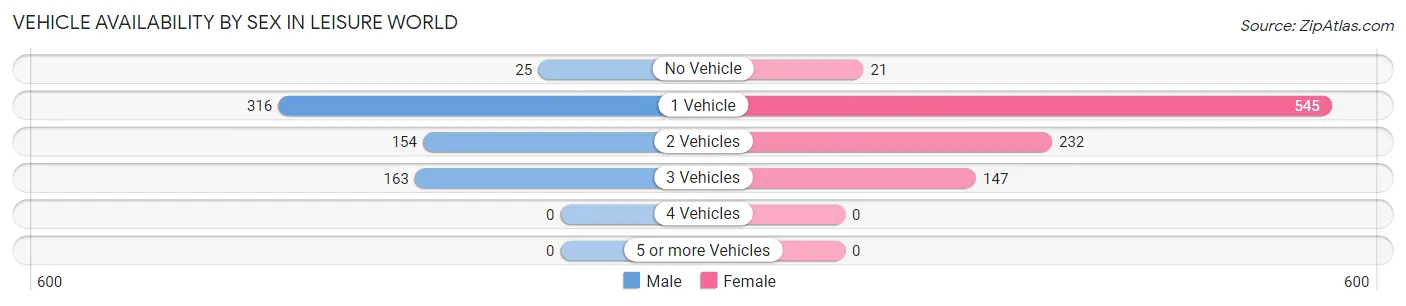
| Vehicles Available | Male | Female |
| No Vehicle | 25 (3.8%) | 21 (2.2%) |
| 1 Vehicle | 316 (48.0%) | 545 (57.7%) |
| 2 Vehicles | 154 (23.4%) | 232 (24.5%) |
| 3 Vehicles | 163 (24.8%) | 147 (15.6%) |
| 4 Vehicles | 0 (0.0%) | 0 (0.0%) |
| 5 or more Vehicles | 0 (0.0%) | 0 (0.0%) |
| Total | 658 (100.0%) | 945 (100.0%) |
Commute Time in Leisure World
The most frequently occuring commute durations in Leisure World are 20 to 24 minutes (229 commuters, 16.6%), 25 to 29 minutes (203 commuters, 14.7%), and 30 to 34 minutes (174 commuters, 12.6%).
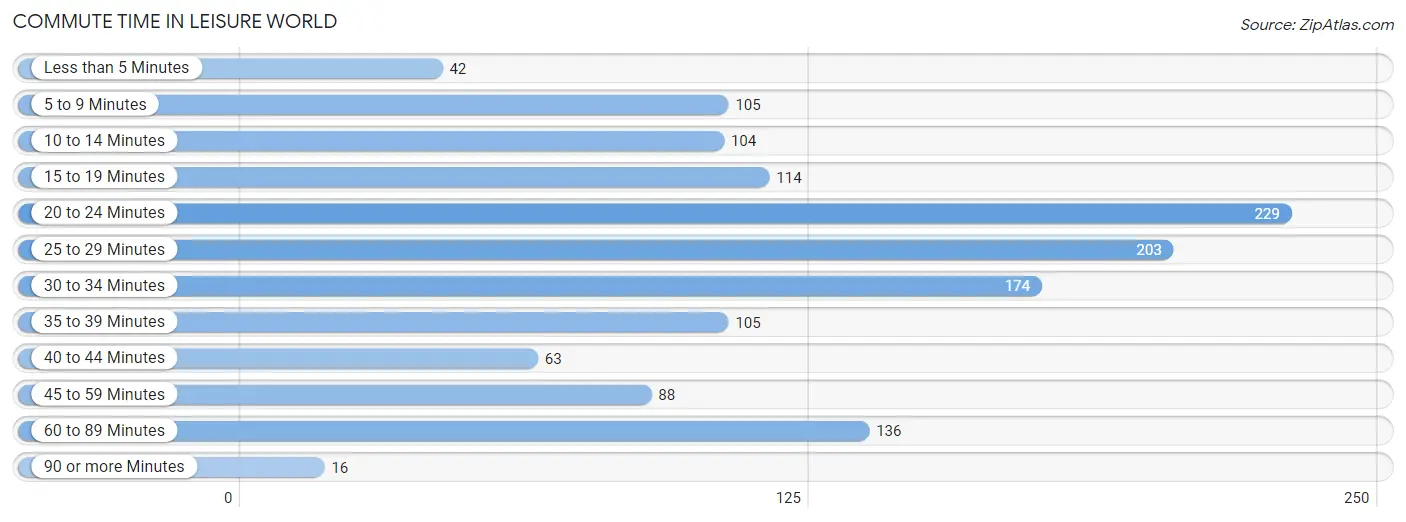
| Commute Time | # Commuters | % Commuters |
| Less than 5 Minutes | 42 | 3.0% |
| 5 to 9 Minutes | 105 | 7.6% |
| 10 to 14 Minutes | 104 | 7.5% |
| 15 to 19 Minutes | 114 | 8.3% |
| 20 to 24 Minutes | 229 | 16.6% |
| 25 to 29 Minutes | 203 | 14.7% |
| 30 to 34 Minutes | 174 | 12.6% |
| 35 to 39 Minutes | 105 | 7.6% |
| 40 to 44 Minutes | 63 | 4.6% |
| 45 to 59 Minutes | 88 | 6.4% |
| 60 to 89 Minutes | 136 | 9.9% |
| 90 or more Minutes | 16 | 1.2% |
Commute Time by Sex in Leisure World
The most common commute times in Leisure World are 25 to 29 minutes (171 commuters, 27.1%) for males and 20 to 24 minutes (207 commuters, 27.7%) for females.
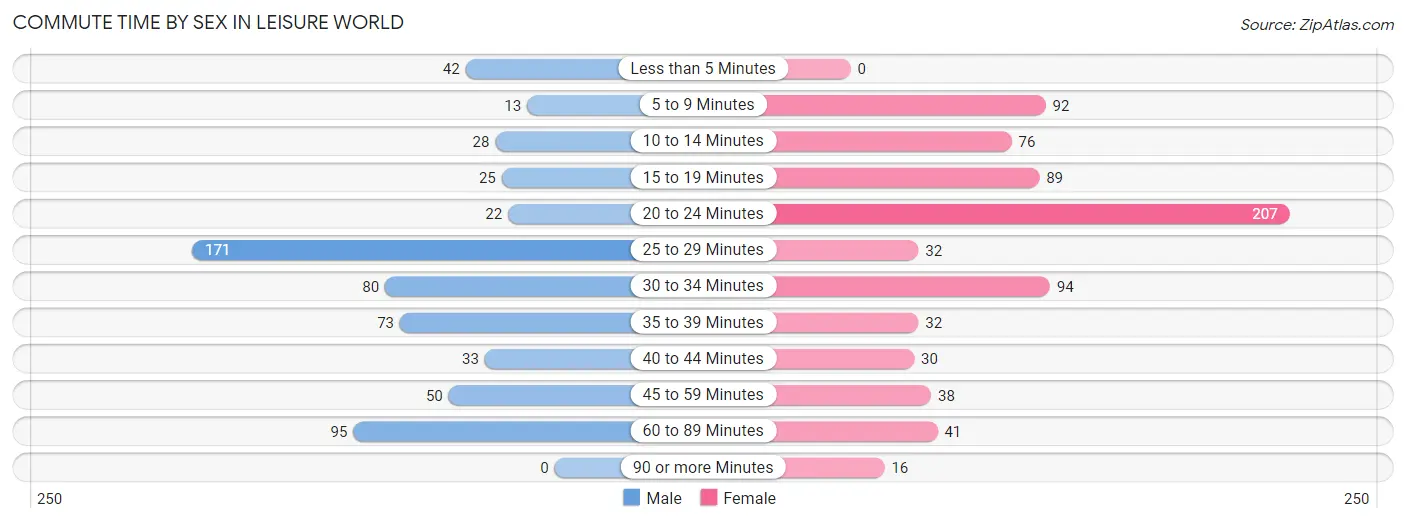
| Commute Time | Male | Female |
| Less than 5 Minutes | 42 (6.7%) | 0 (0.0%) |
| 5 to 9 Minutes | 13 (2.1%) | 92 (12.3%) |
| 10 to 14 Minutes | 28 (4.4%) | 76 (10.2%) |
| 15 to 19 Minutes | 25 (4.0%) | 89 (11.9%) |
| 20 to 24 Minutes | 22 (3.5%) | 207 (27.7%) |
| 25 to 29 Minutes | 171 (27.1%) | 32 (4.3%) |
| 30 to 34 Minutes | 80 (12.7%) | 94 (12.6%) |
| 35 to 39 Minutes | 73 (11.6%) | 32 (4.3%) |
| 40 to 44 Minutes | 33 (5.2%) | 30 (4.0%) |
| 45 to 59 Minutes | 50 (7.9%) | 38 (5.1%) |
| 60 to 89 Minutes | 95 (15.0%) | 41 (5.5%) |
| 90 or more Minutes | 0 (0.0%) | 16 (2.1%) |
Time of Departure to Work by Sex in Leisure World
The most frequent times of departure to work in Leisure World are 12:00 PM to 3:59 PM (123, 19.5%) for males and 10:00 AM to 10:59 AM (136, 18.2%) for females.
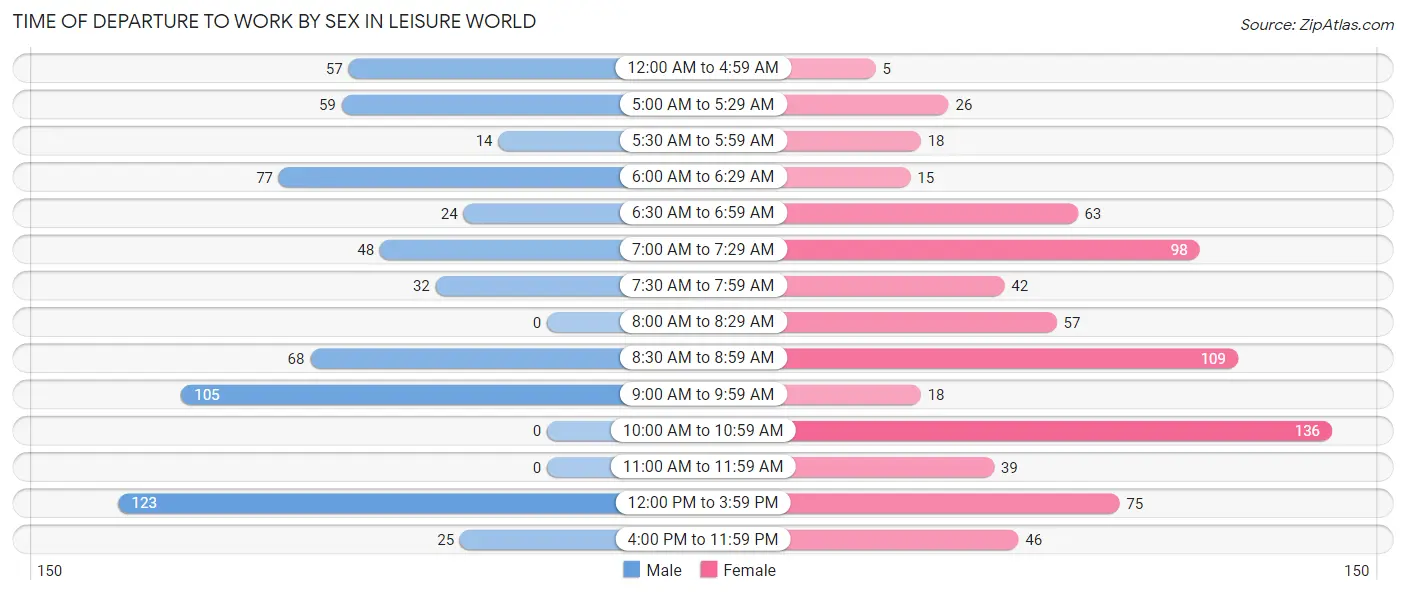
| Time of Departure | Male | Female |
| 12:00 AM to 4:59 AM | 57 (9.0%) | 5 (0.7%) |
| 5:00 AM to 5:29 AM | 59 (9.3%) | 26 (3.5%) |
| 5:30 AM to 5:59 AM | 14 (2.2%) | 18 (2.4%) |
| 6:00 AM to 6:29 AM | 77 (12.2%) | 15 (2.0%) |
| 6:30 AM to 6:59 AM | 24 (3.8%) | 63 (8.4%) |
| 7:00 AM to 7:29 AM | 48 (7.6%) | 98 (13.1%) |
| 7:30 AM to 7:59 AM | 32 (5.1%) | 42 (5.6%) |
| 8:00 AM to 8:29 AM | 0 (0.0%) | 57 (7.6%) |
| 8:30 AM to 8:59 AM | 68 (10.8%) | 109 (14.6%) |
| 9:00 AM to 9:59 AM | 105 (16.6%) | 18 (2.4%) |
| 10:00 AM to 10:59 AM | 0 (0.0%) | 136 (18.2%) |
| 11:00 AM to 11:59 AM | 0 (0.0%) | 39 (5.2%) |
| 12:00 PM to 3:59 PM | 123 (19.5%) | 75 (10.0%) |
| 4:00 PM to 11:59 PM | 25 (4.0%) | 46 (6.2%) |
| Total | 632 (100.0%) | 747 (100.0%) |
Housing Occupancy in Leisure World
Occupancy by Ownership in Leisure World
Of the total 6,034 dwellings in Leisure World, owner-occupied units account for 4,855 (80.5%), while renter-occupied units make up 1,179 (19.5%).
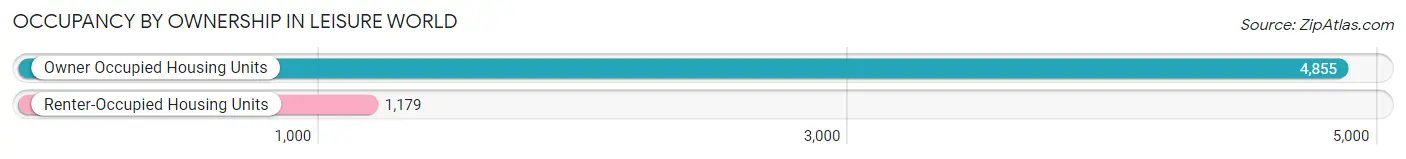
| Occupancy | # Housing Units | % Housing Units |
| Owner Occupied Housing Units | 4,855 | 80.5% |
| Renter-Occupied Housing Units | 1,179 | 19.5% |
| Total Occupied Housing Units | 6,034 | 100.0% |
Occupancy by Household Size in Leisure World
| Household Size | # Housing Units | % Housing Units |
| 1-Person Household | 3,750 | 62.2% |
| 2-Person Household | 2,009 | 33.3% |
| 3-Person Household | 78 | 1.3% |
| 4+ Person Household | 197 | 3.3% |
| Total Housing Units | 6,034 | 100.0% |
Occupancy by Ownership by Household Size in Leisure World
| Household Size | Owner-occupied | Renter-occupied |
| 1-Person Household | 2,943 (78.5%) | 807 (21.5%) |
| 2-Person Household | 1,673 (83.3%) | 336 (16.7%) |
| 3-Person Household | 70 (89.7%) | 8 (10.3%) |
| 4+ Person Household | 169 (85.8%) | 28 (14.2%) |
| Total Housing Units | 4,855 (80.5%) | 1,179 (19.5%) |
Occupancy by Educational Attainment in Leisure World
| Household Size | Owner-occupied | Renter-occupied |
| Less than High School | 71 (72.5%) | 27 (27.6%) |
| High School Diploma | 773 (62.0%) | 473 (38.0%) |
| College/Associate Degree | 1,283 (85.1%) | 224 (14.9%) |
| Bachelor's Degree or higher | 2,728 (85.7%) | 455 (14.3%) |
Occupancy by Age of Householder in Leisure World
| Age Bracket | # Households | % Households |
| Under 35 Years | 37 | 0.6% |
| 35 to 44 Years | 95 | 1.6% |
| 45 to 54 Years | 146 | 2.4% |
| 55 to 64 Years | 496 | 8.2% |
| 65 to 74 Years | 1,526 | 25.3% |
| 75 to 84 Years | 2,158 | 35.8% |
| 85 Years and Over | 1,576 | 26.1% |
| Total | 6,034 | 100.0% |
Housing Finances in Leisure World
Median Income by Occupancy in Leisure World
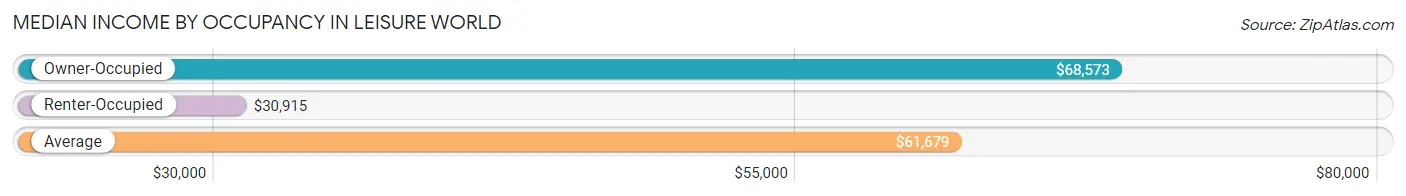
| Occupancy Type | # Households | Median Income |
| Owner-Occupied | 4,855 (80.5%) | $68,573 |
| Renter-Occupied | 1,179 (19.5%) | $30,915 |
| Average | 6,034 (100.0%) | $61,679 |
Occupancy by Householder Income Bracket in Leisure World
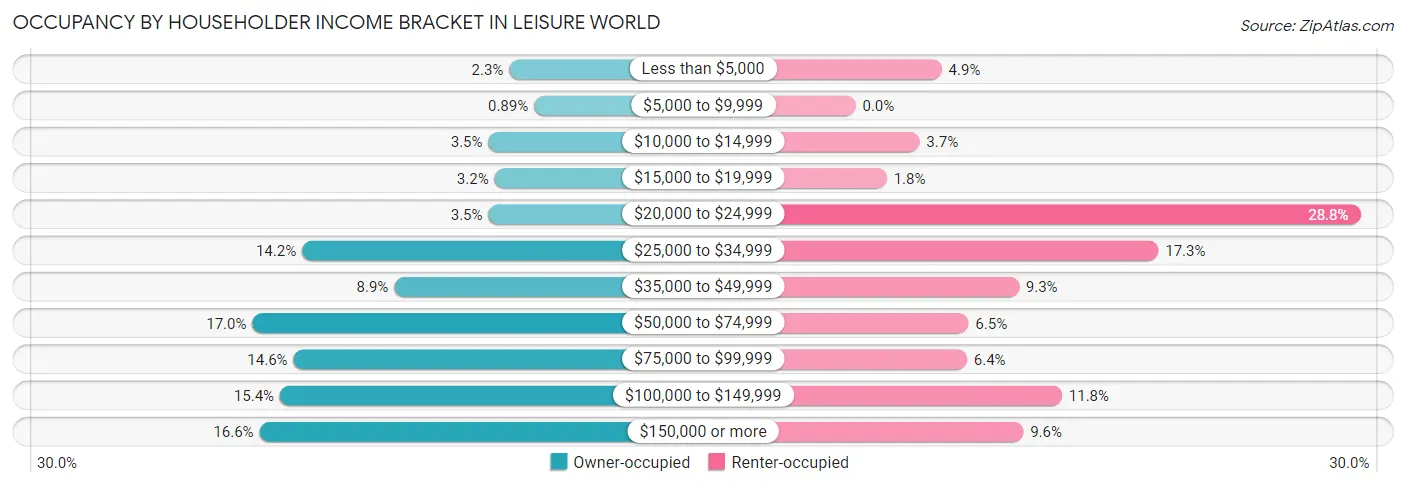
| Income Bracket | Owner-occupied | Renter-occupied |
| Less than $5,000 | 112 (2.3%) | 58 (4.9%) |
| $5,000 to $9,999 | 43 (0.9%) | 0 (0.0%) |
| $10,000 to $14,999 | 170 (3.5%) | 43 (3.6%) |
| $15,000 to $19,999 | 153 (3.2%) | 21 (1.8%) |
| $20,000 to $24,999 | 170 (3.5%) | 340 (28.8%) |
| $25,000 to $34,999 | 687 (14.1%) | 204 (17.3%) |
| $35,000 to $49,999 | 431 (8.9%) | 110 (9.3%) |
| $50,000 to $74,999 | 825 (17.0%) | 76 (6.5%) |
| $75,000 to $99,999 | 711 (14.6%) | 75 (6.4%) |
| $100,000 to $149,999 | 748 (15.4%) | 139 (11.8%) |
| $150,000 or more | 805 (16.6%) | 113 (9.6%) |
| Total | 4,855 (100.0%) | 1,179 (100.0%) |
Monthly Housing Cost Tiers in Leisure World
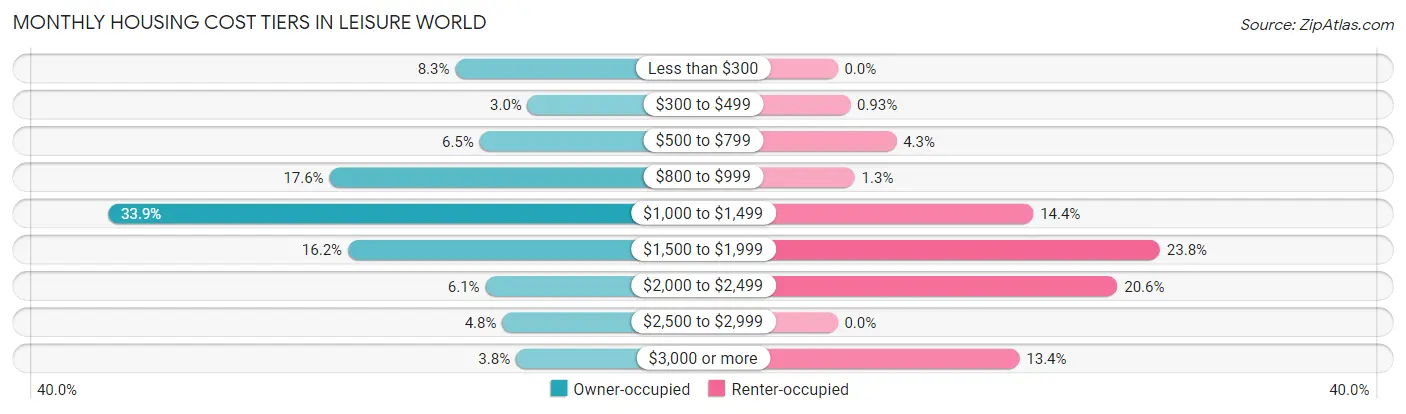
| Monthly Cost | Owner-occupied | Renter-occupied |
| Less than $300 | 402 (8.3%) | 0 (0.0%) |
| $300 to $499 | 143 (2.9%) | 11 (0.9%) |
| $500 to $799 | 315 (6.5%) | 51 (4.3%) |
| $800 to $999 | 852 (17.5%) | 15 (1.3%) |
| $1,000 to $1,499 | 1,644 (33.9%) | 170 (14.4%) |
| $1,500 to $1,999 | 786 (16.2%) | 280 (23.7%) |
| $2,000 to $2,499 | 294 (6.1%) | 243 (20.6%) |
| $2,500 to $2,999 | 234 (4.8%) | 0 (0.0%) |
| $3,000 or more | 185 (3.8%) | 158 (13.4%) |
| Total | 4,855 (100.0%) | 1,179 (100.0%) |
Physical Housing Characteristics in Leisure World
Housing Structures in Leisure World
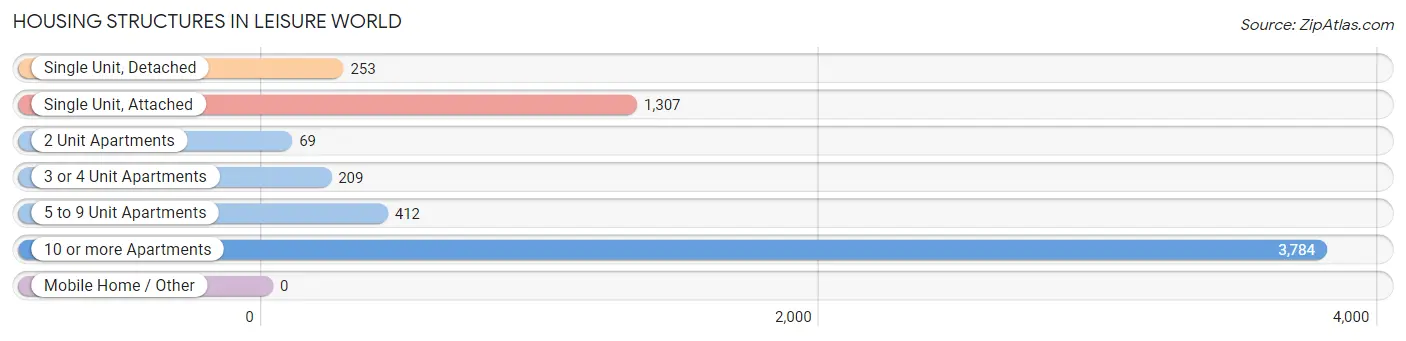
| Structure Type | # Housing Units | % Housing Units |
| Single Unit, Detached | 253 | 4.2% |
| Single Unit, Attached | 1,307 | 21.7% |
| 2 Unit Apartments | 69 | 1.1% |
| 3 or 4 Unit Apartments | 209 | 3.5% |
| 5 to 9 Unit Apartments | 412 | 6.8% |
| 10 or more Apartments | 3,784 | 62.7% |
| Mobile Home / Other | 0 | 0.0% |
| Total | 6,034 | 100.0% |
Housing Structures by Occupancy in Leisure World
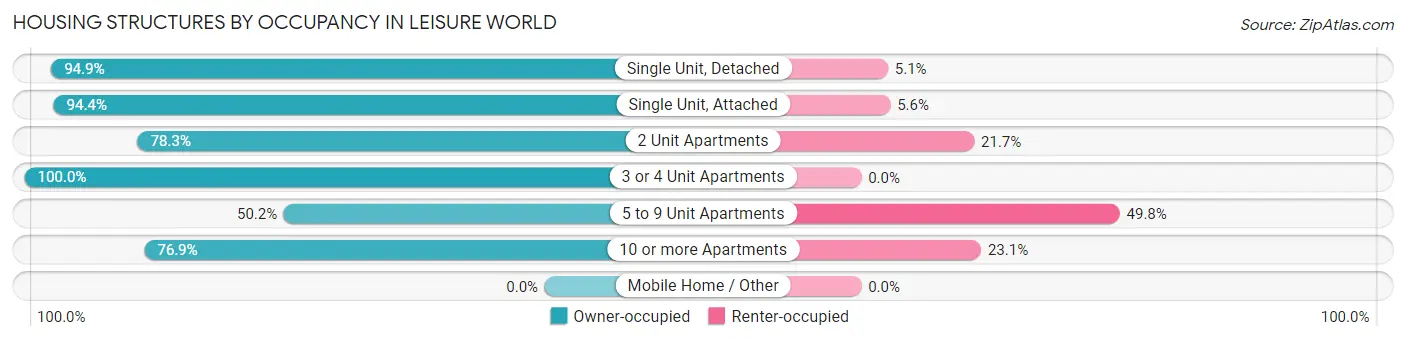
| Structure Type | Owner-occupied | Renter-occupied |
| Single Unit, Detached | 240 (94.9%) | 13 (5.1%) |
| Single Unit, Attached | 1,234 (94.4%) | 73 (5.6%) |
| 2 Unit Apartments | 54 (78.3%) | 15 (21.7%) |
| 3 or 4 Unit Apartments | 209 (100.0%) | 0 (0.0%) |
| 5 to 9 Unit Apartments | 207 (50.2%) | 205 (49.8%) |
| 10 or more Apartments | 2,911 (76.9%) | 873 (23.1%) |
| Mobile Home / Other | 0 (0.0%) | 0 (0.0%) |
| Total | 4,855 (80.5%) | 1,179 (19.5%) |
Housing Structures by Number of Rooms in Leisure World
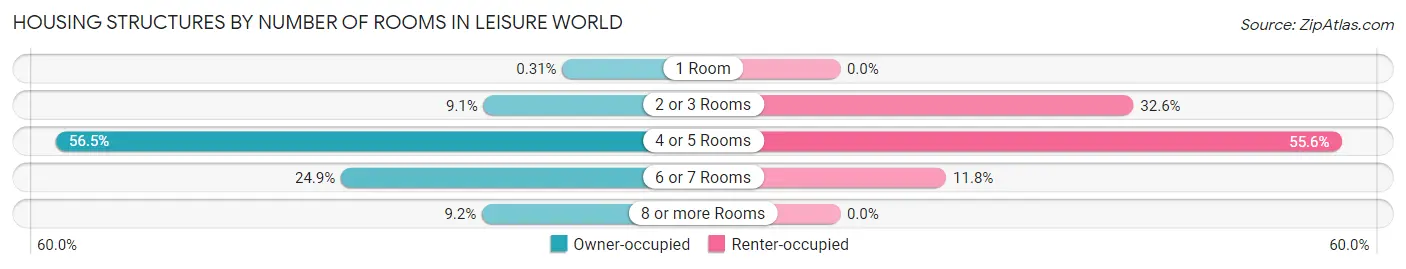
| Number of Rooms | Owner-occupied | Renter-occupied |
| 1 Room | 15 (0.3%) | 0 (0.0%) |
| 2 or 3 Rooms | 440 (9.1%) | 384 (32.6%) |
| 4 or 5 Rooms | 2,744 (56.5%) | 656 (55.6%) |
| 6 or 7 Rooms | 1,208 (24.9%) | 139 (11.8%) |
| 8 or more Rooms | 448 (9.2%) | 0 (0.0%) |
| Total | 4,855 (100.0%) | 1,179 (100.0%) |
Housing Structure by Heating Type in Leisure World
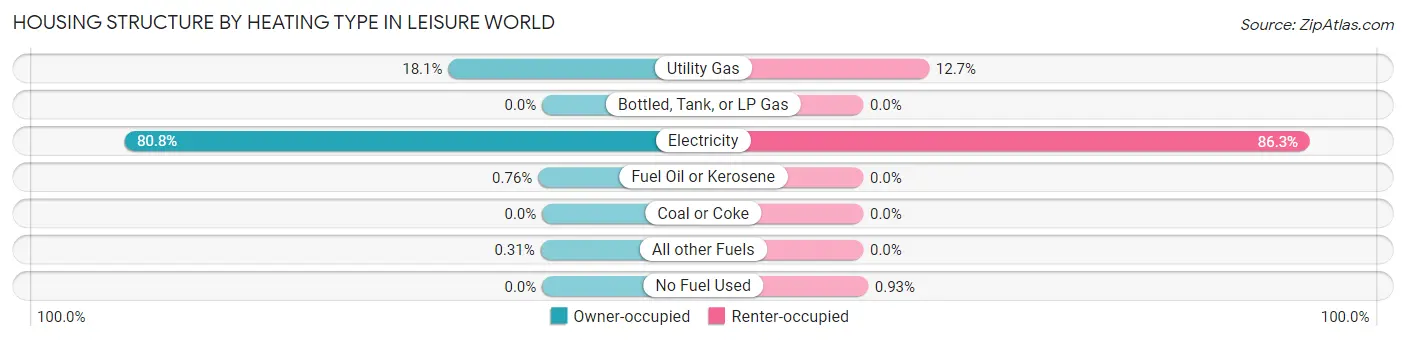
| Heating Type | Owner-occupied | Renter-occupied |
| Utility Gas | 880 (18.1%) | 150 (12.7%) |
| Bottled, Tank, or LP Gas | 0 (0.0%) | 0 (0.0%) |
| Electricity | 3,923 (80.8%) | 1,018 (86.3%) |
| Fuel Oil or Kerosene | 37 (0.8%) | 0 (0.0%) |
| Coal or Coke | 0 (0.0%) | 0 (0.0%) |
| All other Fuels | 15 (0.3%) | 0 (0.0%) |
| No Fuel Used | 0 (0.0%) | 11 (0.9%) |
| Total | 4,855 (100.0%) | 1,179 (100.0%) |
Household Vehicle Usage in Leisure World
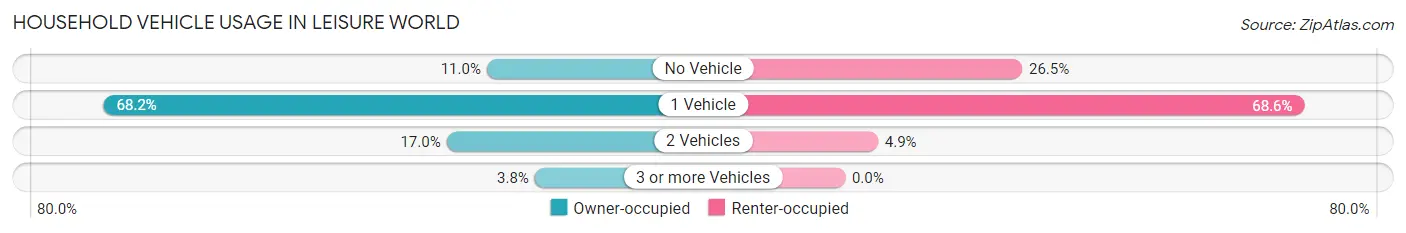
| Vehicles per Household | Owner-occupied | Renter-occupied |
| No Vehicle | 533 (11.0%) | 312 (26.5%) |
| 1 Vehicle | 3,312 (68.2%) | 809 (68.6%) |
| 2 Vehicles | 825 (17.0%) | 58 (4.9%) |
| 3 or more Vehicles | 185 (3.8%) | 0 (0.0%) |
| Total | 4,855 (100.0%) | 1,179 (100.0%) |
Real Estate & Mortgages in Leisure World
Real Estate and Mortgage Overview in Leisure World
| Characteristic | Without Mortgage | With Mortgage |
| Housing Units | 3,129 | 1,726 |
| Median Property Value | $234,700 | $291,500 |
| Median Household Income | $60,117 | $302 |
| Monthly Housing Costs | $991 | $168 |
| Real Estate Taxes | $1,983 | $123 |
Property Value by Mortgage Status in Leisure World
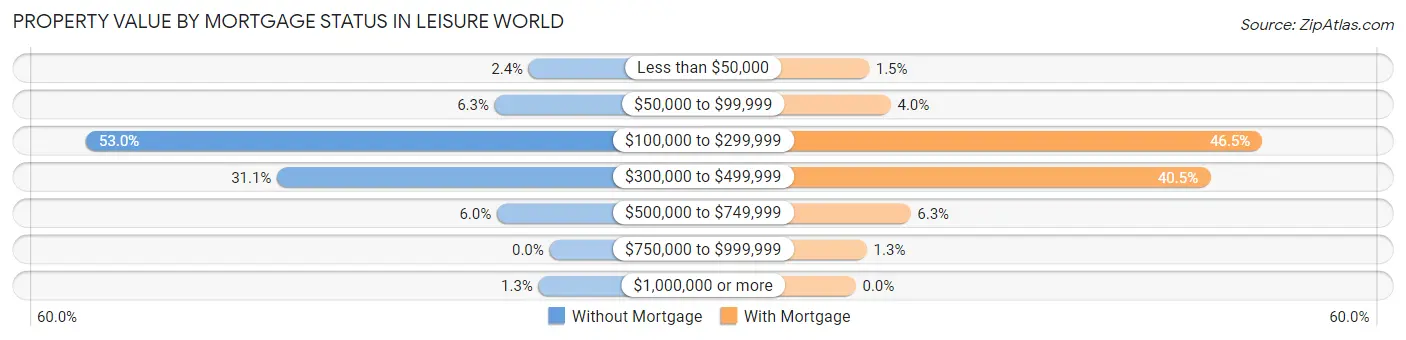
| Property Value | Without Mortgage | With Mortgage |
| Less than $50,000 | 74 (2.4%) | 26 (1.5%) |
| $50,000 to $99,999 | 196 (6.3%) | 69 (4.0%) |
| $100,000 to $299,999 | 1,658 (53.0%) | 802 (46.5%) |
| $300,000 to $499,999 | 974 (31.1%) | 699 (40.5%) |
| $500,000 to $749,999 | 188 (6.0%) | 108 (6.3%) |
| $750,000 to $999,999 | 0 (0.0%) | 22 (1.3%) |
| $1,000,000 or more | 39 (1.3%) | 0 (0.0%) |
| Total | 3,129 (100.0%) | 1,726 (100.0%) |
Household Income by Mortgage Status in Leisure World
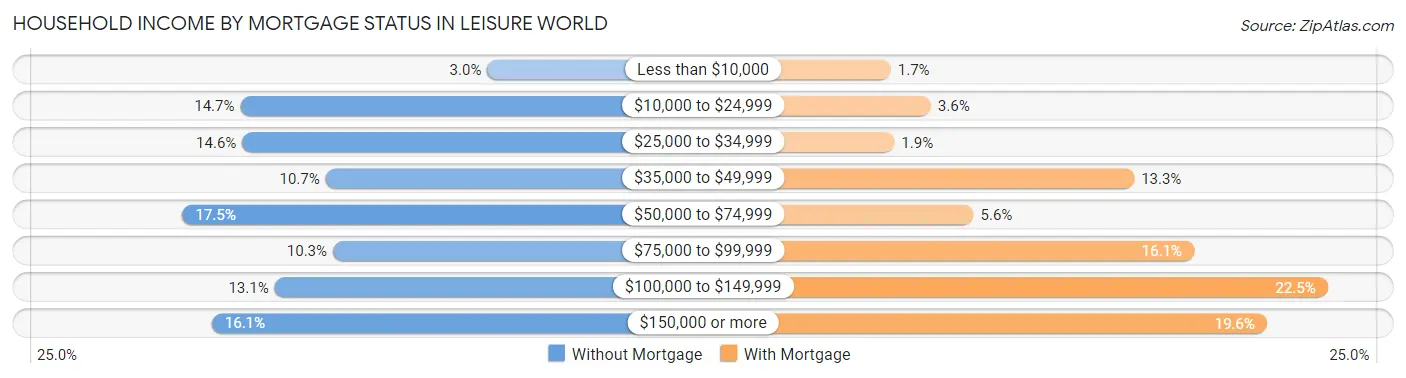
| Household Income | Without Mortgage | With Mortgage |
| Less than $10,000 | 93 (3.0%) | 29 (1.7%) |
| $10,000 to $24,999 | 461 (14.7%) | 62 (3.6%) |
| $25,000 to $34,999 | 458 (14.6%) | 32 (1.8%) |
| $35,000 to $49,999 | 334 (10.7%) | 229 (13.3%) |
| $50,000 to $74,999 | 547 (17.5%) | 97 (5.6%) |
| $75,000 to $99,999 | 323 (10.3%) | 278 (16.1%) |
| $100,000 to $149,999 | 410 (13.1%) | 388 (22.5%) |
| $150,000 or more | 503 (16.1%) | 338 (19.6%) |
| Total | 3,129 (100.0%) | 1,726 (100.0%) |
Property Value to Household Income Ratio in Leisure World
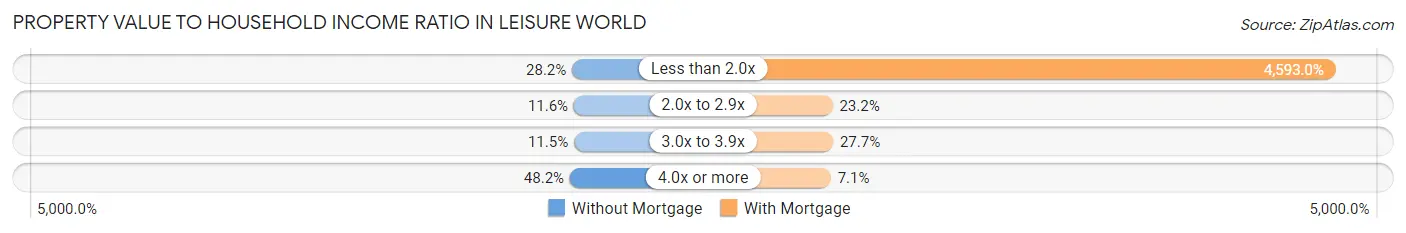
| Value-to-Income Ratio | Without Mortgage | With Mortgage |
| Less than 2.0x | 883 (28.2%) | 79,275 (4,593.0%) |
| 2.0x to 2.9x | 362 (11.6%) | 400 (23.2%) |
| 3.0x to 3.9x | 360 (11.5%) | 478 (27.7%) |
| 4.0x or more | 1,509 (48.2%) | 122 (7.1%) |
| Total | 3,129 (100.0%) | 1,726 (100.0%) |
Real Estate Taxes by Mortgage Status in Leisure World
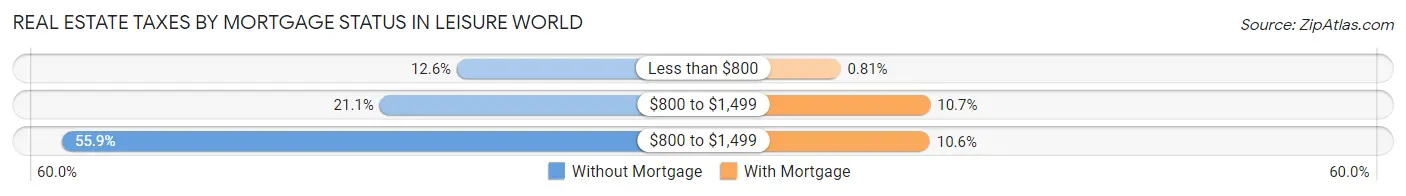
| Property Taxes | Without Mortgage | With Mortgage |
| Less than $800 | 395 (12.6%) | 14 (0.8%) |
| $800 to $1,499 | 660 (21.1%) | 184 (10.7%) |
| $800 to $1,499 | 1,749 (55.9%) | 183 (10.6%) |
| Total | 3,129 (100.0%) | 1,726 (100.0%) |
Health & Disability in Leisure World
Health Insurance Coverage by Age in Leisure World
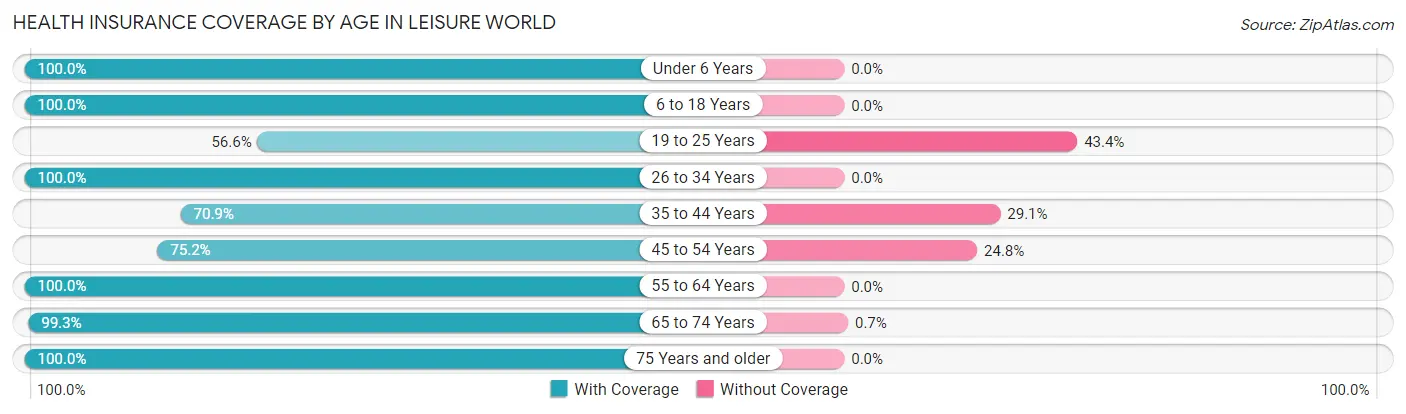
| Age Bracket | With Coverage | Without Coverage |
| Under 6 Years | 29 (100.0%) | 0 (0.0%) |
| 6 to 18 Years | 346 (100.0%) | 0 (0.0%) |
| 19 to 25 Years | 112 (56.6%) | 86 (43.4%) |
| 26 to 34 Years | 113 (100.0%) | 0 (0.0%) |
| 35 to 44 Years | 190 (70.9%) | 78 (29.1%) |
| 45 to 54 Years | 167 (75.2%) | 55 (24.8%) |
| 55 to 64 Years | 817 (100.0%) | 0 (0.0%) |
| 65 to 74 Years | 1,984 (99.3%) | 14 (0.7%) |
| 75 Years and older | 4,938 (100.0%) | 0 (0.0%) |
| Total | 8,696 (97.4%) | 233 (2.6%) |
Health Insurance Coverage by Citizenship Status in Leisure World
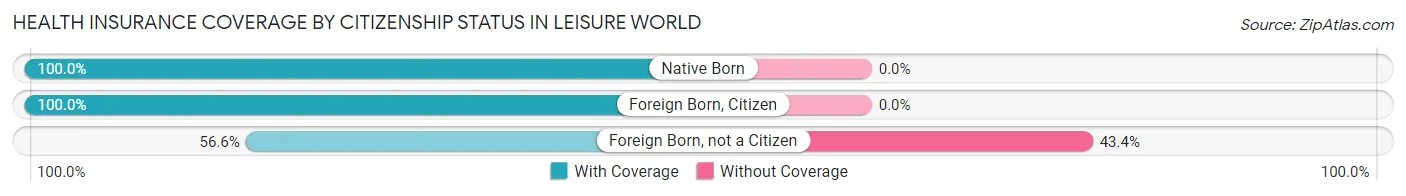
| Citizenship Status | With Coverage | Without Coverage |
| Native Born | 29 (100.0%) | 0 (0.0%) |
| Foreign Born, Citizen | 346 (100.0%) | 0 (0.0%) |
| Foreign Born, not a Citizen | 112 (56.6%) | 86 (43.4%) |
Health Insurance Coverage by Household Income in Leisure World
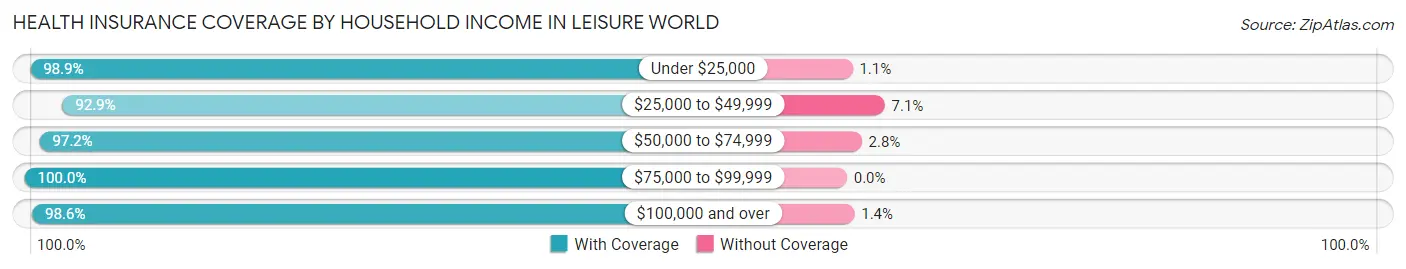
| Household Income | With Coverage | Without Coverage |
| Under $25,000 | 1,309 (98.9%) | 14 (1.1%) |
| $25,000 to $49,999 | 1,851 (92.9%) | 141 (7.1%) |
| $50,000 to $74,999 | 1,265 (97.2%) | 36 (2.8%) |
| $75,000 to $99,999 | 1,288 (100.0%) | 0 (0.0%) |
| $100,000 and over | 2,965 (98.6%) | 42 (1.4%) |
Public vs Private Health Insurance Coverage by Age in Leisure World
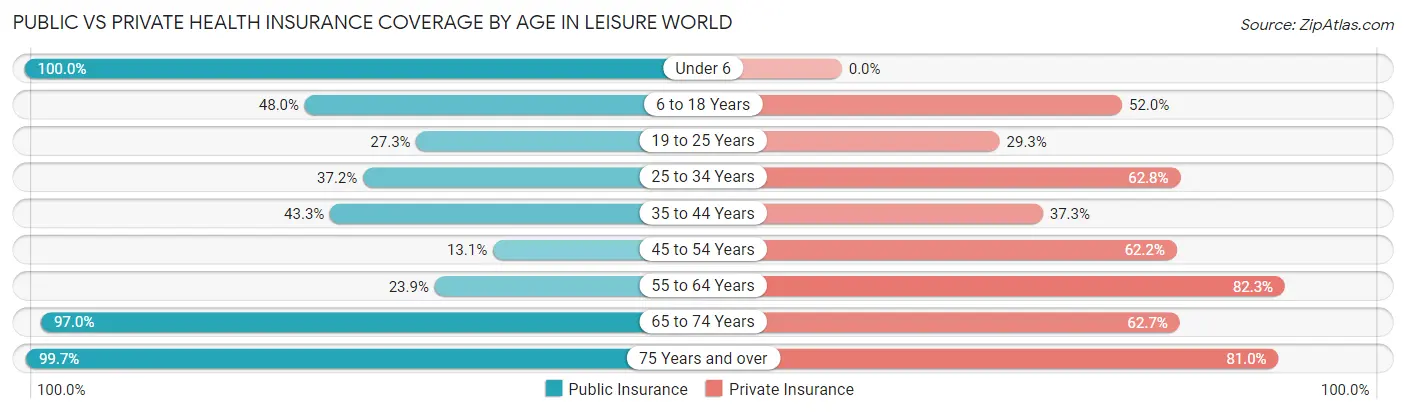
| Age Bracket | Public Insurance | Private Insurance |
| Under 6 | 29 (100.0%) | 0 (0.0%) |
| 6 to 18 Years | 166 (48.0%) | 180 (52.0%) |
| 19 to 25 Years | 54 (27.3%) | 58 (29.3%) |
| 25 to 34 Years | 42 (37.2%) | 71 (62.8%) |
| 35 to 44 Years | 116 (43.3%) | 100 (37.3%) |
| 45 to 54 Years | 29 (13.1%) | 138 (62.2%) |
| 55 to 64 Years | 195 (23.9%) | 672 (82.3%) |
| 65 to 74 Years | 1,937 (97.0%) | 1,253 (62.7%) |
| 75 Years and over | 4,925 (99.7%) | 4,002 (81.0%) |
| Total | 7,493 (83.9%) | 6,474 (72.5%) |
Disability Status by Sex by Age in Leisure World
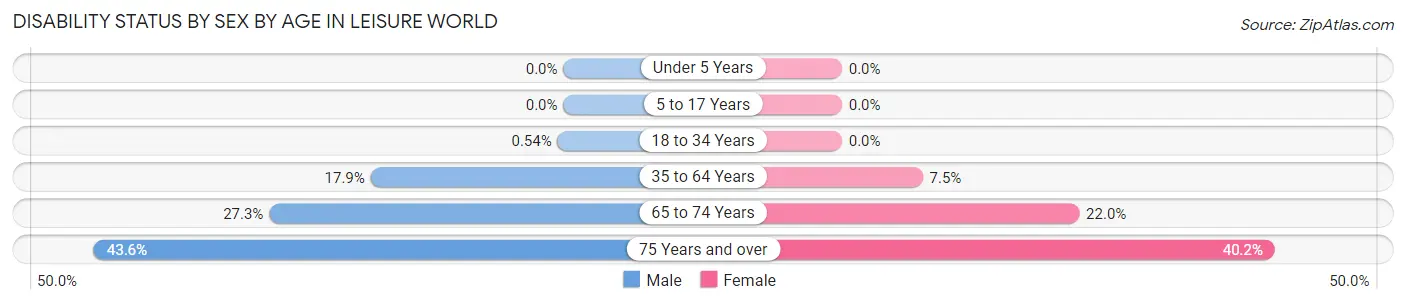
| Age Bracket | Male | Female |
| Under 5 Years | 0 (0.0%) | 0 (0.0%) |
| 5 to 17 Years | 0 (0.0%) | 0 (0.0%) |
| 18 to 34 Years | 1 (0.5%) | 0 (0.0%) |
| 35 to 64 Years | 105 (17.9%) | 54 (7.5%) |
| 65 to 74 Years | 175 (27.3%) | 299 (22.0%) |
| 75 Years and over | 796 (43.6%) | 1,250 (40.2%) |
Disability Class by Sex by Age in Leisure World
Disability Class: Hearing Difficulty
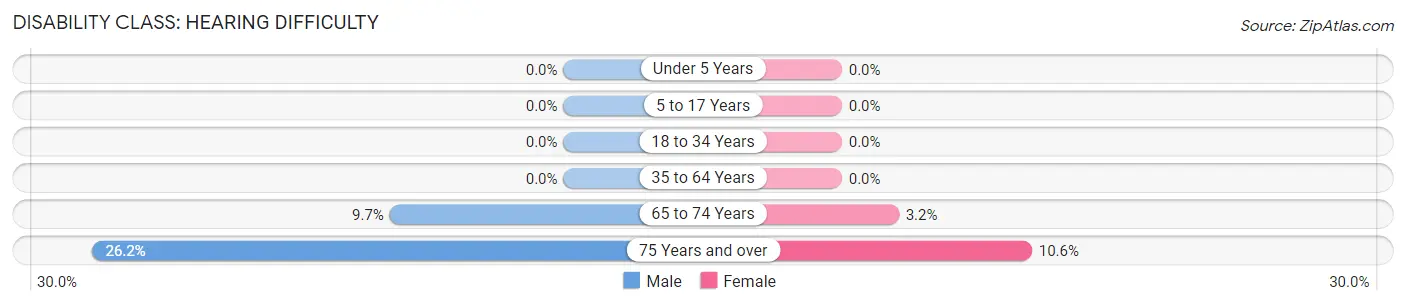
| Age Bracket | Male | Female |
| Under 5 Years | 0 (0.0%) | 0 (0.0%) |
| 5 to 17 Years | 0 (0.0%) | 0 (0.0%) |
| 18 to 34 Years | 0 (0.0%) | 0 (0.0%) |
| 35 to 64 Years | 0 (0.0%) | 0 (0.0%) |
| 65 to 74 Years | 62 (9.7%) | 43 (3.2%) |
| 75 Years and over | 479 (26.2%) | 329 (10.6%) |
Disability Class: Vision Difficulty
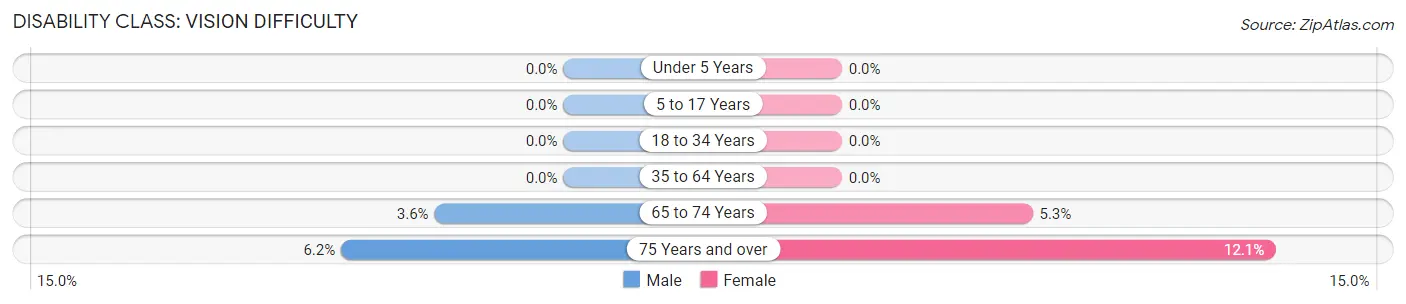
| Age Bracket | Male | Female |
| Under 5 Years | 0 (0.0%) | 0 (0.0%) |
| 5 to 17 Years | 0 (0.0%) | 0 (0.0%) |
| 18 to 34 Years | 0 (0.0%) | 0 (0.0%) |
| 35 to 64 Years | 0 (0.0%) | 0 (0.0%) |
| 65 to 74 Years | 23 (3.6%) | 72 (5.3%) |
| 75 Years and over | 113 (6.2%) | 376 (12.1%) |
Disability Class: Cognitive Difficulty
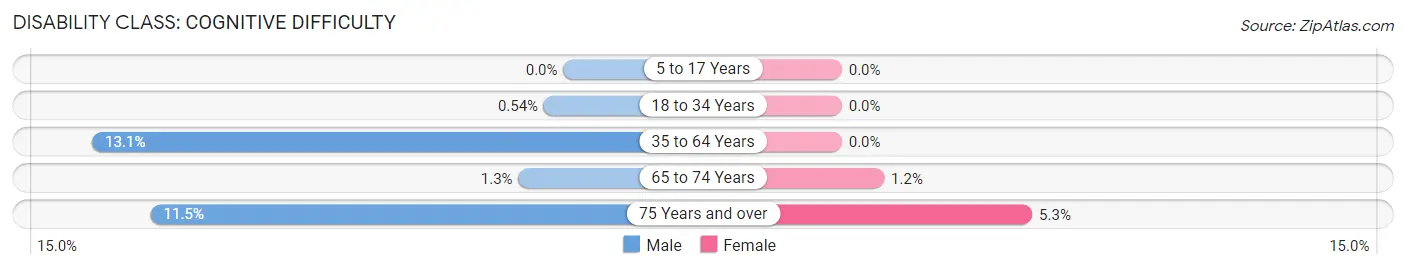
| Age Bracket | Male | Female |
| 5 to 17 Years | 0 (0.0%) | 0 (0.0%) |
| 18 to 34 Years | 1 (0.5%) | 0 (0.0%) |
| 35 to 64 Years | 77 (13.1%) | 0 (0.0%) |
| 65 to 74 Years | 8 (1.3%) | 16 (1.2%) |
| 75 Years and over | 210 (11.5%) | 165 (5.3%) |
Disability Class: Ambulatory Difficulty
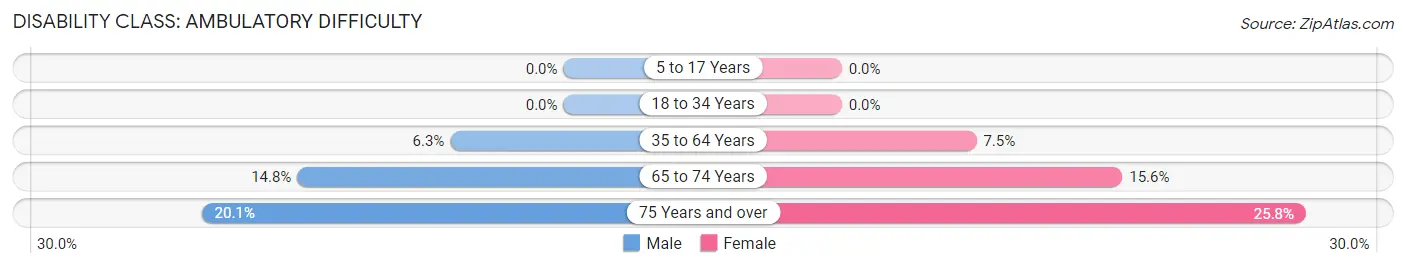
| Age Bracket | Male | Female |
| 5 to 17 Years | 0 (0.0%) | 0 (0.0%) |
| 18 to 34 Years | 0 (0.0%) | 0 (0.0%) |
| 35 to 64 Years | 37 (6.3%) | 54 (7.5%) |
| 65 to 74 Years | 95 (14.8%) | 212 (15.6%) |
| 75 Years and over | 368 (20.1%) | 804 (25.8%) |
Disability Class: Self-Care Difficulty
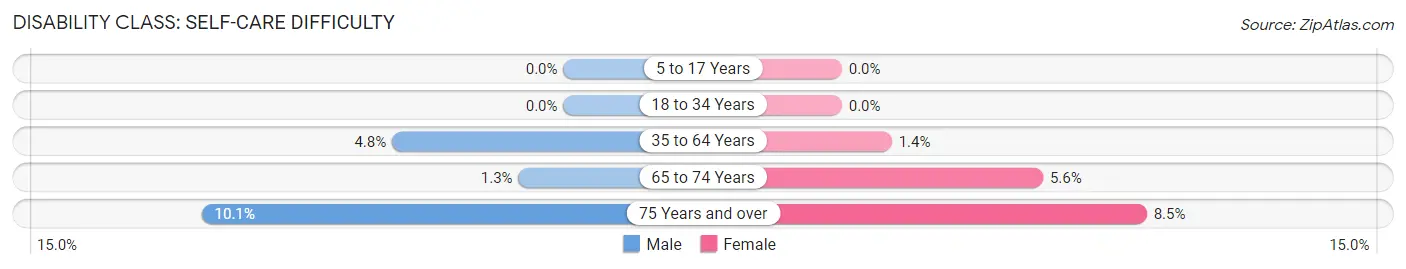
| Age Bracket | Male | Female |
| 5 to 17 Years | 0 (0.0%) | 0 (0.0%) |
| 18 to 34 Years | 0 (0.0%) | 0 (0.0%) |
| 35 to 64 Years | 28 (4.8%) | 10 (1.4%) |
| 65 to 74 Years | 8 (1.3%) | 76 (5.6%) |
| 75 Years and over | 184 (10.1%) | 264 (8.5%) |
Technology Access in Leisure World
Computing Device Access in Leisure World
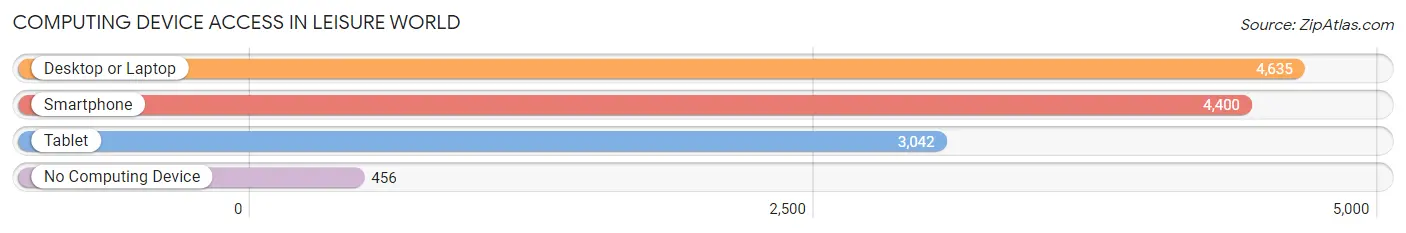
| Device Type | # Households | % Households |
| Desktop or Laptop | 4,635 | 76.8% |
| Smartphone | 4,400 | 72.9% |
| Tablet | 3,042 | 50.4% |
| No Computing Device | 456 | 7.6% |
| Total | 6,034 | 100.0% |
Internet Access in Leisure World
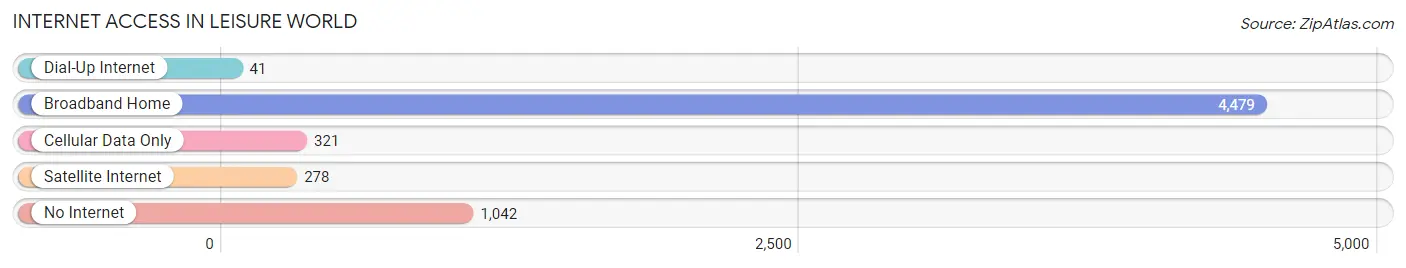
| Internet Type | # Households | % Households |
| Dial-Up Internet | 41 | 0.7% |
| Broadband Home | 4,479 | 74.2% |
| Cellular Data Only | 321 | 5.3% |
| Satellite Internet | 278 | 4.6% |
| No Internet | 1,042 | 17.3% |
| Total | 6,034 | 100.0% |
Leisure World Summary
Leisure World is a census-designated place (CDP) located in Montgomery County, Maryland. It is a retirement community that was established in the 1960s and is home to over 8,000 residents. The community is located just outside of Silver Spring and is bordered by the cities of Rockville and Gaithersburg.
History
Leisure World was founded in the 1960s by the Leisure World Corporation, a real estate development company. The company was founded by two brothers, Robert and William Levitt, who had previously developed the Levittowns in New York and Pennsylvania. The Levitts wanted to create a retirement community that was designed to meet the needs of the growing population of seniors. The community was designed to be self-contained, with all the amenities and services that seniors needed.
The first phase of the development was completed in 1965 and included 1,500 homes, a shopping center, a golf course, and a clubhouse. The community was designed to be a self-contained retirement community, with all the amenities and services that seniors needed. The community was designed to be a safe and secure place for seniors to live, with 24-hour security and a variety of recreational activities.
Geography
Leisure World is located in Montgomery County, Maryland, just outside of Silver Spring. It is bordered by the cities of Rockville and Gaithersburg. The community is situated on a hilltop, with views of the surrounding area. The community is divided into two sections, the North and South sections. The North section is the original development, while the South section was added in the 1980s.
The community is located near several major highways, including Interstate 270, the Capital Beltway, and the Baltimore-Washington Parkway. The community is also close to the Washington Metro, with the nearest station being the Silver Spring station.
Economy
Leisure World is a self-contained retirement community, with all the amenities and services that seniors need. The community has a variety of shops and restaurants, as well as a post office, a library, and a bank. The community also has a variety of recreational activities, including a golf course, tennis courts, and a swimming pool.
The community is also home to a number of businesses, including a medical center, a pharmacy, and a variety of professional services. The community also has a number of retirement homes and assisted living facilities.
Demographics
As of the 2010 census, the population of Leisure World was 8,093. The population is predominantly white (94.3%), with a small percentage of African Americans (2.3%) and Asians (2.2%). The median age of the population is 75.7 years, with a median household income of $50,945.
Leisure World is a retirement community, with over 90% of the population over the age of 65. The community is also home to a large number of veterans, with over 20% of the population having served in the military.
Conclusion
Leisure World is a self-contained retirement community located in Montgomery County, Maryland. It was founded in the 1960s by the Leisure World Corporation and is home to over 8,000 residents. The community is predominantly white, with a median age of 75.7 years and a median household income of $50,945. The community is self-contained, with all the amenities and services that seniors need, as well as a variety of recreational activities.
Common Questions
What is Per Capita Income in Leisure World?
Per Capita income in Leisure World is $62,959.
What is the Median Family Income in Leisure World?
Median Family Income in Leisure World is $79,477.
What is the Median Household income in Leisure World?
Median Household Income in Leisure World is $61,679.
What is Income or Wage Gap in Leisure World?
Income or Wage Gap in Leisure World is 10.0%.
Women in Leisure World earn 90.0 cents for every dollar earned by a man.
What is Family Income Deficit in Leisure World?
Family Income Deficit in Leisure World is $4,682.
Families that are below poverty line in Leisure World earn $4,682 less on average than the poverty threshold level.
What is Inequality or Gini Index in Leisure World?
Inequality or Gini Index in Leisure World is 0.50.
What is the Total Population of Leisure World?
Total Population of Leisure World is 8,975.
What is the Total Male Population of Leisure World?
Total Male Population of Leisure World is 3,489.
What is the Total Female Population of Leisure World?
Total Female Population of Leisure World is 5,486.
What is the Ratio of Males per 100 Females in Leisure World?
There are 63.60 Males per 100 Females in Leisure World.
What is the Ratio of Females per 100 Males in Leisure World?
There are 157.24 Females per 100 Males in Leisure World.
What is the Median Population Age in Leisure World?
Median Population Age in Leisure World is 76.4 Years.
What is the Average Family Size in Leisure World
Average Family Size in Leisure World is 2.2 People.
What is the Average Household Size in Leisure World
Average Household Size in Leisure World is 1.5 People.
How Large is the Labor Force in Leisure World?
There are 2,026 People in the Labor Forcein in Leisure World.
What is the Percentage of People in the Labor Force in Leisure World?
23.3% of People are in the Labor Force in Leisure World.
What is the Unemployment Rate in Leisure World?
Unemployment Rate in Leisure World is 14.6%.