Beaver Creek, MD Map & Demographics
Beaver Creek Map
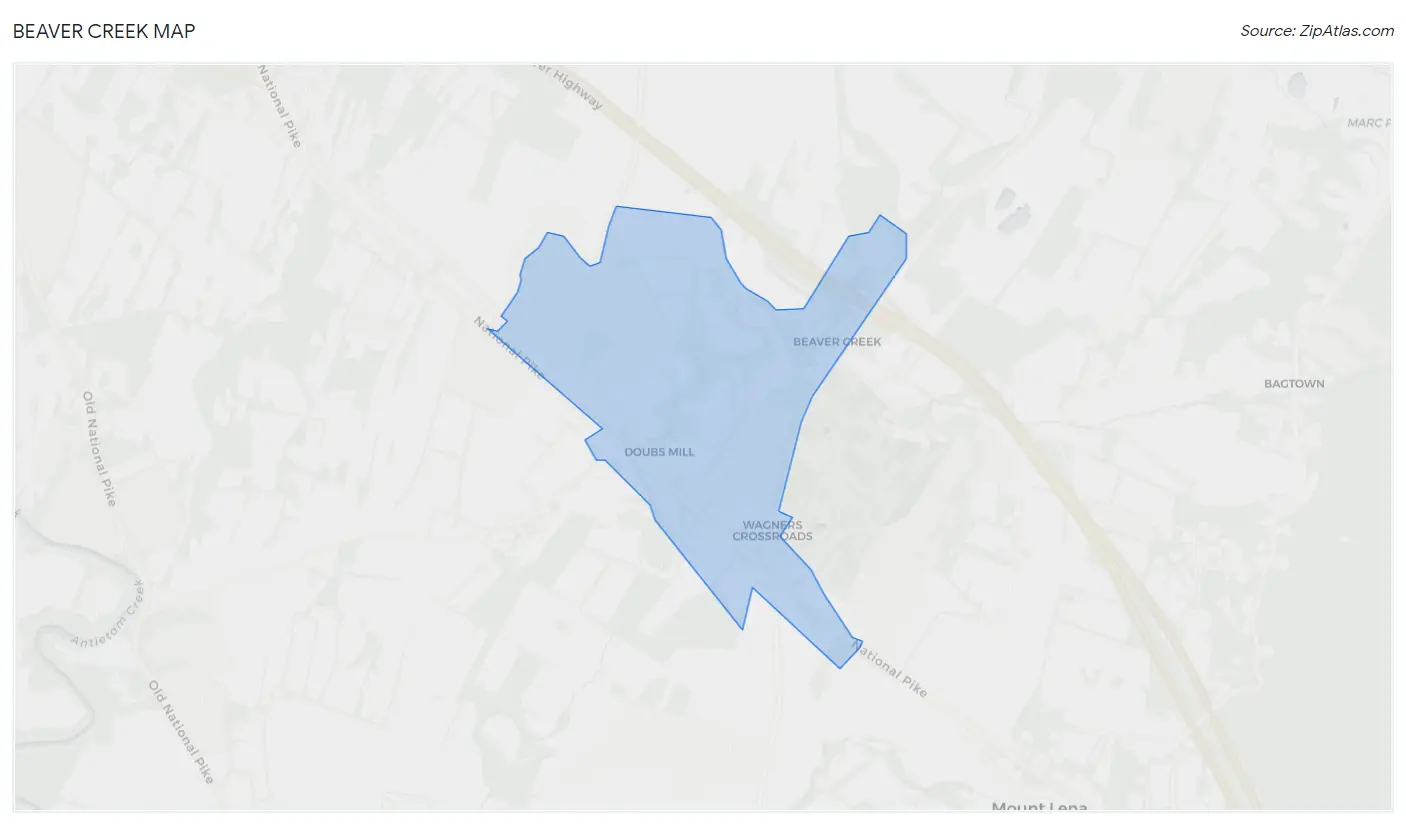
Beaver Creek Overview
$88,141
PER CAPITA INCOME
$155,375
AVG FAMILY INCOME
$155,500
AVG HOUSEHOLD INCOME
0.38
INEQUALITY / GINI INDEX
422
TOTAL POPULATION
188
MALE POPULATION
234
FEMALE POPULATION
80.34
MALES / 100 FEMALES
124.47
FEMALES / 100 MALES
37.6
MEDIAN AGE
3.2
AVG FAMILY SIZE
3.0
AVG HOUSEHOLD SIZE
209
LABOR FORCE [ PEOPLE ]
63.7%
PERCENT IN LABOR FORCE
Income in Beaver Creek
Income Overview in Beaver Creek
Per Capita Income in Beaver Creek is $88,141, while median incomes of families and households are $155,375 and $155,500 respectively.
| Characteristic | Number | Measure |
| Per Capita Income | 422 | $88,141 |
| Median Family Income | 97 | $155,375 |
| Mean Family Income | 97 | $235,521 |
| Median Household Income | 142 | $155,500 |
| Mean Household Income | 142 | $262,419 |
| Income Deficit | 97 | $0 |
| Wage / Income Gap (%) | 422 | 0.00% |
| Wage / Income Gap ($) | 422 | 100.00¢ per $1 |
| Gini / Inequality Index | 422 | 0.38 |
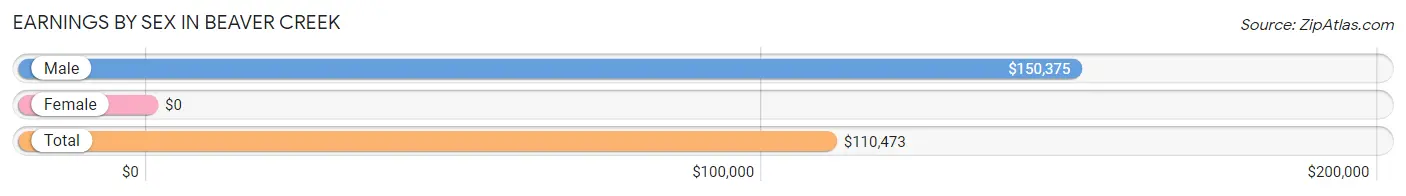
Earnings by Sex in Beaver Creek
| Sex | Number | Average Earnings |
| Male | 123 (55.9%) | $150,375 |
| Female | 97 (44.1%) | $0 |
| Total | 220 (100.0%) | $110,473 |
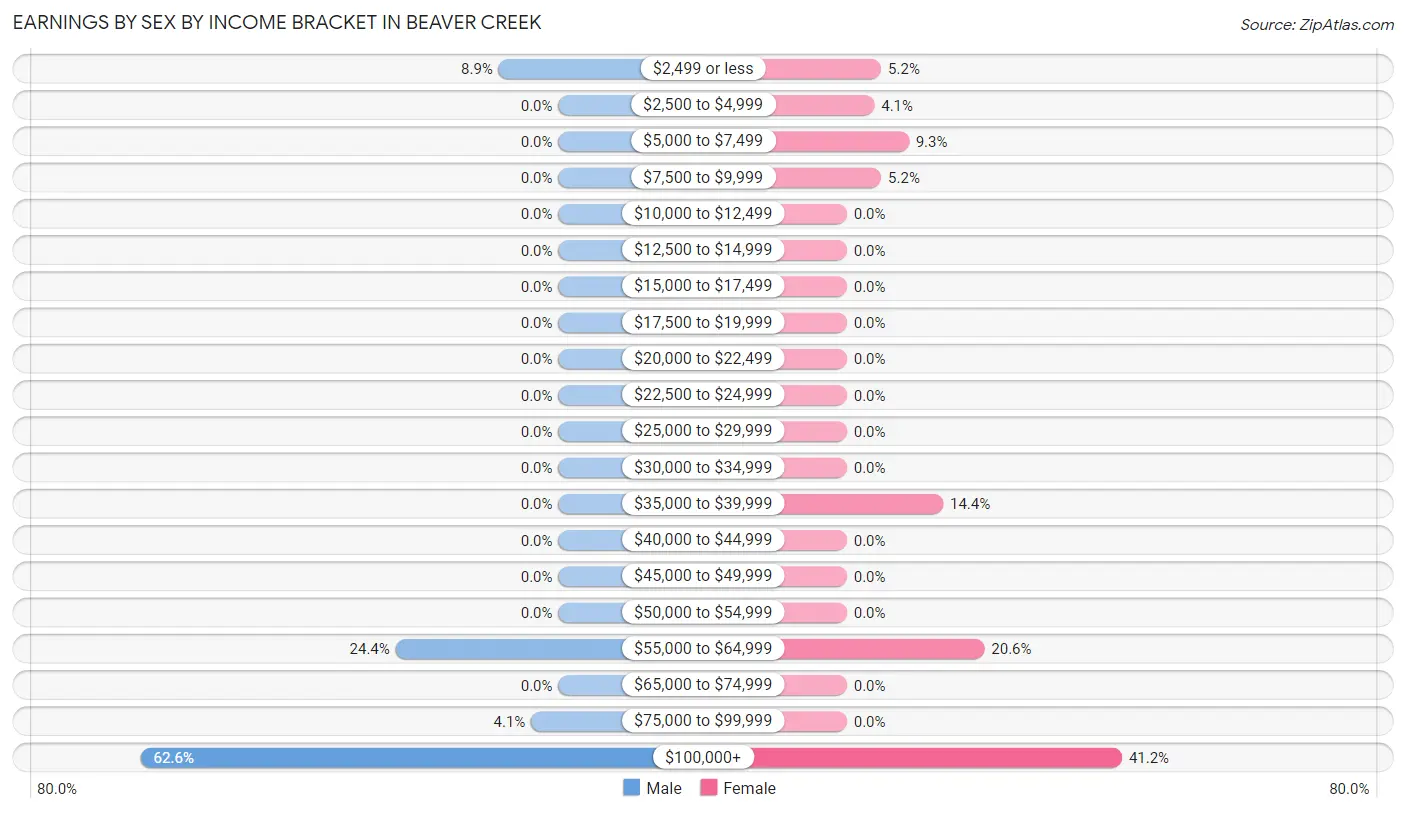
Earnings by Sex by Income Bracket in Beaver Creek
The most common earnings brackets in Beaver Creek are $100,000+ for men (77 | 62.6%) and $100,000+ for women (40 | 41.2%).
| Income | Male | Female |
| $2,499 or less | 11 (8.9%) | 5 (5.1%) |
| $2,500 to $4,999 | 0 (0.0%) | 4 (4.1%) |
| $5,000 to $7,499 | 0 (0.0%) | 9 (9.3%) |
| $7,500 to $9,999 | 0 (0.0%) | 5 (5.1%) |
| $10,000 to $12,499 | 0 (0.0%) | 0 (0.0%) |
| $12,500 to $14,999 | 0 (0.0%) | 0 (0.0%) |
| $15,000 to $17,499 | 0 (0.0%) | 0 (0.0%) |
| $17,500 to $19,999 | 0 (0.0%) | 0 (0.0%) |
| $20,000 to $22,499 | 0 (0.0%) | 0 (0.0%) |
| $22,500 to $24,999 | 0 (0.0%) | 0 (0.0%) |
| $25,000 to $29,999 | 0 (0.0%) | 0 (0.0%) |
| $30,000 to $34,999 | 0 (0.0%) | 0 (0.0%) |
| $35,000 to $39,999 | 0 (0.0%) | 14 (14.4%) |
| $40,000 to $44,999 | 0 (0.0%) | 0 (0.0%) |
| $45,000 to $49,999 | 0 (0.0%) | 0 (0.0%) |
| $50,000 to $54,999 | 0 (0.0%) | 0 (0.0%) |
| $55,000 to $64,999 | 30 (24.4%) | 20 (20.6%) |
| $65,000 to $74,999 | 0 (0.0%) | 0 (0.0%) |
| $75,000 to $99,999 | 5 (4.1%) | 0 (0.0%) |
| $100,000+ | 77 (62.6%) | 40 (41.2%) |
| Total | 123 (100.0%) | 97 (100.0%) |
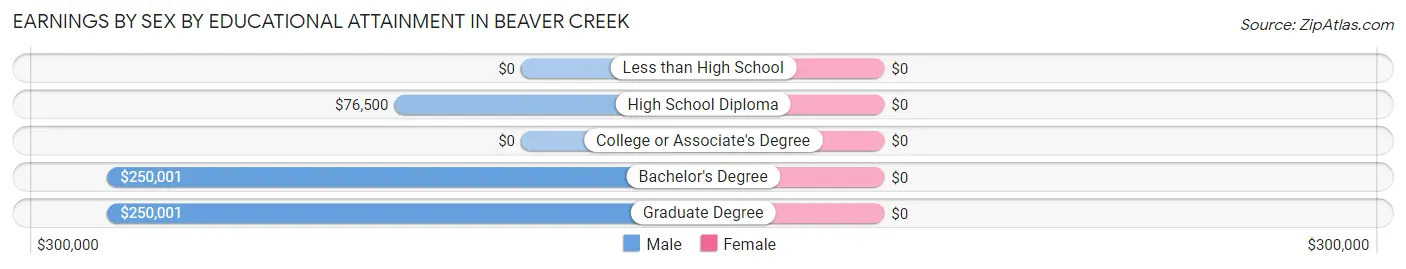
Earnings by Sex by Educational Attainment in Beaver Creek
| Educational Attainment | Male Income | Female Income |
| Less than High School | - | - |
| High School Diploma | $76,500 | $0 |
| College or Associate's Degree | - | - |
| Bachelor's Degree | $250,001 | $0 |
| Graduate Degree | $250,001 | $0 |
| Total | $151,750 | $110,326 |
Family Income in Beaver Creek
Family Income Brackets in Beaver Creek
According to the Beaver Creek family income data, there are 40 families falling into the $200,000+ income range, which is the most common income bracket and makes up 41.2% of all families.
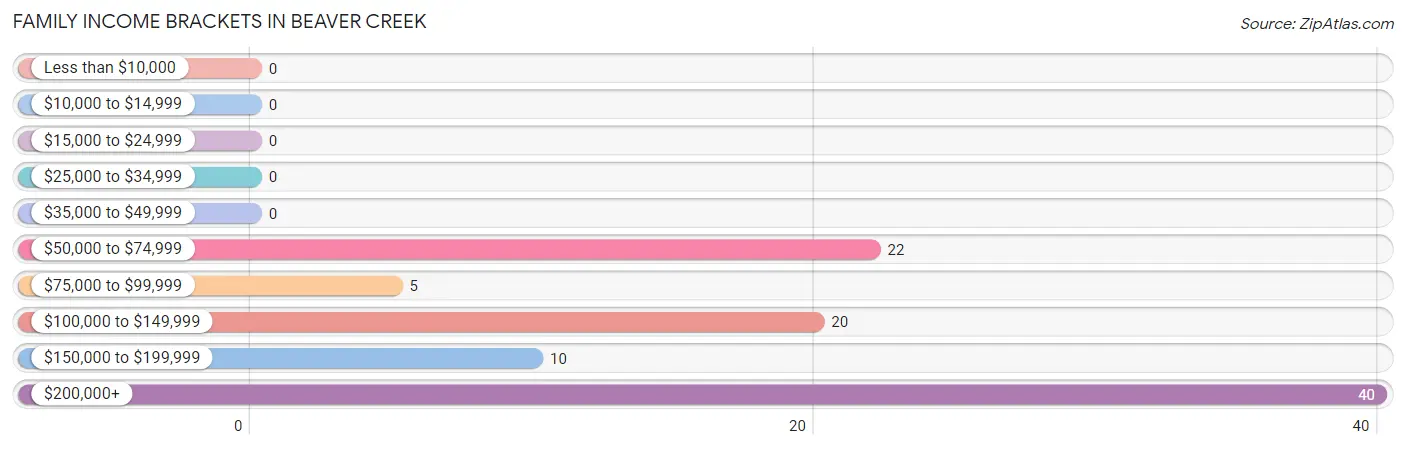
| Income Bracket | # Families | % Families |
| Less than $10,000 | 0 | 0.0% |
| $10,000 to $14,999 | 0 | 0.0% |
| $15,000 to $24,999 | 0 | 0.0% |
| $25,000 to $34,999 | 0 | 0.0% |
| $35,000 to $49,999 | 0 | 0.0% |
| $50,000 to $74,999 | 22 | 22.7% |
| $75,000 to $99,999 | 5 | 5.2% |
| $100,000 to $149,999 | 20 | 20.6% |
| $150,000 to $199,999 | 10 | 10.3% |
| $200,000+ | 40 | 41.2% |
Family Income by Famaliy Size in Beaver Creek
4-person families (31 | 32.0%) account for the highest median family income in Beaver Creek with $250,001 per family, while 2-person families (36 | 37.1%) have the highest median income of $77,750 per family member.
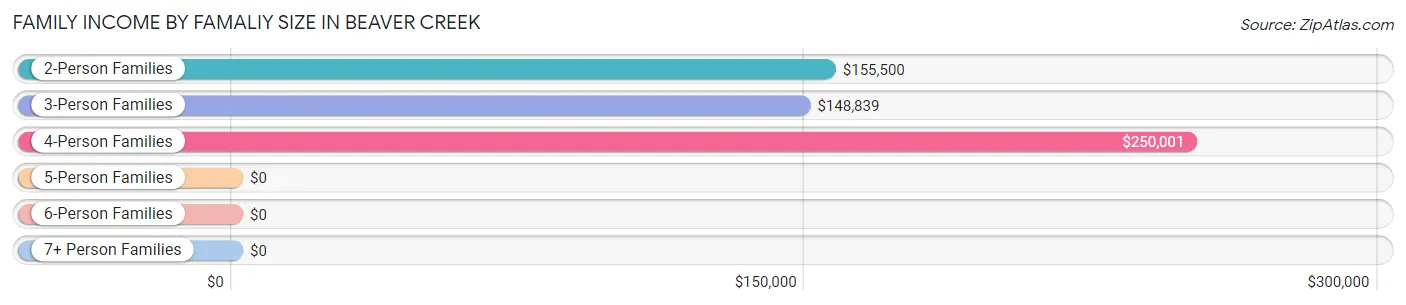
| Income Bracket | # Families | Median Income |
| 2-Person Families | 36 (37.1%) | $155,500 |
| 3-Person Families | 25 (25.8%) | $148,839 |
| 4-Person Families | 31 (32.0%) | $250,001 |
| 5-Person Families | 0 (0.0%) | $0 |
| 6-Person Families | 0 (0.0%) | $0 |
| 7+ Person Families | 5 (5.1%) | $0 |
| Total | 97 (100.0%) | $155,375 |
Family Income by Number of Earners in Beaver Creek
| Number of Earners | # Families | Median Income |
| No Earners | 10 (10.3%) | $0 |
| 1 Earner | 37 (38.1%) | $0 |
| 2 Earners | 34 (35.0%) | $0 |
| 3+ Earners | 16 (16.5%) | $0 |
| Total | 97 (100.0%) | $155,375 |
Household Income in Beaver Creek
Household Income Brackets in Beaver Creek
With 63 households falling in the category, the $200,000+ income range is the most frequent in Beaver Creek, accounting for 44.4% of all households.
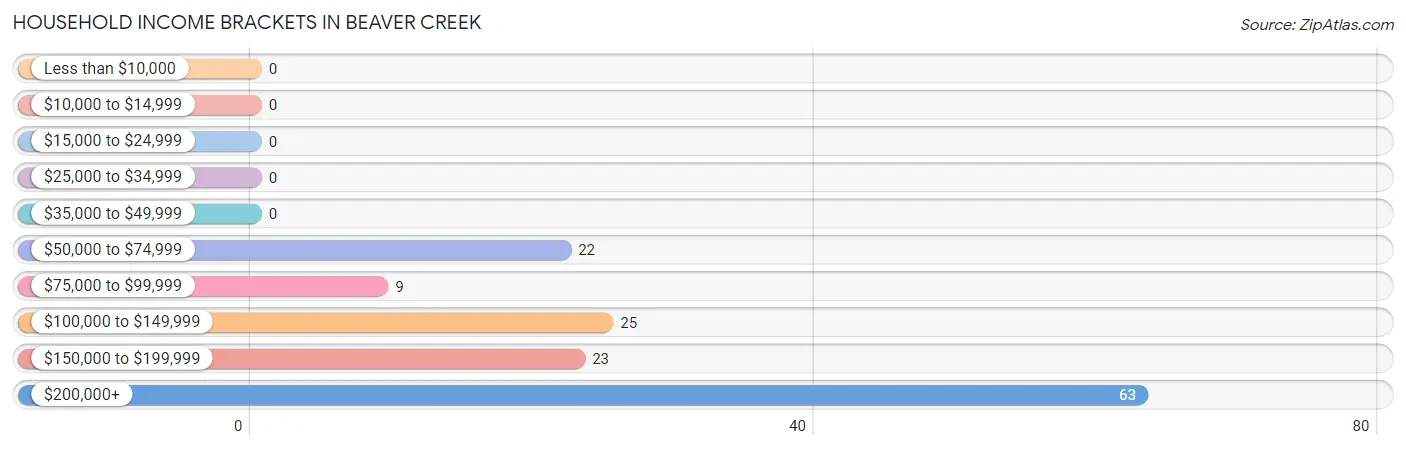
| Income Bracket | # Households | % Households |
| Less than $10,000 | 0 | 0.0% |
| $10,000 to $14,999 | 0 | 0.0% |
| $15,000 to $24,999 | 0 | 0.0% |
| $25,000 to $34,999 | 0 | 0.0% |
| $35,000 to $49,999 | 0 | 0.0% |
| $50,000 to $74,999 | 22 | 15.5% |
| $75,000 to $99,999 | 9 | 6.3% |
| $100,000 to $149,999 | 25 | 17.6% |
| $150,000 to $199,999 | 23 | 16.2% |
| $200,000+ | 63 | 44.4% |
Household Income by Householder Age in Beaver Creek
The median household income in Beaver Creek is $155,500, with the highest median household income of $249,250 found in the 45 to 64 years age bracket for the primary householder. A total of 90 households (63.4%) fall into this category.
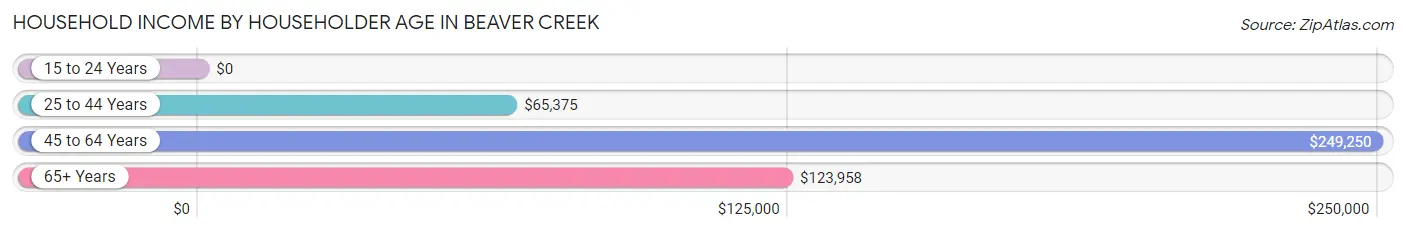
| Income Bracket | # Households | Median Income |
| 15 to 24 Years | 0 (0.0%) | $0 |
| 25 to 44 Years | 27 (19.0%) | $65,375 |
| 45 to 64 Years | 90 (63.4%) | $249,250 |
| 65+ Years | 25 (17.6%) | $123,958 |
| Total | 142 (100.0%) | $155,500 |
Poverty in Beaver Creek
Income Below Poverty by Sex and Age in Beaver Creek
With 2.1% poverty level for males and 13.3% for females among the residents of Beaver Creek, 25 to 34 year old males and 25 to 34 year old females are the most vulnerable to poverty, with 4 males (28.6%) and 27 females (50.9%) in their respective age groups living below the poverty level.
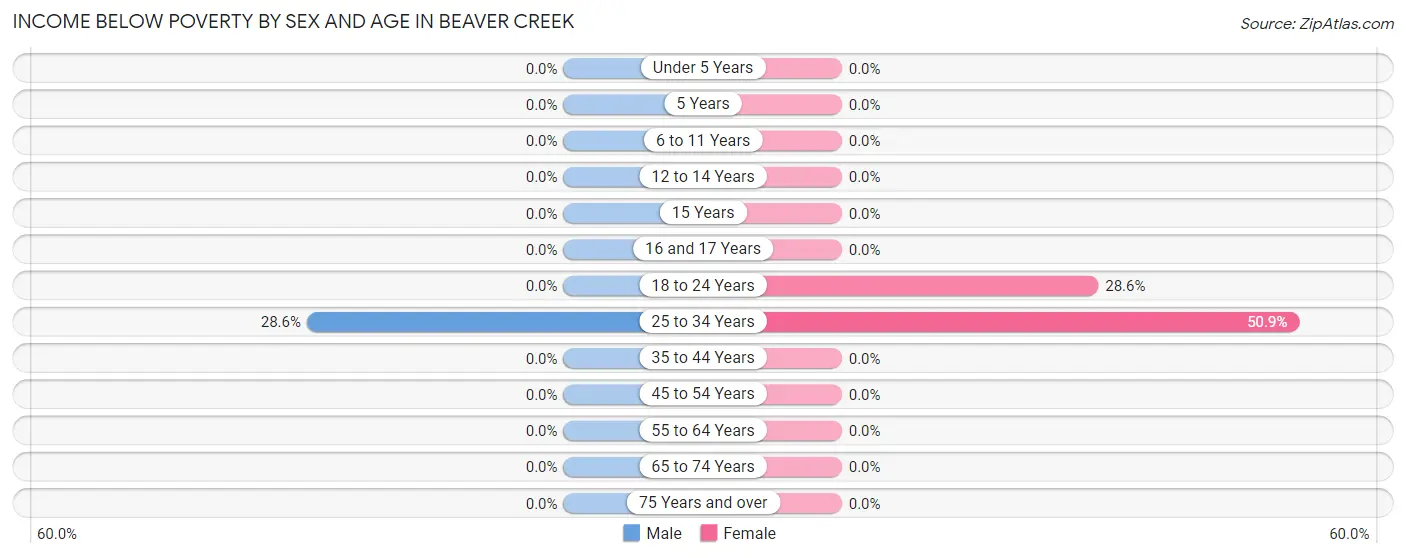
| Age Bracket | Male | Female |
| Under 5 Years | 0 (0.0%) | 0 (0.0%) |
| 5 Years | 0 (0.0%) | 0 (0.0%) |
| 6 to 11 Years | 0 (0.0%) | 0 (0.0%) |
| 12 to 14 Years | 0 (0.0%) | 0 (0.0%) |
| 15 Years | 0 (0.0%) | 0 (0.0%) |
| 16 and 17 Years | 0 (0.0%) | 0 (0.0%) |
| 18 to 24 Years | 0 (0.0%) | 4 (28.6%) |
| 25 to 34 Years | 4 (28.6%) | 27 (50.9%) |
| 35 to 44 Years | 0 (0.0%) | 0 (0.0%) |
| 45 to 54 Years | 0 (0.0%) | 0 (0.0%) |
| 55 to 64 Years | 0 (0.0%) | 0 (0.0%) |
| 65 to 74 Years | 0 (0.0%) | 0 (0.0%) |
| 75 Years and over | 0 (0.0%) | 0 (0.0%) |
| Total | 4 (2.1%) | 31 (13.3%) |
Income Above Poverty by Sex and Age in Beaver Creek
According to the poverty statistics in Beaver Creek, males aged under 5 years and females aged under 5 years are the age groups that are most secure financially, with 100.0% of males and 100.0% of females in these age groups living above the poverty line.
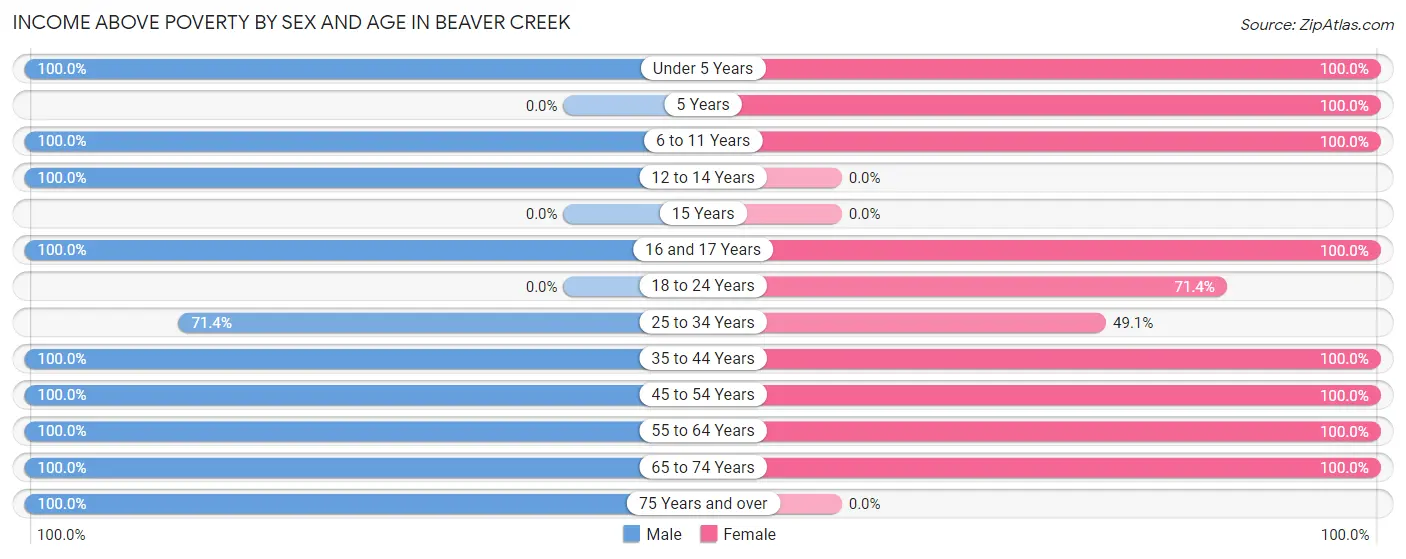
| Age Bracket | Male | Female |
| Under 5 Years | 14 (100.0%) | 7 (100.0%) |
| 5 Years | 0 (0.0%) | 5 (100.0%) |
| 6 to 11 Years | 23 (100.0%) | 31 (100.0%) |
| 12 to 14 Years | 14 (100.0%) | 0 (0.0%) |
| 15 Years | 0 (0.0%) | 0 (0.0%) |
| 16 and 17 Years | 11 (100.0%) | 13 (100.0%) |
| 18 to 24 Years | 0 (0.0%) | 10 (71.4%) |
| 25 to 34 Years | 10 (71.4%) | 26 (49.1%) |
| 35 to 44 Years | 18 (100.0%) | 8 (100.0%) |
| 45 to 54 Years | 44 (100.0%) | 43 (100.0%) |
| 55 to 64 Years | 33 (100.0%) | 33 (100.0%) |
| 65 to 74 Years | 7 (100.0%) | 27 (100.0%) |
| 75 Years and over | 10 (100.0%) | 0 (0.0%) |
| Total | 184 (97.9%) | 203 (86.8%) |
Income Below Poverty Among Married-Couple Families in Beaver Creek
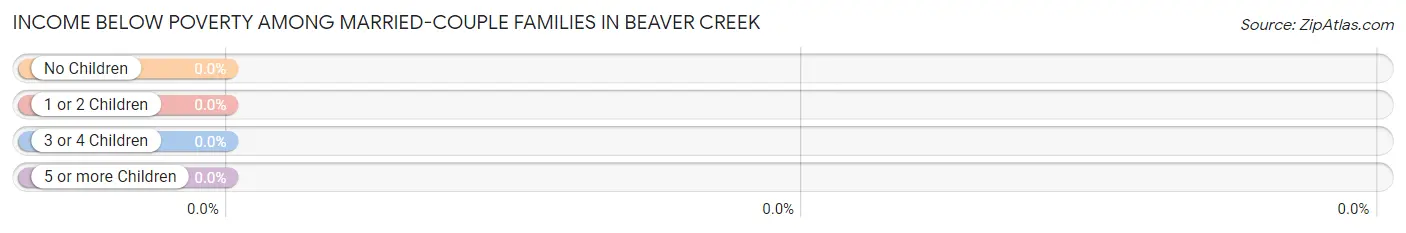
| Children | Above Poverty | Below Poverty |
| No Children | 32 (100.0%) | 0 (0.0%) |
| 1 or 2 Children | 45 (100.0%) | 0 (0.0%) |
| 3 or 4 Children | 0 (0.0%) | 0 (0.0%) |
| 5 or more Children | 5 (100.0%) | 0 (0.0%) |
| Total | 82 (100.0%) | 0 (0.0%) |
Income Below Poverty Among Single-Parent Households in Beaver Creek
| Children | Single Father | Single Mother |
| No Children | 0 (0.0%) | 0 (0.0%) |
| 1 or 2 Children | 0 (0.0%) | 0 (0.0%) |
| 3 or 4 Children | 0 (0.0%) | 0 (0.0%) |
| 5 or more Children | 0 (0.0%) | 0 (0.0%) |
| Total | 0 (0.0%) | 0 (0.0%) |
Income Below Poverty Among Married-Couple vs Single-Parent Households in Beaver Creek
| Children | Married-Couple Families | Single-Parent Households |
| No Children | 0 (0.0%) | 0 (0.0%) |
| 1 or 2 Children | 0 (0.0%) | 0 (0.0%) |
| 3 or 4 Children | 0 (0.0%) | 0 (0.0%) |
| 5 or more Children | 0 (0.0%) | 0 (0.0%) |
| Total | 0 (0.0%) | 0 (0.0%) |
Race in Beaver Creek
The most populous races in Beaver Creek are White / Caucasian (301 | 71.3%), Black / African American (65 | 15.4%), and Two or more Races (52 | 12.3%).
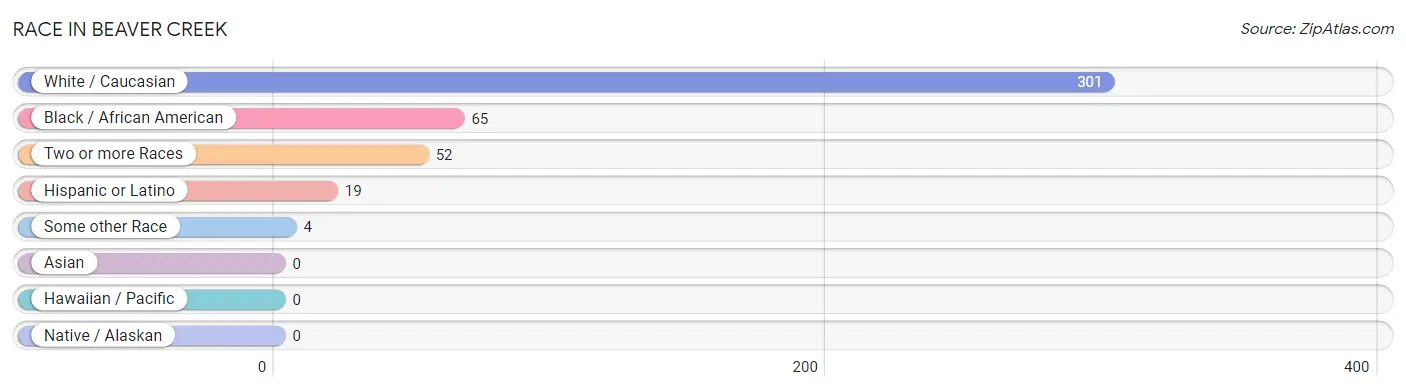
| Race | # Population | % Population |
| Asian | 0 | 0.0% |
| Black / African American | 65 | 15.4% |
| Hawaiian / Pacific | 0 | 0.0% |
| Hispanic or Latino | 19 | 4.5% |
| Native / Alaskan | 0 | 0.0% |
| White / Caucasian | 301 | 71.3% |
| Two or more Races | 52 | 12.3% |
| Some other Race | 4 | 0.9% |
| Total | 422 | 100.0% |
Ancestry in Beaver Creek
The most populous ancestries reported in Beaver Creek are English (107 | 25.4%), Subsaharan African (65 | 15.4%), German (57 | 13.5%), Afghan (37 | 8.8%), and Irish (26 | 6.2%), together accounting for 69.2% of all Beaver Creek residents.
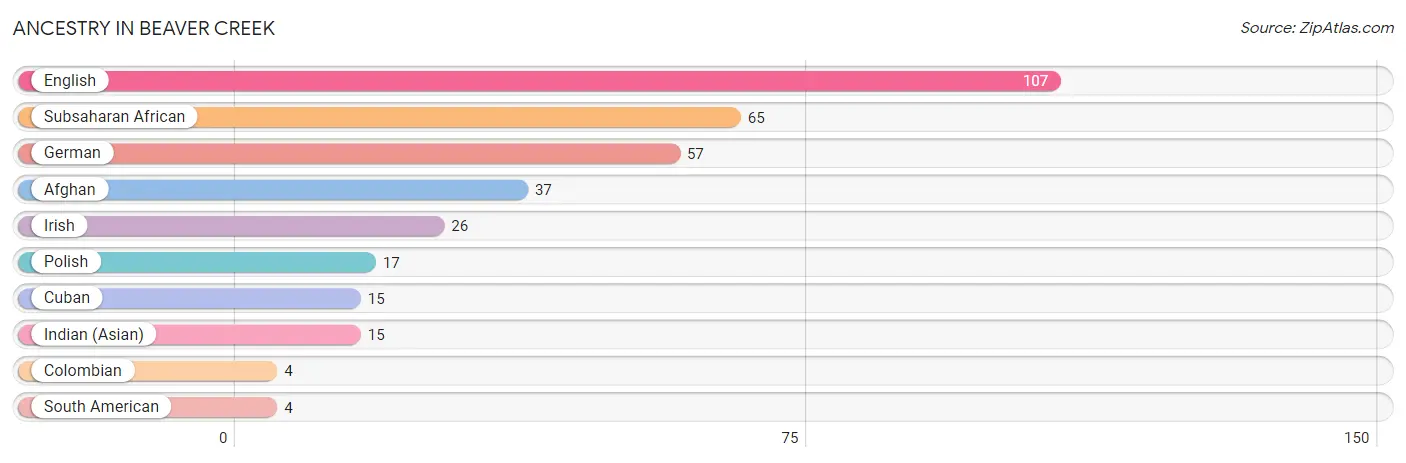
| Ancestry | # Population | % Population |
| Afghan | 37 | 8.8% |
| Colombian | 4 | 0.9% |
| Cuban | 15 | 3.5% |
| English | 107 | 25.4% |
| German | 57 | 13.5% |
| Indian (Asian) | 15 | 3.5% |
| Irish | 26 | 6.2% |
| Polish | 17 | 4.0% |
| South American | 4 | 0.9% |
| Subsaharan African | 65 | 15.4% | View All 10 Rows |
Immigrants in Beaver Creek
The most numerous immigrant groups reported in Beaver Creek came from Africa (49 | 11.6%), Cameroon (49 | 11.6%), Middle Africa (49 | 11.6%), Afghanistan (9 | 2.1%), and Asia (9 | 2.1%), together accounting for 39.1% of all Beaver Creek residents.
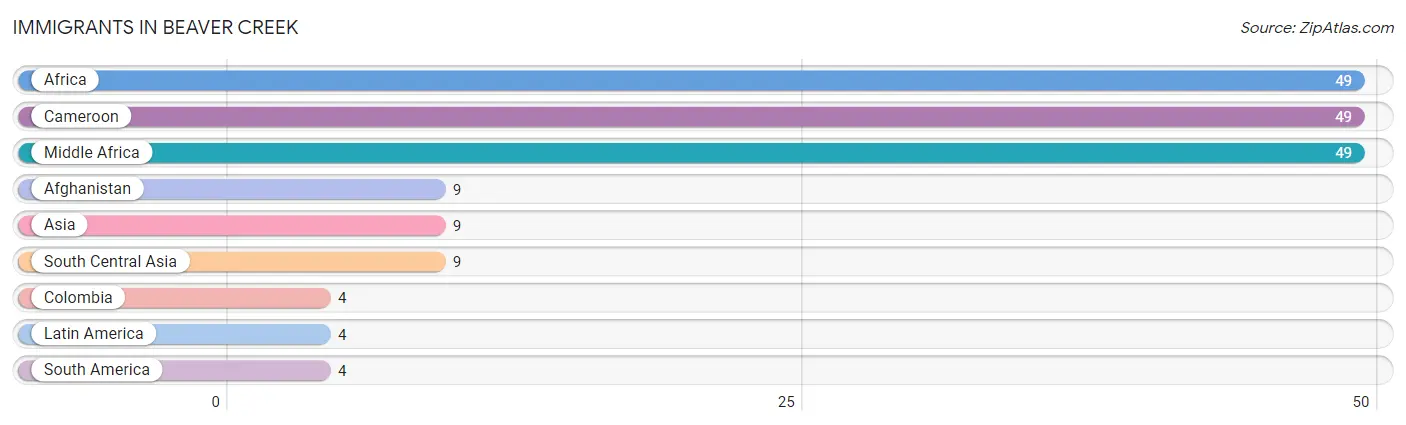
| Immigration Origin | # Population | % Population |
| Afghanistan | 9 | 2.1% |
| Africa | 49 | 11.6% |
| Asia | 9 | 2.1% |
| Cameroon | 49 | 11.6% |
| Colombia | 4 | 0.9% |
| Latin America | 4 | 0.9% |
| Middle Africa | 49 | 11.6% |
| South America | 4 | 0.9% |
| South Central Asia | 9 | 2.1% | View All 9 Rows |
Sex and Age in Beaver Creek
Sex and Age in Beaver Creek
The most populous age groups in Beaver Creek are 45 to 49 Years (44 | 23.4%) for men and 30 to 34 Years (34 | 14.5%) for women.
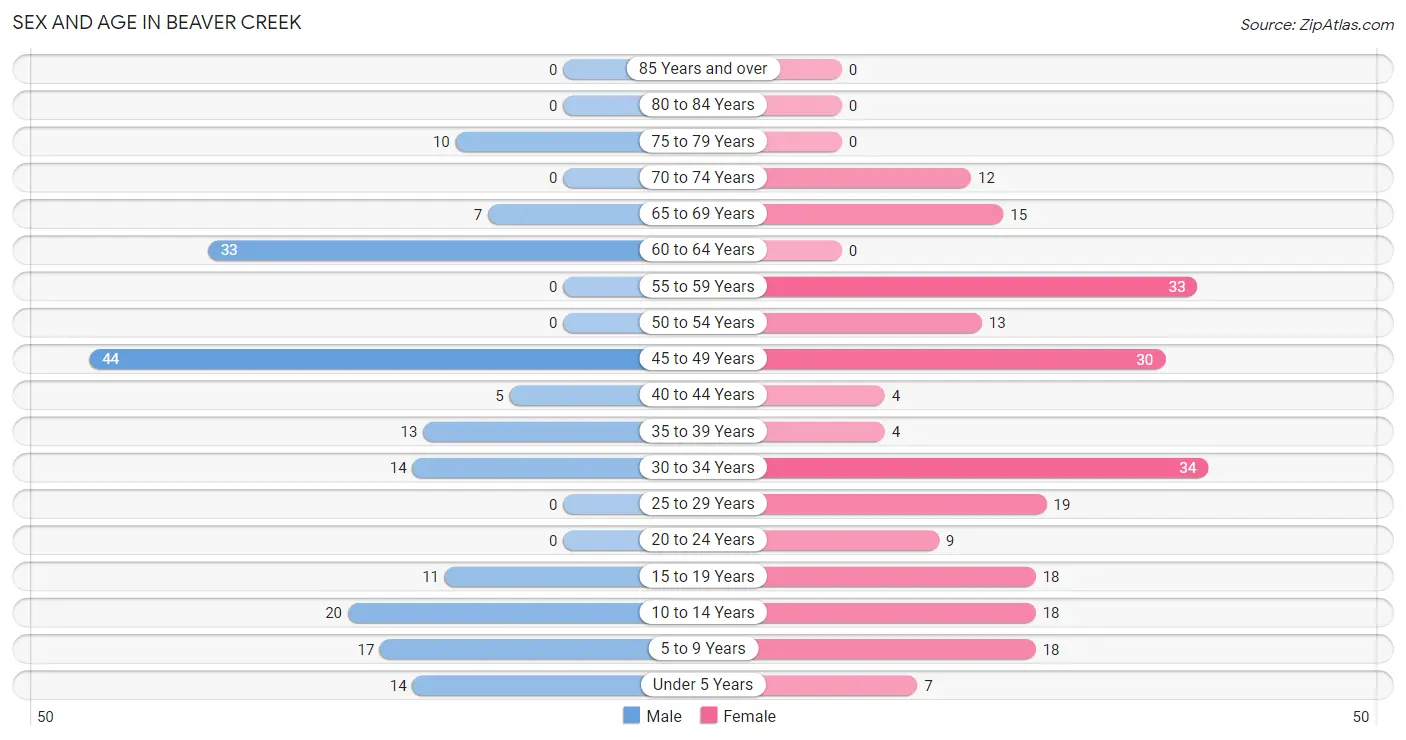
| Age Bracket | Male | Female |
| Under 5 Years | 14 (7.4%) | 7 (3.0%) |
| 5 to 9 Years | 17 (9.0%) | 18 (7.7%) |
| 10 to 14 Years | 20 (10.6%) | 18 (7.7%) |
| 15 to 19 Years | 11 (5.9%) | 18 (7.7%) |
| 20 to 24 Years | 0 (0.0%) | 9 (3.8%) |
| 25 to 29 Years | 0 (0.0%) | 19 (8.1%) |
| 30 to 34 Years | 14 (7.4%) | 34 (14.5%) |
| 35 to 39 Years | 13 (6.9%) | 4 (1.7%) |
| 40 to 44 Years | 5 (2.7%) | 4 (1.7%) |
| 45 to 49 Years | 44 (23.4%) | 30 (12.8%) |
| 50 to 54 Years | 0 (0.0%) | 13 (5.6%) |
| 55 to 59 Years | 0 (0.0%) | 33 (14.1%) |
| 60 to 64 Years | 33 (17.5%) | 0 (0.0%) |
| 65 to 69 Years | 7 (3.7%) | 15 (6.4%) |
| 70 to 74 Years | 0 (0.0%) | 12 (5.1%) |
| 75 to 79 Years | 10 (5.3%) | 0 (0.0%) |
| 80 to 84 Years | 0 (0.0%) | 0 (0.0%) |
| 85 Years and over | 0 (0.0%) | 0 (0.0%) |
| Total | 188 (100.0%) | 234 (100.0%) |
Families and Households in Beaver Creek
Median Family Size in Beaver Creek
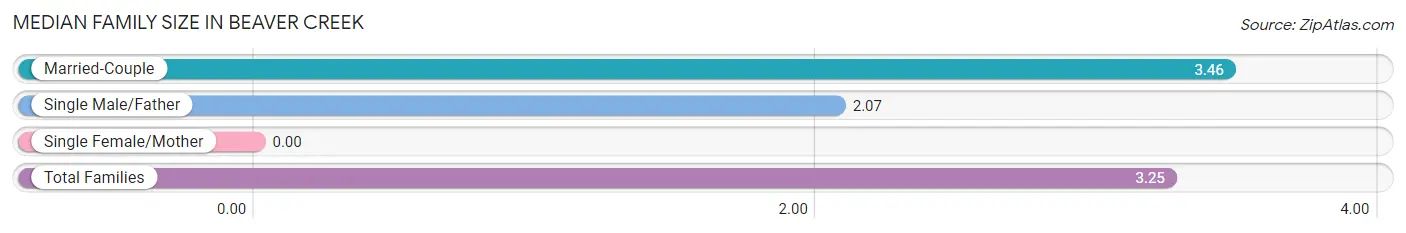
| Family Type | # Families | Family Size |
| Married-Couple | 82 (84.5%) | 3.46 |
| Single Male/Father | 15 (15.5%) | 2.07 |
| Single Female/Mother | 0 (0.0%) | - |
| Total Families | 97 (100.0%) | 3.25 |
Median Household Size in Beaver Creek
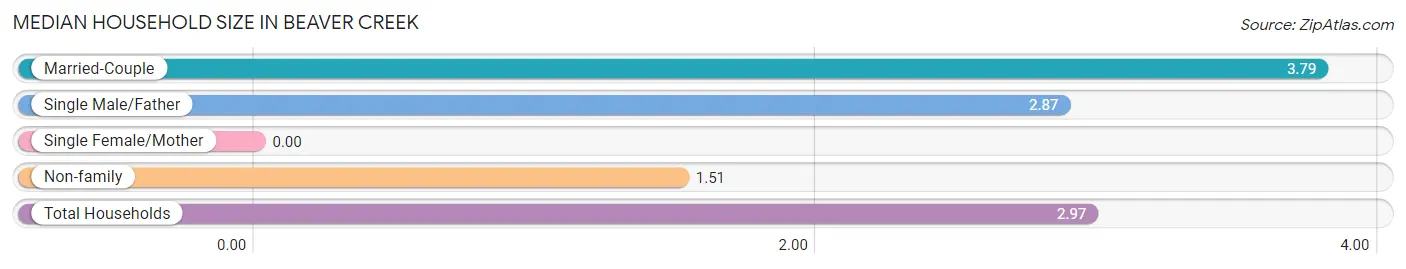
| Household Type | # Households | Household Size |
| Married-Couple | 82 (57.8%) | 3.79 |
| Single Male/Father | 15 (10.6%) | 2.87 |
| Single Female/Mother | 0 (0.0%) | - |
| Non-family | 45 (31.7%) | 1.51 |
| Total Households | 142 (100.0%) | 2.97 |
Household Size by Marriage Status in Beaver Creek
Out of a total of 142 households in Beaver Creek, 97 (68.3%) are family households, while 45 (31.7%) are nonfamily households. The most numerous type of family households are 4-person households, comprising 36, and the most common type of nonfamily households are 2-person households, comprising 23.
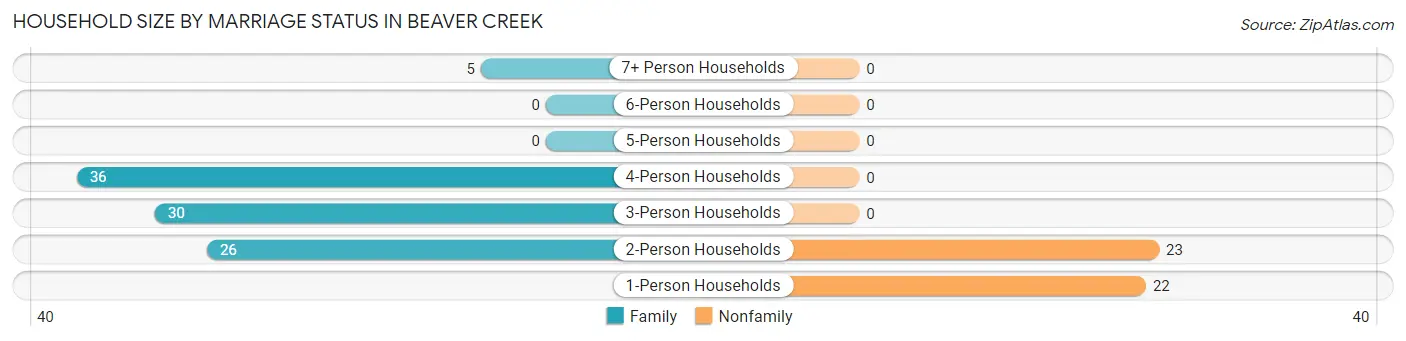
| Household Size | Family Households | Nonfamily Households |
| 1-Person Households | - | 22 (15.5%) |
| 2-Person Households | 26 (18.3%) | 23 (16.2%) |
| 3-Person Households | 30 (21.1%) | 0 (0.0%) |
| 4-Person Households | 36 (25.4%) | 0 (0.0%) |
| 5-Person Households | 0 (0.0%) | 0 (0.0%) |
| 6-Person Households | 0 (0.0%) | 0 (0.0%) |
| 7+ Person Households | 5 (3.5%) | 0 (0.0%) |
| Total | 97 (68.3%) | 45 (31.7%) |
Female Fertility in Beaver Creek
Fertility by Age in Beaver Creek
Average fertility rate in Beaver Creek is 119.0 births per 1,000 women. Women in the age bracket of 20 to 34 years have the highest fertility rate with 226.0 births per 1,000 women. Women in the age bracket of 20 to 34 years acount for 100.0% of all women with births.
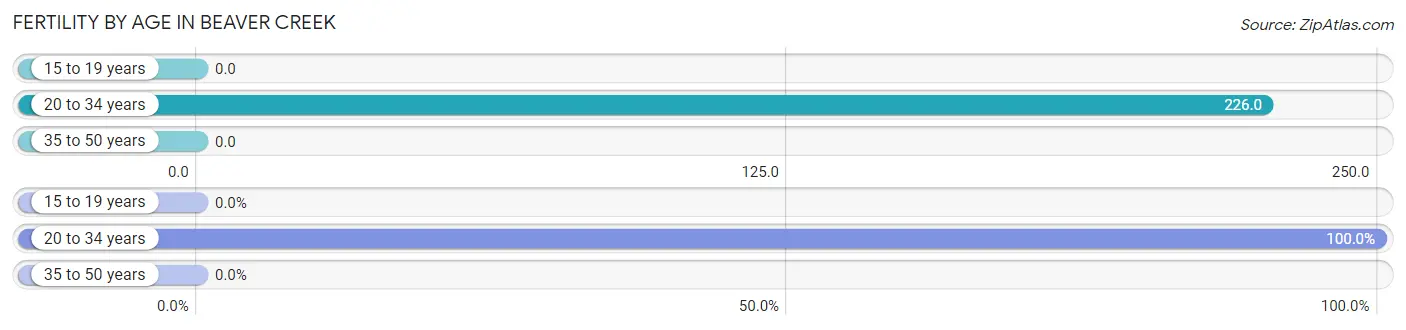
| Age Bracket | Women with Births | Births / 1,000 Women |
| 15 to 19 years | 0 (0.0%) | 0.0 |
| 20 to 34 years | 14 (100.0%) | 226.0 |
| 35 to 50 years | 0 (0.0%) | 0.0 |
| Total | 14 (100.0%) | 119.0 |
Fertility by Age by Marriage Status in Beaver Creek
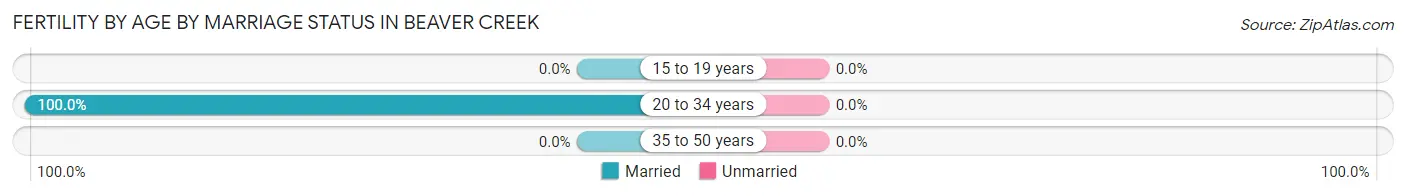
| Age Bracket | Married | Unmarried |
| 15 to 19 years | 0 (0.0%) | 0 (0.0%) |
| 20 to 34 years | 14 (100.0%) | 0 (0.0%) |
| 35 to 50 years | 0 (0.0%) | 0 (0.0%) |
| Total | 14 (100.0%) | 0 (0.0%) |
Fertility by Education in Beaver Creek
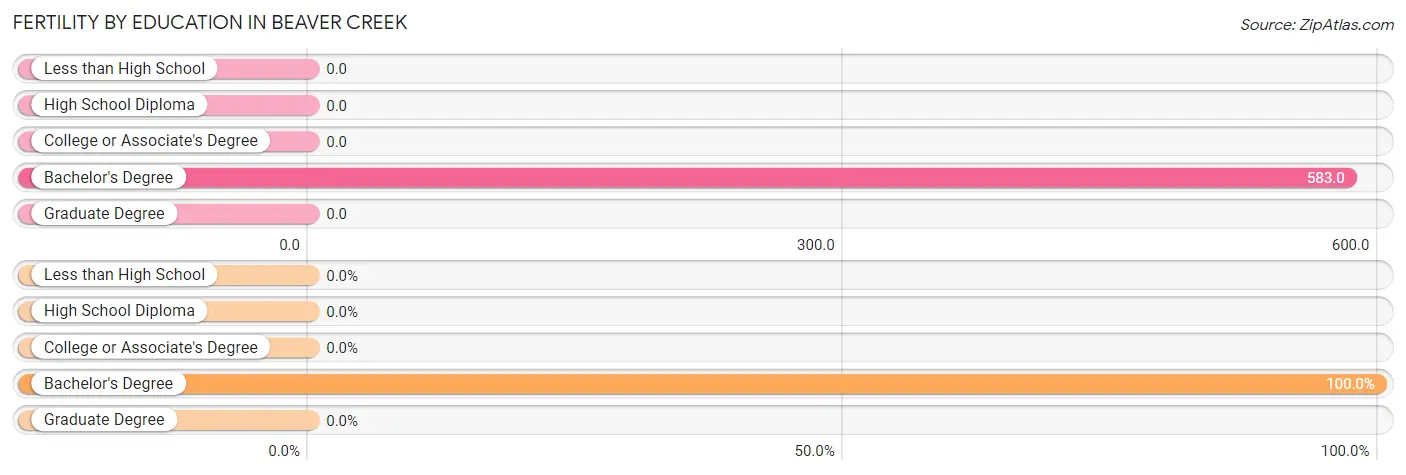
| Educational Attainment | Women with Births | Births / 1,000 Women |
| Less than High School | 0 (0.0%) | 0.0 |
| High School Diploma | 0 (0.0%) | 0.0 |
| College or Associate's Degree | 0 (0.0%) | 0.0 |
| Bachelor's Degree | 14 (100.0%) | 583.0 |
| Graduate Degree | 0 (0.0%) | 0.0 |
| Total | 14 (100.0%) | 119.0 |
Fertility by Education by Marriage Status in Beaver Creek
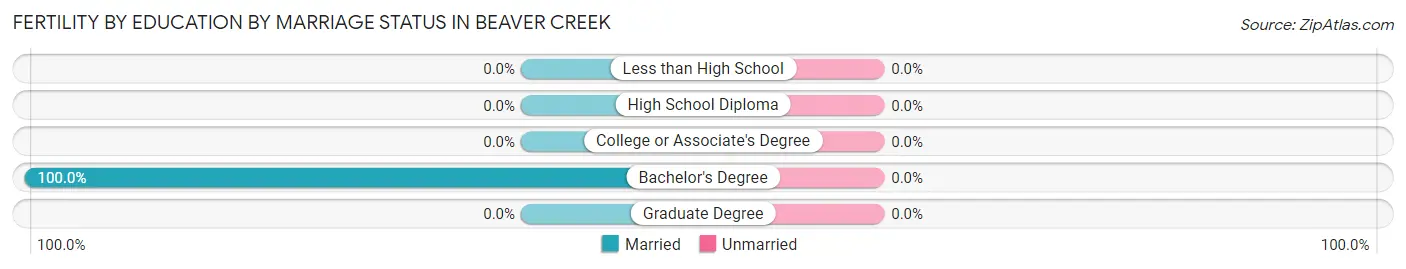
| Educational Attainment | Married | Unmarried |
| Less than High School | 0 (0.0%) | 0 (0.0%) |
| High School Diploma | 0 (0.0%) | 0 (0.0%) |
| College or Associate's Degree | 0 (0.0%) | 0 (0.0%) |
| Bachelor's Degree | 14 (100.0%) | 0 (0.0%) |
| Graduate Degree | 0 (0.0%) | 0 (0.0%) |
| Total | 14 (100.0%) | 0 (0.0%) |
Employment Characteristics in Beaver Creek
Employment by Class of Employer in Beaver Creek
Among the 209 employed individuals in Beaver Creek, private company employees (115 | 55.0%), self-employed (incorporated) (29 | 13.9%), and self-employed (not incorporated) (26 | 12.4%) make up the most common classes of employment.
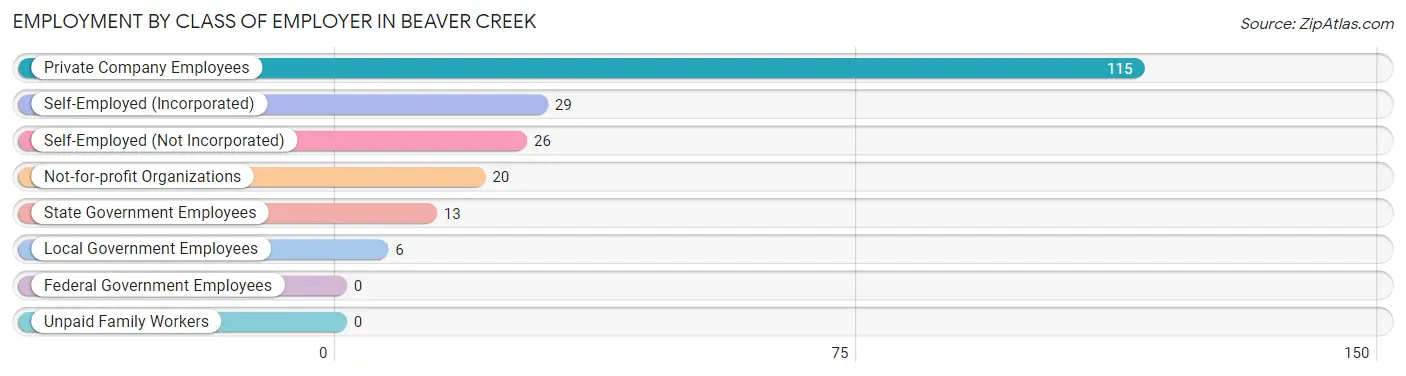
| Employer Class | # Employees | % Employees |
| Private Company Employees | 115 | 55.0% |
| Self-Employed (Incorporated) | 29 | 13.9% |
| Self-Employed (Not Incorporated) | 26 | 12.4% |
| Not-for-profit Organizations | 20 | 9.6% |
| Local Government Employees | 6 | 2.9% |
| State Government Employees | 13 | 6.2% |
| Federal Government Employees | 0 | 0.0% |
| Unpaid Family Workers | 0 | 0.0% |
| Total | 209 | 100.0% |
Employment Status by Age in Beaver Creek
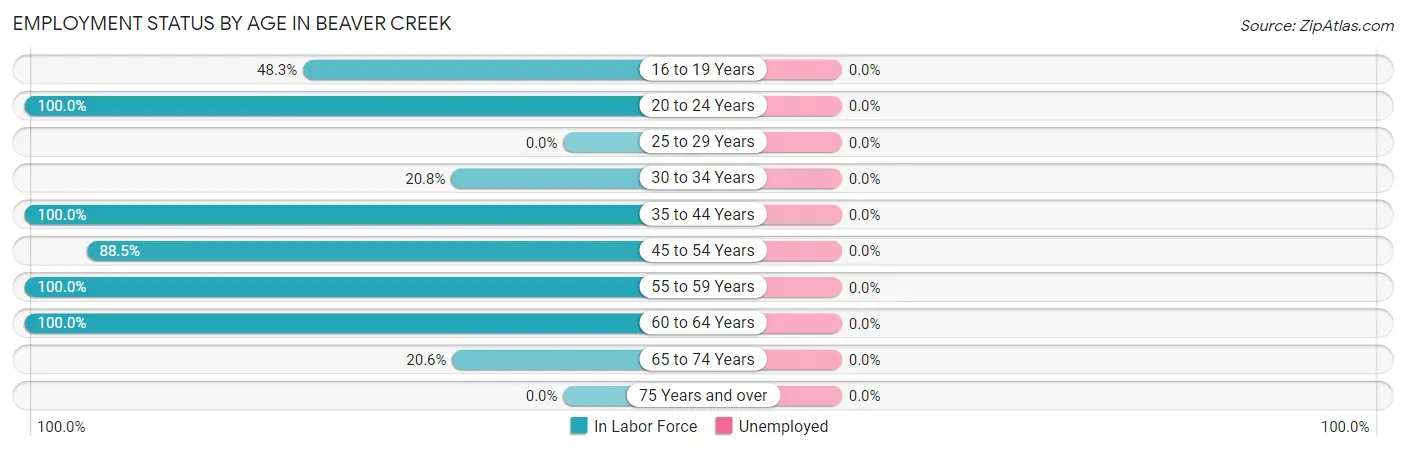
| Age Bracket | In Labor Force | Unemployed |
| 16 to 19 Years | 14 (48.3%) | 0 (0.0%) |
| 20 to 24 Years | 9 (100.0%) | 0 (0.0%) |
| 25 to 29 Years | 0 (0.0%) | 0 (0.0%) |
| 30 to 34 Years | 10 (20.8%) | 0 (0.0%) |
| 35 to 44 Years | 26 (100.0%) | 0 (0.0%) |
| 45 to 54 Years | 77 (88.5%) | 0 (0.0%) |
| 55 to 59 Years | 33 (100.0%) | 0 (0.0%) |
| 60 to 64 Years | 33 (100.0%) | 0 (0.0%) |
| 65 to 74 Years | 7 (20.6%) | 0 (0.0%) |
| 75 Years and over | 0 (0.0%) | 0 (0.0%) |
| Total | 209 (63.7%) | 0 (0.0%) |
Employment Status by Educational Attainment in Beaver Creek
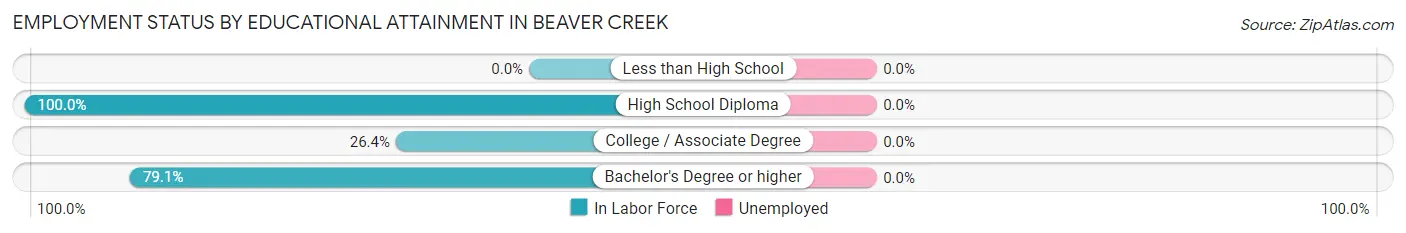
| Educational Attainment | In Labor Force | Unemployed |
| Less than High School | 0 (0.0%) | 0 (0.0%) |
| High School Diploma | 59 (100.0%) | 0 (0.0%) |
| College / Associate Degree | 14 (26.4%) | 0 (0.0%) |
| Bachelor's Degree or higher | 106 (79.1%) | 0 (0.0%) |
| Total | 179 (72.8%) | 0 (0.0%) |
Employment Occupations by Sex in Beaver Creek
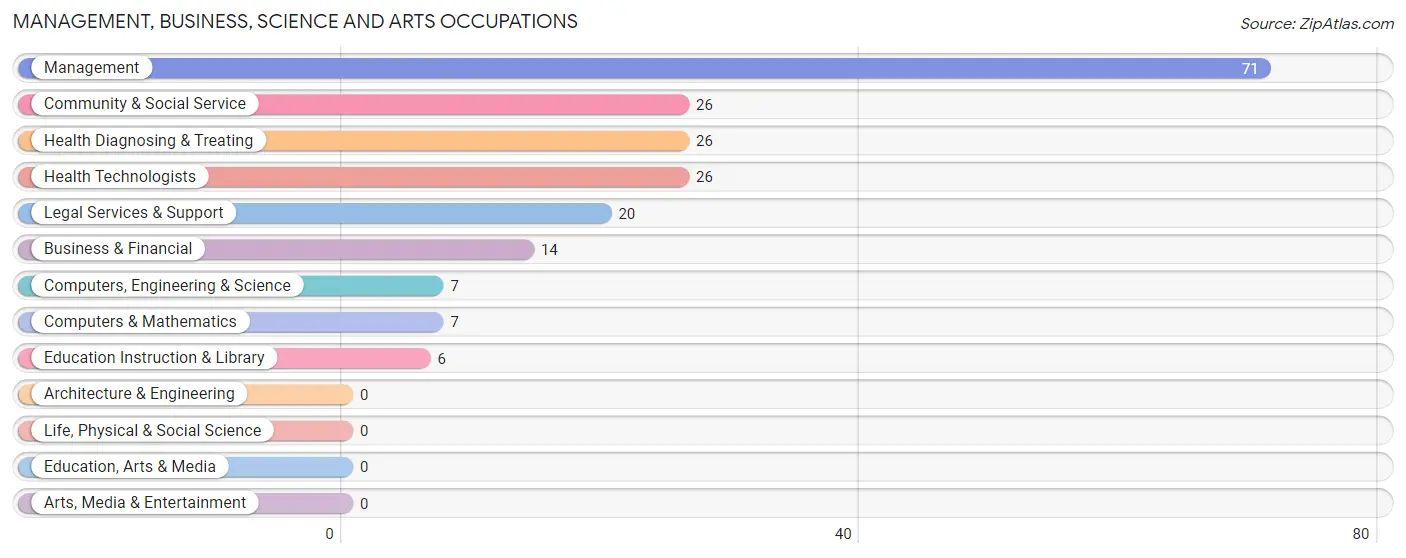
Management, Business, Science and Arts Occupations
The most common Management, Business, Science and Arts occupations in Beaver Creek are Management (71 | 34.0%), Community & Social Service (26 | 12.4%), Health Diagnosing & Treating (26 | 12.4%), Health Technologists (26 | 12.4%), and Legal Services & Support (20 | 9.6%).
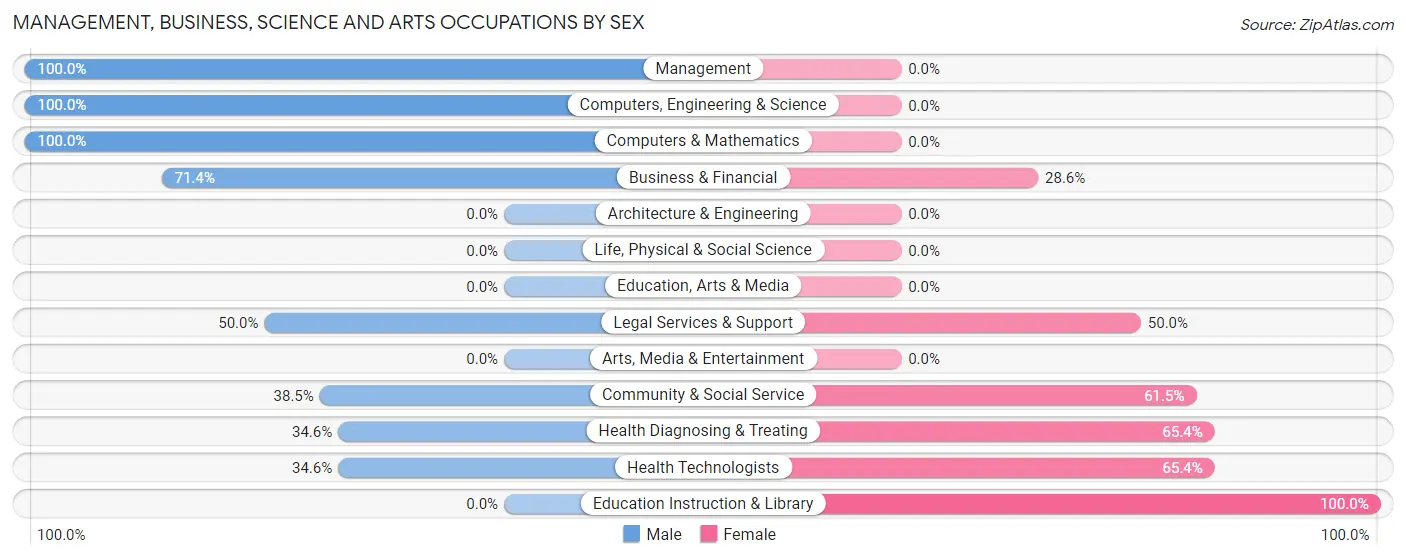
Management, Business, Science and Arts Occupations by Sex
Within the Management, Business, Science and Arts occupations in Beaver Creek, the most male-oriented occupations are Management (100.0%), Computers, Engineering & Science (100.0%), and Computers & Mathematics (100.0%), while the most female-oriented occupations are Education Instruction & Library (100.0%), Health Diagnosing & Treating (65.4%), and Health Technologists (65.4%).
| Occupation | Male | Female |
| Management | 71 (100.0%) | 0 (0.0%) |
| Business & Financial | 10 (71.4%) | 4 (28.6%) |
| Computers, Engineering & Science | 7 (100.0%) | 0 (0.0%) |
| Computers & Mathematics | 7 (100.0%) | 0 (0.0%) |
| Architecture & Engineering | 0 (0.0%) | 0 (0.0%) |
| Life, Physical & Social Science | 0 (0.0%) | 0 (0.0%) |
| Community & Social Service | 10 (38.5%) | 16 (61.5%) |
| Education, Arts & Media | 0 (0.0%) | 0 (0.0%) |
| Legal Services & Support | 10 (50.0%) | 10 (50.0%) |
| Education Instruction & Library | 0 (0.0%) | 6 (100.0%) |
| Arts, Media & Entertainment | 0 (0.0%) | 0 (0.0%) |
| Health Diagnosing & Treating | 9 (34.6%) | 17 (65.4%) |
| Health Technologists | 9 (34.6%) | 17 (65.4%) |
| Total (Category) | 107 (74.3%) | 37 (25.7%) |
| Total (Overall) | 112 (53.6%) | 97 (46.4%) |
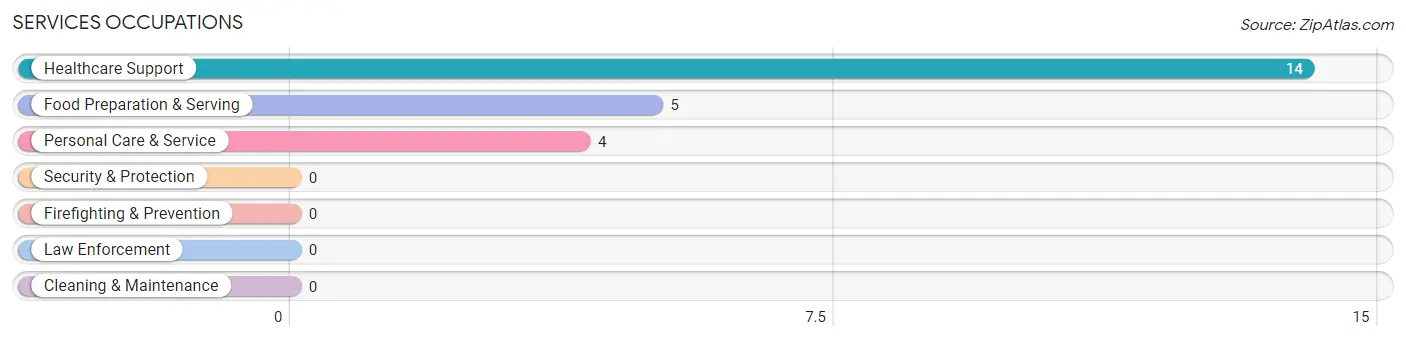
Services Occupations
The most common Services occupations in Beaver Creek are Healthcare Support (14 | 6.7%), Food Preparation & Serving (5 | 2.4%), and Personal Care & Service (4 | 1.9%).
Services Occupations by Sex
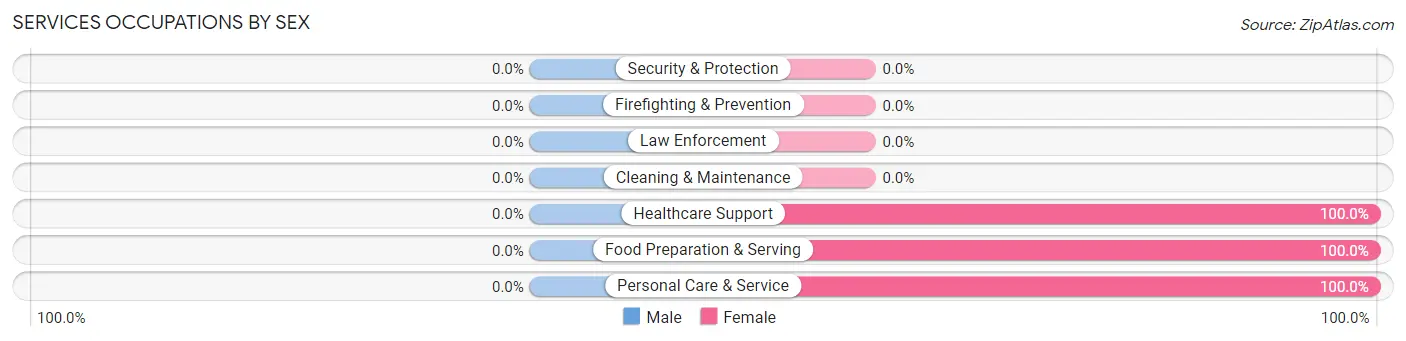
| Occupation | Male | Female |
| Healthcare Support | 0 (0.0%) | 14 (100.0%) |
| Security & Protection | 0 (0.0%) | 0 (0.0%) |
| Firefighting & Prevention | 0 (0.0%) | 0 (0.0%) |
| Law Enforcement | 0 (0.0%) | 0 (0.0%) |
| Food Preparation & Serving | 0 (0.0%) | 5 (100.0%) |
| Cleaning & Maintenance | 0 (0.0%) | 0 (0.0%) |
| Personal Care & Service | 0 (0.0%) | 4 (100.0%) |
| Total (Category) | 0 (0.0%) | 23 (100.0%) |
| Total (Overall) | 112 (53.6%) | 97 (46.4%) |
Sales and Office Occupations
The most common Sales and Office occupations in Beaver Creek are , and Office & Administration (14 | 6.7%).
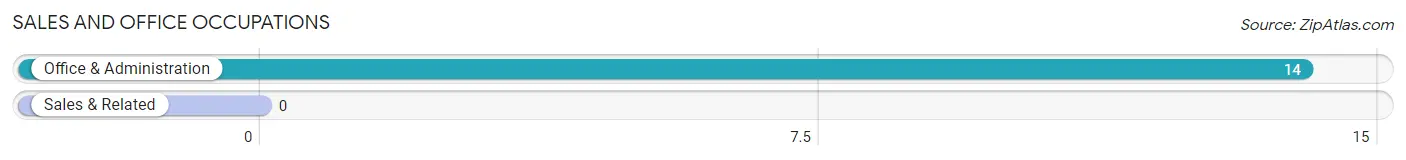
Sales and Office Occupations by Sex

| Occupation | Male | Female |
| Sales & Related | 0 (0.0%) | 0 (0.0%) |
| Office & Administration | 0 (0.0%) | 14 (100.0%) |
| Total (Category) | 0 (0.0%) | 14 (100.0%) |
| Total (Overall) | 112 (53.6%) | 97 (46.4%) |
Natural Resources, Construction and Maintenance Occupations
The most common Natural Resources, Construction and Maintenance occupations in Beaver Creek are , and Installation, Maintenance & Repair (5 | 2.4%).
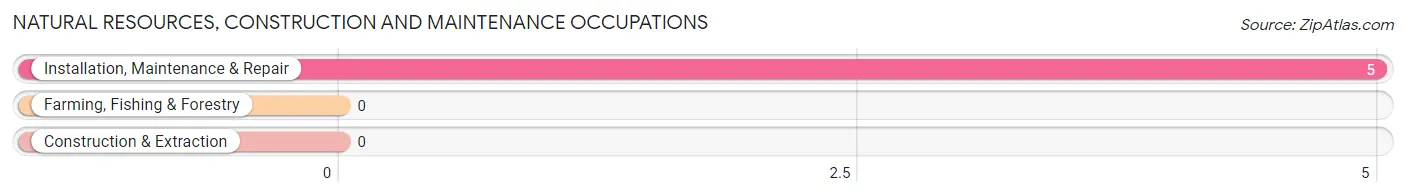
Natural Resources, Construction and Maintenance Occupations by Sex
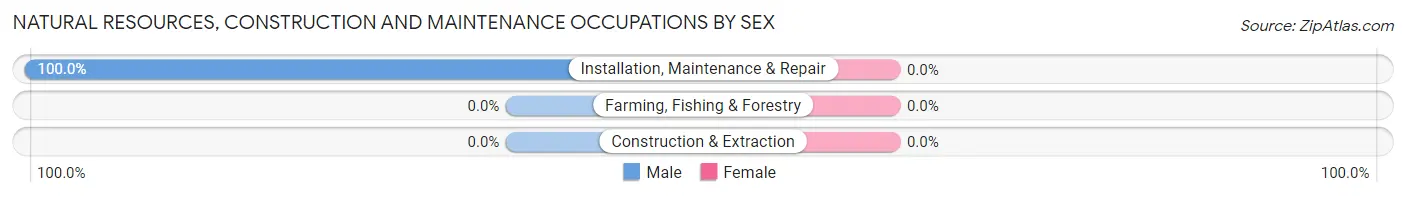
| Occupation | Male | Female |
| Farming, Fishing & Forestry | 0 (0.0%) | 0 (0.0%) |
| Construction & Extraction | 0 (0.0%) | 0 (0.0%) |
| Installation, Maintenance & Repair | 5 (100.0%) | 0 (0.0%) |
| Total (Category) | 5 (100.0%) | 0 (0.0%) |
| Total (Overall) | 112 (53.6%) | 97 (46.4%) |
Production, Transportation and Moving Occupations
The most common Production, Transportation and Moving occupations in Beaver Creek are , and Transportation (23 | 11.0%).
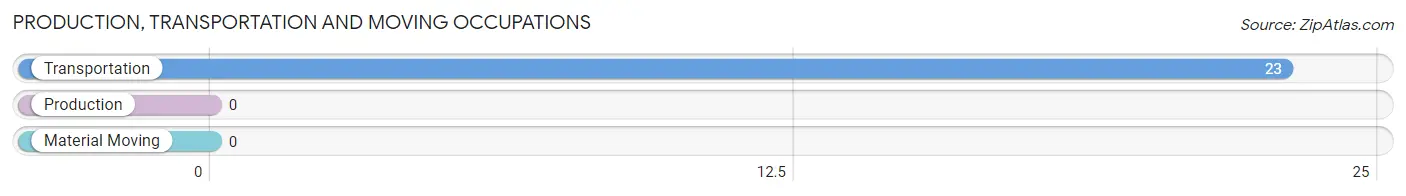
Production, Transportation and Moving Occupations by Sex
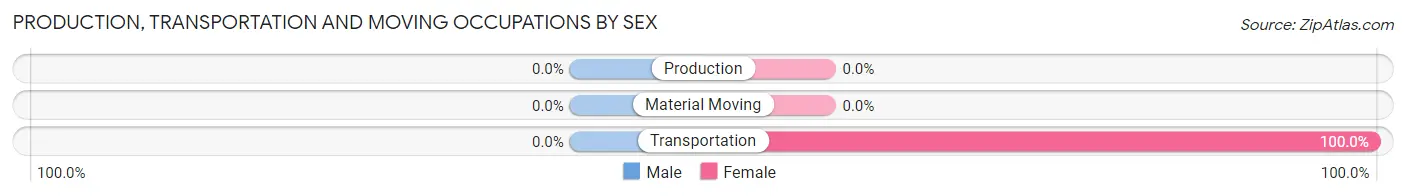
| Occupation | Male | Female |
| Production | 0 (0.0%) | 0 (0.0%) |
| Transportation | 0 (0.0%) | 23 (100.0%) |
| Material Moving | 0 (0.0%) | 0 (0.0%) |
| Total (Category) | 0 (0.0%) | 23 (100.0%) |
| Total (Overall) | 112 (53.6%) | 97 (46.4%) |
Employment Industries by Sex in Beaver Creek
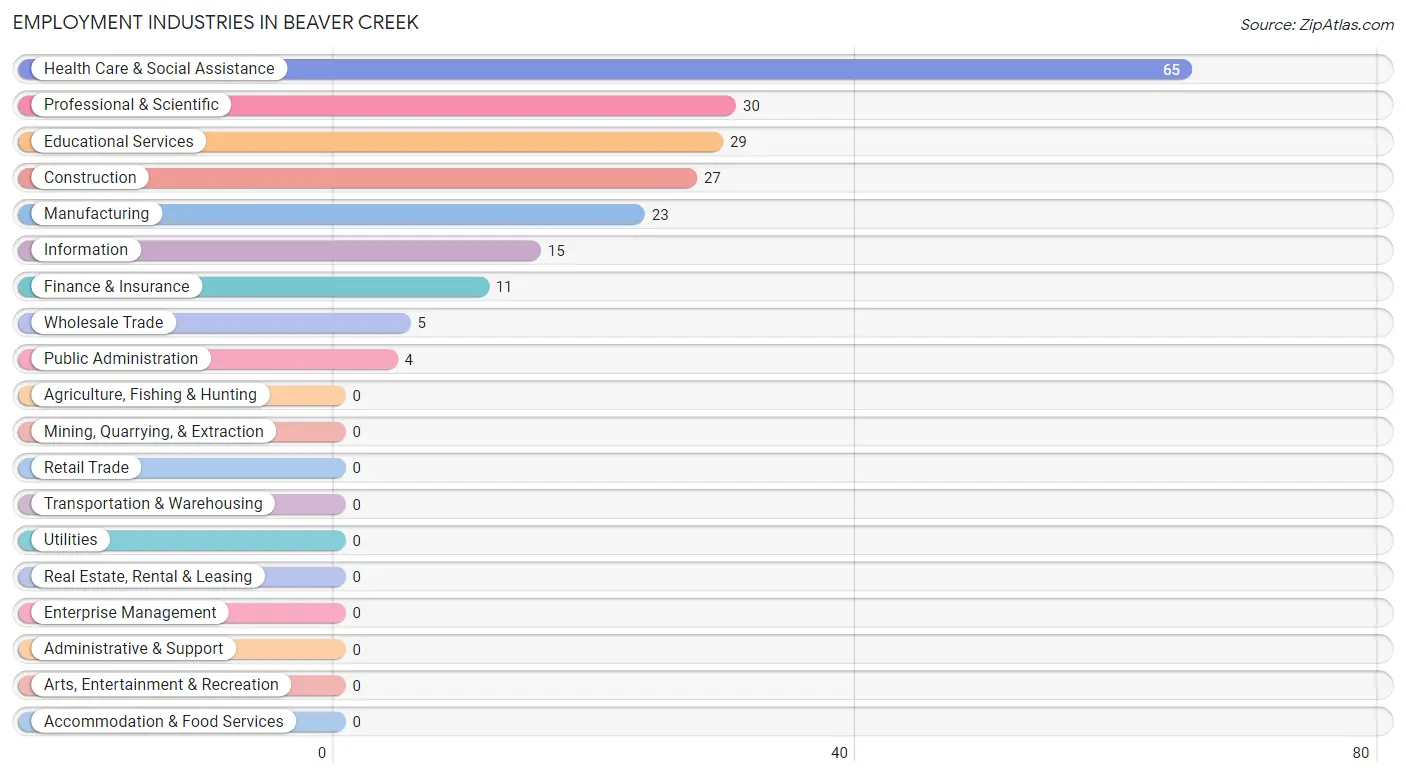
Employment Industries in Beaver Creek
The major employment industries in Beaver Creek include Health Care & Social Assistance (65 | 31.1%), Professional & Scientific (30 | 14.3%), Educational Services (29 | 13.9%), Construction (27 | 12.9%), and Manufacturing (23 | 11.0%).
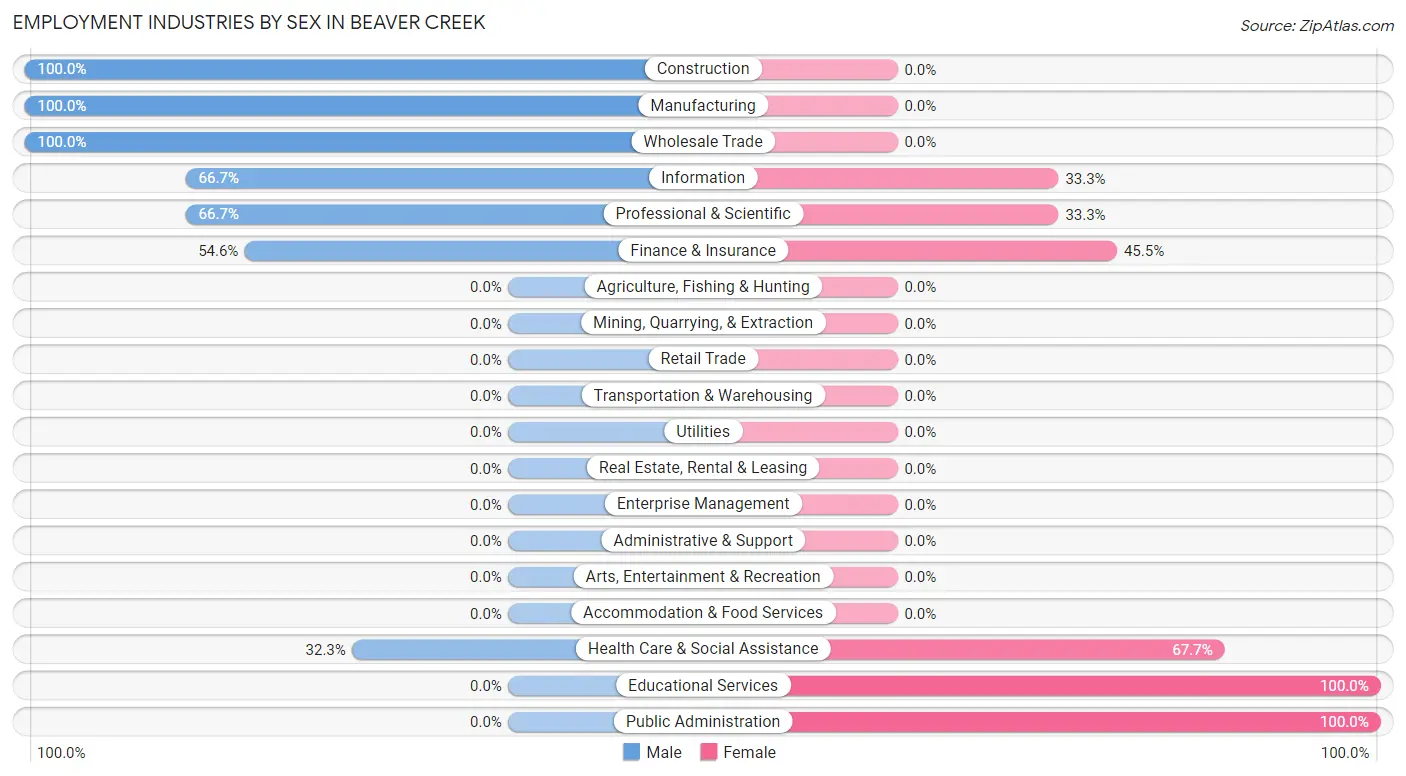
Employment Industries by Sex in Beaver Creek
The Beaver Creek industries that see more men than women are Construction (100.0%), Manufacturing (100.0%), and Wholesale Trade (100.0%), whereas the industries that tend to have a higher number of women are Educational Services (100.0%), Public Administration (100.0%), and Health Care & Social Assistance (67.7%).
| Industry | Male | Female |
| Agriculture, Fishing & Hunting | 0 (0.0%) | 0 (0.0%) |
| Mining, Quarrying, & Extraction | 0 (0.0%) | 0 (0.0%) |
| Construction | 27 (100.0%) | 0 (0.0%) |
| Manufacturing | 23 (100.0%) | 0 (0.0%) |
| Wholesale Trade | 5 (100.0%) | 0 (0.0%) |
| Retail Trade | 0 (0.0%) | 0 (0.0%) |
| Transportation & Warehousing | 0 (0.0%) | 0 (0.0%) |
| Utilities | 0 (0.0%) | 0 (0.0%) |
| Information | 10 (66.7%) | 5 (33.3%) |
| Finance & Insurance | 6 (54.5%) | 5 (45.5%) |
| Real Estate, Rental & Leasing | 0 (0.0%) | 0 (0.0%) |
| Professional & Scientific | 20 (66.7%) | 10 (33.3%) |
| Enterprise Management | 0 (0.0%) | 0 (0.0%) |
| Administrative & Support | 0 (0.0%) | 0 (0.0%) |
| Educational Services | 0 (0.0%) | 29 (100.0%) |
| Health Care & Social Assistance | 21 (32.3%) | 44 (67.7%) |
| Arts, Entertainment & Recreation | 0 (0.0%) | 0 (0.0%) |
| Accommodation & Food Services | 0 (0.0%) | 0 (0.0%) |
| Public Administration | 0 (0.0%) | 4 (100.0%) |
| Total | 112 (53.6%) | 97 (46.4%) |
Education in Beaver Creek
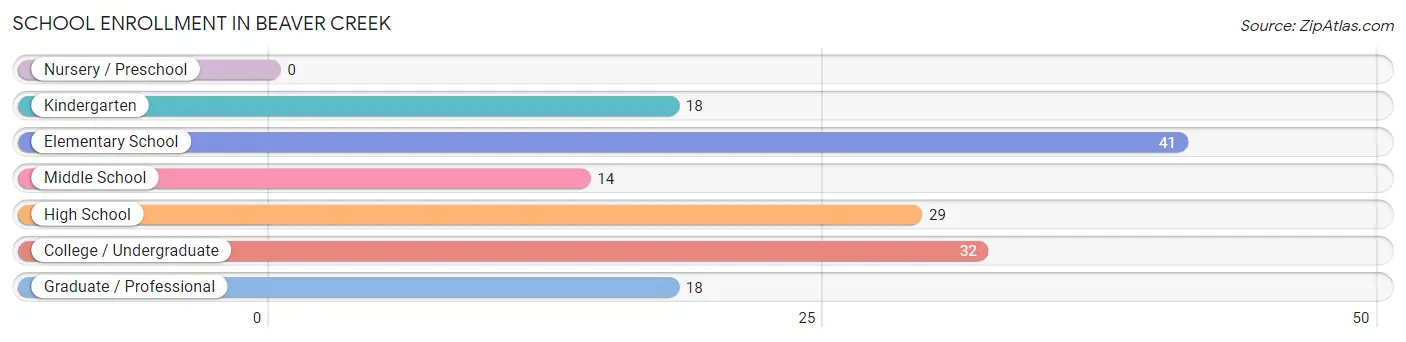
School Enrollment in Beaver Creek
The most common levels of schooling among the 152 students in Beaver Creek are elementary school (41 | 27.0%), college / undergraduate (32 | 21.0%), and high school (29 | 19.1%).
| School Level | # Students | % Students |
| Nursery / Preschool | 0 | 0.0% |
| Kindergarten | 18 | 11.8% |
| Elementary School | 41 | 27.0% |
| Middle School | 14 | 9.2% |
| High School | 29 | 19.1% |
| College / Undergraduate | 32 | 21.0% |
| Graduate / Professional | 18 | 11.8% |
| Total | 152 | 100.0% |
School Enrollment by Age by Funding Source in Beaver Creek
Out of a total of 152 students who are enrolled in schools in Beaver Creek, 4 (2.6%) attend a private institution, while the remaining 148 (97.4%) are enrolled in public schools. The age group of 35 years and over has the highest likelihood of being enrolled in private schools, with 4 (22.2% in the age bracket) enrolled. Conversely, the age group of 5 to 9 year old has the lowest likelihood of being enrolled in a private school, with 35 (100.0% in the age bracket) attending a public institution.
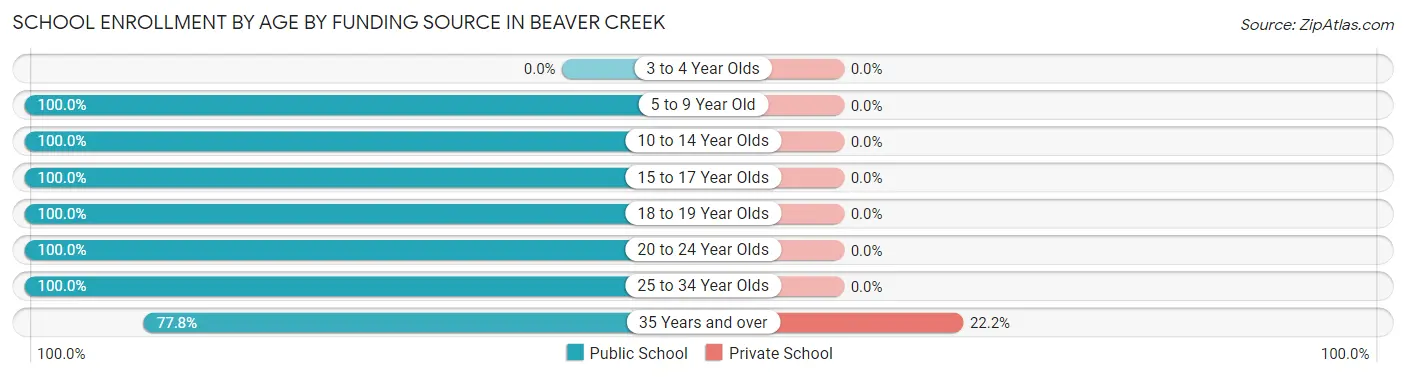
| Age Bracket | Public School | Private School |
| 3 to 4 Year Olds | 0 (0.0%) | 0 (0.0%) |
| 5 to 9 Year Old | 35 (100.0%) | 0 (0.0%) |
| 10 to 14 Year Olds | 38 (100.0%) | 0 (0.0%) |
| 15 to 17 Year Olds | 24 (100.0%) | 0 (0.0%) |
| 18 to 19 Year Olds | 5 (100.0%) | 0 (0.0%) |
| 20 to 24 Year Olds | 9 (100.0%) | 0 (0.0%) |
| 25 to 34 Year Olds | 23 (100.0%) | 0 (0.0%) |
| 35 Years and over | 14 (77.8%) | 4 (22.2%) |
| Total | 148 (97.4%) | 4 (2.6%) |
Educational Attainment by Field of Study in Beaver Creek
Engineering (47 | 27.7%), bio, nature & agricultural (34 | 20.0%), business (20 | 11.8%), liberal arts & history (20 | 11.8%), and science & technology (17 | 10.0%) are the most common fields of study among 170 individuals in Beaver Creek who have obtained a bachelor's degree or higher.
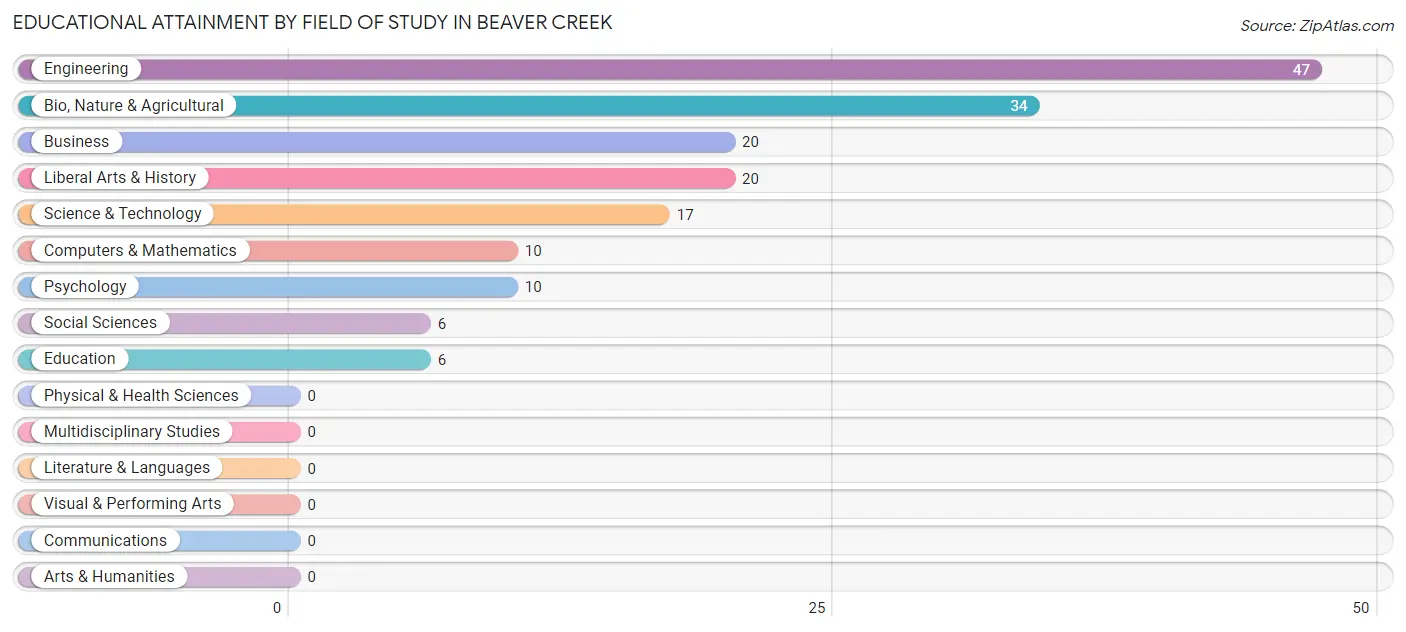
| Field of Study | # Graduates | % Graduates |
| Computers & Mathematics | 10 | 5.9% |
| Bio, Nature & Agricultural | 34 | 20.0% |
| Physical & Health Sciences | 0 | 0.0% |
| Psychology | 10 | 5.9% |
| Social Sciences | 6 | 3.5% |
| Engineering | 47 | 27.7% |
| Multidisciplinary Studies | 0 | 0.0% |
| Science & Technology | 17 | 10.0% |
| Business | 20 | 11.8% |
| Education | 6 | 3.5% |
| Literature & Languages | 0 | 0.0% |
| Liberal Arts & History | 20 | 11.8% |
| Visual & Performing Arts | 0 | 0.0% |
| Communications | 0 | 0.0% |
| Arts & Humanities | 0 | 0.0% |
| Total | 170 | 100.0% |
Transportation & Commute in Beaver Creek
Vehicle Availability by Sex in Beaver Creek
The most prevalent vehicle ownership categories in Beaver Creek are males with 4 vehicles (44, accounting for 39.3%) and females with 4 vehicles (38, making up 45.4%).
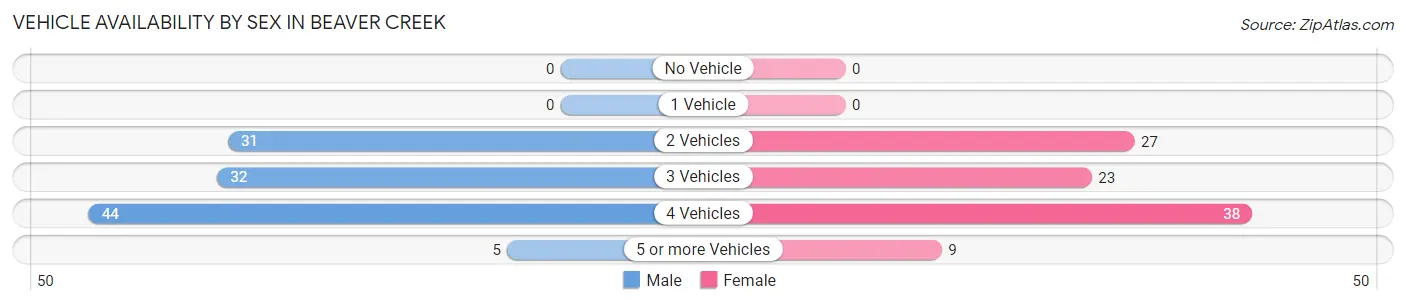
| Vehicles Available | Male | Female |
| No Vehicle | 0 (0.0%) | 0 (0.0%) |
| 1 Vehicle | 0 (0.0%) | 0 (0.0%) |
| 2 Vehicles | 31 (27.7%) | 27 (27.8%) |
| 3 Vehicles | 32 (28.6%) | 23 (23.7%) |
| 4 Vehicles | 44 (39.3%) | 38 (39.2%) |
| 5 or more Vehicles | 5 (4.5%) | 9 (9.3%) |
| Total | 112 (100.0%) | 97 (100.0%) |
Commute Time in Beaver Creek
The most frequently occuring commute durations in Beaver Creek are 15 to 19 minutes (69 commuters, 33.7%), 90 or more minutes (24 commuters, 11.7%), and 35 to 39 minutes (23 commuters, 11.2%).
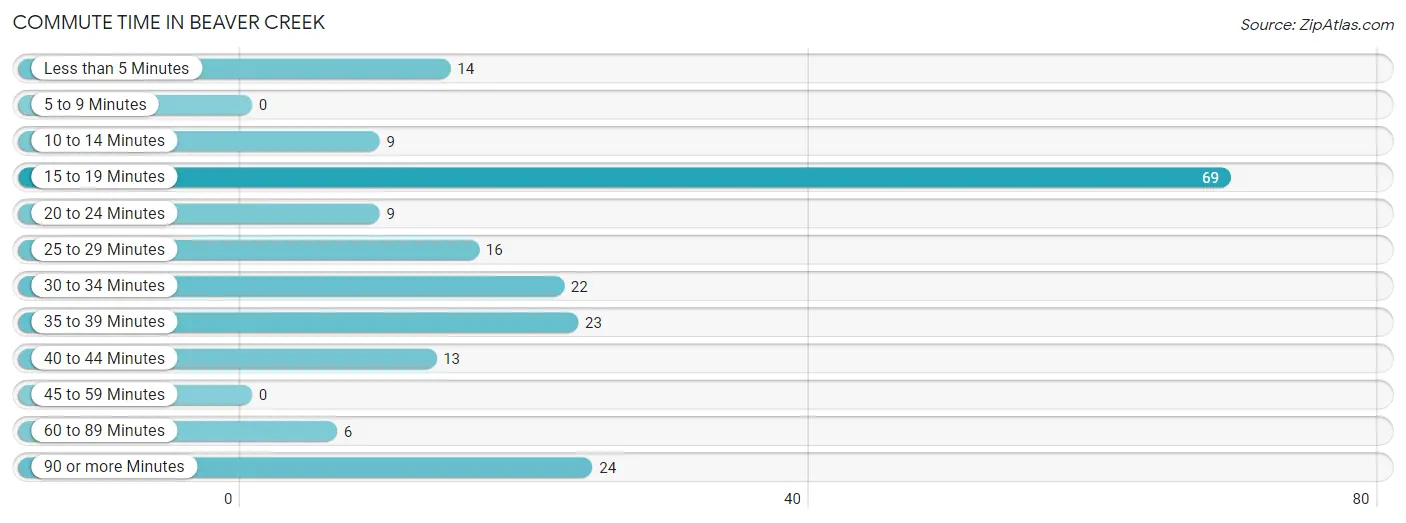
| Commute Time | # Commuters | % Commuters |
| Less than 5 Minutes | 14 | 6.8% |
| 5 to 9 Minutes | 0 | 0.0% |
| 10 to 14 Minutes | 9 | 4.4% |
| 15 to 19 Minutes | 69 | 33.7% |
| 20 to 24 Minutes | 9 | 4.4% |
| 25 to 29 Minutes | 16 | 7.8% |
| 30 to 34 Minutes | 22 | 10.7% |
| 35 to 39 Minutes | 23 | 11.2% |
| 40 to 44 Minutes | 13 | 6.3% |
| 45 to 59 Minutes | 0 | 0.0% |
| 60 to 89 Minutes | 6 | 2.9% |
| 90 or more Minutes | 24 | 11.7% |
Commute Time by Sex in Beaver Creek
The most common commute times in Beaver Creek are 90 or more minutes (24 commuters, 21.4%) for males and 15 to 19 minutes (49 commuters, 52.7%) for females.
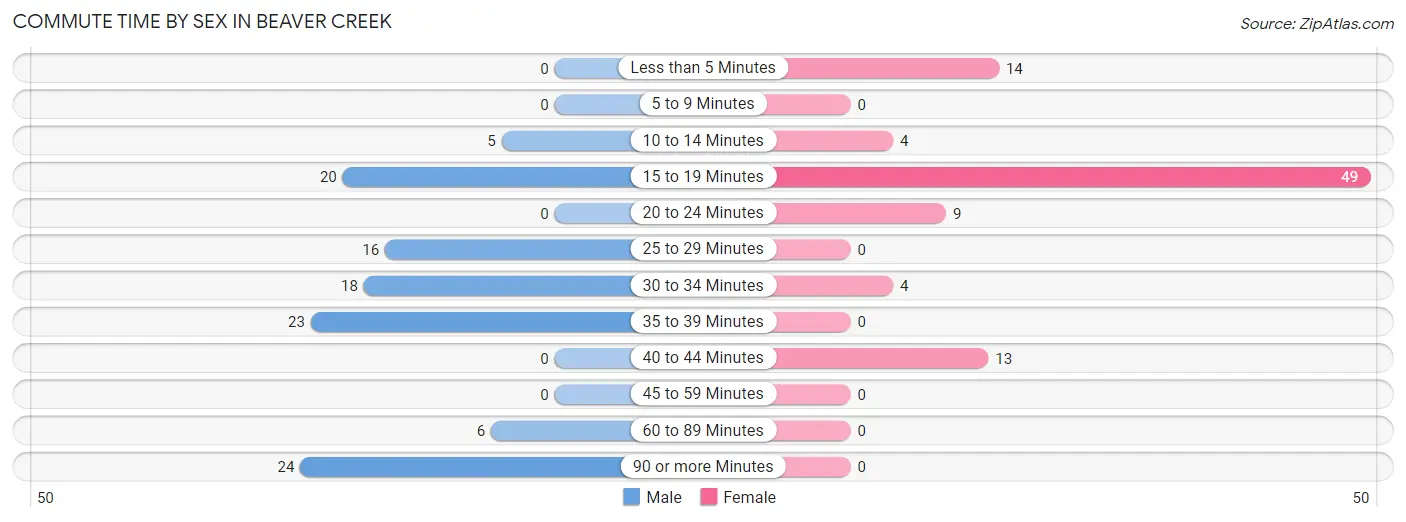
| Commute Time | Male | Female |
| Less than 5 Minutes | 0 (0.0%) | 14 (15.0%) |
| 5 to 9 Minutes | 0 (0.0%) | 0 (0.0%) |
| 10 to 14 Minutes | 5 (4.5%) | 4 (4.3%) |
| 15 to 19 Minutes | 20 (17.9%) | 49 (52.7%) |
| 20 to 24 Minutes | 0 (0.0%) | 9 (9.7%) |
| 25 to 29 Minutes | 16 (14.3%) | 0 (0.0%) |
| 30 to 34 Minutes | 18 (16.1%) | 4 (4.3%) |
| 35 to 39 Minutes | 23 (20.5%) | 0 (0.0%) |
| 40 to 44 Minutes | 0 (0.0%) | 13 (14.0%) |
| 45 to 59 Minutes | 0 (0.0%) | 0 (0.0%) |
| 60 to 89 Minutes | 6 (5.4%) | 0 (0.0%) |
| 90 or more Minutes | 24 (21.4%) | 0 (0.0%) |
Time of Departure to Work by Sex in Beaver Creek
The most frequent times of departure to work in Beaver Creek are 7:30 AM to 7:59 AM (28, 25.0%) for males and 7:30 AM to 7:59 AM (31, 33.3%) for females.
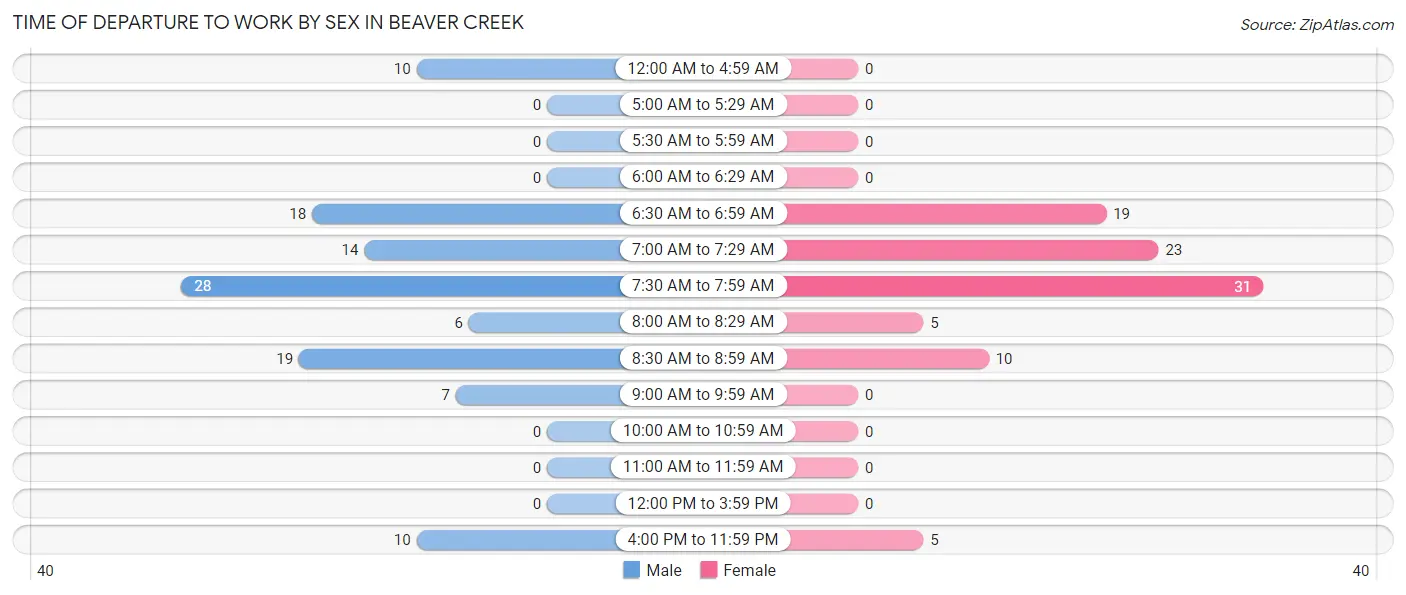
| Time of Departure | Male | Female |
| 12:00 AM to 4:59 AM | 10 (8.9%) | 0 (0.0%) |
| 5:00 AM to 5:29 AM | 0 (0.0%) | 0 (0.0%) |
| 5:30 AM to 5:59 AM | 0 (0.0%) | 0 (0.0%) |
| 6:00 AM to 6:29 AM | 0 (0.0%) | 0 (0.0%) |
| 6:30 AM to 6:59 AM | 18 (16.1%) | 19 (20.4%) |
| 7:00 AM to 7:29 AM | 14 (12.5%) | 23 (24.7%) |
| 7:30 AM to 7:59 AM | 28 (25.0%) | 31 (33.3%) |
| 8:00 AM to 8:29 AM | 6 (5.4%) | 5 (5.4%) |
| 8:30 AM to 8:59 AM | 19 (17.0%) | 10 (10.7%) |
| 9:00 AM to 9:59 AM | 7 (6.2%) | 0 (0.0%) |
| 10:00 AM to 10:59 AM | 0 (0.0%) | 0 (0.0%) |
| 11:00 AM to 11:59 AM | 0 (0.0%) | 0 (0.0%) |
| 12:00 PM to 3:59 PM | 0 (0.0%) | 0 (0.0%) |
| 4:00 PM to 11:59 PM | 10 (8.9%) | 5 (5.4%) |
| Total | 112 (100.0%) | 93 (100.0%) |
Housing Occupancy in Beaver Creek
Occupancy by Ownership in Beaver Creek
Of the total 142 dwellings in Beaver Creek, owner-occupied units account for 132 (93.0%), while renter-occupied units make up 10 (7.0%).
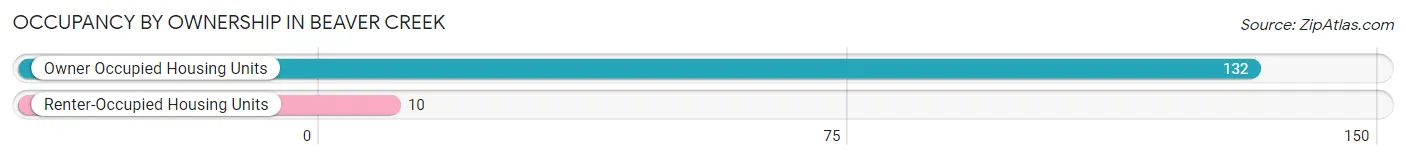
| Occupancy | # Housing Units | % Housing Units |
| Owner Occupied Housing Units | 132 | 93.0% |
| Renter-Occupied Housing Units | 10 | 7.0% |
| Total Occupied Housing Units | 142 | 100.0% |
Occupancy by Household Size in Beaver Creek
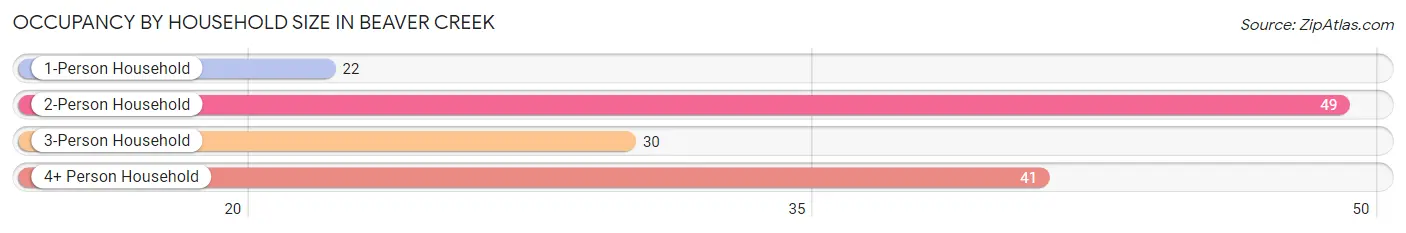
| Household Size | # Housing Units | % Housing Units |
| 1-Person Household | 22 | 15.5% |
| 2-Person Household | 49 | 34.5% |
| 3-Person Household | 30 | 21.1% |
| 4+ Person Household | 41 | 28.9% |
| Total Housing Units | 142 | 100.0% |
Occupancy by Ownership by Household Size in Beaver Creek
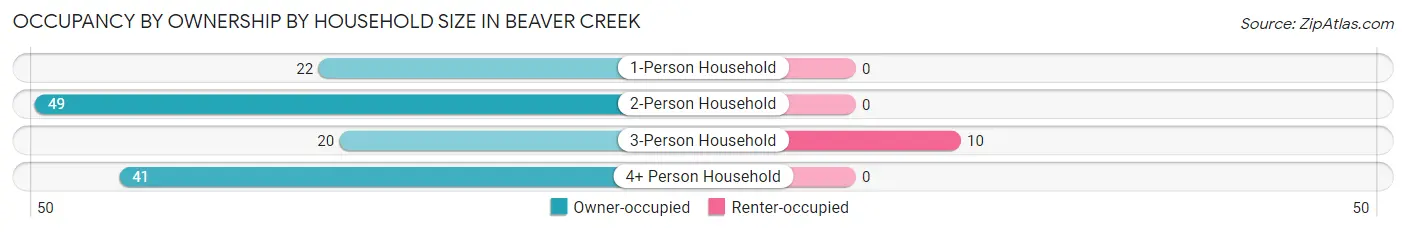
| Household Size | Owner-occupied | Renter-occupied |
| 1-Person Household | 22 (100.0%) | 0 (0.0%) |
| 2-Person Household | 49 (100.0%) | 0 (0.0%) |
| 3-Person Household | 20 (66.7%) | 10 (33.3%) |
| 4+ Person Household | 41 (100.0%) | 0 (0.0%) |
| Total Housing Units | 132 (93.0%) | 10 (7.0%) |
Occupancy by Educational Attainment in Beaver Creek
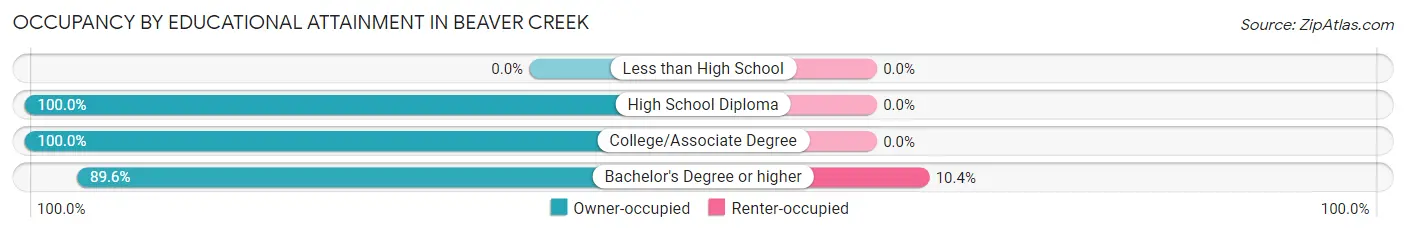
| Household Size | Owner-occupied | Renter-occupied |
| Less than High School | 0 (0.0%) | 0 (0.0%) |
| High School Diploma | 28 (100.0%) | 0 (0.0%) |
| College/Associate Degree | 18 (100.0%) | 0 (0.0%) |
| Bachelor's Degree or higher | 86 (89.6%) | 10 (10.4%) |
Occupancy by Age of Householder in Beaver Creek
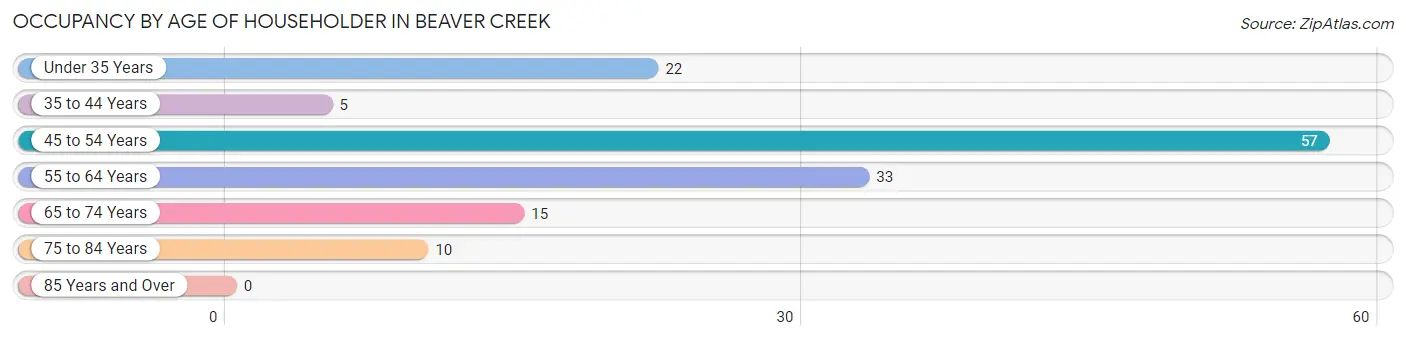
| Age Bracket | # Households | % Households |
| Under 35 Years | 22 | 15.5% |
| 35 to 44 Years | 5 | 3.5% |
| 45 to 54 Years | 57 | 40.1% |
| 55 to 64 Years | 33 | 23.2% |
| 65 to 74 Years | 15 | 10.6% |
| 75 to 84 Years | 10 | 7.0% |
| 85 Years and Over | 0 | 0.0% |
| Total | 142 | 100.0% |
Housing Finances in Beaver Creek
Median Income by Occupancy in Beaver Creek
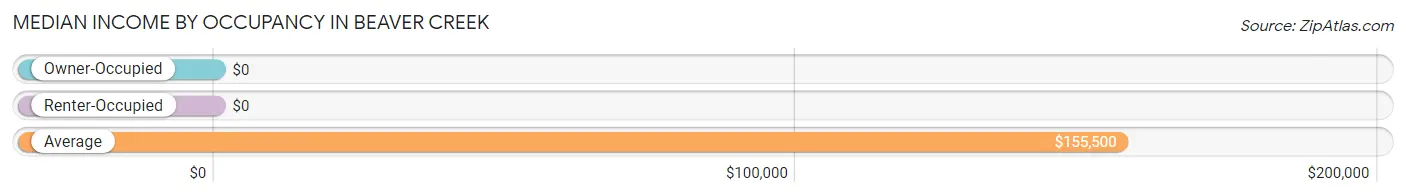
| Occupancy Type | # Households | Median Income |
| Owner-Occupied | 132 (93.0%) | $0 |
| Renter-Occupied | 10 (7.0%) | $0 |
| Average | 142 (100.0%) | $155,500 |
Occupancy by Householder Income Bracket in Beaver Creek
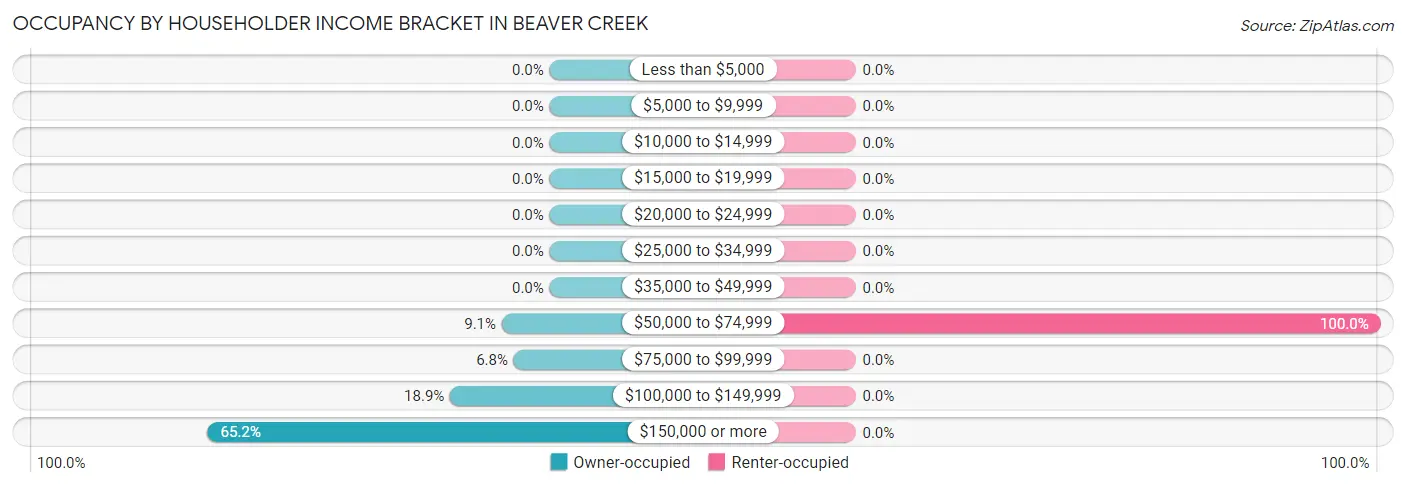
| Income Bracket | Owner-occupied | Renter-occupied |
| Less than $5,000 | 0 (0.0%) | 0 (0.0%) |
| $5,000 to $9,999 | 0 (0.0%) | 0 (0.0%) |
| $10,000 to $14,999 | 0 (0.0%) | 0 (0.0%) |
| $15,000 to $19,999 | 0 (0.0%) | 0 (0.0%) |
| $20,000 to $24,999 | 0 (0.0%) | 0 (0.0%) |
| $25,000 to $34,999 | 0 (0.0%) | 0 (0.0%) |
| $35,000 to $49,999 | 0 (0.0%) | 0 (0.0%) |
| $50,000 to $74,999 | 12 (9.1%) | 10 (100.0%) |
| $75,000 to $99,999 | 9 (6.8%) | 0 (0.0%) |
| $100,000 to $149,999 | 25 (18.9%) | 0 (0.0%) |
| $150,000 or more | 86 (65.1%) | 0 (0.0%) |
| Total | 132 (100.0%) | 10 (100.0%) |
Monthly Housing Cost Tiers in Beaver Creek
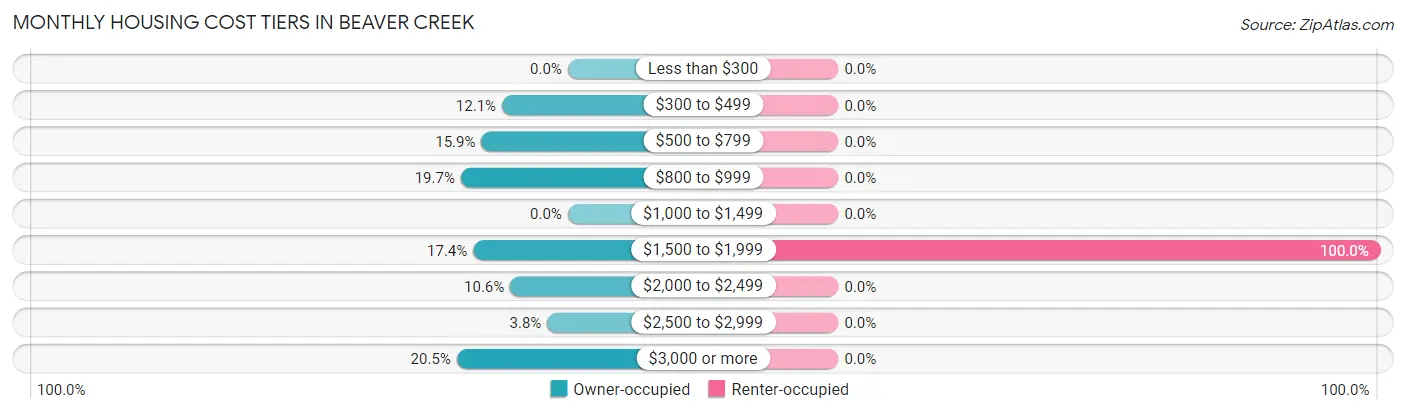
| Monthly Cost | Owner-occupied | Renter-occupied |
| Less than $300 | 0 (0.0%) | 0 (0.0%) |
| $300 to $499 | 16 (12.1%) | 0 (0.0%) |
| $500 to $799 | 21 (15.9%) | 0 (0.0%) |
| $800 to $999 | 26 (19.7%) | 0 (0.0%) |
| $1,000 to $1,499 | 0 (0.0%) | 0 (0.0%) |
| $1,500 to $1,999 | 23 (17.4%) | 10 (100.0%) |
| $2,000 to $2,499 | 14 (10.6%) | 0 (0.0%) |
| $2,500 to $2,999 | 5 (3.8%) | 0 (0.0%) |
| $3,000 or more | 27 (20.4%) | 0 (0.0%) |
| Total | 132 (100.0%) | 10 (100.0%) |
Physical Housing Characteristics in Beaver Creek
Housing Structures in Beaver Creek
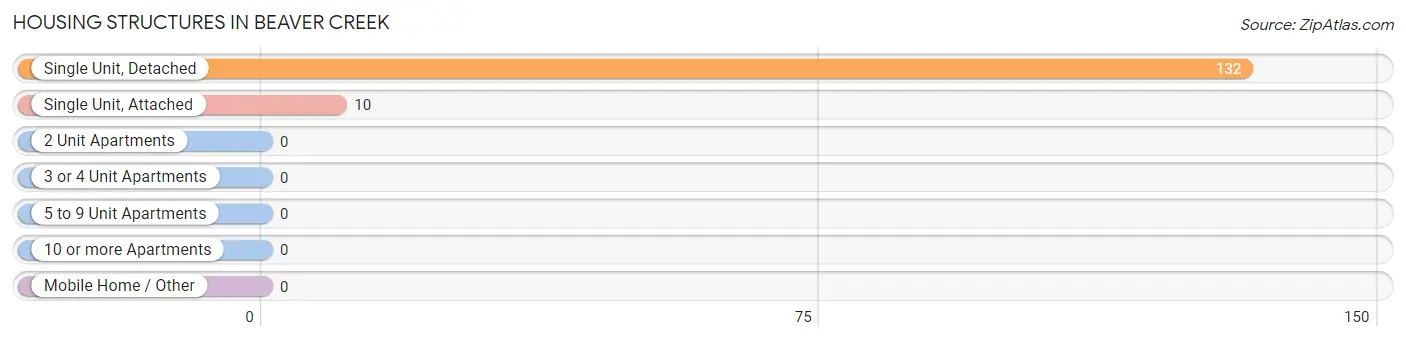
| Structure Type | # Housing Units | % Housing Units |
| Single Unit, Detached | 132 | 93.0% |
| Single Unit, Attached | 10 | 7.0% |
| 2 Unit Apartments | 0 | 0.0% |
| 3 or 4 Unit Apartments | 0 | 0.0% |
| 5 to 9 Unit Apartments | 0 | 0.0% |
| 10 or more Apartments | 0 | 0.0% |
| Mobile Home / Other | 0 | 0.0% |
| Total | 142 | 100.0% |
Housing Structures by Occupancy in Beaver Creek
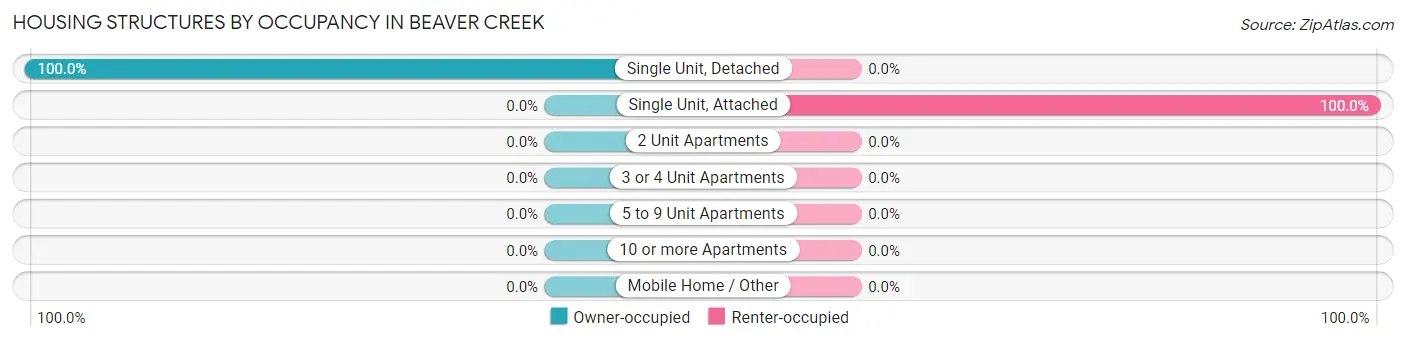
| Structure Type | Owner-occupied | Renter-occupied |
| Single Unit, Detached | 132 (100.0%) | 0 (0.0%) |
| Single Unit, Attached | 0 (0.0%) | 10 (100.0%) |
| 2 Unit Apartments | 0 (0.0%) | 0 (0.0%) |
| 3 or 4 Unit Apartments | 0 (0.0%) | 0 (0.0%) |
| 5 to 9 Unit Apartments | 0 (0.0%) | 0 (0.0%) |
| 10 or more Apartments | 0 (0.0%) | 0 (0.0%) |
| Mobile Home / Other | 0 (0.0%) | 0 (0.0%) |
| Total | 132 (93.0%) | 10 (7.0%) |
Housing Structures by Number of Rooms in Beaver Creek
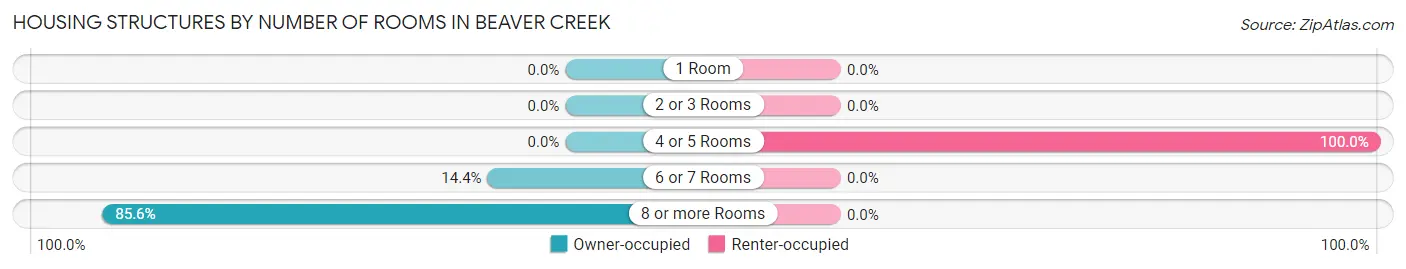
| Number of Rooms | Owner-occupied | Renter-occupied |
| 1 Room | 0 (0.0%) | 0 (0.0%) |
| 2 or 3 Rooms | 0 (0.0%) | 0 (0.0%) |
| 4 or 5 Rooms | 0 (0.0%) | 10 (100.0%) |
| 6 or 7 Rooms | 19 (14.4%) | 0 (0.0%) |
| 8 or more Rooms | 113 (85.6%) | 0 (0.0%) |
| Total | 132 (100.0%) | 10 (100.0%) |
Housing Structure by Heating Type in Beaver Creek
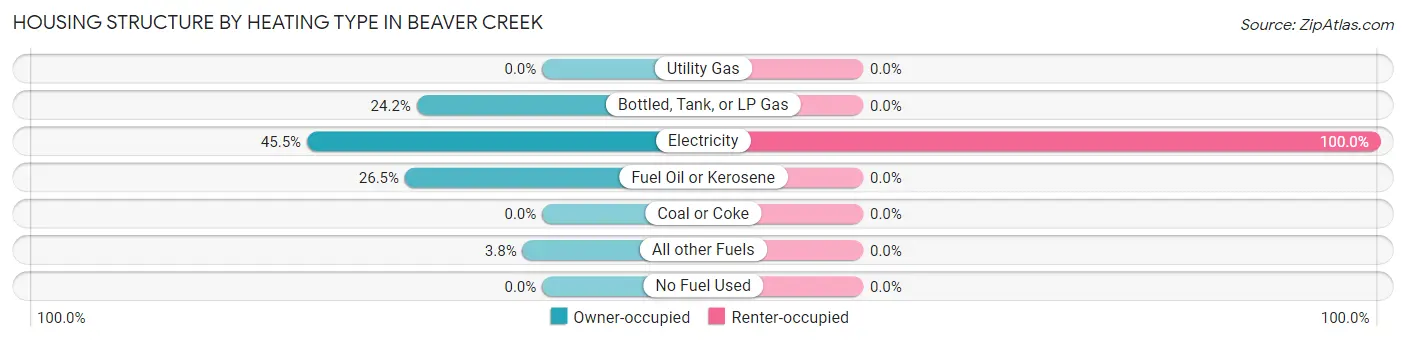
| Heating Type | Owner-occupied | Renter-occupied |
| Utility Gas | 0 (0.0%) | 0 (0.0%) |
| Bottled, Tank, or LP Gas | 32 (24.2%) | 0 (0.0%) |
| Electricity | 60 (45.5%) | 10 (100.0%) |
| Fuel Oil or Kerosene | 35 (26.5%) | 0 (0.0%) |
| Coal or Coke | 0 (0.0%) | 0 (0.0%) |
| All other Fuels | 5 (3.8%) | 0 (0.0%) |
| No Fuel Used | 0 (0.0%) | 0 (0.0%) |
| Total | 132 (100.0%) | 10 (100.0%) |
Household Vehicle Usage in Beaver Creek
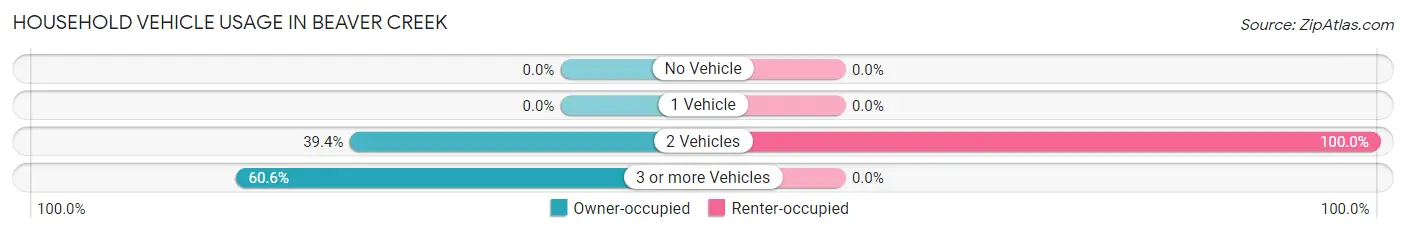
| Vehicles per Household | Owner-occupied | Renter-occupied |
| No Vehicle | 0 (0.0%) | 0 (0.0%) |
| 1 Vehicle | 0 (0.0%) | 0 (0.0%) |
| 2 Vehicles | 52 (39.4%) | 10 (100.0%) |
| 3 or more Vehicles | 80 (60.6%) | 0 (0.0%) |
| Total | 132 (100.0%) | 10 (100.0%) |
Real Estate & Mortgages in Beaver Creek
Real Estate and Mortgage Overview in Beaver Creek
| Characteristic | Without Mortgage | With Mortgage |
| Housing Units | 63 | 69 |
| Median Property Value | $543,300 | $577,500 |
| Median Household Income | $156,125 | $50 |
| Monthly Housing Costs | $654 | $27 |
| Real Estate Taxes | $3,738 | $0 |
Property Value by Mortgage Status in Beaver Creek
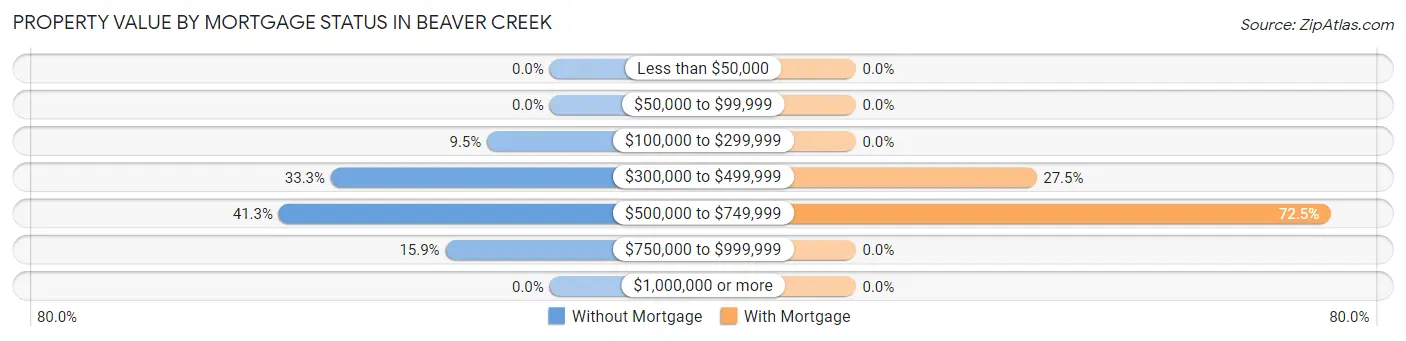
| Property Value | Without Mortgage | With Mortgage |
| Less than $50,000 | 0 (0.0%) | 0 (0.0%) |
| $50,000 to $99,999 | 0 (0.0%) | 0 (0.0%) |
| $100,000 to $299,999 | 6 (9.5%) | 0 (0.0%) |
| $300,000 to $499,999 | 21 (33.3%) | 19 (27.5%) |
| $500,000 to $749,999 | 26 (41.3%) | 50 (72.5%) |
| $750,000 to $999,999 | 10 (15.9%) | 0 (0.0%) |
| $1,000,000 or more | 0 (0.0%) | 0 (0.0%) |
| Total | 63 (100.0%) | 69 (100.0%) |
Household Income by Mortgage Status in Beaver Creek
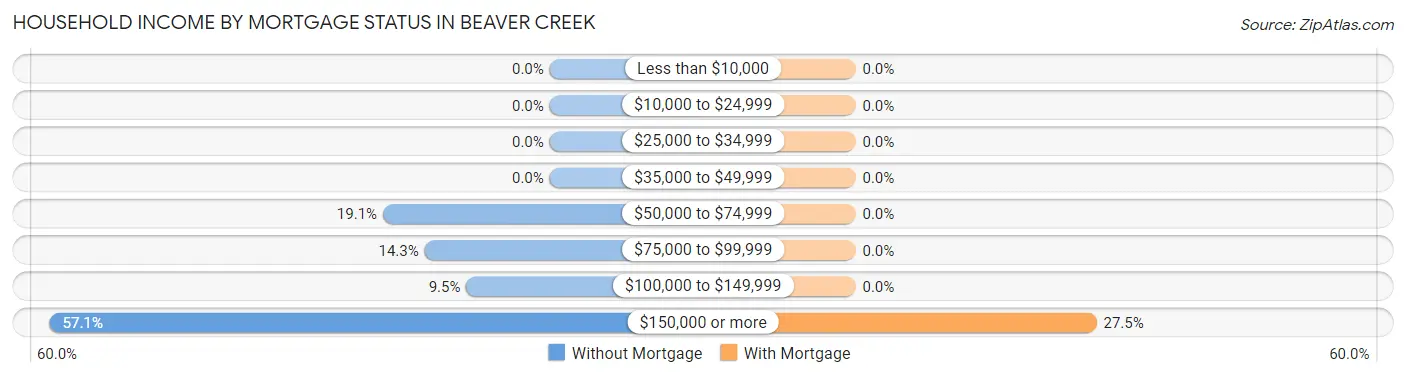
| Household Income | Without Mortgage | With Mortgage |
| Less than $10,000 | 0 (0.0%) | 0 (0.0%) |
| $10,000 to $24,999 | 0 (0.0%) | 0 (0.0%) |
| $25,000 to $34,999 | 0 (0.0%) | 0 (0.0%) |
| $35,000 to $49,999 | 0 (0.0%) | 0 (0.0%) |
| $50,000 to $74,999 | 12 (19.1%) | 0 (0.0%) |
| $75,000 to $99,999 | 9 (14.3%) | 0 (0.0%) |
| $100,000 to $149,999 | 6 (9.5%) | 0 (0.0%) |
| $150,000 or more | 36 (57.1%) | 19 (27.5%) |
| Total | 63 (100.0%) | 69 (100.0%) |
Property Value to Household Income Ratio in Beaver Creek
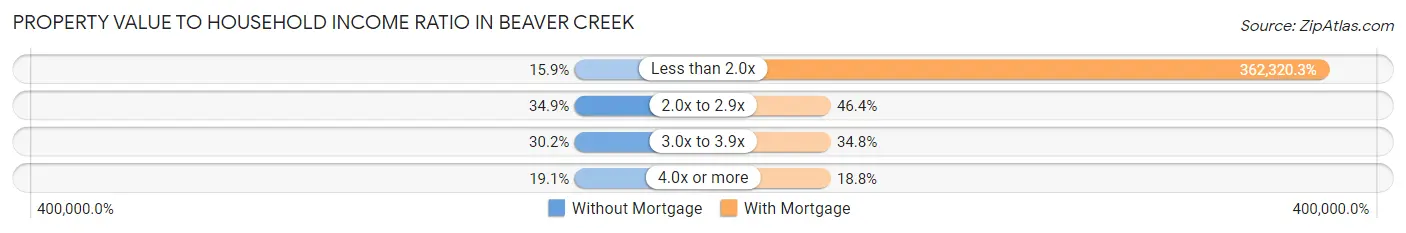
| Value-to-Income Ratio | Without Mortgage | With Mortgage |
| Less than 2.0x | 10 (15.9%) | 250,001 (362,320.3%) |
| 2.0x to 2.9x | 22 (34.9%) | 32 (46.4%) |
| 3.0x to 3.9x | 19 (30.2%) | 24 (34.8%) |
| 4.0x or more | 12 (19.1%) | 13 (18.8%) |
| Total | 63 (100.0%) | 69 (100.0%) |
Real Estate Taxes by Mortgage Status in Beaver Creek
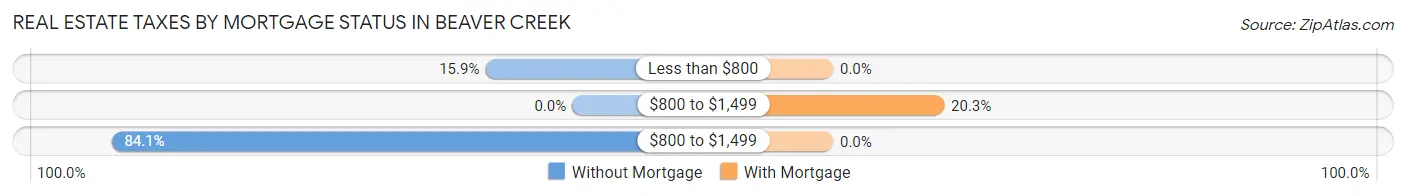
| Property Taxes | Without Mortgage | With Mortgage |
| Less than $800 | 10 (15.9%) | 0 (0.0%) |
| $800 to $1,499 | 0 (0.0%) | 14 (20.3%) |
| $800 to $1,499 | 53 (84.1%) | 0 (0.0%) |
| Total | 63 (100.0%) | 69 (100.0%) |
Health & Disability in Beaver Creek
Health Insurance Coverage by Age in Beaver Creek
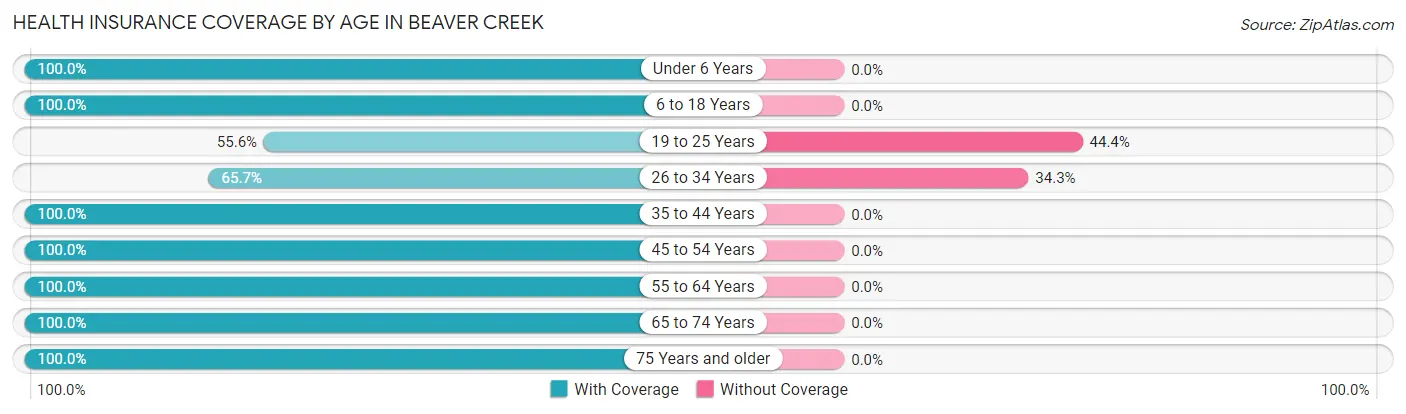
| Age Bracket | With Coverage | Without Coverage |
| Under 6 Years | 26 (100.0%) | 0 (0.0%) |
| 6 to 18 Years | 97 (100.0%) | 0 (0.0%) |
| 19 to 25 Years | 5 (55.6%) | 4 (44.4%) |
| 26 to 34 Years | 44 (65.7%) | 23 (34.3%) |
| 35 to 44 Years | 26 (100.0%) | 0 (0.0%) |
| 45 to 54 Years | 87 (100.0%) | 0 (0.0%) |
| 55 to 64 Years | 66 (100.0%) | 0 (0.0%) |
| 65 to 74 Years | 34 (100.0%) | 0 (0.0%) |
| 75 Years and older | 10 (100.0%) | 0 (0.0%) |
| Total | 395 (93.6%) | 27 (6.4%) |
Health Insurance Coverage by Citizenship Status in Beaver Creek
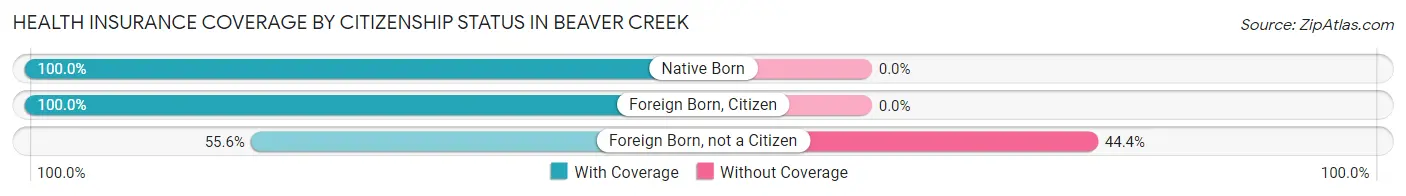
| Citizenship Status | With Coverage | Without Coverage |
| Native Born | 26 (100.0%) | 0 (0.0%) |
| Foreign Born, Citizen | 97 (100.0%) | 0 (0.0%) |
| Foreign Born, not a Citizen | 5 (55.6%) | 4 (44.4%) |
Health Insurance Coverage by Household Income in Beaver Creek
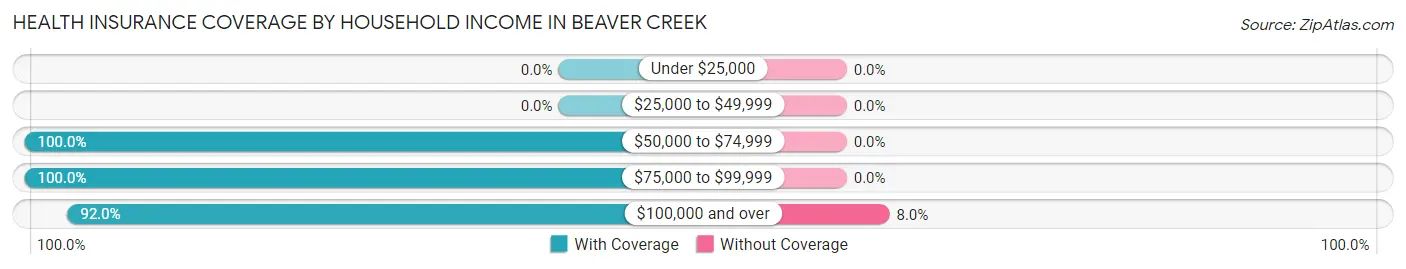
| Household Income | With Coverage | Without Coverage |
| Under $25,000 | 0 (0.0%) | 0 (0.0%) |
| $25,000 to $49,999 | 0 (0.0%) | 0 (0.0%) |
| $50,000 to $74,999 | 76 (100.0%) | 0 (0.0%) |
| $75,000 to $99,999 | 9 (100.0%) | 0 (0.0%) |
| $100,000 and over | 310 (92.0%) | 27 (8.0%) |
Public vs Private Health Insurance Coverage by Age in Beaver Creek
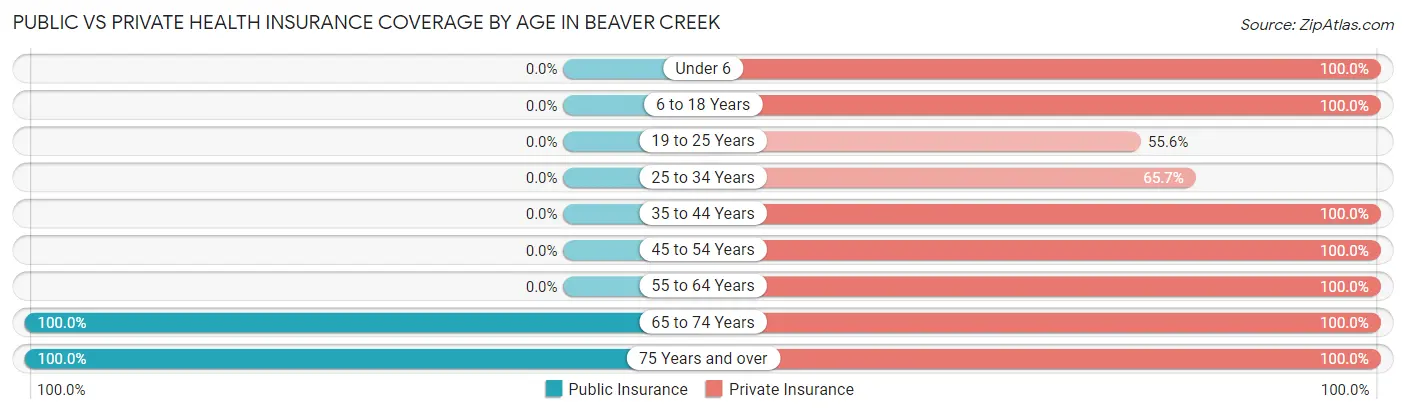
| Age Bracket | Public Insurance | Private Insurance |
| Under 6 | 0 (0.0%) | 26 (100.0%) |
| 6 to 18 Years | 0 (0.0%) | 97 (100.0%) |
| 19 to 25 Years | 0 (0.0%) | 5 (55.6%) |
| 25 to 34 Years | 0 (0.0%) | 44 (65.7%) |
| 35 to 44 Years | 0 (0.0%) | 26 (100.0%) |
| 45 to 54 Years | 0 (0.0%) | 87 (100.0%) |
| 55 to 64 Years | 0 (0.0%) | 66 (100.0%) |
| 65 to 74 Years | 34 (100.0%) | 34 (100.0%) |
| 75 Years and over | 10 (100.0%) | 10 (100.0%) |
| Total | 44 (10.4%) | 395 (93.6%) |
Disability Status by Sex by Age in Beaver Creek
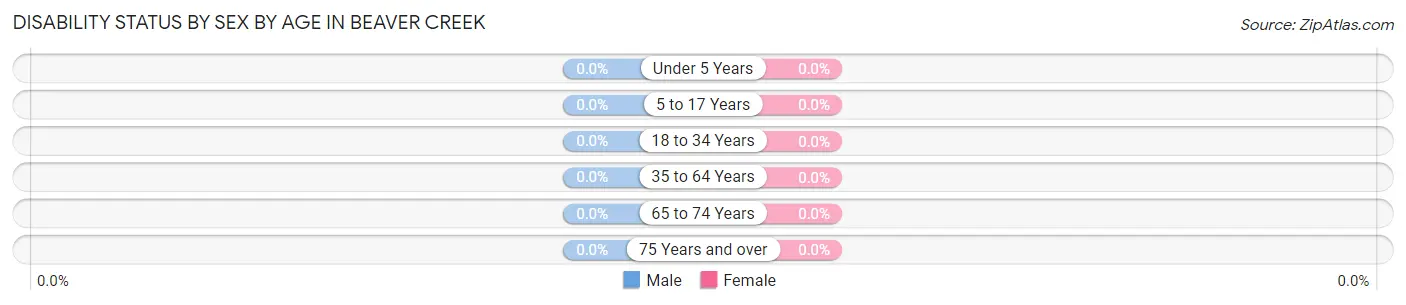
| Age Bracket | Male | Female |
| Under 5 Years | 0 (0.0%) | 0 (0.0%) |
| 5 to 17 Years | 0 (0.0%) | 0 (0.0%) |
| 18 to 34 Years | 0 (0.0%) | 0 (0.0%) |
| 35 to 64 Years | 0 (0.0%) | 0 (0.0%) |
| 65 to 74 Years | 0 (0.0%) | 0 (0.0%) |
| 75 Years and over | 0 (0.0%) | 0 (0.0%) |
Disability Class by Sex by Age in Beaver Creek
Disability Class: Hearing Difficulty
| Age Bracket | Male | Female |
| Under 5 Years | 0 (0.0%) | 0 (0.0%) |
| 5 to 17 Years | 0 (0.0%) | 0 (0.0%) |
| 18 to 34 Years | 0 (0.0%) | 0 (0.0%) |
| 35 to 64 Years | 0 (0.0%) | 0 (0.0%) |
| 65 to 74 Years | 0 (0.0%) | 0 (0.0%) |
| 75 Years and over | 0 (0.0%) | 0 (0.0%) |
Disability Class: Vision Difficulty
| Age Bracket | Male | Female |
| Under 5 Years | 0 (0.0%) | 0 (0.0%) |
| 5 to 17 Years | 0 (0.0%) | 0 (0.0%) |
| 18 to 34 Years | 0 (0.0%) | 0 (0.0%) |
| 35 to 64 Years | 0 (0.0%) | 0 (0.0%) |
| 65 to 74 Years | 0 (0.0%) | 0 (0.0%) |
| 75 Years and over | 0 (0.0%) | 0 (0.0%) |
Disability Class: Cognitive Difficulty
| Age Bracket | Male | Female |
| 5 to 17 Years | 0 (0.0%) | 0 (0.0%) |
| 18 to 34 Years | 0 (0.0%) | 0 (0.0%) |
| 35 to 64 Years | 0 (0.0%) | 0 (0.0%) |
| 65 to 74 Years | 0 (0.0%) | 0 (0.0%) |
| 75 Years and over | 0 (0.0%) | 0 (0.0%) |
Disability Class: Ambulatory Difficulty
| Age Bracket | Male | Female |
| 5 to 17 Years | 0 (0.0%) | 0 (0.0%) |
| 18 to 34 Years | 0 (0.0%) | 0 (0.0%) |
| 35 to 64 Years | 0 (0.0%) | 0 (0.0%) |
| 65 to 74 Years | 0 (0.0%) | 0 (0.0%) |
| 75 Years and over | 0 (0.0%) | 0 (0.0%) |
Disability Class: Self-Care Difficulty
| Age Bracket | Male | Female |
| 5 to 17 Years | 0 (0.0%) | 0 (0.0%) |
| 18 to 34 Years | 0 (0.0%) | 0 (0.0%) |
| 35 to 64 Years | 0 (0.0%) | 0 (0.0%) |
| 65 to 74 Years | 0 (0.0%) | 0 (0.0%) |
| 75 Years and over | 0 (0.0%) | 0 (0.0%) |
Technology Access in Beaver Creek
Computing Device Access in Beaver Creek
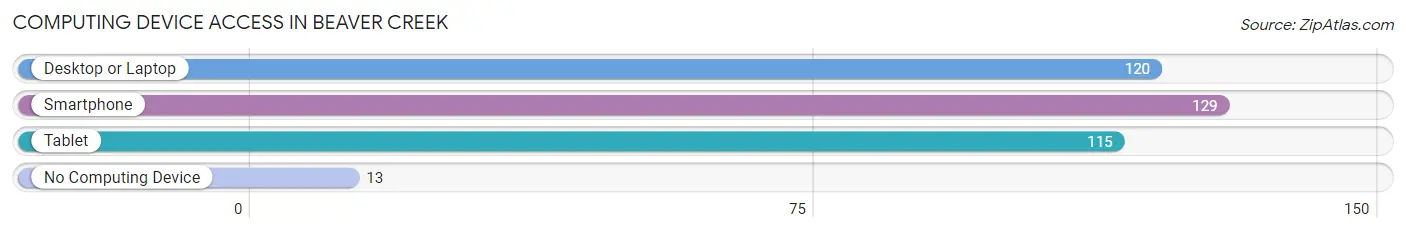
| Device Type | # Households | % Households |
| Desktop or Laptop | 120 | 84.5% |
| Smartphone | 129 | 90.8% |
| Tablet | 115 | 81.0% |
| No Computing Device | 13 | 9.1% |
| Total | 142 | 100.0% |
Internet Access in Beaver Creek
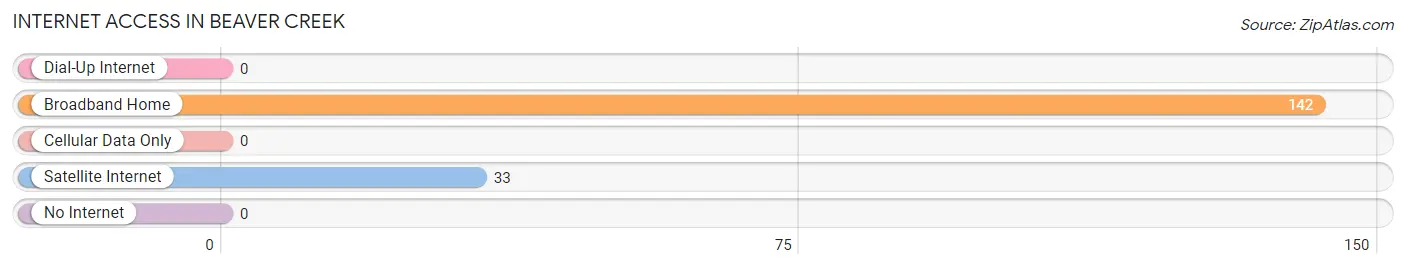
| Internet Type | # Households | % Households |
| Dial-Up Internet | 0 | 0.0% |
| Broadband Home | 142 | 100.0% |
| Cellular Data Only | 0 | 0.0% |
| Satellite Internet | 33 | 23.2% |
| No Internet | 0 | 0.0% |
| Total | 142 | 100.0% |
Beaver Creek Summary
Beaver Creek is a small unincorporated community located in Washington County, Maryland. It is situated in the Appalachian Mountains, approximately two miles east of the Potomac River. The community is located in the northern part of the county, near the Pennsylvania border.
History
Beaver Creek was first settled in the late 1700s by German immigrants. The community was named after the nearby creek, which was named for the abundance of beavers in the area. The first settlers were farmers, and the area was known for its fertile soil and abundant wildlife.
In the early 1800s, the area was home to a number of small industries, including a grist mill, a sawmill, and a tannery. The community also had a post office, a general store, and a blacksmith shop.
In the late 1800s, the area was home to a number of coal mines. The coal industry was the main source of employment for the community until the mines closed in the early 1900s.
Geography
Beaver Creek is located in the Appalachian Mountains, approximately two miles east of the Potomac River. The community is situated in a valley, surrounded by hills and mountains. The area is known for its scenic beauty, with rolling hills, lush forests, and clear streams.
The climate in Beaver Creek is temperate, with mild winters and warm summers. The average annual temperature is around 50 degrees Fahrenheit.
Economy
The economy of Beaver Creek is largely based on agriculture and tourism. The area is home to a number of small farms, which produce a variety of crops, including corn, soybeans, and hay.
The area is also popular with tourists, who come to enjoy the scenic beauty and outdoor activities. The nearby Potomac River is a popular destination for fishing, boating, and other water sports.
Demographics
As of the 2010 census, the population of Beaver Creek was 1,845. The population is predominantly white (97.3%), with a small minority of African Americans (1.2%) and Hispanics (1.5%). The median household income is $45,000, and the median age is 44.
Beaver Creek is a small, rural community with a close-knit community. The area is known for its friendly atmosphere and strong sense of community.
Common Questions
What is Per Capita Income in Beaver Creek?
Per Capita income in Beaver Creek is $88,141.
What is the Median Family Income in Beaver Creek?
Median Family Income in Beaver Creek is $155,375.
What is the Median Household income in Beaver Creek?
Median Household Income in Beaver Creek is $155,500.
What is Inequality or Gini Index in Beaver Creek?
Inequality or Gini Index in Beaver Creek is 0.38.
What is the Total Population of Beaver Creek?
Total Population of Beaver Creek is 422.
What is the Total Male Population of Beaver Creek?
Total Male Population of Beaver Creek is 188.
What is the Total Female Population of Beaver Creek?
Total Female Population of Beaver Creek is 234.
What is the Ratio of Males per 100 Females in Beaver Creek?
There are 80.34 Males per 100 Females in Beaver Creek.
What is the Ratio of Females per 100 Males in Beaver Creek?
There are 124.47 Females per 100 Males in Beaver Creek.
What is the Median Population Age in Beaver Creek?
Median Population Age in Beaver Creek is 37.6 Years.
What is the Average Family Size in Beaver Creek
Average Family Size in Beaver Creek is 3.2 People.
What is the Average Household Size in Beaver Creek
Average Household Size in Beaver Creek is 3.0 People.
How Large is the Labor Force in Beaver Creek?
There are 209 People in the Labor Forcein in Beaver Creek.
What is the Percentage of People in the Labor Force in Beaver Creek?
63.7% of People are in the Labor Force in Beaver Creek.