Layhill, MD Map & Demographics
Layhill Map
Layhill Overview
$49,096
PER CAPITA INCOME
$135,302
AVG FAMILY INCOME
$131,528
AVG HOUSEHOLD INCOME
30.1%
WAGE / INCOME GAP [ % ]
69.9¢/ $1
WAGE / INCOME GAP [ $ ]
0.42
INEQUALITY / GINI INDEX
5,157
TOTAL POPULATION
2,319
MALE POPULATION
2,838
FEMALE POPULATION
81.71
MALES / 100 FEMALES
122.38
FEMALES / 100 MALES
43.7
MEDIAN AGE
3.6
AVG FAMILY SIZE
3.2
AVG HOUSEHOLD SIZE
2,995
LABOR FORCE [ PEOPLE ]
68.6%
PERCENT IN LABOR FORCE
6.2%
UNEMPLOYMENT RATE
Income in Layhill
Income Overview in Layhill
Per Capita Income in Layhill is $49,096, while median incomes of families and households are $135,302 and $131,528 respectively.
| Characteristic | Number | Measure |
| Per Capita Income | 5,157 | $49,096 |
| Median Family Income | 1,241 | $135,302 |
| Mean Family Income | 1,241 | $171,048 |
| Median Household Income | 1,585 | $131,528 |
| Mean Household Income | 1,585 | $155,550 |
| Income Deficit | 1,241 | $0 |
| Wage / Income Gap (%) | 5,157 | 30.08% |
| Wage / Income Gap ($) | 5,157 | 69.92¢ per $1 |
| Gini / Inequality Index | 5,157 | 0.42 |
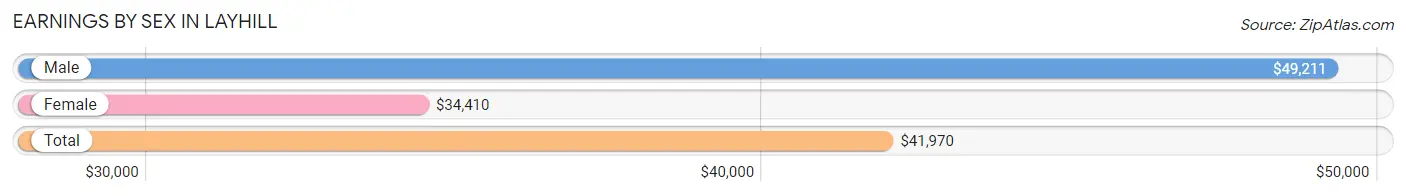
Earnings by Sex in Layhill
Average Earnings in Layhill are $41,970, $49,211 for men and $34,410 for women, a difference of 30.1%.
| Sex | Number | Average Earnings |
| Male | 1,324 (45.2%) | $49,211 |
| Female | 1,608 (54.8%) | $34,410 |
| Total | 2,932 (100.0%) | $41,970 |
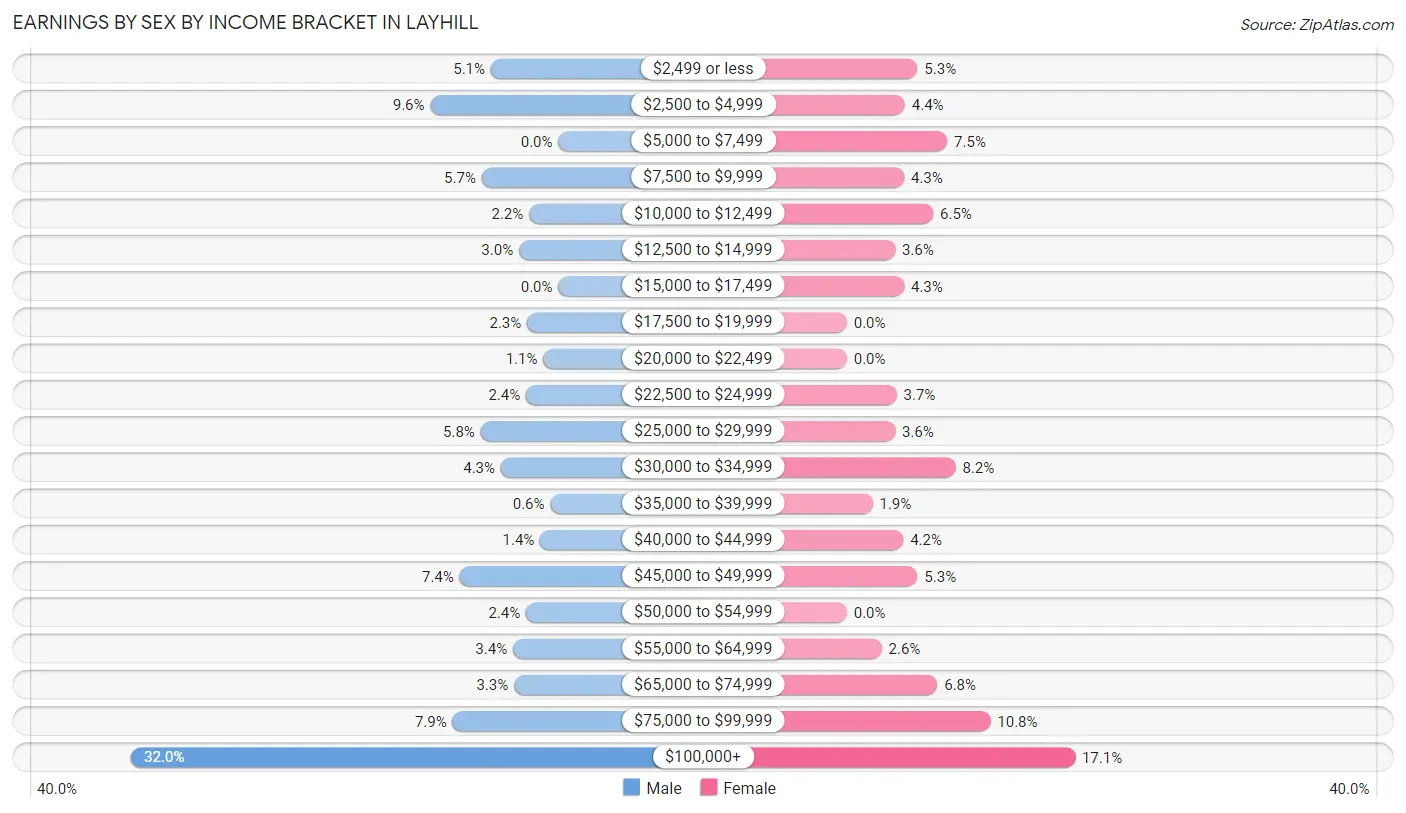
Earnings by Sex by Income Bracket in Layhill
The most common earnings brackets in Layhill are $100,000+ for men (424 | 32.0%) and $100,000+ for women (275 | 17.1%).
| Income | Male | Female |
| $2,499 or less | 67 (5.1%) | 85 (5.3%) |
| $2,500 to $4,999 | 127 (9.6%) | 70 (4.3%) |
| $5,000 to $7,499 | 0 (0.0%) | 121 (7.5%) |
| $7,500 to $9,999 | 76 (5.7%) | 69 (4.3%) |
| $10,000 to $12,499 | 29 (2.2%) | 104 (6.5%) |
| $12,500 to $14,999 | 39 (2.9%) | 58 (3.6%) |
| $15,000 to $17,499 | 0 (0.0%) | 69 (4.3%) |
| $17,500 to $19,999 | 31 (2.3%) | 0 (0.0%) |
| $20,000 to $22,499 | 15 (1.1%) | 0 (0.0%) |
| $22,500 to $24,999 | 32 (2.4%) | 60 (3.7%) |
| $25,000 to $29,999 | 77 (5.8%) | 58 (3.6%) |
| $30,000 to $34,999 | 57 (4.3%) | 131 (8.2%) |
| $35,000 to $39,999 | 8 (0.6%) | 31 (1.9%) |
| $40,000 to $44,999 | 18 (1.4%) | 68 (4.2%) |
| $45,000 to $49,999 | 98 (7.4%) | 85 (5.3%) |
| $50,000 to $54,999 | 32 (2.4%) | 0 (0.0%) |
| $55,000 to $64,999 | 45 (3.4%) | 42 (2.6%) |
| $65,000 to $74,999 | 44 (3.3%) | 109 (6.8%) |
| $75,000 to $99,999 | 105 (7.9%) | 173 (10.8%) |
| $100,000+ | 424 (32.0%) | 275 (17.1%) |
| Total | 1,324 (100.0%) | 1,608 (100.0%) |
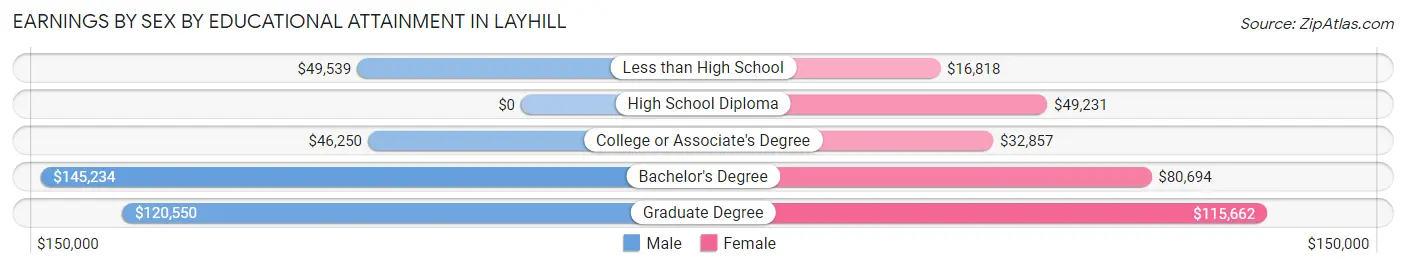
Earnings by Sex by Educational Attainment in Layhill
Average earnings in Layhill are $68,550 for men and $46,875 for women, a difference of 31.6%. Men with an educational attainment of bachelor's degree enjoy the highest average annual earnings of $145,234, while those with college or associate's degree education earn the least with $46,250. Women with an educational attainment of graduate degree earn the most with the average annual earnings of $115,662, while those with less than high school education have the smallest earnings of $16,818.
| Educational Attainment | Male Income | Female Income |
| Less than High School | $49,539 | $16,818 |
| High School Diploma | - | - |
| College or Associate's Degree | $46,250 | $32,857 |
| Bachelor's Degree | $145,234 | $80,694 |
| Graduate Degree | $120,550 | $115,662 |
| Total | $68,550 | $46,875 |
Family Income in Layhill
Family Income Brackets in Layhill
According to the Layhill family income data, there are 364 families falling into the $200,000+ income range, which is the most common income bracket and makes up 29.3% of all families.
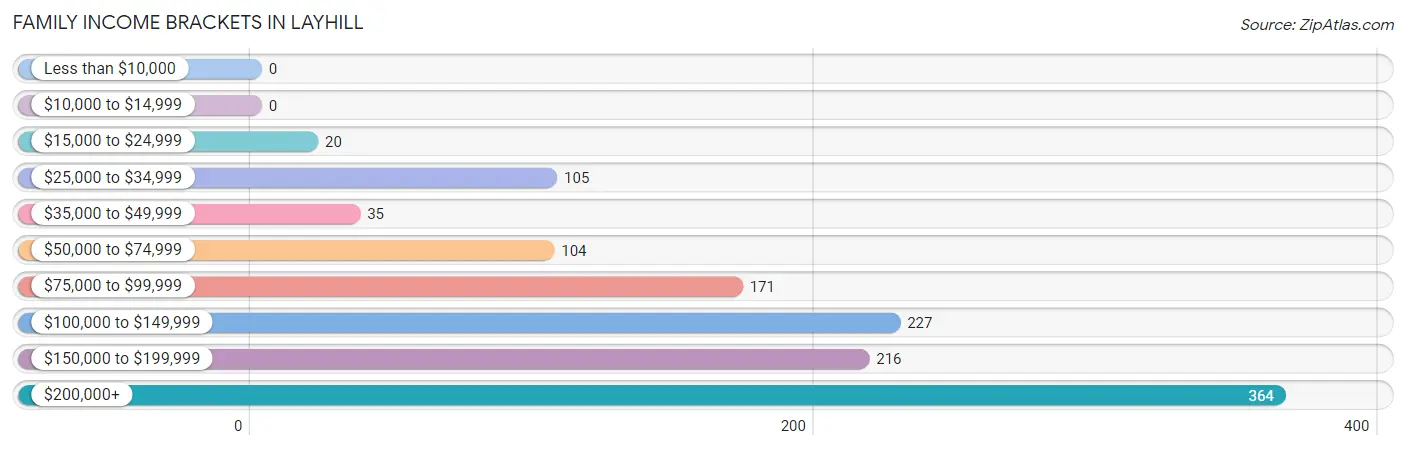
| Income Bracket | # Families | % Families |
| Less than $10,000 | 0 | 0.0% |
| $10,000 to $14,999 | 0 | 0.0% |
| $15,000 to $24,999 | 20 | 1.6% |
| $25,000 to $34,999 | 105 | 8.5% |
| $35,000 to $49,999 | 35 | 2.8% |
| $50,000 to $74,999 | 104 | 8.4% |
| $75,000 to $99,999 | 171 | 13.8% |
| $100,000 to $149,999 | 227 | 18.3% |
| $150,000 to $199,999 | 216 | 17.4% |
| $200,000+ | 364 | 29.3% |
Family Income by Famaliy Size in Layhill
5-person families (101 | 8.1%) account for the highest median family income in Layhill with $180,469 per family, while 2-person families (439 | 35.4%) have the highest median income of $67,910 per family member.
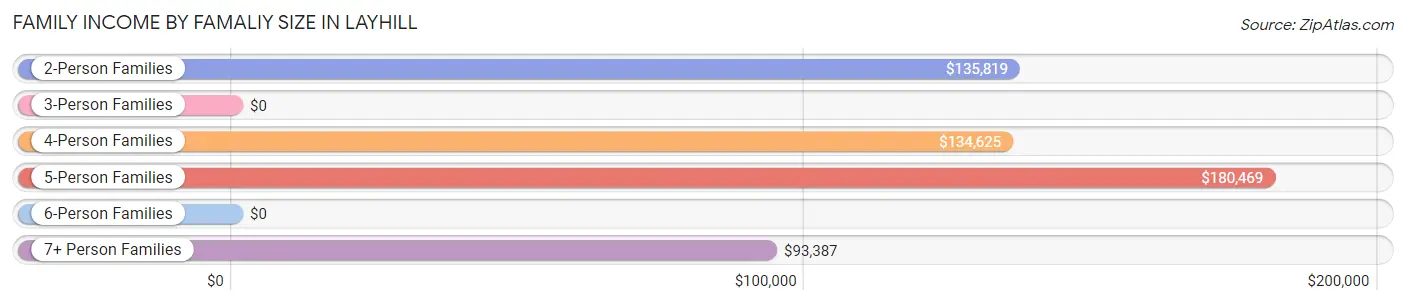
| Income Bracket | # Families | Median Income |
| 2-Person Families | 439 (35.4%) | $135,819 |
| 3-Person Families | 266 (21.4%) | $0 |
| 4-Person Families | 318 (25.6%) | $134,625 |
| 5-Person Families | 101 (8.1%) | $180,469 |
| 6-Person Families | 59 (4.8%) | $0 |
| 7+ Person Families | 58 (4.7%) | $93,387 |
| Total | 1,241 (100.0%) | $135,302 |
Family Income by Number of Earners in Layhill
The median family income in Layhill is $135,302, with families comprising 2 earners (578) having the highest median family income of $155,278, while families with no earners (129) have the lowest median family income of $126,771, accounting for 46.6% and 10.4% of families, respectively.
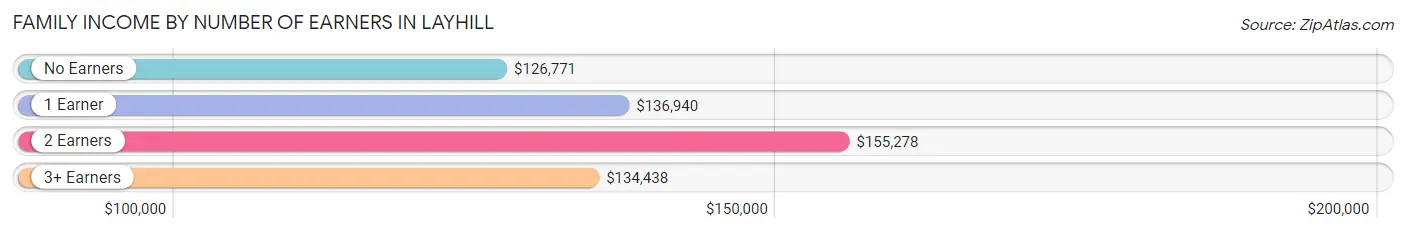
| Number of Earners | # Families | Median Income |
| No Earners | 129 (10.4%) | $126,771 |
| 1 Earner | 231 (18.6%) | $136,940 |
| 2 Earners | 578 (46.6%) | $155,278 |
| 3+ Earners | 303 (24.4%) | $134,438 |
| Total | 1,241 (100.0%) | $135,302 |
Household Income in Layhill
Household Income Brackets in Layhill
With 387 households falling in the category, the $200,000+ income range is the most frequent in Layhill, accounting for 24.4% of all households. In contrast, only 32 households (2.0%) fall into the less than $10,000 income bracket, making it the least populous group.
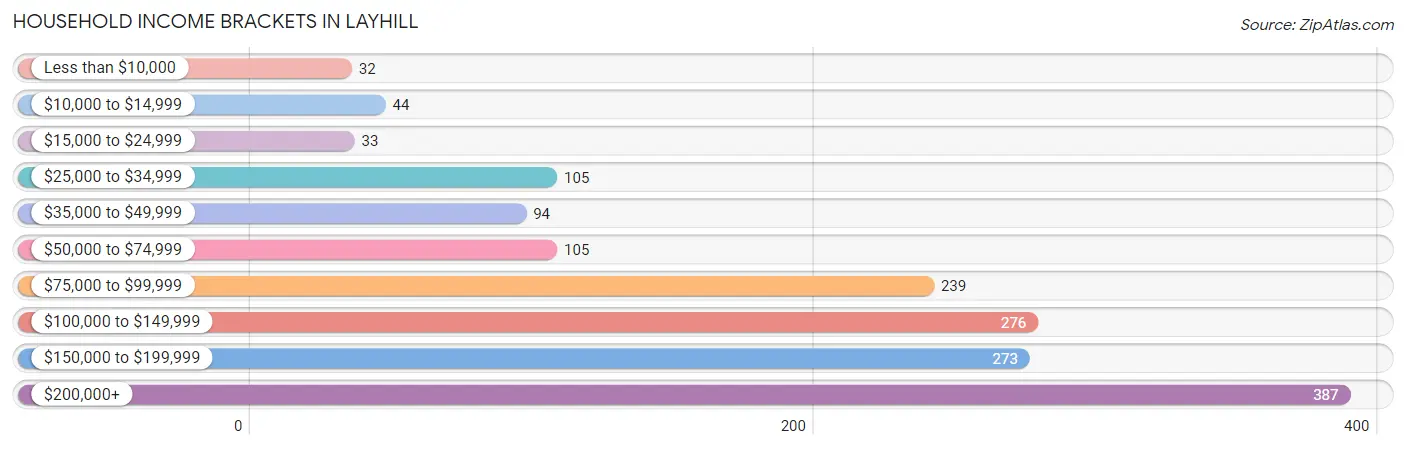
| Income Bracket | # Households | % Households |
| Less than $10,000 | 32 | 2.0% |
| $10,000 to $14,999 | 44 | 2.8% |
| $15,000 to $24,999 | 33 | 2.1% |
| $25,000 to $34,999 | 105 | 6.6% |
| $35,000 to $49,999 | 94 | 5.9% |
| $50,000 to $74,999 | 105 | 6.6% |
| $75,000 to $99,999 | 239 | 15.1% |
| $100,000 to $149,999 | 276 | 17.4% |
| $150,000 to $199,999 | 273 | 17.2% |
| $200,000+ | 387 | 24.4% |
Household Income by Householder Age in Layhill
The median household income in Layhill is $131,528, with the highest median household income of $151,563 found in the 45 to 64 years age bracket for the primary householder. A total of 795 households (50.2%) fall into this category.
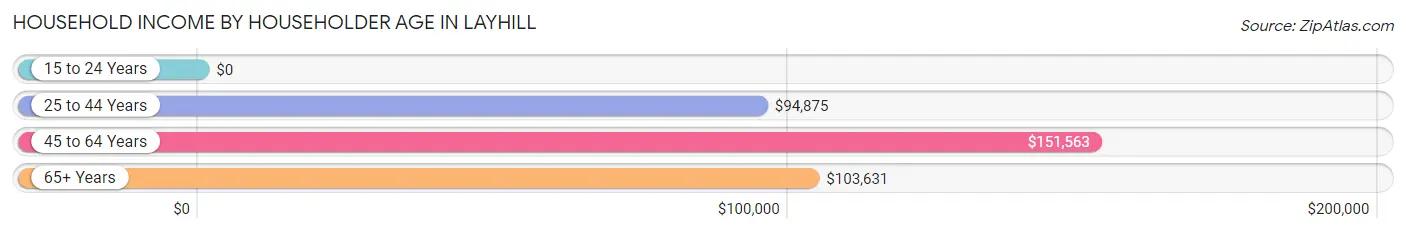
| Income Bracket | # Households | Median Income |
| 15 to 24 Years | 0 (0.0%) | $0 |
| 25 to 44 Years | 265 (16.7%) | $94,875 |
| 45 to 64 Years | 795 (50.2%) | $151,563 |
| 65+ Years | 525 (33.1%) | $103,631 |
| Total | 1,585 (100.0%) | $131,528 |
Poverty in Layhill
Income Below Poverty by Sex and Age in Layhill
With 4.2% poverty level for males and 5.0% for females among the residents of Layhill, 65 to 74 year old males and 65 to 74 year old females are the most vulnerable to poverty, with 51 males (21.4%) and 58 females (17.6%) in their respective age groups living below the poverty level.
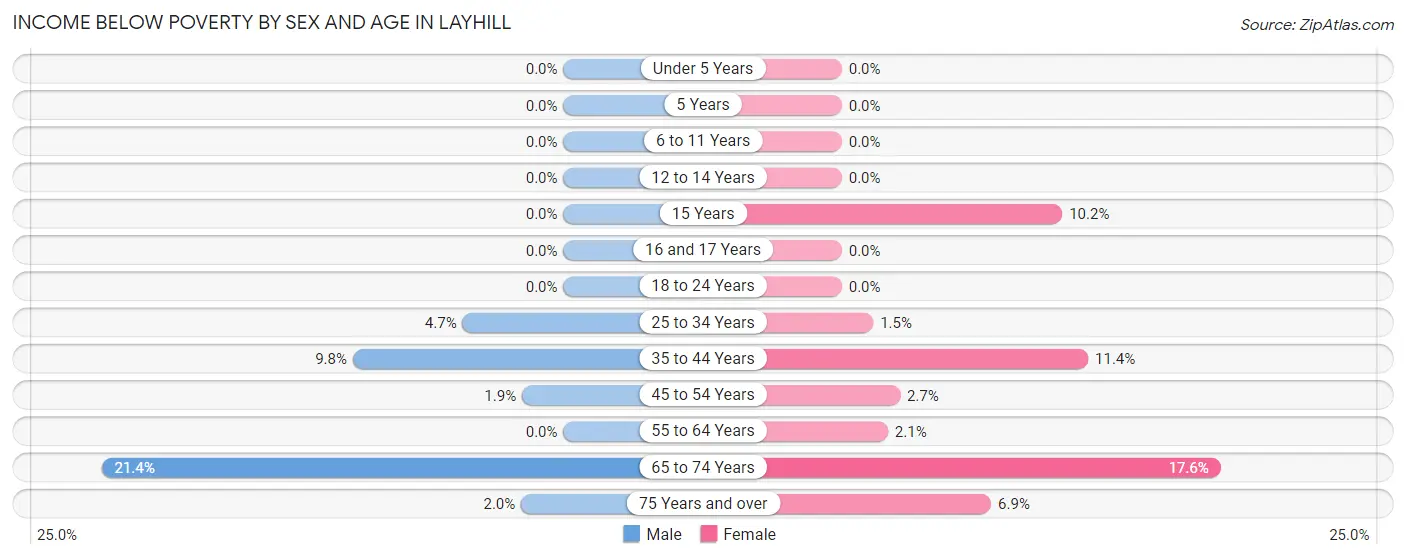
| Age Bracket | Male | Female |
| Under 5 Years | 0 (0.0%) | 0 (0.0%) |
| 5 Years | 0 (0.0%) | 0 (0.0%) |
| 6 to 11 Years | 0 (0.0%) | 0 (0.0%) |
| 12 to 14 Years | 0 (0.0%) | 0 (0.0%) |
| 15 Years | 0 (0.0%) | 9 (10.2%) |
| 16 and 17 Years | 0 (0.0%) | 0 (0.0%) |
| 18 to 24 Years | 0 (0.0%) | 0 (0.0%) |
| 25 to 34 Years | 8 (4.7%) | 4 (1.5%) |
| 35 to 44 Years | 26 (9.8%) | 32 (11.4%) |
| 45 to 54 Years | 6 (1.9%) | 11 (2.7%) |
| 55 to 64 Years | 0 (0.0%) | 8 (2.1%) |
| 65 to 74 Years | 51 (21.4%) | 58 (17.6%) |
| 75 Years and over | 4 (2.0%) | 16 (6.9%) |
| Total | 95 (4.2%) | 138 (5.0%) |
Income Above Poverty by Sex and Age in Layhill
According to the poverty statistics in Layhill, males aged under 5 years and females aged under 5 years are the age groups that are most secure financially, with 100.0% of males and 100.0% of females in these age groups living above the poverty line.
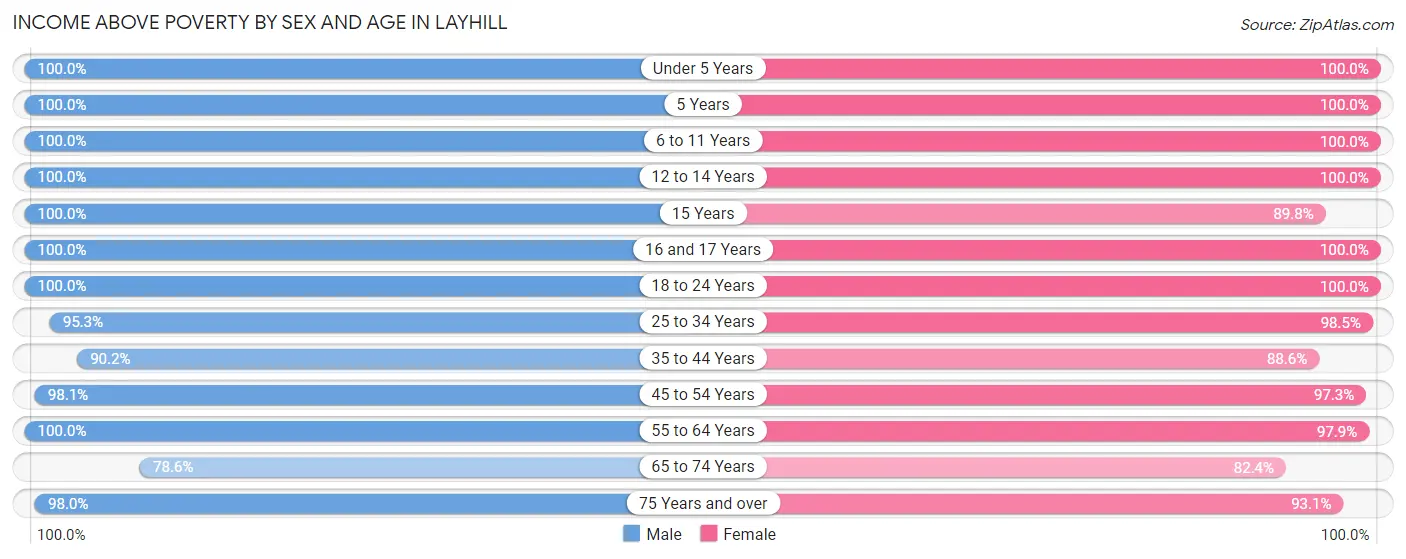
| Age Bracket | Male | Female |
| Under 5 Years | 88 (100.0%) | 62 (100.0%) |
| 5 Years | 86 (100.0%) | 11 (100.0%) |
| 6 to 11 Years | 124 (100.0%) | 76 (100.0%) |
| 12 to 14 Years | 33 (100.0%) | 126 (100.0%) |
| 15 Years | 73 (100.0%) | 79 (89.8%) |
| 16 and 17 Years | 20 (100.0%) | 133 (100.0%) |
| 18 to 24 Years | 287 (100.0%) | 396 (100.0%) |
| 25 to 34 Years | 163 (95.3%) | 270 (98.5%) |
| 35 to 44 Years | 240 (90.2%) | 248 (88.6%) |
| 45 to 54 Years | 307 (98.1%) | 397 (97.3%) |
| 55 to 64 Years | 345 (100.0%) | 366 (97.9%) |
| 65 to 74 Years | 187 (78.6%) | 272 (82.4%) |
| 75 Years and over | 200 (98.0%) | 215 (93.1%) |
| Total | 2,153 (95.8%) | 2,651 (95.1%) |
Income Below Poverty Among Married-Couple Families in Layhill
The poverty statistics for married-couple families in Layhill show that 1.3% or 12 of the total 914 families live below the poverty line. Families with no children have the highest poverty rate of 2.1%, comprising of 12 families. On the other hand, families with 1 or 2 children have the lowest poverty rate of 0.0%, which includes 0 families.
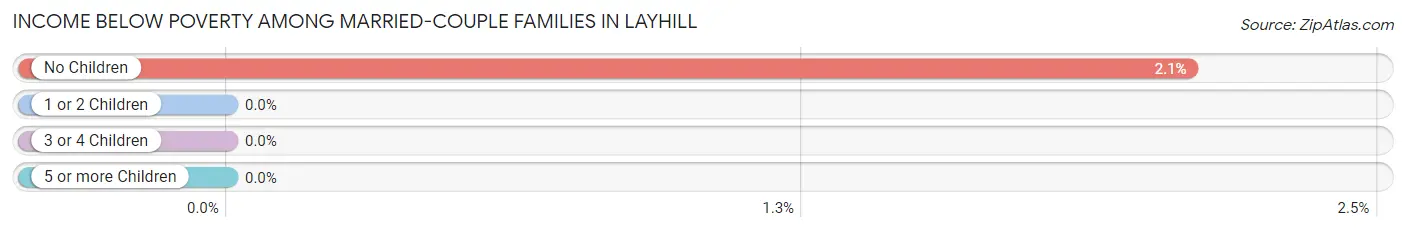
| Children | Above Poverty | Below Poverty |
| No Children | 561 (97.9%) | 12 (2.1%) |
| 1 or 2 Children | 257 (100.0%) | 0 (0.0%) |
| 3 or 4 Children | 57 (100.0%) | 0 (0.0%) |
| 5 or more Children | 27 (100.0%) | 0 (0.0%) |
| Total | 902 (98.7%) | 12 (1.3%) |
Income Below Poverty Among Single-Parent Households in Layhill

| Children | Single Father | Single Mother |
| No Children | 0 (0.0%) | 0 (0.0%) |
| 1 or 2 Children | 0 (0.0%) | 8 (6.5%) |
| 3 or 4 Children | 0 (0.0%) | 0 (0.0%) |
| 5 or more Children | 0 (0.0%) | 0 (0.0%) |
| Total | 0 (0.0%) | 8 (2.8%) |
Income Below Poverty Among Married-Couple vs Single-Parent Households in Layhill
The poverty data for Layhill shows that 12 of the married-couple family households (1.3%) and 8 of the single-parent households (2.5%) are living below the poverty level. Within the married-couple family households, those with no children have the highest poverty rate, with 12 households (2.1%) falling below the poverty line. Among the single-parent households, those with 1 or 2 children have the highest poverty rate, with 8 household (5.2%) living below poverty.
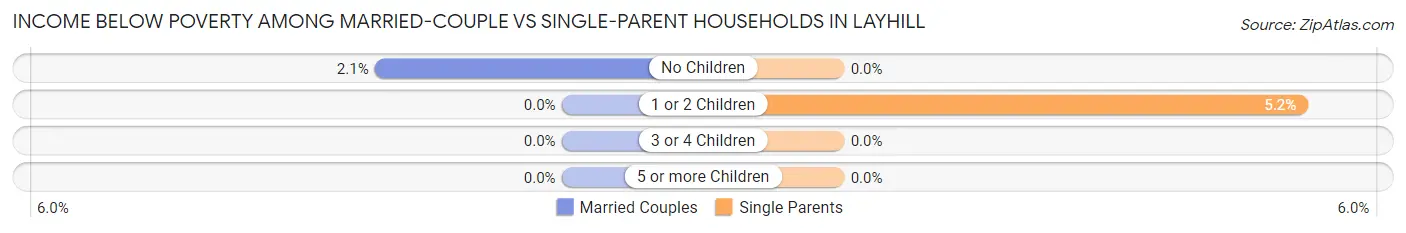
| Children | Married-Couple Families | Single-Parent Households |
| No Children | 12 (2.1%) | 0 (0.0%) |
| 1 or 2 Children | 0 (0.0%) | 8 (5.2%) |
| 3 or 4 Children | 0 (0.0%) | 0 (0.0%) |
| 5 or more Children | 0 (0.0%) | 0 (0.0%) |
| Total | 12 (1.3%) | 8 (2.5%) |
Race in Layhill
The most populous races in Layhill are Black / African American (2,044 | 39.6%), White / Caucasian (1,421 | 27.6%), and Hispanic or Latino (847 | 16.4%).
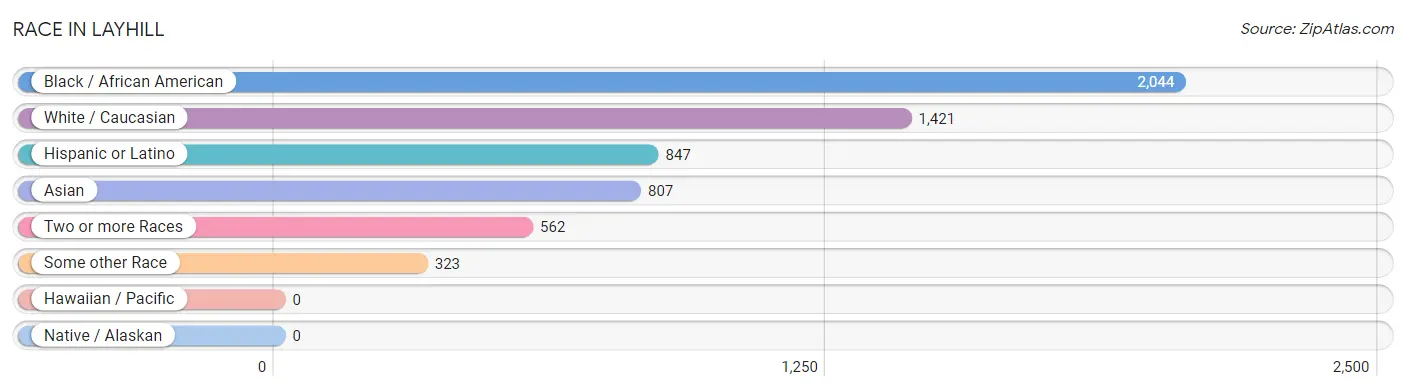
| Race | # Population | % Population |
| Asian | 807 | 15.7% |
| Black / African American | 2,044 | 39.6% |
| Hawaiian / Pacific | 0 | 0.0% |
| Hispanic or Latino | 847 | 16.4% |
| Native / Alaskan | 0 | 0.0% |
| White / Caucasian | 1,421 | 27.6% |
| Two or more Races | 562 | 10.9% |
| Some other Race | 323 | 6.3% |
| Total | 5,157 | 100.0% |
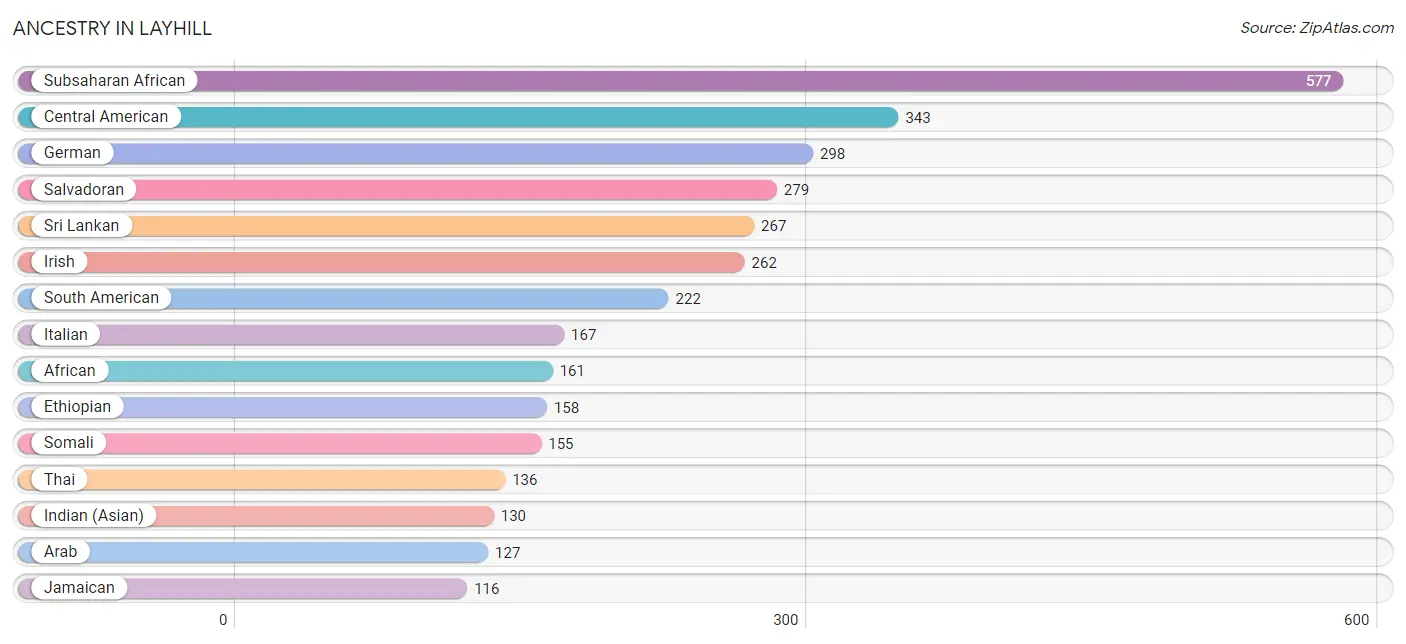
Ancestry in Layhill
The most populous ancestries reported in Layhill are Subsaharan African (577 | 11.2%), Central American (343 | 6.7%), German (298 | 5.8%), Salvadoran (279 | 5.4%), and Sri Lankan (267 | 5.2%), together accounting for 34.2% of all Layhill residents.
| Ancestry | # Population | % Population |
| African | 161 | 3.1% |
| American | 68 | 1.3% |
| Arab | 127 | 2.5% |
| Argentinean | 24 | 0.5% |
| Armenian | 28 | 0.5% |
| Austrian | 12 | 0.2% |
| Belgian | 6 | 0.1% |
| Bolivian | 79 | 1.5% |
| Brazilian | 61 | 1.2% |
| British | 10 | 0.2% |
| Burmese | 78 | 1.5% |
| Canadian | 18 | 0.4% |
| Celtic | 15 | 0.3% |
| Central American | 343 | 6.7% |
| Cherokee | 71 | 1.4% |
| Colombian | 52 | 1.0% |
| Costa Rican | 18 | 0.4% |
| Cree | 41 | 0.8% |
| Czech | 30 | 0.6% |
| Czechoslovakian | 5 | 0.1% |
| Danish | 12 | 0.2% |
| Eastern European | 27 | 0.5% |
| Ecuadorian | 67 | 1.3% |
| English | 89 | 1.7% |
| Ethiopian | 158 | 3.1% |
| European | 5 | 0.1% |
| French | 7 | 0.1% |
| German | 298 | 5.8% |
| Ghanaian | 7 | 0.1% |
| Greek | 46 | 0.9% |
| Guamanian / Chamorro | 23 | 0.4% |
| Guatemalan | 14 | 0.3% |
| Hungarian | 17 | 0.3% |
| Indian (Asian) | 130 | 2.5% |
| Iraqi | 34 | 0.7% |
| Irish | 262 | 5.1% |
| Israeli | 12 | 0.2% |
| Italian | 167 | 3.2% |
| Jamaican | 116 | 2.2% |
| Japanese | 104 | 2.0% |
| Korean | 33 | 0.6% |
| Laotian | 69 | 1.3% |
| Lebanese | 76 | 1.5% |
| Lithuanian | 15 | 0.3% |
| Malaysian | 88 | 1.7% |
| Mexican | 85 | 1.7% |
| Norwegian | 10 | 0.2% |
| Pakistani | 49 | 0.9% |
| Panamanian | 30 | 0.6% |
| Polish | 48 | 0.9% |
| Puerto Rican | 18 | 0.4% |
| Romanian | 49 | 0.9% |
| Russian | 76 | 1.5% |
| Salvadoran | 279 | 5.4% |
| Scotch-Irish | 5 | 0.1% |
| Scottish | 6 | 0.1% |
| Somali | 155 | 3.0% |
| South American | 222 | 4.3% |
| Spaniard | 8 | 0.2% |
| Spanish | 56 | 1.1% |
| Sri Lankan | 267 | 5.2% |
| Subsaharan African | 577 | 11.2% |
| Swedish | 22 | 0.4% |
| Thai | 136 | 2.6% |
| Trinidadian and Tobagonian | 17 | 0.3% |
| Turkish | 12 | 0.2% |
| Ukrainian | 64 | 1.2% | View All 67 Rows |
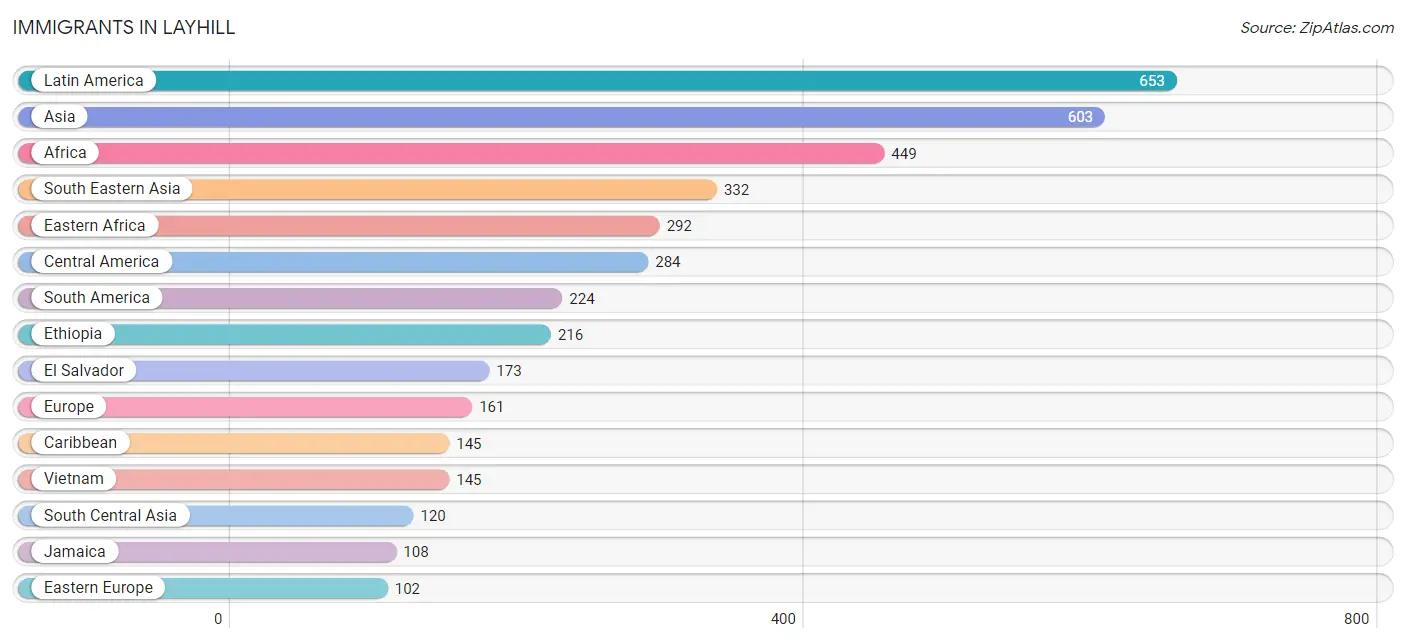
Immigrants in Layhill
The most numerous immigrant groups reported in Layhill came from Latin America (653 | 12.7%), Asia (603 | 11.7%), Africa (449 | 8.7%), South Eastern Asia (332 | 6.4%), and Eastern Africa (292 | 5.7%), together accounting for 45.2% of all Layhill residents.
| Immigration Origin | # Population | % Population |
| Africa | 449 | 8.7% |
| Argentina | 24 | 0.5% |
| Asia | 603 | 11.7% |
| Bangladesh | 28 | 0.5% |
| Bolivia | 79 | 1.5% |
| Brazil | 83 | 1.6% |
| Cambodia | 70 | 1.4% |
| Cameroon | 96 | 1.9% |
| Caribbean | 145 | 2.8% |
| Central America | 284 | 5.5% |
| China | 40 | 0.8% |
| Colombia | 38 | 0.7% |
| Costa Rica | 5 | 0.1% |
| Eastern Africa | 292 | 5.7% |
| Eastern Asia | 100 | 1.9% |
| Eastern Europe | 102 | 2.0% |
| El Salvador | 173 | 3.4% |
| England | 18 | 0.4% |
| Ethiopia | 216 | 4.2% |
| Europe | 161 | 3.1% |
| Ghana | 27 | 0.5% |
| Greece | 16 | 0.3% |
| Guatemala | 22 | 0.4% |
| Haiti | 37 | 0.7% |
| Honduras | 54 | 1.1% |
| Hong Kong | 11 | 0.2% |
| India | 64 | 1.2% |
| Indonesia | 69 | 1.3% |
| Iran | 28 | 0.5% |
| Iraq | 45 | 0.9% |
| Ireland | 15 | 0.3% |
| Israel | 6 | 0.1% |
| Jamaica | 108 | 2.1% |
| Korea | 60 | 1.2% |
| Laos | 8 | 0.2% |
| Latin America | 653 | 12.7% |
| Middle Africa | 96 | 1.9% |
| Northern Europe | 43 | 0.8% |
| Panama | 30 | 0.6% |
| Philippines | 10 | 0.2% |
| Romania | 102 | 2.0% |
| Sierra Leone | 22 | 0.4% |
| Somalia | 76 | 1.5% |
| South America | 224 | 4.3% |
| South Central Asia | 120 | 2.3% |
| South Eastern Asia | 332 | 6.4% |
| Southern Europe | 16 | 0.3% |
| Thailand | 30 | 0.6% |
| Vietnam | 145 | 2.8% |
| Western Africa | 61 | 1.2% |
| Western Asia | 51 | 1.0% | View All 51 Rows |
Sex and Age in Layhill
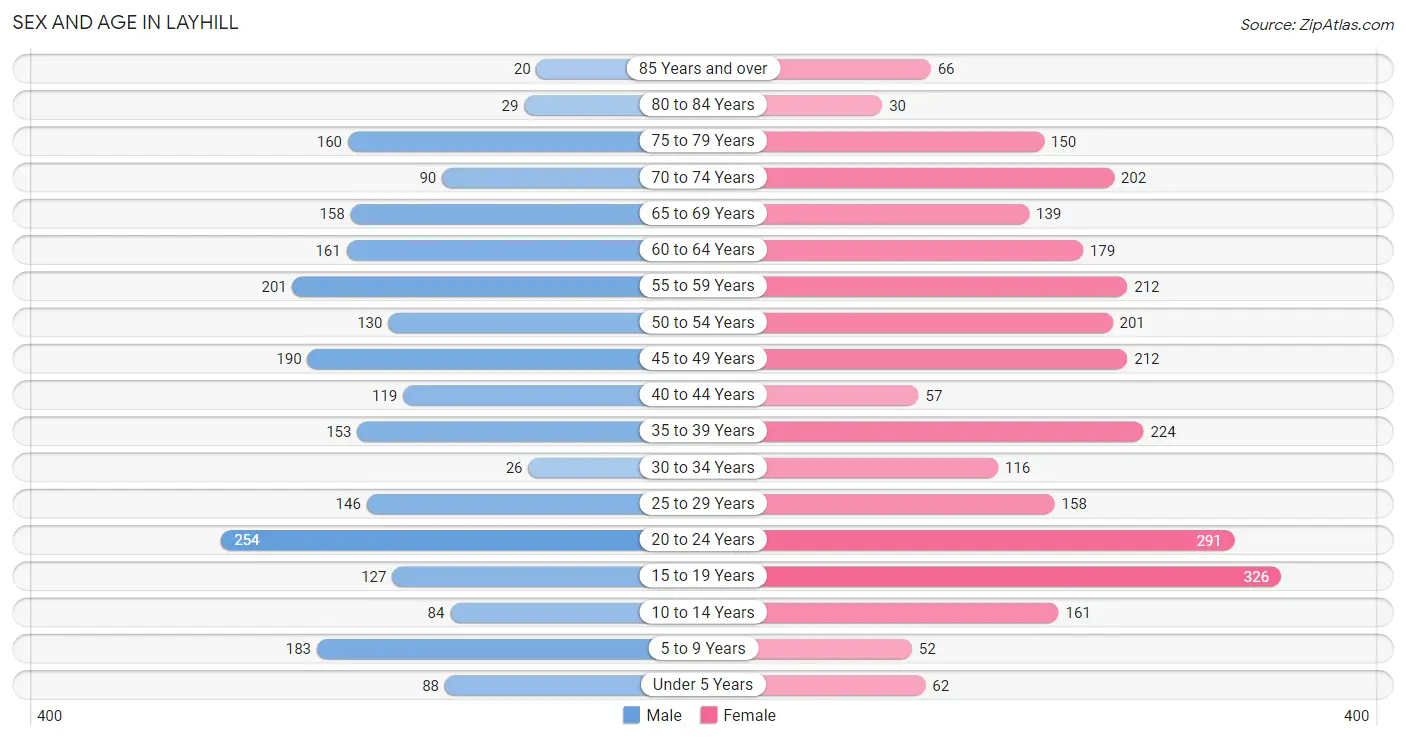
Sex and Age in Layhill
The most populous age groups in Layhill are 20 to 24 Years (254 | 11.0%) for men and 15 to 19 Years (326 | 11.5%) for women.
| Age Bracket | Male | Female |
| Under 5 Years | 88 (3.8%) | 62 (2.2%) |
| 5 to 9 Years | 183 (7.9%) | 52 (1.8%) |
| 10 to 14 Years | 84 (3.6%) | 161 (5.7%) |
| 15 to 19 Years | 127 (5.5%) | 326 (11.5%) |
| 20 to 24 Years | 254 (11.0%) | 291 (10.2%) |
| 25 to 29 Years | 146 (6.3%) | 158 (5.6%) |
| 30 to 34 Years | 26 (1.1%) | 116 (4.1%) |
| 35 to 39 Years | 153 (6.6%) | 224 (7.9%) |
| 40 to 44 Years | 119 (5.1%) | 57 (2.0%) |
| 45 to 49 Years | 190 (8.2%) | 212 (7.5%) |
| 50 to 54 Years | 130 (5.6%) | 201 (7.1%) |
| 55 to 59 Years | 201 (8.7%) | 212 (7.5%) |
| 60 to 64 Years | 161 (6.9%) | 179 (6.3%) |
| 65 to 69 Years | 158 (6.8%) | 139 (4.9%) |
| 70 to 74 Years | 90 (3.9%) | 202 (7.1%) |
| 75 to 79 Years | 160 (6.9%) | 150 (5.3%) |
| 80 to 84 Years | 29 (1.3%) | 30 (1.1%) |
| 85 Years and over | 20 (0.9%) | 66 (2.3%) |
| Total | 2,319 (100.0%) | 2,838 (100.0%) |
Families and Households in Layhill
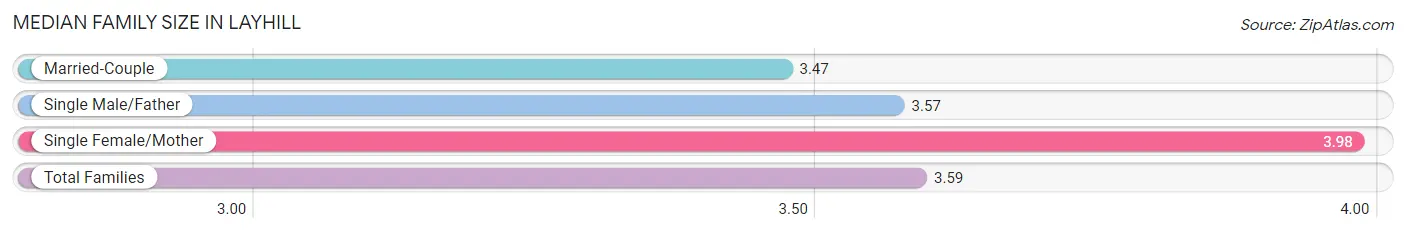
Median Family Size in Layhill
The median family size in Layhill is 3.59 persons per family, with single female/mother families (290 | 23.4%) accounting for the largest median family size of 3.98 persons per family. On the other hand, married-couple families (914 | 73.7%) represent the smallest median family size with 3.47 persons per family.
| Family Type | # Families | Family Size |
| Married-Couple | 914 (73.7%) | 3.47 |
| Single Male/Father | 37 (3.0%) | 3.57 |
| Single Female/Mother | 290 (23.4%) | 3.98 |
| Total Families | 1,241 (100.0%) | 3.59 |
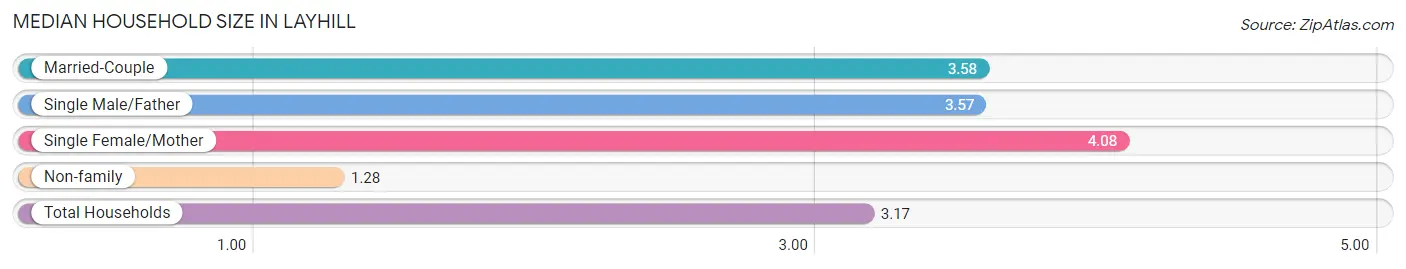
Median Household Size in Layhill
The median household size in Layhill is 3.17 persons per household, with single female/mother households (290 | 18.3%) accounting for the largest median household size of 4.08 persons per household. non-family households (344 | 21.7%) represent the smallest median household size with 1.28 persons per household.
| Household Type | # Households | Household Size |
| Married-Couple | 914 (57.7%) | 3.58 |
| Single Male/Father | 37 (2.3%) | 3.57 |
| Single Female/Mother | 290 (18.3%) | 4.08 |
| Non-family | 344 (21.7%) | 1.28 |
| Total Households | 1,585 (100.0%) | 3.17 |
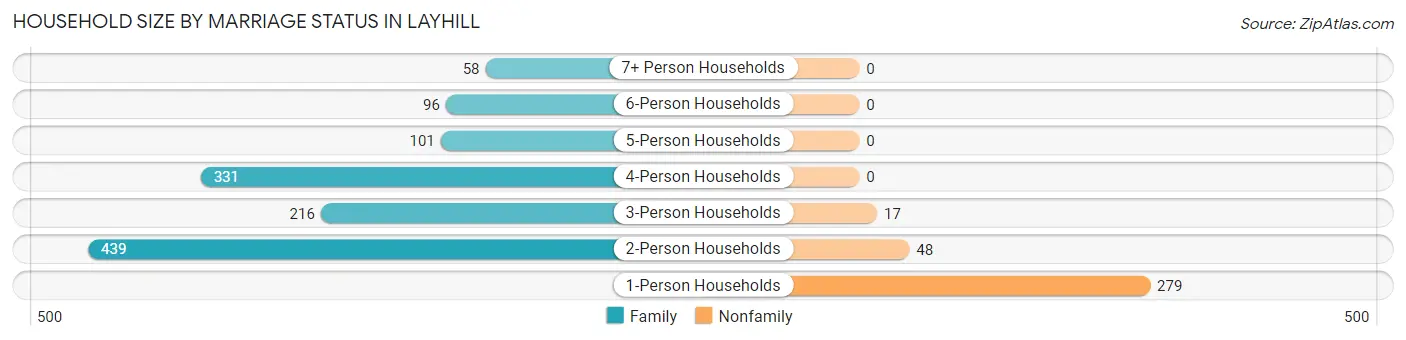
Household Size by Marriage Status in Layhill
Out of a total of 1,585 households in Layhill, 1,241 (78.3%) are family households, while 344 (21.7%) are nonfamily households. The most numerous type of family households are 2-person households, comprising 439, and the most common type of nonfamily households are 1-person households, comprising 279.
| Household Size | Family Households | Nonfamily Households |
| 1-Person Households | - | 279 (17.6%) |
| 2-Person Households | 439 (27.7%) | 48 (3.0%) |
| 3-Person Households | 216 (13.6%) | 17 (1.1%) |
| 4-Person Households | 331 (20.9%) | 0 (0.0%) |
| 5-Person Households | 101 (6.4%) | 0 (0.0%) |
| 6-Person Households | 96 (6.1%) | 0 (0.0%) |
| 7+ Person Households | 58 (3.7%) | 0 (0.0%) |
| Total | 1,241 (78.3%) | 344 (21.7%) |
Female Fertility in Layhill
Fertility by Age in Layhill
Average fertility rate in Layhill is 34.0 births per 1,000 women. Women in the age bracket of 15 to 19 years have the highest fertility rate with 123.0 births per 1,000 women. Women in the age bracket of 15 to 19 years acount for 85.1% of all women with births.
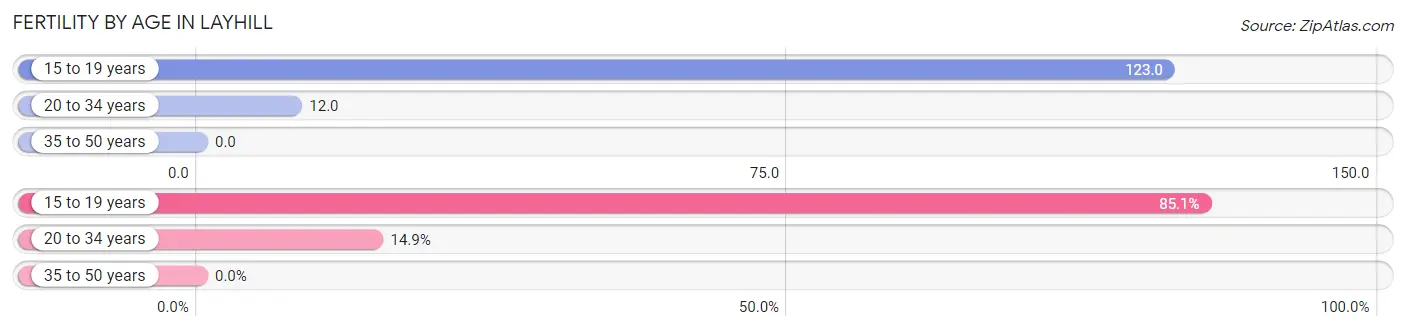
| Age Bracket | Women with Births | Births / 1,000 Women |
| 15 to 19 years | 40 (85.1%) | 123.0 |
| 20 to 34 years | 7 (14.9%) | 12.0 |
| 35 to 50 years | 0 (0.0%) | 0.0 |
| Total | 47 (100.0%) | 34.0 |
Fertility by Age by Marriage Status in Layhill
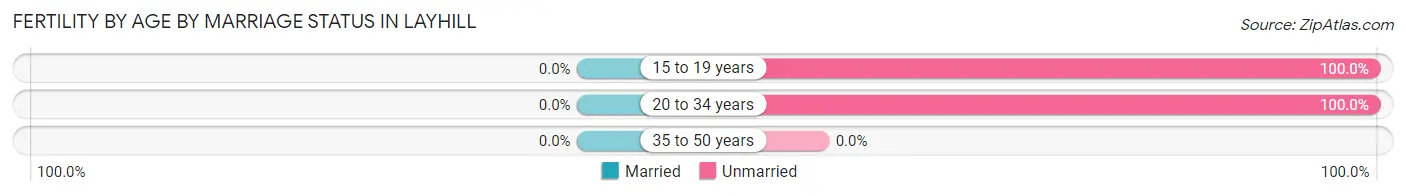
| Age Bracket | Married | Unmarried |
| 15 to 19 years | 0 (0.0%) | 40 (100.0%) |
| 20 to 34 years | 0 (0.0%) | 7 (100.0%) |
| 35 to 50 years | 0 (0.0%) | 0 (0.0%) |
| Total | 0 (0.0%) | 47 (100.0%) |
Fertility by Education in Layhill
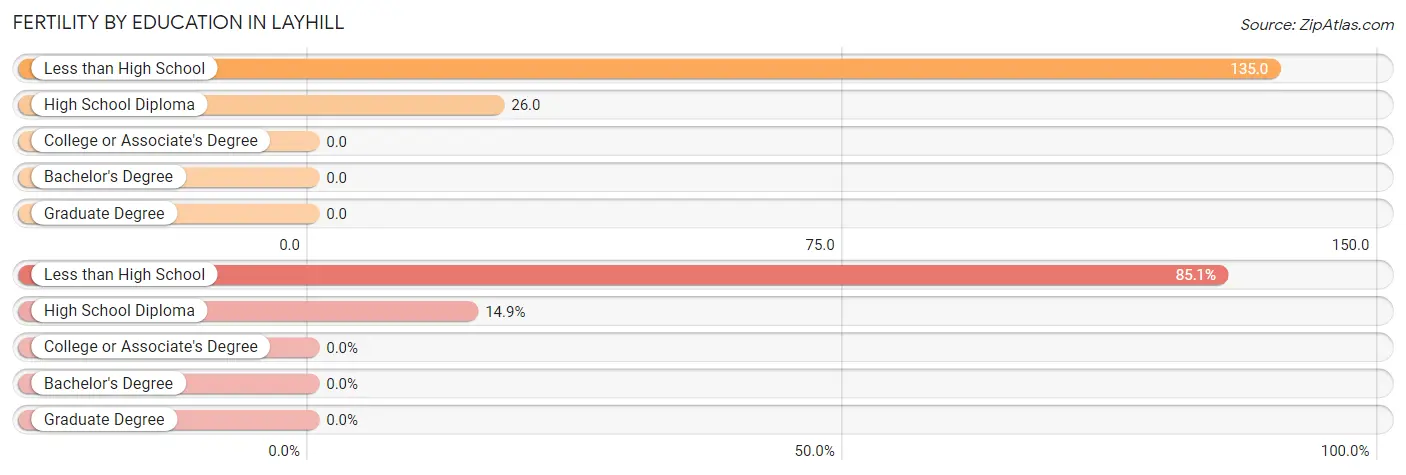
| Educational Attainment | Women with Births | Births / 1,000 Women |
| Less than High School | 40 (85.1%) | 135.0 |
| High School Diploma | 7 (14.9%) | 26.0 |
| College or Associate's Degree | 0 (0.0%) | 0.0 |
| Bachelor's Degree | 0 (0.0%) | 0.0 |
| Graduate Degree | 0 (0.0%) | 0.0 |
| Total | 47 (100.0%) | 34.0 |
Fertility by Education by Marriage Status in Layhill
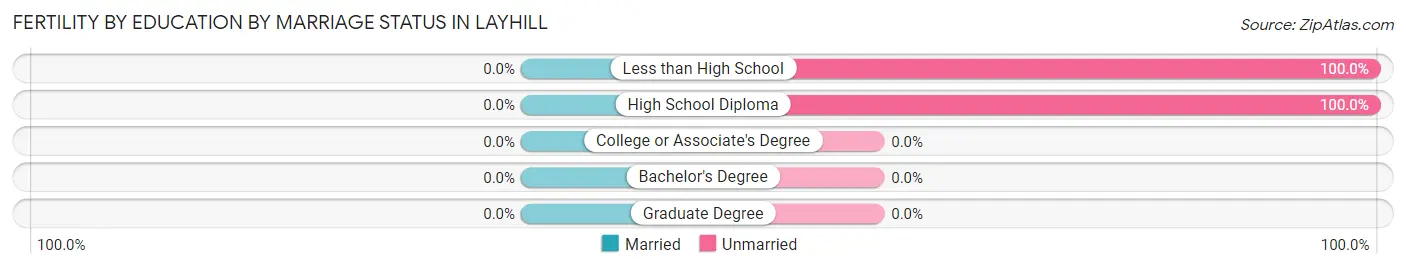
| Educational Attainment | Married | Unmarried |
| Less than High School | 0 (0.0%) | 40 (100.0%) |
| High School Diploma | 0 (0.0%) | 7 (100.0%) |
| College or Associate's Degree | 0 (0.0%) | 0 (0.0%) |
| Bachelor's Degree | 0 (0.0%) | 0 (0.0%) |
| Graduate Degree | 0 (0.0%) | 0 (0.0%) |
| Total | 0 (0.0%) | 47 (100.0%) |
Employment Characteristics in Layhill
Employment by Class of Employer in Layhill
Among the 2,682 employed individuals in Layhill, private company employees (1,478 | 55.1%), not-for-profit organizations (340 | 12.7%), and federal government employees (288 | 10.7%) make up the most common classes of employment.
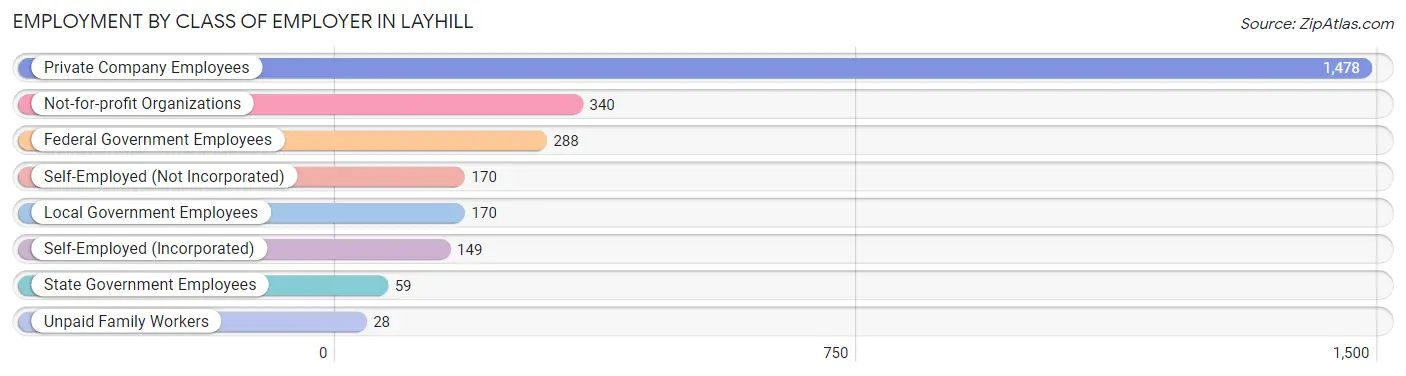
| Employer Class | # Employees | % Employees |
| Private Company Employees | 1,478 | 55.1% |
| Self-Employed (Incorporated) | 149 | 5.6% |
| Self-Employed (Not Incorporated) | 170 | 6.3% |
| Not-for-profit Organizations | 340 | 12.7% |
| Local Government Employees | 170 | 6.3% |
| State Government Employees | 59 | 2.2% |
| Federal Government Employees | 288 | 10.7% |
| Unpaid Family Workers | 28 | 1.0% |
| Total | 2,682 | 100.0% |
Employment Status by Age in Layhill
According to the labor force statistics for Layhill, out of the total population over 16 years of age (4,366), 68.6% or 2,995 individuals are in the labor force, with 6.2% or 186 of them unemployed. The age group with the highest labor force participation rate is 30 to 34 years, with 99.3% or 141 individuals in the labor force. Within the labor force, the 75 years and over age range has the highest percentage of unemployed individuals, with 24.2% or 15 of them being unemployed.
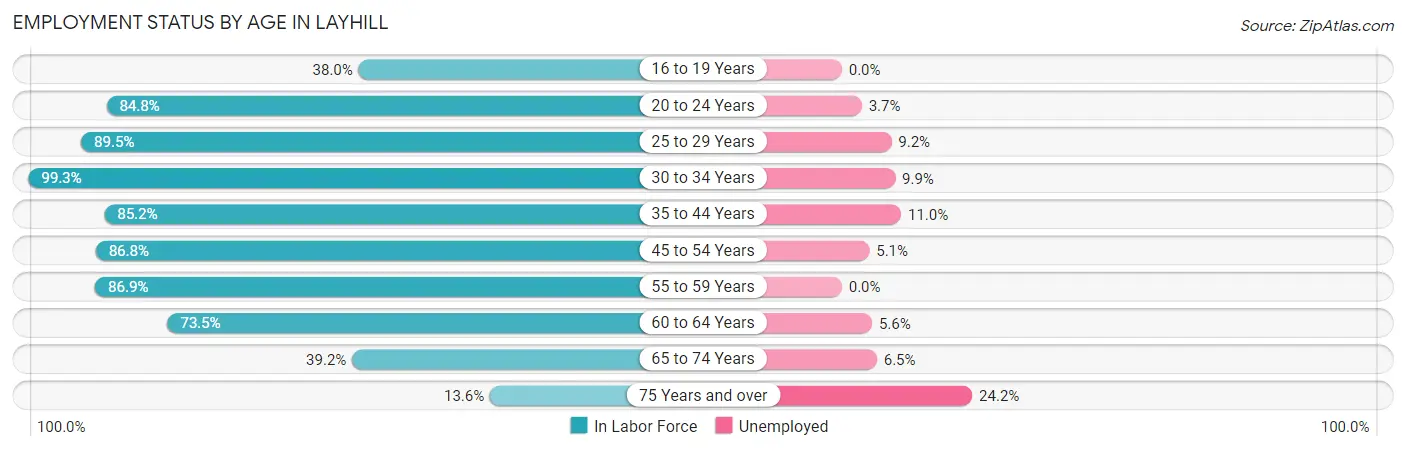
| Age Bracket | In Labor Force | Unemployed |
| 16 to 19 Years | 111 (38.0%) | 0 (0.0%) |
| 20 to 24 Years | 462 (84.8%) | 17 (3.7%) |
| 25 to 29 Years | 272 (89.5%) | 25 (9.2%) |
| 30 to 34 Years | 141 (99.3%) | 14 (9.9%) |
| 35 to 44 Years | 471 (85.2%) | 52 (11.0%) |
| 45 to 54 Years | 636 (86.8%) | 32 (5.1%) |
| 55 to 59 Years | 359 (86.9%) | 0 (0.0%) |
| 60 to 64 Years | 250 (73.5%) | 14 (5.6%) |
| 65 to 74 Years | 231 (39.2%) | 15 (6.5%) |
| 75 Years and over | 62 (13.6%) | 15 (24.2%) |
| Total | 2,995 (68.6%) | 186 (6.2%) |
Employment Status by Educational Attainment in Layhill
According to labor force statistics for Layhill, 85.7% of individuals (2,130) out of the total population between 25 and 64 years of age (2,485) are in the labor force, with 6.5% or 138 of them being unemployed. The group with the highest labor force participation rate are those with the educational attainment of bachelor's degree or higher, with 90.3% or 1,013 individuals in the labor force. Within the labor force, individuals with college / associate degree education have the highest percentage of unemployment, with 12.0% or 70 of them being unemployed.
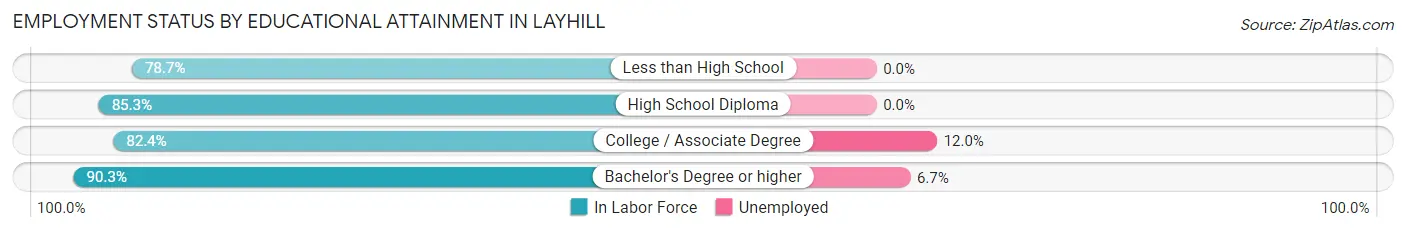
| Educational Attainment | In Labor Force | Unemployed |
| Less than High School | 311 (78.7%) | 0 (0.0%) |
| High School Diploma | 221 (85.3%) | 0 (0.0%) |
| College / Associate Degree | 584 (82.4%) | 85 (12.0%) |
| Bachelor's Degree or higher | 1,013 (90.3%) | 75 (6.7%) |
| Total | 2,130 (85.7%) | 162 (6.5%) |
Employment Occupations by Sex in Layhill
Management, Business, Science and Arts Occupations
The most common Management, Business, Science and Arts occupations in Layhill are Management (363 | 13.0%), Community & Social Service (272 | 9.8%), Computers, Engineering & Science (227 | 8.1%), Business & Financial (226 | 8.1%), and Health Diagnosing & Treating (212 | 7.6%).
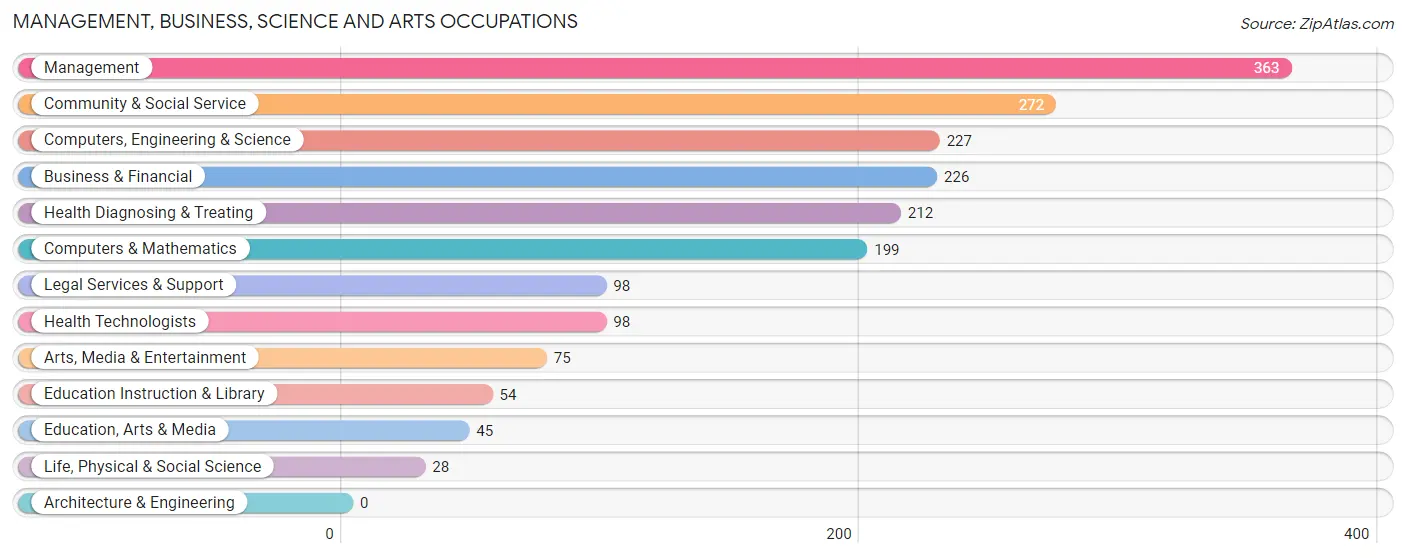
Management, Business, Science and Arts Occupations by Sex
Within the Management, Business, Science and Arts occupations in Layhill, the most male-oriented occupations are Computers & Mathematics (80.4%), Computers, Engineering & Science (77.1%), and Arts, Media & Entertainment (57.3%), while the most female-oriented occupations are Education Instruction & Library (90.7%), Health Technologists (73.5%), and Business & Financial (67.3%).
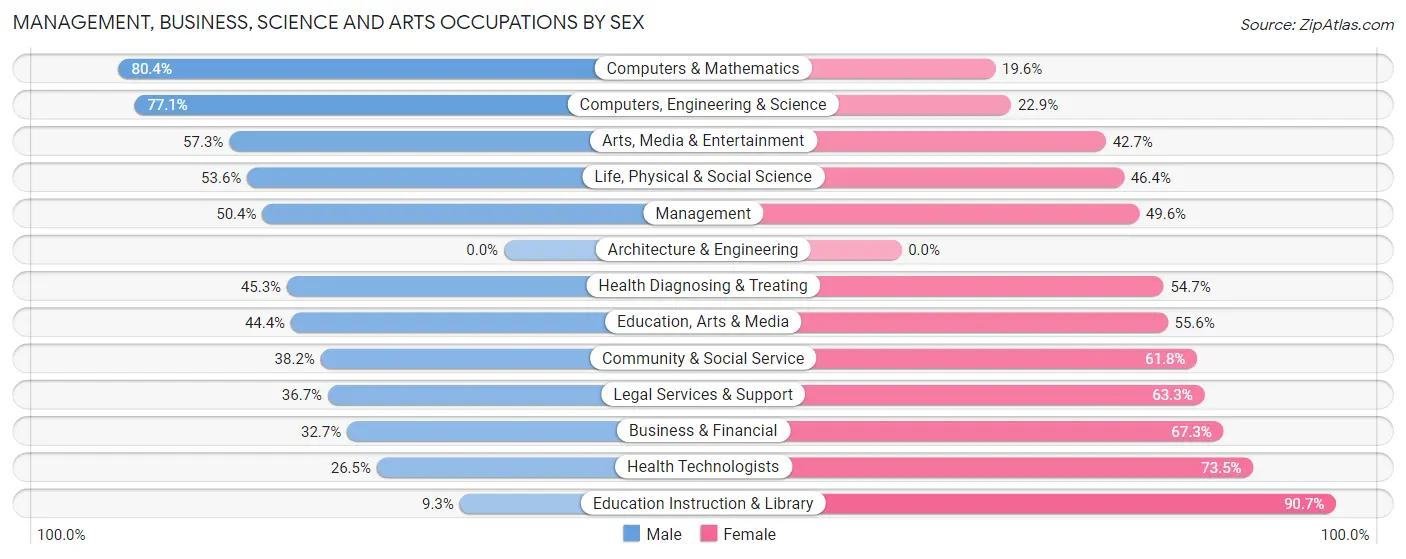
| Occupation | Male | Female |
| Management | 183 (50.4%) | 180 (49.6%) |
| Business & Financial | 74 (32.7%) | 152 (67.3%) |
| Computers, Engineering & Science | 175 (77.1%) | 52 (22.9%) |
| Computers & Mathematics | 160 (80.4%) | 39 (19.6%) |
| Architecture & Engineering | 0 (0.0%) | 0 (0.0%) |
| Life, Physical & Social Science | 15 (53.6%) | 13 (46.4%) |
| Community & Social Service | 104 (38.2%) | 168 (61.8%) |
| Education, Arts & Media | 20 (44.4%) | 25 (55.6%) |
| Legal Services & Support | 36 (36.7%) | 62 (63.3%) |
| Education Instruction & Library | 5 (9.3%) | 49 (90.7%) |
| Arts, Media & Entertainment | 43 (57.3%) | 32 (42.7%) |
| Health Diagnosing & Treating | 96 (45.3%) | 116 (54.7%) |
| Health Technologists | 26 (26.5%) | 72 (73.5%) |
| Total (Category) | 632 (48.6%) | 668 (51.4%) |
| Total (Overall) | 1,237 (44.4%) | 1,552 (55.6%) |
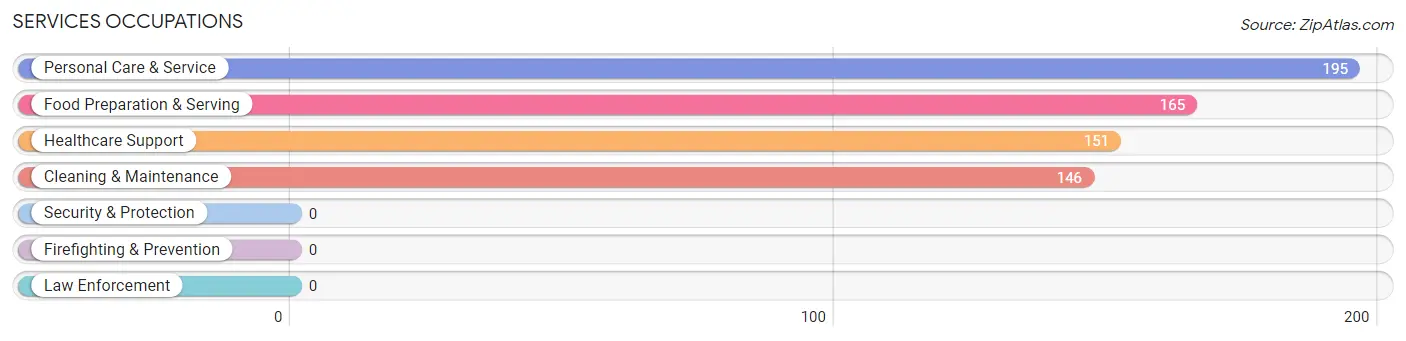
Services Occupations
The most common Services occupations in Layhill are Personal Care & Service (195 | 7.0%), Food Preparation & Serving (165 | 5.9%), Healthcare Support (151 | 5.4%), and Cleaning & Maintenance (146 | 5.2%).
Services Occupations by Sex
Within the Services occupations in Layhill, the most male-oriented occupations are Food Preparation & Serving (65.4%), and Cleaning & Maintenance (45.9%), while the most female-oriented occupations are Healthcare Support (100.0%), Personal Care & Service (100.0%), and Cleaning & Maintenance (54.1%).
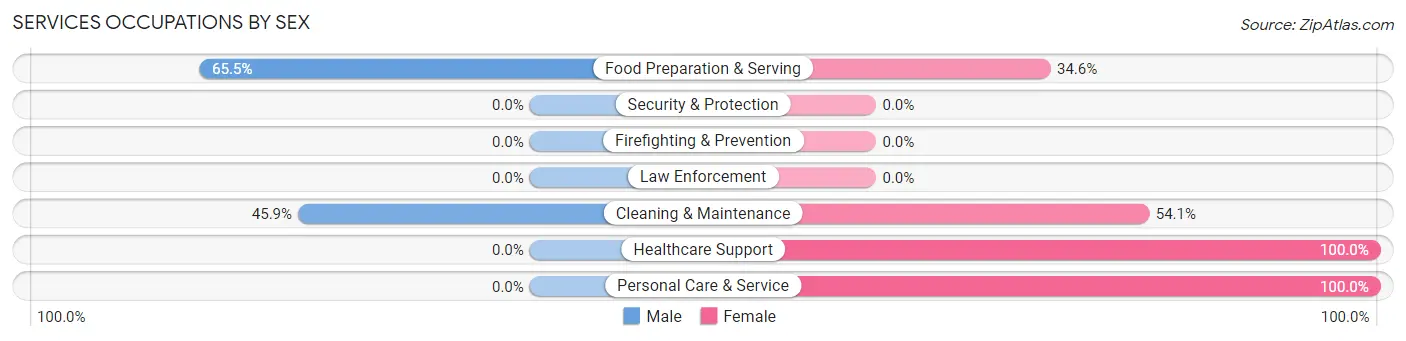
| Occupation | Male | Female |
| Healthcare Support | 0 (0.0%) | 151 (100.0%) |
| Security & Protection | 0 (0.0%) | 0 (0.0%) |
| Firefighting & Prevention | 0 (0.0%) | 0 (0.0%) |
| Law Enforcement | 0 (0.0%) | 0 (0.0%) |
| Food Preparation & Serving | 108 (65.4%) | 57 (34.5%) |
| Cleaning & Maintenance | 67 (45.9%) | 79 (54.1%) |
| Personal Care & Service | 0 (0.0%) | 195 (100.0%) |
| Total (Category) | 175 (26.6%) | 482 (73.4%) |
| Total (Overall) | 1,237 (44.4%) | 1,552 (55.6%) |
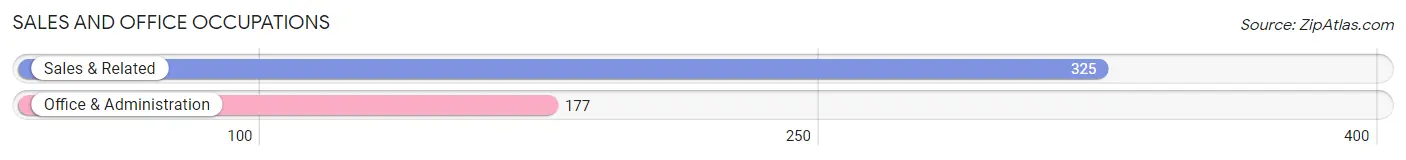
Sales and Office Occupations
The most common Sales and Office occupations in Layhill are Sales & Related (325 | 11.7%), and Office & Administration (177 | 6.4%).
Sales and Office Occupations by Sex
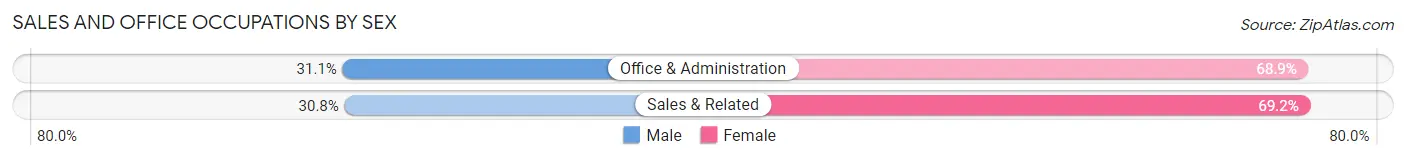
| Occupation | Male | Female |
| Sales & Related | 100 (30.8%) | 225 (69.2%) |
| Office & Administration | 55 (31.1%) | 122 (68.9%) |
| Total (Category) | 155 (30.9%) | 347 (69.1%) |
| Total (Overall) | 1,237 (44.4%) | 1,552 (55.6%) |
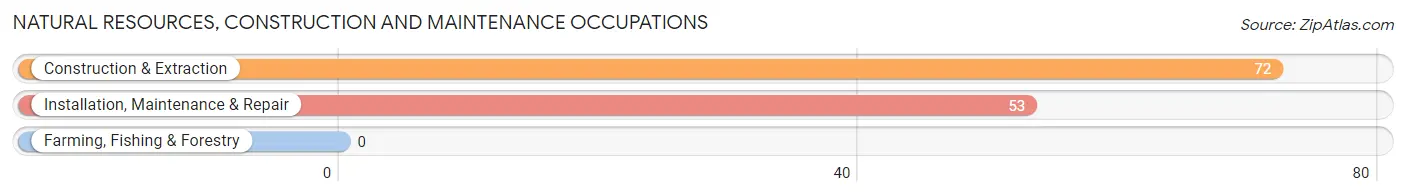
Natural Resources, Construction and Maintenance Occupations
The most common Natural Resources, Construction and Maintenance occupations in Layhill are Construction & Extraction (72 | 2.6%), and Installation, Maintenance & Repair (53 | 1.9%).
Natural Resources, Construction and Maintenance Occupations by Sex
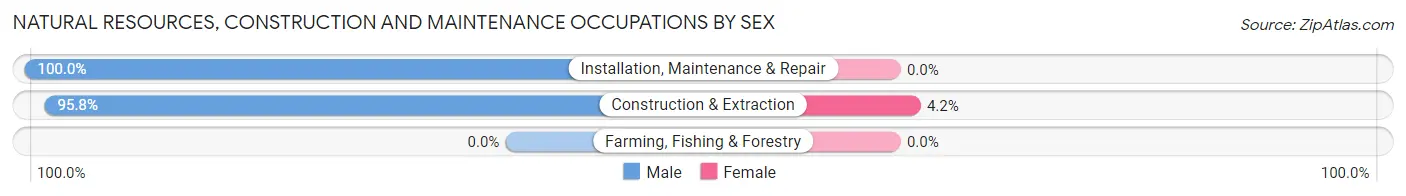
| Occupation | Male | Female |
| Farming, Fishing & Forestry | 0 (0.0%) | 0 (0.0%) |
| Construction & Extraction | 69 (95.8%) | 3 (4.2%) |
| Installation, Maintenance & Repair | 53 (100.0%) | 0 (0.0%) |
| Total (Category) | 122 (97.6%) | 3 (2.4%) |
| Total (Overall) | 1,237 (44.4%) | 1,552 (55.6%) |
Production, Transportation and Moving Occupations
The most common Production, Transportation and Moving occupations in Layhill are Transportation (115 | 4.1%), Material Moving (47 | 1.7%), and Production (43 | 1.5%).
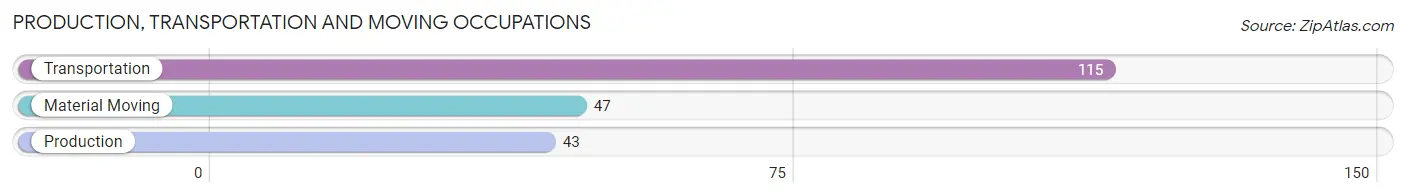
Production, Transportation and Moving Occupations by Sex
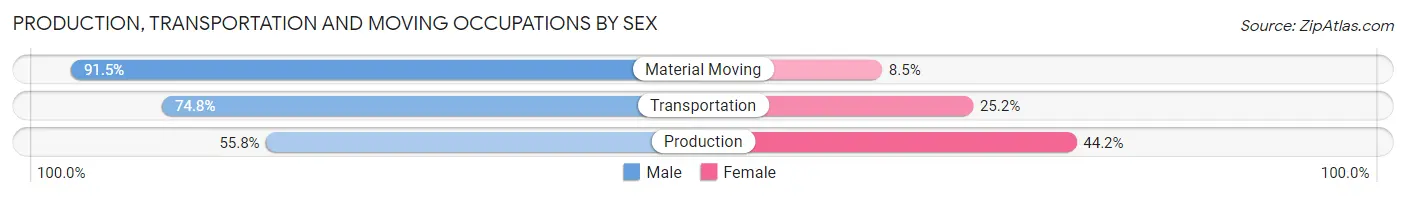
| Occupation | Male | Female |
| Production | 24 (55.8%) | 19 (44.2%) |
| Transportation | 86 (74.8%) | 29 (25.2%) |
| Material Moving | 43 (91.5%) | 4 (8.5%) |
| Total (Category) | 153 (74.6%) | 52 (25.4%) |
| Total (Overall) | 1,237 (44.4%) | 1,552 (55.6%) |
Employment Industries by Sex in Layhill
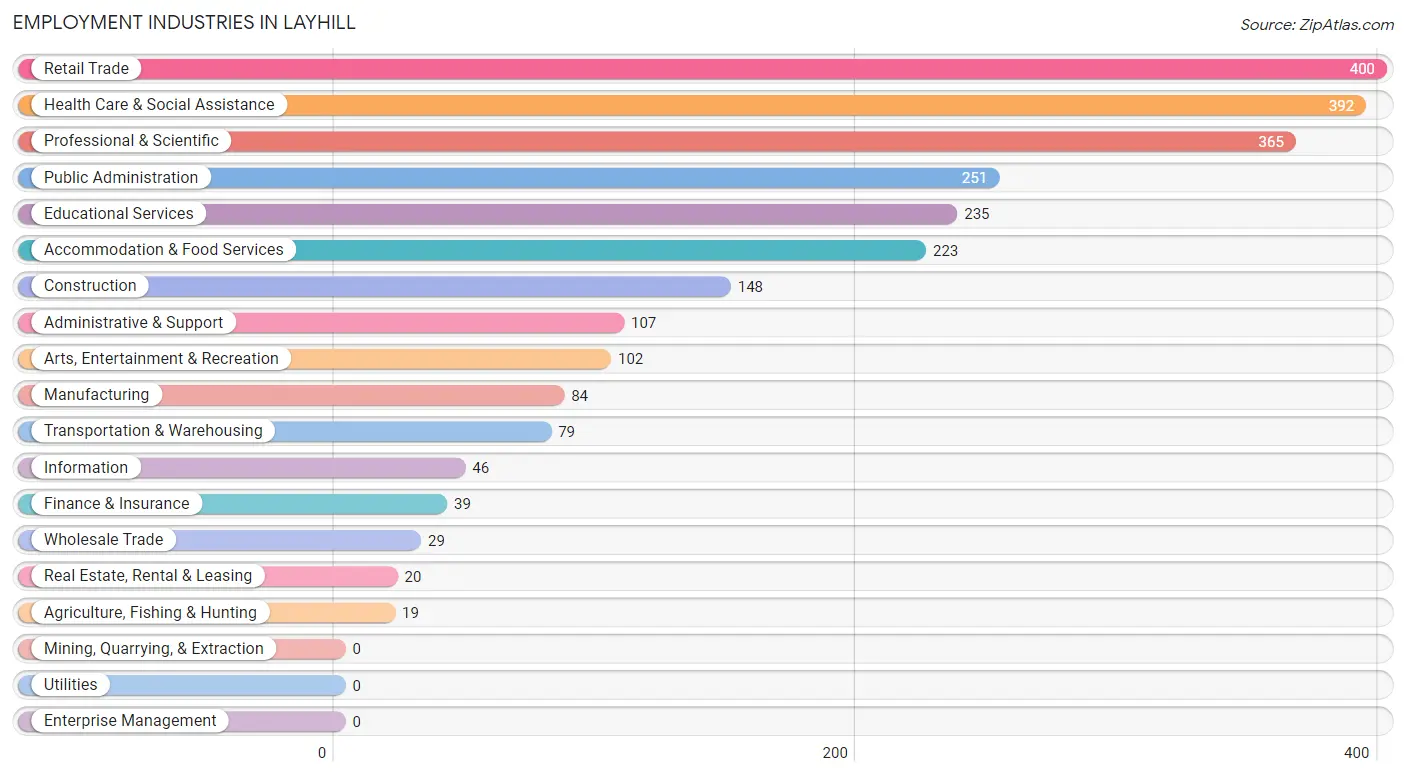
Employment Industries in Layhill
The major employment industries in Layhill include Retail Trade (400 | 14.3%), Health Care & Social Assistance (392 | 14.1%), Professional & Scientific (365 | 13.1%), Public Administration (251 | 9.0%), and Educational Services (235 | 8.4%).
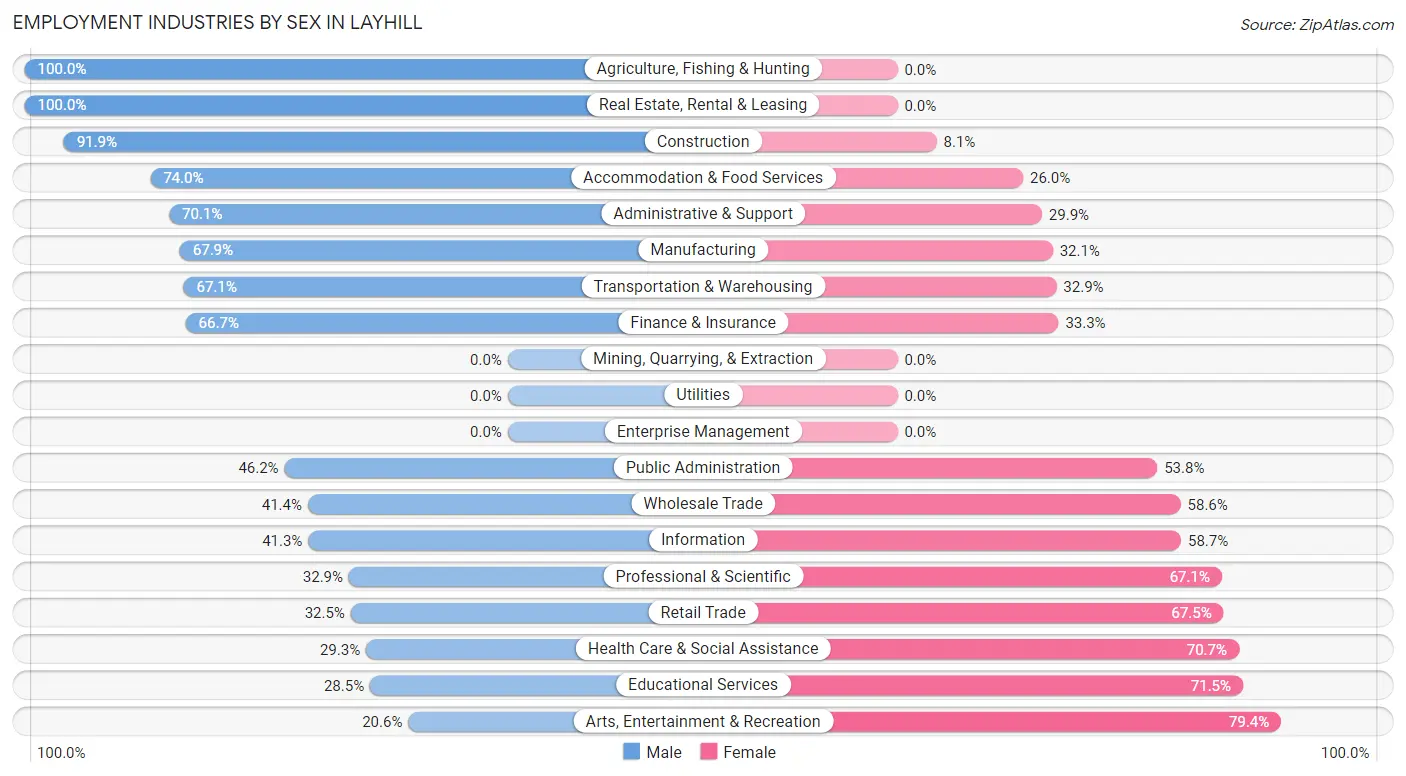
Employment Industries by Sex in Layhill
The Layhill industries that see more men than women are Agriculture, Fishing & Hunting (100.0%), Real Estate, Rental & Leasing (100.0%), and Construction (91.9%), whereas the industries that tend to have a higher number of women are Arts, Entertainment & Recreation (79.4%), Educational Services (71.5%), and Health Care & Social Assistance (70.7%).
| Industry | Male | Female |
| Agriculture, Fishing & Hunting | 19 (100.0%) | 0 (0.0%) |
| Mining, Quarrying, & Extraction | 0 (0.0%) | 0 (0.0%) |
| Construction | 136 (91.9%) | 12 (8.1%) |
| Manufacturing | 57 (67.9%) | 27 (32.1%) |
| Wholesale Trade | 12 (41.4%) | 17 (58.6%) |
| Retail Trade | 130 (32.5%) | 270 (67.5%) |
| Transportation & Warehousing | 53 (67.1%) | 26 (32.9%) |
| Utilities | 0 (0.0%) | 0 (0.0%) |
| Information | 19 (41.3%) | 27 (58.7%) |
| Finance & Insurance | 26 (66.7%) | 13 (33.3%) |
| Real Estate, Rental & Leasing | 20 (100.0%) | 0 (0.0%) |
| Professional & Scientific | 120 (32.9%) | 245 (67.1%) |
| Enterprise Management | 0 (0.0%) | 0 (0.0%) |
| Administrative & Support | 75 (70.1%) | 32 (29.9%) |
| Educational Services | 67 (28.5%) | 168 (71.5%) |
| Health Care & Social Assistance | 115 (29.3%) | 277 (70.7%) |
| Arts, Entertainment & Recreation | 21 (20.6%) | 81 (79.4%) |
| Accommodation & Food Services | 165 (74.0%) | 58 (26.0%) |
| Public Administration | 116 (46.2%) | 135 (53.8%) |
| Total | 1,237 (44.4%) | 1,552 (55.6%) |
Education in Layhill
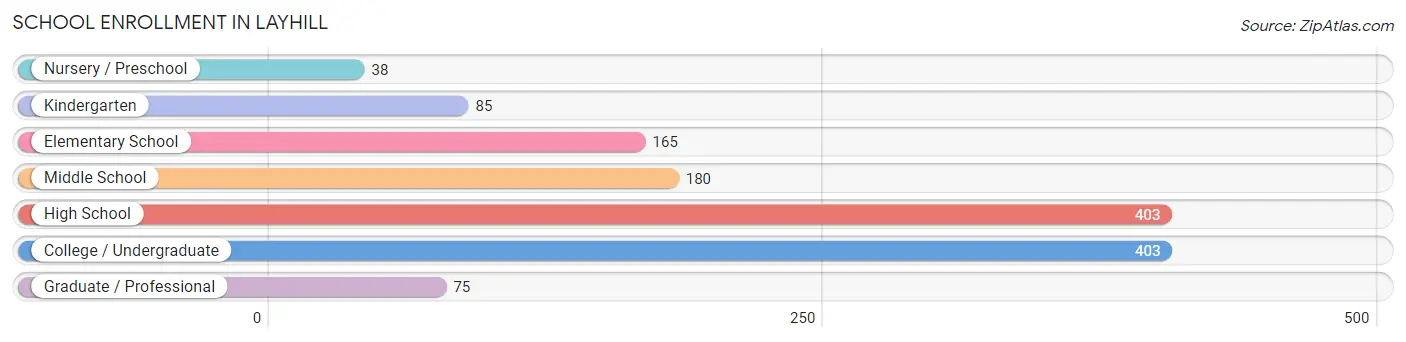
School Enrollment in Layhill
The most common levels of schooling among the 1,349 students in Layhill are high school (403 | 29.9%), college / undergraduate (403 | 29.9%), and middle school (180 | 13.3%).
| School Level | # Students | % Students |
| Nursery / Preschool | 38 | 2.8% |
| Kindergarten | 85 | 6.3% |
| Elementary School | 165 | 12.2% |
| Middle School | 180 | 13.3% |
| High School | 403 | 29.9% |
| College / Undergraduate | 403 | 29.9% |
| Graduate / Professional | 75 | 5.6% |
| Total | 1,349 | 100.0% |
School Enrollment by Age by Funding Source in Layhill
Out of a total of 1,349 students who are enrolled in schools in Layhill, 202 (15.0%) attend a private institution, while the remaining 1,147 (85.0%) are enrolled in public schools. The age group of 3 to 4 year olds has the highest likelihood of being enrolled in private schools, with 8 (100.0% in the age bracket) enrolled. Conversely, the age group of 15 to 17 year olds has the lowest likelihood of being enrolled in a private school, with 291 (92.4% in the age bracket) attending a public institution.
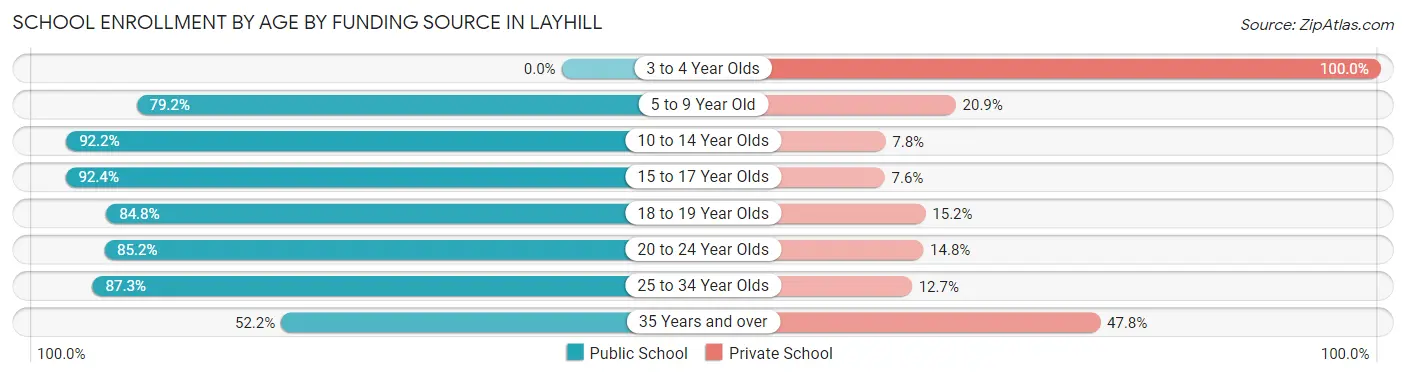
| Age Bracket | Public School | Private School |
| 3 to 4 Year Olds | 0 (0.0%) | 8 (100.0%) |
| 5 to 9 Year Old | 186 (79.1%) | 49 (20.8%) |
| 10 to 14 Year Olds | 226 (92.2%) | 19 (7.8%) |
| 15 to 17 Year Olds | 291 (92.4%) | 24 (7.6%) |
| 18 to 19 Year Olds | 117 (84.8%) | 21 (15.2%) |
| 20 to 24 Year Olds | 230 (85.2%) | 40 (14.8%) |
| 25 to 34 Year Olds | 62 (87.3%) | 9 (12.7%) |
| 35 Years and over | 35 (52.2%) | 32 (47.8%) |
| Total | 1,147 (85.0%) | 202 (15.0%) |
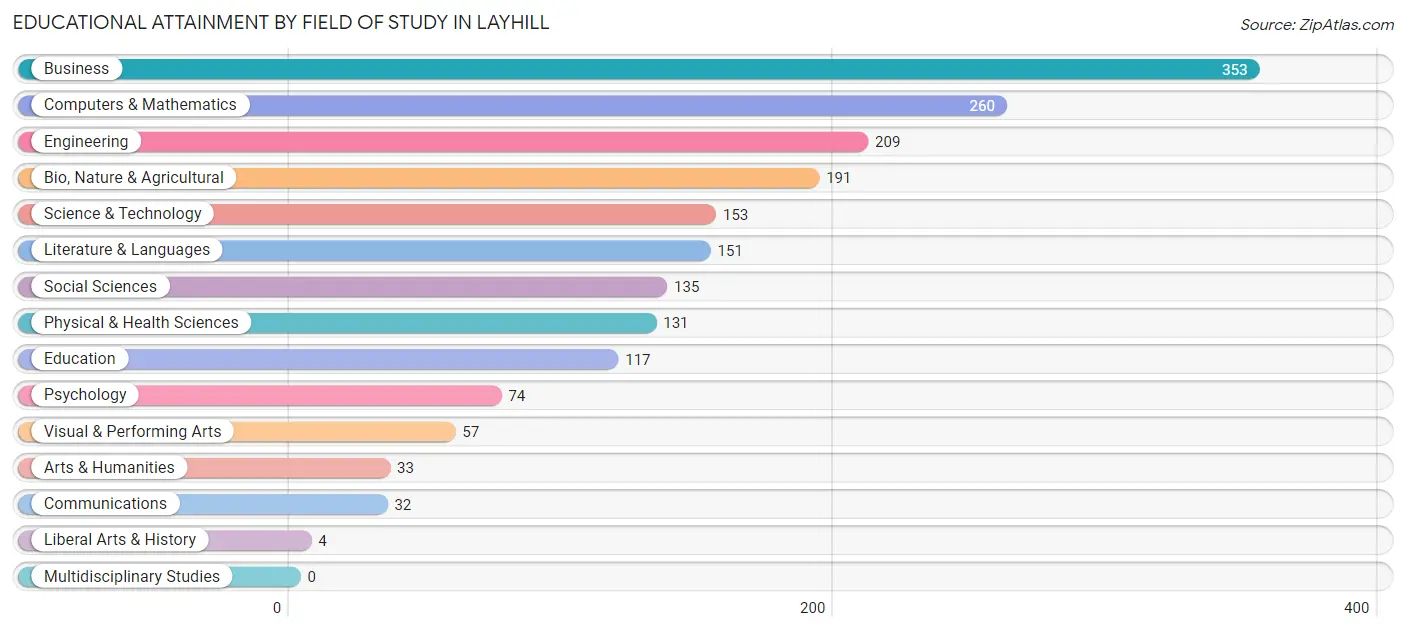
Educational Attainment by Field of Study in Layhill
Business (353 | 18.6%), computers & mathematics (260 | 13.7%), engineering (209 | 11.0%), bio, nature & agricultural (191 | 10.1%), and science & technology (153 | 8.1%) are the most common fields of study among 1,900 individuals in Layhill who have obtained a bachelor's degree or higher.
| Field of Study | # Graduates | % Graduates |
| Computers & Mathematics | 260 | 13.7% |
| Bio, Nature & Agricultural | 191 | 10.1% |
| Physical & Health Sciences | 131 | 6.9% |
| Psychology | 74 | 3.9% |
| Social Sciences | 135 | 7.1% |
| Engineering | 209 | 11.0% |
| Multidisciplinary Studies | 0 | 0.0% |
| Science & Technology | 153 | 8.1% |
| Business | 353 | 18.6% |
| Education | 117 | 6.2% |
| Literature & Languages | 151 | 8.0% |
| Liberal Arts & History | 4 | 0.2% |
| Visual & Performing Arts | 57 | 3.0% |
| Communications | 32 | 1.7% |
| Arts & Humanities | 33 | 1.7% |
| Total | 1,900 | 100.0% |
Transportation & Commute in Layhill
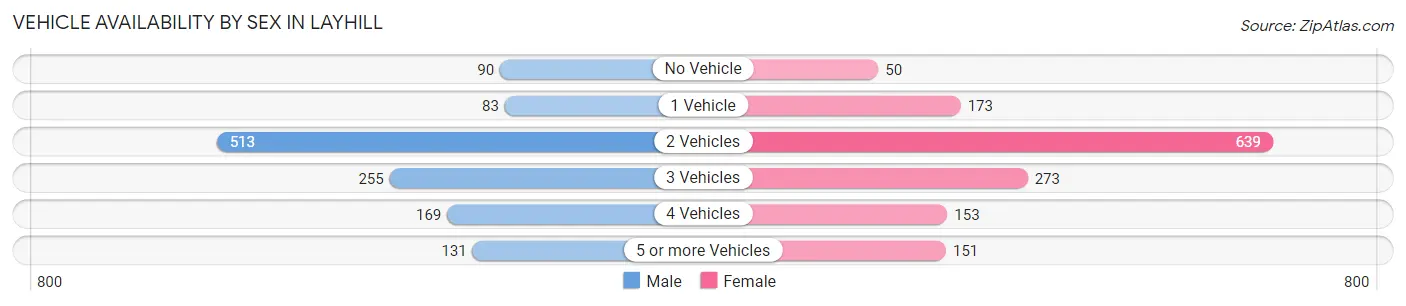
Vehicle Availability by Sex in Layhill
The most prevalent vehicle ownership categories in Layhill are males with 2 vehicles (513, accounting for 41.3%) and females with 2 vehicles (639, making up 35.6%).
| Vehicles Available | Male | Female |
| No Vehicle | 90 (7.2%) | 50 (3.5%) |
| 1 Vehicle | 83 (6.7%) | 173 (12.0%) |
| 2 Vehicles | 513 (41.3%) | 639 (44.4%) |
| 3 Vehicles | 255 (20.5%) | 273 (19.0%) |
| 4 Vehicles | 169 (13.6%) | 153 (10.6%) |
| 5 or more Vehicles | 131 (10.6%) | 151 (10.5%) |
| Total | 1,241 (100.0%) | 1,439 (100.0%) |
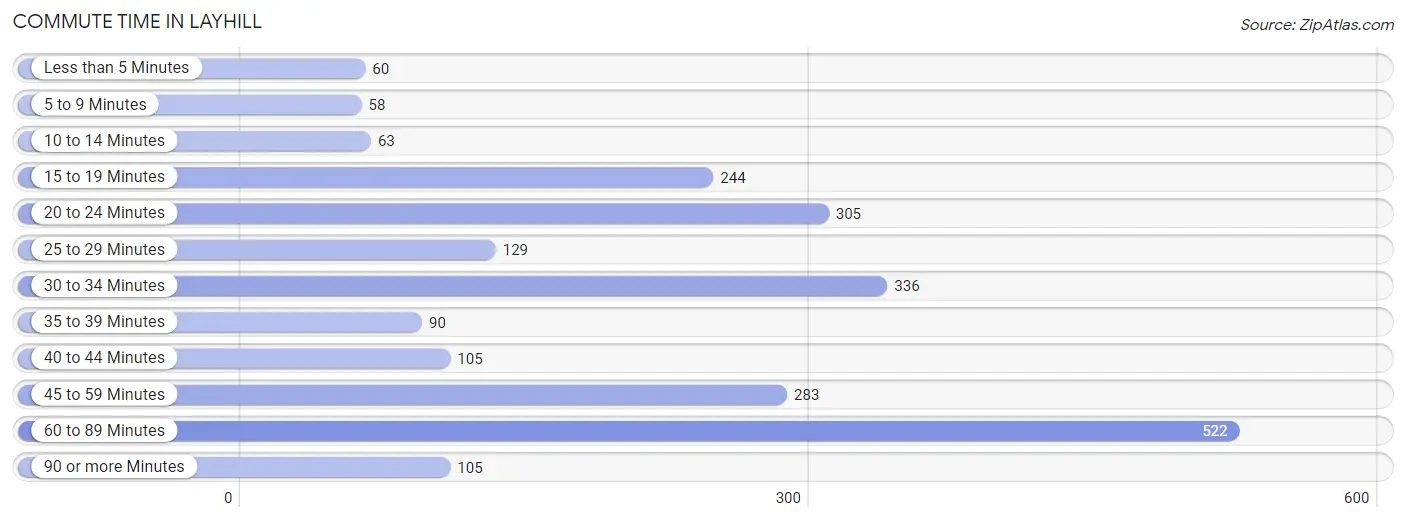
Commute Time in Layhill
The most frequently occuring commute durations in Layhill are 60 to 89 minutes (522 commuters, 22.7%), 30 to 34 minutes (336 commuters, 14.6%), and 20 to 24 minutes (305 commuters, 13.3%).
| Commute Time | # Commuters | % Commuters |
| Less than 5 Minutes | 60 | 2.6% |
| 5 to 9 Minutes | 58 | 2.5% |
| 10 to 14 Minutes | 63 | 2.7% |
| 15 to 19 Minutes | 244 | 10.6% |
| 20 to 24 Minutes | 305 | 13.3% |
| 25 to 29 Minutes | 129 | 5.6% |
| 30 to 34 Minutes | 336 | 14.6% |
| 35 to 39 Minutes | 90 | 3.9% |
| 40 to 44 Minutes | 105 | 4.6% |
| 45 to 59 Minutes | 283 | 12.3% |
| 60 to 89 Minutes | 522 | 22.7% |
| 90 or more Minutes | 105 | 4.6% |
Commute Time by Sex in Layhill
The most common commute times in Layhill are 60 to 89 minutes (336 commuters, 31.6%) for males and 20 to 24 minutes (199 commuters, 16.1%) for females.
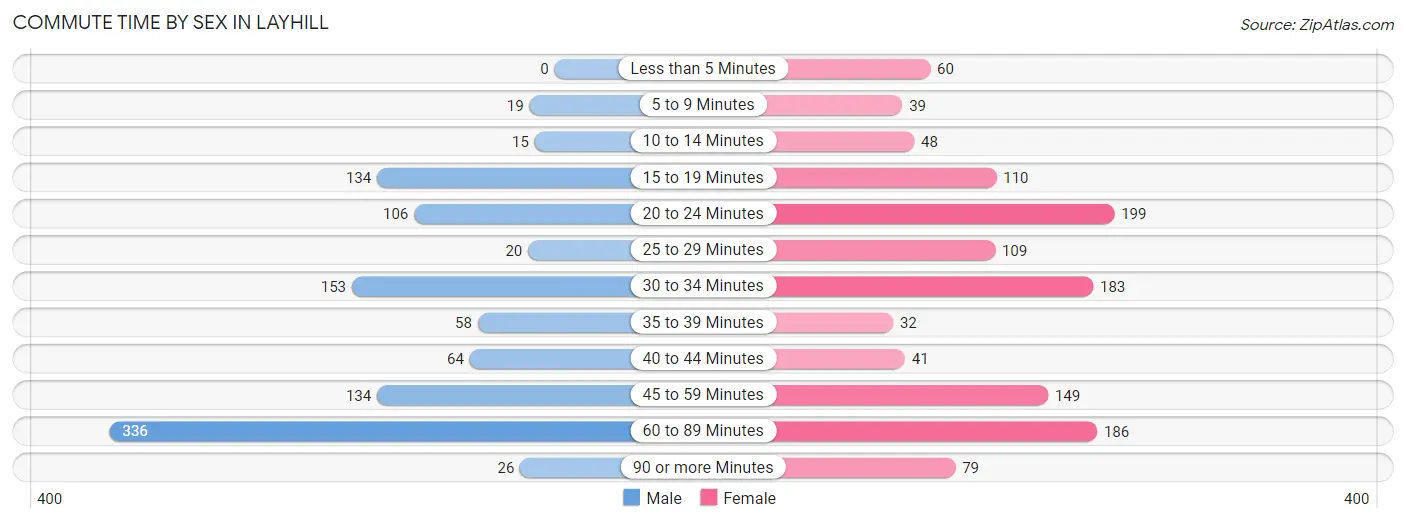
| Commute Time | Male | Female |
| Less than 5 Minutes | 0 (0.0%) | 60 (4.9%) |
| 5 to 9 Minutes | 19 (1.8%) | 39 (3.2%) |
| 10 to 14 Minutes | 15 (1.4%) | 48 (3.9%) |
| 15 to 19 Minutes | 134 (12.6%) | 110 (8.9%) |
| 20 to 24 Minutes | 106 (10.0%) | 199 (16.1%) |
| 25 to 29 Minutes | 20 (1.9%) | 109 (8.8%) |
| 30 to 34 Minutes | 153 (14.4%) | 183 (14.8%) |
| 35 to 39 Minutes | 58 (5.4%) | 32 (2.6%) |
| 40 to 44 Minutes | 64 (6.0%) | 41 (3.3%) |
| 45 to 59 Minutes | 134 (12.6%) | 149 (12.1%) |
| 60 to 89 Minutes | 336 (31.6%) | 186 (15.1%) |
| 90 or more Minutes | 26 (2.4%) | 79 (6.4%) |
Time of Departure to Work by Sex in Layhill
The most frequent times of departure to work in Layhill are 7:00 AM to 7:29 AM (166, 15.6%) for males and 7:00 AM to 7:29 AM (213, 17.2%) for females.
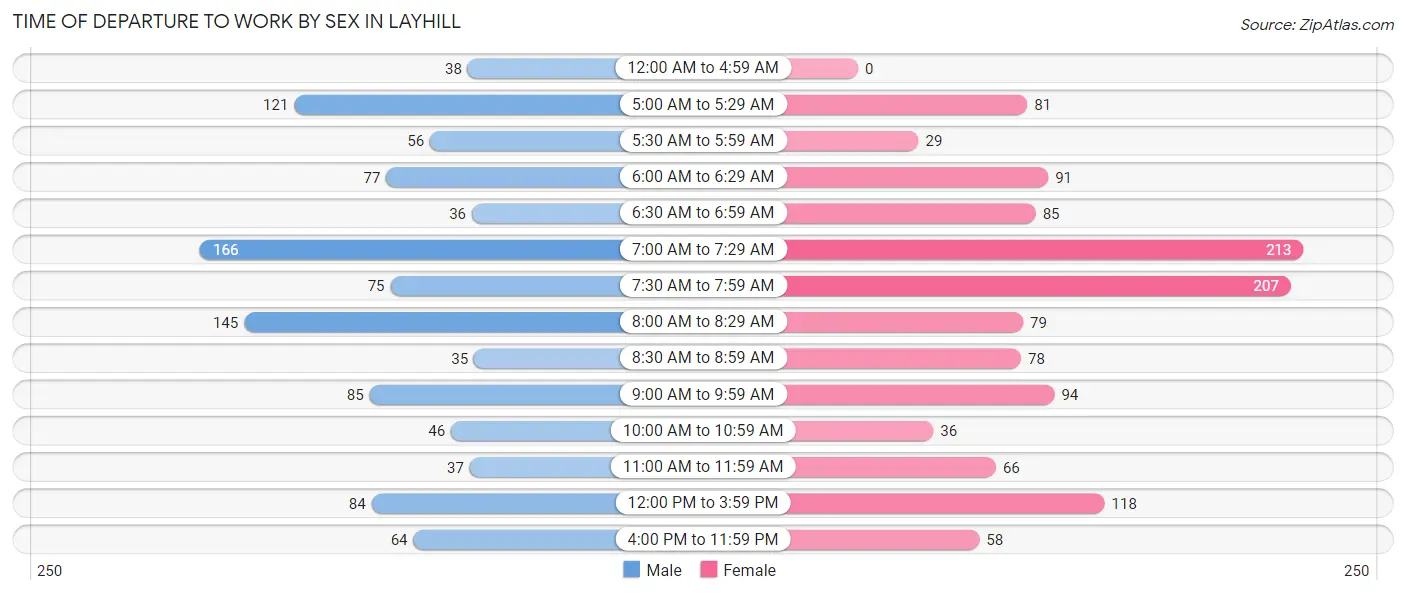
| Time of Departure | Male | Female |
| 12:00 AM to 4:59 AM | 38 (3.6%) | 0 (0.0%) |
| 5:00 AM to 5:29 AM | 121 (11.4%) | 81 (6.6%) |
| 5:30 AM to 5:59 AM | 56 (5.3%) | 29 (2.4%) |
| 6:00 AM to 6:29 AM | 77 (7.2%) | 91 (7.4%) |
| 6:30 AM to 6:59 AM | 36 (3.4%) | 85 (6.9%) |
| 7:00 AM to 7:29 AM | 166 (15.6%) | 213 (17.2%) |
| 7:30 AM to 7:59 AM | 75 (7.0%) | 207 (16.8%) |
| 8:00 AM to 8:29 AM | 145 (13.6%) | 79 (6.4%) |
| 8:30 AM to 8:59 AM | 35 (3.3%) | 78 (6.3%) |
| 9:00 AM to 9:59 AM | 85 (8.0%) | 94 (7.6%) |
| 10:00 AM to 10:59 AM | 46 (4.3%) | 36 (2.9%) |
| 11:00 AM to 11:59 AM | 37 (3.5%) | 66 (5.3%) |
| 12:00 PM to 3:59 PM | 84 (7.9%) | 118 (9.6%) |
| 4:00 PM to 11:59 PM | 64 (6.0%) | 58 (4.7%) |
| Total | 1,065 (100.0%) | 1,235 (100.0%) |
Housing Occupancy in Layhill
Occupancy by Ownership in Layhill
Of the total 1,585 dwellings in Layhill, owner-occupied units account for 1,400 (88.3%), while renter-occupied units make up 185 (11.7%).
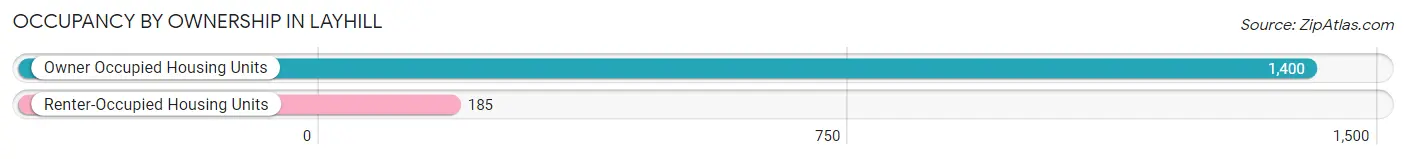
| Occupancy | # Housing Units | % Housing Units |
| Owner Occupied Housing Units | 1,400 | 88.3% |
| Renter-Occupied Housing Units | 185 | 11.7% |
| Total Occupied Housing Units | 1,585 | 100.0% |
Occupancy by Household Size in Layhill
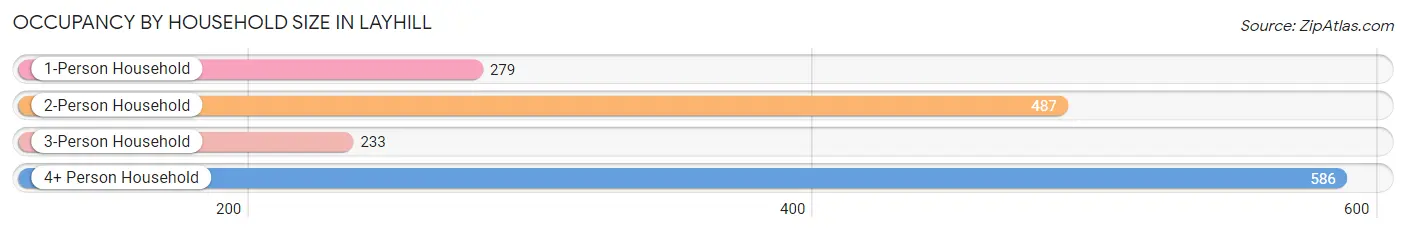
| Household Size | # Housing Units | % Housing Units |
| 1-Person Household | 279 | 17.6% |
| 2-Person Household | 487 | 30.7% |
| 3-Person Household | 233 | 14.7% |
| 4+ Person Household | 586 | 37.0% |
| Total Housing Units | 1,585 | 100.0% |
Occupancy by Ownership by Household Size in Layhill
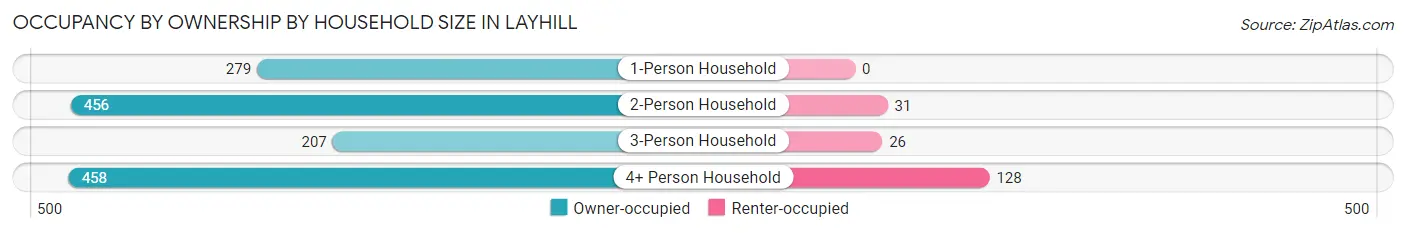
| Household Size | Owner-occupied | Renter-occupied |
| 1-Person Household | 279 (100.0%) | 0 (0.0%) |
| 2-Person Household | 456 (93.6%) | 31 (6.4%) |
| 3-Person Household | 207 (88.8%) | 26 (11.2%) |
| 4+ Person Household | 458 (78.2%) | 128 (21.8%) |
| Total Housing Units | 1,400 (88.3%) | 185 (11.7%) |
Occupancy by Educational Attainment in Layhill
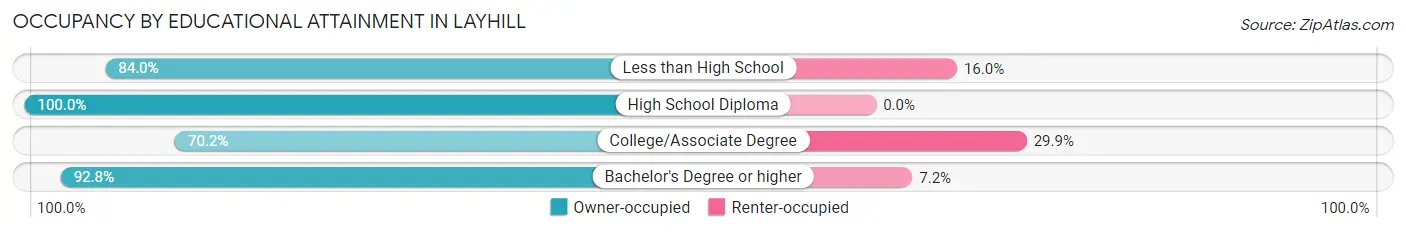
| Household Size | Owner-occupied | Renter-occupied |
| Less than High School | 194 (84.0%) | 37 (16.0%) |
| High School Diploma | 137 (100.0%) | 0 (0.0%) |
| College/Associate Degree | 188 (70.2%) | 80 (29.8%) |
| Bachelor's Degree or higher | 881 (92.8%) | 68 (7.2%) |
Occupancy by Age of Householder in Layhill
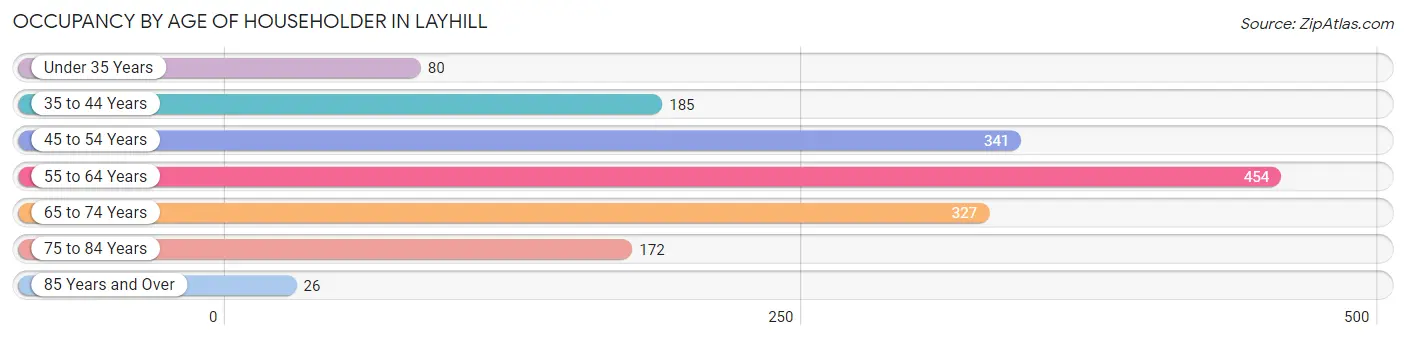
| Age Bracket | # Households | % Households |
| Under 35 Years | 80 | 5.1% |
| 35 to 44 Years | 185 | 11.7% |
| 45 to 54 Years | 341 | 21.5% |
| 55 to 64 Years | 454 | 28.6% |
| 65 to 74 Years | 327 | 20.6% |
| 75 to 84 Years | 172 | 10.8% |
| 85 Years and Over | 26 | 1.6% |
| Total | 1,585 | 100.0% |
Housing Finances in Layhill
Median Income by Occupancy in Layhill
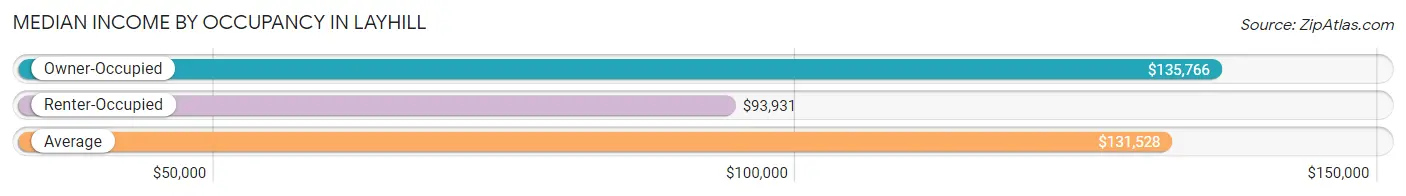
| Occupancy Type | # Households | Median Income |
| Owner-Occupied | 1,400 (88.3%) | $135,766 |
| Renter-Occupied | 185 (11.7%) | $93,931 |
| Average | 1,585 (100.0%) | $131,528 |
Occupancy by Householder Income Bracket in Layhill
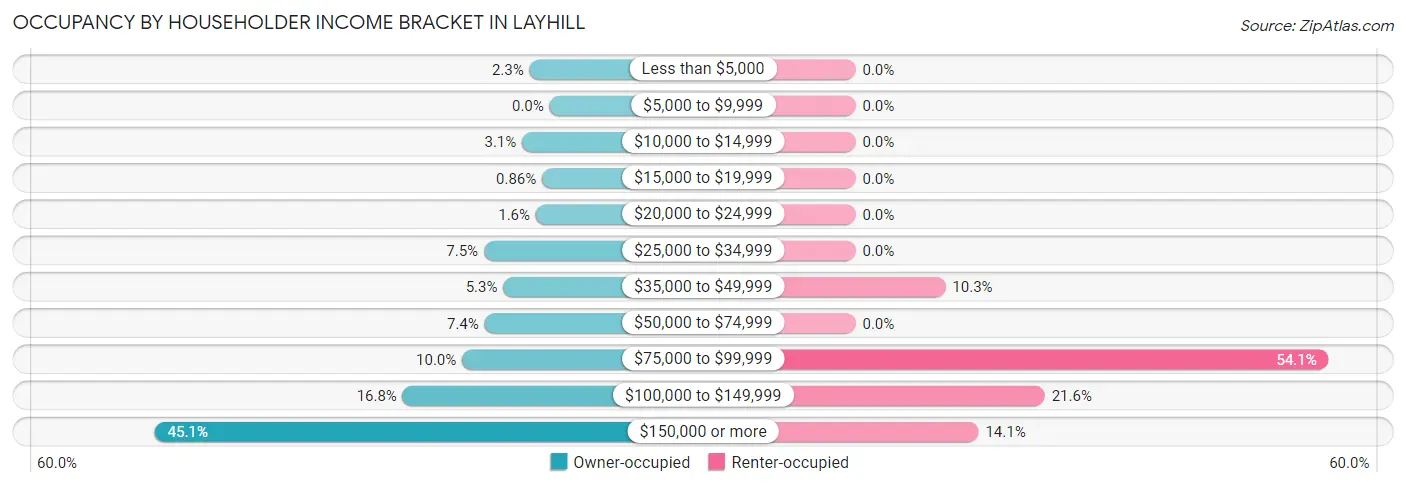
| Income Bracket | Owner-occupied | Renter-occupied |
| Less than $5,000 | 32 (2.3%) | 0 (0.0%) |
| $5,000 to $9,999 | 0 (0.0%) | 0 (0.0%) |
| $10,000 to $14,999 | 44 (3.1%) | 0 (0.0%) |
| $15,000 to $19,999 | 12 (0.9%) | 0 (0.0%) |
| $20,000 to $24,999 | 22 (1.6%) | 0 (0.0%) |
| $25,000 to $34,999 | 105 (7.5%) | 0 (0.0%) |
| $35,000 to $49,999 | 74 (5.3%) | 19 (10.3%) |
| $50,000 to $74,999 | 104 (7.4%) | 0 (0.0%) |
| $75,000 to $99,999 | 140 (10.0%) | 100 (54.0%) |
| $100,000 to $149,999 | 235 (16.8%) | 40 (21.6%) |
| $150,000 or more | 632 (45.1%) | 26 (14.1%) |
| Total | 1,400 (100.0%) | 185 (100.0%) |
Monthly Housing Cost Tiers in Layhill
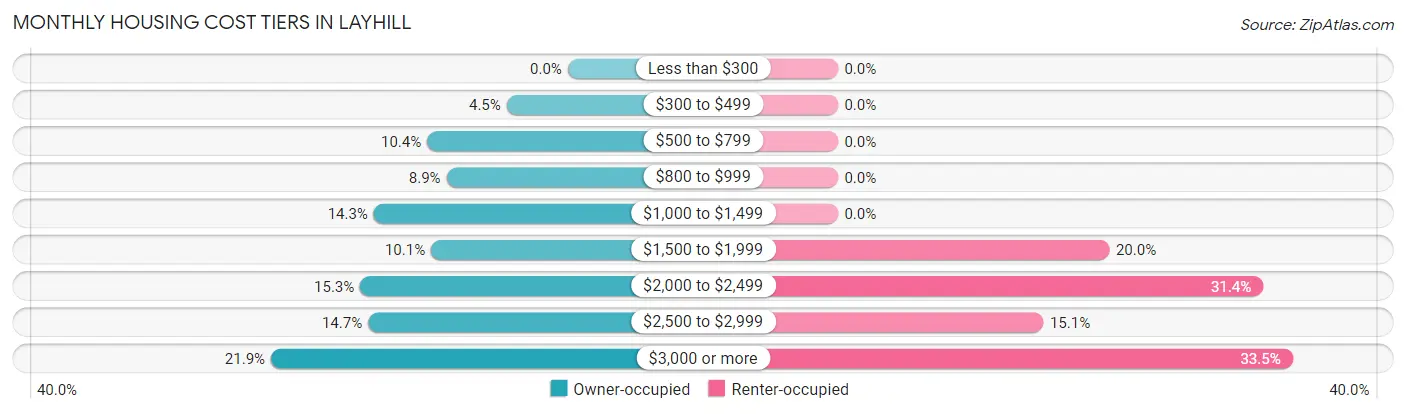
| Monthly Cost | Owner-occupied | Renter-occupied |
| Less than $300 | 0 (0.0%) | 0 (0.0%) |
| $300 to $499 | 63 (4.5%) | 0 (0.0%) |
| $500 to $799 | 145 (10.4%) | 0 (0.0%) |
| $800 to $999 | 125 (8.9%) | 0 (0.0%) |
| $1,000 to $1,499 | 200 (14.3%) | 0 (0.0%) |
| $1,500 to $1,999 | 141 (10.1%) | 37 (20.0%) |
| $2,000 to $2,499 | 214 (15.3%) | 58 (31.4%) |
| $2,500 to $2,999 | 206 (14.7%) | 28 (15.1%) |
| $3,000 or more | 306 (21.9%) | 62 (33.5%) |
| Total | 1,400 (100.0%) | 185 (100.0%) |
Physical Housing Characteristics in Layhill
Housing Structures in Layhill
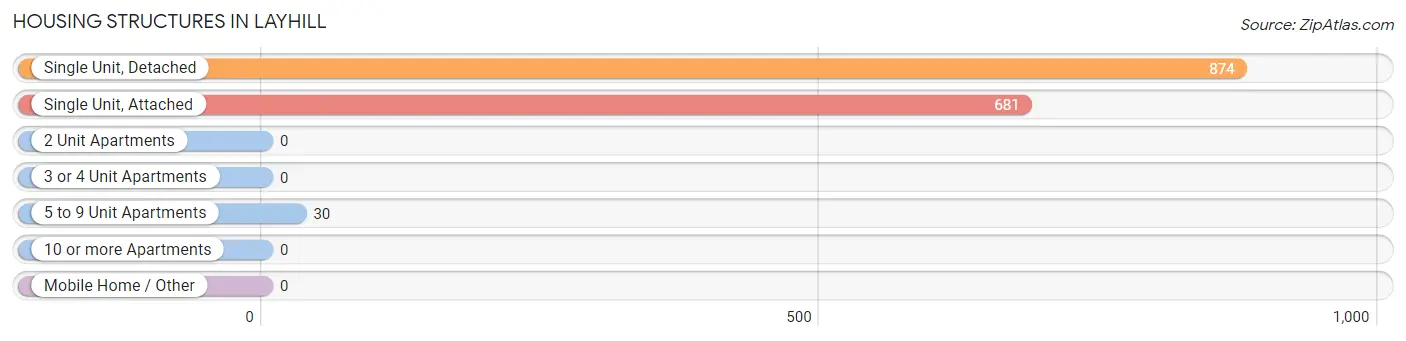
| Structure Type | # Housing Units | % Housing Units |
| Single Unit, Detached | 874 | 55.1% |
| Single Unit, Attached | 681 | 43.0% |
| 2 Unit Apartments | 0 | 0.0% |
| 3 or 4 Unit Apartments | 0 | 0.0% |
| 5 to 9 Unit Apartments | 30 | 1.9% |
| 10 or more Apartments | 0 | 0.0% |
| Mobile Home / Other | 0 | 0.0% |
| Total | 1,585 | 100.0% |
Housing Structures by Occupancy in Layhill
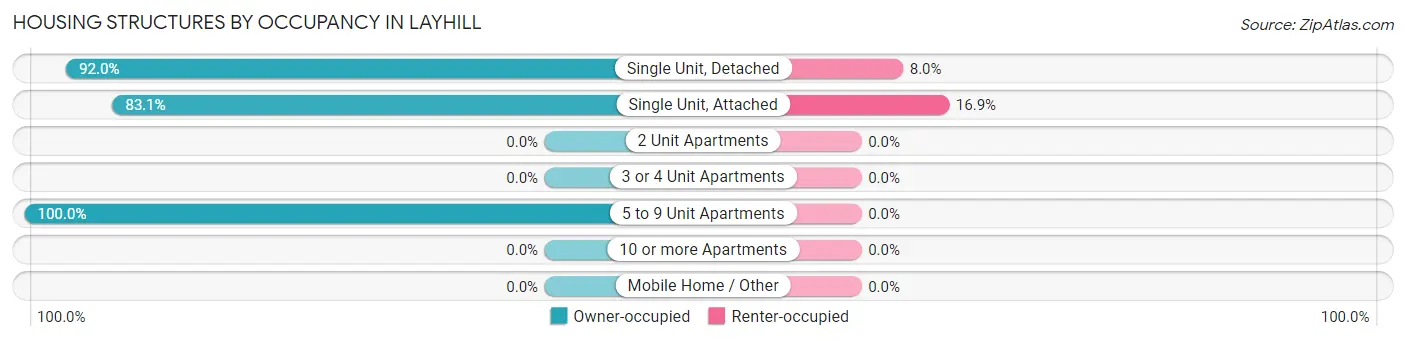
| Structure Type | Owner-occupied | Renter-occupied |
| Single Unit, Detached | 804 (92.0%) | 70 (8.0%) |
| Single Unit, Attached | 566 (83.1%) | 115 (16.9%) |
| 2 Unit Apartments | 0 (0.0%) | 0 (0.0%) |
| 3 or 4 Unit Apartments | 0 (0.0%) | 0 (0.0%) |
| 5 to 9 Unit Apartments | 30 (100.0%) | 0 (0.0%) |
| 10 or more Apartments | 0 (0.0%) | 0 (0.0%) |
| Mobile Home / Other | 0 (0.0%) | 0 (0.0%) |
| Total | 1,400 (88.3%) | 185 (11.7%) |
Housing Structures by Number of Rooms in Layhill
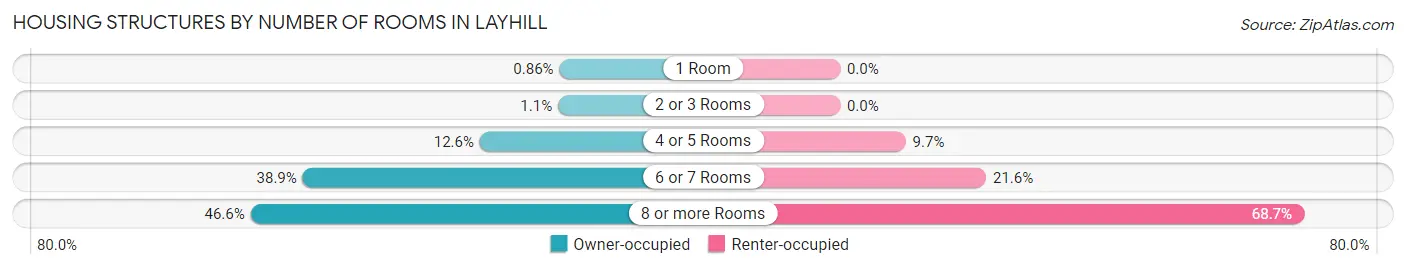
| Number of Rooms | Owner-occupied | Renter-occupied |
| 1 Room | 12 (0.9%) | 0 (0.0%) |
| 2 or 3 Rooms | 15 (1.1%) | 0 (0.0%) |
| 4 or 5 Rooms | 177 (12.6%) | 18 (9.7%) |
| 6 or 7 Rooms | 544 (38.9%) | 40 (21.6%) |
| 8 or more Rooms | 652 (46.6%) | 127 (68.6%) |
| Total | 1,400 (100.0%) | 185 (100.0%) |
Housing Structure by Heating Type in Layhill
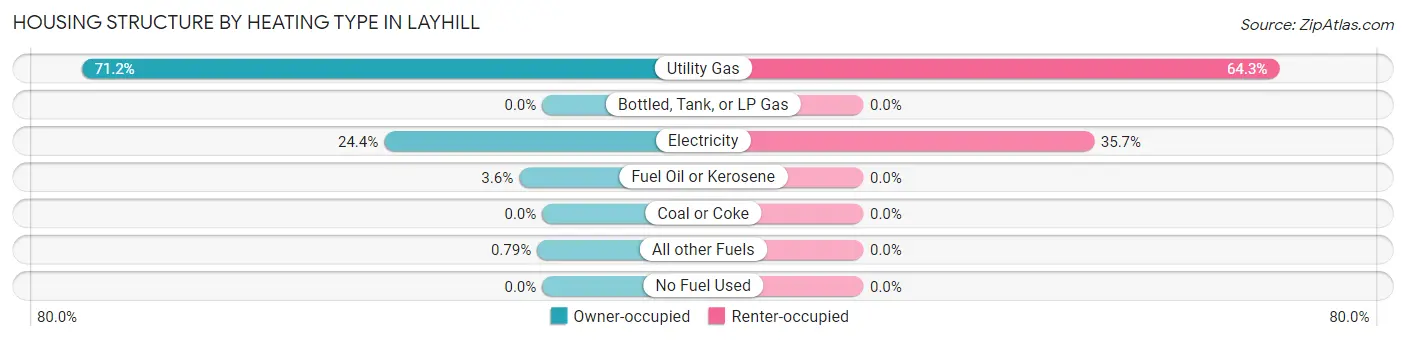
| Heating Type | Owner-occupied | Renter-occupied |
| Utility Gas | 997 (71.2%) | 119 (64.3%) |
| Bottled, Tank, or LP Gas | 0 (0.0%) | 0 (0.0%) |
| Electricity | 342 (24.4%) | 66 (35.7%) |
| Fuel Oil or Kerosene | 50 (3.6%) | 0 (0.0%) |
| Coal or Coke | 0 (0.0%) | 0 (0.0%) |
| All other Fuels | 11 (0.8%) | 0 (0.0%) |
| No Fuel Used | 0 (0.0%) | 0 (0.0%) |
| Total | 1,400 (100.0%) | 185 (100.0%) |
Household Vehicle Usage in Layhill
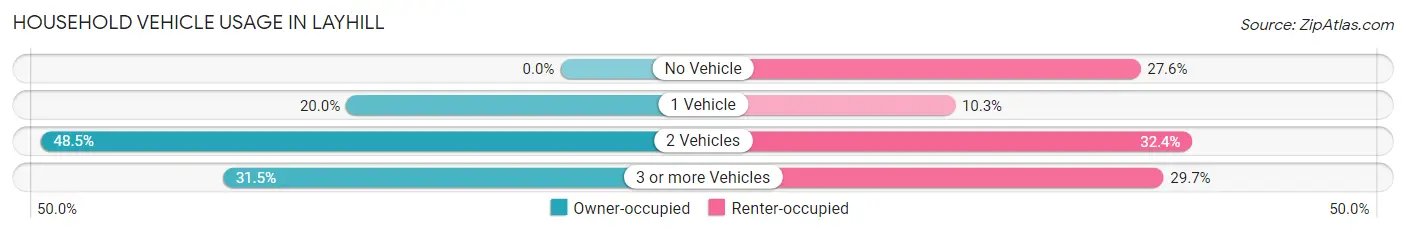
| Vehicles per Household | Owner-occupied | Renter-occupied |
| No Vehicle | 0 (0.0%) | 51 (27.6%) |
| 1 Vehicle | 280 (20.0%) | 19 (10.3%) |
| 2 Vehicles | 679 (48.5%) | 60 (32.4%) |
| 3 or more Vehicles | 441 (31.5%) | 55 (29.7%) |
| Total | 1,400 (100.0%) | 185 (100.0%) |
Real Estate & Mortgages in Layhill
Real Estate and Mortgage Overview in Layhill
| Characteristic | Without Mortgage | With Mortgage |
| Housing Units | 444 | 956 |
| Median Property Value | $514,400 | $546,700 |
| Median Household Income | $97,105 | $505 |
| Monthly Housing Costs | $836 | $306 |
| Real Estate Taxes | $4,176 | $19 |
Property Value by Mortgage Status in Layhill
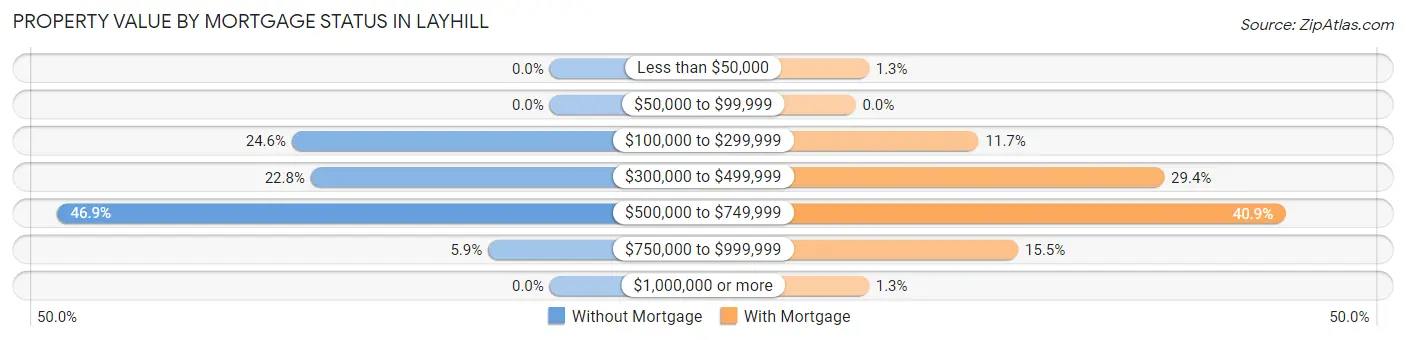
| Property Value | Without Mortgage | With Mortgage |
| Less than $50,000 | 0 (0.0%) | 12 (1.3%) |
| $50,000 to $99,999 | 0 (0.0%) | 0 (0.0%) |
| $100,000 to $299,999 | 109 (24.5%) | 112 (11.7%) |
| $300,000 to $499,999 | 101 (22.8%) | 281 (29.4%) |
| $500,000 to $749,999 | 208 (46.9%) | 391 (40.9%) |
| $750,000 to $999,999 | 26 (5.9%) | 148 (15.5%) |
| $1,000,000 or more | 0 (0.0%) | 12 (1.3%) |
| Total | 444 (100.0%) | 956 (100.0%) |
Household Income by Mortgage Status in Layhill
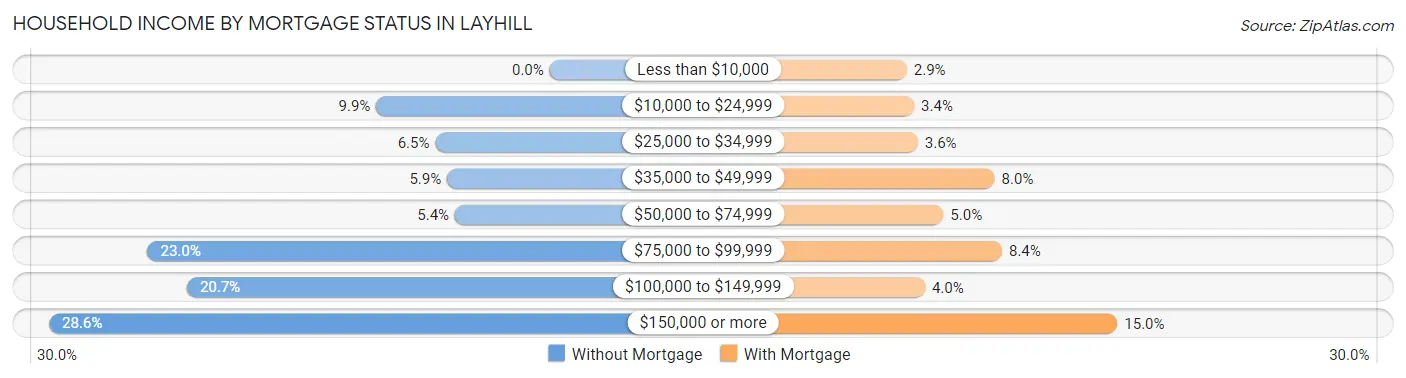
| Household Income | Without Mortgage | With Mortgage |
| Less than $10,000 | 0 (0.0%) | 28 (2.9%) |
| $10,000 to $24,999 | 44 (9.9%) | 32 (3.4%) |
| $25,000 to $34,999 | 29 (6.5%) | 34 (3.6%) |
| $35,000 to $49,999 | 26 (5.9%) | 76 (8.0%) |
| $50,000 to $74,999 | 24 (5.4%) | 48 (5.0%) |
| $75,000 to $99,999 | 102 (23.0%) | 80 (8.4%) |
| $100,000 to $149,999 | 92 (20.7%) | 38 (4.0%) |
| $150,000 or more | 127 (28.6%) | 143 (15.0%) |
| Total | 444 (100.0%) | 956 (100.0%) |
Property Value to Household Income Ratio in Layhill
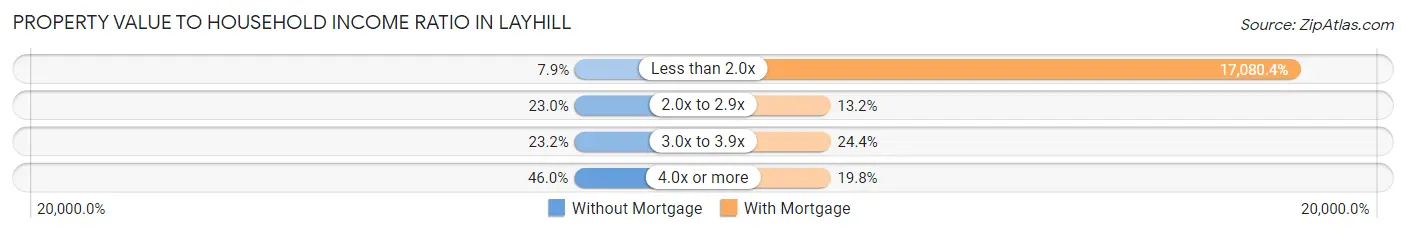
| Value-to-Income Ratio | Without Mortgage | With Mortgage |
| Less than 2.0x | 35 (7.9%) | 163,289 (17,080.4%) |
| 2.0x to 2.9x | 102 (23.0%) | 126 (13.2%) |
| 3.0x to 3.9x | 103 (23.2%) | 233 (24.4%) |
| 4.0x or more | 204 (46.0%) | 189 (19.8%) |
| Total | 444 (100.0%) | 956 (100.0%) |
Real Estate Taxes by Mortgage Status in Layhill
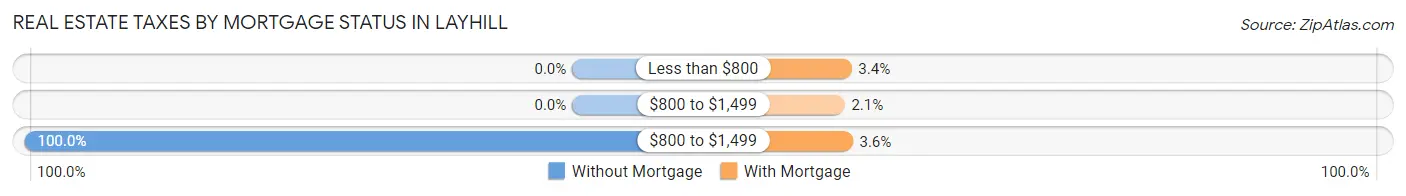
| Property Taxes | Without Mortgage | With Mortgage |
| Less than $800 | 0 (0.0%) | 32 (3.4%) |
| $800 to $1,499 | 0 (0.0%) | 20 (2.1%) |
| $800 to $1,499 | 444 (100.0%) | 34 (3.6%) |
| Total | 444 (100.0%) | 956 (100.0%) |
Health & Disability in Layhill
Health Insurance Coverage by Age in Layhill
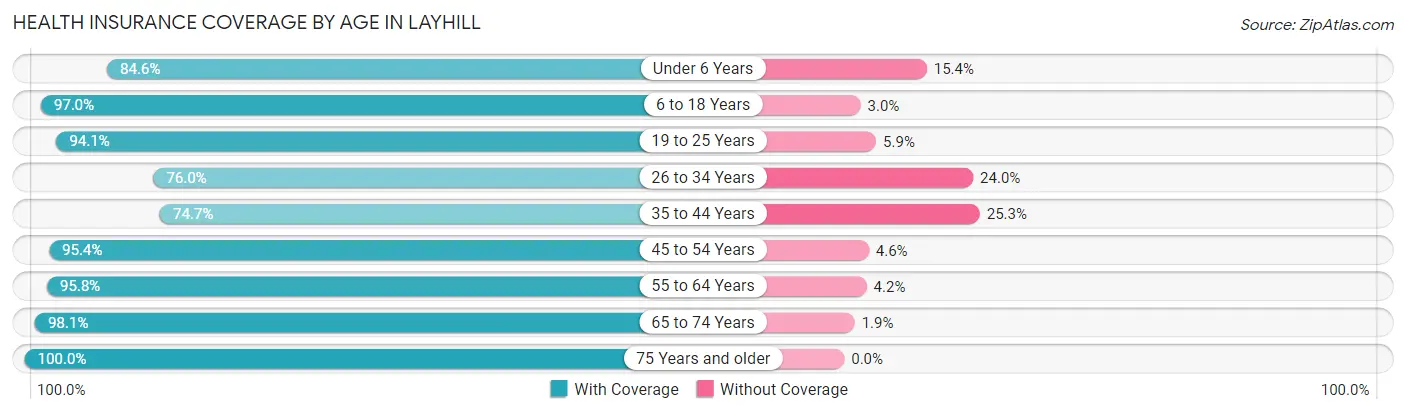
| Age Bracket | With Coverage | Without Coverage |
| Under 6 Years | 209 (84.6%) | 38 (15.4%) |
| 6 to 18 Years | 766 (97.0%) | 24 (3.0%) |
| 19 to 25 Years | 586 (94.1%) | 37 (5.9%) |
| 26 to 34 Years | 313 (76.0%) | 99 (24.0%) |
| 35 to 44 Years | 408 (74.7%) | 138 (25.3%) |
| 45 to 54 Years | 666 (95.4%) | 32 (4.6%) |
| 55 to 64 Years | 689 (95.8%) | 30 (4.2%) |
| 65 to 74 Years | 557 (98.1%) | 11 (1.9%) |
| 75 Years and older | 435 (100.0%) | 0 (0.0%) |
| Total | 4,629 (91.9%) | 409 (8.1%) |
Health Insurance Coverage by Citizenship Status in Layhill
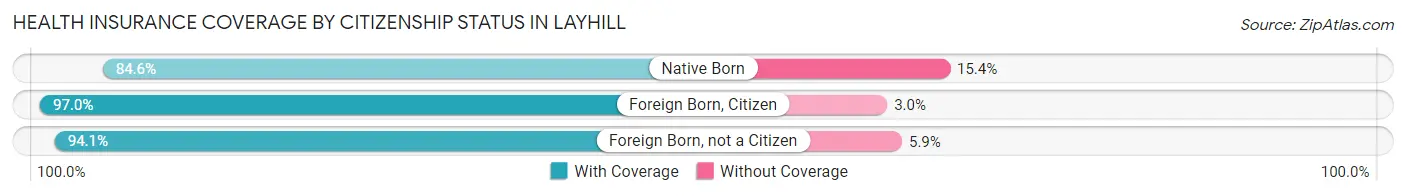
| Citizenship Status | With Coverage | Without Coverage |
| Native Born | 209 (84.6%) | 38 (15.4%) |
| Foreign Born, Citizen | 766 (97.0%) | 24 (3.0%) |
| Foreign Born, not a Citizen | 586 (94.1%) | 37 (5.9%) |
Health Insurance Coverage by Household Income in Layhill
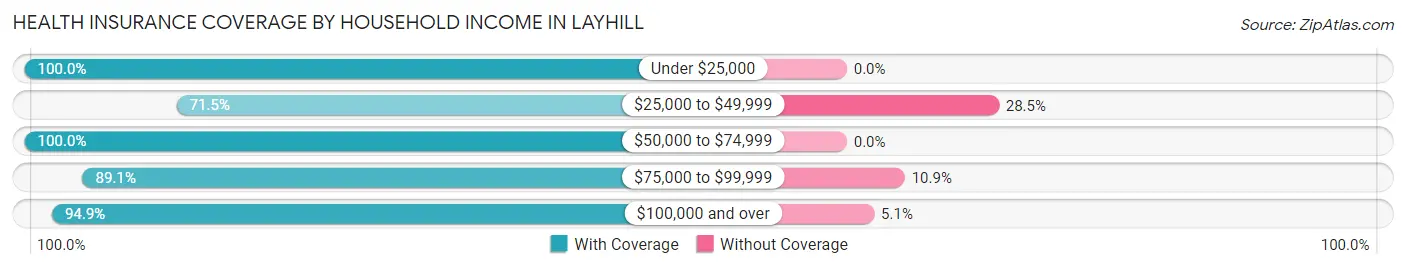
| Household Income | With Coverage | Without Coverage |
| Under $25,000 | 167 (100.0%) | 0 (0.0%) |
| $25,000 to $49,999 | 387 (71.5%) | 154 (28.5%) |
| $50,000 to $74,999 | 370 (100.0%) | 0 (0.0%) |
| $75,000 to $99,999 | 829 (89.1%) | 101 (10.9%) |
| $100,000 and over | 2,846 (94.9%) | 154 (5.1%) |
Public vs Private Health Insurance Coverage by Age in Layhill
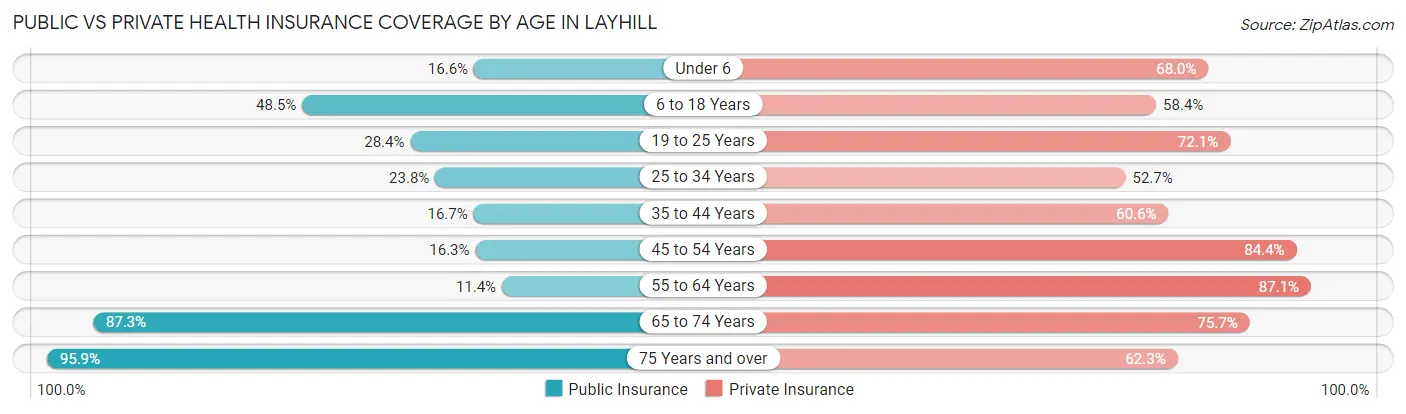
| Age Bracket | Public Insurance | Private Insurance |
| Under 6 | 41 (16.6%) | 168 (68.0%) |
| 6 to 18 Years | 383 (48.5%) | 461 (58.4%) |
| 19 to 25 Years | 177 (28.4%) | 449 (72.1%) |
| 25 to 34 Years | 98 (23.8%) | 217 (52.7%) |
| 35 to 44 Years | 91 (16.7%) | 331 (60.6%) |
| 45 to 54 Years | 114 (16.3%) | 589 (84.4%) |
| 55 to 64 Years | 82 (11.4%) | 626 (87.1%) |
| 65 to 74 Years | 496 (87.3%) | 430 (75.7%) |
| 75 Years and over | 417 (95.9%) | 271 (62.3%) |
| Total | 1,899 (37.7%) | 3,542 (70.3%) |
Disability Status by Sex by Age in Layhill
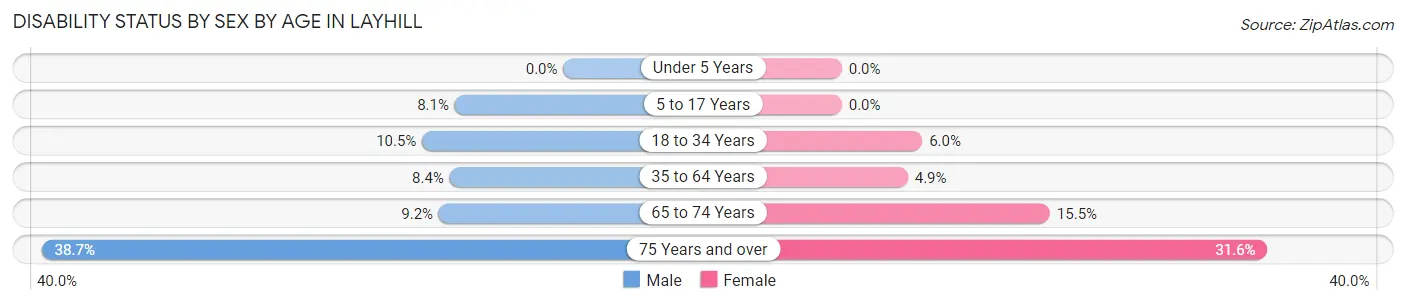
| Age Bracket | Male | Female |
| Under 5 Years | 0 (0.0%) | 0 (0.0%) |
| 5 to 17 Years | 29 (8.1%) | 0 (0.0%) |
| 18 to 34 Years | 48 (10.5%) | 40 (6.0%) |
| 35 to 64 Years | 76 (8.4%) | 52 (4.9%) |
| 65 to 74 Years | 22 (9.2%) | 51 (15.4%) |
| 75 Years and over | 79 (38.7%) | 73 (31.6%) |
Disability Class by Sex by Age in Layhill
Disability Class: Hearing Difficulty
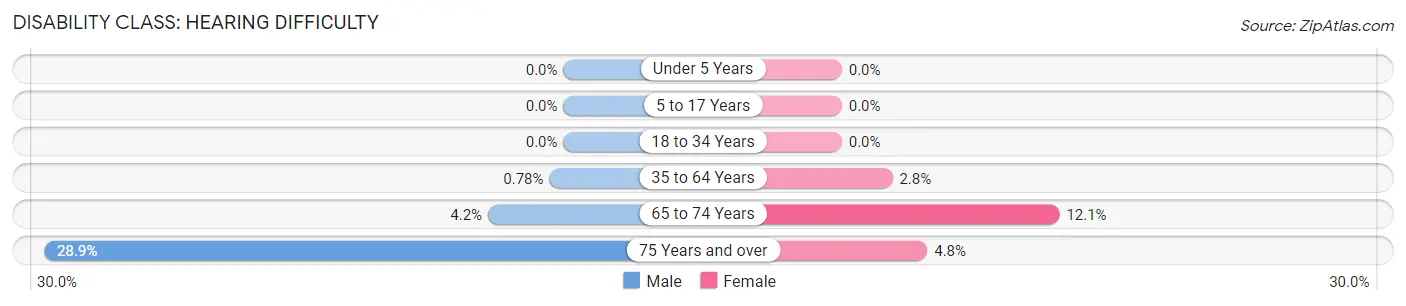
| Age Bracket | Male | Female |
| Under 5 Years | 0 (0.0%) | 0 (0.0%) |
| 5 to 17 Years | 0 (0.0%) | 0 (0.0%) |
| 18 to 34 Years | 0 (0.0%) | 0 (0.0%) |
| 35 to 64 Years | 7 (0.8%) | 30 (2.8%) |
| 65 to 74 Years | 10 (4.2%) | 40 (12.1%) |
| 75 Years and over | 59 (28.9%) | 11 (4.8%) |
Disability Class: Vision Difficulty
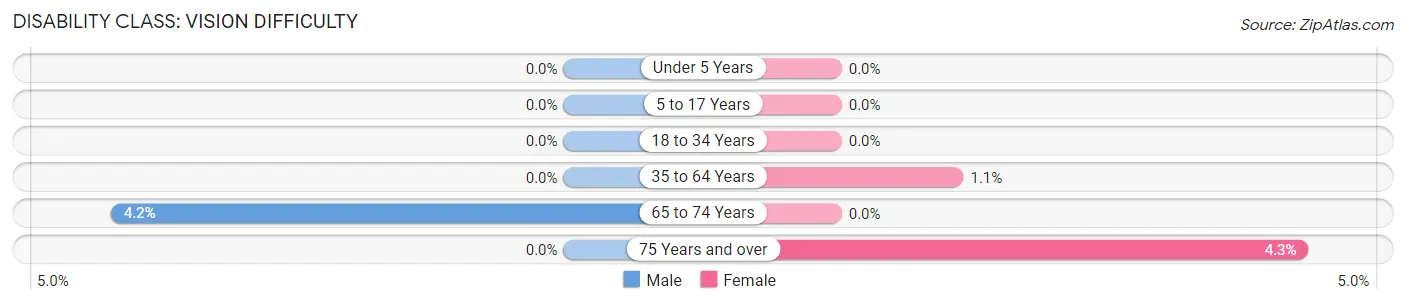
| Age Bracket | Male | Female |
| Under 5 Years | 0 (0.0%) | 0 (0.0%) |
| 5 to 17 Years | 0 (0.0%) | 0 (0.0%) |
| 18 to 34 Years | 0 (0.0%) | 0 (0.0%) |
| 35 to 64 Years | 0 (0.0%) | 12 (1.1%) |
| 65 to 74 Years | 10 (4.2%) | 0 (0.0%) |
| 75 Years and over | 0 (0.0%) | 10 (4.3%) |
Disability Class: Cognitive Difficulty
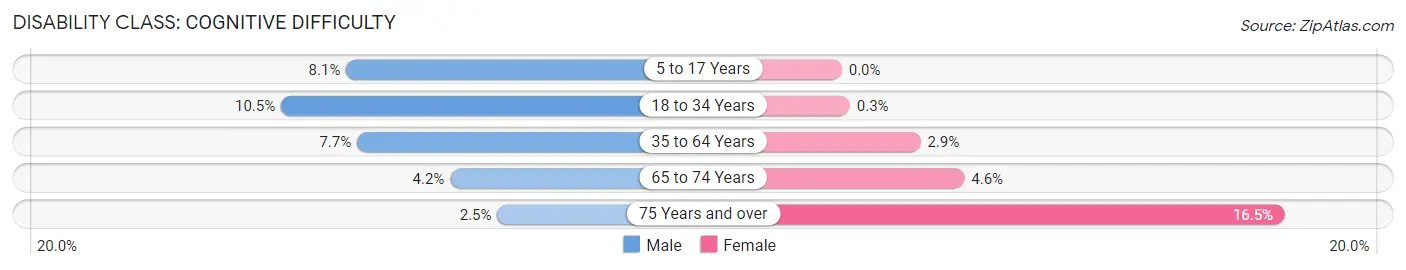
| Age Bracket | Male | Female |
| 5 to 17 Years | 29 (8.1%) | 0 (0.0%) |
| 18 to 34 Years | 48 (10.5%) | 2 (0.3%) |
| 35 to 64 Years | 69 (7.7%) | 31 (2.9%) |
| 65 to 74 Years | 10 (4.2%) | 15 (4.5%) |
| 75 Years and over | 5 (2.5%) | 38 (16.5%) |
Disability Class: Ambulatory Difficulty
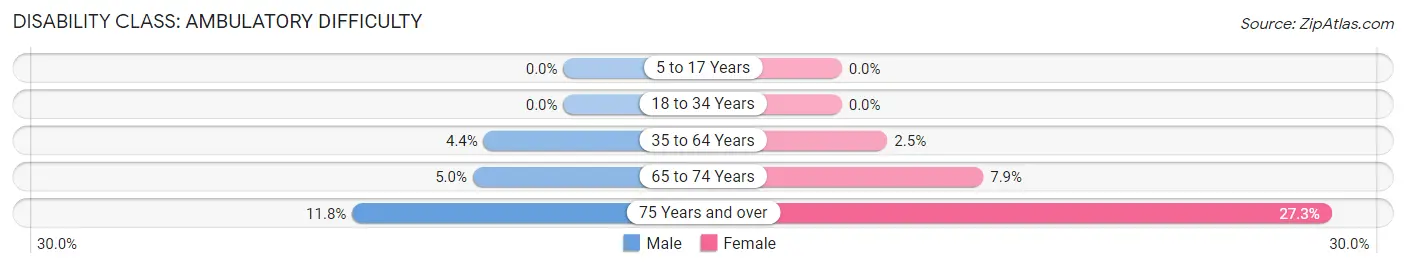
| Age Bracket | Male | Female |
| 5 to 17 Years | 0 (0.0%) | 0 (0.0%) |
| 18 to 34 Years | 0 (0.0%) | 0 (0.0%) |
| 35 to 64 Years | 40 (4.4%) | 27 (2.5%) |
| 65 to 74 Years | 12 (5.0%) | 26 (7.9%) |
| 75 Years and over | 24 (11.8%) | 63 (27.3%) |
Disability Class: Self-Care Difficulty
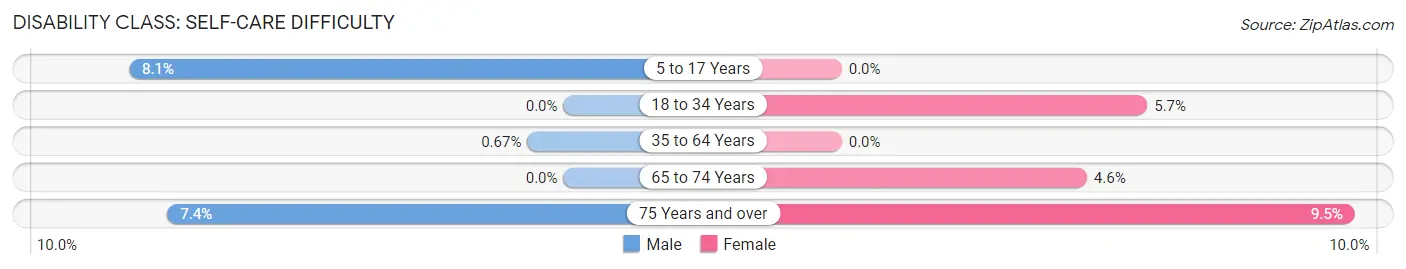
| Age Bracket | Male | Female |
| 5 to 17 Years | 29 (8.1%) | 0 (0.0%) |
| 18 to 34 Years | 0 (0.0%) | 38 (5.7%) |
| 35 to 64 Years | 6 (0.7%) | 0 (0.0%) |
| 65 to 74 Years | 0 (0.0%) | 15 (4.5%) |
| 75 Years and over | 15 (7.3%) | 22 (9.5%) |
Technology Access in Layhill
Computing Device Access in Layhill
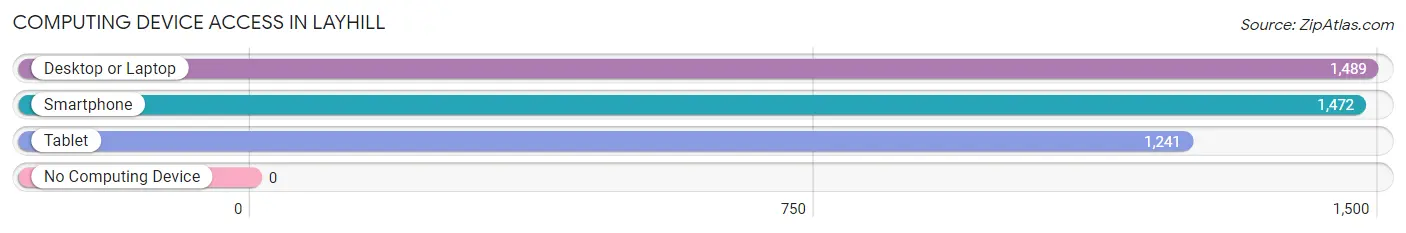
| Device Type | # Households | % Households |
| Desktop or Laptop | 1,489 | 93.9% |
| Smartphone | 1,472 | 92.9% |
| Tablet | 1,241 | 78.3% |
| No Computing Device | 0 | 0.0% |
| Total | 1,585 | 100.0% |
Internet Access in Layhill
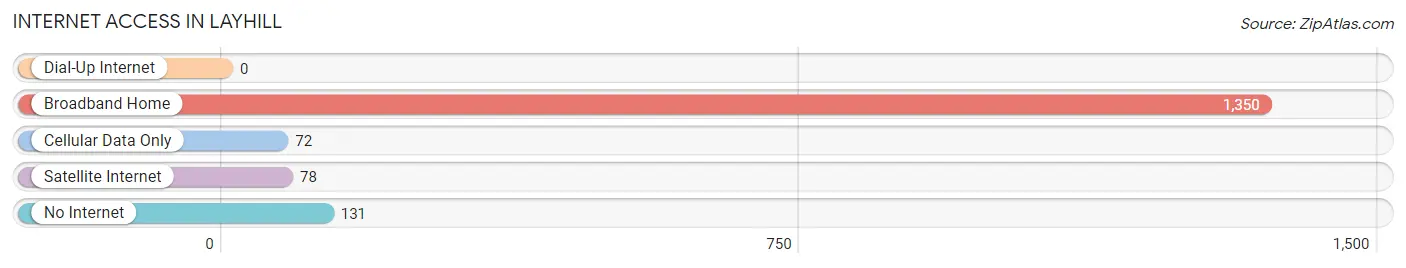
| Internet Type | # Households | % Households |
| Dial-Up Internet | 0 | 0.0% |
| Broadband Home | 1,350 | 85.2% |
| Cellular Data Only | 72 | 4.5% |
| Satellite Internet | 78 | 4.9% |
| No Internet | 131 | 8.3% |
| Total | 1,585 | 100.0% |
Layhill Summary
Layhill, Maryland is a census-designated place located in Montgomery County, Maryland. It is situated in the northern part of the county, just south of the city of Rockville. The population of Layhill was estimated to be 17,945 in 2019.
History
Layhill was first settled in the late 1700s by a group of German immigrants. The area was originally known as "Lay Hill" and was part of a larger tract of land owned by the Lay family. The Lay family owned the land until the early 1900s when it was sold to developers. The area was then developed into a residential community and was officially incorporated as a census-designated place in 1950.
Geography
Layhill is located in the northern part of Montgomery County, Maryland. It is bordered by the city of Rockville to the north, Aspen Hill to the east, and Norbeck to the south. The area is mostly residential, with some commercial and industrial development. The terrain is mostly flat, with some rolling hills.
Economy
The economy of Layhill is largely based on the service industry. There are several restaurants, retail stores, and other businesses located in the area. The area is also home to several government offices, including the Montgomery County Department of Health and Human Services and the Montgomery County Public Schools.
Demographics
As of the 2019 census, the population of Layhill was estimated to be 17,945. The racial makeup of the area was 57.3% White, 22.2% African American, 14.2% Hispanic or Latino, and 6.3% Asian. The median household income was $90,945, and the median home value was $400,000.
Conclusion
Layhill, Maryland is a census-designated place located in Montgomery County, Maryland. It is situated in the northern part of the county, just south of the city of Rockville. The area is mostly residential, with some commercial and industrial development. The economy of Layhill is largely based on the service industry. As of the 2019 census, the population of Layhill was estimated to be 17,945. The racial makeup of the area was 57.3% White, 22.2% African American, 14.2% Hispanic or Latino, and 6.3% Asian. The median household income was $90,945, and the median home value was $400,000.
Common Questions
What is Per Capita Income in Layhill?
Per Capita income in Layhill is $49,096.
What is the Median Family Income in Layhill?
Median Family Income in Layhill is $135,302.
What is the Median Household income in Layhill?
Median Household Income in Layhill is $131,528.
What is Income or Wage Gap in Layhill?
Income or Wage Gap in Layhill is 30.1%.
Women in Layhill earn 69.9 cents for every dollar earned by a man.
What is Inequality or Gini Index in Layhill?
Inequality or Gini Index in Layhill is 0.42.
What is the Total Population of Layhill?
Total Population of Layhill is 5,157.
What is the Total Male Population of Layhill?
Total Male Population of Layhill is 2,319.
What is the Total Female Population of Layhill?
Total Female Population of Layhill is 2,838.
What is the Ratio of Males per 100 Females in Layhill?
There are 81.71 Males per 100 Females in Layhill.
What is the Ratio of Females per 100 Males in Layhill?
There are 122.38 Females per 100 Males in Layhill.
What is the Median Population Age in Layhill?
Median Population Age in Layhill is 43.7 Years.
What is the Average Family Size in Layhill
Average Family Size in Layhill is 3.6 People.
What is the Average Household Size in Layhill
Average Household Size in Layhill is 3.2 People.
How Large is the Labor Force in Layhill?
There are 2,995 People in the Labor Forcein in Layhill.
What is the Percentage of People in the Labor Force in Layhill?
68.6% of People are in the Labor Force in Layhill.
What is the Unemployment Rate in Layhill?
Unemployment Rate in Layhill is 6.2%.