Spring Ridge, MD Map & Demographics
Spring Ridge Map
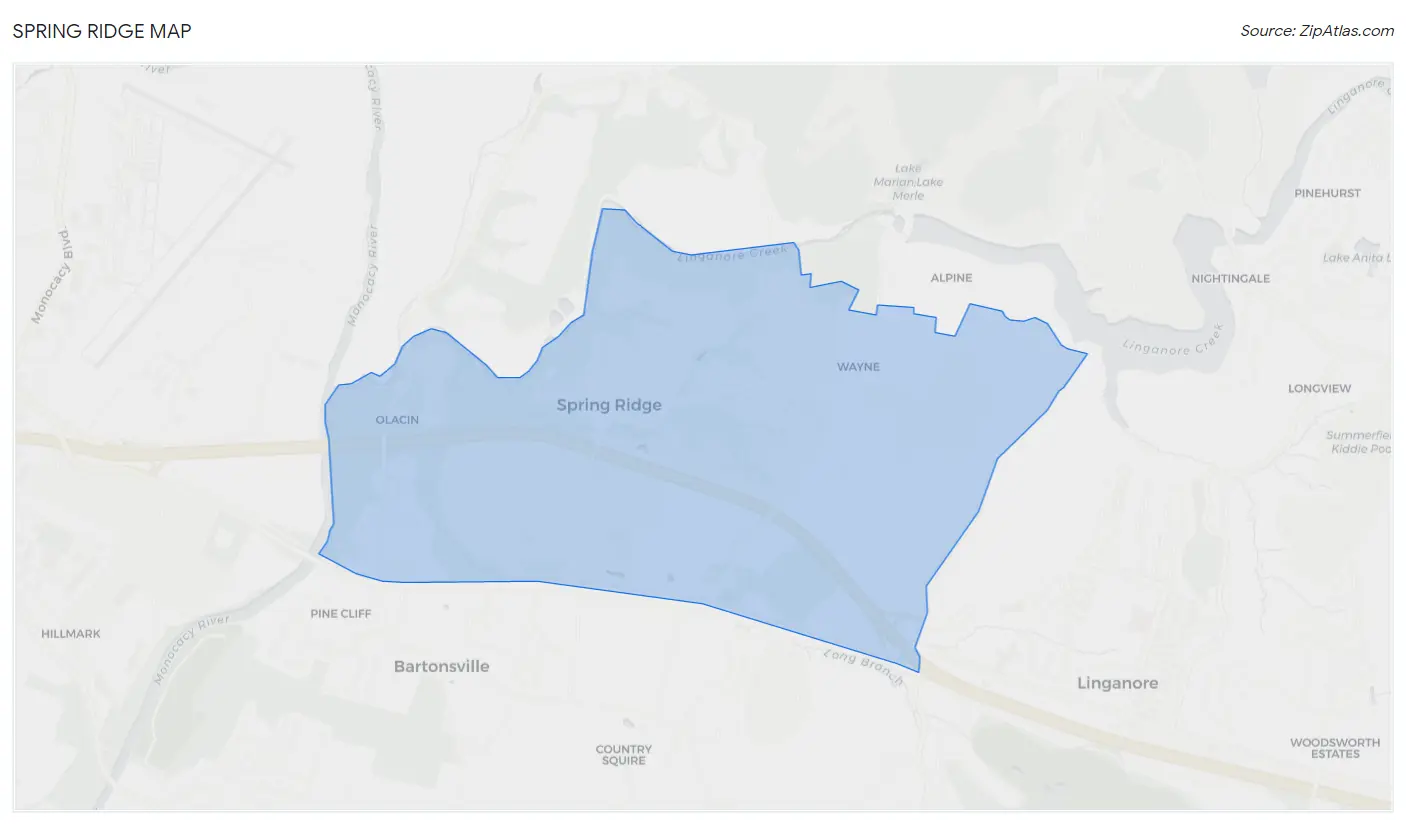
Spring Ridge Overview
$56,246
PER CAPITA INCOME
$153,657
AVG FAMILY INCOME
$129,853
AVG HOUSEHOLD INCOME
50.4%
WAGE / INCOME GAP [ % ]
49.6¢/ $1
WAGE / INCOME GAP [ $ ]
0.34
INEQUALITY / GINI INDEX
5,691
TOTAL POPULATION
2,647
MALE POPULATION
3,044
FEMALE POPULATION
86.96
MALES / 100 FEMALES
115.00
FEMALES / 100 MALES
36.6
MEDIAN AGE
3.4
AVG FAMILY SIZE
2.7
AVG HOUSEHOLD SIZE
3,528
LABOR FORCE [ PEOPLE ]
74.8%
PERCENT IN LABOR FORCE
3.0%
UNEMPLOYMENT RATE
Income in Spring Ridge
Income Overview in Spring Ridge
Per Capita Income in Spring Ridge is $56,246, while median incomes of families and households are $153,657 and $129,853 respectively.
| Characteristic | Number | Measure |
| Per Capita Income | 5,691 | $56,246 |
| Median Family Income | 1,347 | $153,657 |
| Mean Family Income | 1,347 | $181,212 |
| Median Household Income | 2,108 | $129,853 |
| Mean Household Income | 2,108 | $149,972 |
| Income Deficit | 1,347 | $0 |
| Wage / Income Gap (%) | 5,691 | 50.44% |
| Wage / Income Gap ($) | 5,691 | 49.56¢ per $1 |
| Gini / Inequality Index | 5,691 | 0.34 |
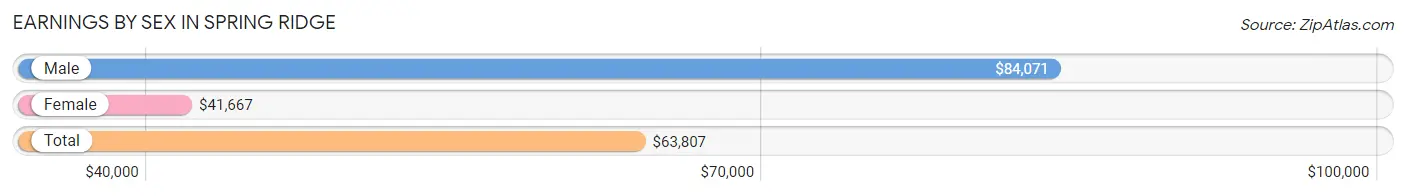
Earnings by Sex in Spring Ridge
Average Earnings in Spring Ridge are $63,807, $84,071 for men and $41,667 for women, a difference of 50.4%.
| Sex | Number | Average Earnings |
| Male | 1,778 (49.0%) | $84,071 |
| Female | 1,848 (51.0%) | $41,667 |
| Total | 3,626 (100.0%) | $63,807 |
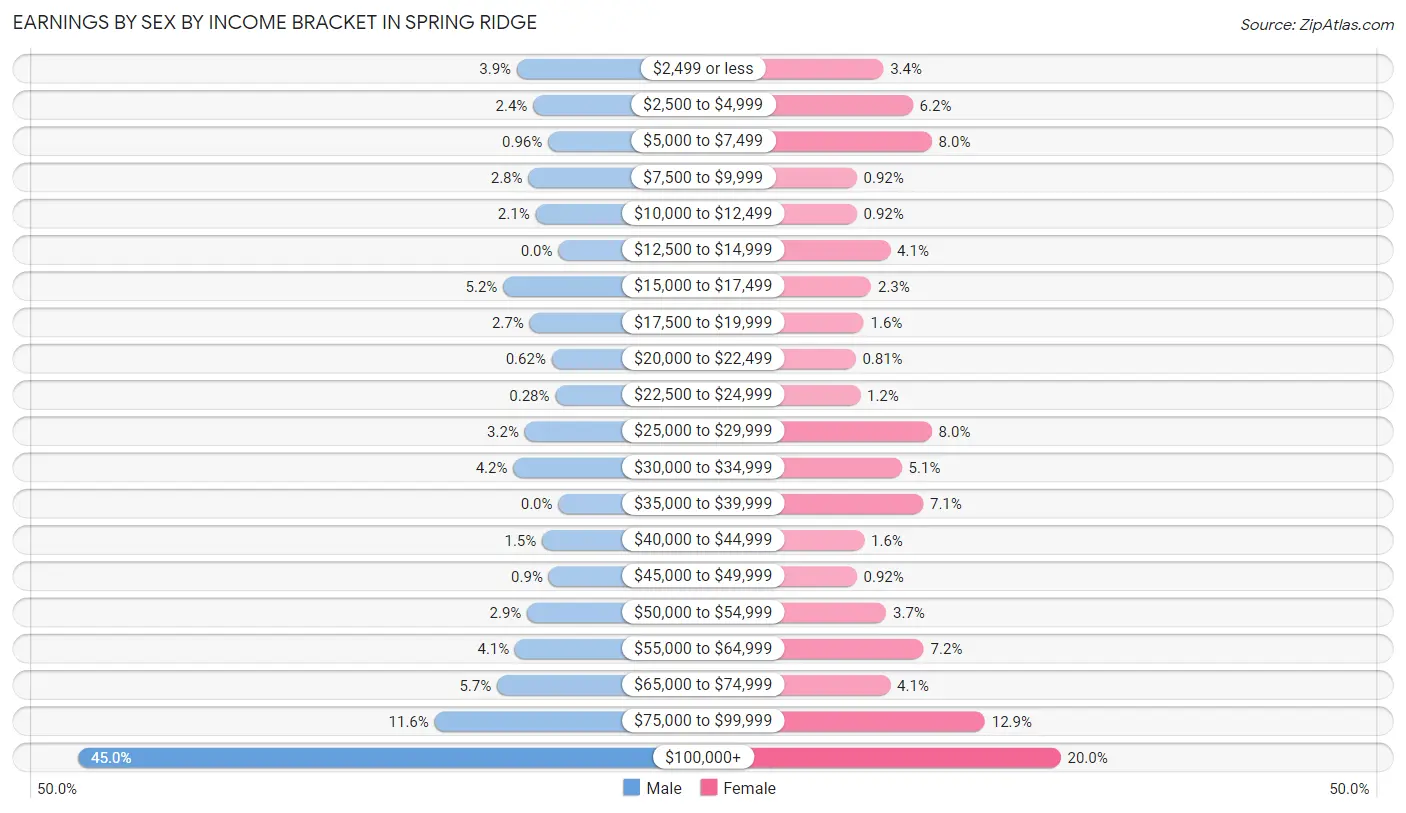
Earnings by Sex by Income Bracket in Spring Ridge
The most common earnings brackets in Spring Ridge are $100,000+ for men (800 | 45.0%) and $100,000+ for women (370 | 20.0%).
| Income | Male | Female |
| $2,499 or less | 69 (3.9%) | 63 (3.4%) |
| $2,500 to $4,999 | 42 (2.4%) | 114 (6.2%) |
| $5,000 to $7,499 | 17 (1.0%) | 147 (8.0%) |
| $7,500 to $9,999 | 50 (2.8%) | 17 (0.9%) |
| $10,000 to $12,499 | 38 (2.1%) | 17 (0.9%) |
| $12,500 to $14,999 | 0 (0.0%) | 75 (4.1%) |
| $15,000 to $17,499 | 92 (5.2%) | 42 (2.3%) |
| $17,500 to $19,999 | 48 (2.7%) | 29 (1.6%) |
| $20,000 to $22,499 | 11 (0.6%) | 15 (0.8%) |
| $22,500 to $24,999 | 5 (0.3%) | 23 (1.2%) |
| $25,000 to $29,999 | 56 (3.2%) | 147 (8.0%) |
| $30,000 to $34,999 | 75 (4.2%) | 95 (5.1%) |
| $35,000 to $39,999 | 0 (0.0%) | 132 (7.1%) |
| $40,000 to $44,999 | 27 (1.5%) | 30 (1.6%) |
| $45,000 to $49,999 | 16 (0.9%) | 17 (0.9%) |
| $50,000 to $54,999 | 52 (2.9%) | 68 (3.7%) |
| $55,000 to $64,999 | 72 (4.1%) | 133 (7.2%) |
| $65,000 to $74,999 | 102 (5.7%) | 75 (4.1%) |
| $75,000 to $99,999 | 206 (11.6%) | 239 (12.9%) |
| $100,000+ | 800 (45.0%) | 370 (20.0%) |
| Total | 1,778 (100.0%) | 1,848 (100.0%) |
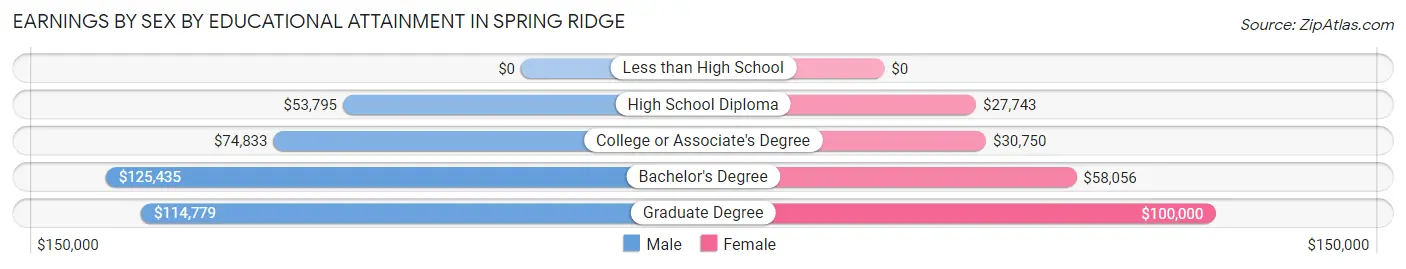
Earnings by Sex by Educational Attainment in Spring Ridge
Average earnings in Spring Ridge are $106,667 for men and $59,006 for women, a difference of 44.7%. Men with an educational attainment of bachelor's degree enjoy the highest average annual earnings of $125,435, while those with high school diploma education earn the least with $53,795. Women with an educational attainment of graduate degree earn the most with the average annual earnings of $100,000, while those with high school diploma education have the smallest earnings of $27,743.
| Educational Attainment | Male Income | Female Income |
| Less than High School | - | - |
| High School Diploma | $53,795 | $27,743 |
| College or Associate's Degree | $74,833 | $30,750 |
| Bachelor's Degree | $125,435 | $58,056 |
| Graduate Degree | $114,779 | $100,000 |
| Total | $106,667 | $59,006 |
Family Income in Spring Ridge
Family Income Brackets in Spring Ridge
According to the Spring Ridge family income data, there are 459 families falling into the $200,000+ income range, which is the most common income bracket and makes up 34.1% of all families.
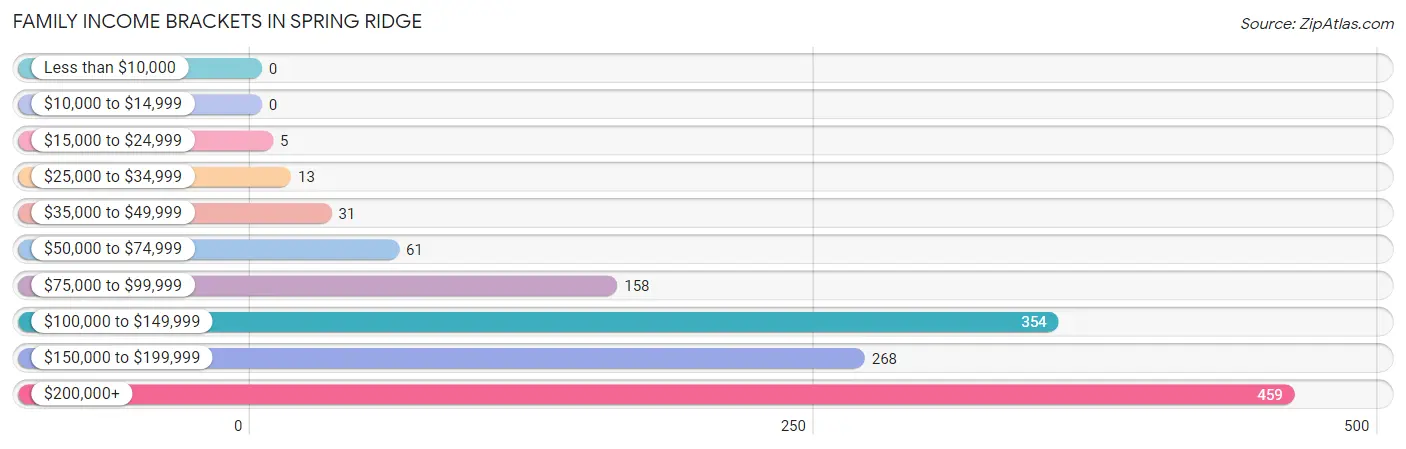
| Income Bracket | # Families | % Families |
| Less than $10,000 | 0 | 0.0% |
| $10,000 to $14,999 | 0 | 0.0% |
| $15,000 to $24,999 | 5 | 0.4% |
| $25,000 to $34,999 | 13 | 1.0% |
| $35,000 to $49,999 | 31 | 2.3% |
| $50,000 to $74,999 | 61 | 4.5% |
| $75,000 to $99,999 | 158 | 11.7% |
| $100,000 to $149,999 | 354 | 26.3% |
| $150,000 to $199,999 | 268 | 19.9% |
| $200,000+ | 459 | 34.1% |
Family Income by Famaliy Size in Spring Ridge
4-person families (285 | 21.2%) account for the highest median family income in Spring Ridge with $195,655 per family, while 2-person families (268 | 19.9%) have the highest median income of $64,653 per family member.
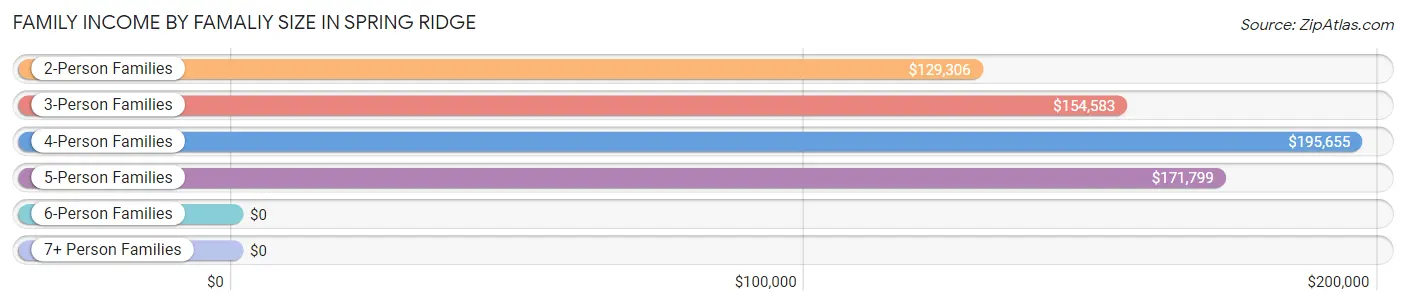
| Income Bracket | # Families | Median Income |
| 2-Person Families | 268 (19.9%) | $129,306 |
| 3-Person Families | 561 (41.6%) | $154,583 |
| 4-Person Families | 285 (21.2%) | $195,655 |
| 5-Person Families | 233 (17.3%) | $171,799 |
| 6-Person Families | 0 (0.0%) | $0 |
| 7+ Person Families | 0 (0.0%) | $0 |
| Total | 1,347 (100.0%) | $153,657 |
Family Income by Number of Earners in Spring Ridge
The median family income in Spring Ridge is $153,657, with families comprising 3+ earners (366) having the highest median family income of $250,001, while families with no earners (64) have the lowest median family income of $88,409, accounting for 27.2% and 4.8% of families, respectively.
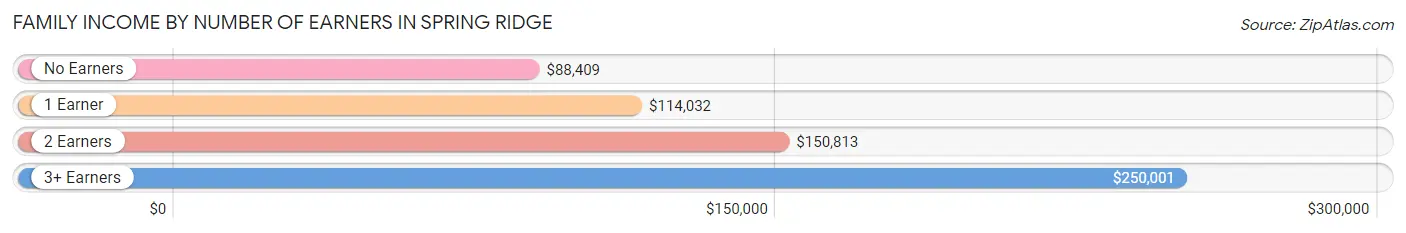
| Number of Earners | # Families | Median Income |
| No Earners | 64 (4.8%) | $88,409 |
| 1 Earner | 220 (16.3%) | $114,032 |
| 2 Earners | 697 (51.7%) | $150,813 |
| 3+ Earners | 366 (27.2%) | $250,001 |
| Total | 1,347 (100.0%) | $153,657 |
Household Income in Spring Ridge
Household Income Brackets in Spring Ridge
With 506 households falling in the category, the $200,000+ income range is the most frequent in Spring Ridge, accounting for 24.0% of all households. In contrast, only 13 households (0.6%) fall into the less than $10,000 income bracket, making it the least populous group.
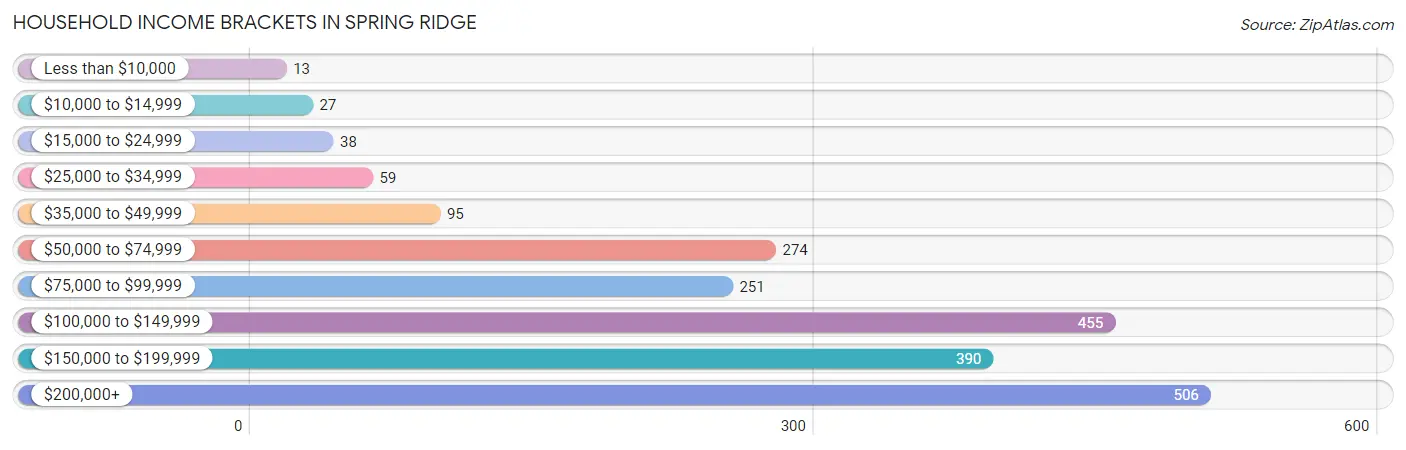
| Income Bracket | # Households | % Households |
| Less than $10,000 | 13 | 0.6% |
| $10,000 to $14,999 | 27 | 1.3% |
| $15,000 to $24,999 | 38 | 1.8% |
| $25,000 to $34,999 | 59 | 2.8% |
| $35,000 to $49,999 | 95 | 4.5% |
| $50,000 to $74,999 | 274 | 13.0% |
| $75,000 to $99,999 | 251 | 11.9% |
| $100,000 to $149,999 | 455 | 21.6% |
| $150,000 to $199,999 | 390 | 18.5% |
| $200,000+ | 506 | 24.0% |
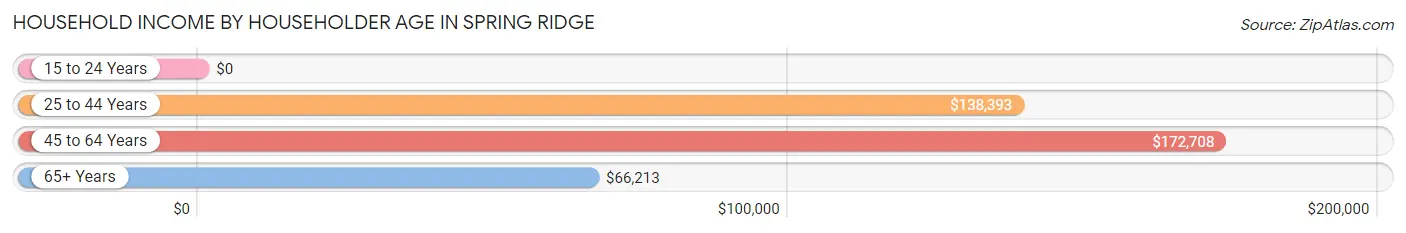
Household Income by Householder Age in Spring Ridge
The median household income in Spring Ridge is $129,853, with the highest median household income of $172,708 found in the 45 to 64 years age bracket for the primary householder. A total of 848 households (40.2%) fall into this category. Meanwhile, the 15 to 24 years age bracket for the primary householder has the lowest median household income of $0, with 47 households (2.2%) in this group.
| Income Bracket | # Households | Median Income |
| 15 to 24 Years | 47 (2.2%) | $0 |
| 25 to 44 Years | 642 (30.5%) | $138,393 |
| 45 to 64 Years | 848 (40.2%) | $172,708 |
| 65+ Years | 571 (27.1%) | $66,213 |
| Total | 2,108 (100.0%) | $129,853 |
Poverty in Spring Ridge
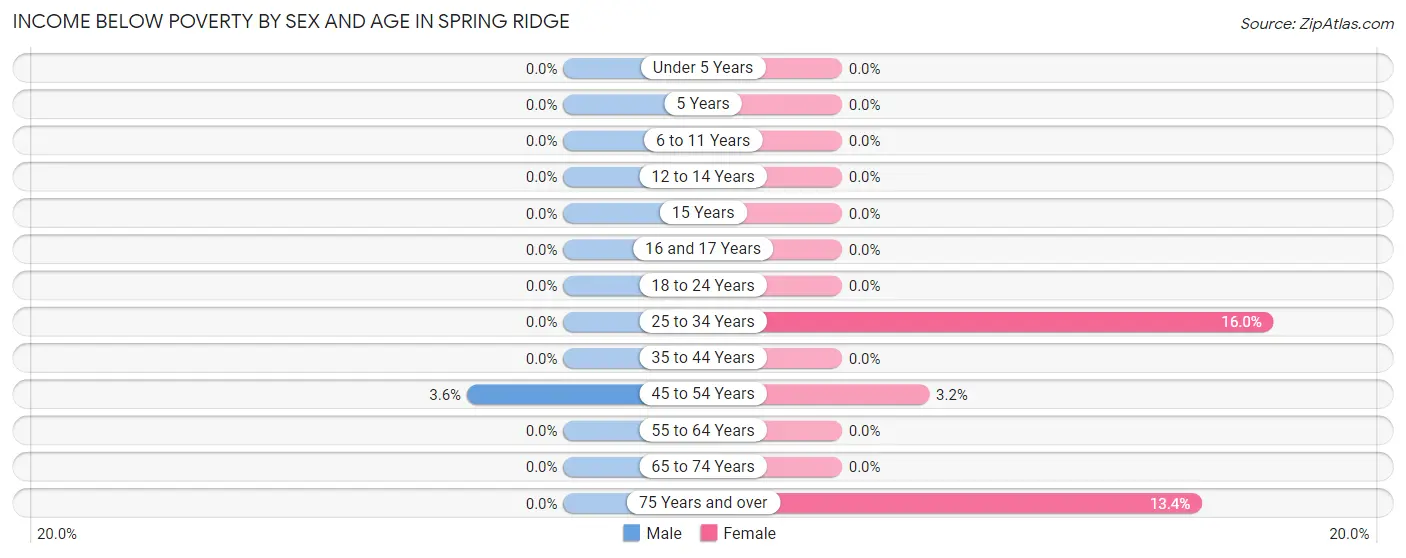
Income Below Poverty by Sex and Age in Spring Ridge
With 0.6% poverty level for males and 3.9% for females among the residents of Spring Ridge, 45 to 54 year old males and 25 to 34 year old females are the most vulnerable to poverty, with 17 males (3.6%) and 76 females (16.0%) in their respective age groups living below the poverty level.
| Age Bracket | Male | Female |
| Under 5 Years | 0 (0.0%) | 0 (0.0%) |
| 5 Years | 0 (0.0%) | 0 (0.0%) |
| 6 to 11 Years | 0 (0.0%) | 0 (0.0%) |
| 12 to 14 Years | 0 (0.0%) | 0 (0.0%) |
| 15 Years | 0 (0.0%) | 0 (0.0%) |
| 16 and 17 Years | 0 (0.0%) | 0 (0.0%) |
| 18 to 24 Years | 0 (0.0%) | 0 (0.0%) |
| 25 to 34 Years | 0 (0.0%) | 76 (16.0%) |
| 35 to 44 Years | 0 (0.0%) | 0 (0.0%) |
| 45 to 54 Years | 17 (3.6%) | 15 (3.2%) |
| 55 to 64 Years | 0 (0.0%) | 0 (0.0%) |
| 65 to 74 Years | 0 (0.0%) | 0 (0.0%) |
| 75 Years and over | 0 (0.0%) | 27 (13.4%) |
| Total | 17 (0.6%) | 118 (3.9%) |
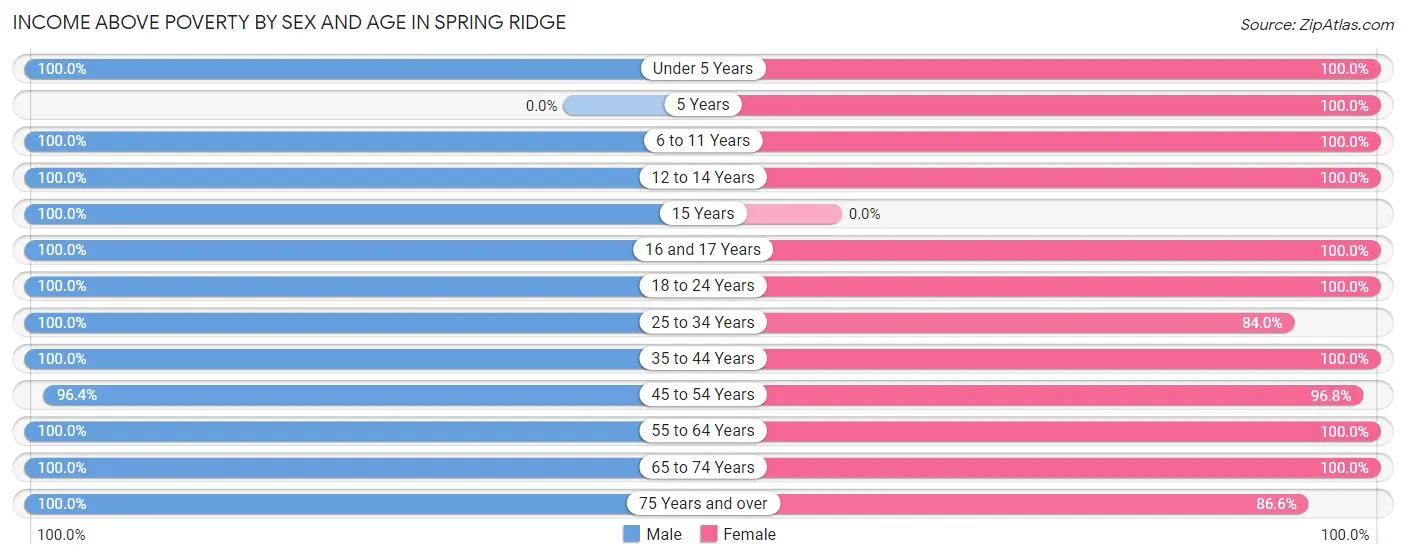
Income Above Poverty by Sex and Age in Spring Ridge
According to the poverty statistics in Spring Ridge, males aged under 5 years and females aged under 5 years are the age groups that are most secure financially, with 100.0% of males and 100.0% of females in these age groups living above the poverty line.
| Age Bracket | Male | Female |
| Under 5 Years | 87 (100.0%) | 156 (100.0%) |
| 5 Years | 0 (0.0%) | 42 (100.0%) |
| 6 to 11 Years | 263 (100.0%) | 174 (100.0%) |
| 12 to 14 Years | 99 (100.0%) | 136 (100.0%) |
| 15 Years | 17 (100.0%) | 0 (0.0%) |
| 16 and 17 Years | 128 (100.0%) | 121 (100.0%) |
| 18 to 24 Years | 311 (100.0%) | 303 (100.0%) |
| 25 to 34 Years | 490 (100.0%) | 398 (84.0%) |
| 35 to 44 Years | 290 (100.0%) | 350 (100.0%) |
| 45 to 54 Years | 458 (96.4%) | 448 (96.8%) |
| 55 to 64 Years | 219 (100.0%) | 356 (100.0%) |
| 65 to 74 Years | 164 (100.0%) | 267 (100.0%) |
| 75 Years and over | 104 (100.0%) | 175 (86.6%) |
| Total | 2,630 (99.4%) | 2,926 (96.1%) |
Income Below Poverty Among Married-Couple Families in Spring Ridge
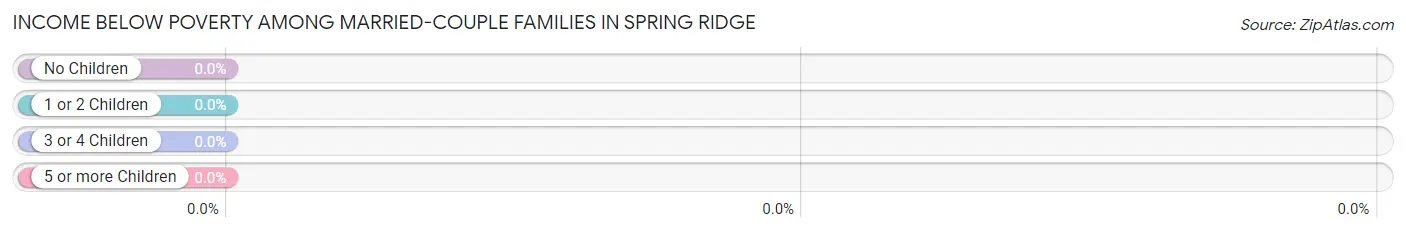
| Children | Above Poverty | Below Poverty |
| No Children | 496 (100.0%) | 0 (0.0%) |
| 1 or 2 Children | 541 (100.0%) | 0 (0.0%) |
| 3 or 4 Children | 99 (100.0%) | 0 (0.0%) |
| 5 or more Children | 0 (0.0%) | 0 (0.0%) |
| Total | 1,136 (100.0%) | 0 (0.0%) |
Income Below Poverty Among Single-Parent Households in Spring Ridge
| Children | Single Father | Single Mother |
| No Children | 0 (0.0%) | 0 (0.0%) |
| 1 or 2 Children | 0 (0.0%) | 0 (0.0%) |
| 3 or 4 Children | 0 (0.0%) | 0 (0.0%) |
| 5 or more Children | 0 (0.0%) | 0 (0.0%) |
| Total | 0 (0.0%) | 0 (0.0%) |
Income Below Poverty Among Married-Couple vs Single-Parent Households in Spring Ridge
| Children | Married-Couple Families | Single-Parent Households |
| No Children | 0 (0.0%) | 0 (0.0%) |
| 1 or 2 Children | 0 (0.0%) | 0 (0.0%) |
| 3 or 4 Children | 0 (0.0%) | 0 (0.0%) |
| 5 or more Children | 0 (0.0%) | 0 (0.0%) |
| Total | 0 (0.0%) | 0 (0.0%) |
Race in Spring Ridge
The most populous races in Spring Ridge are White / Caucasian (4,856 | 85.3%), Two or more Races (415 | 7.3%), and Black / African American (397 | 7.0%).
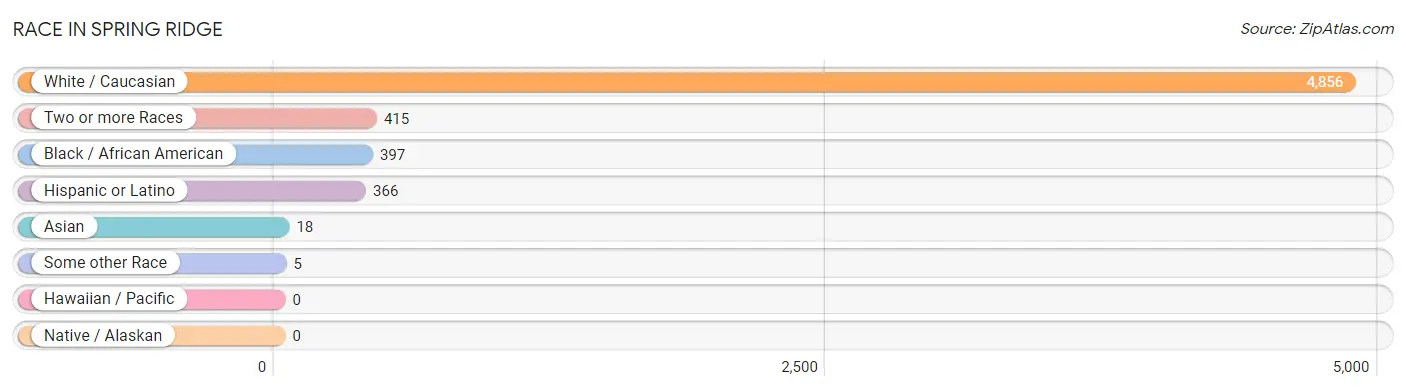
| Race | # Population | % Population |
| Asian | 18 | 0.3% |
| Black / African American | 397 | 7.0% |
| Hawaiian / Pacific | 0 | 0.0% |
| Hispanic or Latino | 366 | 6.4% |
| Native / Alaskan | 0 | 0.0% |
| White / Caucasian | 4,856 | 85.3% |
| Two or more Races | 415 | 7.3% |
| Some other Race | 5 | 0.1% |
| Total | 5,691 | 100.0% |
Ancestry in Spring Ridge
The most populous ancestries reported in Spring Ridge are German (1,308 | 23.0%), Irish (880 | 15.5%), English (743 | 13.1%), Italian (603 | 10.6%), and Polish (351 | 6.2%), together accounting for 68.3% of all Spring Ridge residents.
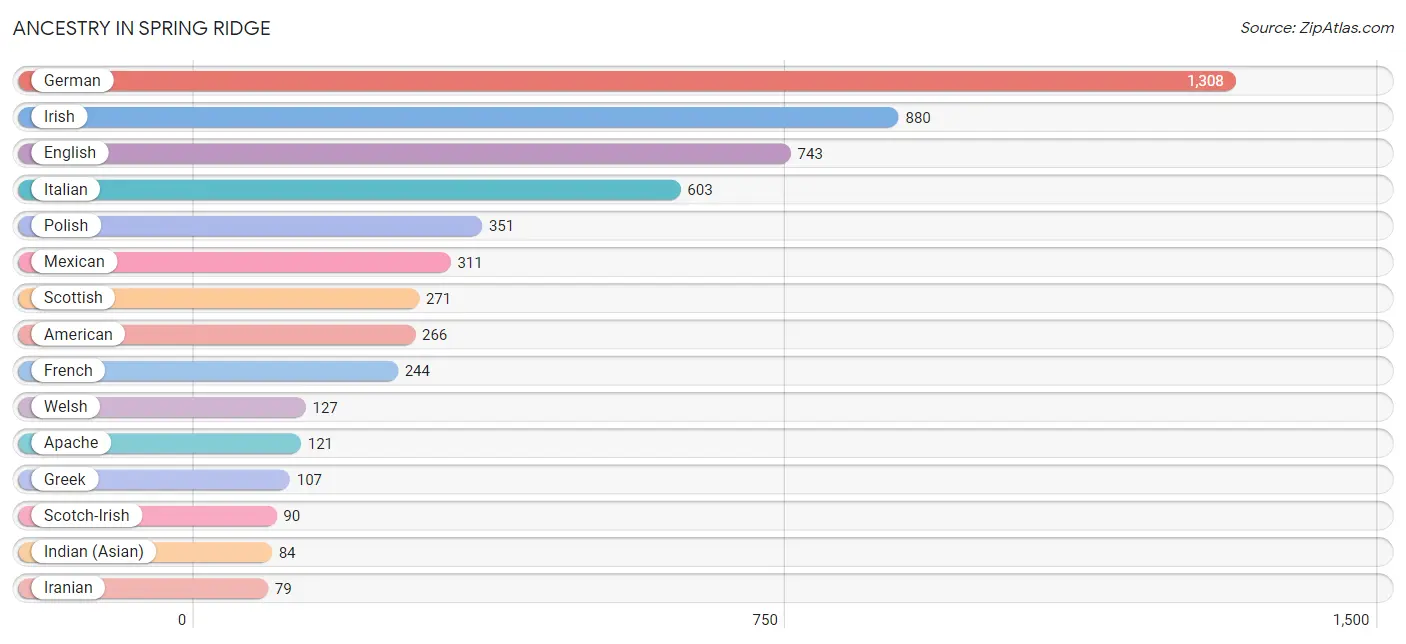
| Ancestry | # Population | % Population |
| American | 266 | 4.7% |
| Apache | 121 | 2.1% |
| Belgian | 23 | 0.4% |
| British | 65 | 1.1% |
| Burmese | 15 | 0.3% |
| Central American | 44 | 0.8% |
| Czech | 14 | 0.3% |
| Dutch | 17 | 0.3% |
| Eastern European | 58 | 1.0% |
| English | 743 | 13.1% |
| European | 51 | 0.9% |
| French | 244 | 4.3% |
| French Canadian | 28 | 0.5% |
| German | 1,308 | 23.0% |
| Greek | 107 | 1.9% |
| Hungarian | 18 | 0.3% |
| Indian (Asian) | 84 | 1.5% |
| Iranian | 79 | 1.4% |
| Irish | 880 | 15.5% |
| Italian | 603 | 10.6% |
| Lithuanian | 14 | 0.3% |
| Mexican | 311 | 5.5% |
| Norwegian | 24 | 0.4% |
| Polish | 351 | 6.2% |
| Puerto Rican | 11 | 0.2% |
| Russian | 46 | 0.8% |
| Salvadoran | 10 | 0.2% |
| Scandinavian | 23 | 0.4% |
| Scotch-Irish | 90 | 1.6% |
| Scottish | 271 | 4.8% |
| Serbian | 15 | 0.3% |
| Slovak | 11 | 0.2% |
| Slovene | 15 | 0.3% |
| Swedish | 74 | 1.3% |
| Ukrainian | 20 | 0.4% |
| Welsh | 127 | 2.2% | View All 36 Rows |
Immigrants in Spring Ridge
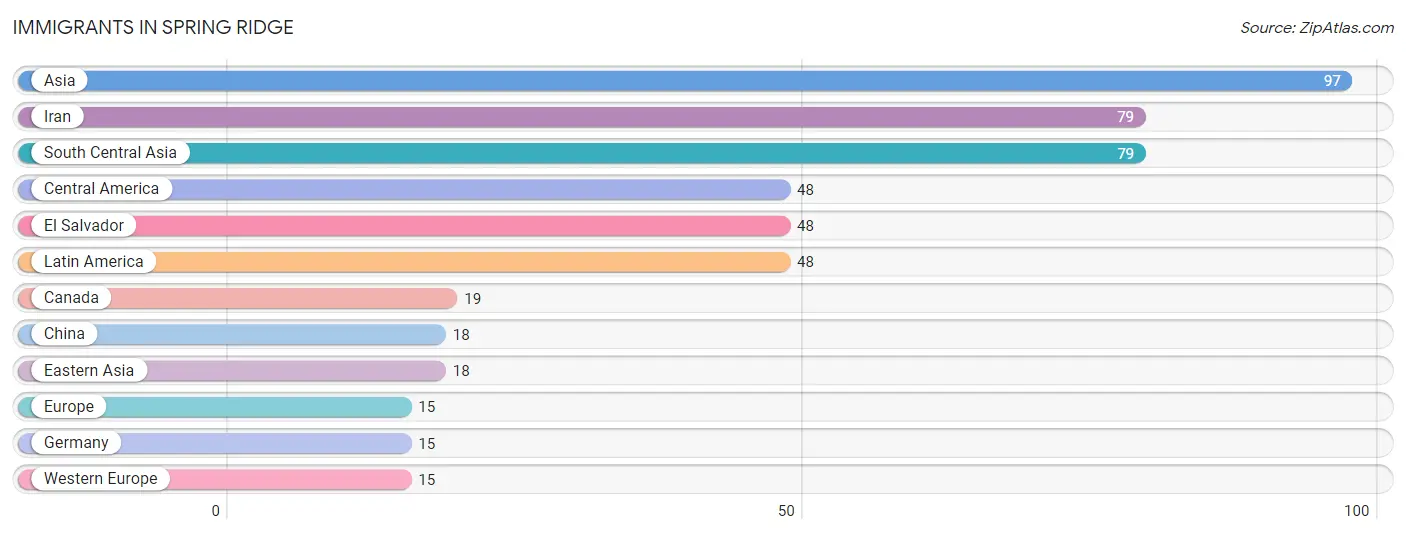
The most numerous immigrant groups reported in Spring Ridge came from Asia (97 | 1.7%), Iran (79 | 1.4%), South Central Asia (79 | 1.4%), Central America (48 | 0.8%), and El Salvador (48 | 0.8%), together accounting for 6.2% of all Spring Ridge residents.
| Immigration Origin | # Population | % Population |
| Asia | 97 | 1.7% |
| Canada | 19 | 0.3% |
| Central America | 48 | 0.8% |
| China | 18 | 0.3% |
| Eastern Asia | 18 | 0.3% |
| El Salvador | 48 | 0.8% |
| Europe | 15 | 0.3% |
| Germany | 15 | 0.3% |
| Iran | 79 | 1.4% |
| Latin America | 48 | 0.8% |
| South Central Asia | 79 | 1.4% |
| Western Europe | 15 | 0.3% | View All 12 Rows |
Sex and Age in Spring Ridge
Sex and Age in Spring Ridge
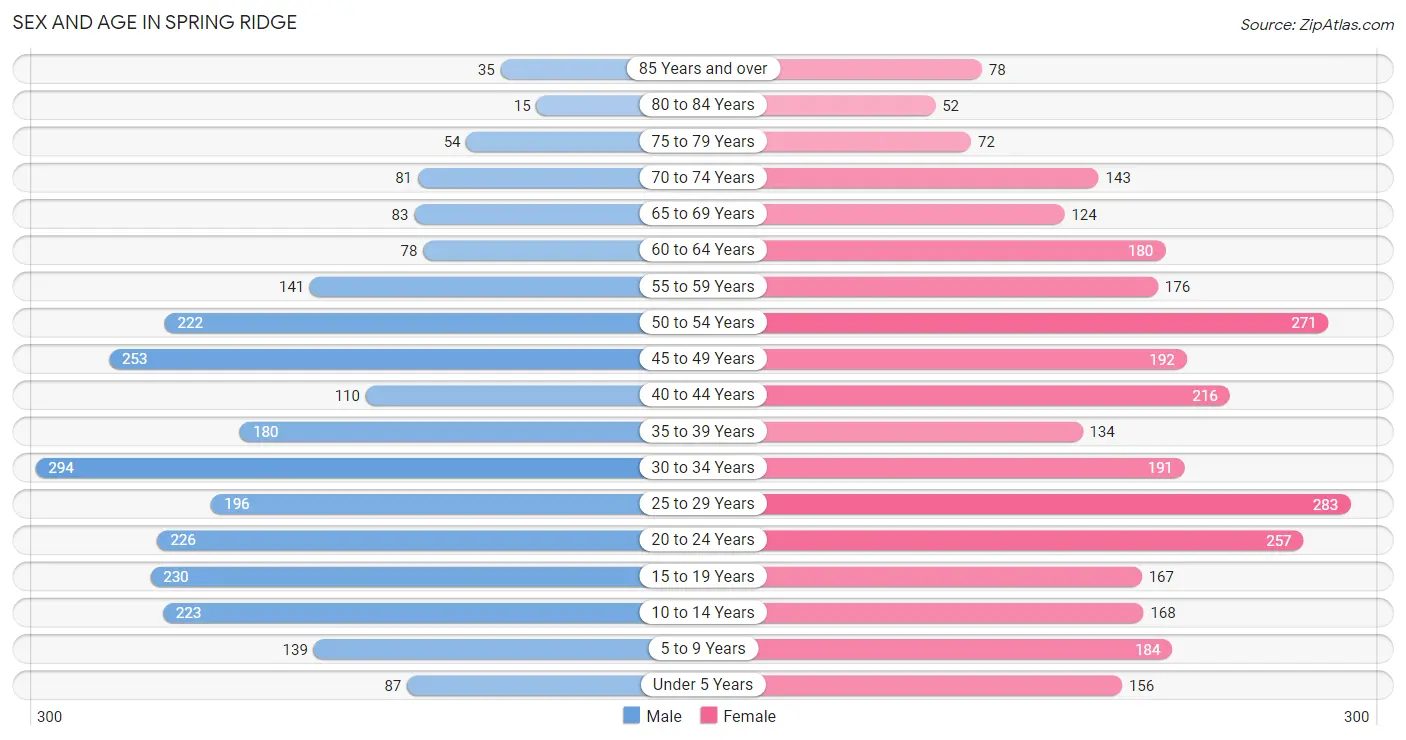
The most populous age groups in Spring Ridge are 30 to 34 Years (294 | 11.1%) for men and 25 to 29 Years (283 | 9.3%) for women.
| Age Bracket | Male | Female |
| Under 5 Years | 87 (3.3%) | 156 (5.1%) |
| 5 to 9 Years | 139 (5.2%) | 184 (6.0%) |
| 10 to 14 Years | 223 (8.4%) | 168 (5.5%) |
| 15 to 19 Years | 230 (8.7%) | 167 (5.5%) |
| 20 to 24 Years | 226 (8.5%) | 257 (8.4%) |
| 25 to 29 Years | 196 (7.4%) | 283 (9.3%) |
| 30 to 34 Years | 294 (11.1%) | 191 (6.3%) |
| 35 to 39 Years | 180 (6.8%) | 134 (4.4%) |
| 40 to 44 Years | 110 (4.2%) | 216 (7.1%) |
| 45 to 49 Years | 253 (9.6%) | 192 (6.3%) |
| 50 to 54 Years | 222 (8.4%) | 271 (8.9%) |
| 55 to 59 Years | 141 (5.3%) | 176 (5.8%) |
| 60 to 64 Years | 78 (2.9%) | 180 (5.9%) |
| 65 to 69 Years | 83 (3.1%) | 124 (4.1%) |
| 70 to 74 Years | 81 (3.1%) | 143 (4.7%) |
| 75 to 79 Years | 54 (2.0%) | 72 (2.4%) |
| 80 to 84 Years | 15 (0.6%) | 52 (1.7%) |
| 85 Years and over | 35 (1.3%) | 78 (2.6%) |
| Total | 2,647 (100.0%) | 3,044 (100.0%) |
Families and Households in Spring Ridge
Median Family Size in Spring Ridge
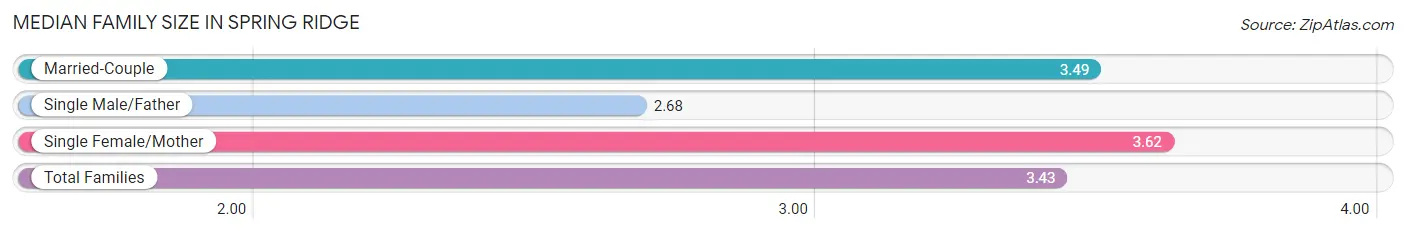
The median family size in Spring Ridge is 3.43 persons per family, with single female/mother families (104 | 7.7%) accounting for the largest median family size of 3.62 persons per family. On the other hand, single male/father families (107 | 7.9%) represent the smallest median family size with 2.68 persons per family.
| Family Type | # Families | Family Size |
| Married-Couple | 1,136 (84.3%) | 3.49 |
| Single Male/Father | 107 (7.9%) | 2.68 |
| Single Female/Mother | 104 (7.7%) | 3.62 |
| Total Families | 1,347 (100.0%) | 3.43 |
Median Household Size in Spring Ridge
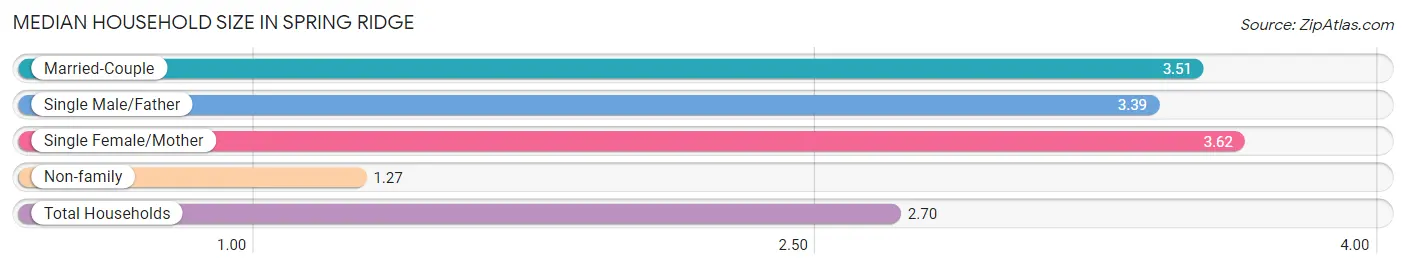
The median household size in Spring Ridge is 2.70 persons per household, with single female/mother households (104 | 4.9%) accounting for the largest median household size of 3.62 persons per household. non-family households (761 | 36.1%) represent the smallest median household size with 1.27 persons per household.
| Household Type | # Households | Household Size |
| Married-Couple | 1,136 (53.9%) | 3.51 |
| Single Male/Father | 107 (5.1%) | 3.39 |
| Single Female/Mother | 104 (4.9%) | 3.62 |
| Non-family | 761 (36.1%) | 1.27 |
| Total Households | 2,108 (100.0%) | 2.70 |
Household Size by Marriage Status in Spring Ridge
Out of a total of 2,108 households in Spring Ridge, 1,347 (63.9%) are family households, while 761 (36.1%) are nonfamily households. The most numerous type of family households are 3-person households, comprising 489, and the most common type of nonfamily households are 1-person households, comprising 598.
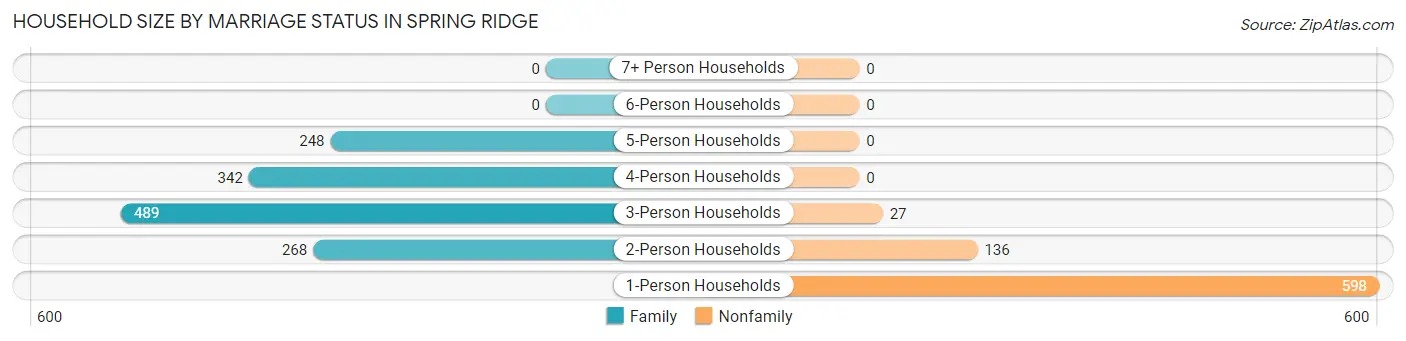
| Household Size | Family Households | Nonfamily Households |
| 1-Person Households | - | 598 (28.4%) |
| 2-Person Households | 268 (12.7%) | 136 (6.5%) |
| 3-Person Households | 489 (23.2%) | 27 (1.3%) |
| 4-Person Households | 342 (16.2%) | 0 (0.0%) |
| 5-Person Households | 248 (11.8%) | 0 (0.0%) |
| 6-Person Households | 0 (0.0%) | 0 (0.0%) |
| 7+ Person Households | 0 (0.0%) | 0 (0.0%) |
| Total | 1,347 (63.9%) | 761 (36.1%) |
Female Fertility in Spring Ridge
Fertility by Age in Spring Ridge
Average fertility rate in Spring Ridge is 19.0 births per 1,000 women. Women in the age bracket of 20 to 34 years have the highest fertility rate with 40.0 births per 1,000 women. Women in the age bracket of 20 to 34 years acount for 100.0% of all women with births.
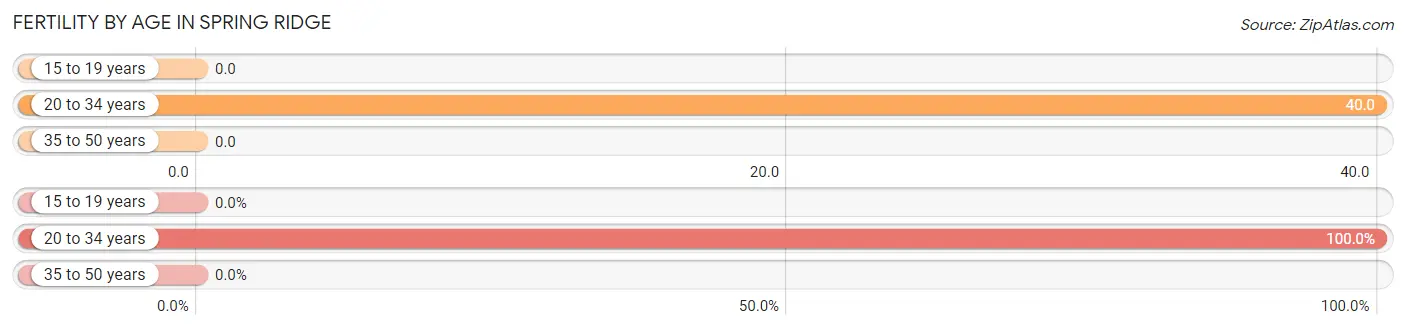
| Age Bracket | Women with Births | Births / 1,000 Women |
| 15 to 19 years | 0 (0.0%) | 0.0 |
| 20 to 34 years | 29 (100.0%) | 40.0 |
| 35 to 50 years | 0 (0.0%) | 0.0 |
| Total | 29 (100.0%) | 19.0 |
Fertility by Age by Marriage Status in Spring Ridge
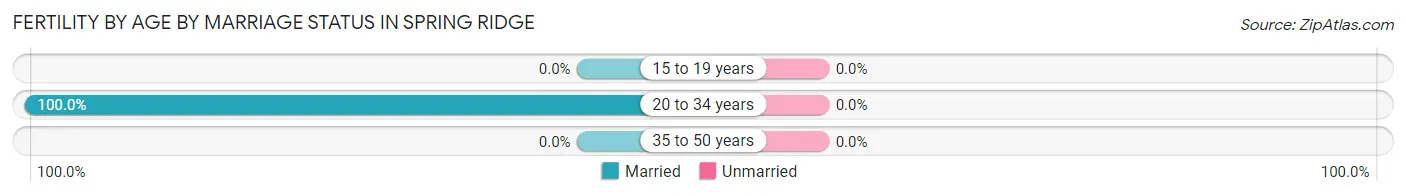
| Age Bracket | Married | Unmarried |
| 15 to 19 years | 0 (0.0%) | 0 (0.0%) |
| 20 to 34 years | 29 (100.0%) | 0 (0.0%) |
| 35 to 50 years | 0 (0.0%) | 0 (0.0%) |
| Total | 29 (100.0%) | 0 (0.0%) |
Fertility by Education in Spring Ridge
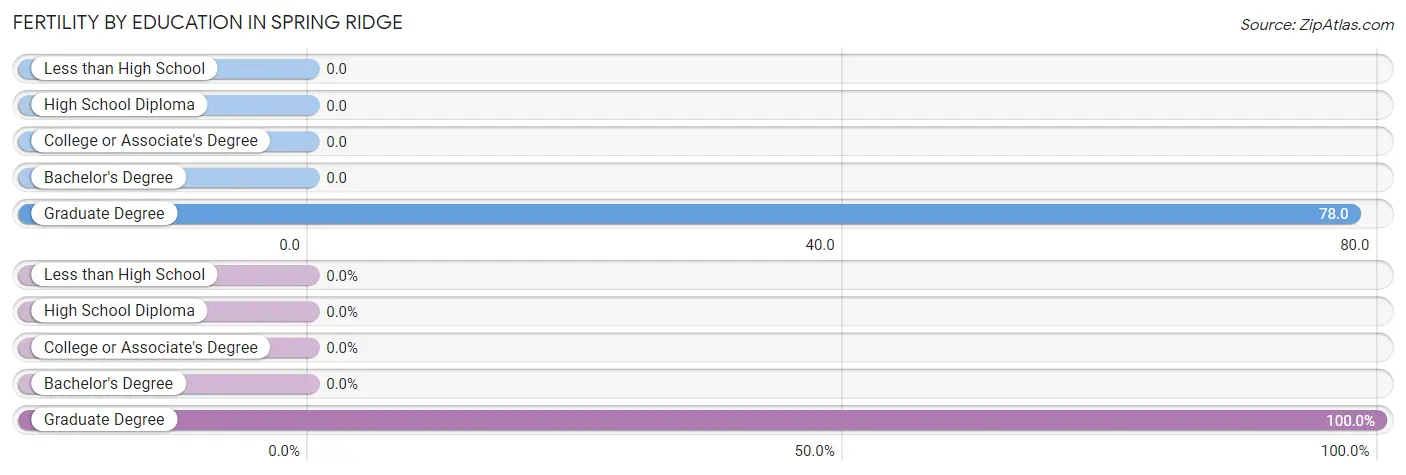
| Educational Attainment | Women with Births | Births / 1,000 Women |
| Less than High School | 0 (0.0%) | 0.0 |
| High School Diploma | 0 (0.0%) | 0.0 |
| College or Associate's Degree | 0 (0.0%) | 0.0 |
| Bachelor's Degree | 0 (0.0%) | 0.0 |
| Graduate Degree | 29 (100.0%) | 78.0 |
| Total | 29 (100.0%) | 19.0 |
Fertility by Education by Marriage Status in Spring Ridge
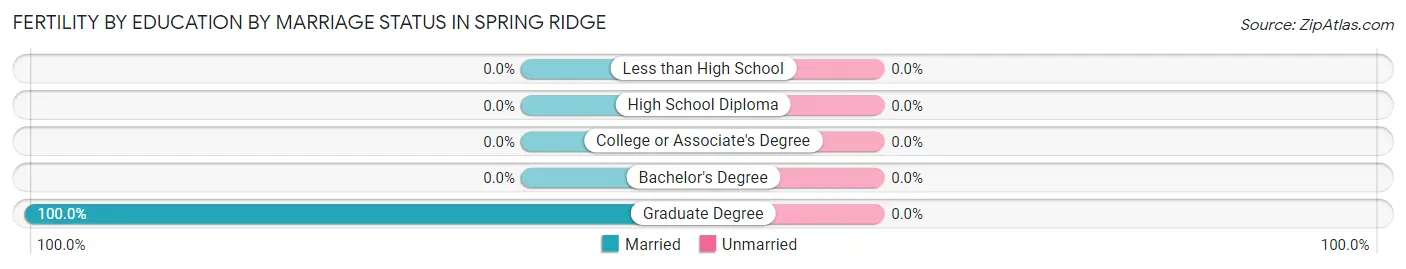
| Educational Attainment | Married | Unmarried |
| Less than High School | 0 (0.0%) | 0 (0.0%) |
| High School Diploma | 0 (0.0%) | 0 (0.0%) |
| College or Associate's Degree | 0 (0.0%) | 0 (0.0%) |
| Bachelor's Degree | 0 (0.0%) | 0 (0.0%) |
| Graduate Degree | 29 (100.0%) | 0 (0.0%) |
| Total | 29 (100.0%) | 0 (0.0%) |
Employment Characteristics in Spring Ridge
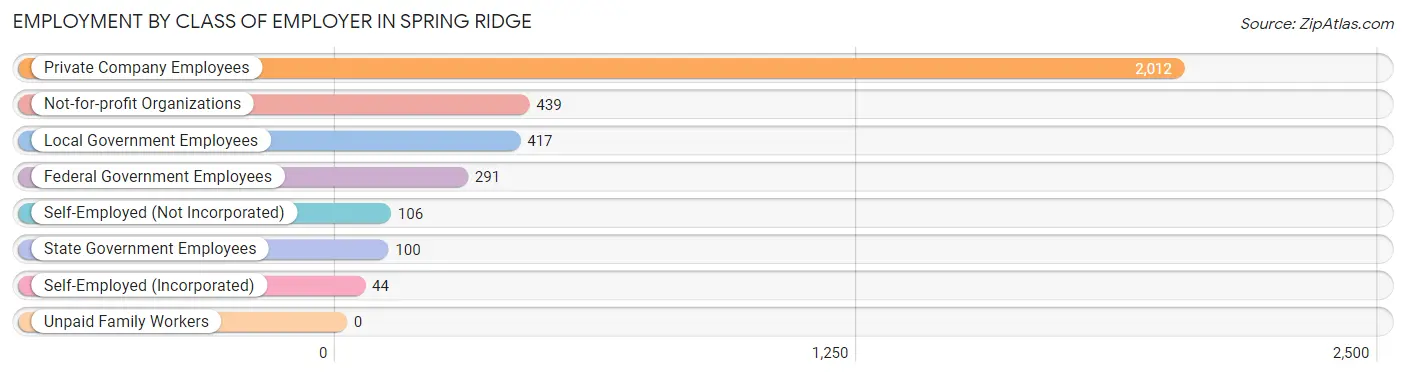
Employment by Class of Employer in Spring Ridge
Among the 3,409 employed individuals in Spring Ridge, private company employees (2,012 | 59.0%), not-for-profit organizations (439 | 12.9%), and local government employees (417 | 12.2%) make up the most common classes of employment.
| Employer Class | # Employees | % Employees |
| Private Company Employees | 2,012 | 59.0% |
| Self-Employed (Incorporated) | 44 | 1.3% |
| Self-Employed (Not Incorporated) | 106 | 3.1% |
| Not-for-profit Organizations | 439 | 12.9% |
| Local Government Employees | 417 | 12.2% |
| State Government Employees | 100 | 2.9% |
| Federal Government Employees | 291 | 8.5% |
| Unpaid Family Workers | 0 | 0.0% |
| Total | 3,409 | 100.0% |
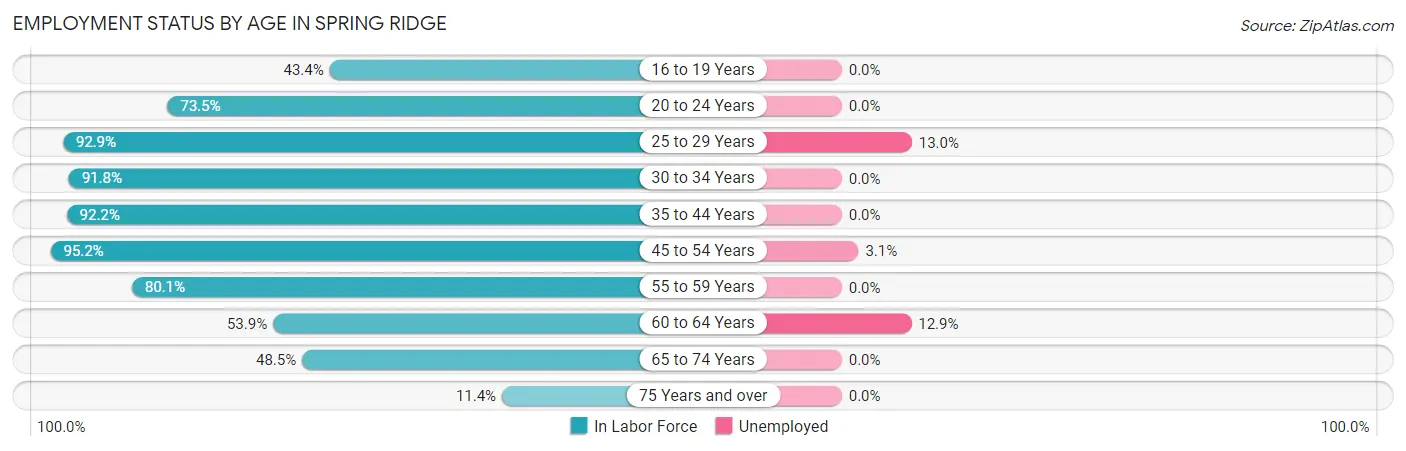
Employment Status by Age in Spring Ridge
According to the labor force statistics for Spring Ridge, out of the total population over 16 years of age (4,717), 74.8% or 3,528 individuals are in the labor force, with 3.0% or 106 of them unemployed. The age group with the highest labor force participation rate is 45 to 54 years, with 95.2% or 893 individuals in the labor force. Within the labor force, the 25 to 29 years age range has the highest percentage of unemployed individuals, with 13.0% or 58 of them being unemployed.
| Age Bracket | In Labor Force | Unemployed |
| 16 to 19 Years | 165 (43.4%) | 0 (0.0%) |
| 20 to 24 Years | 355 (73.5%) | 0 (0.0%) |
| 25 to 29 Years | 445 (92.9%) | 58 (13.0%) |
| 30 to 34 Years | 445 (91.8%) | 0 (0.0%) |
| 35 to 44 Years | 590 (92.2%) | 0 (0.0%) |
| 45 to 54 Years | 893 (95.2%) | 28 (3.1%) |
| 55 to 59 Years | 254 (80.1%) | 0 (0.0%) |
| 60 to 64 Years | 139 (53.9%) | 18 (12.9%) |
| 65 to 74 Years | 209 (48.5%) | 0 (0.0%) |
| 75 Years and over | 35 (11.4%) | 0 (0.0%) |
| Total | 3,528 (74.8%) | 106 (3.0%) |
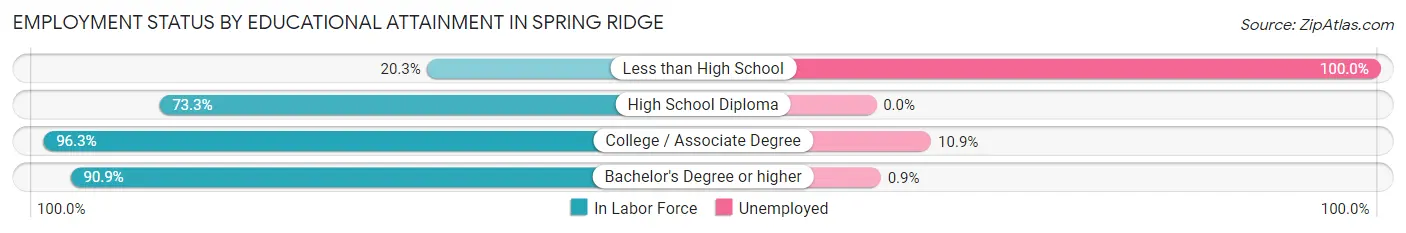
Employment Status by Educational Attainment in Spring Ridge
According to labor force statistics for Spring Ridge, 88.7% of individuals (2,765) out of the total population between 25 and 64 years of age (3,117) are in the labor force, with 3.8% or 105 of them being unemployed. The group with the highest labor force participation rate are those with the educational attainment of college / associate degree, with 96.3% or 697 individuals in the labor force. Within the labor force, individuals with less than high school education have the highest percentage of unemployment, with 100.0% or 12 of them being unemployed.
| Educational Attainment | In Labor Force | Unemployed |
| Less than High School | 12 (20.3%) | 59 (100.0%) |
| High School Diploma | 272 (73.3%) | 0 (0.0%) |
| College / Associate Degree | 697 (96.3%) | 79 (10.9%) |
| Bachelor's Degree or higher | 1,784 (90.9%) | 18 (0.9%) |
| Total | 2,765 (88.7%) | 118 (3.8%) |
Employment Occupations by Sex in Spring Ridge
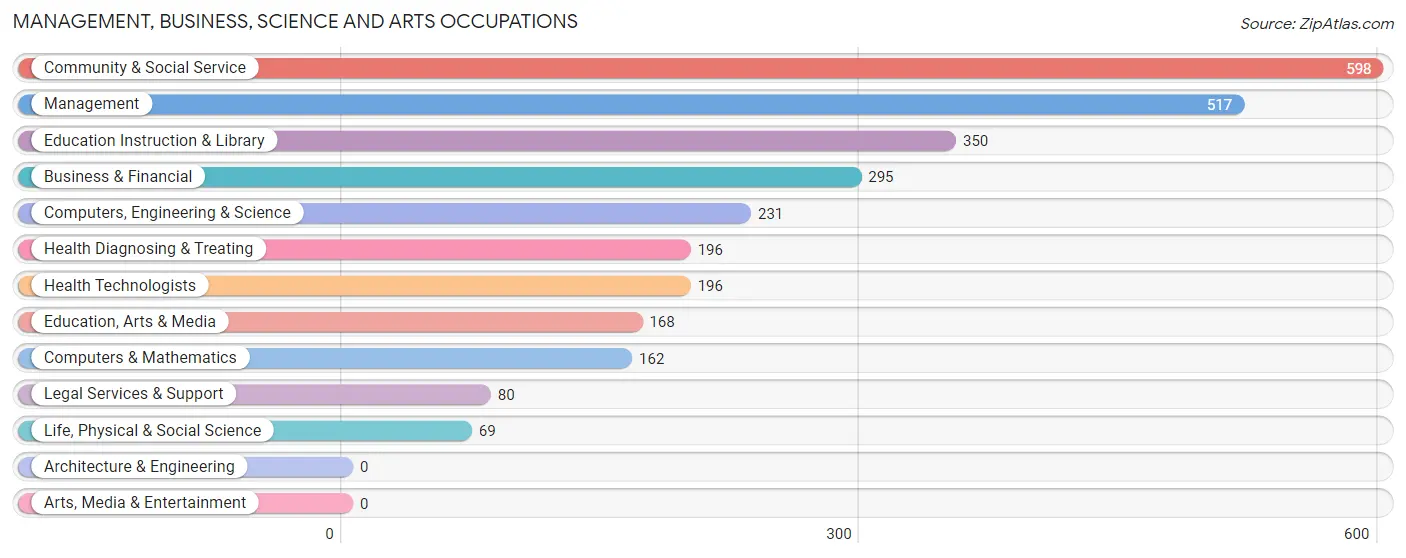
Management, Business, Science and Arts Occupations
The most common Management, Business, Science and Arts occupations in Spring Ridge are Community & Social Service (598 | 17.8%), Management (517 | 15.4%), Education Instruction & Library (350 | 10.4%), Business & Financial (295 | 8.8%), and Computers, Engineering & Science (231 | 6.9%).
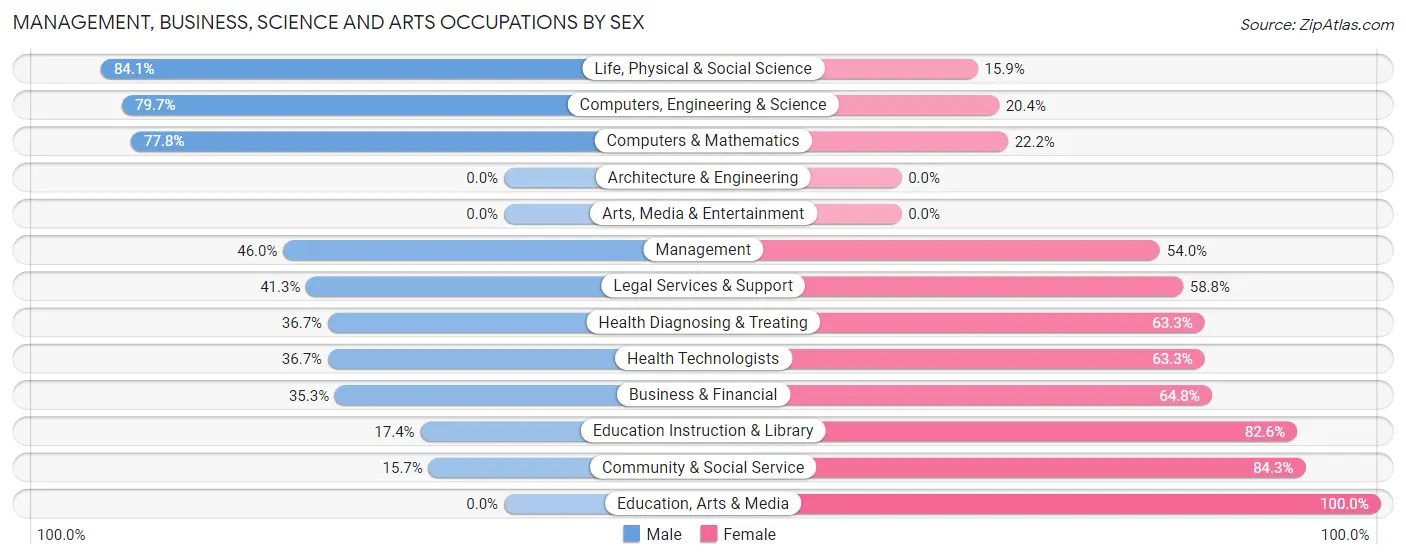
Management, Business, Science and Arts Occupations by Sex
Within the Management, Business, Science and Arts occupations in Spring Ridge, the most male-oriented occupations are Life, Physical & Social Science (84.1%), Computers, Engineering & Science (79.6%), and Computers & Mathematics (77.8%), while the most female-oriented occupations are Education, Arts & Media (100.0%), Community & Social Service (84.3%), and Education Instruction & Library (82.6%).
| Occupation | Male | Female |
| Management | 238 (46.0%) | 279 (54.0%) |
| Business & Financial | 104 (35.2%) | 191 (64.7%) |
| Computers, Engineering & Science | 184 (79.6%) | 47 (20.3%) |
| Computers & Mathematics | 126 (77.8%) | 36 (22.2%) |
| Architecture & Engineering | 0 (0.0%) | 0 (0.0%) |
| Life, Physical & Social Science | 58 (84.1%) | 11 (15.9%) |
| Community & Social Service | 94 (15.7%) | 504 (84.3%) |
| Education, Arts & Media | 0 (0.0%) | 168 (100.0%) |
| Legal Services & Support | 33 (41.2%) | 47 (58.8%) |
| Education Instruction & Library | 61 (17.4%) | 289 (82.6%) |
| Arts, Media & Entertainment | 0 (0.0%) | 0 (0.0%) |
| Health Diagnosing & Treating | 72 (36.7%) | 124 (63.3%) |
| Health Technologists | 72 (36.7%) | 124 (63.3%) |
| Total (Category) | 692 (37.7%) | 1,145 (62.3%) |
| Total (Overall) | 1,572 (46.8%) | 1,787 (53.2%) |
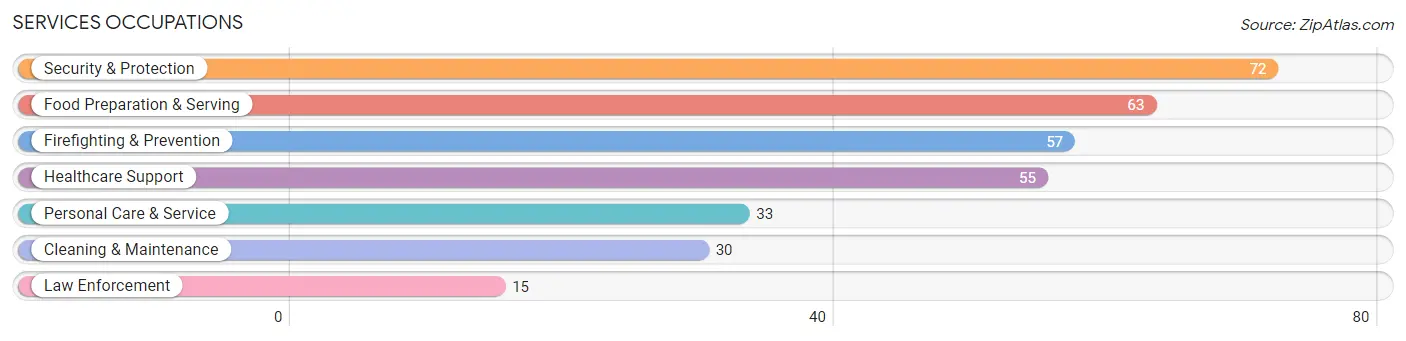
Services Occupations
The most common Services occupations in Spring Ridge are Security & Protection (72 | 2.1%), Food Preparation & Serving (63 | 1.9%), Firefighting & Prevention (57 | 1.7%), Healthcare Support (55 | 1.6%), and Personal Care & Service (33 | 1.0%).
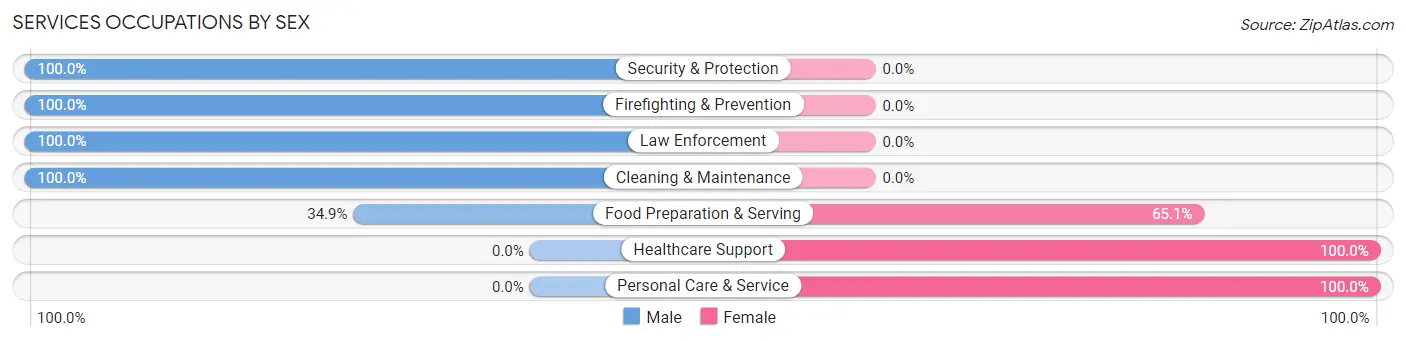
Services Occupations by Sex
Within the Services occupations in Spring Ridge, the most male-oriented occupations are Security & Protection (100.0%), Firefighting & Prevention (100.0%), and Law Enforcement (100.0%), while the most female-oriented occupations are Healthcare Support (100.0%), Personal Care & Service (100.0%), and Food Preparation & Serving (65.1%).
| Occupation | Male | Female |
| Healthcare Support | 0 (0.0%) | 55 (100.0%) |
| Security & Protection | 72 (100.0%) | 0 (0.0%) |
| Firefighting & Prevention | 57 (100.0%) | 0 (0.0%) |
| Law Enforcement | 15 (100.0%) | 0 (0.0%) |
| Food Preparation & Serving | 22 (34.9%) | 41 (65.1%) |
| Cleaning & Maintenance | 30 (100.0%) | 0 (0.0%) |
| Personal Care & Service | 0 (0.0%) | 33 (100.0%) |
| Total (Category) | 124 (49.0%) | 129 (51.0%) |
| Total (Overall) | 1,572 (46.8%) | 1,787 (53.2%) |
Sales and Office Occupations
The most common Sales and Office occupations in Spring Ridge are Office & Administration (401 | 11.9%), and Sales & Related (373 | 11.1%).
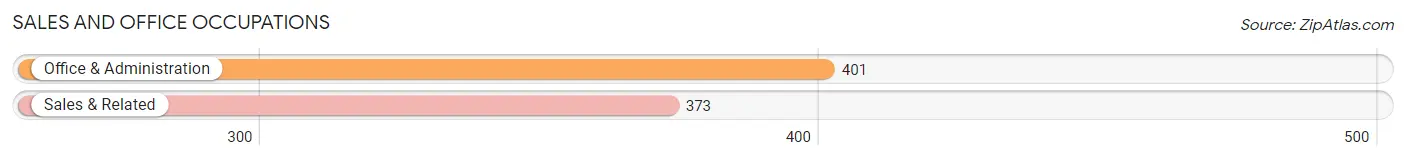
Sales and Office Occupations by Sex
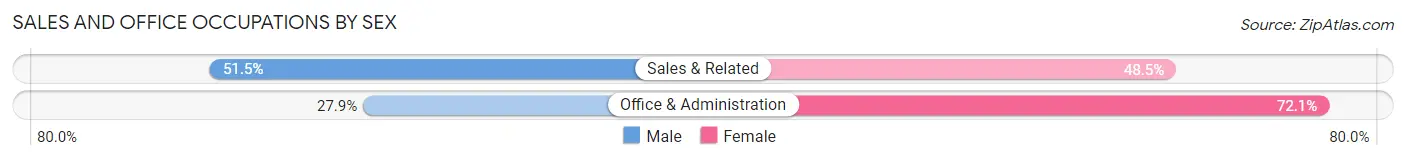
| Occupation | Male | Female |
| Sales & Related | 192 (51.5%) | 181 (48.5%) |
| Office & Administration | 112 (27.9%) | 289 (72.1%) |
| Total (Category) | 304 (39.3%) | 470 (60.7%) |
| Total (Overall) | 1,572 (46.8%) | 1,787 (53.2%) |
Natural Resources, Construction and Maintenance Occupations
The most common Natural Resources, Construction and Maintenance occupations in Spring Ridge are Construction & Extraction (136 | 4.1%), and Installation, Maintenance & Repair (45 | 1.3%).
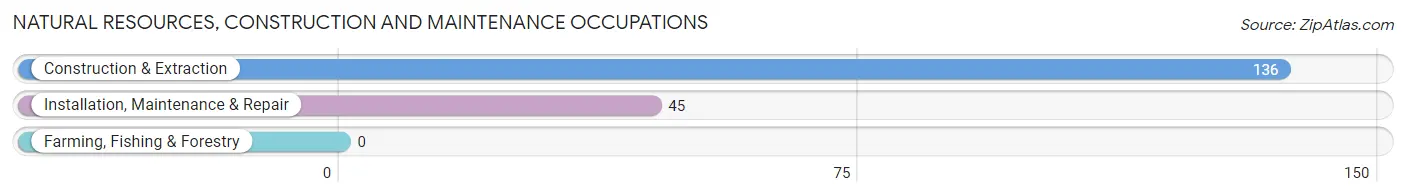
Natural Resources, Construction and Maintenance Occupations by Sex
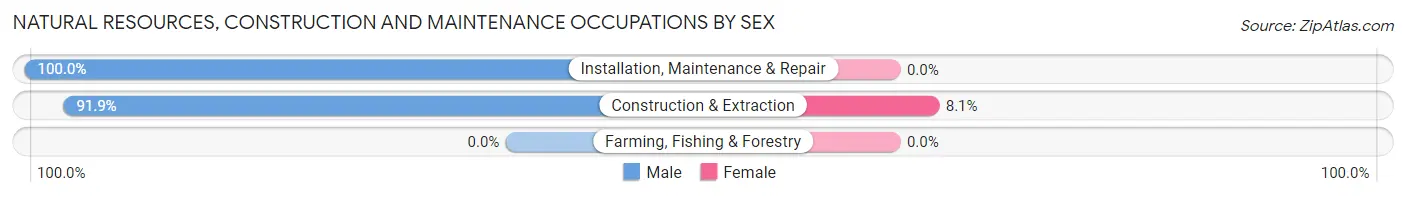
| Occupation | Male | Female |
| Farming, Fishing & Forestry | 0 (0.0%) | 0 (0.0%) |
| Construction & Extraction | 125 (91.9%) | 11 (8.1%) |
| Installation, Maintenance & Repair | 45 (100.0%) | 0 (0.0%) |
| Total (Category) | 170 (93.9%) | 11 (6.1%) |
| Total (Overall) | 1,572 (46.8%) | 1,787 (53.2%) |
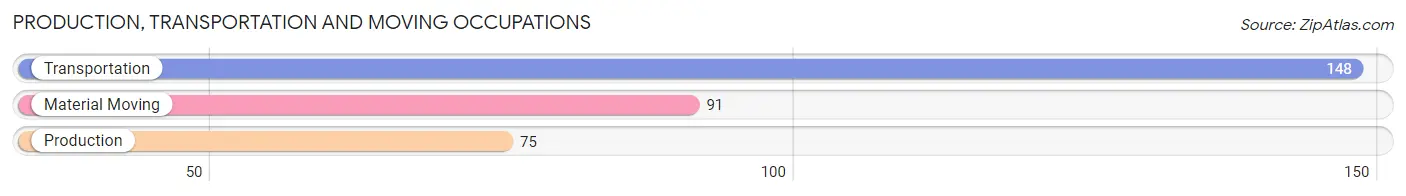
Production, Transportation and Moving Occupations
The most common Production, Transportation and Moving occupations in Spring Ridge are Transportation (148 | 4.4%), Material Moving (91 | 2.7%), and Production (75 | 2.2%).
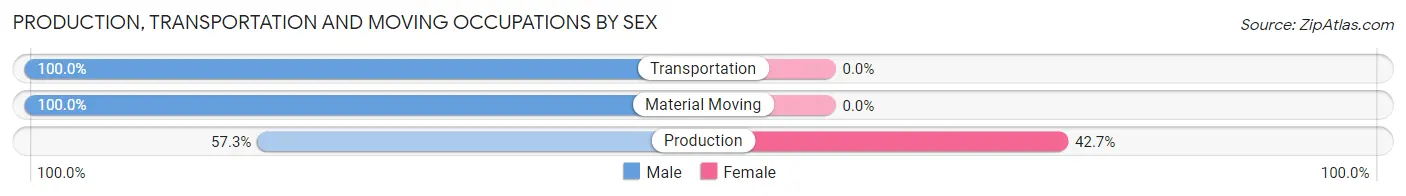
Production, Transportation and Moving Occupations by Sex
| Occupation | Male | Female |
| Production | 43 (57.3%) | 32 (42.7%) |
| Transportation | 148 (100.0%) | 0 (0.0%) |
| Material Moving | 91 (100.0%) | 0 (0.0%) |
| Total (Category) | 282 (89.8%) | 32 (10.2%) |
| Total (Overall) | 1,572 (46.8%) | 1,787 (53.2%) |
Employment Industries by Sex in Spring Ridge
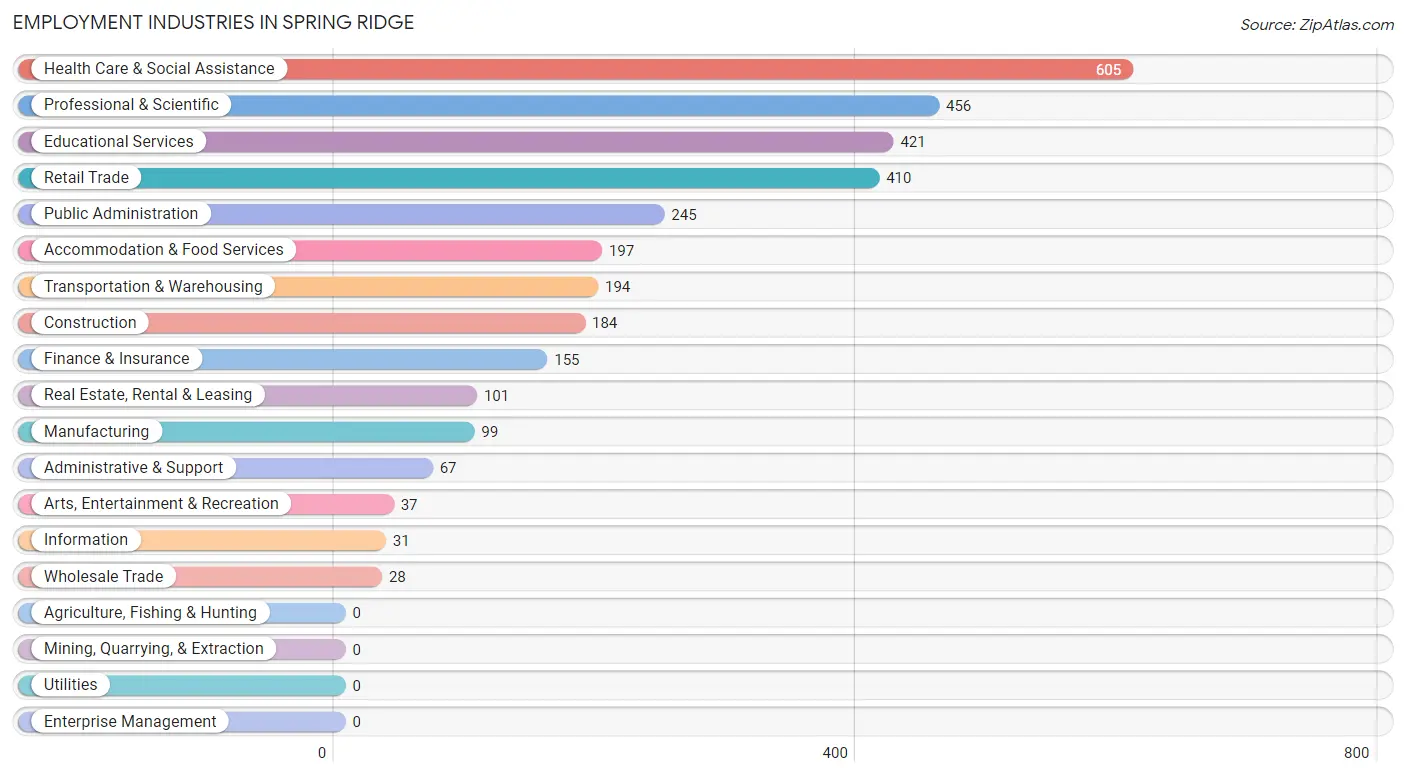
Employment Industries in Spring Ridge
The major employment industries in Spring Ridge include Health Care & Social Assistance (605 | 18.0%), Professional & Scientific (456 | 13.6%), Educational Services (421 | 12.5%), Retail Trade (410 | 12.2%), and Public Administration (245 | 7.3%).
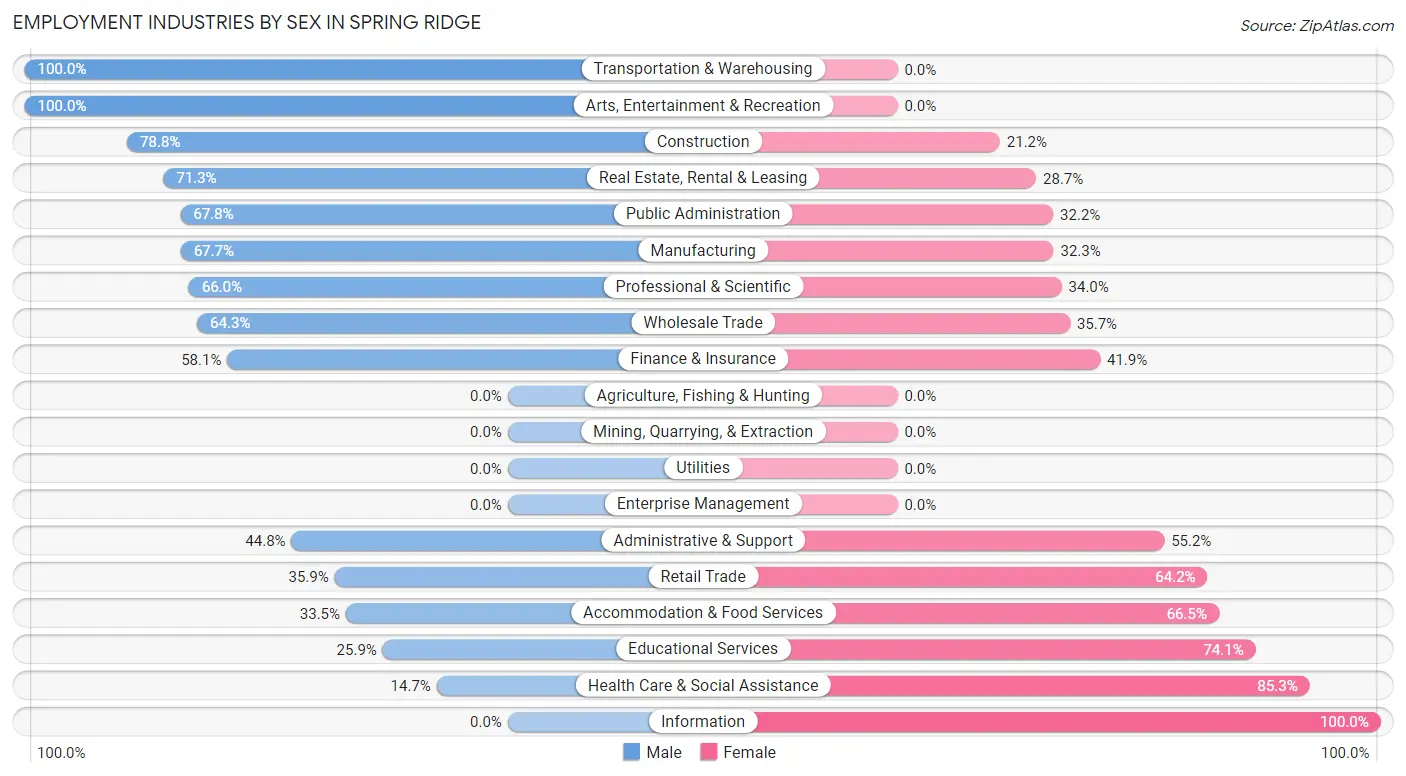
Employment Industries by Sex in Spring Ridge
The Spring Ridge industries that see more men than women are Transportation & Warehousing (100.0%), Arts, Entertainment & Recreation (100.0%), and Construction (78.8%), whereas the industries that tend to have a higher number of women are Information (100.0%), Health Care & Social Assistance (85.3%), and Educational Services (74.1%).
| Industry | Male | Female |
| Agriculture, Fishing & Hunting | 0 (0.0%) | 0 (0.0%) |
| Mining, Quarrying, & Extraction | 0 (0.0%) | 0 (0.0%) |
| Construction | 145 (78.8%) | 39 (21.2%) |
| Manufacturing | 67 (67.7%) | 32 (32.3%) |
| Wholesale Trade | 18 (64.3%) | 10 (35.7%) |
| Retail Trade | 147 (35.8%) | 263 (64.1%) |
| Transportation & Warehousing | 194 (100.0%) | 0 (0.0%) |
| Utilities | 0 (0.0%) | 0 (0.0%) |
| Information | 0 (0.0%) | 31 (100.0%) |
| Finance & Insurance | 90 (58.1%) | 65 (41.9%) |
| Real Estate, Rental & Leasing | 72 (71.3%) | 29 (28.7%) |
| Professional & Scientific | 301 (66.0%) | 155 (34.0%) |
| Enterprise Management | 0 (0.0%) | 0 (0.0%) |
| Administrative & Support | 30 (44.8%) | 37 (55.2%) |
| Educational Services | 109 (25.9%) | 312 (74.1%) |
| Health Care & Social Assistance | 89 (14.7%) | 516 (85.3%) |
| Arts, Entertainment & Recreation | 37 (100.0%) | 0 (0.0%) |
| Accommodation & Food Services | 66 (33.5%) | 131 (66.5%) |
| Public Administration | 166 (67.8%) | 79 (32.2%) |
| Total | 1,572 (46.8%) | 1,787 (53.2%) |
Education in Spring Ridge
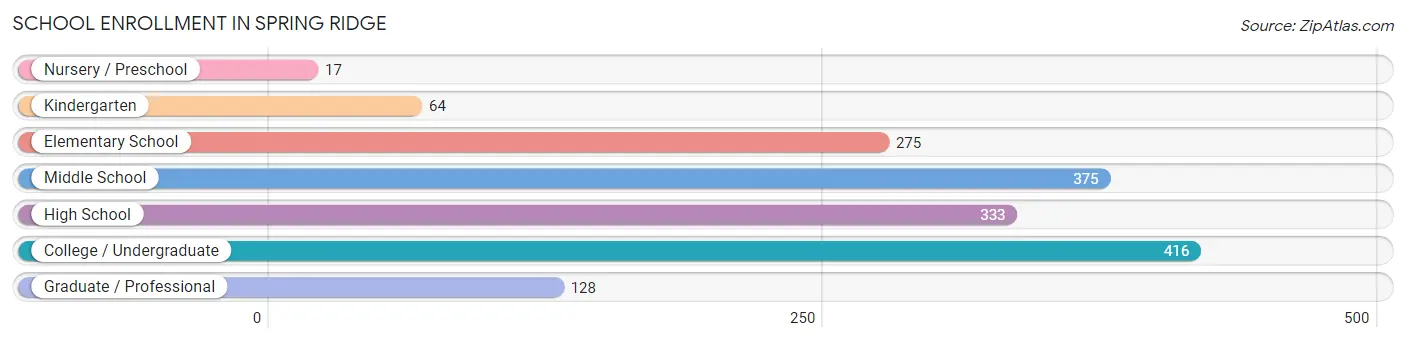
School Enrollment in Spring Ridge
The most common levels of schooling among the 1,608 students in Spring Ridge are college / undergraduate (416 | 25.9%), middle school (375 | 23.3%), and high school (333 | 20.7%).
| School Level | # Students | % Students |
| Nursery / Preschool | 17 | 1.1% |
| Kindergarten | 64 | 4.0% |
| Elementary School | 275 | 17.1% |
| Middle School | 375 | 23.3% |
| High School | 333 | 20.7% |
| College / Undergraduate | 416 | 25.9% |
| Graduate / Professional | 128 | 8.0% |
| Total | 1,608 | 100.0% |
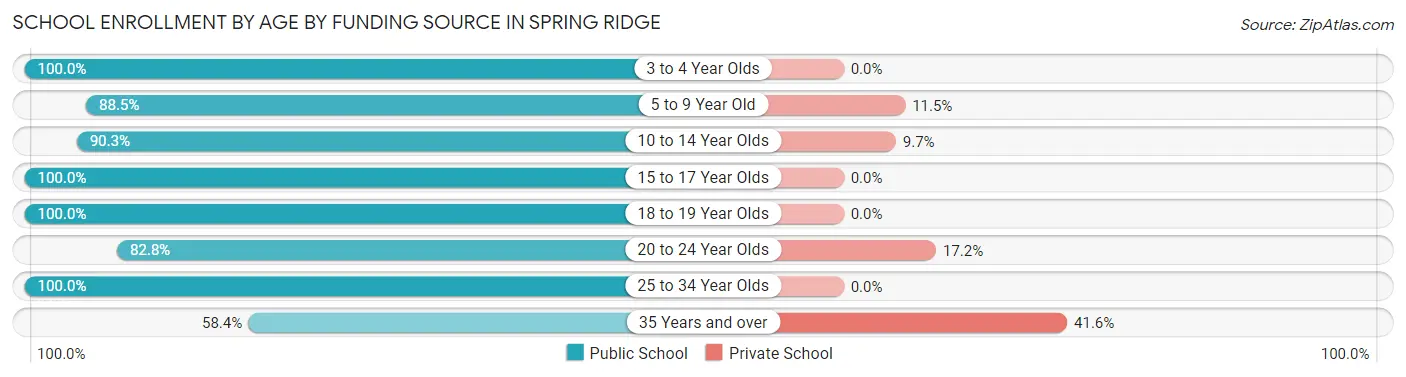
School Enrollment by Age by Funding Source in Spring Ridge
Out of a total of 1,608 students who are enrolled in schools in Spring Ridge, 183 (11.4%) attend a private institution, while the remaining 1,425 (88.6%) are enrolled in public schools. The age group of 35 years and over has the highest likelihood of being enrolled in private schools, with 72 (41.6% in the age bracket) enrolled. Conversely, the age group of 3 to 4 year olds has the lowest likelihood of being enrolled in a private school, with 17 (100.0% in the age bracket) attending a public institution.
| Age Bracket | Public School | Private School |
| 3 to 4 Year Olds | 17 (100.0%) | 0 (0.0%) |
| 5 to 9 Year Old | 286 (88.5%) | 37 (11.5%) |
| 10 to 14 Year Olds | 353 (90.3%) | 38 (9.7%) |
| 15 to 17 Year Olds | 266 (100.0%) | 0 (0.0%) |
| 18 to 19 Year Olds | 131 (100.0%) | 0 (0.0%) |
| 20 to 24 Year Olds | 178 (82.8%) | 37 (17.2%) |
| 25 to 34 Year Olds | 92 (100.0%) | 0 (0.0%) |
| 35 Years and over | 101 (58.4%) | 72 (41.6%) |
| Total | 1,425 (88.6%) | 183 (11.4%) |
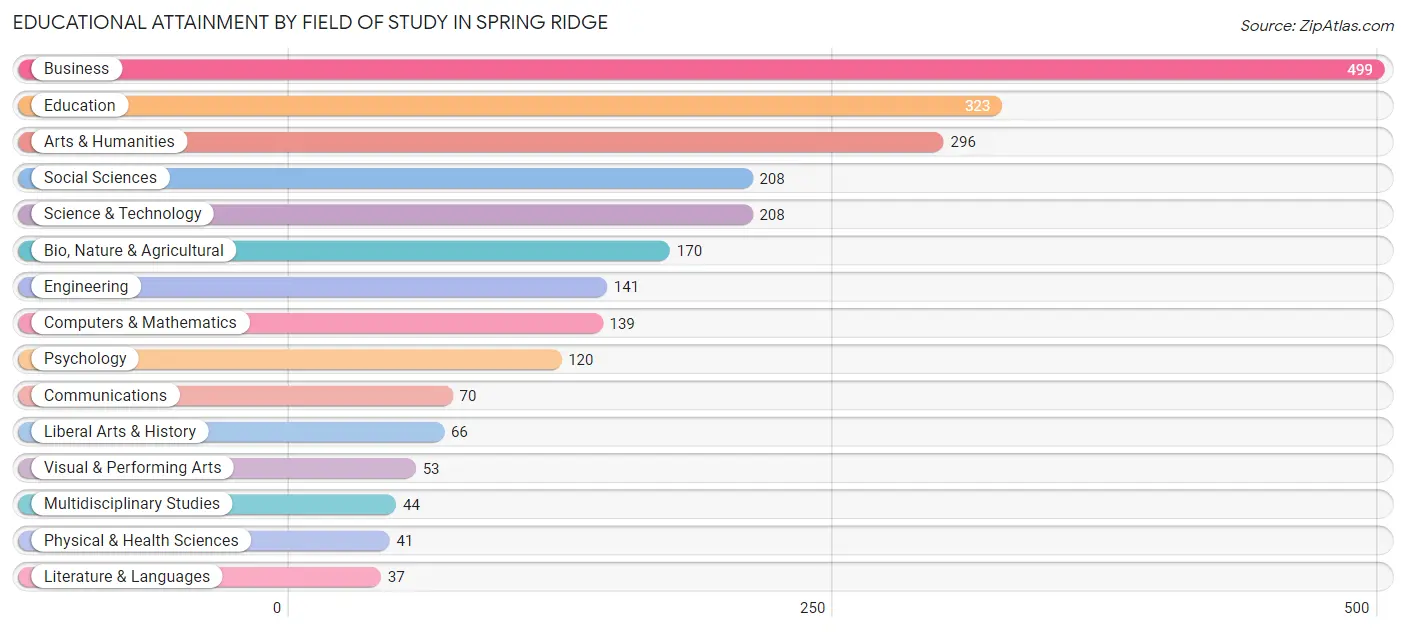
Educational Attainment by Field of Study in Spring Ridge
Business (499 | 20.7%), education (323 | 13.4%), arts & humanities (296 | 12.3%), social sciences (208 | 8.6%), and science & technology (208 | 8.6%) are the most common fields of study among 2,415 individuals in Spring Ridge who have obtained a bachelor's degree or higher.
| Field of Study | # Graduates | % Graduates |
| Computers & Mathematics | 139 | 5.8% |
| Bio, Nature & Agricultural | 170 | 7.0% |
| Physical & Health Sciences | 41 | 1.7% |
| Psychology | 120 | 5.0% |
| Social Sciences | 208 | 8.6% |
| Engineering | 141 | 5.8% |
| Multidisciplinary Studies | 44 | 1.8% |
| Science & Technology | 208 | 8.6% |
| Business | 499 | 20.7% |
| Education | 323 | 13.4% |
| Literature & Languages | 37 | 1.5% |
| Liberal Arts & History | 66 | 2.7% |
| Visual & Performing Arts | 53 | 2.2% |
| Communications | 70 | 2.9% |
| Arts & Humanities | 296 | 12.3% |
| Total | 2,415 | 100.0% |
Transportation & Commute in Spring Ridge
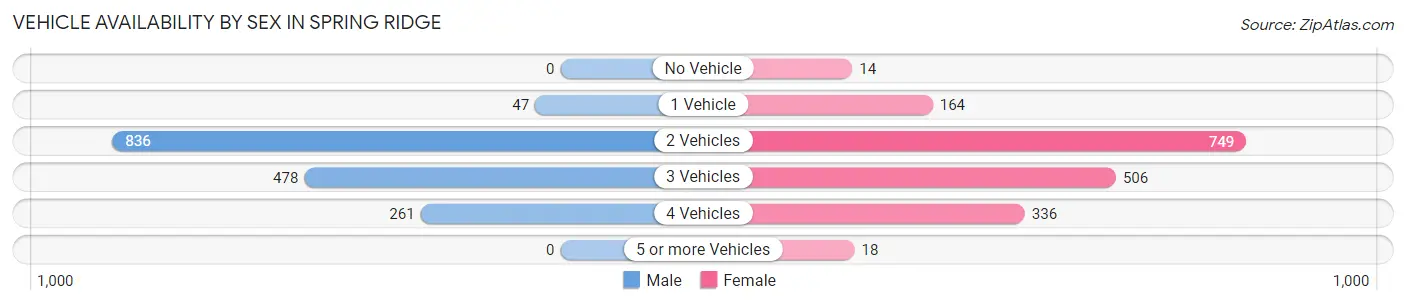
Vehicle Availability by Sex in Spring Ridge
The most prevalent vehicle ownership categories in Spring Ridge are males with 2 vehicles (836, accounting for 51.5%) and females with 2 vehicles (749, making up 46.8%).
| Vehicles Available | Male | Female |
| No Vehicle | 0 (0.0%) | 14 (0.8%) |
| 1 Vehicle | 47 (2.9%) | 164 (9.2%) |
| 2 Vehicles | 836 (51.5%) | 749 (41.9%) |
| 3 Vehicles | 478 (29.5%) | 506 (28.3%) |
| 4 Vehicles | 261 (16.1%) | 336 (18.8%) |
| 5 or more Vehicles | 0 (0.0%) | 18 (1.0%) |
| Total | 1,622 (100.0%) | 1,787 (100.0%) |
Commute Time in Spring Ridge
The most frequently occuring commute durations in Spring Ridge are 15 to 19 minutes (464 commuters, 16.9%), 20 to 24 minutes (415 commuters, 15.1%), and 60 to 89 minutes (362 commuters, 13.2%).
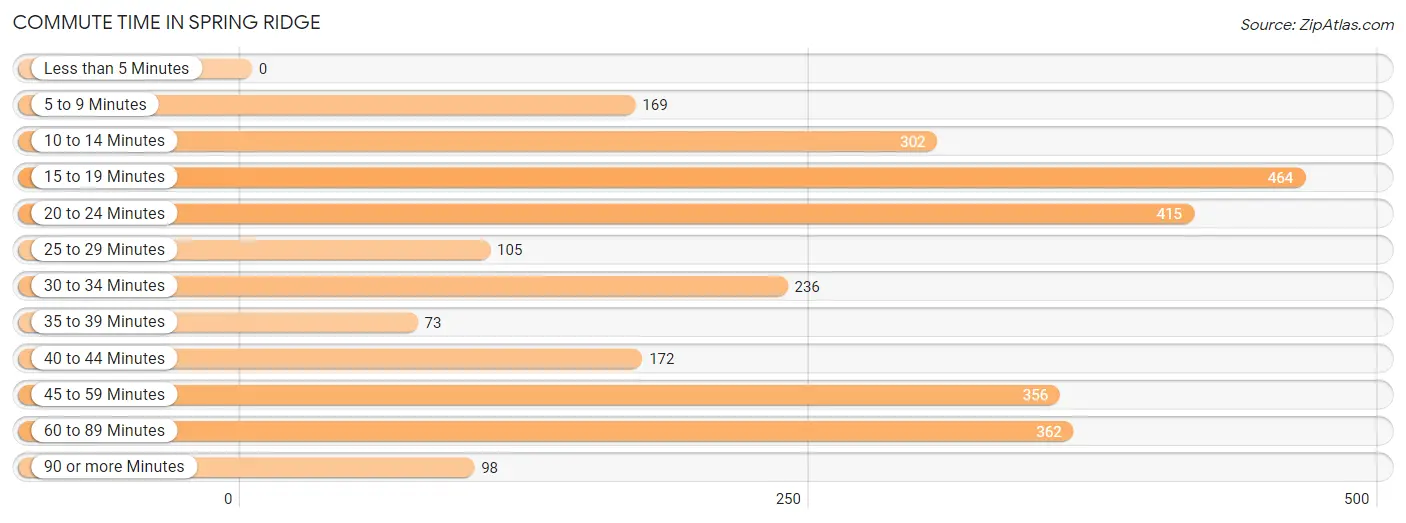
| Commute Time | # Commuters | % Commuters |
| Less than 5 Minutes | 0 | 0.0% |
| 5 to 9 Minutes | 169 | 6.1% |
| 10 to 14 Minutes | 302 | 11.0% |
| 15 to 19 Minutes | 464 | 16.9% |
| 20 to 24 Minutes | 415 | 15.1% |
| 25 to 29 Minutes | 105 | 3.8% |
| 30 to 34 Minutes | 236 | 8.6% |
| 35 to 39 Minutes | 73 | 2.6% |
| 40 to 44 Minutes | 172 | 6.2% |
| 45 to 59 Minutes | 356 | 12.9% |
| 60 to 89 Minutes | 362 | 13.2% |
| 90 or more Minutes | 98 | 3.6% |
Commute Time by Sex in Spring Ridge
The most common commute times in Spring Ridge are 15 to 19 minutes (254 commuters, 18.0%) for males and 20 to 24 minutes (224 commuters, 16.7%) for females.
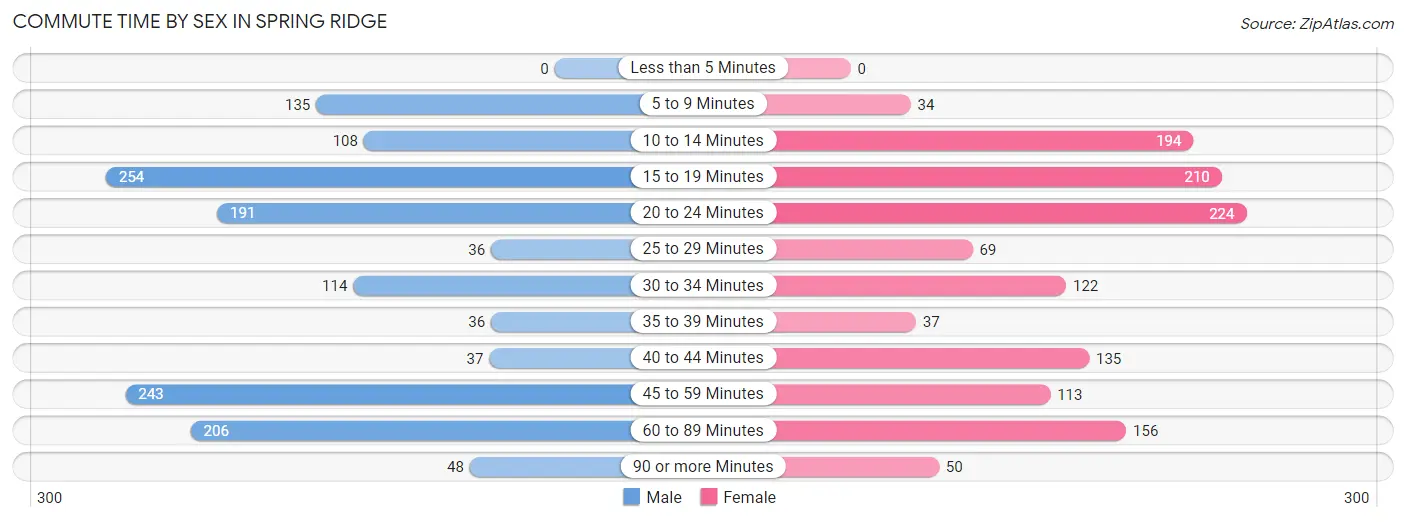
| Commute Time | Male | Female |
| Less than 5 Minutes | 0 (0.0%) | 0 (0.0%) |
| 5 to 9 Minutes | 135 (9.6%) | 34 (2.5%) |
| 10 to 14 Minutes | 108 (7.7%) | 194 (14.4%) |
| 15 to 19 Minutes | 254 (18.0%) | 210 (15.6%) |
| 20 to 24 Minutes | 191 (13.6%) | 224 (16.7%) |
| 25 to 29 Minutes | 36 (2.6%) | 69 (5.1%) |
| 30 to 34 Minutes | 114 (8.1%) | 122 (9.1%) |
| 35 to 39 Minutes | 36 (2.6%) | 37 (2.8%) |
| 40 to 44 Minutes | 37 (2.6%) | 135 (10.0%) |
| 45 to 59 Minutes | 243 (17.3%) | 113 (8.4%) |
| 60 to 89 Minutes | 206 (14.6%) | 156 (11.6%) |
| 90 or more Minutes | 48 (3.4%) | 50 (3.7%) |
Time of Departure to Work by Sex in Spring Ridge
The most frequent times of departure to work in Spring Ridge are 7:00 AM to 7:29 AM (298, 21.2%) for males and 8:00 AM to 8:29 AM (308, 22.9%) for females.
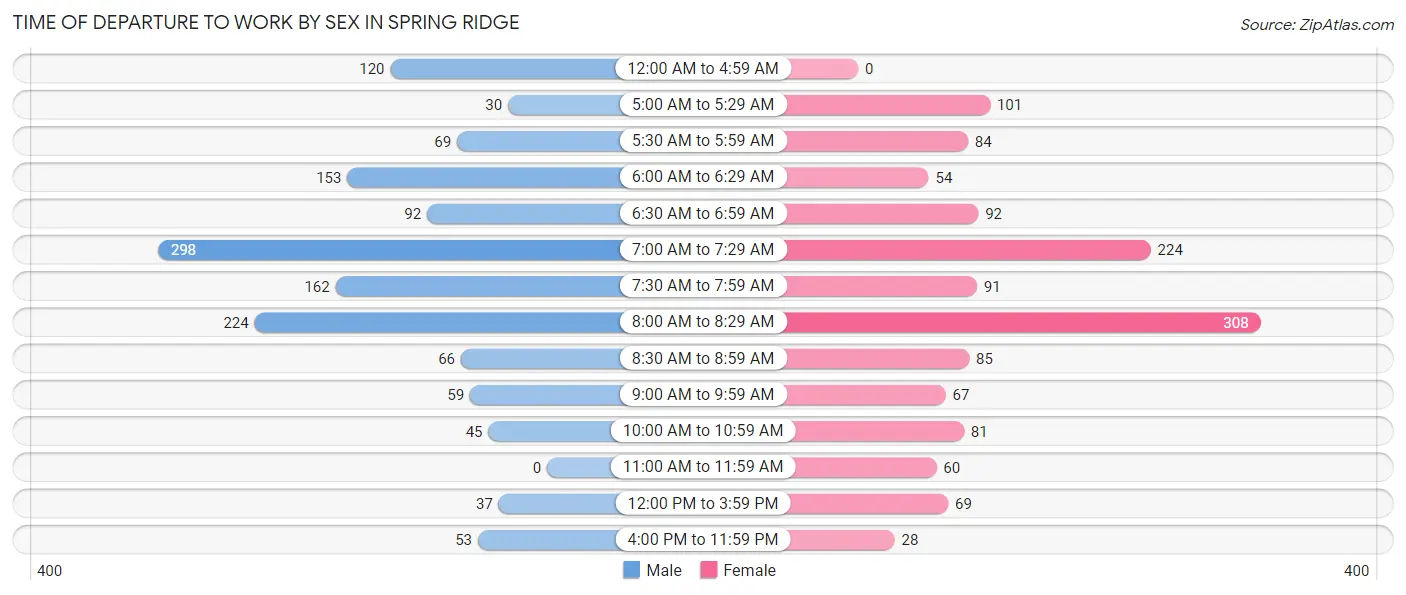
| Time of Departure | Male | Female |
| 12:00 AM to 4:59 AM | 120 (8.5%) | 0 (0.0%) |
| 5:00 AM to 5:29 AM | 30 (2.1%) | 101 (7.5%) |
| 5:30 AM to 5:59 AM | 69 (4.9%) | 84 (6.2%) |
| 6:00 AM to 6:29 AM | 153 (10.9%) | 54 (4.0%) |
| 6:30 AM to 6:59 AM | 92 (6.5%) | 92 (6.9%) |
| 7:00 AM to 7:29 AM | 298 (21.2%) | 224 (16.7%) |
| 7:30 AM to 7:59 AM | 162 (11.5%) | 91 (6.8%) |
| 8:00 AM to 8:29 AM | 224 (15.9%) | 308 (22.9%) |
| 8:30 AM to 8:59 AM | 66 (4.7%) | 85 (6.3%) |
| 9:00 AM to 9:59 AM | 59 (4.2%) | 67 (5.0%) |
| 10:00 AM to 10:59 AM | 45 (3.2%) | 81 (6.0%) |
| 11:00 AM to 11:59 AM | 0 (0.0%) | 60 (4.5%) |
| 12:00 PM to 3:59 PM | 37 (2.6%) | 69 (5.1%) |
| 4:00 PM to 11:59 PM | 53 (3.8%) | 28 (2.1%) |
| Total | 1,408 (100.0%) | 1,344 (100.0%) |
Housing Occupancy in Spring Ridge
Occupancy by Ownership in Spring Ridge
Of the total 2,108 dwellings in Spring Ridge, owner-occupied units account for 1,775 (84.2%), while renter-occupied units make up 333 (15.8%).
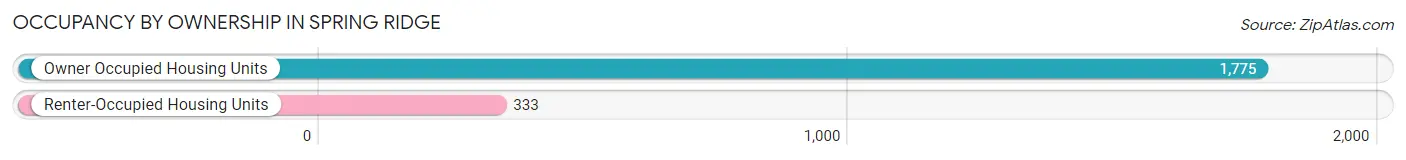
| Occupancy | # Housing Units | % Housing Units |
| Owner Occupied Housing Units | 1,775 | 84.2% |
| Renter-Occupied Housing Units | 333 | 15.8% |
| Total Occupied Housing Units | 2,108 | 100.0% |
Occupancy by Household Size in Spring Ridge
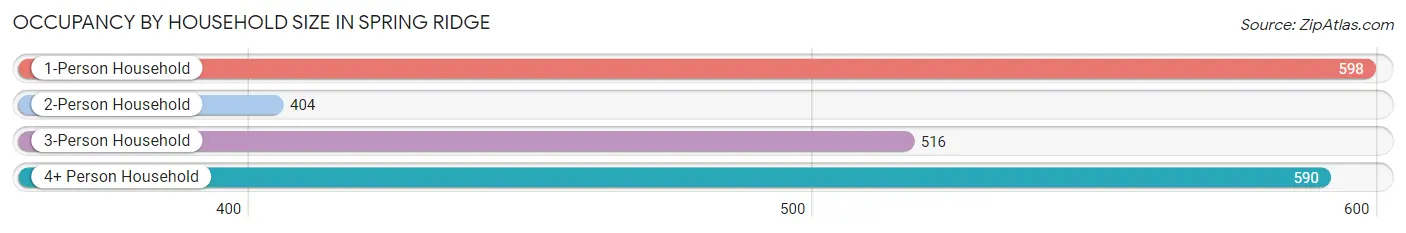
| Household Size | # Housing Units | % Housing Units |
| 1-Person Household | 598 | 28.4% |
| 2-Person Household | 404 | 19.2% |
| 3-Person Household | 516 | 24.5% |
| 4+ Person Household | 590 | 28.0% |
| Total Housing Units | 2,108 | 100.0% |
Occupancy by Ownership by Household Size in Spring Ridge
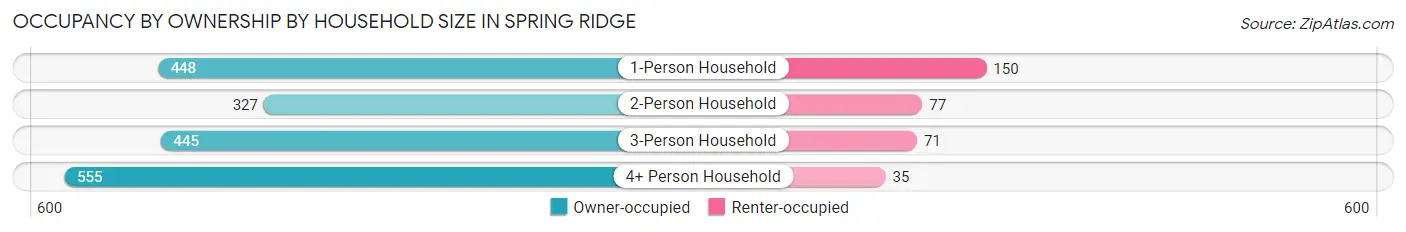
| Household Size | Owner-occupied | Renter-occupied |
| 1-Person Household | 448 (74.9%) | 150 (25.1%) |
| 2-Person Household | 327 (80.9%) | 77 (19.1%) |
| 3-Person Household | 445 (86.2%) | 71 (13.8%) |
| 4+ Person Household | 555 (94.1%) | 35 (5.9%) |
| Total Housing Units | 1,775 (84.2%) | 333 (15.8%) |
Occupancy by Educational Attainment in Spring Ridge
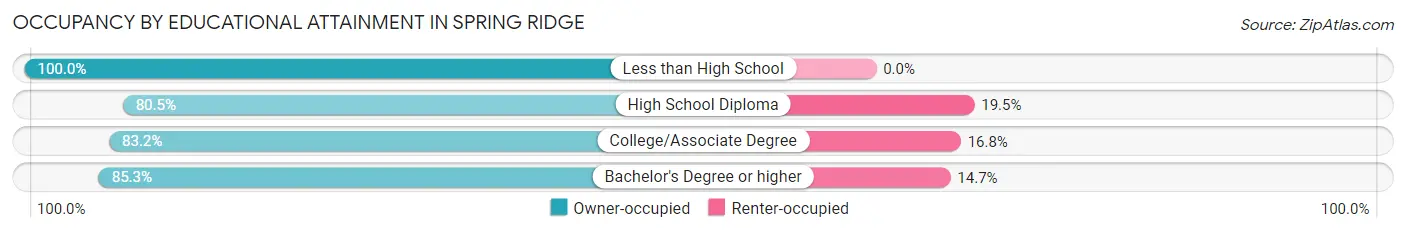
| Household Size | Owner-occupied | Renter-occupied |
| Less than High School | 14 (100.0%) | 0 (0.0%) |
| High School Diploma | 240 (80.5%) | 58 (19.5%) |
| College/Associate Degree | 432 (83.2%) | 87 (16.8%) |
| Bachelor's Degree or higher | 1,089 (85.3%) | 188 (14.7%) |
Occupancy by Age of Householder in Spring Ridge
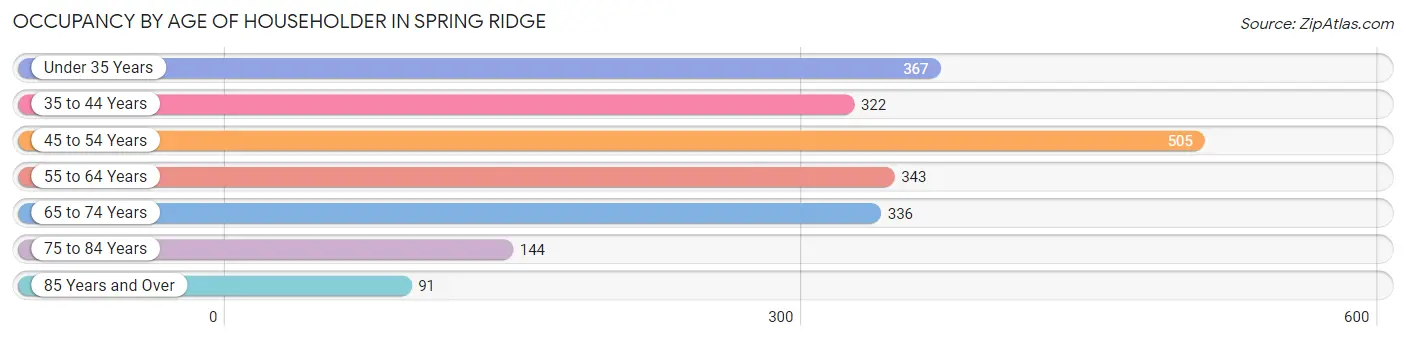
| Age Bracket | # Households | % Households |
| Under 35 Years | 367 | 17.4% |
| 35 to 44 Years | 322 | 15.3% |
| 45 to 54 Years | 505 | 24.0% |
| 55 to 64 Years | 343 | 16.3% |
| 65 to 74 Years | 336 | 15.9% |
| 75 to 84 Years | 144 | 6.8% |
| 85 Years and Over | 91 | 4.3% |
| Total | 2,108 | 100.0% |
Housing Finances in Spring Ridge
Median Income by Occupancy in Spring Ridge
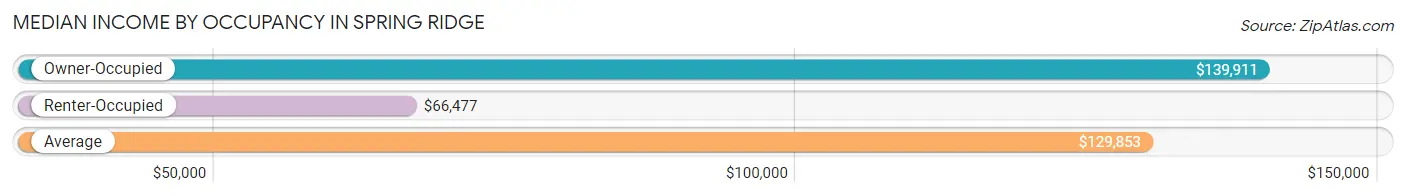
| Occupancy Type | # Households | Median Income |
| Owner-Occupied | 1,775 (84.2%) | $139,911 |
| Renter-Occupied | 333 (15.8%) | $66,477 |
| Average | 2,108 (100.0%) | $129,853 |
Occupancy by Householder Income Bracket in Spring Ridge
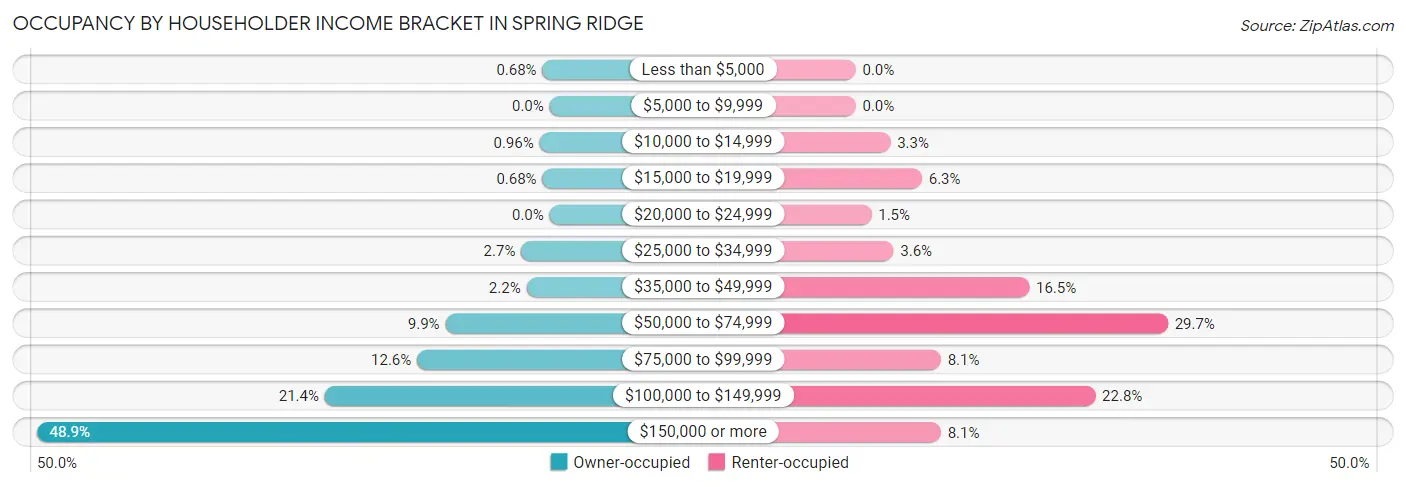
| Income Bracket | Owner-occupied | Renter-occupied |
| Less than $5,000 | 12 (0.7%) | 0 (0.0%) |
| $5,000 to $9,999 | 0 (0.0%) | 0 (0.0%) |
| $10,000 to $14,999 | 17 (1.0%) | 11 (3.3%) |
| $15,000 to $19,999 | 12 (0.7%) | 21 (6.3%) |
| $20,000 to $24,999 | 0 (0.0%) | 5 (1.5%) |
| $25,000 to $34,999 | 48 (2.7%) | 12 (3.6%) |
| $35,000 to $49,999 | 39 (2.2%) | 55 (16.5%) |
| $50,000 to $74,999 | 176 (9.9%) | 99 (29.7%) |
| $75,000 to $99,999 | 224 (12.6%) | 27 (8.1%) |
| $100,000 to $149,999 | 380 (21.4%) | 76 (22.8%) |
| $150,000 or more | 867 (48.8%) | 27 (8.1%) |
| Total | 1,775 (100.0%) | 333 (100.0%) |
Monthly Housing Cost Tiers in Spring Ridge
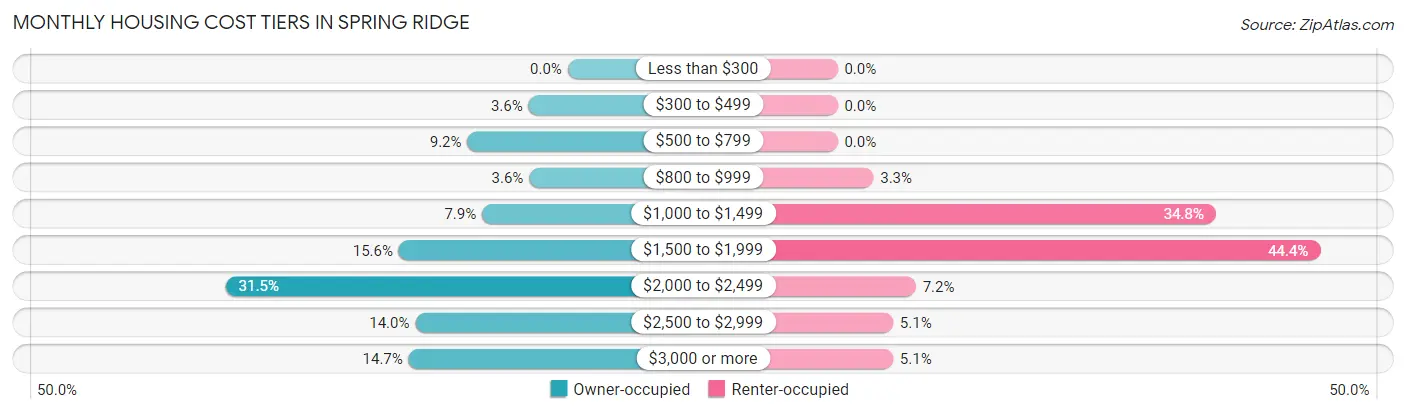
| Monthly Cost | Owner-occupied | Renter-occupied |
| Less than $300 | 0 (0.0%) | 0 (0.0%) |
| $300 to $499 | 64 (3.6%) | 0 (0.0%) |
| $500 to $799 | 164 (9.2%) | 0 (0.0%) |
| $800 to $999 | 63 (3.5%) | 11 (3.3%) |
| $1,000 to $1,499 | 140 (7.9%) | 116 (34.8%) |
| $1,500 to $1,999 | 276 (15.5%) | 148 (44.4%) |
| $2,000 to $2,499 | 559 (31.5%) | 24 (7.2%) |
| $2,500 to $2,999 | 249 (14.0%) | 17 (5.1%) |
| $3,000 or more | 260 (14.6%) | 17 (5.1%) |
| Total | 1,775 (100.0%) | 333 (100.0%) |
Physical Housing Characteristics in Spring Ridge
Housing Structures in Spring Ridge
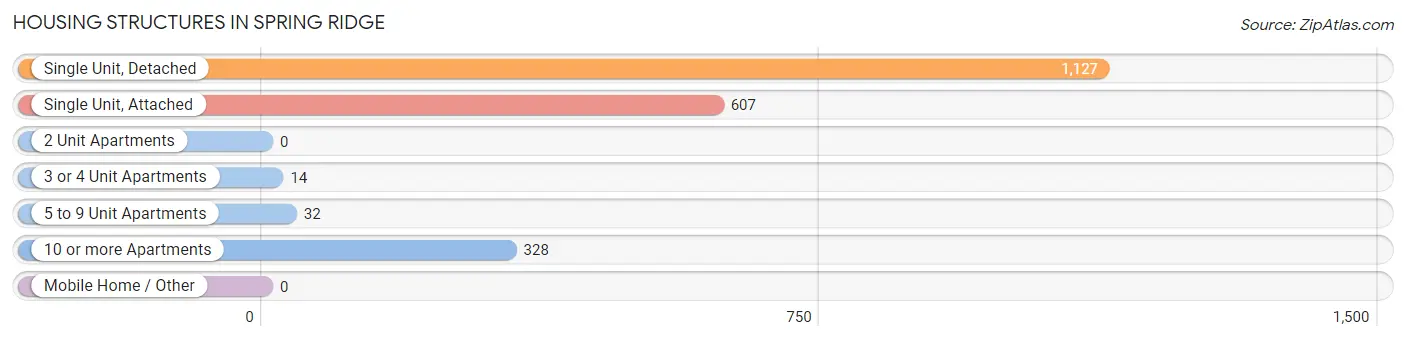
| Structure Type | # Housing Units | % Housing Units |
| Single Unit, Detached | 1,127 | 53.5% |
| Single Unit, Attached | 607 | 28.8% |
| 2 Unit Apartments | 0 | 0.0% |
| 3 or 4 Unit Apartments | 14 | 0.7% |
| 5 to 9 Unit Apartments | 32 | 1.5% |
| 10 or more Apartments | 328 | 15.6% |
| Mobile Home / Other | 0 | 0.0% |
| Total | 2,108 | 100.0% |
Housing Structures by Occupancy in Spring Ridge
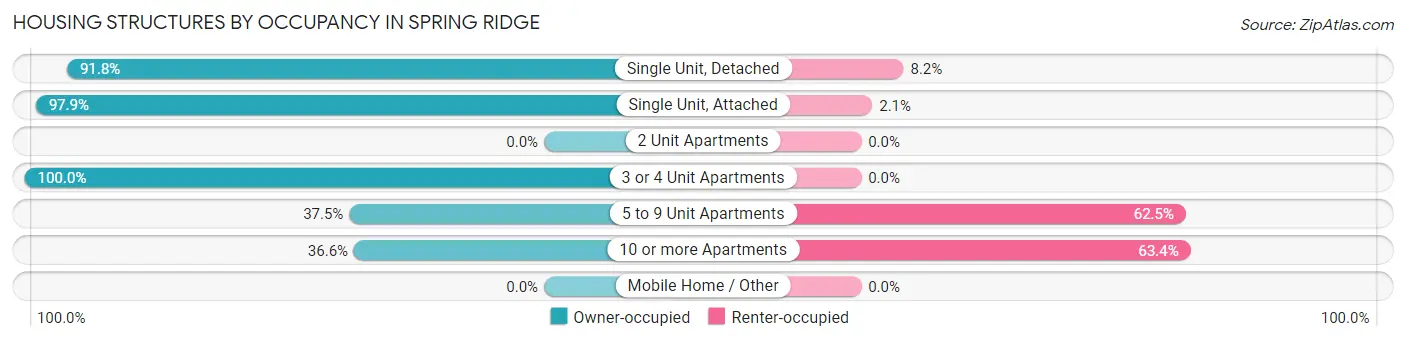
| Structure Type | Owner-occupied | Renter-occupied |
| Single Unit, Detached | 1,035 (91.8%) | 92 (8.2%) |
| Single Unit, Attached | 594 (97.9%) | 13 (2.1%) |
| 2 Unit Apartments | 0 (0.0%) | 0 (0.0%) |
| 3 or 4 Unit Apartments | 14 (100.0%) | 0 (0.0%) |
| 5 to 9 Unit Apartments | 12 (37.5%) | 20 (62.5%) |
| 10 or more Apartments | 120 (36.6%) | 208 (63.4%) |
| Mobile Home / Other | 0 (0.0%) | 0 (0.0%) |
| Total | 1,775 (84.2%) | 333 (15.8%) |
Housing Structures by Number of Rooms in Spring Ridge
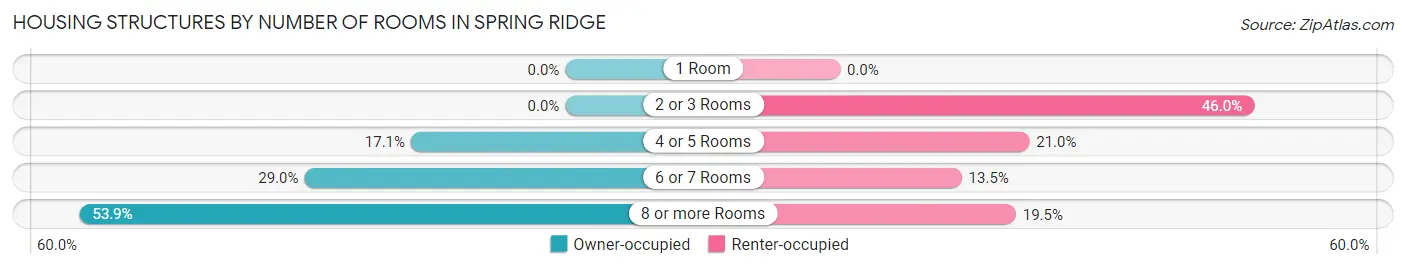
| Number of Rooms | Owner-occupied | Renter-occupied |
| 1 Room | 0 (0.0%) | 0 (0.0%) |
| 2 or 3 Rooms | 0 (0.0%) | 153 (46.0%) |
| 4 or 5 Rooms | 304 (17.1%) | 70 (21.0%) |
| 6 or 7 Rooms | 514 (29.0%) | 45 (13.5%) |
| 8 or more Rooms | 957 (53.9%) | 65 (19.5%) |
| Total | 1,775 (100.0%) | 333 (100.0%) |
Housing Structure by Heating Type in Spring Ridge
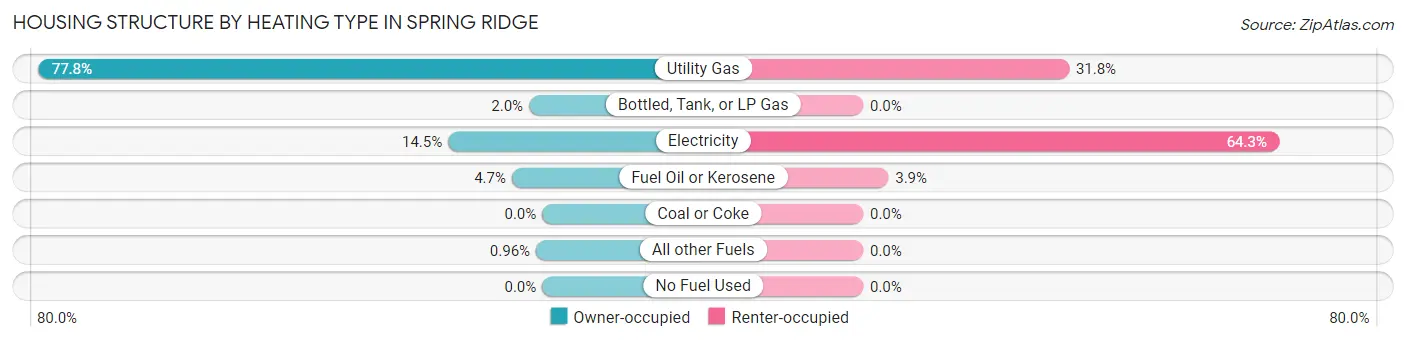
| Heating Type | Owner-occupied | Renter-occupied |
| Utility Gas | 1,381 (77.8%) | 106 (31.8%) |
| Bottled, Tank, or LP Gas | 36 (2.0%) | 0 (0.0%) |
| Electricity | 258 (14.5%) | 214 (64.3%) |
| Fuel Oil or Kerosene | 83 (4.7%) | 13 (3.9%) |
| Coal or Coke | 0 (0.0%) | 0 (0.0%) |
| All other Fuels | 17 (1.0%) | 0 (0.0%) |
| No Fuel Used | 0 (0.0%) | 0 (0.0%) |
| Total | 1,775 (100.0%) | 333 (100.0%) |
Household Vehicle Usage in Spring Ridge
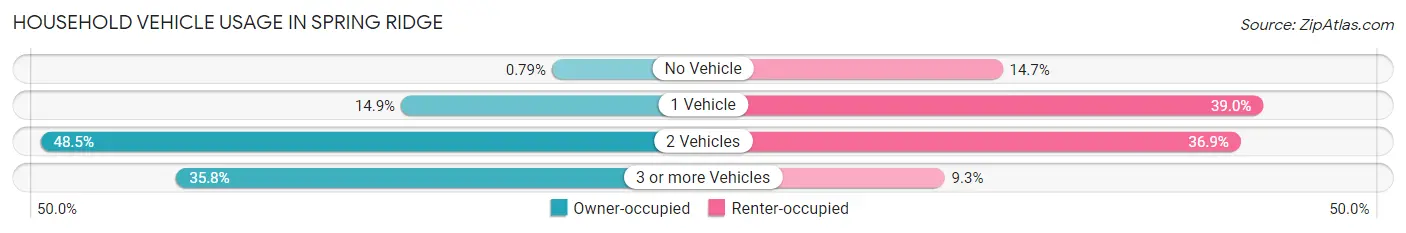
| Vehicles per Household | Owner-occupied | Renter-occupied |
| No Vehicle | 14 (0.8%) | 49 (14.7%) |
| 1 Vehicle | 264 (14.9%) | 130 (39.0%) |
| 2 Vehicles | 861 (48.5%) | 123 (36.9%) |
| 3 or more Vehicles | 636 (35.8%) | 31 (9.3%) |
| Total | 1,775 (100.0%) | 333 (100.0%) |
Real Estate & Mortgages in Spring Ridge
Real Estate and Mortgage Overview in Spring Ridge
| Characteristic | Without Mortgage | With Mortgage |
| Housing Units | 247 | 1,528 |
| Median Property Value | $440,400 | $401,700 |
| Median Household Income | $164,792 | $727 |
| Monthly Housing Costs | $672 | $260 |
| Real Estate Taxes | $3,444 | $17 |
Property Value by Mortgage Status in Spring Ridge
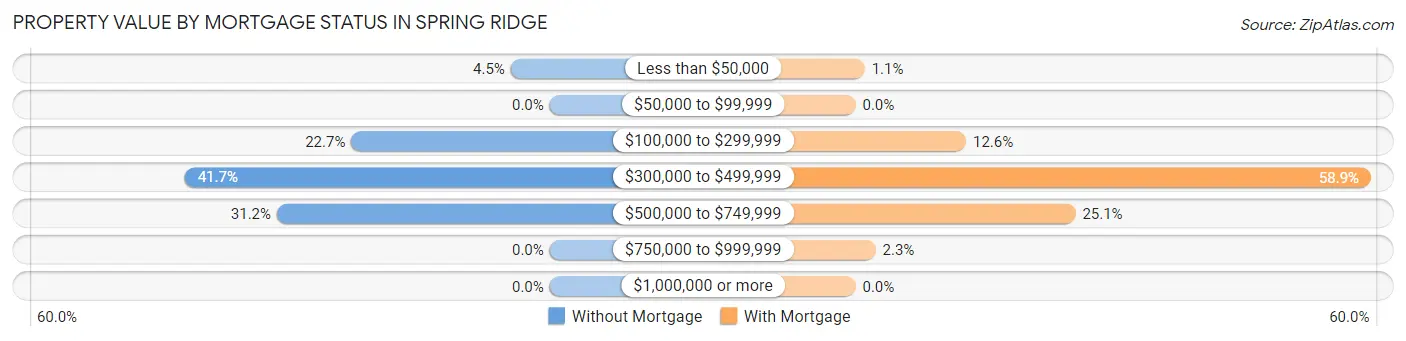
| Property Value | Without Mortgage | With Mortgage |
| Less than $50,000 | 11 (4.4%) | 16 (1.1%) |
| $50,000 to $99,999 | 0 (0.0%) | 0 (0.0%) |
| $100,000 to $299,999 | 56 (22.7%) | 193 (12.6%) |
| $300,000 to $499,999 | 103 (41.7%) | 900 (58.9%) |
| $500,000 to $749,999 | 77 (31.2%) | 384 (25.1%) |
| $750,000 to $999,999 | 0 (0.0%) | 35 (2.3%) |
| $1,000,000 or more | 0 (0.0%) | 0 (0.0%) |
| Total | 247 (100.0%) | 1,528 (100.0%) |
Household Income by Mortgage Status in Spring Ridge
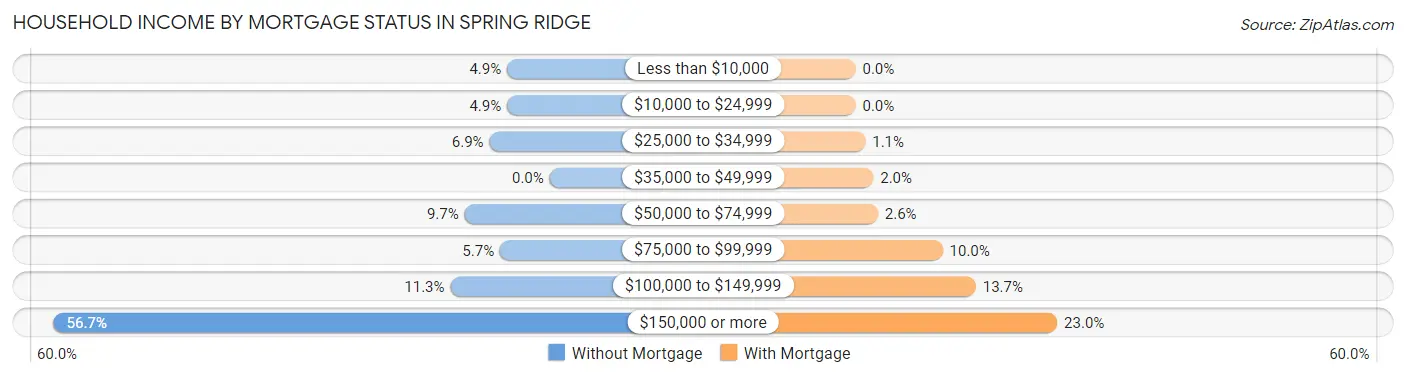
| Household Income | Without Mortgage | With Mortgage |
| Less than $10,000 | 12 (4.9%) | 0 (0.0%) |
| $10,000 to $24,999 | 12 (4.9%) | 0 (0.0%) |
| $25,000 to $34,999 | 17 (6.9%) | 17 (1.1%) |
| $35,000 to $49,999 | 0 (0.0%) | 31 (2.0%) |
| $50,000 to $74,999 | 24 (9.7%) | 39 (2.5%) |
| $75,000 to $99,999 | 14 (5.7%) | 152 (10.0%) |
| $100,000 to $149,999 | 28 (11.3%) | 210 (13.7%) |
| $150,000 or more | 140 (56.7%) | 352 (23.0%) |
| Total | 247 (100.0%) | 1,528 (100.0%) |
Property Value to Household Income Ratio in Spring Ridge
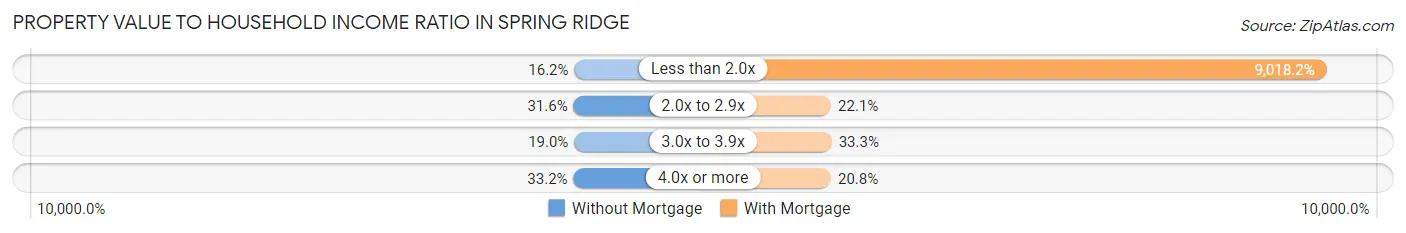
| Value-to-Income Ratio | Without Mortgage | With Mortgage |
| Less than 2.0x | 40 (16.2%) | 137,798 (9,018.2%) |
| 2.0x to 2.9x | 78 (31.6%) | 338 (22.1%) |
| 3.0x to 3.9x | 47 (19.0%) | 509 (33.3%) |
| 4.0x or more | 82 (33.2%) | 318 (20.8%) |
| Total | 247 (100.0%) | 1,528 (100.0%) |
Real Estate Taxes by Mortgage Status in Spring Ridge
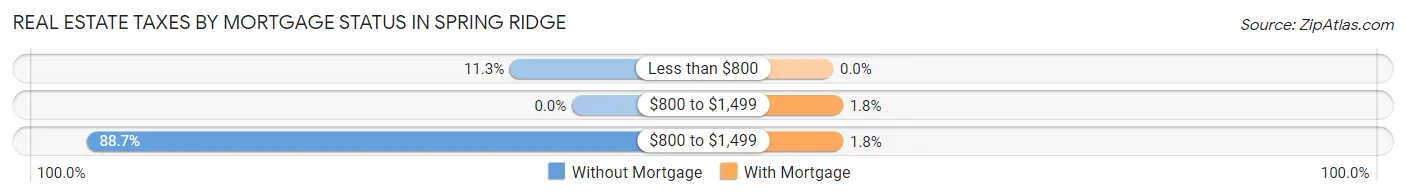
| Property Taxes | Without Mortgage | With Mortgage |
| Less than $800 | 28 (11.3%) | 0 (0.0%) |
| $800 to $1,499 | 0 (0.0%) | 27 (1.8%) |
| $800 to $1,499 | 219 (88.7%) | 28 (1.8%) |
| Total | 247 (100.0%) | 1,528 (100.0%) |
Health & Disability in Spring Ridge
Health Insurance Coverage by Age in Spring Ridge
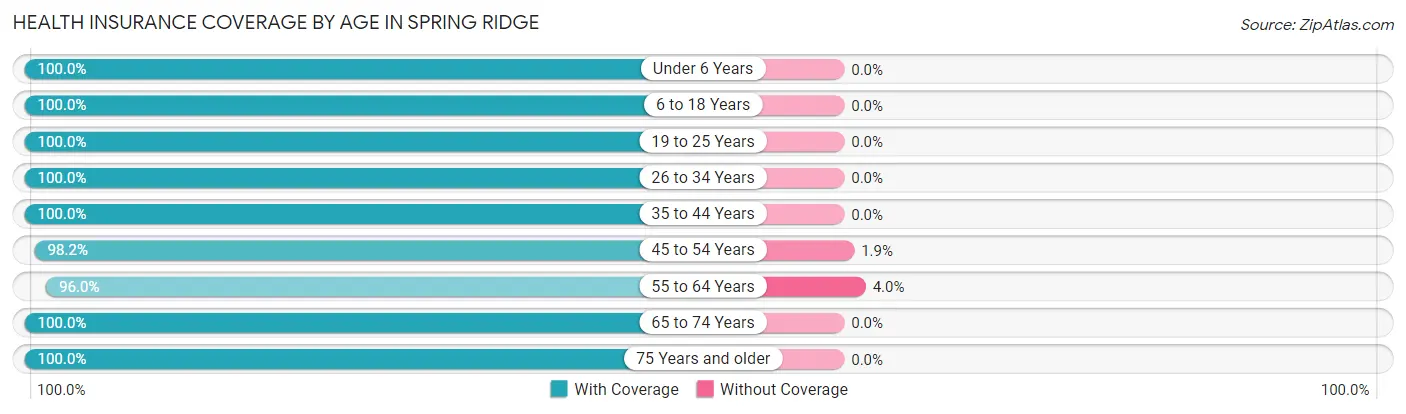
| Age Bracket | With Coverage | Without Coverage |
| Under 6 Years | 285 (100.0%) | 0 (0.0%) |
| 6 to 18 Years | 1,051 (100.0%) | 0 (0.0%) |
| 19 to 25 Years | 553 (100.0%) | 0 (0.0%) |
| 26 to 34 Years | 891 (100.0%) | 0 (0.0%) |
| 35 to 44 Years | 610 (100.0%) | 0 (0.0%) |
| 45 to 54 Years | 904 (98.2%) | 17 (1.8%) |
| 55 to 64 Years | 552 (96.0%) | 23 (4.0%) |
| 65 to 74 Years | 431 (100.0%) | 0 (0.0%) |
| 75 Years and older | 306 (100.0%) | 0 (0.0%) |
| Total | 5,583 (99.3%) | 40 (0.7%) |
Health Insurance Coverage by Citizenship Status in Spring Ridge
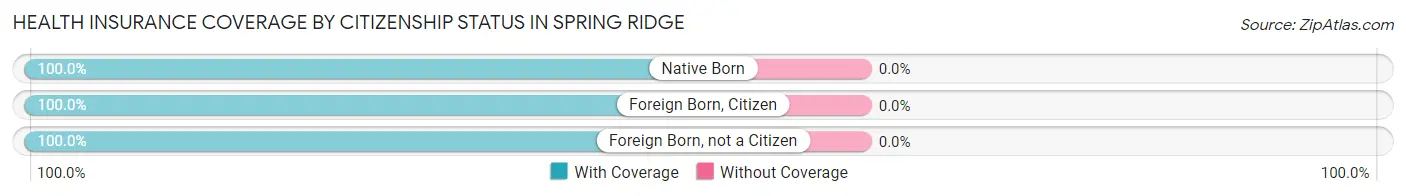
| Citizenship Status | With Coverage | Without Coverage |
| Native Born | 285 (100.0%) | 0 (0.0%) |
| Foreign Born, Citizen | 1,051 (100.0%) | 0 (0.0%) |
| Foreign Born, not a Citizen | 553 (100.0%) | 0 (0.0%) |
Health Insurance Coverage by Household Income in Spring Ridge
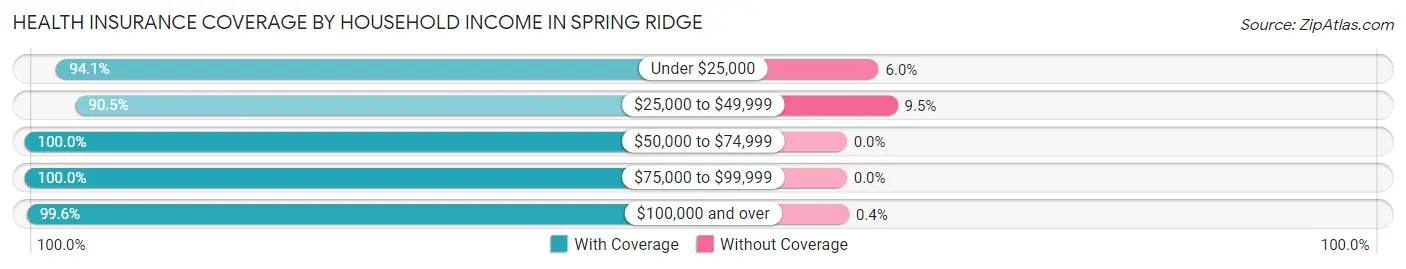
| Household Income | With Coverage | Without Coverage |
| Under $25,000 | 79 (94.1%) | 5 (5.9%) |
| $25,000 to $49,999 | 171 (90.5%) | 18 (9.5%) |
| $50,000 to $74,999 | 496 (100.0%) | 0 (0.0%) |
| $75,000 to $99,999 | 560 (100.0%) | 0 (0.0%) |
| $100,000 and over | 4,277 (99.6%) | 17 (0.4%) |
Public vs Private Health Insurance Coverage by Age in Spring Ridge
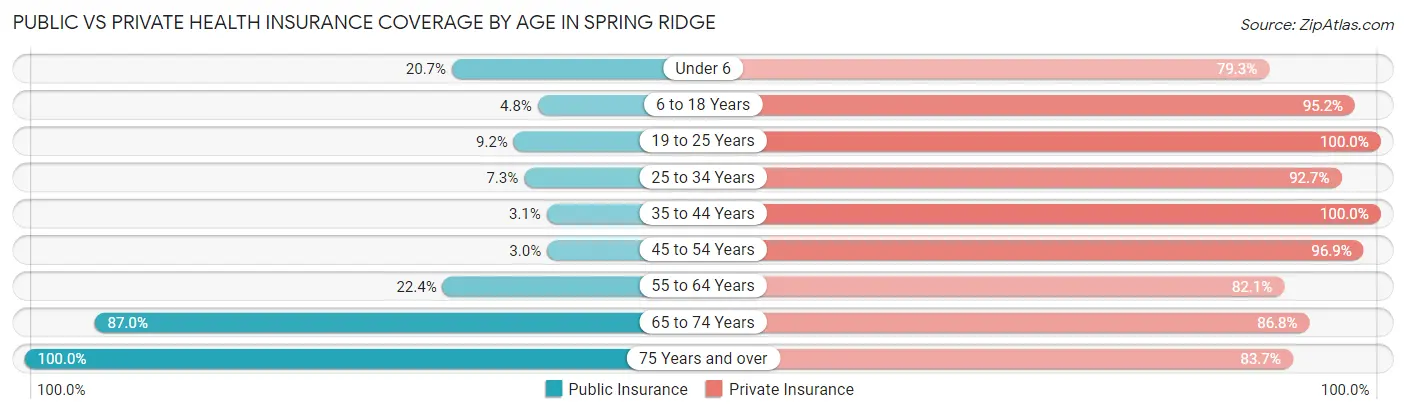
| Age Bracket | Public Insurance | Private Insurance |
| Under 6 | 59 (20.7%) | 226 (79.3%) |
| 6 to 18 Years | 50 (4.8%) | 1,001 (95.2%) |
| 19 to 25 Years | 51 (9.2%) | 553 (100.0%) |
| 25 to 34 Years | 65 (7.3%) | 826 (92.7%) |
| 35 to 44 Years | 19 (3.1%) | 610 (100.0%) |
| 45 to 54 Years | 28 (3.0%) | 892 (96.9%) |
| 55 to 64 Years | 129 (22.4%) | 472 (82.1%) |
| 65 to 74 Years | 375 (87.0%) | 374 (86.8%) |
| 75 Years and over | 306 (100.0%) | 256 (83.7%) |
| Total | 1,082 (19.2%) | 5,210 (92.7%) |
Disability Status by Sex by Age in Spring Ridge
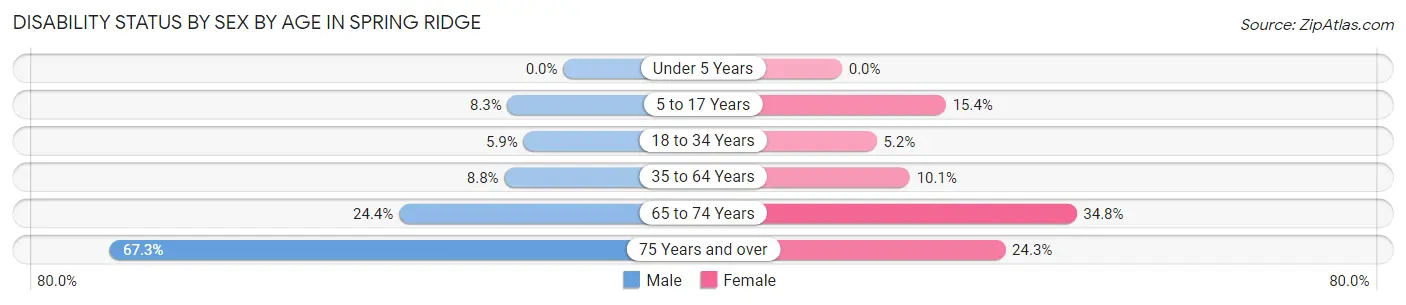
| Age Bracket | Male | Female |
| Under 5 Years | 0 (0.0%) | 0 (0.0%) |
| 5 to 17 Years | 42 (8.3%) | 73 (15.4%) |
| 18 to 34 Years | 46 (5.9%) | 40 (5.1%) |
| 35 to 64 Years | 82 (8.7%) | 118 (10.1%) |
| 65 to 74 Years | 40 (24.4%) | 93 (34.8%) |
| 75 Years and over | 70 (67.3%) | 49 (24.3%) |
Disability Class by Sex by Age in Spring Ridge
Disability Class: Hearing Difficulty
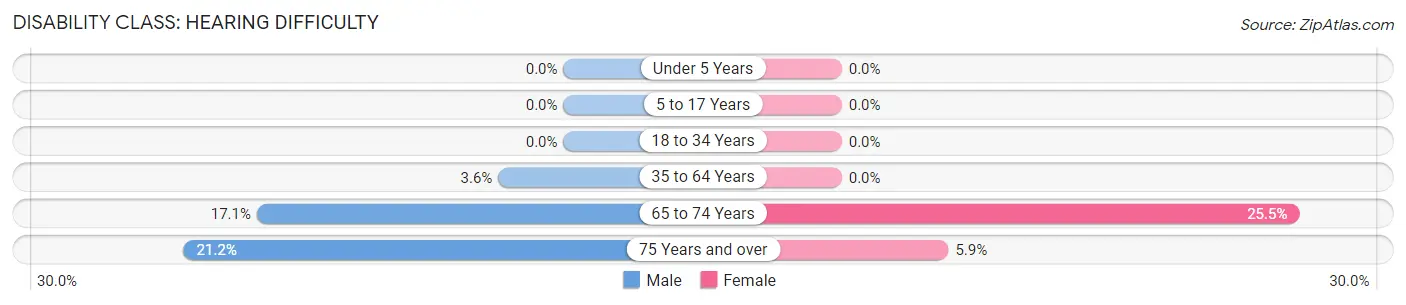
| Age Bracket | Male | Female |
| Under 5 Years | 0 (0.0%) | 0 (0.0%) |
| 5 to 17 Years | 0 (0.0%) | 0 (0.0%) |
| 18 to 34 Years | 0 (0.0%) | 0 (0.0%) |
| 35 to 64 Years | 34 (3.6%) | 0 (0.0%) |
| 65 to 74 Years | 28 (17.1%) | 68 (25.5%) |
| 75 Years and over | 22 (21.1%) | 12 (5.9%) |
Disability Class: Vision Difficulty
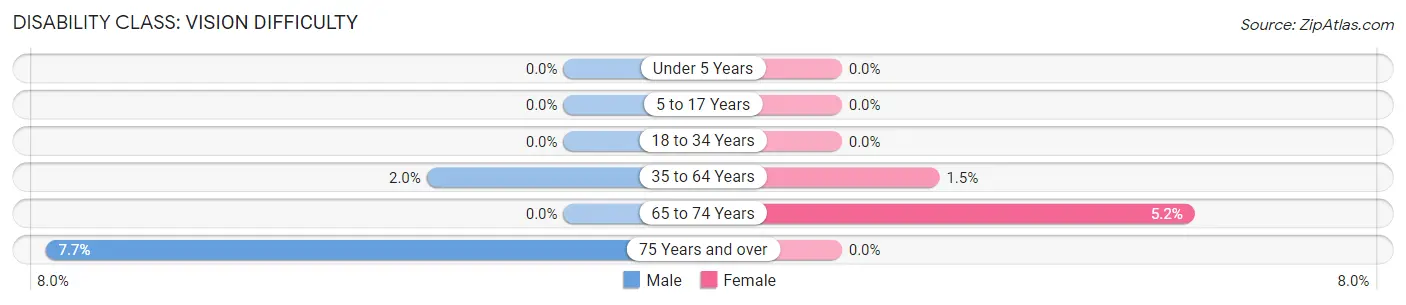
| Age Bracket | Male | Female |
| Under 5 Years | 0 (0.0%) | 0 (0.0%) |
| 5 to 17 Years | 0 (0.0%) | 0 (0.0%) |
| 18 to 34 Years | 0 (0.0%) | 0 (0.0%) |
| 35 to 64 Years | 19 (2.0%) | 17 (1.5%) |
| 65 to 74 Years | 0 (0.0%) | 14 (5.2%) |
| 75 Years and over | 8 (7.7%) | 0 (0.0%) |
Disability Class: Cognitive Difficulty
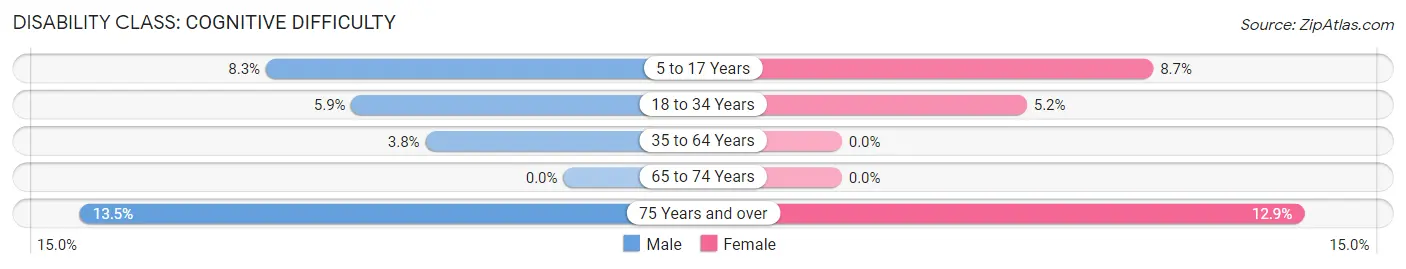
| Age Bracket | Male | Female |
| 5 to 17 Years | 42 (8.3%) | 41 (8.7%) |
| 18 to 34 Years | 46 (5.9%) | 40 (5.1%) |
| 35 to 64 Years | 36 (3.8%) | 0 (0.0%) |
| 65 to 74 Years | 0 (0.0%) | 0 (0.0%) |
| 75 Years and over | 14 (13.5%) | 26 (12.9%) |
Disability Class: Ambulatory Difficulty
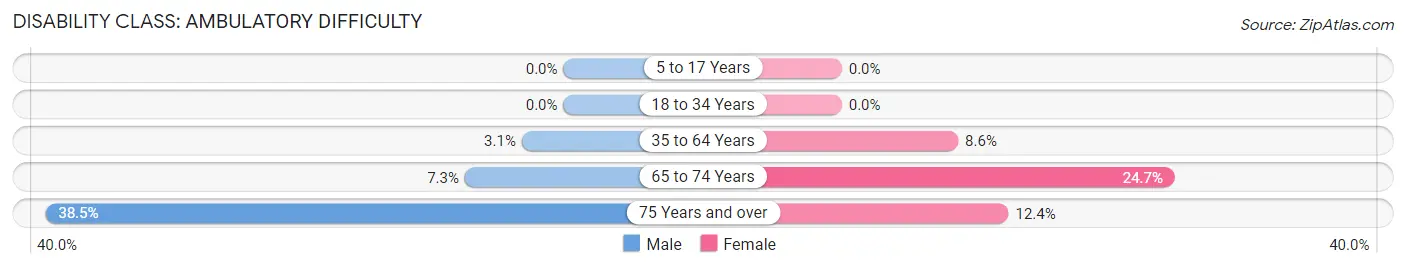
| Age Bracket | Male | Female |
| 5 to 17 Years | 0 (0.0%) | 0 (0.0%) |
| 18 to 34 Years | 0 (0.0%) | 0 (0.0%) |
| 35 to 64 Years | 29 (3.1%) | 101 (8.6%) |
| 65 to 74 Years | 12 (7.3%) | 66 (24.7%) |
| 75 Years and over | 40 (38.5%) | 25 (12.4%) |
Disability Class: Self-Care Difficulty
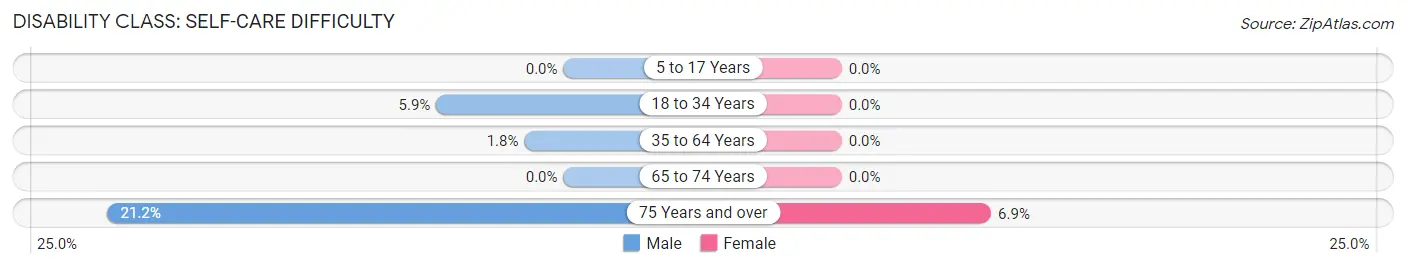
| Age Bracket | Male | Female |
| 5 to 17 Years | 0 (0.0%) | 0 (0.0%) |
| 18 to 34 Years | 46 (5.9%) | 0 (0.0%) |
| 35 to 64 Years | 17 (1.8%) | 0 (0.0%) |
| 65 to 74 Years | 0 (0.0%) | 0 (0.0%) |
| 75 Years and over | 22 (21.1%) | 14 (6.9%) |
Technology Access in Spring Ridge
Computing Device Access in Spring Ridge
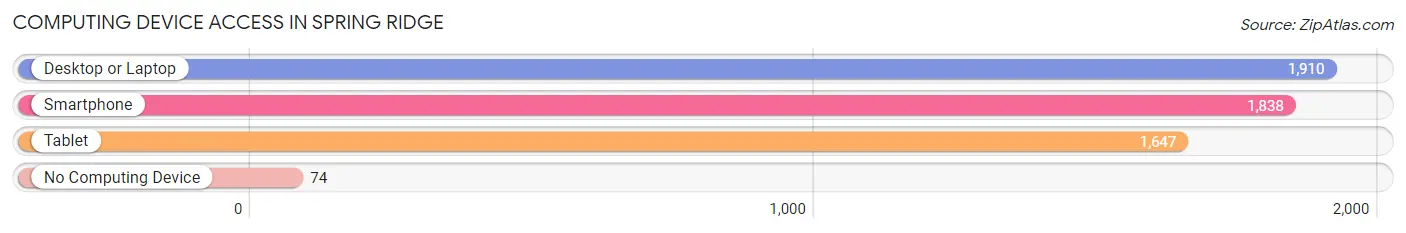
| Device Type | # Households | % Households |
| Desktop or Laptop | 1,910 | 90.6% |
| Smartphone | 1,838 | 87.2% |
| Tablet | 1,647 | 78.1% |
| No Computing Device | 74 | 3.5% |
| Total | 2,108 | 100.0% |
Internet Access in Spring Ridge
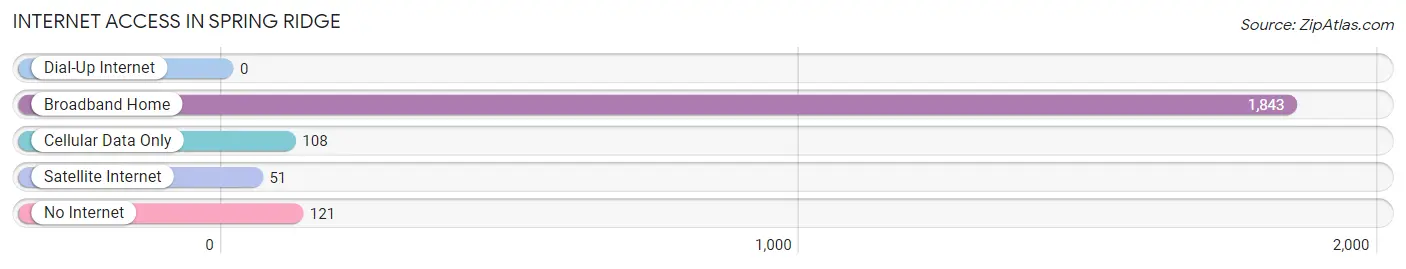
| Internet Type | # Households | % Households |
| Dial-Up Internet | 0 | 0.0% |
| Broadband Home | 1,843 | 87.4% |
| Cellular Data Only | 108 | 5.1% |
| Satellite Internet | 51 | 2.4% |
| No Internet | 121 | 5.7% |
| Total | 2,108 | 100.0% |
Spring Ridge Summary
History
Spring Ridge is an unincorporated community located in Frederick County, Maryland. It is situated in the northern part of the county, just south of the Pennsylvania border. The area was first settled in the late 1700s by German immigrants, who were attracted to the area by its fertile soil and abundant natural resources. The community was originally known as “Springfield”, but the name was changed to “Spring Ridge” in 1845.
The area was primarily agricultural until the mid-1900s, when the population began to grow and the economy shifted to a more suburban focus. The area was home to several small businesses, including a general store, a blacksmith shop, and a post office. In the 1950s, the area began to experience rapid growth as more people moved to the area to take advantage of the area’s proximity to Washington, D.C. and Baltimore.
Today, Spring Ridge is a thriving community with a population of over 10,000 people. The area is home to a variety of businesses, including retail stores, restaurants, and professional services. The area is also home to several parks and recreational facilities, including a golf course, a swimming pool, and a community center.
Geography
Spring Ridge is located in northern Frederick County, Maryland, just south of the Pennsylvania border. The area is situated in the foothills of the Appalachian Mountains, and is characterized by rolling hills and lush forests. The area is home to several creeks and streams, including the Monocacy River, which flows through the area.
The climate in Spring Ridge is temperate, with hot summers and cold winters. The average annual temperature is around 55 degrees Fahrenheit, and the average annual precipitation is around 40 inches.
Economy
The economy of Spring Ridge is primarily driven by the service sector, with a variety of retail stores, restaurants, and professional services located in the area. The area is also home to several manufacturing companies, including a furniture manufacturer and a printing company.
The area is also home to several government agencies, including the National Institutes of Health and the National Institute of Standards and Technology. The area is also home to several educational institutions, including Frederick Community College and Hood College.
Demographics
As of the 2010 census, the population of Spring Ridge was 10,845. The population is primarily white (83.3%), with smaller percentages of African American (7.7%), Asian (3.2%), and Hispanic (2.7%) residents. The median household income in the area is $76,845, and the median home value is $346,000. The area is home to a variety of religious denominations, including Catholic, Protestant, and Jewish.
Common Questions
What is Per Capita Income in Spring Ridge?
Per Capita income in Spring Ridge is $56,246.
What is the Median Family Income in Spring Ridge?
Median Family Income in Spring Ridge is $153,657.
What is the Median Household income in Spring Ridge?
Median Household Income in Spring Ridge is $129,853.
What is Income or Wage Gap in Spring Ridge?
Income or Wage Gap in Spring Ridge is 50.4%.
Women in Spring Ridge earn 49.6 cents for every dollar earned by a man.
What is Inequality or Gini Index in Spring Ridge?
Inequality or Gini Index in Spring Ridge is 0.34.
What is the Total Population of Spring Ridge?
Total Population of Spring Ridge is 5,691.
What is the Total Male Population of Spring Ridge?
Total Male Population of Spring Ridge is 2,647.
What is the Total Female Population of Spring Ridge?
Total Female Population of Spring Ridge is 3,044.
What is the Ratio of Males per 100 Females in Spring Ridge?
There are 86.96 Males per 100 Females in Spring Ridge.
What is the Ratio of Females per 100 Males in Spring Ridge?
There are 115.00 Females per 100 Males in Spring Ridge.
What is the Median Population Age in Spring Ridge?
Median Population Age in Spring Ridge is 36.6 Years.
What is the Average Family Size in Spring Ridge
Average Family Size in Spring Ridge is 3.4 People.
What is the Average Household Size in Spring Ridge
Average Household Size in Spring Ridge is 2.7 People.
How Large is the Labor Force in Spring Ridge?
There are 3,528 People in the Labor Forcein in Spring Ridge.
What is the Percentage of People in the Labor Force in Spring Ridge?
74.8% of People are in the Labor Force in Spring Ridge.
What is the Unemployment Rate in Spring Ridge?
Unemployment Rate in Spring Ridge is 3.0%.