Forestville, MD Map & Demographics
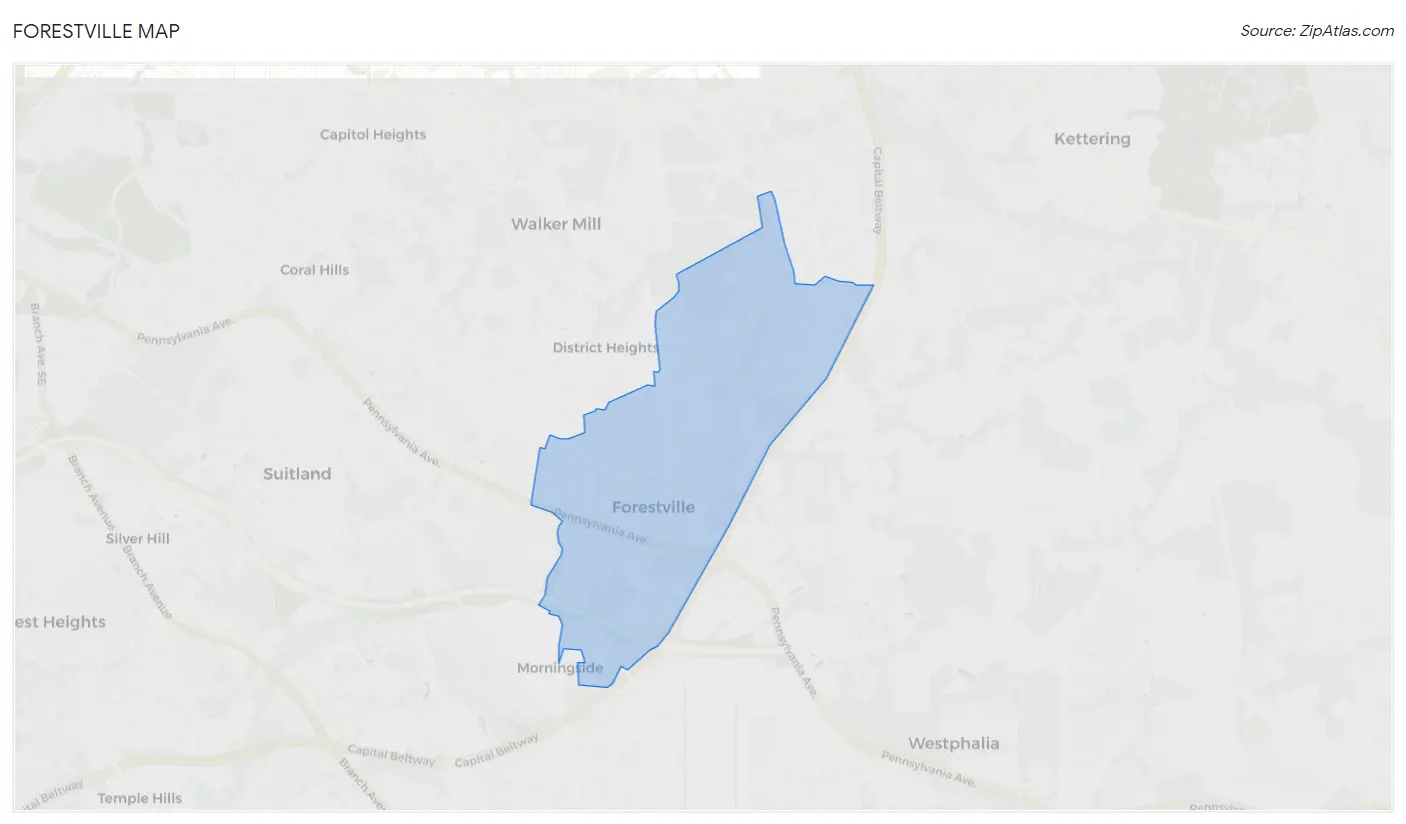
Forestville Map
Forestville Overview
$38,106
PER CAPITA INCOME
$78,093
AVG FAMILY INCOME
$64,660
AVG HOUSEHOLD INCOME
19.8%
WAGE / INCOME GAP [ % ]
80.2¢/ $1
WAGE / INCOME GAP [ $ ]
0.40
INEQUALITY / GINI INDEX
10,291
TOTAL POPULATION
4,934
MALE POPULATION
5,357
FEMALE POPULATION
92.10
MALES / 100 FEMALES
108.57
FEMALES / 100 MALES
44.9
MEDIAN AGE
3.2
AVG FAMILY SIZE
2.3
AVG HOUSEHOLD SIZE
5,524
LABOR FORCE [ PEOPLE ]
63.5%
PERCENT IN LABOR FORCE
7.2%
UNEMPLOYMENT RATE
Income in Forestville
Income Overview in Forestville
Per Capita Income in Forestville is $38,106, while median incomes of families and households are $78,093 and $64,660 respectively.
| Characteristic | Number | Measure |
| Per Capita Income | 10,291 | $38,106 |
| Median Family Income | 2,523 | $78,093 |
| Mean Family Income | 2,523 | $102,406 |
| Median Household Income | 4,352 | $64,660 |
| Mean Household Income | 4,352 | $85,095 |
| Income Deficit | 2,523 | $0 |
| Wage / Income Gap (%) | 10,291 | 19.77% |
| Wage / Income Gap ($) | 10,291 | 80.23¢ per $1 |
| Gini / Inequality Index | 10,291 | 0.40 |
Earnings by Sex in Forestville
Average Earnings in Forestville are $41,046, $36,140 for men and $45,045 for women, a difference of 19.8%.
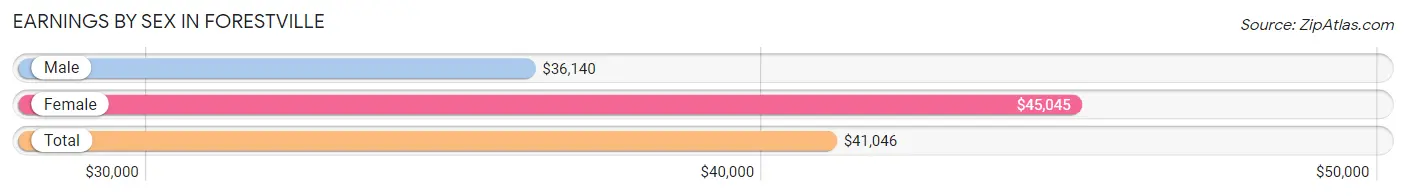
| Sex | Number | Average Earnings |
| Male | 2,510 (45.3%) | $36,140 |
| Female | 3,028 (54.7%) | $45,045 |
| Total | 5,538 (100.0%) | $41,046 |
Earnings by Sex by Income Bracket in Forestville
The most common earnings brackets in Forestville are $100,000+ for men (403 | 16.1%) and $75,000 to $99,999 for women (387 | 12.8%).
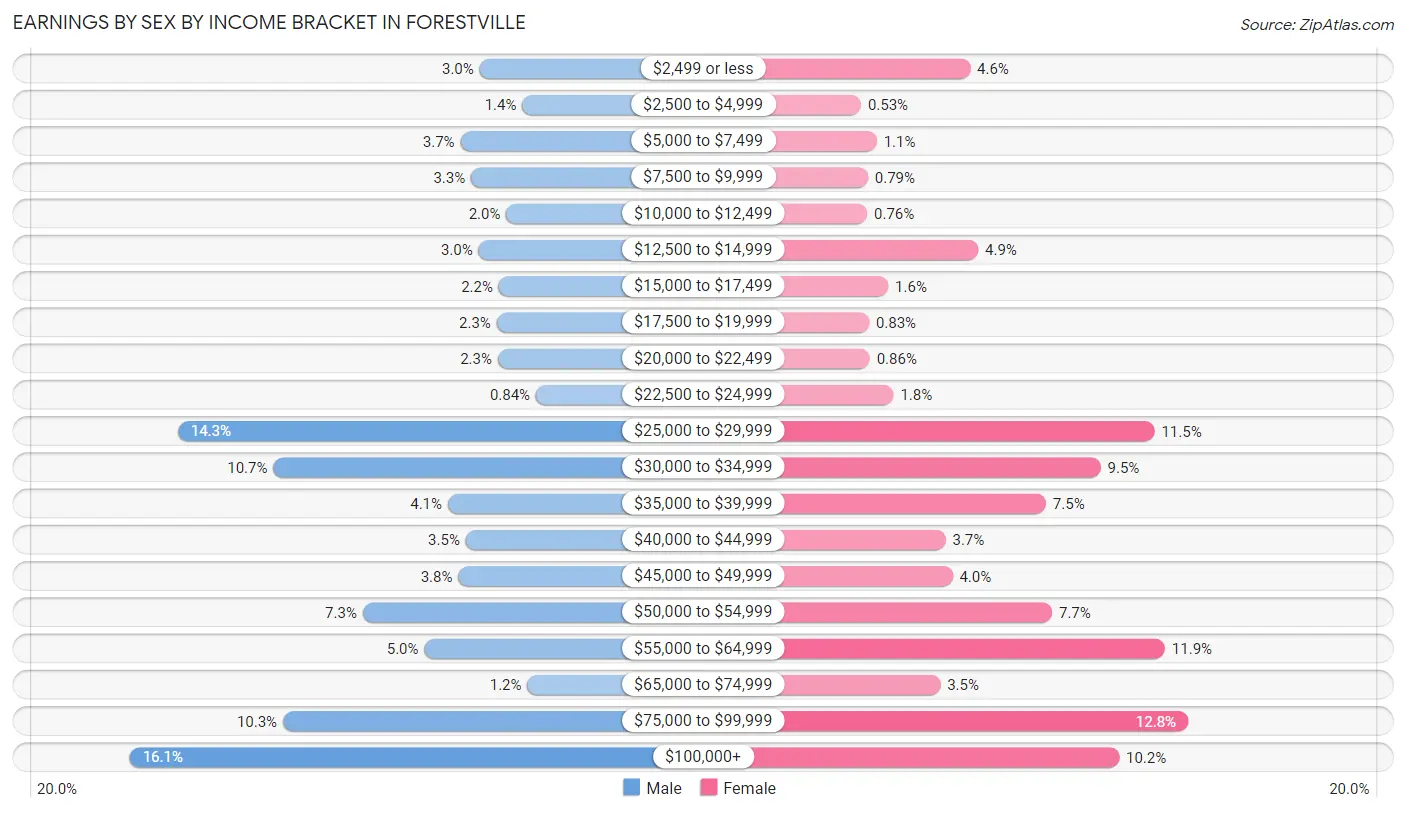
| Income | Male | Female |
| $2,499 or less | 74 (2.9%) | 140 (4.6%) |
| $2,500 to $4,999 | 34 (1.3%) | 16 (0.5%) |
| $5,000 to $7,499 | 92 (3.7%) | 34 (1.1%) |
| $7,500 to $9,999 | 82 (3.3%) | 24 (0.8%) |
| $10,000 to $12,499 | 49 (1.9%) | 23 (0.8%) |
| $12,500 to $14,999 | 75 (3.0%) | 149 (4.9%) |
| $15,000 to $17,499 | 56 (2.2%) | 47 (1.5%) |
| $17,500 to $19,999 | 58 (2.3%) | 25 (0.8%) |
| $20,000 to $22,499 | 57 (2.3%) | 26 (0.9%) |
| $22,500 to $24,999 | 21 (0.8%) | 53 (1.8%) |
| $25,000 to $29,999 | 358 (14.3%) | 349 (11.5%) |
| $30,000 to $34,999 | 268 (10.7%) | 288 (9.5%) |
| $35,000 to $39,999 | 104 (4.1%) | 226 (7.5%) |
| $40,000 to $44,999 | 87 (3.5%) | 112 (3.7%) |
| $45,000 to $49,999 | 94 (3.7%) | 120 (4.0%) |
| $50,000 to $54,999 | 184 (7.3%) | 233 (7.7%) |
| $55,000 to $64,999 | 126 (5.0%) | 361 (11.9%) |
| $65,000 to $74,999 | 29 (1.2%) | 106 (3.5%) |
| $75,000 to $99,999 | 259 (10.3%) | 387 (12.8%) |
| $100,000+ | 403 (16.1%) | 309 (10.2%) |
| Total | 2,510 (100.0%) | 3,028 (100.0%) |
Earnings by Sex by Educational Attainment in Forestville
Average earnings in Forestville are $40,259 for men and $50,993 for women, a difference of 21.0%. Men with an educational attainment of bachelor's degree enjoy the highest average annual earnings of $92,500, while those with less than high school education earn the least with $29,792. Women with an educational attainment of graduate degree earn the most with the average annual earnings of $86,701, while those with less than high school education have the smallest earnings of $36,293.
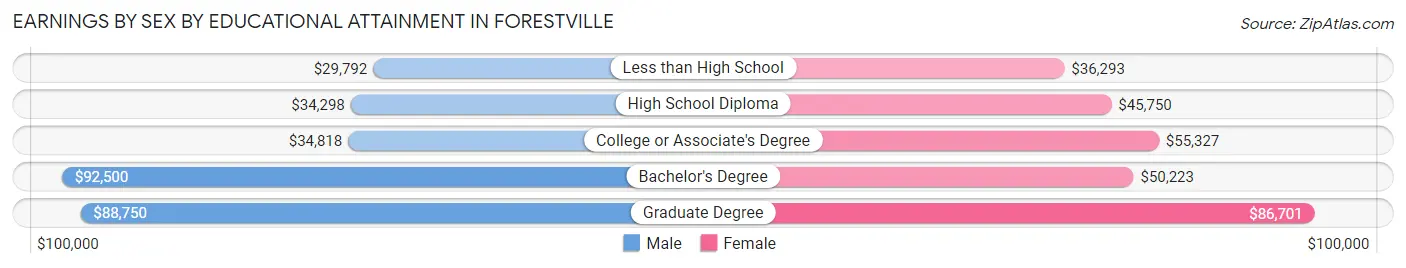
| Educational Attainment | Male Income | Female Income |
| Less than High School | $29,792 | $36,293 |
| High School Diploma | $34,298 | $45,750 |
| College or Associate's Degree | $34,818 | $55,327 |
| Bachelor's Degree | $92,500 | $50,223 |
| Graduate Degree | $88,750 | $86,701 |
| Total | $40,259 | $50,993 |
Family Income in Forestville
Family Income Brackets in Forestville
According to the Forestville family income data, there are 570 families falling into the $50,000 to $74,999 income range, which is the most common income bracket and makes up 22.6% of all families. Conversely, the $10,000 to $14,999 income bracket is the least frequent group with only 33 families (1.3%) belonging to this category.
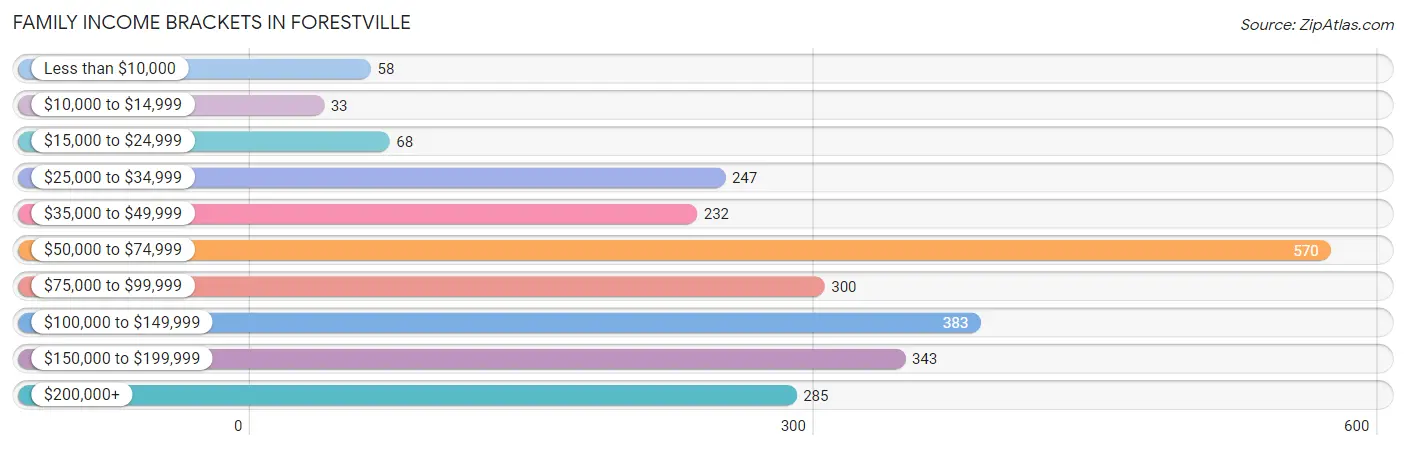
| Income Bracket | # Families | % Families |
| Less than $10,000 | 58 | 2.3% |
| $10,000 to $14,999 | 33 | 1.3% |
| $15,000 to $24,999 | 68 | 2.7% |
| $25,000 to $34,999 | 247 | 9.8% |
| $35,000 to $49,999 | 232 | 9.2% |
| $50,000 to $74,999 | 570 | 22.6% |
| $75,000 to $99,999 | 300 | 11.9% |
| $100,000 to $149,999 | 383 | 15.2% |
| $150,000 to $199,999 | 343 | 13.6% |
| $200,000+ | 285 | 11.3% |
Family Income by Famaliy Size in Forestville
4-person families (498 | 19.7%) account for the highest median family income in Forestville with $124,583 per family, while 2-person families (1,150 | 45.6%) have the highest median income of $34,134 per family member.
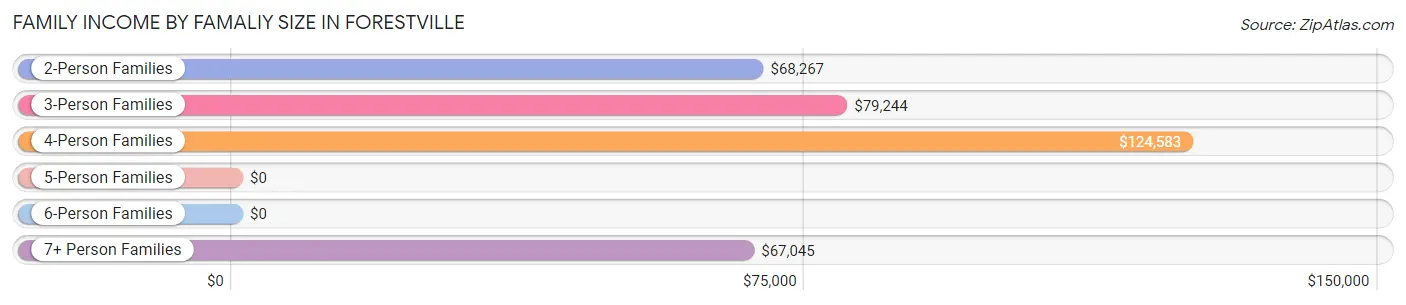
| Income Bracket | # Families | Median Income |
| 2-Person Families | 1,150 (45.6%) | $68,267 |
| 3-Person Families | 732 (29.0%) | $79,244 |
| 4-Person Families | 498 (19.7%) | $124,583 |
| 5-Person Families | 55 (2.2%) | $0 |
| 6-Person Families | 34 (1.3%) | $0 |
| 7+ Person Families | 54 (2.1%) | $67,045 |
| Total | 2,523 (100.0%) | $78,093 |
Family Income by Number of Earners in Forestville
The median family income in Forestville is $78,093, with families comprising 3+ earners (257) having the highest median family income of $183,693, while families with no earners (233) have the lowest median family income of $42,708, accounting for 10.2% and 9.2% of families, respectively.
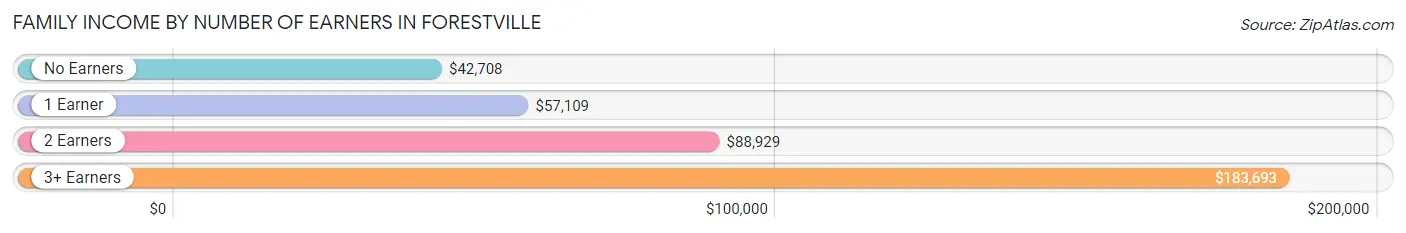
| Number of Earners | # Families | Median Income |
| No Earners | 233 (9.2%) | $42,708 |
| 1 Earner | 1,067 (42.3%) | $57,109 |
| 2 Earners | 966 (38.3%) | $88,929 |
| 3+ Earners | 257 (10.2%) | $183,693 |
| Total | 2,523 (100.0%) | $78,093 |
Household Income in Forestville
Household Income Brackets in Forestville
With 957 households falling in the category, the $50,000 to $74,999 income range is the most frequent in Forestville, accounting for 22.0% of all households. In contrast, only 109 households (2.5%) fall into the $10,000 to $14,999 income bracket, making it the least populous group.
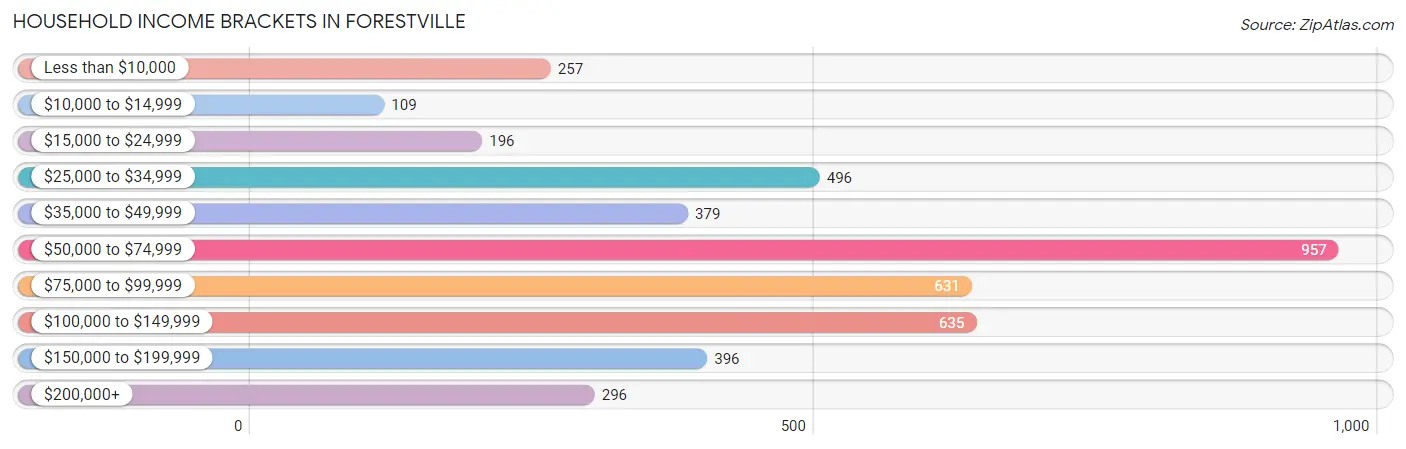
| Income Bracket | # Households | % Households |
| Less than $10,000 | 257 | 5.9% |
| $10,000 to $14,999 | 109 | 2.5% |
| $15,000 to $24,999 | 196 | 4.5% |
| $25,000 to $34,999 | 496 | 11.4% |
| $35,000 to $49,999 | 379 | 8.7% |
| $50,000 to $74,999 | 957 | 22.0% |
| $75,000 to $99,999 | 631 | 14.5% |
| $100,000 to $149,999 | 635 | 14.6% |
| $150,000 to $199,999 | 396 | 9.1% |
| $200,000+ | 296 | 6.8% |
Household Income by Householder Age in Forestville
The median household income in Forestville is $64,660, with the highest median household income of $92,903 found in the 45 to 64 years age bracket for the primary householder. A total of 1,951 households (44.8%) fall into this category. Meanwhile, the 15 to 24 years age bracket for the primary householder has the lowest median household income of $28,327, with 155 households (3.6%) in this group.
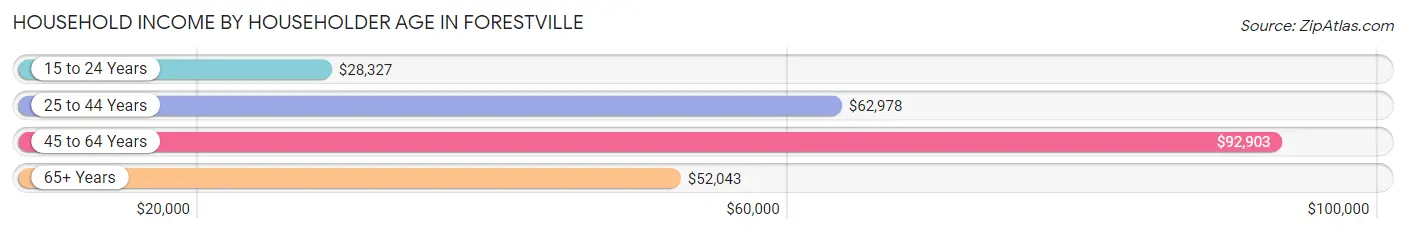
| Income Bracket | # Households | Median Income |
| 15 to 24 Years | 155 (3.6%) | $28,327 |
| 25 to 44 Years | 1,005 (23.1%) | $62,978 |
| 45 to 64 Years | 1,951 (44.8%) | $92,903 |
| 65+ Years | 1,241 (28.5%) | $52,043 |
| Total | 4,352 (100.0%) | $64,660 |
Poverty in Forestville
Income Below Poverty by Sex and Age in Forestville
With 9.5% poverty level for males and 10.8% for females among the residents of Forestville, 16 and 17 year old males and 12 to 14 year old females are the most vulnerable to poverty, with 86 males (67.7%) and 74 females (27.3%) in their respective age groups living below the poverty level.
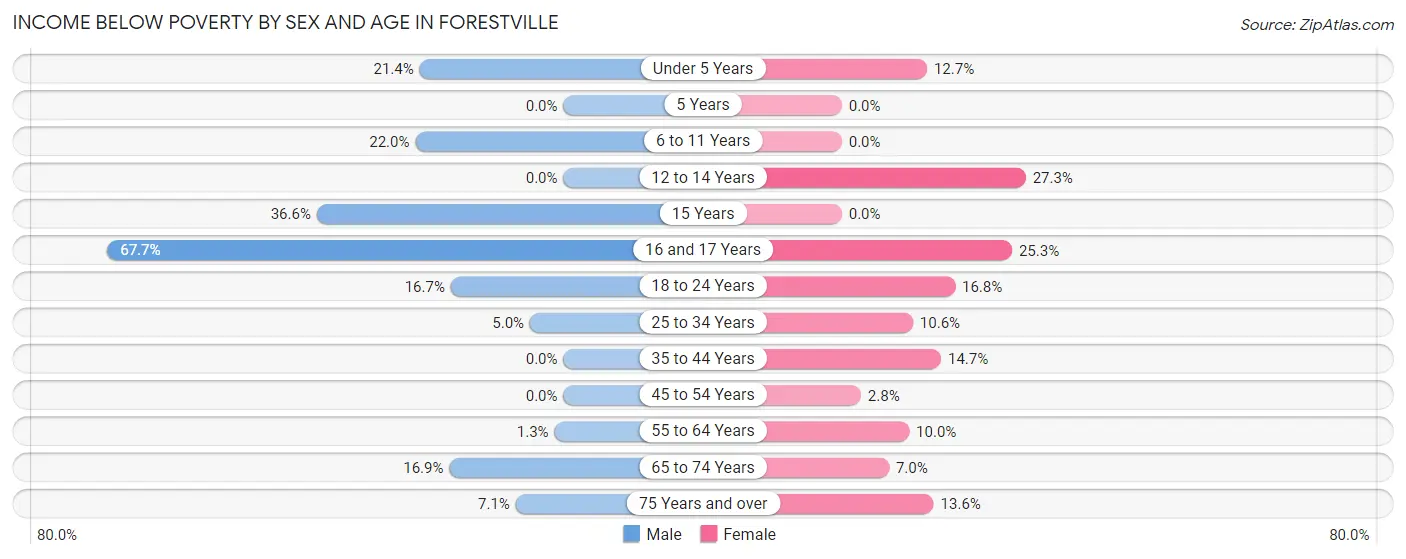
| Age Bracket | Male | Female |
| Under 5 Years | 44 (21.4%) | 31 (12.7%) |
| 5 Years | 0 (0.0%) | 0 (0.0%) |
| 6 to 11 Years | 100 (22.0%) | 0 (0.0%) |
| 12 to 14 Years | 0 (0.0%) | 74 (27.3%) |
| 15 Years | 26 (36.6%) | 0 (0.0%) |
| 16 and 17 Years | 86 (67.7%) | 23 (25.3%) |
| 18 to 24 Years | 48 (16.7%) | 74 (16.8%) |
| 25 to 34 Years | 49 (5.0%) | 77 (10.6%) |
| 35 to 44 Years | 0 (0.0%) | 74 (14.7%) |
| 45 to 54 Years | 0 (0.0%) | 24 (2.8%) |
| 55 to 64 Years | 10 (1.3%) | 92 (10.0%) |
| 65 to 74 Years | 63 (16.9%) | 46 (7.0%) |
| 75 Years and over | 30 (7.1%) | 57 (13.6%) |
| Total | 456 (9.5%) | 572 (10.8%) |
Income Above Poverty by Sex and Age in Forestville
According to the poverty statistics in Forestville, males aged 5 years and females aged 5 years are the age groups that are most secure financially, with 100.0% of males and 100.0% of females in these age groups living above the poverty line.
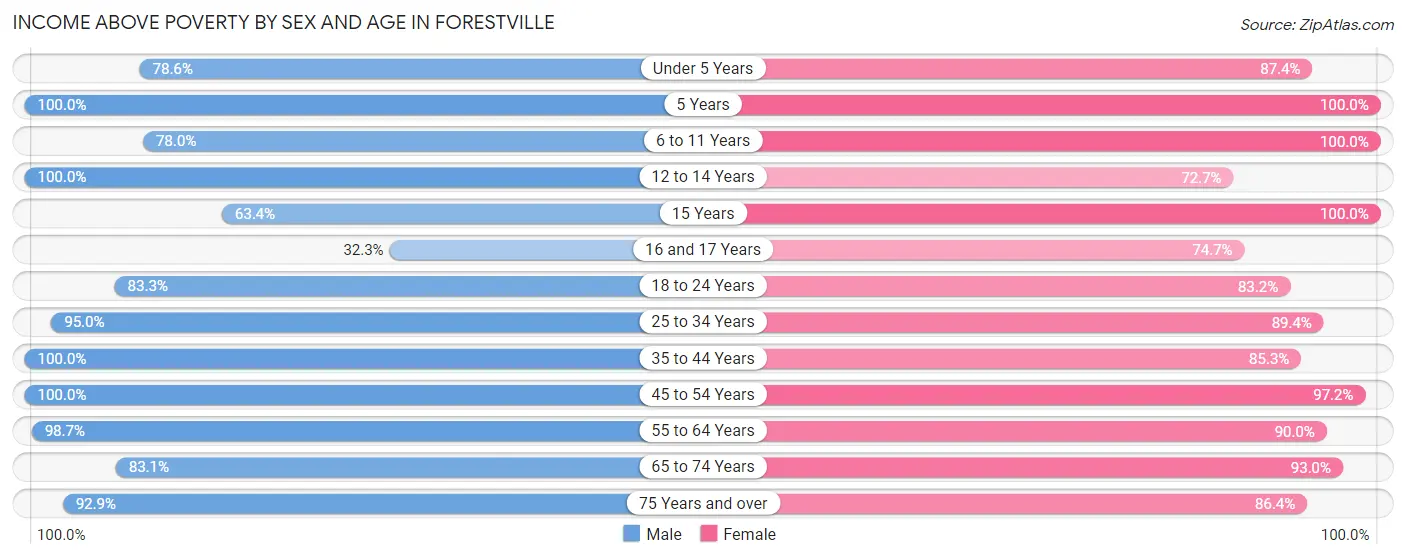
| Age Bracket | Male | Female |
| Under 5 Years | 162 (78.6%) | 214 (87.4%) |
| 5 Years | 40 (100.0%) | 10 (100.0%) |
| 6 to 11 Years | 355 (78.0%) | 149 (100.0%) |
| 12 to 14 Years | 111 (100.0%) | 197 (72.7%) |
| 15 Years | 45 (63.4%) | 34 (100.0%) |
| 16 and 17 Years | 41 (32.3%) | 68 (74.7%) |
| 18 to 24 Years | 239 (83.3%) | 366 (83.2%) |
| 25 to 34 Years | 938 (95.0%) | 652 (89.4%) |
| 35 to 44 Years | 392 (100.0%) | 428 (85.3%) |
| 45 to 54 Years | 586 (100.0%) | 821 (97.2%) |
| 55 to 64 Years | 747 (98.7%) | 828 (90.0%) |
| 65 to 74 Years | 309 (83.1%) | 611 (93.0%) |
| 75 Years and over | 394 (92.9%) | 361 (86.4%) |
| Total | 4,359 (90.5%) | 4,739 (89.2%) |
Income Below Poverty Among Married-Couple Families in Forestville
The poverty statistics for married-couple families in Forestville show that 3.1% or 31 of the total 1,009 families live below the poverty line. Families with no children have the highest poverty rate of 4.2%, comprising of 31 families. On the other hand, families with 1 or 2 children have the lowest poverty rate of 0.0%, which includes 0 families.
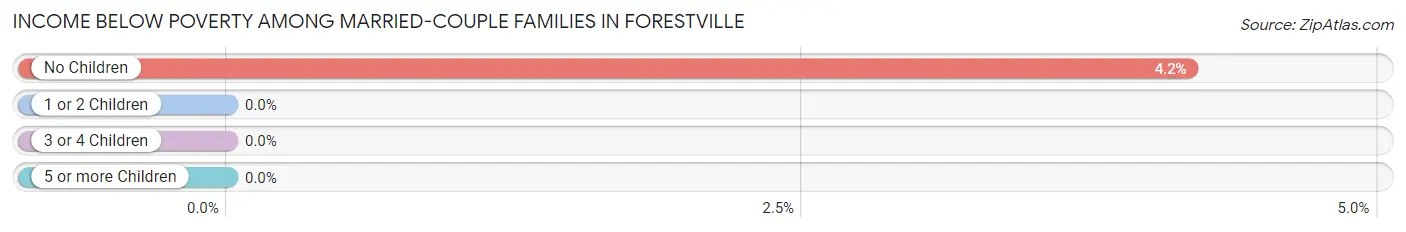
| Children | Above Poverty | Below Poverty |
| No Children | 710 (95.8%) | 31 (4.2%) |
| 1 or 2 Children | 242 (100.0%) | 0 (0.0%) |
| 3 or 4 Children | 15 (100.0%) | 0 (0.0%) |
| 5 or more Children | 11 (100.0%) | 0 (0.0%) |
| Total | 978 (96.9%) | 31 (3.1%) |
Income Below Poverty Among Single-Parent Households in Forestville
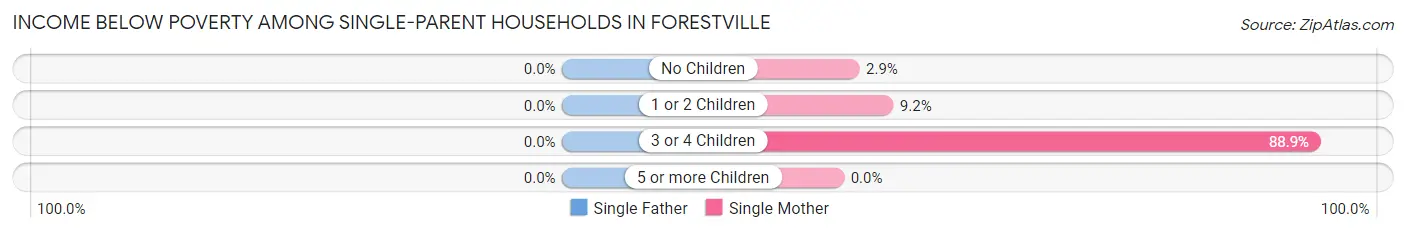
| Children | Single Father | Single Mother |
| No Children | 0 (0.0%) | 17 (2.9%) |
| 1 or 2 Children | 0 (0.0%) | 42 (9.2%) |
| 3 or 4 Children | 0 (0.0%) | 104 (88.9%) |
| 5 or more Children | 0 (0.0%) | 0 (0.0%) |
| Total | 0 (0.0%) | 163 (13.6%) |
Income Below Poverty Among Married-Couple vs Single-Parent Households in Forestville
The poverty data for Forestville shows that 31 of the married-couple family households (3.1%) and 163 of the single-parent households (10.8%) are living below the poverty level. Within the married-couple family households, those with no children have the highest poverty rate, with 31 households (4.2%) falling below the poverty line. Among the single-parent households, those with 3 or 4 children have the highest poverty rate, with 104 household (88.9%) living below poverty.
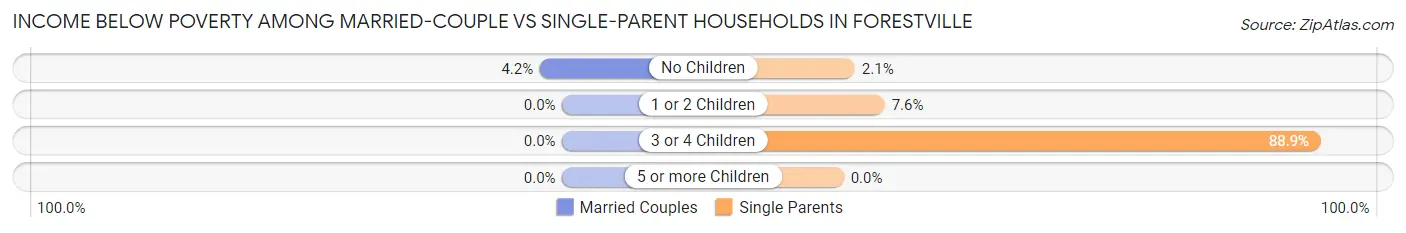
| Children | Married-Couple Families | Single-Parent Households |
| No Children | 31 (4.2%) | 17 (2.1%) |
| 1 or 2 Children | 0 (0.0%) | 42 (7.6%) |
| 3 or 4 Children | 0 (0.0%) | 104 (88.9%) |
| 5 or more Children | 0 (0.0%) | 0 (0.0%) |
| Total | 31 (3.1%) | 163 (10.8%) |
Race in Forestville
The most populous races in Forestville are Black / African American (8,832 | 85.8%), Hispanic or Latino (765 | 7.4%), and Some other Race (507 | 4.9%).
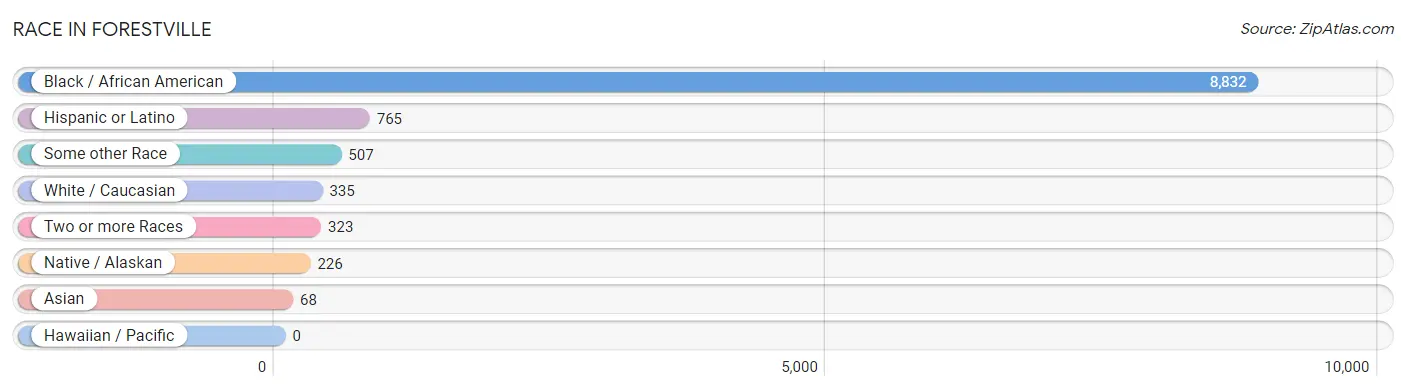
| Race | # Population | % Population |
| Asian | 68 | 0.7% |
| Black / African American | 8,832 | 85.8% |
| Hawaiian / Pacific | 0 | 0.0% |
| Hispanic or Latino | 765 | 7.4% |
| Native / Alaskan | 226 | 2.2% |
| White / Caucasian | 335 | 3.3% |
| Two or more Races | 323 | 3.1% |
| Some other Race | 507 | 4.9% |
| Total | 10,291 | 100.0% |
Ancestry in Forestville
The most populous ancestries reported in Forestville are Central American (606 | 5.9%), Salvadoran (544 | 5.3%), Subsaharan African (223 | 2.2%), African (180 | 1.8%), and German (126 | 1.2%), together accounting for 16.3% of all Forestville residents.
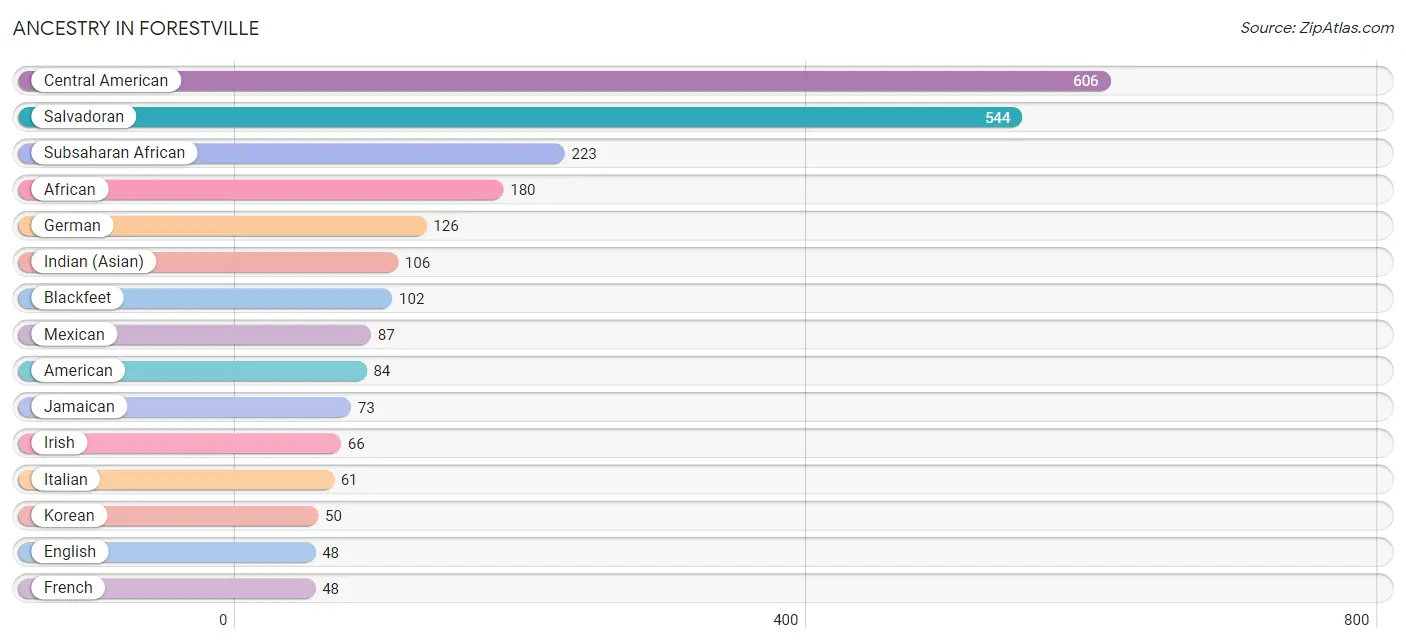
| Ancestry | # Population | % Population |
| African | 180 | 1.8% |
| American | 84 | 0.8% |
| Bhutanese | 4 | 0.0% |
| Blackfeet | 102 | 1.0% |
| Central American | 606 | 5.9% |
| Chickasaw | 10 | 0.1% |
| Choctaw | 11 | 0.1% |
| Cuban | 1 | 0.0% |
| Eastern European | 15 | 0.2% |
| English | 48 | 0.5% |
| European | 1 | 0.0% |
| French | 48 | 0.5% |
| French Canadian | 31 | 0.3% |
| German | 126 | 1.2% |
| Guatemalan | 9 | 0.1% |
| Haitian | 10 | 0.1% |
| Honduran | 36 | 0.4% |
| Indian (Asian) | 106 | 1.0% |
| Irish | 66 | 0.6% |
| Italian | 61 | 0.6% |
| Jamaican | 73 | 0.7% |
| Korean | 50 | 0.5% |
| Mexican | 87 | 0.9% |
| Pakistani | 6 | 0.1% |
| Panamanian | 17 | 0.2% |
| Polish | 5 | 0.1% |
| Puerto Rican | 13 | 0.1% |
| Salvadoran | 544 | 5.3% |
| Subsaharan African | 223 | 2.2% |
| Thai | 5 | 0.1% |
| Trinidadian and Tobagonian | 27 | 0.3% | View All 31 Rows |
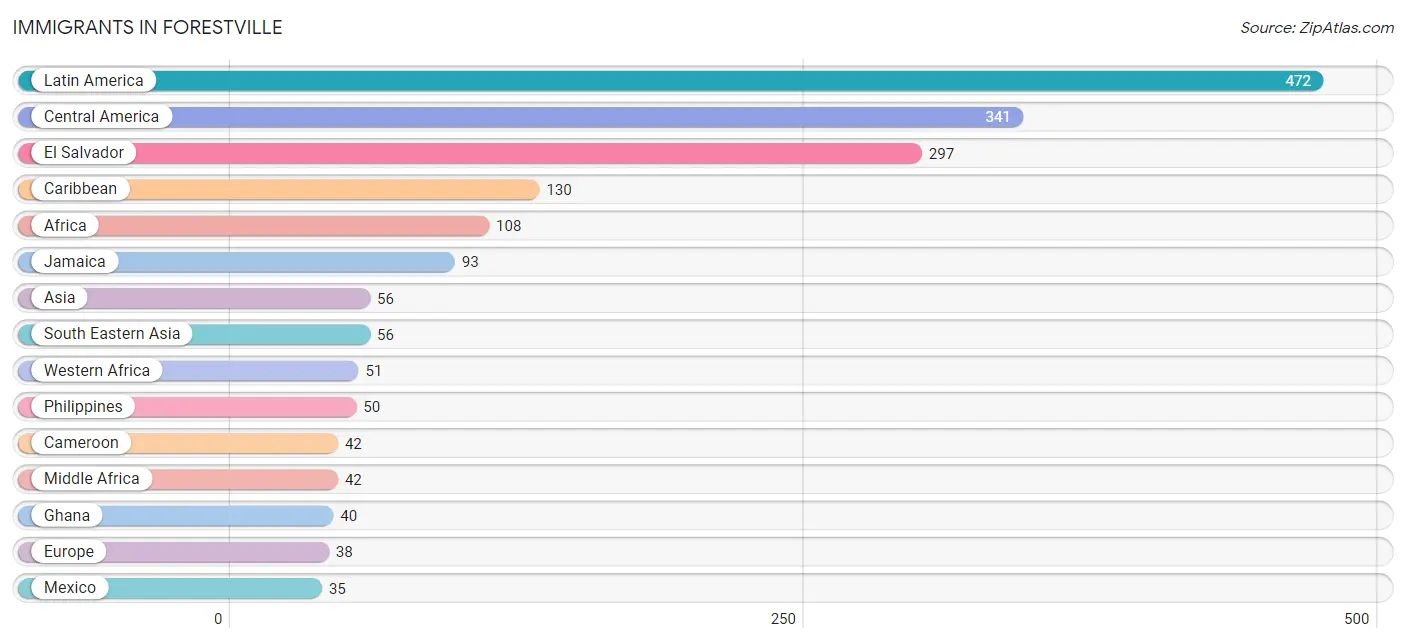
Immigrants in Forestville
The most numerous immigrant groups reported in Forestville came from Latin America (472 | 4.6%), Central America (341 | 3.3%), El Salvador (297 | 2.9%), Caribbean (130 | 1.3%), and Africa (108 | 1.1%), together accounting for 13.1% of all Forestville residents.
| Immigration Origin | # Population | % Population |
| Africa | 108 | 1.1% |
| Asia | 56 | 0.5% |
| Cameroon | 42 | 0.4% |
| Caribbean | 130 | 1.3% |
| Central America | 341 | 3.3% |
| Eastern Africa | 15 | 0.2% |
| Eastern Europe | 16 | 0.2% |
| El Salvador | 297 | 2.9% |
| Ethiopia | 15 | 0.2% |
| Europe | 38 | 0.4% |
| Germany | 22 | 0.2% |
| Ghana | 40 | 0.4% |
| Guatemala | 9 | 0.1% |
| Jamaica | 93 | 0.9% |
| Latin America | 472 | 4.6% |
| Mexico | 35 | 0.3% |
| Middle Africa | 42 | 0.4% |
| Philippines | 50 | 0.5% |
| Poland | 16 | 0.2% |
| Sierra Leone | 11 | 0.1% |
| South America | 1 | 0.0% |
| South Eastern Asia | 56 | 0.5% |
| Thailand | 6 | 0.1% |
| Trinidad and Tobago | 27 | 0.3% |
| Venezuela | 1 | 0.0% |
| West Indies | 10 | 0.1% |
| Western Africa | 51 | 0.5% |
| Western Europe | 22 | 0.2% | View All 28 Rows |
Sex and Age in Forestville
Sex and Age in Forestville
The most populous age groups in Forestville are 25 to 29 Years (616 | 12.5%) for men and 60 to 64 Years (469 | 8.7%) for women.
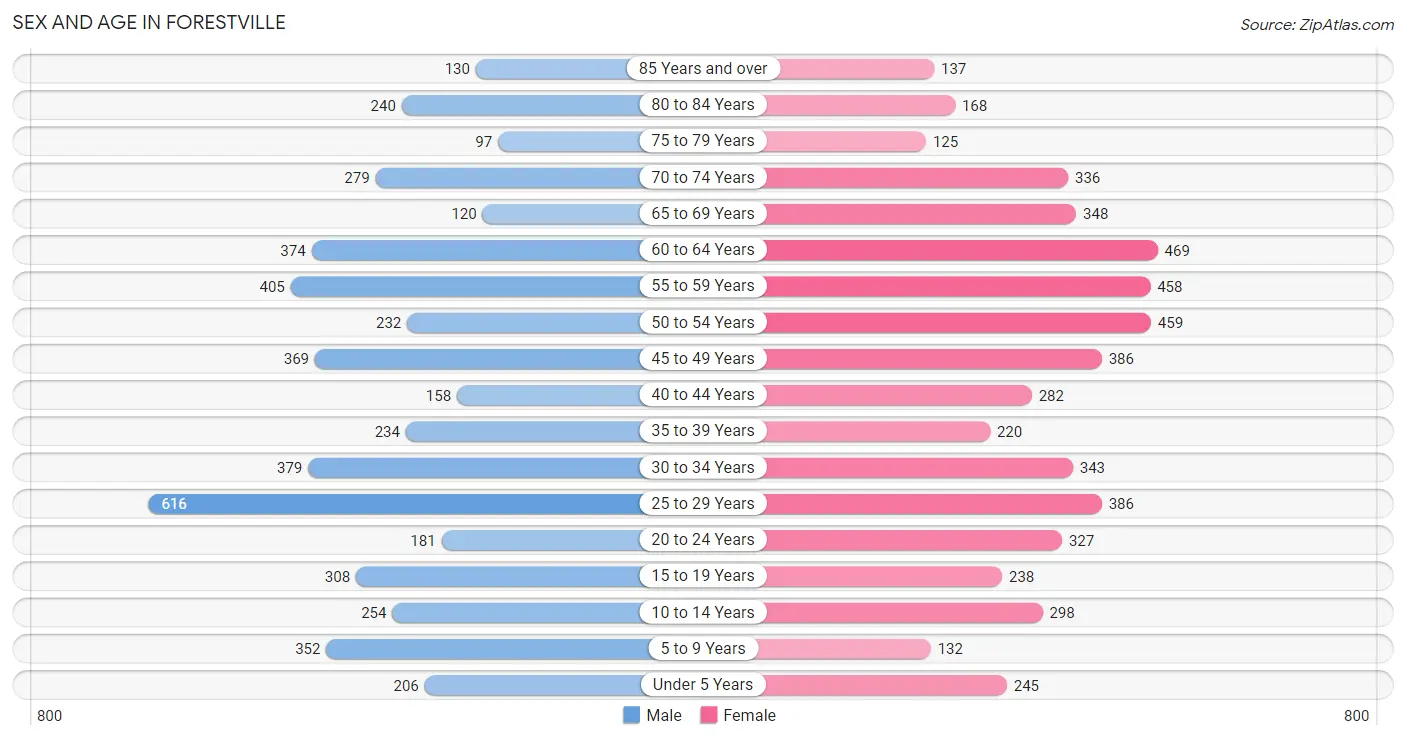
| Age Bracket | Male | Female |
| Under 5 Years | 206 (4.2%) | 245 (4.6%) |
| 5 to 9 Years | 352 (7.1%) | 132 (2.5%) |
| 10 to 14 Years | 254 (5.1%) | 298 (5.6%) |
| 15 to 19 Years | 308 (6.2%) | 238 (4.4%) |
| 20 to 24 Years | 181 (3.7%) | 327 (6.1%) |
| 25 to 29 Years | 616 (12.5%) | 386 (7.2%) |
| 30 to 34 Years | 379 (7.7%) | 343 (6.4%) |
| 35 to 39 Years | 234 (4.7%) | 220 (4.1%) |
| 40 to 44 Years | 158 (3.2%) | 282 (5.3%) |
| 45 to 49 Years | 369 (7.5%) | 386 (7.2%) |
| 50 to 54 Years | 232 (4.7%) | 459 (8.6%) |
| 55 to 59 Years | 405 (8.2%) | 458 (8.6%) |
| 60 to 64 Years | 374 (7.6%) | 469 (8.7%) |
| 65 to 69 Years | 120 (2.4%) | 348 (6.5%) |
| 70 to 74 Years | 279 (5.7%) | 336 (6.3%) |
| 75 to 79 Years | 97 (2.0%) | 125 (2.3%) |
| 80 to 84 Years | 240 (4.9%) | 168 (3.1%) |
| 85 Years and over | 130 (2.6%) | 137 (2.6%) |
| Total | 4,934 (100.0%) | 5,357 (100.0%) |
Families and Households in Forestville
Median Family Size in Forestville
The median family size in Forestville is 3.18 persons per family, with married-couple families (1,009 | 40.0%) accounting for the largest median family size of 3.48 persons per family. On the other hand, single male/father families (313 | 12.4%) represent the smallest median family size with 2.65 persons per family.
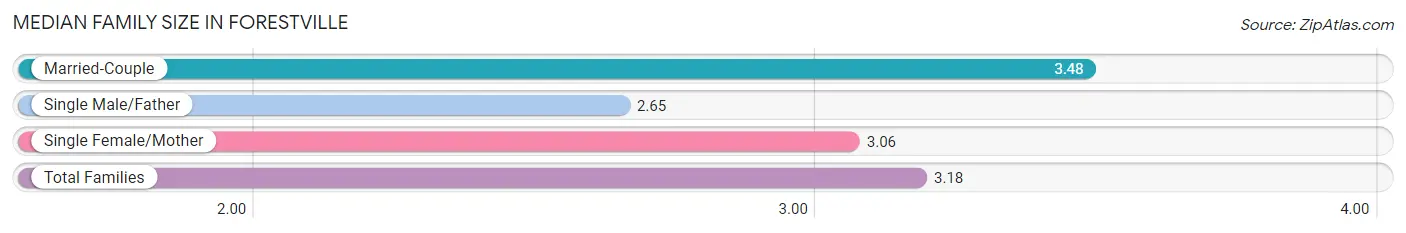
| Family Type | # Families | Family Size |
| Married-Couple | 1,009 (40.0%) | 3.48 |
| Single Male/Father | 313 (12.4%) | 2.65 |
| Single Female/Mother | 1,201 (47.6%) | 3.06 |
| Total Families | 2,523 (100.0%) | 3.18 |
Median Household Size in Forestville
The median household size in Forestville is 2.33 persons per household, with married-couple households (1,009 | 23.2%) accounting for the largest median household size of 3.51 persons per household. non-family households (1,829 | 42.0%) represent the smallest median household size with 1.09 persons per household.
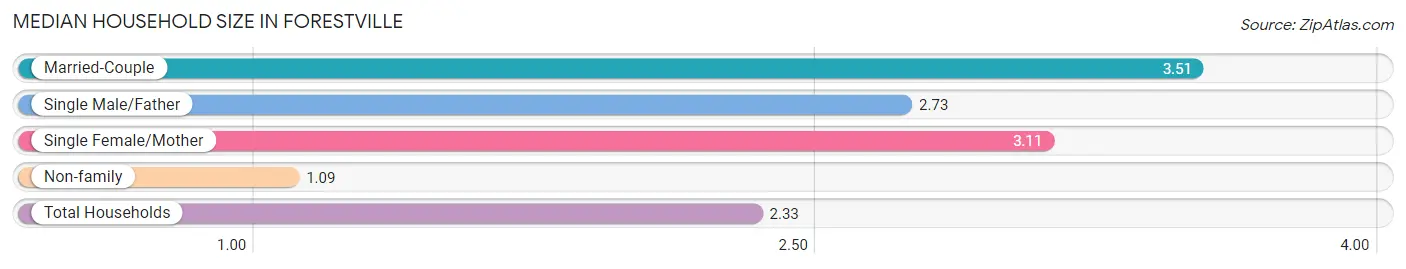
| Household Type | # Households | Household Size |
| Married-Couple | 1,009 (23.2%) | 3.51 |
| Single Male/Father | 313 (7.2%) | 2.73 |
| Single Female/Mother | 1,201 (27.6%) | 3.11 |
| Non-family | 1,829 (42.0%) | 1.09 |
| Total Households | 4,352 (100.0%) | 2.33 |
Household Size by Marriage Status in Forestville
Out of a total of 4,352 households in Forestville, 2,523 (58.0%) are family households, while 1,829 (42.0%) are nonfamily households. The most numerous type of family households are 2-person households, comprising 1,134, and the most common type of nonfamily households are 1-person households, comprising 1,695.
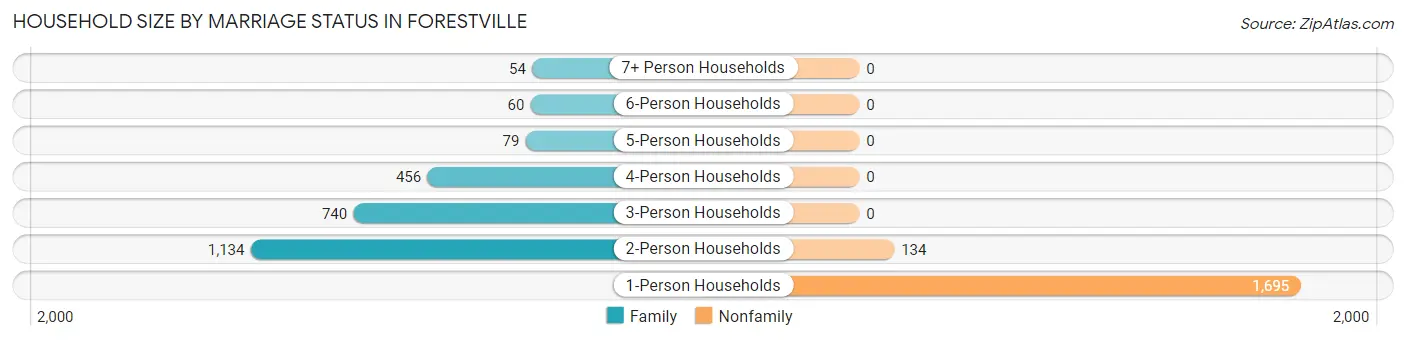
| Household Size | Family Households | Nonfamily Households |
| 1-Person Households | - | 1,695 (39.0%) |
| 2-Person Households | 1,134 (26.1%) | 134 (3.1%) |
| 3-Person Households | 740 (17.0%) | 0 (0.0%) |
| 4-Person Households | 456 (10.5%) | 0 (0.0%) |
| 5-Person Households | 79 (1.8%) | 0 (0.0%) |
| 6-Person Households | 60 (1.4%) | 0 (0.0%) |
| 7+ Person Households | 54 (1.2%) | 0 (0.0%) |
| Total | 2,523 (58.0%) | 1,829 (42.0%) |
Female Fertility in Forestville
Fertility by Age in Forestville
Average fertility rate in Forestville is 39.0 births per 1,000 women. Women in the age bracket of 20 to 34 years have the highest fertility rate with 53.0 births per 1,000 women. Women in the age bracket of 20 to 34 years acount for 62.2% of all women with births.
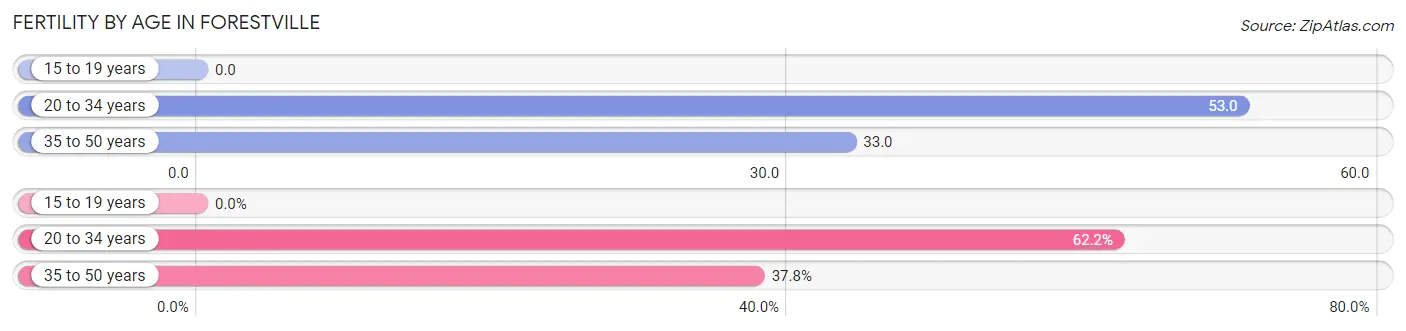
| Age Bracket | Women with Births | Births / 1,000 Women |
| 15 to 19 years | 0 (0.0%) | 0.0 |
| 20 to 34 years | 56 (62.2%) | 53.0 |
| 35 to 50 years | 34 (37.8%) | 33.0 |
| Total | 90 (100.0%) | 39.0 |
Fertility by Age by Marriage Status in Forestville
45.6% of women with births (90) in Forestville are married. The highest percentage of unmarried women with births falls into 35 to 50 years age bracket with 76.5% of them unmarried at the time of birth, while the lowest percentage of unmarried women with births belong to 20 to 34 years age bracket with 41.1% of them unmarried.
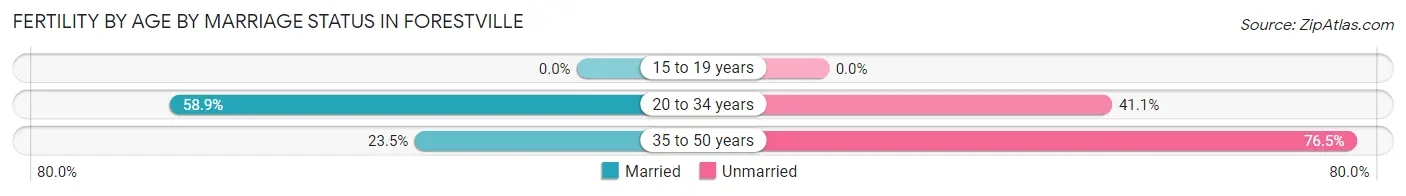
| Age Bracket | Married | Unmarried |
| 15 to 19 years | 0 (0.0%) | 0 (0.0%) |
| 20 to 34 years | 33 (58.9%) | 23 (41.1%) |
| 35 to 50 years | 8 (23.5%) | 26 (76.5%) |
| Total | 41 (45.6%) | 49 (54.4%) |
Fertility by Education in Forestville
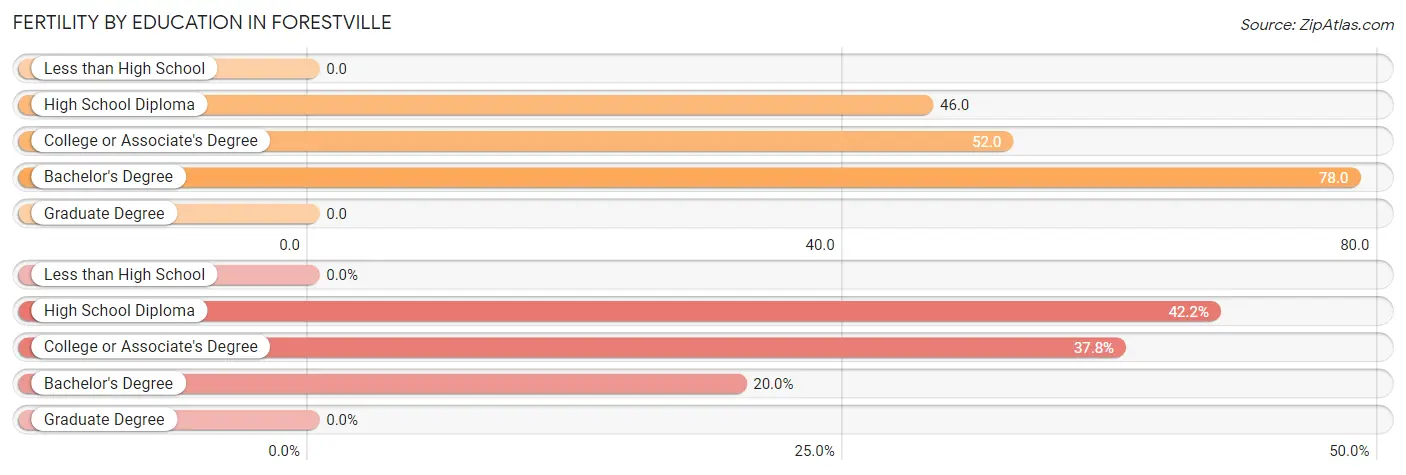
| Educational Attainment | Women with Births | Births / 1,000 Women |
| Less than High School | 0 (0.0%) | 0.0 |
| High School Diploma | 38 (42.2%) | 46.0 |
| College or Associate's Degree | 34 (37.8%) | 52.0 |
| Bachelor's Degree | 18 (20.0%) | 78.0 |
| Graduate Degree | 0 (0.0%) | 0.0 |
| Total | 90 (100.0%) | 39.0 |
Fertility by Education by Marriage Status in Forestville
54.4% of women with births in Forestville are unmarried. Women with the educational attainment of bachelor's degree are most likely to be married with 100.0% of them married at childbirth, while women with the educational attainment of high school diploma are least likely to be married with 100.0% of them unmarried at childbirth.
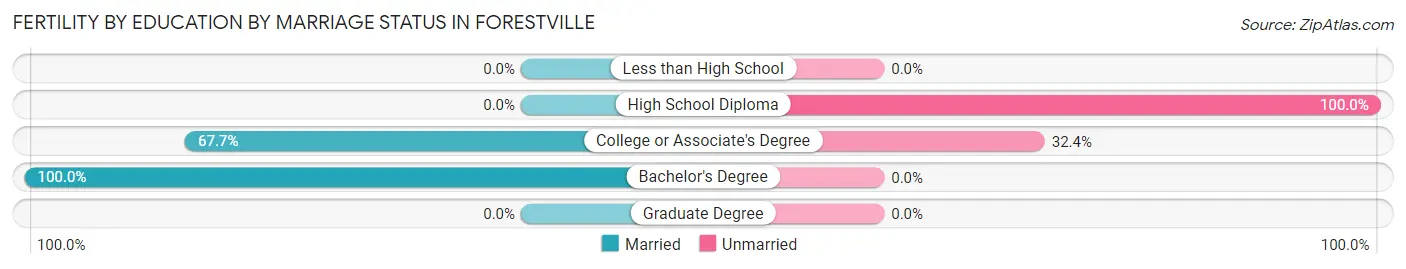
| Educational Attainment | Married | Unmarried |
| Less than High School | 0 (0.0%) | 0 (0.0%) |
| High School Diploma | 0 (0.0%) | 38 (100.0%) |
| College or Associate's Degree | 23 (67.6%) | 11 (32.4%) |
| Bachelor's Degree | 18 (100.0%) | 0 (0.0%) |
| Graduate Degree | 0 (0.0%) | 0 (0.0%) |
| Total | 41 (45.6%) | 49 (54.4%) |
Employment Characteristics in Forestville
Employment by Class of Employer in Forestville
Among the 5,061 employed individuals in Forestville, private company employees (2,673 | 52.8%), federal government employees (831 | 16.4%), and local government employees (576 | 11.4%) make up the most common classes of employment.
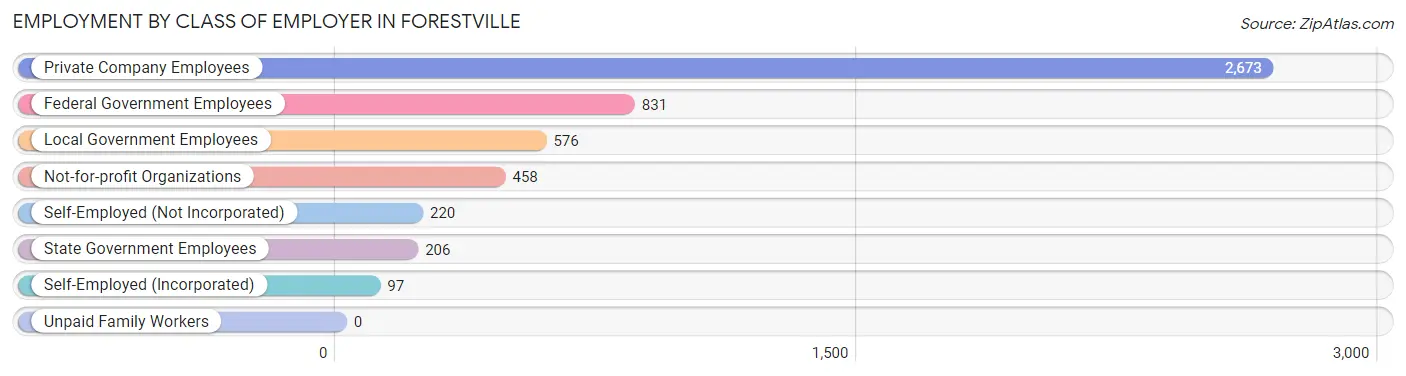
| Employer Class | # Employees | % Employees |
| Private Company Employees | 2,673 | 52.8% |
| Self-Employed (Incorporated) | 97 | 1.9% |
| Self-Employed (Not Incorporated) | 220 | 4.3% |
| Not-for-profit Organizations | 458 | 9.0% |
| Local Government Employees | 576 | 11.4% |
| State Government Employees | 206 | 4.1% |
| Federal Government Employees | 831 | 16.4% |
| Unpaid Family Workers | 0 | 0.0% |
| Total | 5,061 | 100.0% |
Employment Status by Age in Forestville
According to the labor force statistics for Forestville, out of the total population over 16 years of age (8,699), 63.5% or 5,524 individuals are in the labor force, with 7.2% or 398 of them unemployed. The age group with the highest labor force participation rate is 30 to 34 years, with 100.0% or 722 individuals in the labor force. Within the labor force, the 16 to 19 years age range has the highest percentage of unemployed individuals, with 27.4% or 23 of them being unemployed.
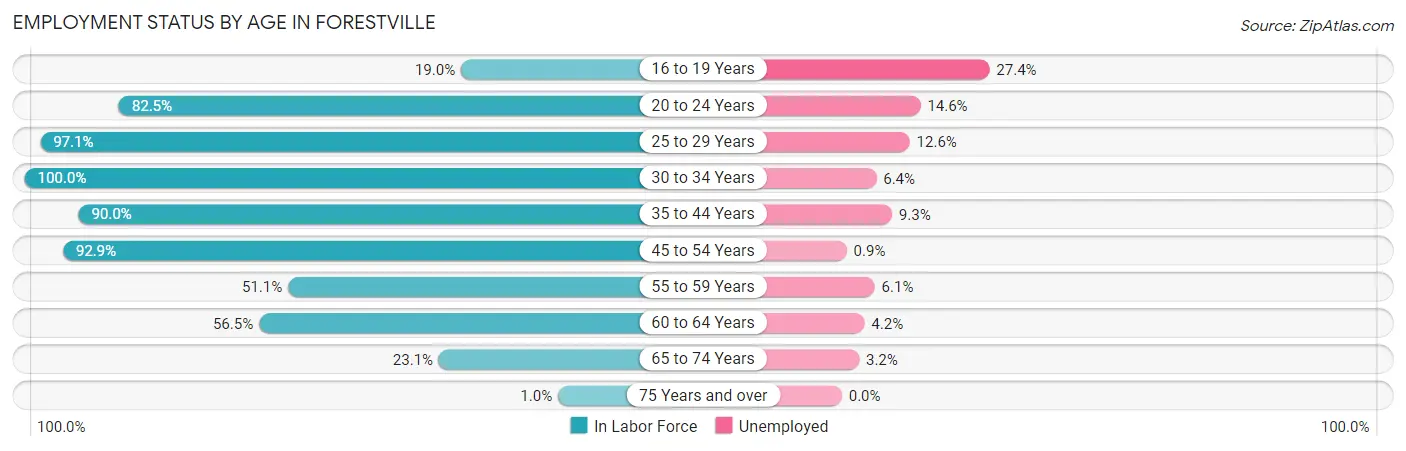
| Age Bracket | In Labor Force | Unemployed |
| 16 to 19 Years | 84 (19.0%) | 23 (27.4%) |
| 20 to 24 Years | 419 (82.5%) | 61 (14.6%) |
| 25 to 29 Years | 973 (97.1%) | 123 (12.6%) |
| 30 to 34 Years | 722 (100.0%) | 46 (6.4%) |
| 35 to 44 Years | 805 (90.0%) | 75 (9.3%) |
| 45 to 54 Years | 1,343 (92.9%) | 12 (0.9%) |
| 55 to 59 Years | 441 (51.1%) | 27 (6.1%) |
| 60 to 64 Years | 476 (56.5%) | 20 (4.2%) |
| 65 to 74 Years | 250 (23.1%) | 8 (3.2%) |
| 75 Years and over | 9 (1.0%) | 0 (0.0%) |
| Total | 5,524 (63.5%) | 398 (7.2%) |
Employment Status by Educational Attainment in Forestville
According to labor force statistics for Forestville, 82.5% of individuals (4,760) out of the total population between 25 and 64 years of age (5,770) are in the labor force, with 6.4% or 305 of them being unemployed. The group with the highest labor force participation rate are those with the educational attainment of less than high school, with 88.2% or 558 individuals in the labor force. Within the labor force, individuals with high school diploma education have the highest percentage of unemployment, with 10.0% or 191 of them being unemployed.
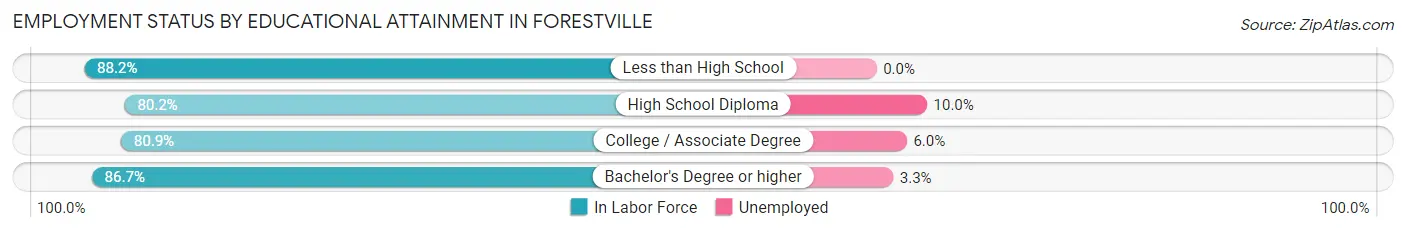
| Educational Attainment | In Labor Force | Unemployed |
| Less than High School | 558 (88.2%) | 0 (0.0%) |
| High School Diploma | 1,908 (80.2%) | 238 (10.0%) |
| College / Associate Degree | 1,351 (80.9%) | 100 (6.0%) |
| Bachelor's Degree or higher | 943 (86.7%) | 36 (3.3%) |
| Total | 4,760 (82.5%) | 369 (6.4%) |
Employment Occupations by Sex in Forestville
Management, Business, Science and Arts Occupations
The most common Management, Business, Science and Arts occupations in Forestville are Community & Social Service (455 | 8.9%), Management (354 | 6.9%), Computers, Engineering & Science (323 | 6.3%), Computers & Mathematics (298 | 5.8%), and Business & Financial (285 | 5.6%).
Management, Business, Science and Arts Occupations by Sex
Within the Management, Business, Science and Arts occupations in Forestville, the most male-oriented occupations are Legal Services & Support (85.2%), Community & Social Service (61.3%), and Arts, Media & Entertainment (58.2%), while the most female-oriented occupations are Life, Physical & Social Science (100.0%), Health Diagnosing & Treating (86.7%), and Management (85.0%).
| Occupation | Male | Female |
| Management | 53 (15.0%) | 301 (85.0%) |
| Business & Financial | 119 (41.7%) | 166 (58.3%) |
| Computers, Engineering & Science | 86 (26.6%) | 237 (73.4%) |
| Computers & Mathematics | 86 (28.9%) | 212 (71.1%) |
| Architecture & Engineering | 0 (0.0%) | 0 (0.0%) |
| Life, Physical & Social Science | 0 (0.0%) | 25 (100.0%) |
| Community & Social Service | 279 (61.3%) | 176 (38.7%) |
| Education, Arts & Media | 52 (56.5%) | 40 (43.5%) |
| Legal Services & Support | 109 (85.2%) | 19 (14.8%) |
| Education Instruction & Library | 72 (46.2%) | 84 (53.8%) |
| Arts, Media & Entertainment | 46 (58.2%) | 33 (41.8%) |
| Health Diagnosing & Treating | 29 (13.3%) | 189 (86.7%) |
| Health Technologists | 29 (41.4%) | 41 (58.6%) |
| Total (Category) | 566 (34.6%) | 1,069 (65.4%) |
| Total (Overall) | 2,463 (48.0%) | 2,664 (52.0%) |
Services Occupations
The most common Services occupations in Forestville are Food Preparation & Serving (220 | 4.3%), Security & Protection (174 | 3.4%), Healthcare Support (169 | 3.3%), Cleaning & Maintenance (130 | 2.5%), and Firefighting & Prevention (119 | 2.3%).
Services Occupations by Sex
Within the Services occupations in Forestville, the most male-oriented occupations are Cleaning & Maintenance (80.8%), Law Enforcement (61.8%), and Security & Protection (55.7%), while the most female-oriented occupations are Food Preparation & Serving (56.8%), Healthcare Support (55.6%), and Personal Care & Service (48.3%).
| Occupation | Male | Female |
| Healthcare Support | 75 (44.4%) | 94 (55.6%) |
| Security & Protection | 97 (55.7%) | 77 (44.3%) |
| Firefighting & Prevention | 63 (52.9%) | 56 (47.1%) |
| Law Enforcement | 34 (61.8%) | 21 (38.2%) |
| Food Preparation & Serving | 95 (43.2%) | 125 (56.8%) |
| Cleaning & Maintenance | 105 (80.8%) | 25 (19.2%) |
| Personal Care & Service | 47 (51.6%) | 44 (48.3%) |
| Total (Category) | 419 (53.4%) | 365 (46.6%) |
| Total (Overall) | 2,463 (48.0%) | 2,664 (52.0%) |
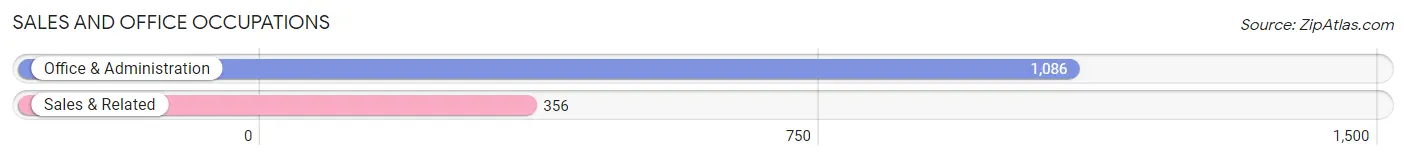
Sales and Office Occupations
The most common Sales and Office occupations in Forestville are Office & Administration (1,086 | 21.2%), and Sales & Related (356 | 6.9%).
Sales and Office Occupations by Sex
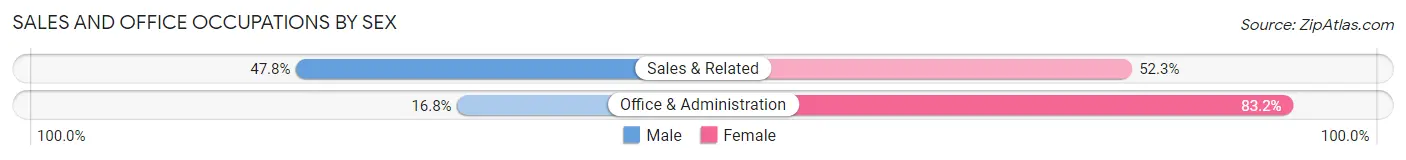
| Occupation | Male | Female |
| Sales & Related | 170 (47.7%) | 186 (52.2%) |
| Office & Administration | 182 (16.8%) | 904 (83.2%) |
| Total (Category) | 352 (24.4%) | 1,090 (75.6%) |
| Total (Overall) | 2,463 (48.0%) | 2,664 (52.0%) |
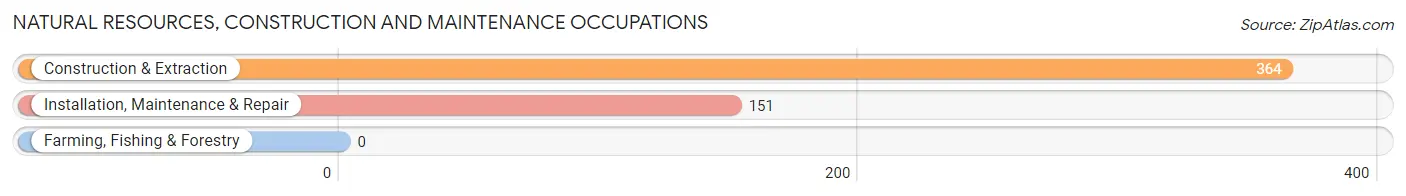
Natural Resources, Construction and Maintenance Occupations
The most common Natural Resources, Construction and Maintenance occupations in Forestville are Construction & Extraction (364 | 7.1%), and Installation, Maintenance & Repair (151 | 2.9%).
Natural Resources, Construction and Maintenance Occupations by Sex
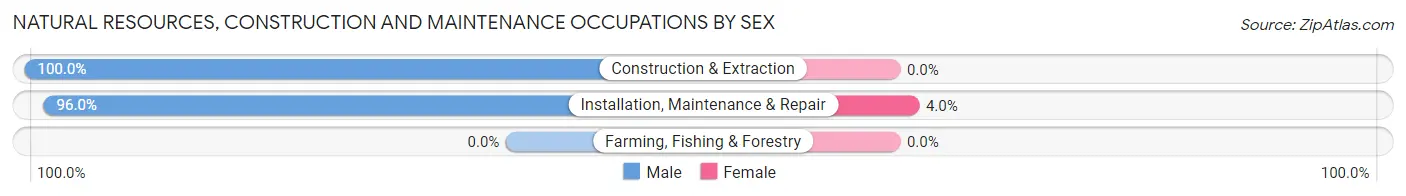
| Occupation | Male | Female |
| Farming, Fishing & Forestry | 0 (0.0%) | 0 (0.0%) |
| Construction & Extraction | 364 (100.0%) | 0 (0.0%) |
| Installation, Maintenance & Repair | 145 (96.0%) | 6 (4.0%) |
| Total (Category) | 509 (98.8%) | 6 (1.2%) |
| Total (Overall) | 2,463 (48.0%) | 2,664 (52.0%) |
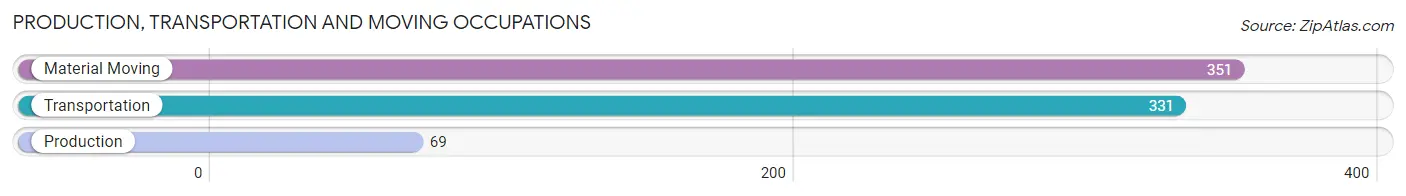
Production, Transportation and Moving Occupations
The most common Production, Transportation and Moving occupations in Forestville are Material Moving (351 | 6.9%), Transportation (331 | 6.5%), and Production (69 | 1.3%).
Production, Transportation and Moving Occupations by Sex
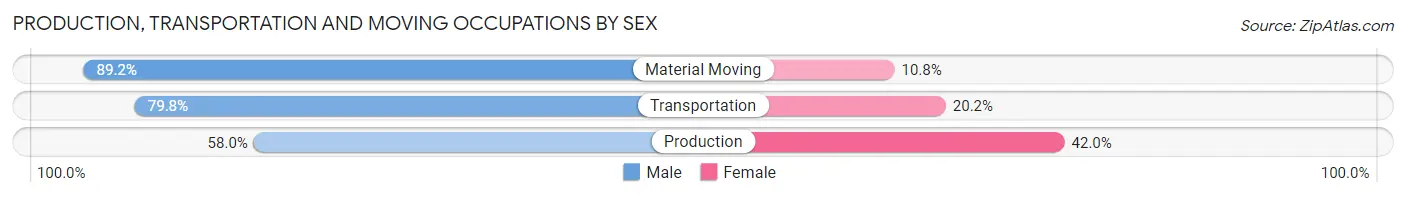
| Occupation | Male | Female |
| Production | 40 (58.0%) | 29 (42.0%) |
| Transportation | 264 (79.8%) | 67 (20.2%) |
| Material Moving | 313 (89.2%) | 38 (10.8%) |
| Total (Category) | 617 (82.2%) | 134 (17.8%) |
| Total (Overall) | 2,463 (48.0%) | 2,664 (52.0%) |
Employment Industries by Sex in Forestville
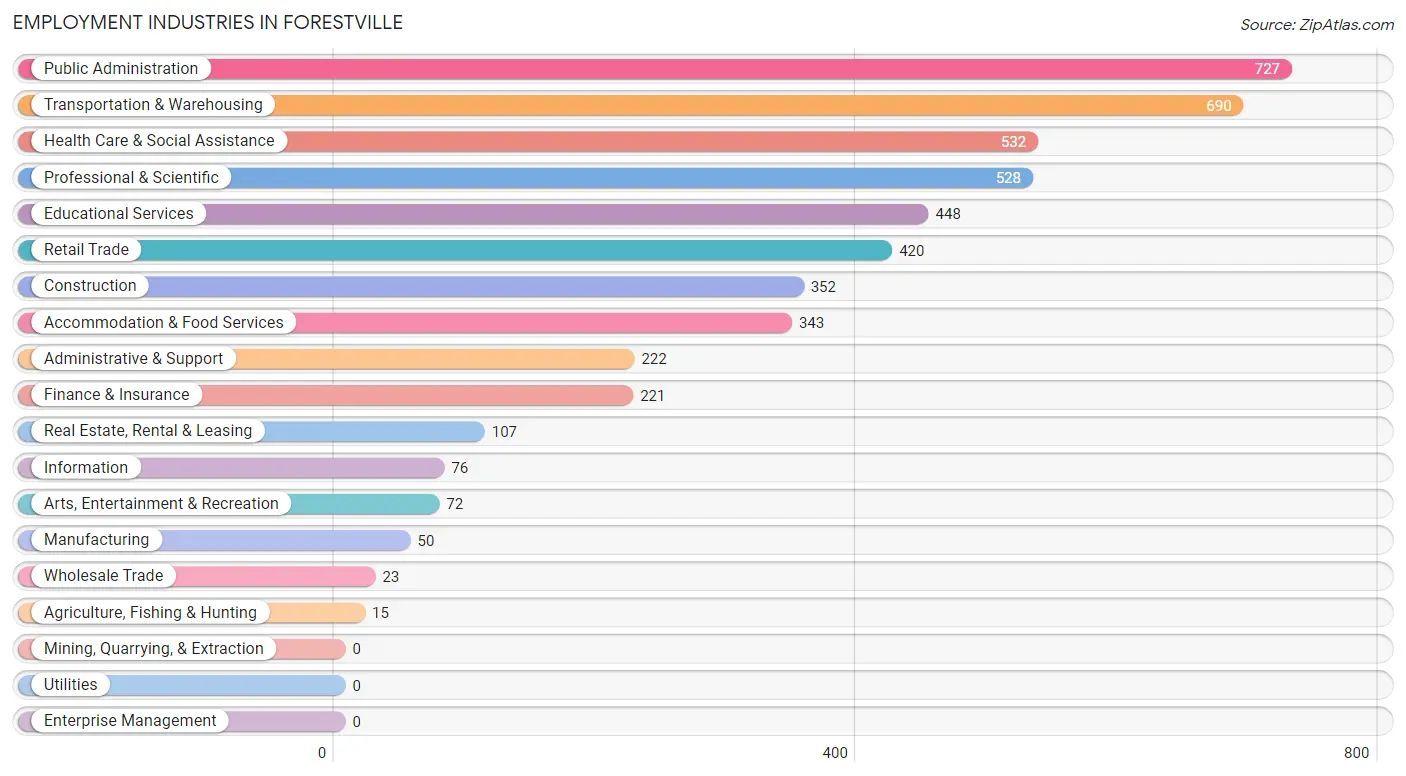
Employment Industries in Forestville
The major employment industries in Forestville include Public Administration (727 | 14.2%), Transportation & Warehousing (690 | 13.5%), Health Care & Social Assistance (532 | 10.4%), Professional & Scientific (528 | 10.3%), and Educational Services (448 | 8.7%).
Employment Industries by Sex in Forestville
The Forestville industries that see more men than women are Agriculture, Fishing & Hunting (100.0%), Wholesale Trade (100.0%), and Construction (91.8%), whereas the industries that tend to have a higher number of women are Manufacturing (100.0%), Finance & Insurance (100.0%), and Health Care & Social Assistance (71.6%).
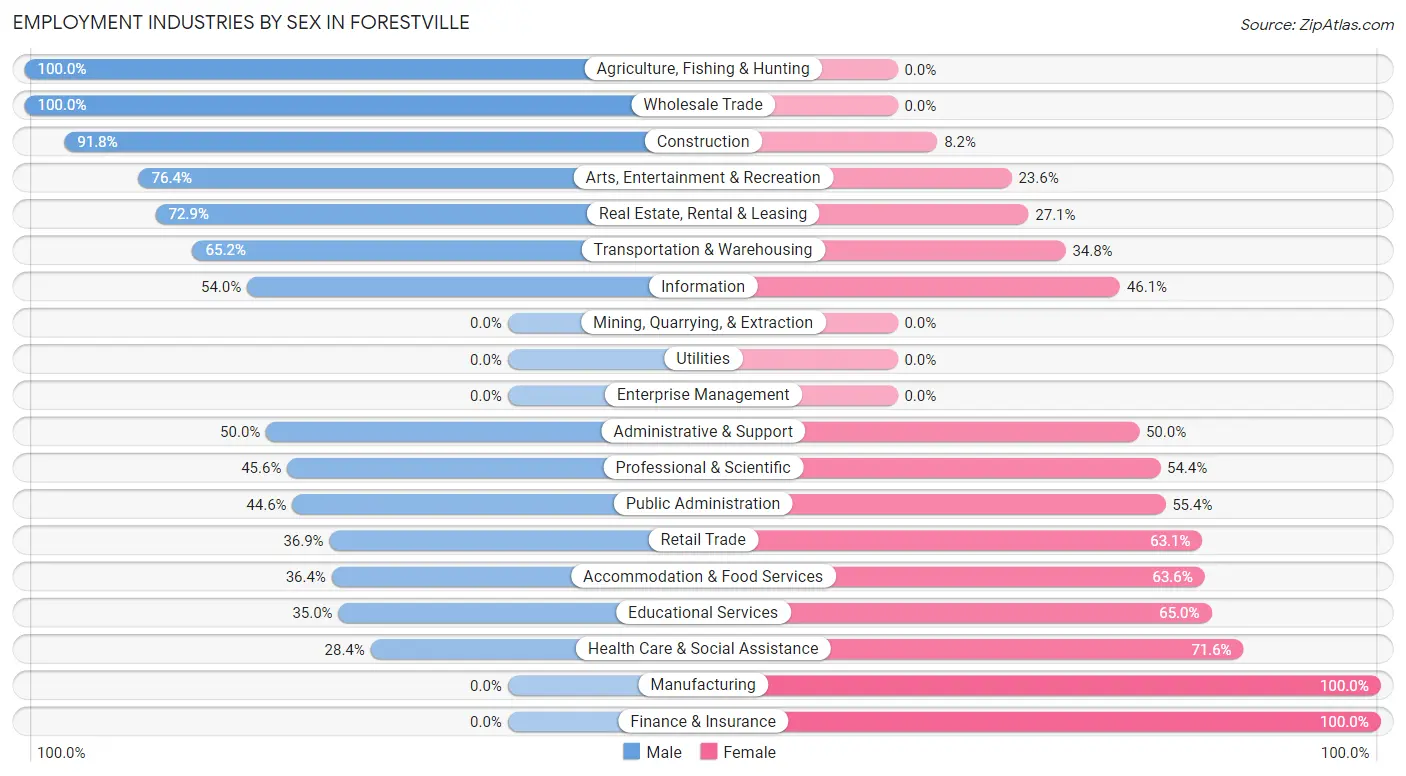
| Industry | Male | Female |
| Agriculture, Fishing & Hunting | 15 (100.0%) | 0 (0.0%) |
| Mining, Quarrying, & Extraction | 0 (0.0%) | 0 (0.0%) |
| Construction | 323 (91.8%) | 29 (8.2%) |
| Manufacturing | 0 (0.0%) | 50 (100.0%) |
| Wholesale Trade | 23 (100.0%) | 0 (0.0%) |
| Retail Trade | 155 (36.9%) | 265 (63.1%) |
| Transportation & Warehousing | 450 (65.2%) | 240 (34.8%) |
| Utilities | 0 (0.0%) | 0 (0.0%) |
| Information | 41 (53.9%) | 35 (46.1%) |
| Finance & Insurance | 0 (0.0%) | 221 (100.0%) |
| Real Estate, Rental & Leasing | 78 (72.9%) | 29 (27.1%) |
| Professional & Scientific | 241 (45.6%) | 287 (54.4%) |
| Enterprise Management | 0 (0.0%) | 0 (0.0%) |
| Administrative & Support | 111 (50.0%) | 111 (50.0%) |
| Educational Services | 157 (35.0%) | 291 (65.0%) |
| Health Care & Social Assistance | 151 (28.4%) | 381 (71.6%) |
| Arts, Entertainment & Recreation | 55 (76.4%) | 17 (23.6%) |
| Accommodation & Food Services | 125 (36.4%) | 218 (63.6%) |
| Public Administration | 324 (44.6%) | 403 (55.4%) |
| Total | 2,463 (48.0%) | 2,664 (52.0%) |
Education in Forestville
School Enrollment in Forestville
The most common levels of schooling among the 1,787 students in Forestville are elementary school (521 | 29.2%), high school (449 | 25.1%), and middle school (323 | 18.1%).
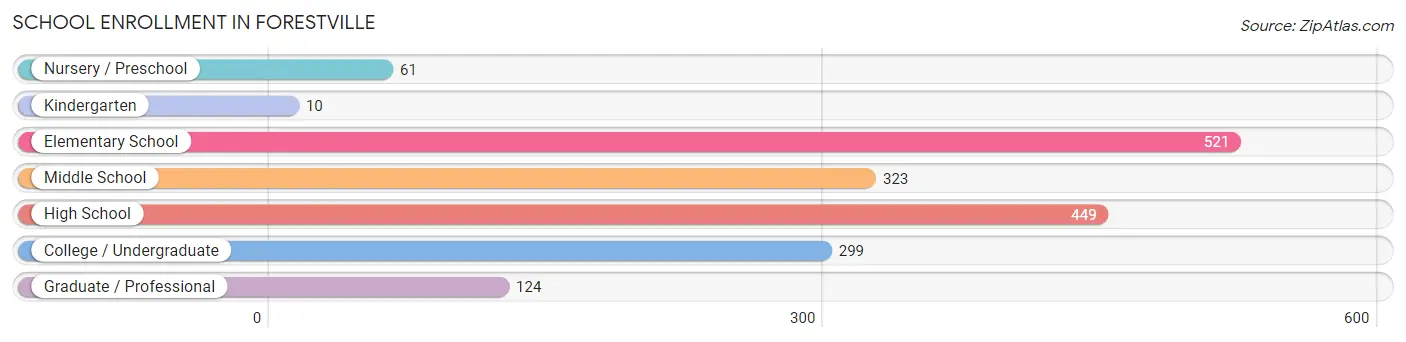
| School Level | # Students | % Students |
| Nursery / Preschool | 61 | 3.4% |
| Kindergarten | 10 | 0.6% |
| Elementary School | 521 | 29.2% |
| Middle School | 323 | 18.1% |
| High School | 449 | 25.1% |
| College / Undergraduate | 299 | 16.7% |
| Graduate / Professional | 124 | 6.9% |
| Total | 1,787 | 100.0% |
School Enrollment by Age by Funding Source in Forestville
Out of a total of 1,787 students who are enrolled in schools in Forestville, 206 (11.5%) attend a private institution, while the remaining 1,581 (88.5%) are enrolled in public schools. The age group of 35 years and over has the highest likelihood of being enrolled in private schools, with 49 (41.2% in the age bracket) enrolled. Conversely, the age group of 3 to 4 year olds has the lowest likelihood of being enrolled in a private school, with 50 (100.0% in the age bracket) attending a public institution.
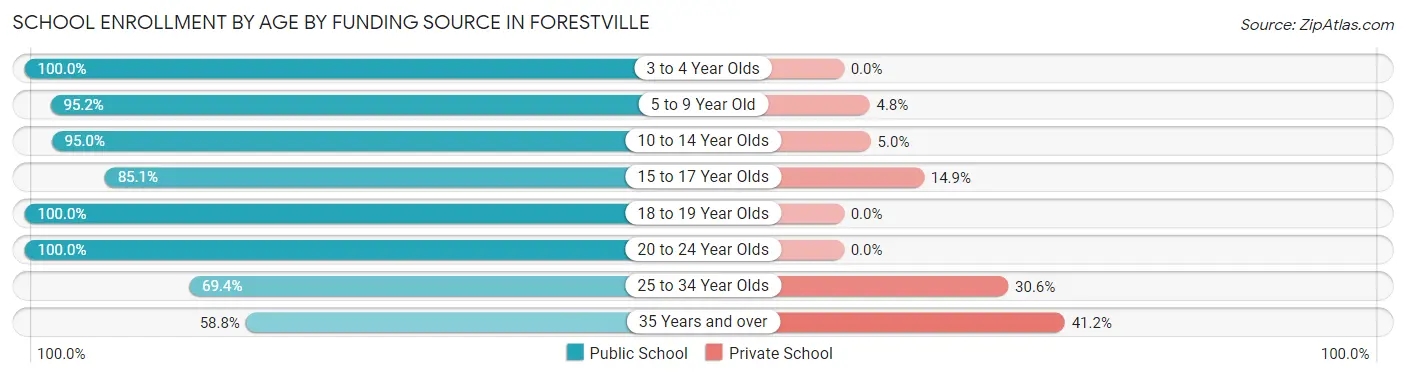
| Age Bracket | Public School | Private School |
| 3 to 4 Year Olds | 50 (100.0%) | 0 (0.0%) |
| 5 to 9 Year Old | 415 (95.2%) | 21 (4.8%) |
| 10 to 14 Year Olds | 472 (95.0%) | 25 (5.0%) |
| 15 to 17 Year Olds | 245 (85.1%) | 43 (14.9%) |
| 18 to 19 Year Olds | 144 (100.0%) | 0 (0.0%) |
| 20 to 24 Year Olds | 31 (100.0%) | 0 (0.0%) |
| 25 to 34 Year Olds | 154 (69.4%) | 68 (30.6%) |
| 35 Years and over | 70 (58.8%) | 49 (41.2%) |
| Total | 1,581 (88.5%) | 206 (11.5%) |
Educational Attainment by Field of Study in Forestville
Business (345 | 23.3%), arts & humanities (210 | 14.1%), social sciences (147 | 9.9%), communications (143 | 9.6%), and education (135 | 9.1%) are the most common fields of study among 1,484 individuals in Forestville who have obtained a bachelor's degree or higher.
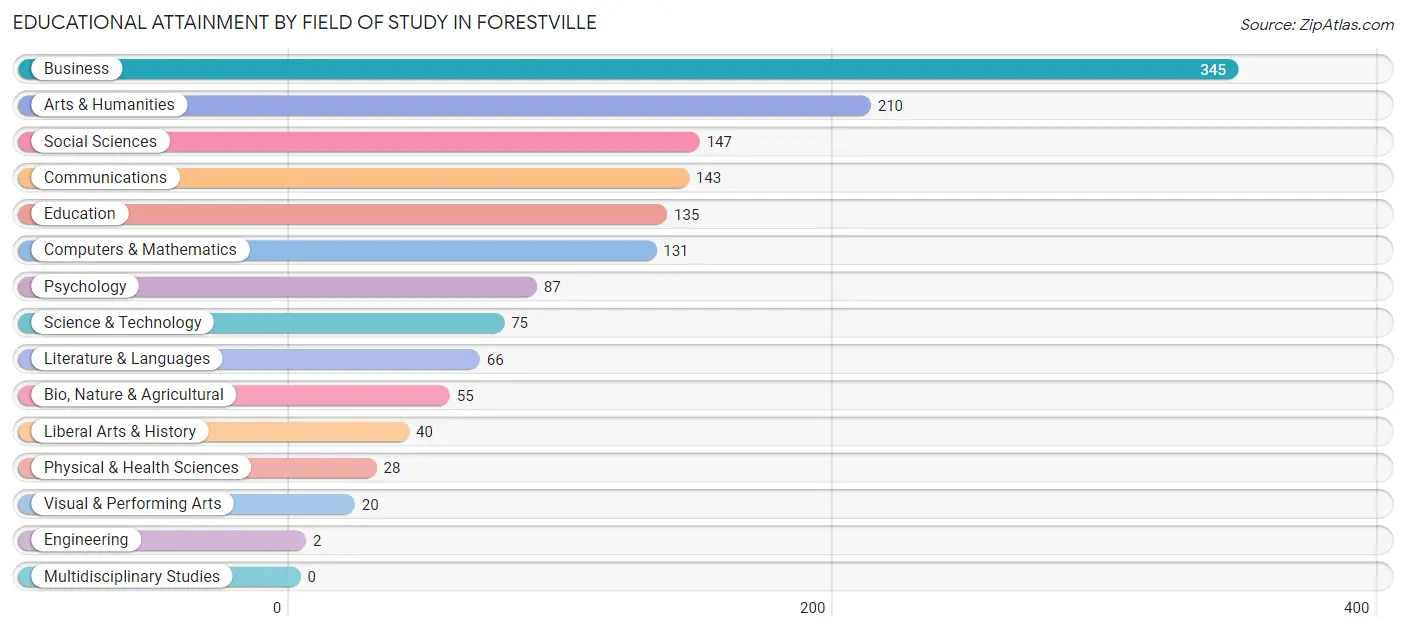
| Field of Study | # Graduates | % Graduates |
| Computers & Mathematics | 131 | 8.8% |
| Bio, Nature & Agricultural | 55 | 3.7% |
| Physical & Health Sciences | 28 | 1.9% |
| Psychology | 87 | 5.9% |
| Social Sciences | 147 | 9.9% |
| Engineering | 2 | 0.1% |
| Multidisciplinary Studies | 0 | 0.0% |
| Science & Technology | 75 | 5.1% |
| Business | 345 | 23.3% |
| Education | 135 | 9.1% |
| Literature & Languages | 66 | 4.4% |
| Liberal Arts & History | 40 | 2.7% |
| Visual & Performing Arts | 20 | 1.3% |
| Communications | 143 | 9.6% |
| Arts & Humanities | 210 | 14.1% |
| Total | 1,484 | 100.0% |
Transportation & Commute in Forestville
Vehicle Availability by Sex in Forestville
The most prevalent vehicle ownership categories in Forestville are males with 2 vehicles (859, accounting for 35.7%) and females with 2 vehicles (952, making up 32.4%).
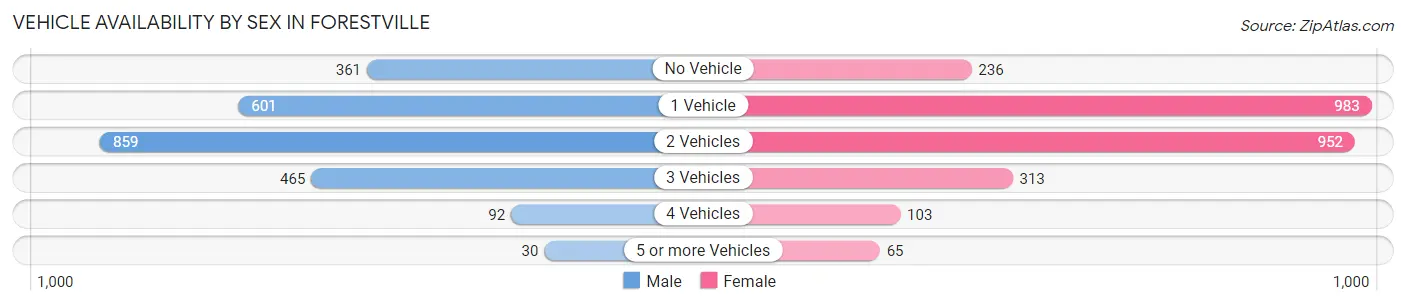
| Vehicles Available | Male | Female |
| No Vehicle | 361 (15.0%) | 236 (8.9%) |
| 1 Vehicle | 601 (25.0%) | 983 (37.1%) |
| 2 Vehicles | 859 (35.7%) | 952 (35.9%) |
| 3 Vehicles | 465 (19.3%) | 313 (11.8%) |
| 4 Vehicles | 92 (3.8%) | 103 (3.9%) |
| 5 or more Vehicles | 30 (1.3%) | 65 (2.5%) |
| Total | 2,408 (100.0%) | 2,652 (100.0%) |
Commute Time in Forestville
The most frequently occuring commute durations in Forestville are 30 to 34 minutes (1,124 commuters, 24.6%), 60 to 89 minutes (651 commuters, 14.2%), and 20 to 24 minutes (650 commuters, 14.2%).
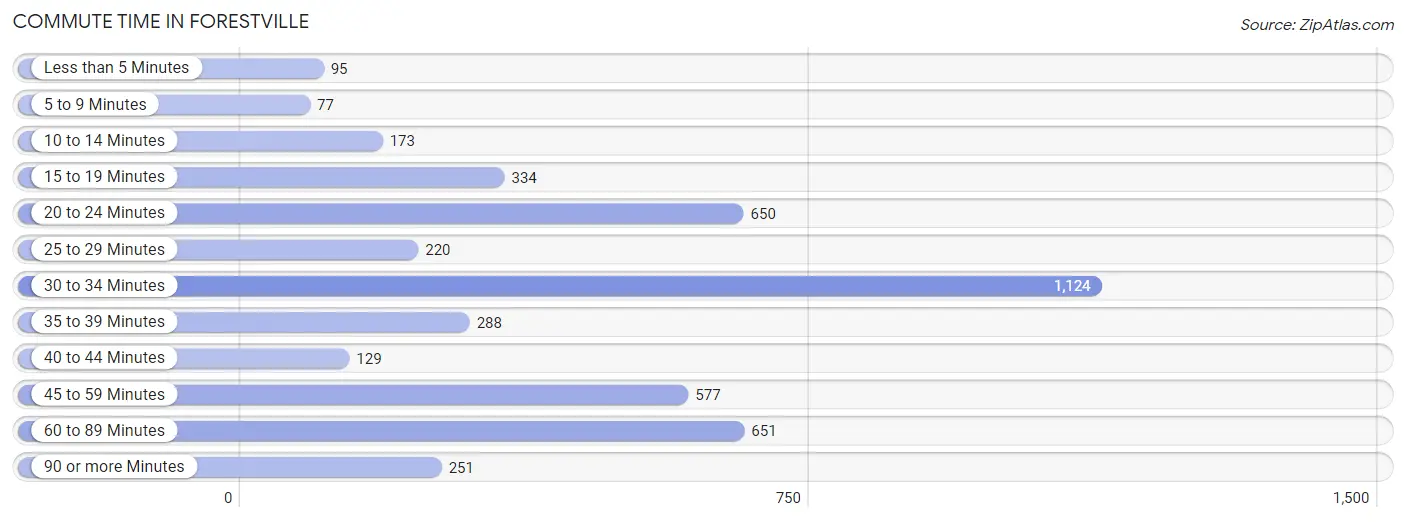
| Commute Time | # Commuters | % Commuters |
| Less than 5 Minutes | 95 | 2.1% |
| 5 to 9 Minutes | 77 | 1.7% |
| 10 to 14 Minutes | 173 | 3.8% |
| 15 to 19 Minutes | 334 | 7.3% |
| 20 to 24 Minutes | 650 | 14.2% |
| 25 to 29 Minutes | 220 | 4.8% |
| 30 to 34 Minutes | 1,124 | 24.6% |
| 35 to 39 Minutes | 288 | 6.3% |
| 40 to 44 Minutes | 129 | 2.8% |
| 45 to 59 Minutes | 577 | 12.6% |
| 60 to 89 Minutes | 651 | 14.2% |
| 90 or more Minutes | 251 | 5.5% |
Commute Time by Sex in Forestville
The most common commute times in Forestville are 30 to 34 minutes (528 commuters, 23.9%) for males and 30 to 34 minutes (596 commuters, 25.2%) for females.
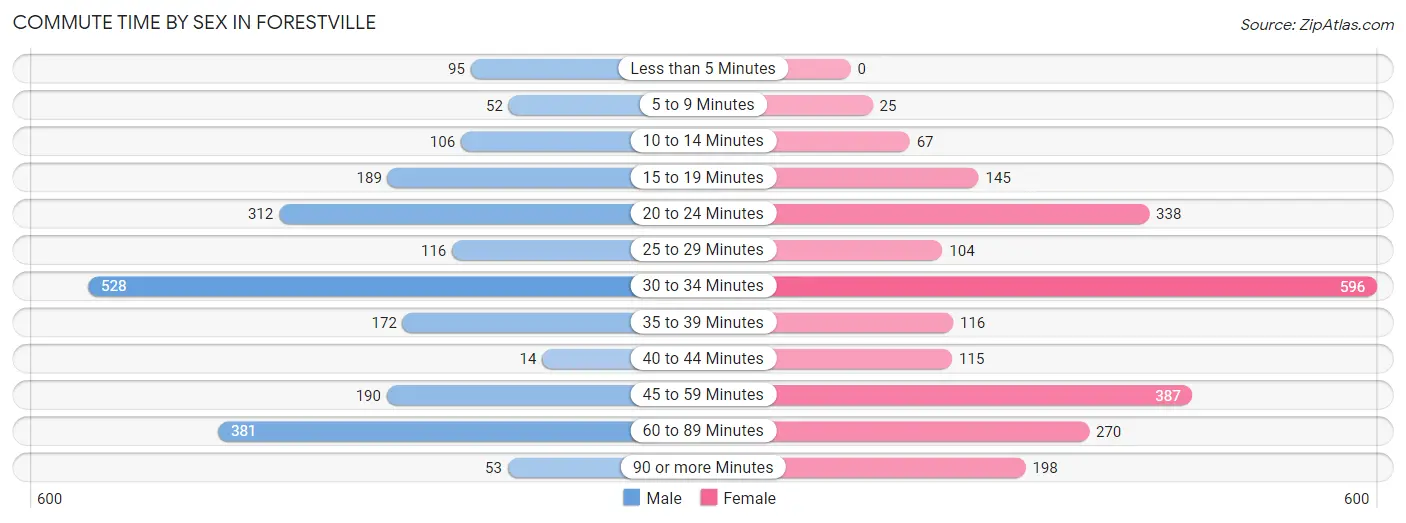
| Commute Time | Male | Female |
| Less than 5 Minutes | 95 (4.3%) | 0 (0.0%) |
| 5 to 9 Minutes | 52 (2.4%) | 25 (1.1%) |
| 10 to 14 Minutes | 106 (4.8%) | 67 (2.8%) |
| 15 to 19 Minutes | 189 (8.6%) | 145 (6.1%) |
| 20 to 24 Minutes | 312 (14.1%) | 338 (14.3%) |
| 25 to 29 Minutes | 116 (5.2%) | 104 (4.4%) |
| 30 to 34 Minutes | 528 (23.9%) | 596 (25.2%) |
| 35 to 39 Minutes | 172 (7.8%) | 116 (4.9%) |
| 40 to 44 Minutes | 14 (0.6%) | 115 (4.9%) |
| 45 to 59 Minutes | 190 (8.6%) | 387 (16.4%) |
| 60 to 89 Minutes | 381 (17.3%) | 270 (11.4%) |
| 90 or more Minutes | 53 (2.4%) | 198 (8.4%) |
Time of Departure to Work by Sex in Forestville
The most frequent times of departure to work in Forestville are 7:30 AM to 7:59 AM (347, 15.7%) for males and 6:00 AM to 6:29 AM (424, 18.0%) for females.
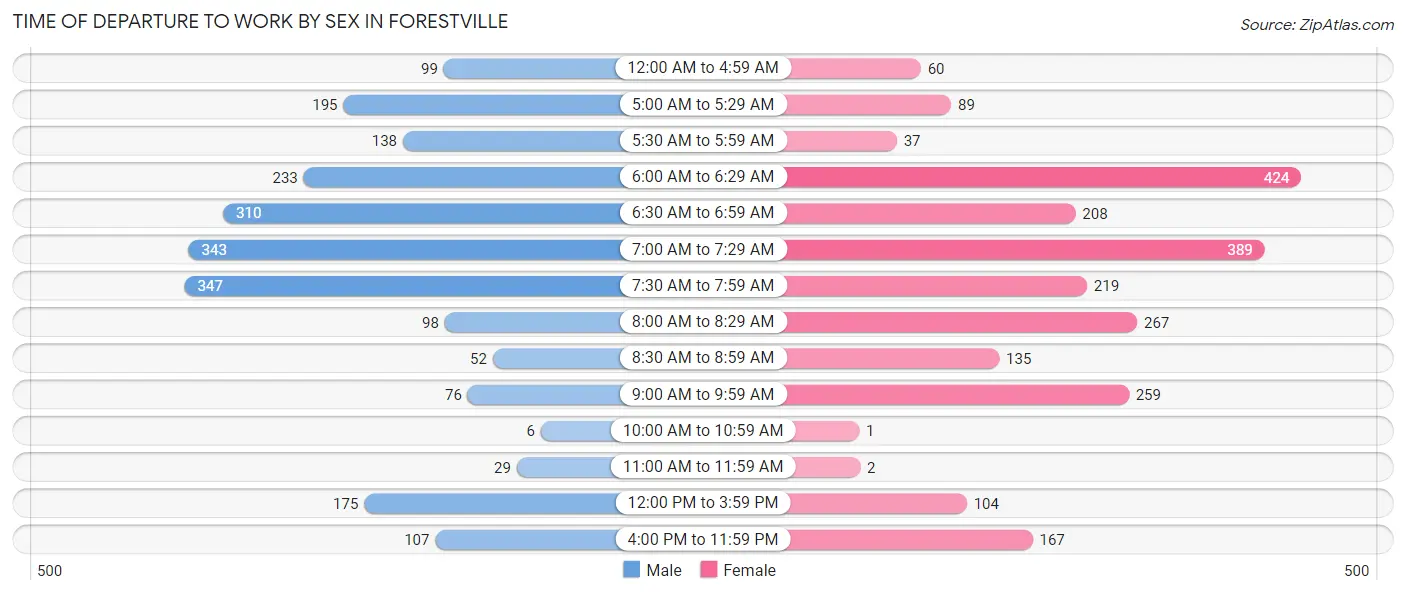
| Time of Departure | Male | Female |
| 12:00 AM to 4:59 AM | 99 (4.5%) | 60 (2.5%) |
| 5:00 AM to 5:29 AM | 195 (8.8%) | 89 (3.8%) |
| 5:30 AM to 5:59 AM | 138 (6.2%) | 37 (1.6%) |
| 6:00 AM to 6:29 AM | 233 (10.5%) | 424 (18.0%) |
| 6:30 AM to 6:59 AM | 310 (14.0%) | 208 (8.8%) |
| 7:00 AM to 7:29 AM | 343 (15.5%) | 389 (16.5%) |
| 7:30 AM to 7:59 AM | 347 (15.7%) | 219 (9.3%) |
| 8:00 AM to 8:29 AM | 98 (4.4%) | 267 (11.3%) |
| 8:30 AM to 8:59 AM | 52 (2.4%) | 135 (5.7%) |
| 9:00 AM to 9:59 AM | 76 (3.4%) | 259 (11.0%) |
| 10:00 AM to 10:59 AM | 6 (0.3%) | 1 (0.0%) |
| 11:00 AM to 11:59 AM | 29 (1.3%) | 2 (0.1%) |
| 12:00 PM to 3:59 PM | 175 (7.9%) | 104 (4.4%) |
| 4:00 PM to 11:59 PM | 107 (4.9%) | 167 (7.1%) |
| Total | 2,208 (100.0%) | 2,361 (100.0%) |
Housing Occupancy in Forestville
Occupancy by Ownership in Forestville
Of the total 4,352 dwellings in Forestville, owner-occupied units account for 2,904 (66.7%), while renter-occupied units make up 1,448 (33.3%).
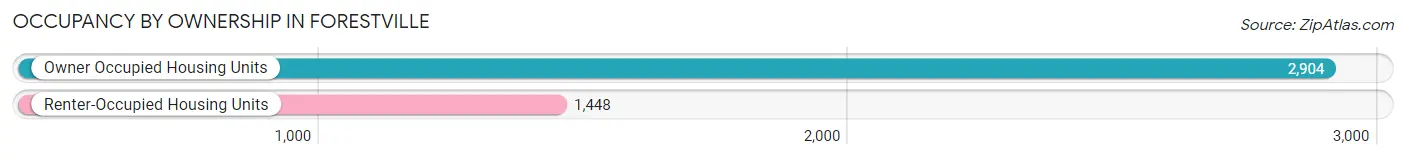
| Occupancy | # Housing Units | % Housing Units |
| Owner Occupied Housing Units | 2,904 | 66.7% |
| Renter-Occupied Housing Units | 1,448 | 33.3% |
| Total Occupied Housing Units | 4,352 | 100.0% |
Occupancy by Household Size in Forestville
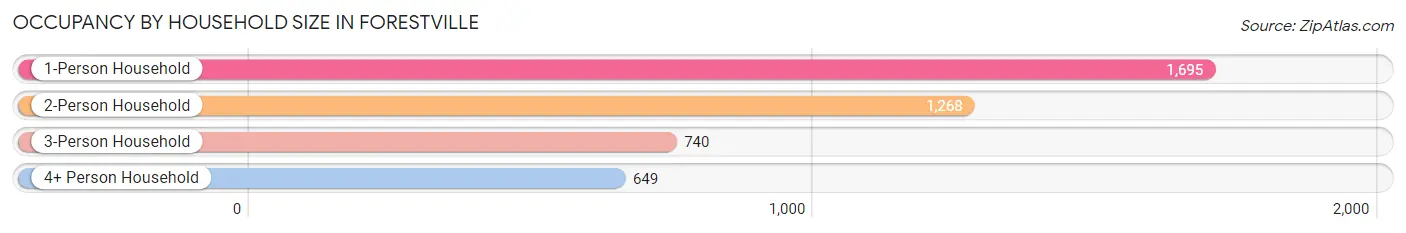
| Household Size | # Housing Units | % Housing Units |
| 1-Person Household | 1,695 | 39.0% |
| 2-Person Household | 1,268 | 29.1% |
| 3-Person Household | 740 | 17.0% |
| 4+ Person Household | 649 | 14.9% |
| Total Housing Units | 4,352 | 100.0% |
Occupancy by Ownership by Household Size in Forestville
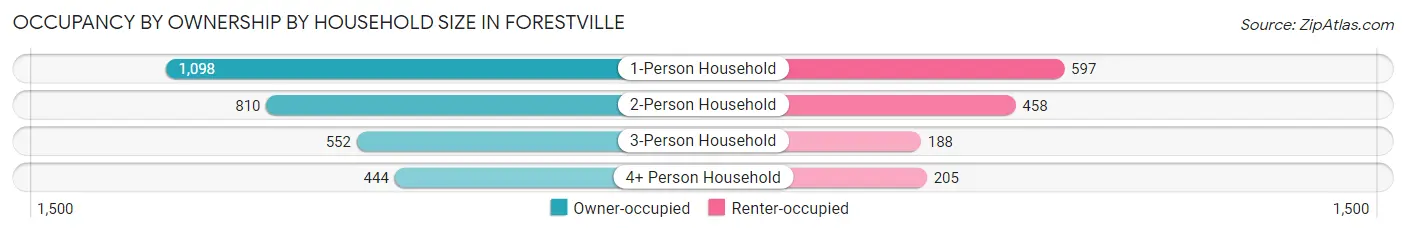
| Household Size | Owner-occupied | Renter-occupied |
| 1-Person Household | 1,098 (64.8%) | 597 (35.2%) |
| 2-Person Household | 810 (63.9%) | 458 (36.1%) |
| 3-Person Household | 552 (74.6%) | 188 (25.4%) |
| 4+ Person Household | 444 (68.4%) | 205 (31.6%) |
| Total Housing Units | 2,904 (66.7%) | 1,448 (33.3%) |
Occupancy by Educational Attainment in Forestville
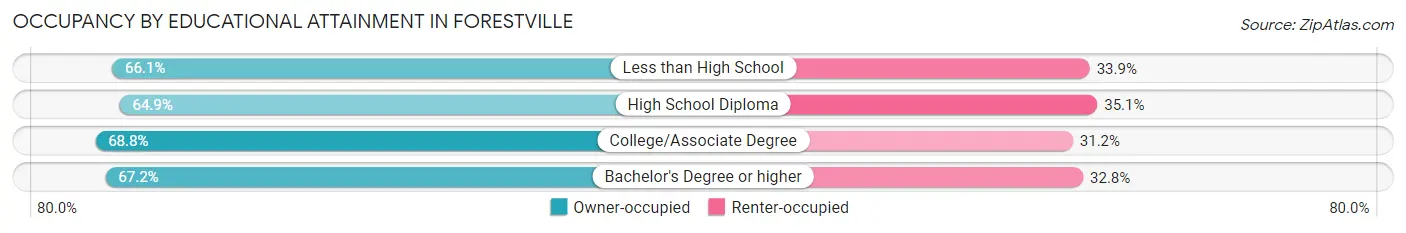
| Household Size | Owner-occupied | Renter-occupied |
| Less than High School | 285 (66.1%) | 146 (33.9%) |
| High School Diploma | 1,074 (64.9%) | 580 (35.1%) |
| College/Associate Degree | 937 (68.8%) | 425 (31.2%) |
| Bachelor's Degree or higher | 608 (67.2%) | 297 (32.8%) |
Occupancy by Age of Householder in Forestville
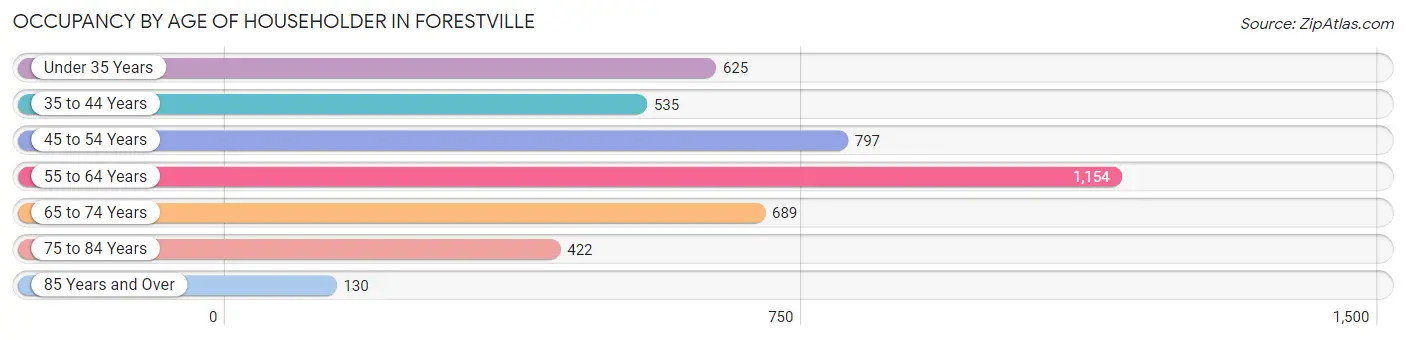
| Age Bracket | # Households | % Households |
| Under 35 Years | 625 | 14.4% |
| 35 to 44 Years | 535 | 12.3% |
| 45 to 54 Years | 797 | 18.3% |
| 55 to 64 Years | 1,154 | 26.5% |
| 65 to 74 Years | 689 | 15.8% |
| 75 to 84 Years | 422 | 9.7% |
| 85 Years and Over | 130 | 3.0% |
| Total | 4,352 | 100.0% |
Housing Finances in Forestville
Median Income by Occupancy in Forestville
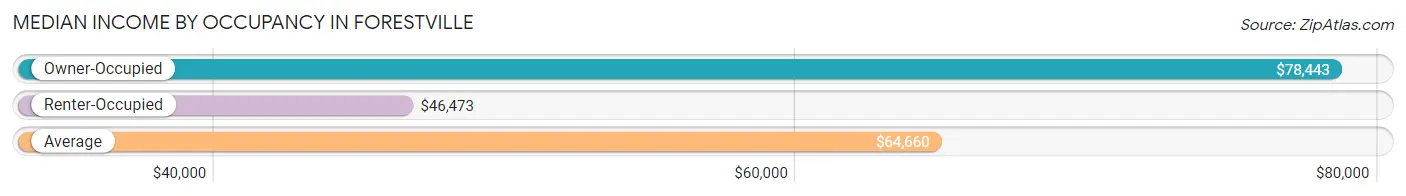
| Occupancy Type | # Households | Median Income |
| Owner-Occupied | 2,904 (66.7%) | $78,443 |
| Renter-Occupied | 1,448 (33.3%) | $46,473 |
| Average | 4,352 (100.0%) | $64,660 |
Occupancy by Householder Income Bracket in Forestville
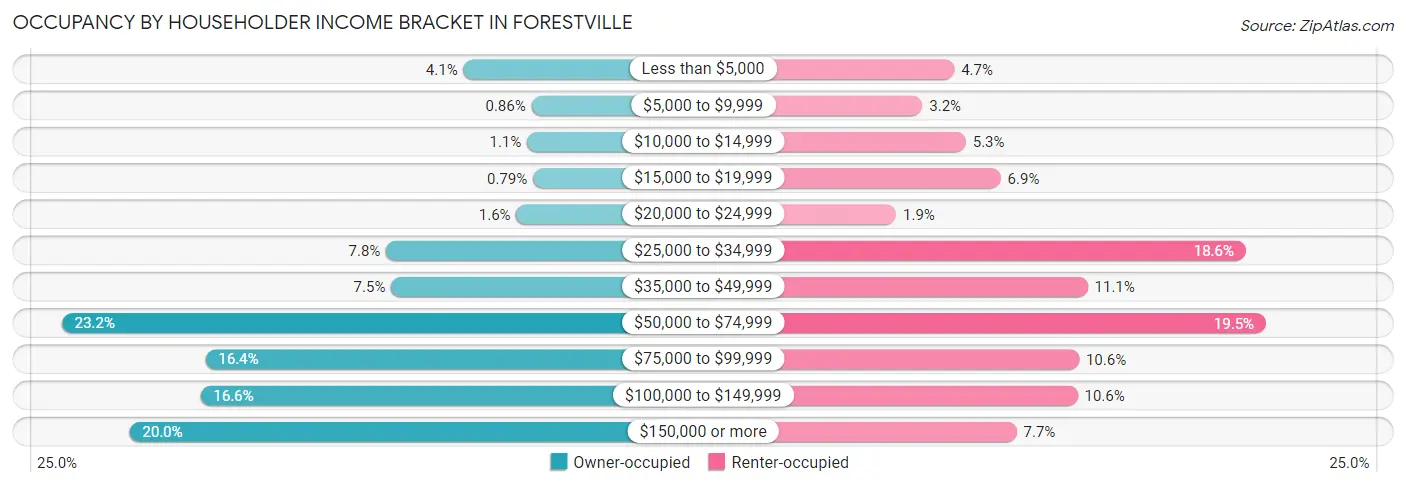
| Income Bracket | Owner-occupied | Renter-occupied |
| Less than $5,000 | 119 (4.1%) | 68 (4.7%) |
| $5,000 to $9,999 | 25 (0.9%) | 46 (3.2%) |
| $10,000 to $14,999 | 31 (1.1%) | 76 (5.2%) |
| $15,000 to $19,999 | 23 (0.8%) | 100 (6.9%) |
| $20,000 to $24,999 | 46 (1.6%) | 28 (1.9%) |
| $25,000 to $34,999 | 226 (7.8%) | 269 (18.6%) |
| $35,000 to $49,999 | 219 (7.5%) | 160 (11.1%) |
| $50,000 to $74,999 | 675 (23.2%) | 283 (19.5%) |
| $75,000 to $99,999 | 476 (16.4%) | 154 (10.6%) |
| $100,000 to $149,999 | 483 (16.6%) | 153 (10.6%) |
| $150,000 or more | 581 (20.0%) | 111 (7.7%) |
| Total | 2,904 (100.0%) | 1,448 (100.0%) |
Monthly Housing Cost Tiers in Forestville
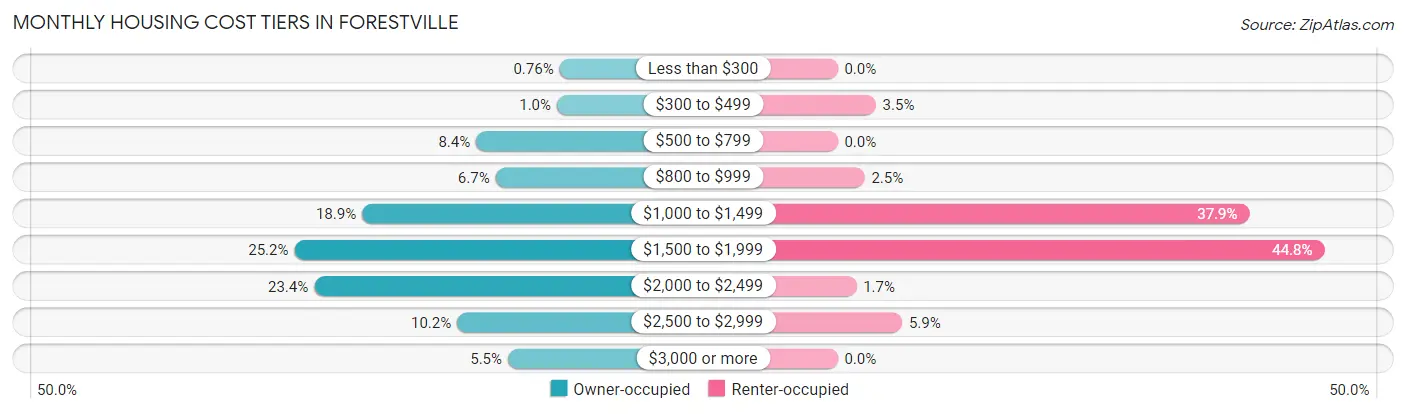
| Monthly Cost | Owner-occupied | Renter-occupied |
| Less than $300 | 22 (0.8%) | 0 (0.0%) |
| $300 to $499 | 29 (1.0%) | 51 (3.5%) |
| $500 to $799 | 245 (8.4%) | 0 (0.0%) |
| $800 to $999 | 193 (6.7%) | 36 (2.5%) |
| $1,000 to $1,499 | 550 (18.9%) | 549 (37.9%) |
| $1,500 to $1,999 | 731 (25.2%) | 649 (44.8%) |
| $2,000 to $2,499 | 678 (23.4%) | 25 (1.7%) |
| $2,500 to $2,999 | 296 (10.2%) | 86 (5.9%) |
| $3,000 or more | 160 (5.5%) | 0 (0.0%) |
| Total | 2,904 (100.0%) | 1,448 (100.0%) |
Physical Housing Characteristics in Forestville
Housing Structures in Forestville
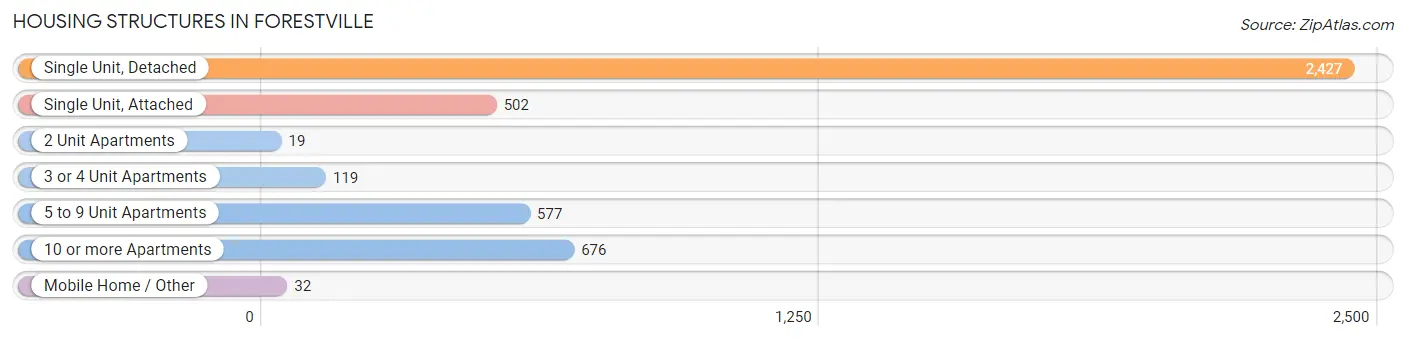
| Structure Type | # Housing Units | % Housing Units |
| Single Unit, Detached | 2,427 | 55.8% |
| Single Unit, Attached | 502 | 11.5% |
| 2 Unit Apartments | 19 | 0.4% |
| 3 or 4 Unit Apartments | 119 | 2.7% |
| 5 to 9 Unit Apartments | 577 | 13.3% |
| 10 or more Apartments | 676 | 15.5% |
| Mobile Home / Other | 32 | 0.7% |
| Total | 4,352 | 100.0% |
Housing Structures by Occupancy in Forestville
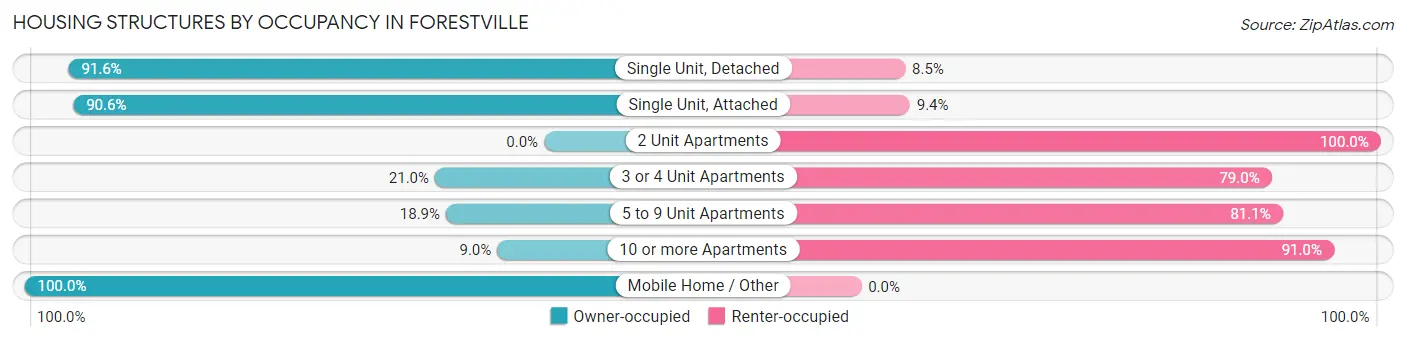
| Structure Type | Owner-occupied | Renter-occupied |
| Single Unit, Detached | 2,222 (91.5%) | 205 (8.5%) |
| Single Unit, Attached | 455 (90.6%) | 47 (9.4%) |
| 2 Unit Apartments | 0 (0.0%) | 19 (100.0%) |
| 3 or 4 Unit Apartments | 25 (21.0%) | 94 (79.0%) |
| 5 to 9 Unit Apartments | 109 (18.9%) | 468 (81.1%) |
| 10 or more Apartments | 61 (9.0%) | 615 (91.0%) |
| Mobile Home / Other | 32 (100.0%) | 0 (0.0%) |
| Total | 2,904 (66.7%) | 1,448 (33.3%) |
Housing Structures by Number of Rooms in Forestville
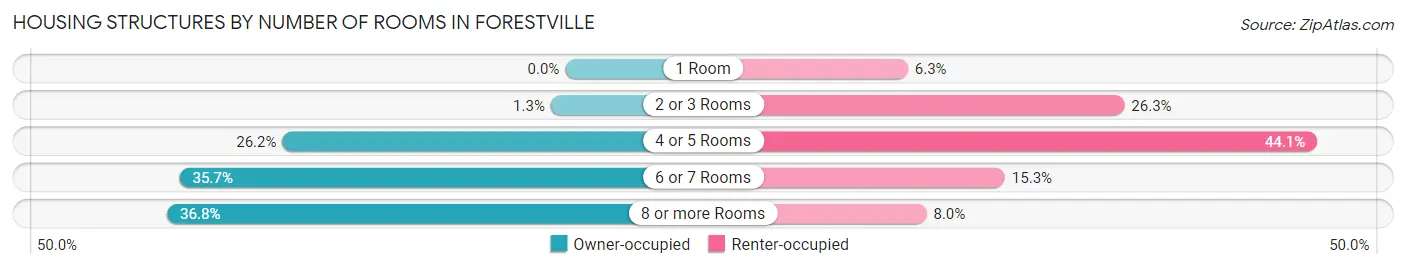
| Number of Rooms | Owner-occupied | Renter-occupied |
| 1 Room | 0 (0.0%) | 91 (6.3%) |
| 2 or 3 Rooms | 39 (1.3%) | 381 (26.3%) |
| 4 or 5 Rooms | 760 (26.2%) | 639 (44.1%) |
| 6 or 7 Rooms | 1,036 (35.7%) | 221 (15.3%) |
| 8 or more Rooms | 1,069 (36.8%) | 116 (8.0%) |
| Total | 2,904 (100.0%) | 1,448 (100.0%) |
Housing Structure by Heating Type in Forestville
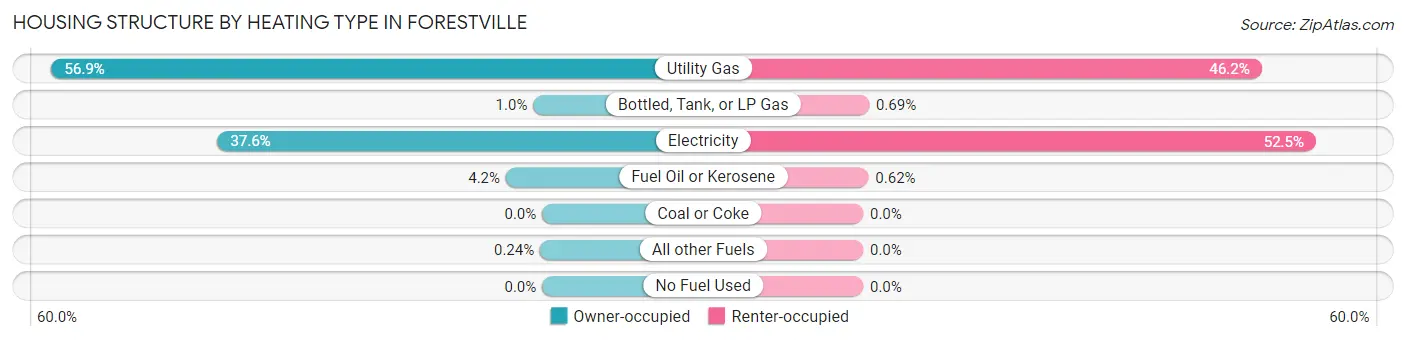
| Heating Type | Owner-occupied | Renter-occupied |
| Utility Gas | 1,652 (56.9%) | 669 (46.2%) |
| Bottled, Tank, or LP Gas | 30 (1.0%) | 10 (0.7%) |
| Electricity | 1,093 (37.6%) | 760 (52.5%) |
| Fuel Oil or Kerosene | 122 (4.2%) | 9 (0.6%) |
| Coal or Coke | 0 (0.0%) | 0 (0.0%) |
| All other Fuels | 7 (0.2%) | 0 (0.0%) |
| No Fuel Used | 0 (0.0%) | 0 (0.0%) |
| Total | 2,904 (100.0%) | 1,448 (100.0%) |
Household Vehicle Usage in Forestville
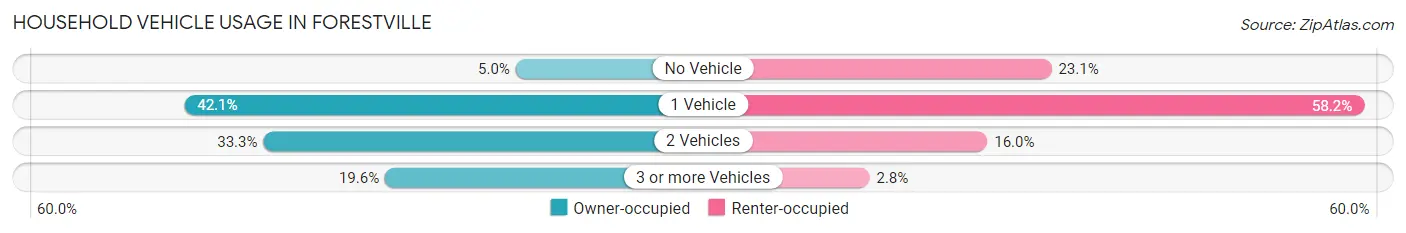
| Vehicles per Household | Owner-occupied | Renter-occupied |
| No Vehicle | 145 (5.0%) | 335 (23.1%) |
| 1 Vehicle | 1,223 (42.1%) | 842 (58.2%) |
| 2 Vehicles | 966 (33.3%) | 231 (16.0%) |
| 3 or more Vehicles | 570 (19.6%) | 40 (2.8%) |
| Total | 2,904 (100.0%) | 1,448 (100.0%) |
Real Estate & Mortgages in Forestville
Real Estate and Mortgage Overview in Forestville
| Characteristic | Without Mortgage | With Mortgage |
| Housing Units | 408 | 2,496 |
| Median Property Value | $288,100 | $323,200 |
| Median Household Income | $50,431 | $522 |
| Monthly Housing Costs | $768 | $160 |
| Real Estate Taxes | $3,824 | $163 |
Property Value by Mortgage Status in Forestville
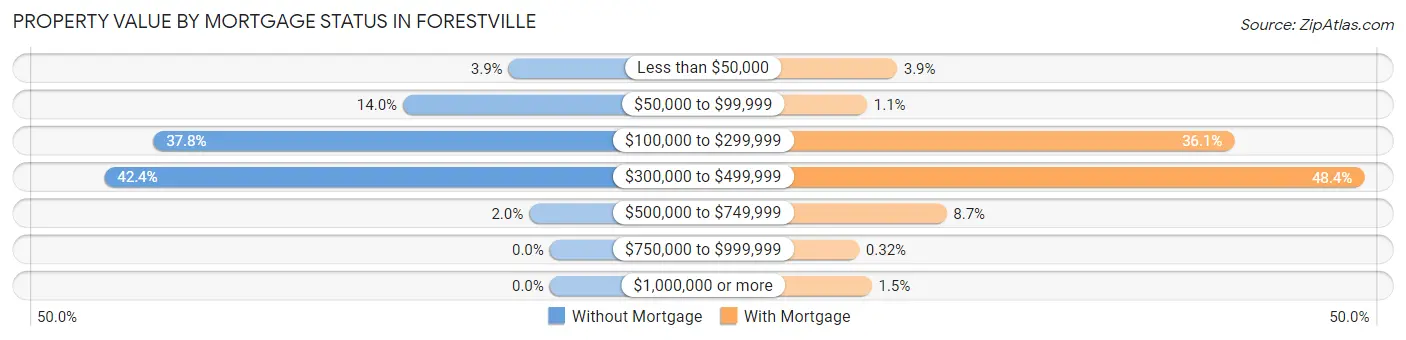
| Property Value | Without Mortgage | With Mortgage |
| Less than $50,000 | 16 (3.9%) | 98 (3.9%) |
| $50,000 to $99,999 | 57 (14.0%) | 27 (1.1%) |
| $100,000 to $299,999 | 154 (37.8%) | 900 (36.1%) |
| $300,000 to $499,999 | 173 (42.4%) | 1,209 (48.4%) |
| $500,000 to $749,999 | 8 (2.0%) | 216 (8.6%) |
| $750,000 to $999,999 | 0 (0.0%) | 8 (0.3%) |
| $1,000,000 or more | 0 (0.0%) | 38 (1.5%) |
| Total | 408 (100.0%) | 2,496 (100.0%) |
Household Income by Mortgage Status in Forestville
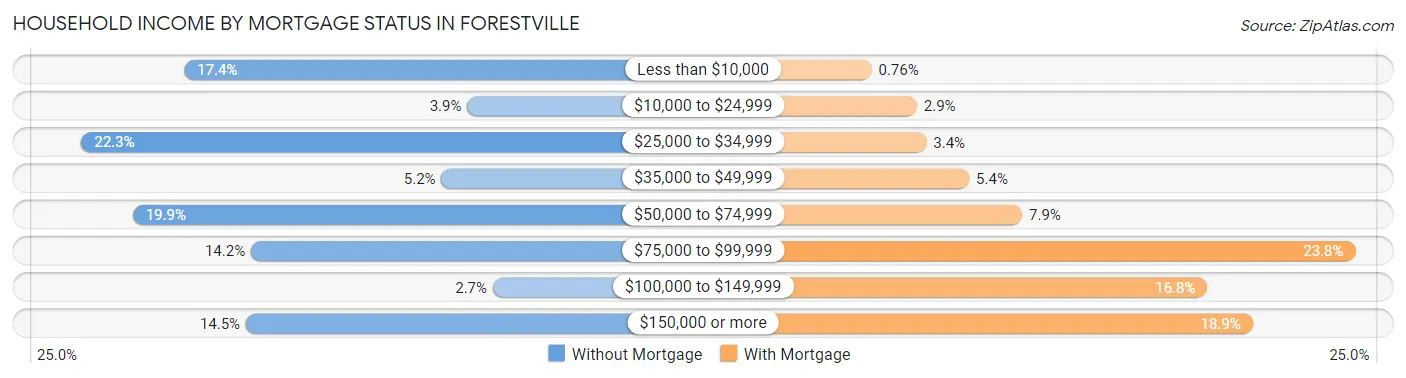
| Household Income | Without Mortgage | With Mortgage |
| Less than $10,000 | 71 (17.4%) | 19 (0.8%) |
| $10,000 to $24,999 | 16 (3.9%) | 73 (2.9%) |
| $25,000 to $34,999 | 91 (22.3%) | 84 (3.4%) |
| $35,000 to $49,999 | 21 (5.1%) | 135 (5.4%) |
| $50,000 to $74,999 | 81 (19.9%) | 198 (7.9%) |
| $75,000 to $99,999 | 58 (14.2%) | 594 (23.8%) |
| $100,000 to $149,999 | 11 (2.7%) | 418 (16.8%) |
| $150,000 or more | 59 (14.5%) | 472 (18.9%) |
| Total | 408 (100.0%) | 2,496 (100.0%) |
Property Value to Household Income Ratio in Forestville
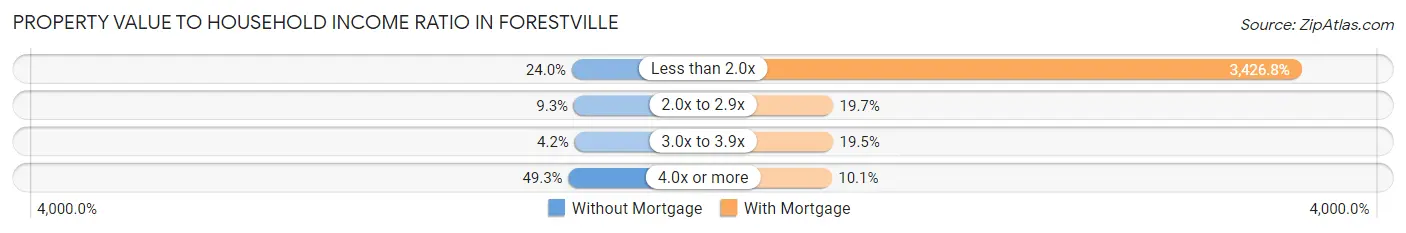
| Value-to-Income Ratio | Without Mortgage | With Mortgage |
| Less than 2.0x | 98 (24.0%) | 85,532 (3,426.8%) |
| 2.0x to 2.9x | 38 (9.3%) | 492 (19.7%) |
| 3.0x to 3.9x | 17 (4.2%) | 487 (19.5%) |
| 4.0x or more | 201 (49.3%) | 253 (10.1%) |
| Total | 408 (100.0%) | 2,496 (100.0%) |
Real Estate Taxes by Mortgage Status in Forestville
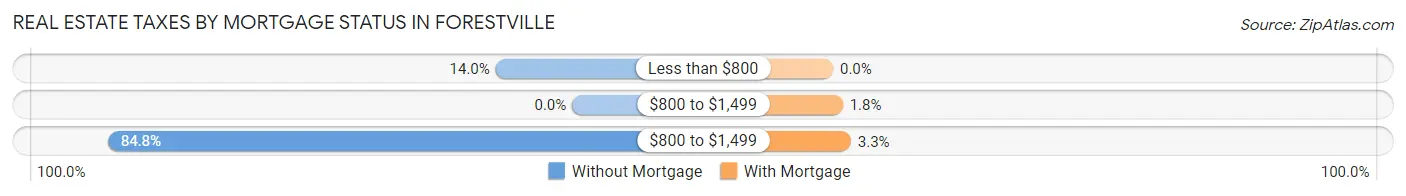
| Property Taxes | Without Mortgage | With Mortgage |
| Less than $800 | 57 (14.0%) | 0 (0.0%) |
| $800 to $1,499 | 0 (0.0%) | 44 (1.8%) |
| $800 to $1,499 | 346 (84.8%) | 81 (3.3%) |
| Total | 408 (100.0%) | 2,496 (100.0%) |
Health & Disability in Forestville
Health Insurance Coverage by Age in Forestville
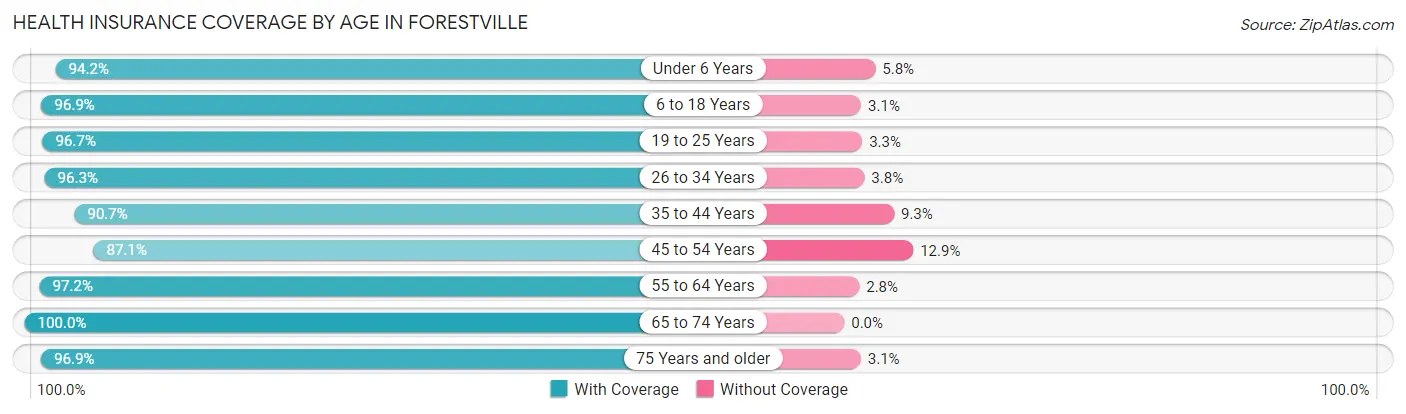
| Age Bracket | With Coverage | Without Coverage |
| Under 6 Years | 472 (94.2%) | 29 (5.8%) |
| 6 to 18 Years | 1,357 (96.9%) | 44 (3.1%) |
| 19 to 25 Years | 752 (96.7%) | 26 (3.3%) |
| 26 to 34 Years | 1,514 (96.3%) | 59 (3.7%) |
| 35 to 44 Years | 811 (90.7%) | 83 (9.3%) |
| 45 to 54 Years | 1,247 (87.1%) | 184 (12.9%) |
| 55 to 64 Years | 1,630 (97.2%) | 47 (2.8%) |
| 65 to 74 Years | 1,029 (100.0%) | 0 (0.0%) |
| 75 Years and older | 816 (96.9%) | 26 (3.1%) |
| Total | 9,628 (95.1%) | 498 (4.9%) |
Health Insurance Coverage by Citizenship Status in Forestville
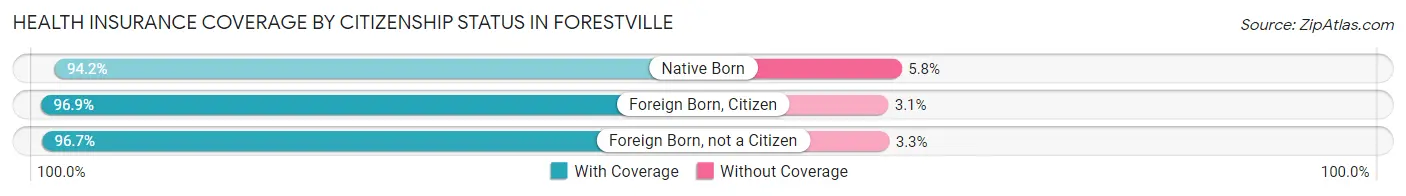
| Citizenship Status | With Coverage | Without Coverage |
| Native Born | 472 (94.2%) | 29 (5.8%) |
| Foreign Born, Citizen | 1,357 (96.9%) | 44 (3.1%) |
| Foreign Born, not a Citizen | 752 (96.7%) | 26 (3.3%) |
Health Insurance Coverage by Household Income in Forestville
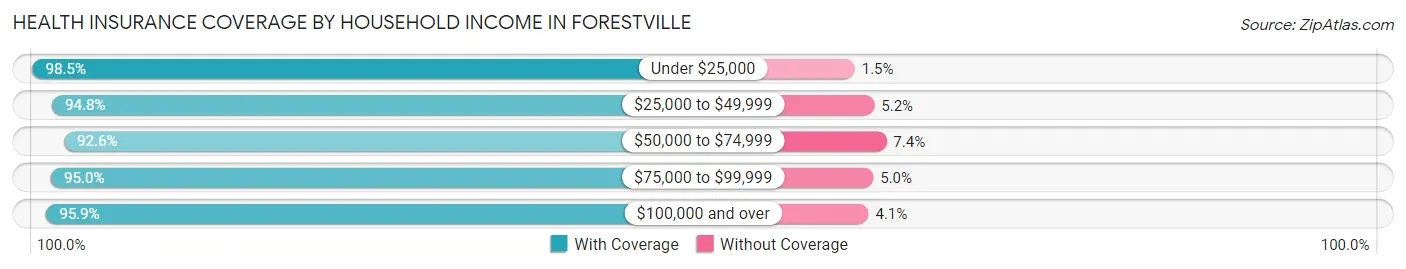
| Household Income | With Coverage | Without Coverage |
| Under $25,000 | 854 (98.5%) | 13 (1.5%) |
| $25,000 to $49,999 | 1,686 (94.8%) | 92 (5.2%) |
| $50,000 to $74,999 | 2,096 (92.6%) | 168 (7.4%) |
| $75,000 to $99,999 | 1,265 (95.0%) | 66 (5.0%) |
| $100,000 and over | 3,721 (95.9%) | 158 (4.1%) |
Public vs Private Health Insurance Coverage by Age in Forestville
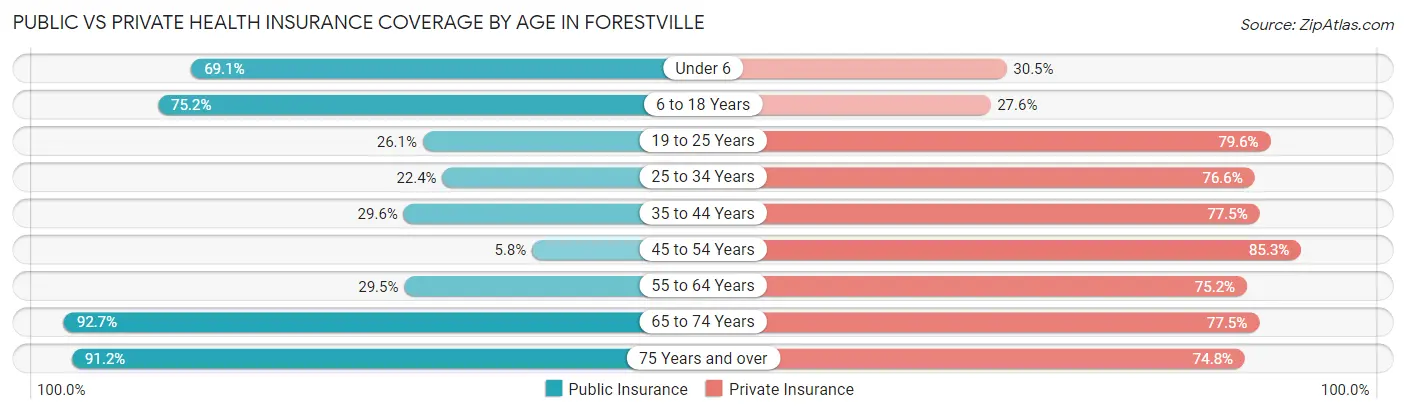
| Age Bracket | Public Insurance | Private Insurance |
| Under 6 | 346 (69.1%) | 153 (30.5%) |
| 6 to 18 Years | 1,054 (75.2%) | 386 (27.6%) |
| 19 to 25 Years | 203 (26.1%) | 619 (79.6%) |
| 25 to 34 Years | 353 (22.4%) | 1,205 (76.6%) |
| 35 to 44 Years | 265 (29.6%) | 693 (77.5%) |
| 45 to 54 Years | 83 (5.8%) | 1,220 (85.3%) |
| 55 to 64 Years | 495 (29.5%) | 1,261 (75.2%) |
| 65 to 74 Years | 954 (92.7%) | 797 (77.4%) |
| 75 Years and over | 768 (91.2%) | 630 (74.8%) |
| Total | 4,521 (44.7%) | 6,964 (68.8%) |
Disability Status by Sex by Age in Forestville
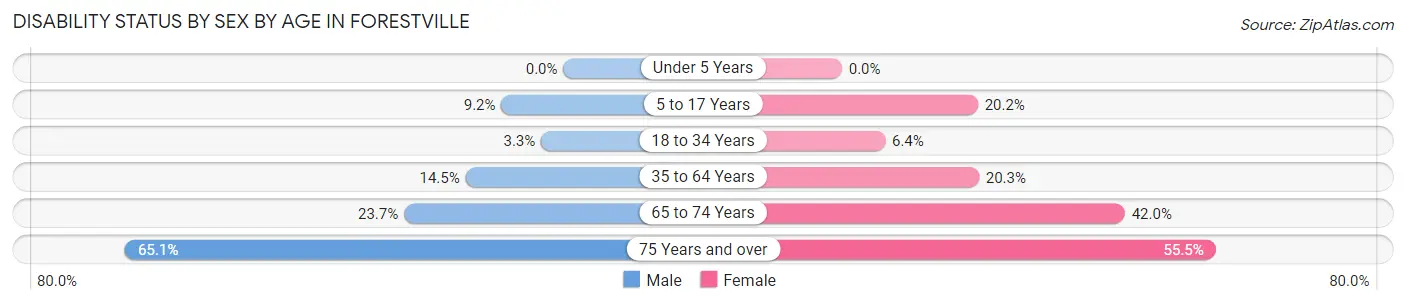
| Age Bracket | Male | Female |
| Under 5 Years | 0 (0.0%) | 0 (0.0%) |
| 5 to 17 Years | 74 (9.2%) | 112 (20.2%) |
| 18 to 34 Years | 42 (3.3%) | 75 (6.4%) |
| 35 to 64 Years | 252 (14.5%) | 461 (20.3%) |
| 65 to 74 Years | 88 (23.7%) | 276 (42.0%) |
| 75 Years and over | 276 (65.1%) | 232 (55.5%) |
Disability Class by Sex by Age in Forestville
Disability Class: Hearing Difficulty
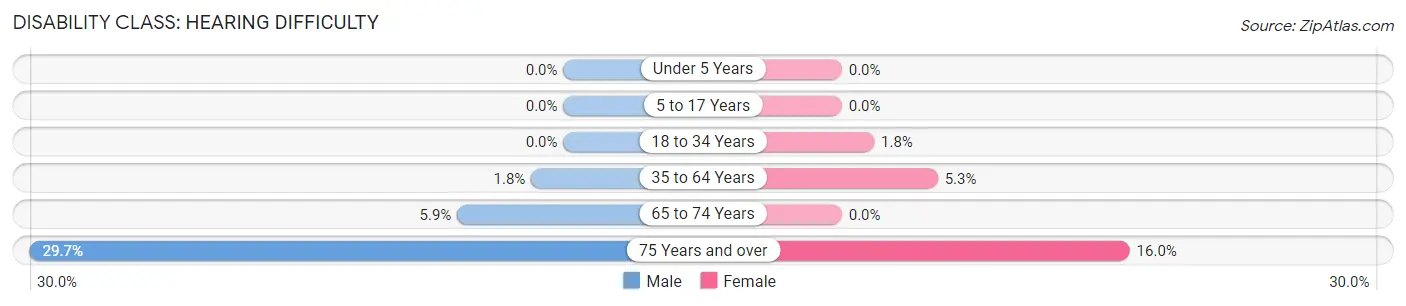
| Age Bracket | Male | Female |
| Under 5 Years | 0 (0.0%) | 0 (0.0%) |
| 5 to 17 Years | 0 (0.0%) | 0 (0.0%) |
| 18 to 34 Years | 0 (0.0%) | 21 (1.8%) |
| 35 to 64 Years | 31 (1.8%) | 121 (5.3%) |
| 65 to 74 Years | 22 (5.9%) | 0 (0.0%) |
| 75 Years and over | 126 (29.7%) | 67 (16.0%) |
Disability Class: Vision Difficulty
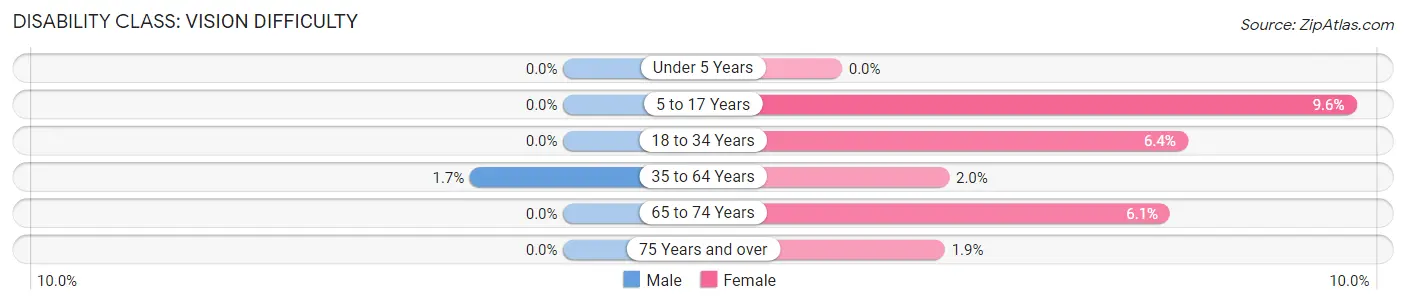
| Age Bracket | Male | Female |
| Under 5 Years | 0 (0.0%) | 0 (0.0%) |
| 5 to 17 Years | 0 (0.0%) | 53 (9.6%) |
| 18 to 34 Years | 0 (0.0%) | 75 (6.4%) |
| 35 to 64 Years | 30 (1.7%) | 45 (2.0%) |
| 65 to 74 Years | 0 (0.0%) | 40 (6.1%) |
| 75 Years and over | 0 (0.0%) | 8 (1.9%) |
Disability Class: Cognitive Difficulty
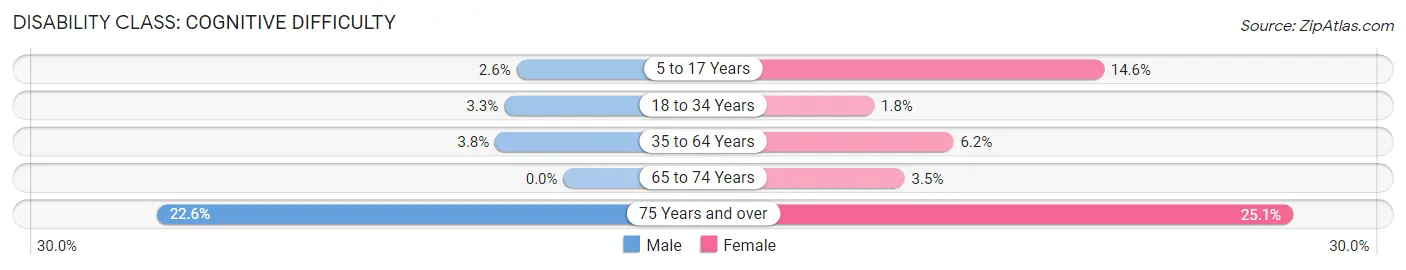
| Age Bracket | Male | Female |
| 5 to 17 Years | 21 (2.6%) | 81 (14.6%) |
| 18 to 34 Years | 42 (3.3%) | 21 (1.8%) |
| 35 to 64 Years | 66 (3.8%) | 141 (6.2%) |
| 65 to 74 Years | 0 (0.0%) | 23 (3.5%) |
| 75 Years and over | 96 (22.6%) | 105 (25.1%) |
Disability Class: Ambulatory Difficulty
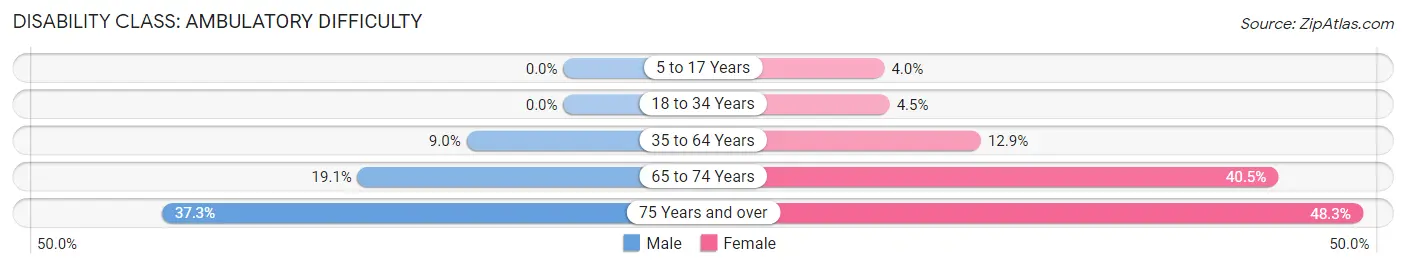
| Age Bracket | Male | Female |
| 5 to 17 Years | 0 (0.0%) | 22 (4.0%) |
| 18 to 34 Years | 0 (0.0%) | 52 (4.4%) |
| 35 to 64 Years | 156 (9.0%) | 293 (12.9%) |
| 65 to 74 Years | 71 (19.1%) | 266 (40.5%) |
| 75 Years and over | 158 (37.3%) | 202 (48.3%) |
Disability Class: Self-Care Difficulty
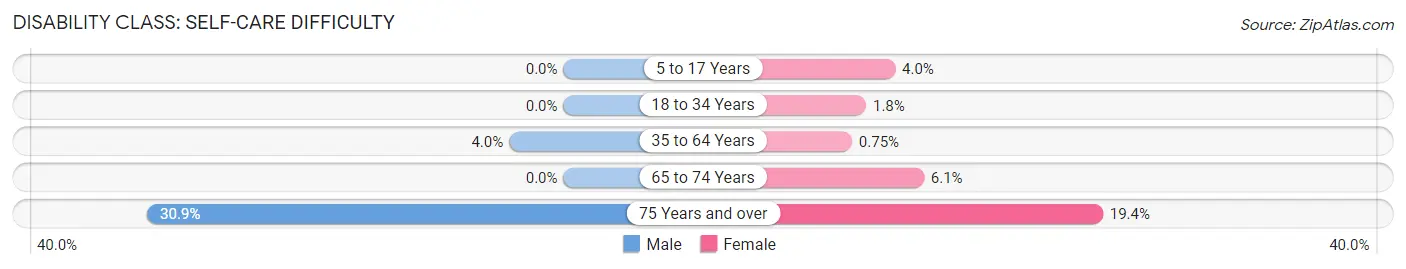
| Age Bracket | Male | Female |
| 5 to 17 Years | 0 (0.0%) | 22 (4.0%) |
| 18 to 34 Years | 0 (0.0%) | 21 (1.8%) |
| 35 to 64 Years | 70 (4.0%) | 17 (0.7%) |
| 65 to 74 Years | 0 (0.0%) | 40 (6.1%) |
| 75 Years and over | 131 (30.9%) | 81 (19.4%) |
Technology Access in Forestville
Computing Device Access in Forestville
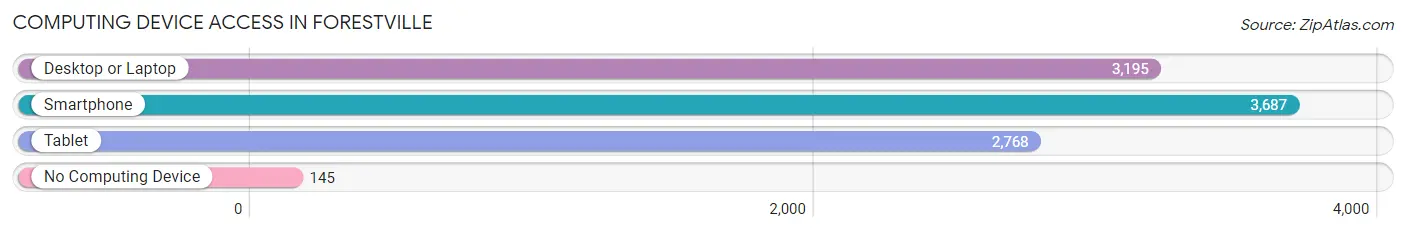
| Device Type | # Households | % Households |
| Desktop or Laptop | 3,195 | 73.4% |
| Smartphone | 3,687 | 84.7% |
| Tablet | 2,768 | 63.6% |
| No Computing Device | 145 | 3.3% |
| Total | 4,352 | 100.0% |
Internet Access in Forestville
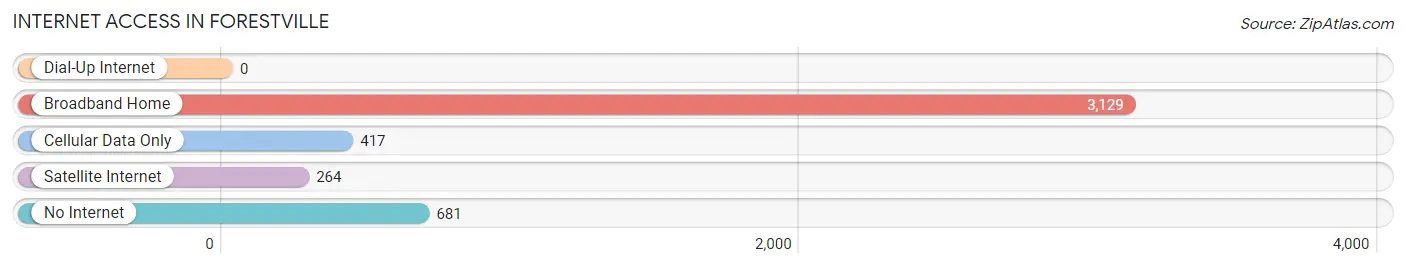
| Internet Type | # Households | % Households |
| Dial-Up Internet | 0 | 0.0% |
| Broadband Home | 3,129 | 71.9% |
| Cellular Data Only | 417 | 9.6% |
| Satellite Internet | 264 | 6.1% |
| No Internet | 681 | 15.7% |
| Total | 4,352 | 100.0% |
Forestville Summary
History
The town of Forestville, Maryland is located in Prince George’s County, just south of Washington, D.C. The area was first settled in the late 1700s by freed slaves and their descendants. The town was officially established in 1867 and was named after the nearby forest. The town was originally a farming community, but it soon became a popular destination for Washingtonians looking to escape the hustle and bustle of the city.
In the early 1900s, Forestville began to experience rapid growth. The town was home to a number of businesses, including a cannery, a brickyard, and a lumber mill. The town also had a number of churches, schools, and other amenities.
In the 1950s, Forestville began to experience a decline in population as many of its residents moved to the suburbs. The town was also affected by the construction of the Capital Beltway, which cut through the town and caused the demolition of many of its buildings.
In the late 1970s, the town began to experience a resurgence. The town was revitalized with the construction of a shopping center, a library, and a community center. The town also experienced an influx of new residents, many of whom were attracted by the town’s affordable housing and close proximity to Washington, D.C.
Today, Forestville is a vibrant community with a population of over 10,000. The town is home to a number of businesses, including restaurants, shops, and a movie theater. The town also has a number of parks and recreational facilities, including a skate park and a community pool.
Geography
Forestville is located in Prince George’s County, Maryland, just south of Washington, D.C. The town is situated on the banks of the Anacostia River, which forms the town’s western boundary. The town is bordered by the towns of Bladensburg to the north, Brentwood to the east, and Suitland to the south.
The town is located in a hilly area, with elevations ranging from 50 to 200 feet above sea level. The town is located in a temperate climate, with hot, humid summers and mild winters. The town receives an average of 43 inches of precipitation per year.
Economy
The economy of Forestville is largely based on the service industry. The town is home to a number of restaurants, shops, and other businesses. The town also has a number of government offices, including a post office and a library.
The town is also home to a number of manufacturing businesses, including a cannery, a brickyard, and a lumber mill. The town is also home to a number of construction companies, which are responsible for the construction of new homes and businesses in the area.
Demographics
As of the 2010 census, the population of Forestville was 10,622. The town has a diverse population, with a majority of African American residents (63.3%), followed by White (25.2%), Hispanic (5.3%), and Asian (3.2%) residents. The median household income in the town is $50,845, and the median home value is $223,000. The town has a high rate of homeownership, with over 70% of residents owning their homes.
Common Questions
What is Per Capita Income in Forestville?
Per Capita income in Forestville is $38,106.
What is the Median Family Income in Forestville?
Median Family Income in Forestville is $78,093.
What is the Median Household income in Forestville?
Median Household Income in Forestville is $64,660.
What is Income or Wage Gap in Forestville?
Income or Wage Gap in Forestville is 19.8%.
Women in Forestville earn 80.2 cents for every dollar earned by a man.
What is Inequality or Gini Index in Forestville?
Inequality or Gini Index in Forestville is 0.40.
What is the Total Population of Forestville?
Total Population of Forestville is 10,291.
What is the Total Male Population of Forestville?
Total Male Population of Forestville is 4,934.
What is the Total Female Population of Forestville?
Total Female Population of Forestville is 5,357.
What is the Ratio of Males per 100 Females in Forestville?
There are 92.10 Males per 100 Females in Forestville.
What is the Ratio of Females per 100 Males in Forestville?
There are 108.57 Females per 100 Males in Forestville.
What is the Median Population Age in Forestville?
Median Population Age in Forestville is 44.9 Years.
What is the Average Family Size in Forestville
Average Family Size in Forestville is 3.2 People.
What is the Average Household Size in Forestville
Average Household Size in Forestville is 2.3 People.
How Large is the Labor Force in Forestville?
There are 5,524 People in the Labor Forcein in Forestville.
What is the Percentage of People in the Labor Force in Forestville?
63.5% of People are in the Labor Force in Forestville.
What is the Unemployment Rate in Forestville?
Unemployment Rate in Forestville is 7.2%.