Edmonston, MD Map & Demographics
Edmonston Map
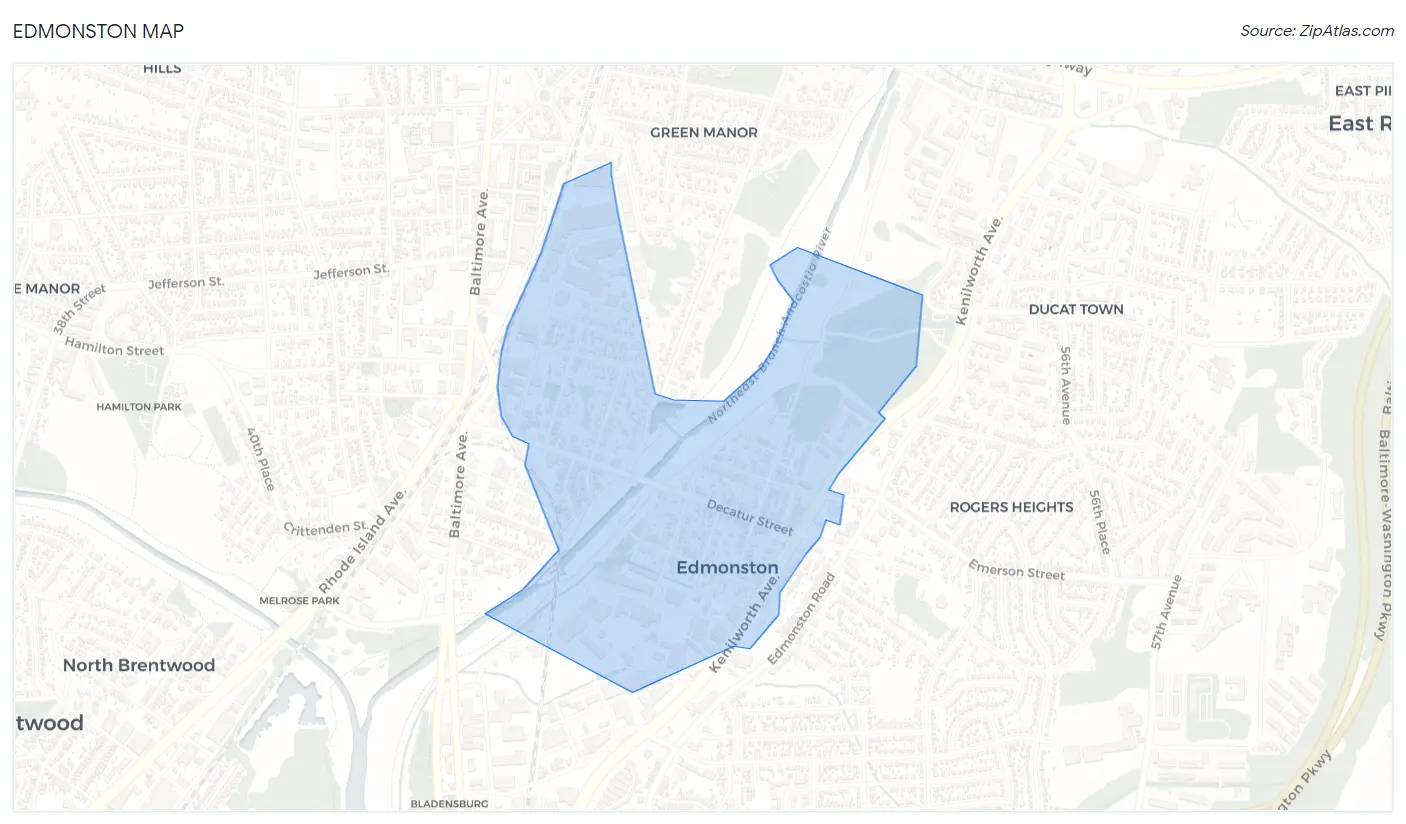
Edmonston Overview
$25,470
PER CAPITA INCOME
$92,333
AVG FAMILY INCOME
$88,750
AVG HOUSEHOLD INCOME
36.7%
WAGE / INCOME GAP [ % ]
63.3¢/ $1
WAGE / INCOME GAP [ $ ]
$20,900
FAMILY INCOME DEFICIT
0.32
INEQUALITY / GINI INDEX
1,751
TOTAL POPULATION
884
MALE POPULATION
867
FEMALE POPULATION
101.96
MALES / 100 FEMALES
98.08
FEMALES / 100 MALES
28.6
MEDIAN AGE
4.6
AVG FAMILY SIZE
3.9
AVG HOUSEHOLD SIZE
923
LABOR FORCE [ PEOPLE ]
75.4%
PERCENT IN LABOR FORCE
10.3%
UNEMPLOYMENT RATE
Income in Edmonston
Income Overview in Edmonston
Per Capita Income in Edmonston is $25,470, while median incomes of families and households are $92,333 and $88,750 respectively.
| Characteristic | Number | Measure |
| Per Capita Income | 1,751 | $25,470 |
| Median Family Income | 332 | $92,333 |
| Mean Family Income | 332 | $98,767 |
| Median Household Income | 449 | $88,750 |
| Mean Household Income | 449 | $94,799 |
| Income Deficit | 332 | $20,900 |
| Wage / Income Gap (%) | 1,751 | 36.71% |
| Wage / Income Gap ($) | 1,751 | 63.29¢ per $1 |
| Gini / Inequality Index | 1,751 | 0.32 |
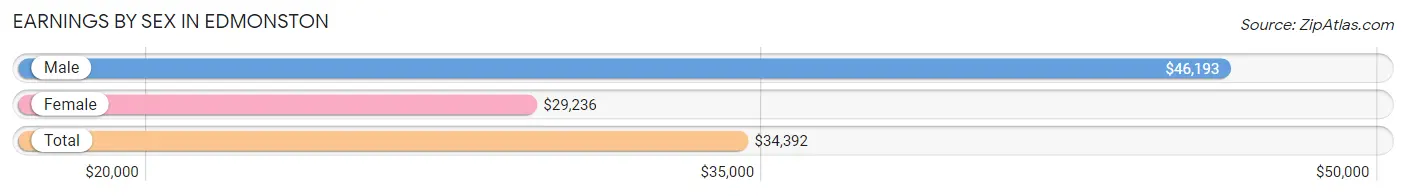
Earnings by Sex in Edmonston
Average Earnings in Edmonston are $34,392, $46,193 for men and $29,236 for women, a difference of 36.7%.
| Sex | Number | Average Earnings |
| Male | 492 (53.3%) | $46,193 |
| Female | 431 (46.7%) | $29,236 |
| Total | 923 (100.0%) | $34,392 |
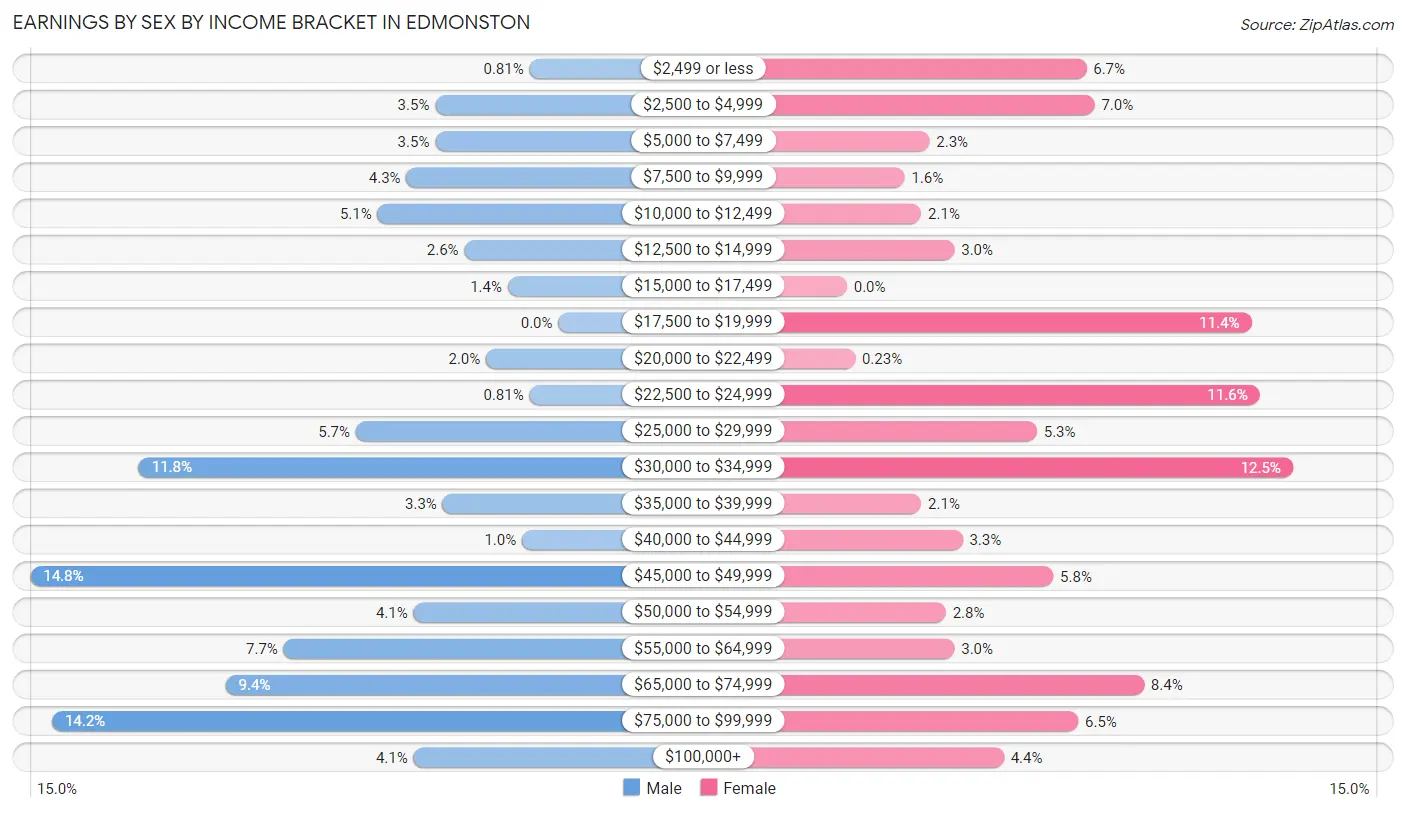
Earnings by Sex by Income Bracket in Edmonston
The most common earnings brackets in Edmonston are $45,000 to $49,999 for men (73 | 14.8%) and $30,000 to $34,999 for women (54 | 12.5%).
| Income | Male | Female |
| $2,499 or less | 4 (0.8%) | 29 (6.7%) |
| $2,500 to $4,999 | 17 (3.5%) | 30 (7.0%) |
| $5,000 to $7,499 | 17 (3.5%) | 10 (2.3%) |
| $7,500 to $9,999 | 21 (4.3%) | 7 (1.6%) |
| $10,000 to $12,499 | 25 (5.1%) | 9 (2.1%) |
| $12,500 to $14,999 | 13 (2.6%) | 13 (3.0%) |
| $15,000 to $17,499 | 7 (1.4%) | 0 (0.0%) |
| $17,500 to $19,999 | 0 (0.0%) | 49 (11.4%) |
| $20,000 to $22,499 | 10 (2.0%) | 1 (0.2%) |
| $22,500 to $24,999 | 4 (0.8%) | 50 (11.6%) |
| $25,000 to $29,999 | 28 (5.7%) | 23 (5.3%) |
| $30,000 to $34,999 | 58 (11.8%) | 54 (12.5%) |
| $35,000 to $39,999 | 16 (3.3%) | 9 (2.1%) |
| $40,000 to $44,999 | 5 (1.0%) | 14 (3.3%) |
| $45,000 to $49,999 | 73 (14.8%) | 25 (5.8%) |
| $50,000 to $54,999 | 20 (4.1%) | 12 (2.8%) |
| $55,000 to $64,999 | 38 (7.7%) | 13 (3.0%) |
| $65,000 to $74,999 | 46 (9.3%) | 36 (8.4%) |
| $75,000 to $99,999 | 70 (14.2%) | 28 (6.5%) |
| $100,000+ | 20 (4.1%) | 19 (4.4%) |
| Total | 492 (100.0%) | 431 (100.0%) |
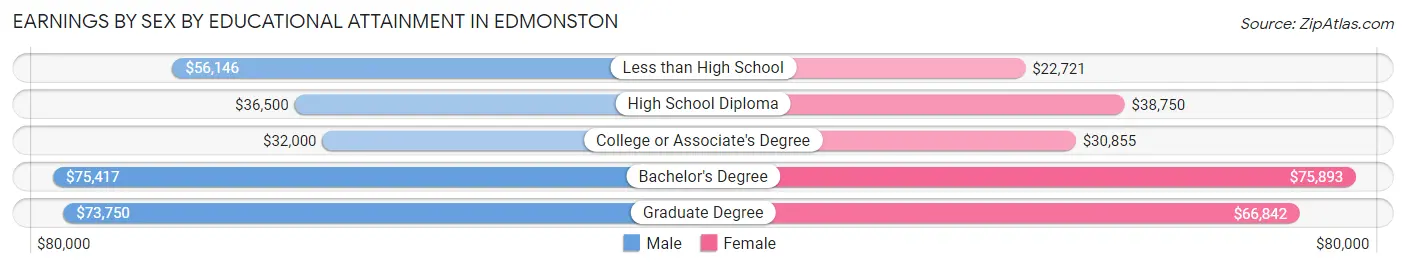
Earnings by Sex by Educational Attainment in Edmonston
Average earnings in Edmonston are $49,612 for men and $32,150 for women, a difference of 35.2%. Men with an educational attainment of bachelor's degree enjoy the highest average annual earnings of $75,417, while those with college or associate's degree education earn the least with $32,000. Women with an educational attainment of bachelor's degree earn the most with the average annual earnings of $75,893, while those with less than high school education have the smallest earnings of $22,721.
| Educational Attainment | Male Income | Female Income |
| Less than High School | $56,146 | $22,721 |
| High School Diploma | $36,500 | $38,750 |
| College or Associate's Degree | $32,000 | $30,855 |
| Bachelor's Degree | $75,417 | $75,893 |
| Graduate Degree | $73,750 | $66,842 |
| Total | $49,612 | $32,150 |
Family Income in Edmonston
Family Income Brackets in Edmonston
According to the Edmonston family income data, there are 112 families falling into the $100,000 to $149,999 income range, which is the most common income bracket and makes up 33.7% of all families.
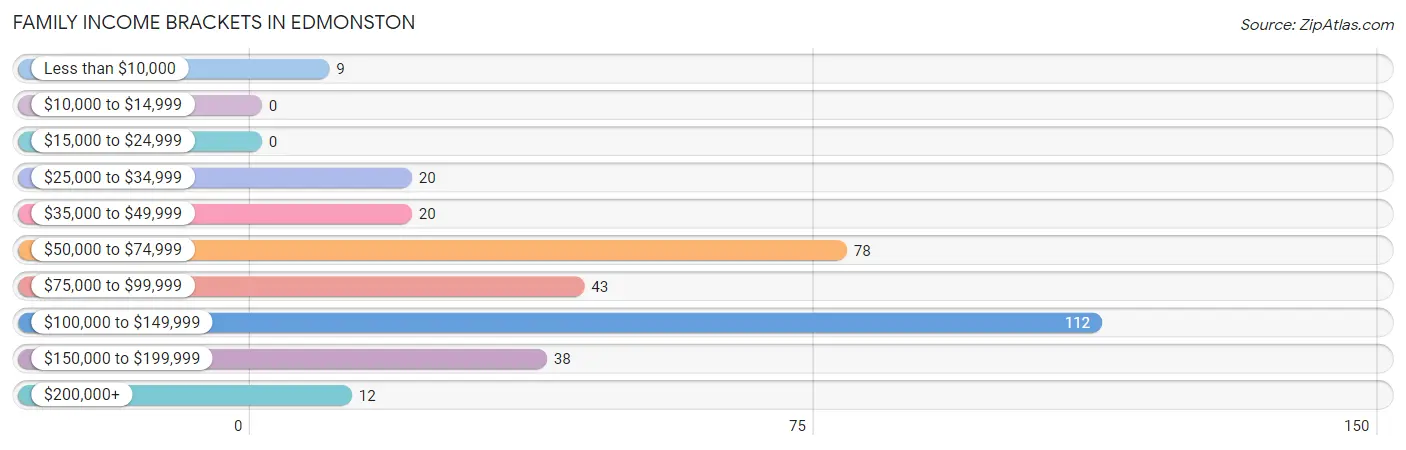
| Income Bracket | # Families | % Families |
| Less than $10,000 | 9 | 2.7% |
| $10,000 to $14,999 | 0 | 0.0% |
| $15,000 to $24,999 | 0 | 0.0% |
| $25,000 to $34,999 | 20 | 6.0% |
| $35,000 to $49,999 | 20 | 6.0% |
| $50,000 to $74,999 | 78 | 23.5% |
| $75,000 to $99,999 | 43 | 13.0% |
| $100,000 to $149,999 | 112 | 33.7% |
| $150,000 to $199,999 | 38 | 11.4% |
| $200,000+ | 12 | 3.6% |
Family Income by Famaliy Size in Edmonston
5-person families (75 | 22.6%) account for the highest median family income in Edmonston with $127,031 per family, while 2-person families (53 | 16.0%) have the highest median income of $55,812 per family member.
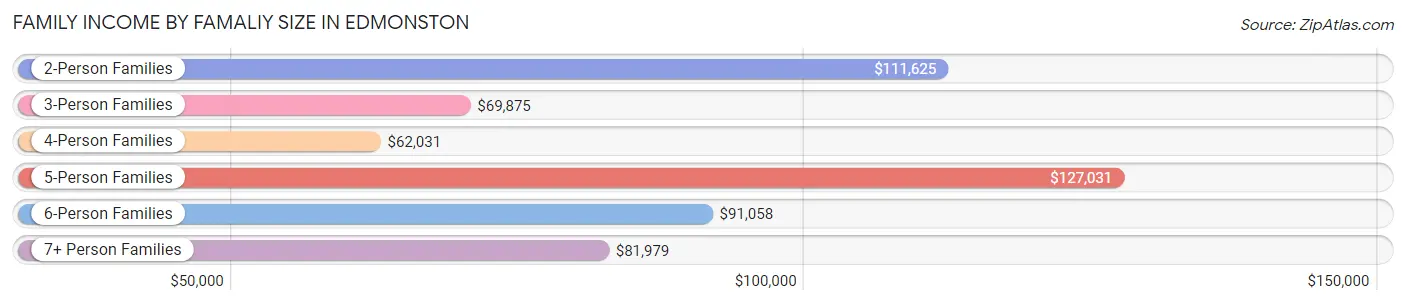
| Income Bracket | # Families | Median Income |
| 2-Person Families | 53 (16.0%) | $111,625 |
| 3-Person Families | 65 (19.6%) | $69,875 |
| 4-Person Families | 87 (26.2%) | $62,031 |
| 5-Person Families | 75 (22.6%) | $127,031 |
| 6-Person Families | 21 (6.3%) | $91,058 |
| 7+ Person Families | 31 (9.3%) | $81,979 |
| Total | 332 (100.0%) | $92,333 |
Family Income by Number of Earners in Edmonston
The median family income in Edmonston is $92,333, with families comprising 3+ earners (123) having the highest median family income of $132,938, while families with 1 earner (61) have the lowest median family income of $42,250, accounting for 37.0% and 18.4% of families, respectively.
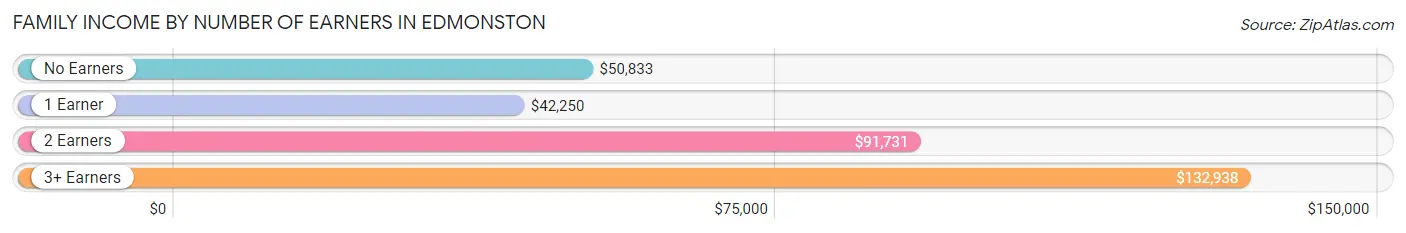
| Number of Earners | # Families | Median Income |
| No Earners | 14 (4.2%) | $50,833 |
| 1 Earner | 61 (18.4%) | $42,250 |
| 2 Earners | 134 (40.4%) | $91,731 |
| 3+ Earners | 123 (37.0%) | $132,938 |
| Total | 332 (100.0%) | $92,333 |
Household Income in Edmonston
Household Income Brackets in Edmonston
With 121 households falling in the category, the $100,000 to $149,999 income range is the most frequent in Edmonston, accounting for 27.0% of all households. In contrast, only 3 households (0.7%) fall into the $10,000 to $14,999 income bracket, making it the least populous group.
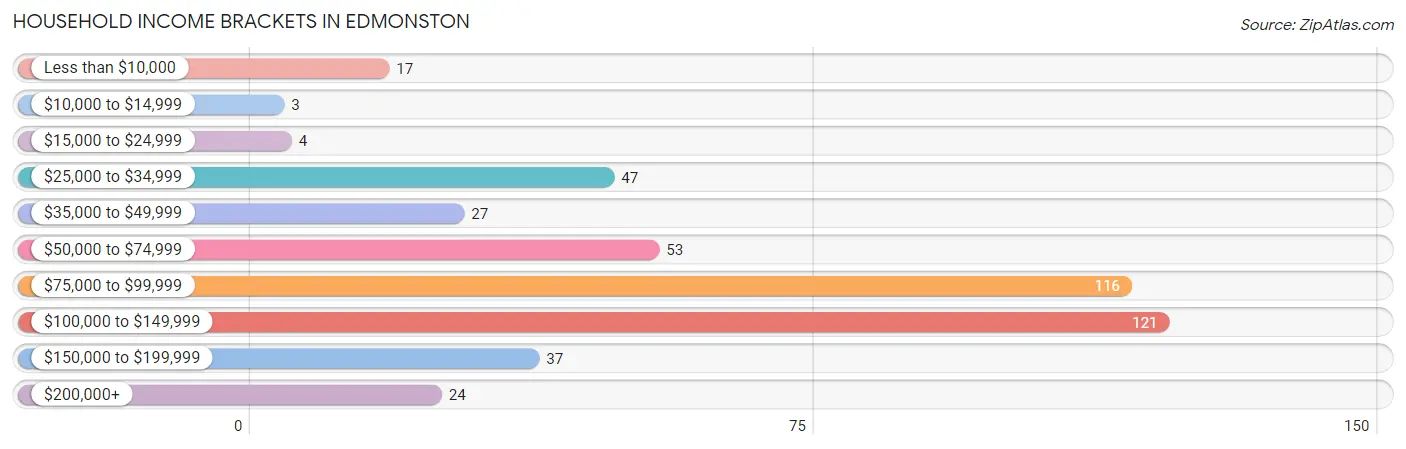
| Income Bracket | # Households | % Households |
| Less than $10,000 | 17 | 3.8% |
| $10,000 to $14,999 | 3 | 0.7% |
| $15,000 to $24,999 | 4 | 0.9% |
| $25,000 to $34,999 | 47 | 10.5% |
| $35,000 to $49,999 | 27 | 6.0% |
| $50,000 to $74,999 | 53 | 11.8% |
| $75,000 to $99,999 | 116 | 25.8% |
| $100,000 to $149,999 | 121 | 26.9% |
| $150,000 to $199,999 | 37 | 8.2% |
| $200,000+ | 24 | 5.3% |
Household Income by Householder Age in Edmonston
The median household income in Edmonston is $88,750, with the highest median household income of $115,357 found in the 45 to 64 years age bracket for the primary householder. A total of 118 households (26.3%) fall into this category. Meanwhile, the 15 to 24 years age bracket for the primary householder has the lowest median household income of $0, with 4 households (0.9%) in this group.
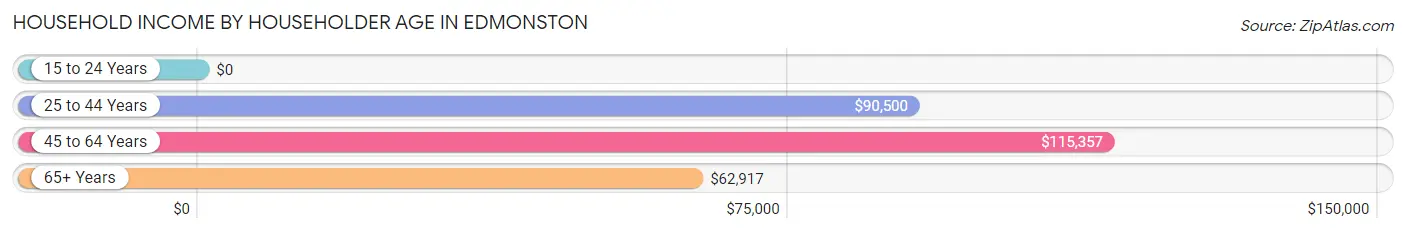
| Income Bracket | # Households | Median Income |
| 15 to 24 Years | 4 (0.9%) | $0 |
| 25 to 44 Years | 230 (51.2%) | $90,500 |
| 45 to 64 Years | 118 (26.3%) | $115,357 |
| 65+ Years | 97 (21.6%) | $62,917 |
| Total | 449 (100.0%) | $88,750 |
Poverty in Edmonston
Income Below Poverty by Sex and Age in Edmonston
With 16.6% poverty level for males and 5.4% for females among the residents of Edmonston, under 5 year old males and 18 to 24 year old females are the most vulnerable to poverty, with 25 males (35.7%) and 24 females (27.3%) in their respective age groups living below the poverty level.
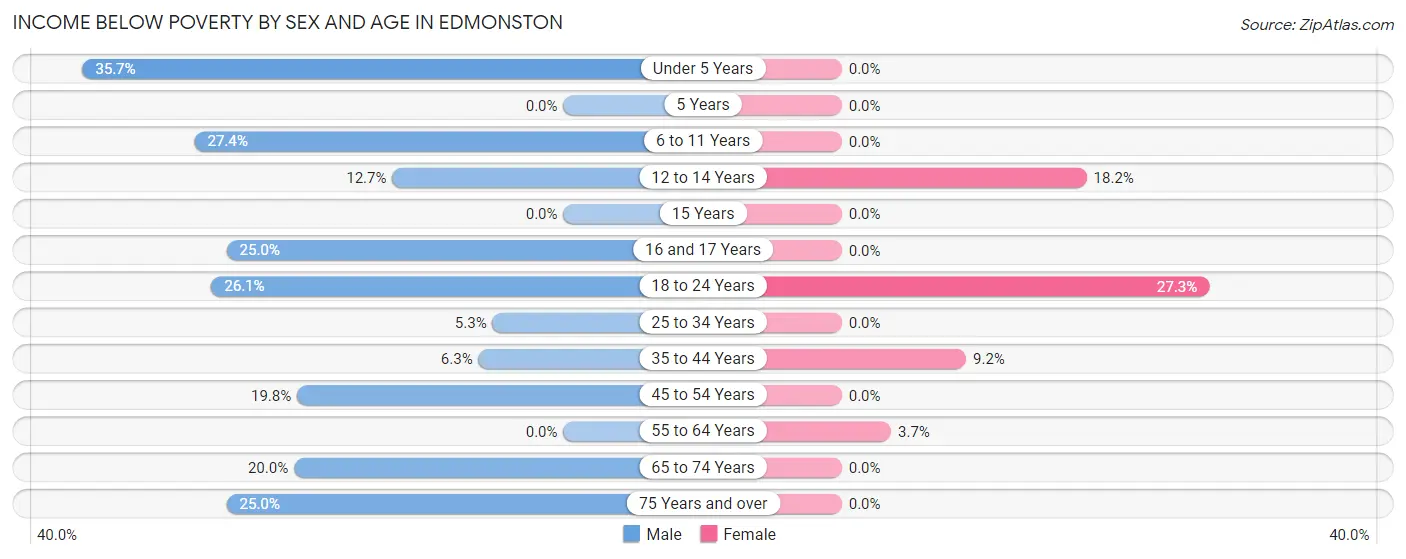
| Age Bracket | Male | Female |
| Under 5 Years | 25 (35.7%) | 0 (0.0%) |
| 5 Years | 0 (0.0%) | 0 (0.0%) |
| 6 to 11 Years | 23 (27.4%) | 0 (0.0%) |
| 12 to 14 Years | 8 (12.7%) | 8 (18.2%) |
| 15 Years | 0 (0.0%) | 0 (0.0%) |
| 16 and 17 Years | 12 (25.0%) | 0 (0.0%) |
| 18 to 24 Years | 29 (26.1%) | 24 (27.3%) |
| 25 to 34 Years | 6 (5.3%) | 0 (0.0%) |
| 35 to 44 Years | 8 (6.3%) | 12 (9.2%) |
| 45 to 54 Years | 17 (19.8%) | 0 (0.0%) |
| 55 to 64 Years | 0 (0.0%) | 3 (3.7%) |
| 65 to 74 Years | 16 (20.0%) | 0 (0.0%) |
| 75 Years and over | 3 (25.0%) | 0 (0.0%) |
| Total | 147 (16.6%) | 47 (5.4%) |
Income Above Poverty by Sex and Age in Edmonston
According to the poverty statistics in Edmonston, males aged 5 years and females aged under 5 years are the age groups that are most secure financially, with 100.0% of males and 100.0% of females in these age groups living above the poverty line.
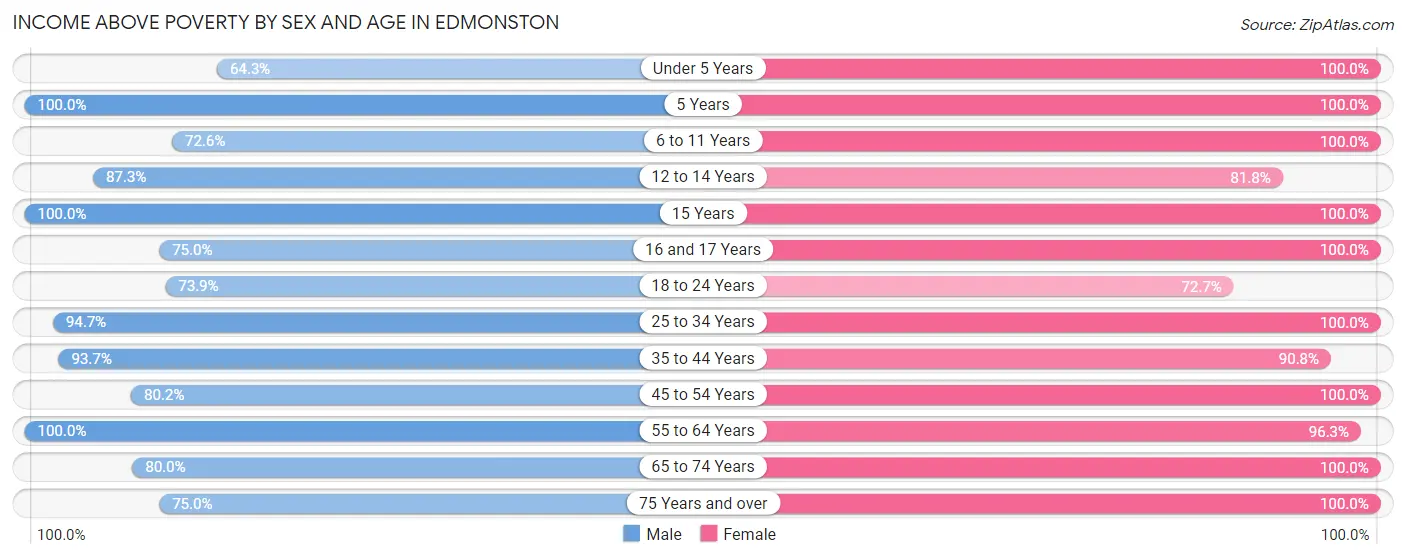
| Age Bracket | Male | Female |
| Under 5 Years | 45 (64.3%) | 128 (100.0%) |
| 5 Years | 15 (100.0%) | 7 (100.0%) |
| 6 to 11 Years | 61 (72.6%) | 61 (100.0%) |
| 12 to 14 Years | 55 (87.3%) | 36 (81.8%) |
| 15 Years | 14 (100.0%) | 41 (100.0%) |
| 16 and 17 Years | 36 (75.0%) | 39 (100.0%) |
| 18 to 24 Years | 82 (73.9%) | 64 (72.7%) |
| 25 to 34 Years | 108 (94.7%) | 142 (100.0%) |
| 35 to 44 Years | 119 (93.7%) | 118 (90.8%) |
| 45 to 54 Years | 69 (80.2%) | 55 (100.0%) |
| 55 to 64 Years | 60 (100.0%) | 79 (96.3%) |
| 65 to 74 Years | 64 (80.0%) | 42 (100.0%) |
| 75 Years and over | 9 (75.0%) | 8 (100.0%) |
| Total | 737 (83.4%) | 820 (94.6%) |
Income Below Poverty Among Married-Couple Families in Edmonston
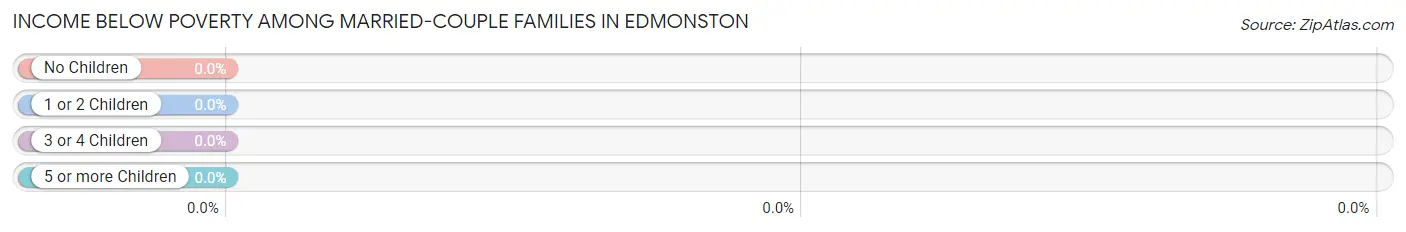
| Children | Above Poverty | Below Poverty |
| No Children | 56 (100.0%) | 0 (0.0%) |
| 1 or 2 Children | 118 (100.0%) | 0 (0.0%) |
| 3 or 4 Children | 35 (100.0%) | 0 (0.0%) |
| 5 or more Children | 0 (0.0%) | 0 (0.0%) |
| Total | 209 (100.0%) | 0 (0.0%) |
Income Below Poverty Among Single-Parent Households in Edmonston
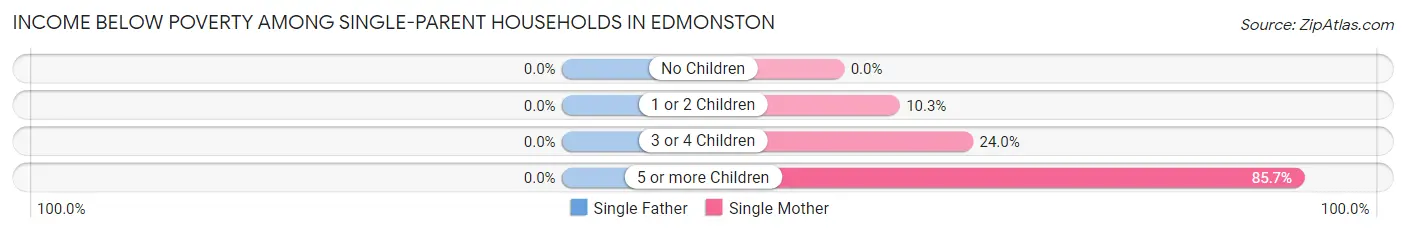
| Children | Single Father | Single Mother |
| No Children | 0 (0.0%) | 0 (0.0%) |
| 1 or 2 Children | 0 (0.0%) | 3 (10.3%) |
| 3 or 4 Children | 0 (0.0%) | 6 (24.0%) |
| 5 or more Children | 0 (0.0%) | 6 (85.7%) |
| Total | 0 (0.0%) | 15 (18.1%) |
Income Below Poverty Among Married-Couple vs Single-Parent Households in Edmonston
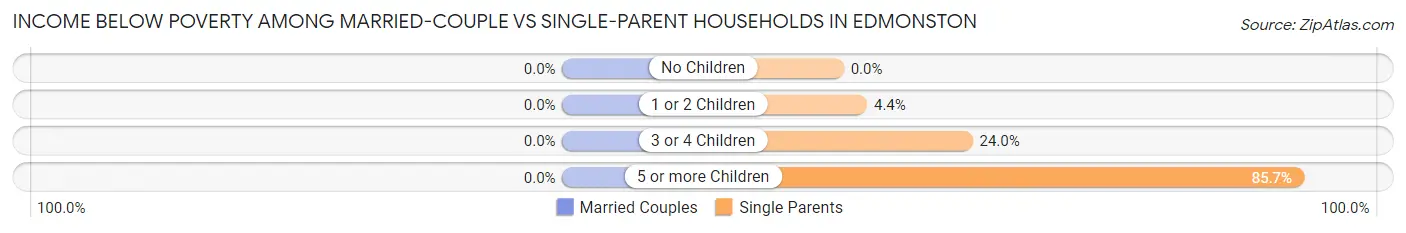
| Children | Married-Couple Families | Single-Parent Households |
| No Children | 0 (0.0%) | 0 (0.0%) |
| 1 or 2 Children | 0 (0.0%) | 3 (4.3%) |
| 3 or 4 Children | 0 (0.0%) | 6 (24.0%) |
| 5 or more Children | 0 (0.0%) | 6 (85.7%) |
| Total | 0 (0.0%) | 15 (12.2%) |
Race in Edmonston
The most populous races in Edmonston are Hispanic or Latino (1,086 | 62.0%), Some other Race (1,042 | 59.5%), and Black / African American (458 | 26.2%).
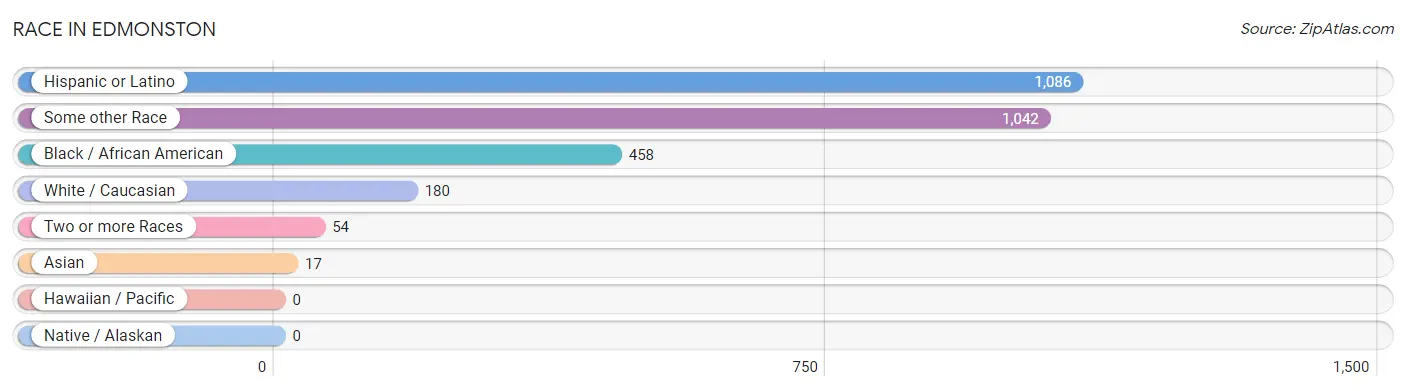
| Race | # Population | % Population |
| Asian | 17 | 1.0% |
| Black / African American | 458 | 26.2% |
| Hawaiian / Pacific | 0 | 0.0% |
| Hispanic or Latino | 1,086 | 62.0% |
| Native / Alaskan | 0 | 0.0% |
| White / Caucasian | 180 | 10.3% |
| Two or more Races | 54 | 3.1% |
| Some other Race | 1,042 | 59.5% |
| Total | 1,751 | 100.0% |
Ancestry in Edmonston
The most populous ancestries reported in Edmonston are Central American (720 | 41.1%), Salvadoran (630 | 36.0%), Mexican (296 | 16.9%), Subsaharan African (151 | 8.6%), and American (90 | 5.1%), together accounting for 107.8% of all Edmonston residents.
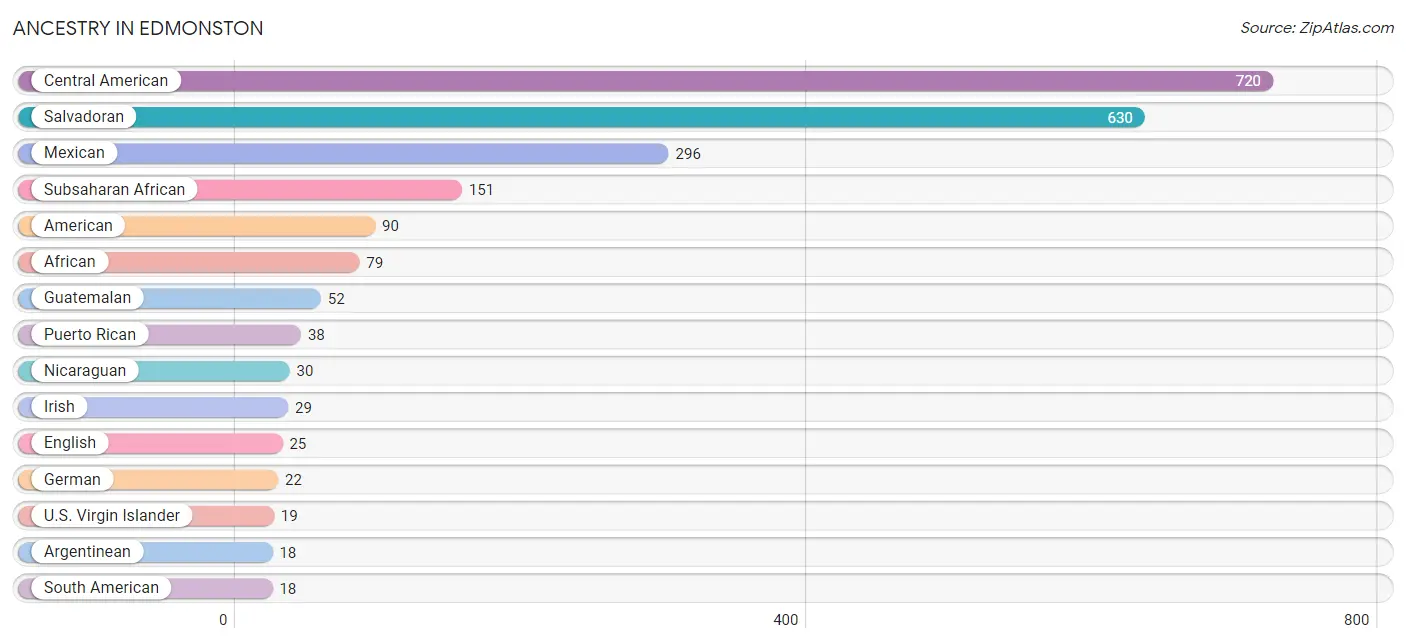
| Ancestry | # Population | % Population |
| African | 79 | 4.5% |
| American | 90 | 5.1% |
| Arab | 5 | 0.3% |
| Argentinean | 18 | 1.0% |
| Bermudan | 9 | 0.5% |
| Central American | 720 | 41.1% |
| Danish | 6 | 0.3% |
| Dominican | 14 | 0.8% |
| Dutch | 4 | 0.2% |
| English | 25 | 1.4% |
| Ethiopian | 10 | 0.6% |
| European | 8 | 0.5% |
| French | 5 | 0.3% |
| French Canadian | 4 | 0.2% |
| German | 22 | 1.3% |
| Guatemalan | 52 | 3.0% |
| Honduran | 8 | 0.5% |
| Indian (Asian) | 3 | 0.2% |
| Irish | 29 | 1.7% |
| Italian | 4 | 0.2% |
| Jamaican | 13 | 0.7% |
| Korean | 17 | 1.0% |
| Mexican | 296 | 16.9% |
| Nicaraguan | 30 | 1.7% |
| Norwegian | 3 | 0.2% |
| Polish | 1 | 0.1% |
| Portuguese | 6 | 0.3% |
| Puerto Rican | 38 | 2.2% |
| Salvadoran | 630 | 36.0% |
| Scottish | 7 | 0.4% |
| Sierra Leonean | 7 | 0.4% |
| South American | 18 | 1.0% |
| Subsaharan African | 151 | 8.6% |
| Swedish | 3 | 0.2% |
| Trinidadian and Tobagonian | 1 | 0.1% |
| U.S. Virgin Islander | 19 | 1.1% | View All 36 Rows |
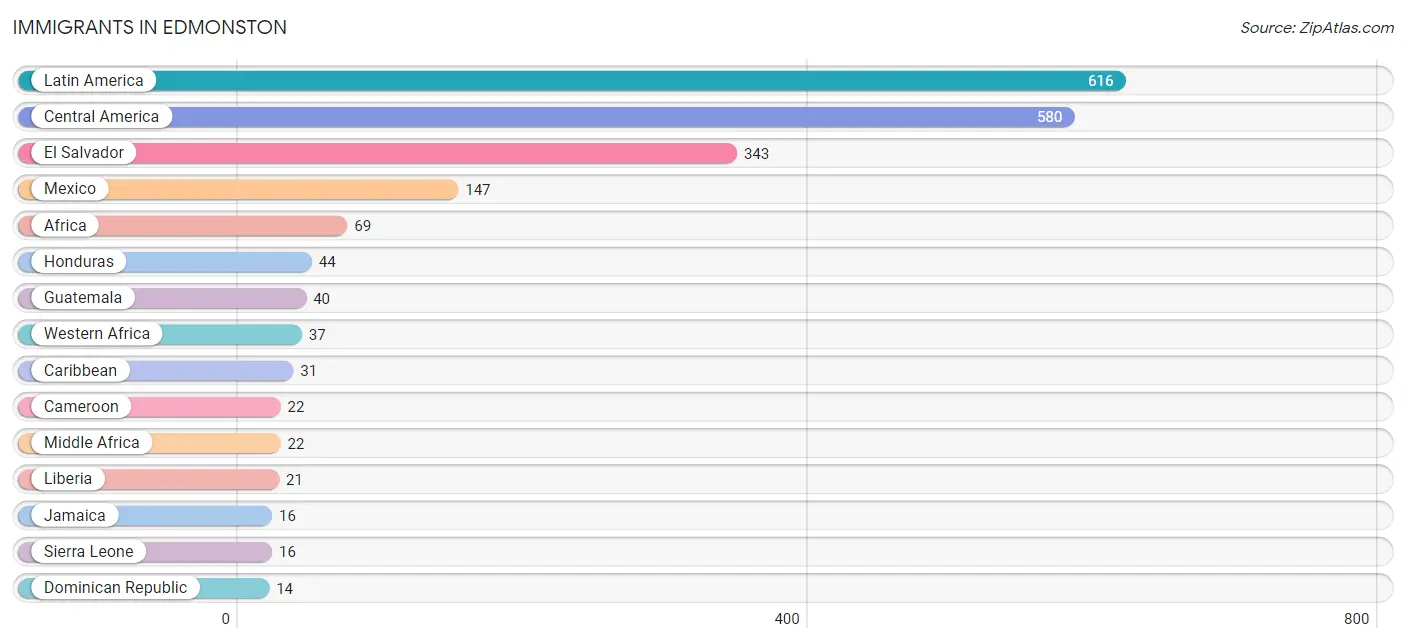
Immigrants in Edmonston
The most numerous immigrant groups reported in Edmonston came from Latin America (616 | 35.2%), Central America (580 | 33.1%), El Salvador (343 | 19.6%), Mexico (147 | 8.4%), and Africa (69 | 3.9%), together accounting for 100.2% of all Edmonston residents.
| Immigration Origin | # Population | % Population |
| Africa | 69 | 3.9% |
| Argentina | 5 | 0.3% |
| Asia | 5 | 0.3% |
| Cameroon | 22 | 1.3% |
| Caribbean | 31 | 1.8% |
| Central America | 580 | 33.1% |
| Dominican Republic | 14 | 0.8% |
| Eastern Africa | 10 | 0.6% |
| Eastern Europe | 3 | 0.2% |
| El Salvador | 343 | 19.6% |
| Ethiopia | 10 | 0.6% |
| Europe | 9 | 0.5% |
| Guatemala | 40 | 2.3% |
| Honduras | 44 | 2.5% |
| Israel | 5 | 0.3% |
| Jamaica | 16 | 0.9% |
| Latin America | 616 | 35.2% |
| Liberia | 21 | 1.2% |
| Mexico | 147 | 8.4% |
| Middle Africa | 22 | 1.3% |
| Nicaragua | 6 | 0.3% |
| Portugal | 6 | 0.3% |
| Sierra Leone | 16 | 0.9% |
| South America | 5 | 0.3% |
| Southern Europe | 6 | 0.3% |
| Trinidad and Tobago | 1 | 0.1% |
| Ukraine | 3 | 0.2% |
| Western Africa | 37 | 2.1% |
| Western Asia | 5 | 0.3% | View All 29 Rows |
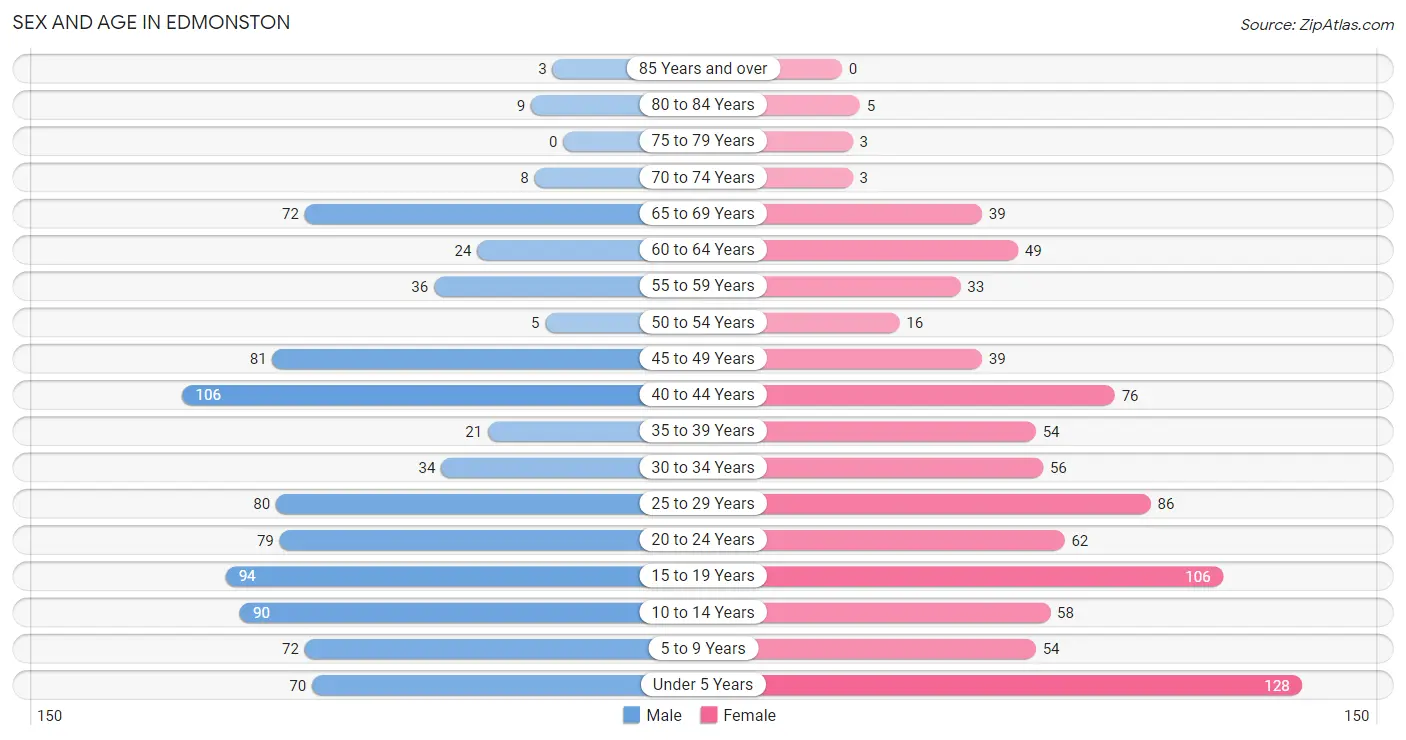
Sex and Age in Edmonston
Sex and Age in Edmonston
The most populous age groups in Edmonston are 40 to 44 Years (106 | 12.0%) for men and Under 5 Years (128 | 14.8%) for women.
| Age Bracket | Male | Female |
| Under 5 Years | 70 (7.9%) | 128 (14.8%) |
| 5 to 9 Years | 72 (8.1%) | 54 (6.2%) |
| 10 to 14 Years | 90 (10.2%) | 58 (6.7%) |
| 15 to 19 Years | 94 (10.6%) | 106 (12.2%) |
| 20 to 24 Years | 79 (8.9%) | 62 (7.1%) |
| 25 to 29 Years | 80 (9.0%) | 86 (9.9%) |
| 30 to 34 Years | 34 (3.8%) | 56 (6.5%) |
| 35 to 39 Years | 21 (2.4%) | 54 (6.2%) |
| 40 to 44 Years | 106 (12.0%) | 76 (8.8%) |
| 45 to 49 Years | 81 (9.2%) | 39 (4.5%) |
| 50 to 54 Years | 5 (0.6%) | 16 (1.8%) |
| 55 to 59 Years | 36 (4.1%) | 33 (3.8%) |
| 60 to 64 Years | 24 (2.7%) | 49 (5.7%) |
| 65 to 69 Years | 72 (8.1%) | 39 (4.5%) |
| 70 to 74 Years | 8 (0.9%) | 3 (0.4%) |
| 75 to 79 Years | 0 (0.0%) | 3 (0.4%) |
| 80 to 84 Years | 9 (1.0%) | 5 (0.6%) |
| 85 Years and over | 3 (0.3%) | 0 (0.0%) |
| Total | 884 (100.0%) | 867 (100.0%) |
Families and Households in Edmonston
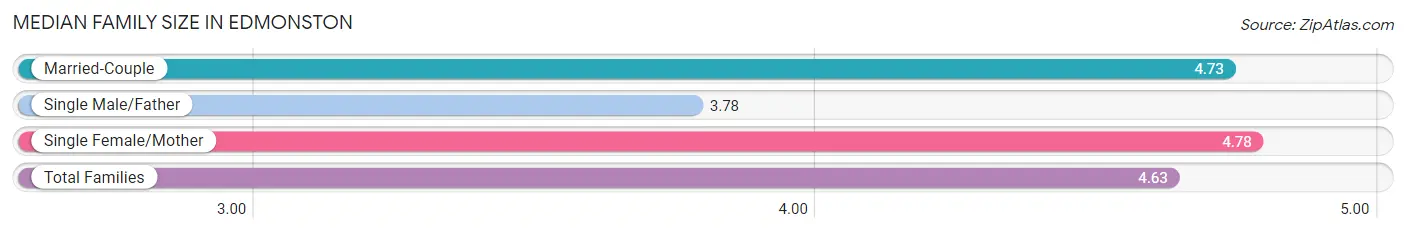
Median Family Size in Edmonston
The median family size in Edmonston is 4.63 persons per family, with single female/mother families (83 | 25.0%) accounting for the largest median family size of 4.78 persons per family. On the other hand, single male/father families (40 | 12.0%) represent the smallest median family size with 3.78 persons per family.
| Family Type | # Families | Family Size |
| Married-Couple | 209 (62.9%) | 4.73 |
| Single Male/Father | 40 (12.0%) | 3.78 |
| Single Female/Mother | 83 (25.0%) | 4.78 |
| Total Families | 332 (100.0%) | 4.63 |
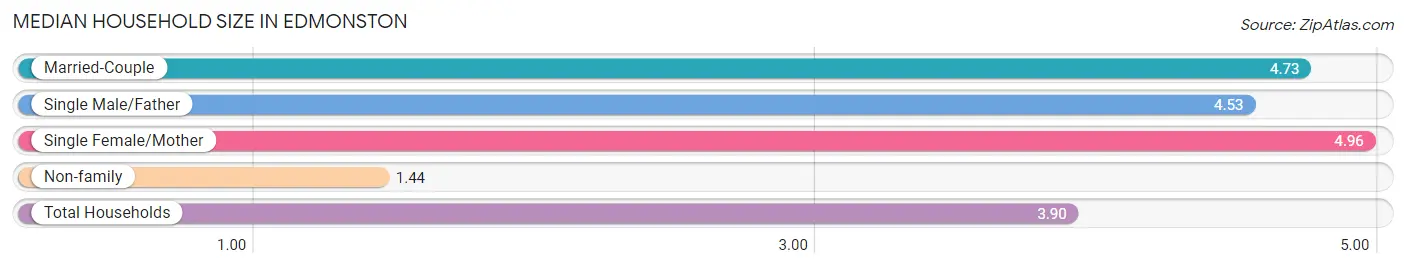
Median Household Size in Edmonston
The median household size in Edmonston is 3.90 persons per household, with single female/mother households (83 | 18.5%) accounting for the largest median household size of 4.96 persons per household. non-family households (117 | 26.1%) represent the smallest median household size with 1.44 persons per household.
| Household Type | # Households | Household Size |
| Married-Couple | 209 (46.6%) | 4.73 |
| Single Male/Father | 40 (8.9%) | 4.53 |
| Single Female/Mother | 83 (18.5%) | 4.96 |
| Non-family | 117 (26.1%) | 1.44 |
| Total Households | 449 (100.0%) | 3.90 |
Household Size by Marriage Status in Edmonston
Out of a total of 449 households in Edmonston, 332 (73.9%) are family households, while 117 (26.1%) are nonfamily households. The most numerous type of family households are 5-person households, comprising 121, and the most common type of nonfamily households are 1-person households, comprising 79.
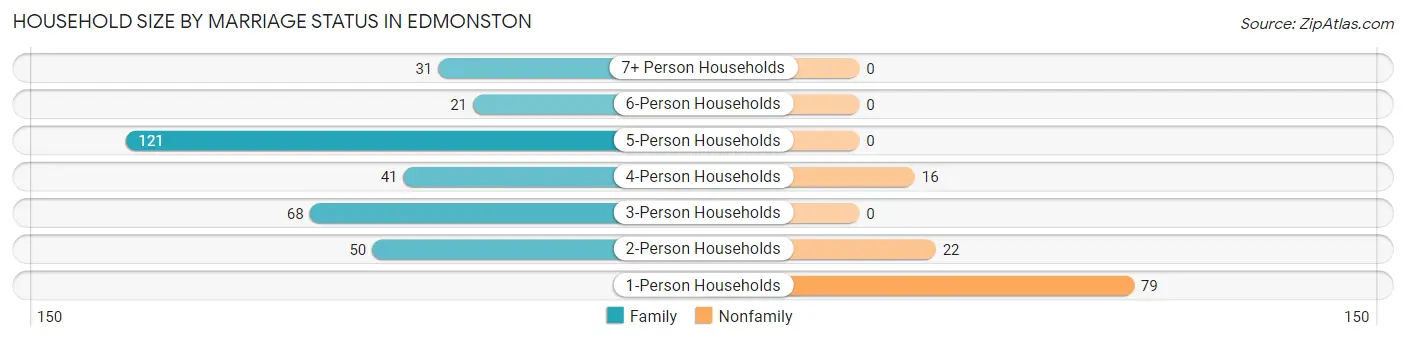
| Household Size | Family Households | Nonfamily Households |
| 1-Person Households | - | 79 (17.6%) |
| 2-Person Households | 50 (11.1%) | 22 (4.9%) |
| 3-Person Households | 68 (15.1%) | 0 (0.0%) |
| 4-Person Households | 41 (9.1%) | 16 (3.6%) |
| 5-Person Households | 121 (27.0%) | 0 (0.0%) |
| 6-Person Households | 21 (4.7%) | 0 (0.0%) |
| 7+ Person Households | 31 (6.9%) | 0 (0.0%) |
| Total | 332 (73.9%) | 117 (26.1%) |
Female Fertility in Edmonston
Fertility by Age in Edmonston
Average fertility rate in Edmonston is 115.0 births per 1,000 women. Women in the age bracket of 35 to 50 years have the highest fertility rate with 160.0 births per 1,000 women. Women in the age bracket of 20 to 34 years acount for 50.9% of all women with births.
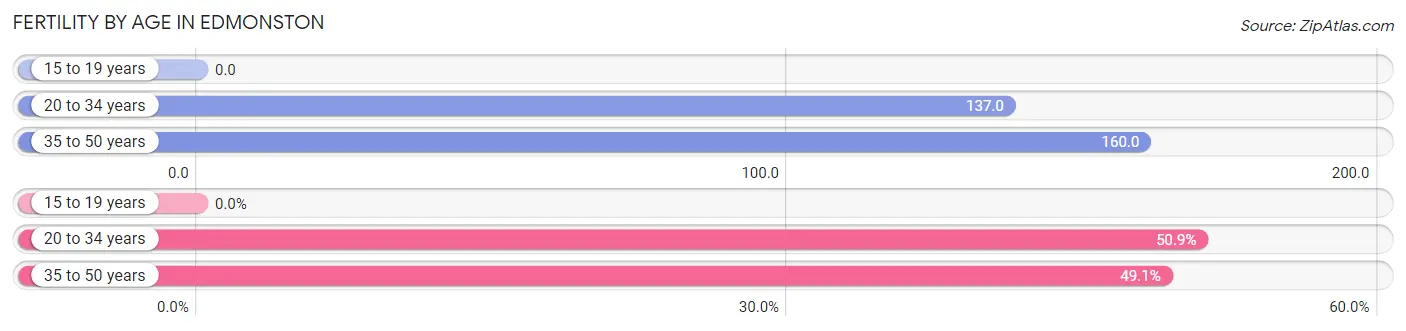
| Age Bracket | Women with Births | Births / 1,000 Women |
| 15 to 19 years | 0 (0.0%) | 0.0 |
| 20 to 34 years | 28 (50.9%) | 137.0 |
| 35 to 50 years | 27 (49.1%) | 160.0 |
| Total | 55 (100.0%) | 115.0 |
Fertility by Age by Marriage Status in Edmonston
43.6% of women with births (55) in Edmonston are married. The highest percentage of unmarried women with births falls into 35 to 50 years age bracket with 100.0% of them unmarried at the time of birth, while the lowest percentage of unmarried women with births belong to 20 to 34 years age bracket with 14.3% of them unmarried.
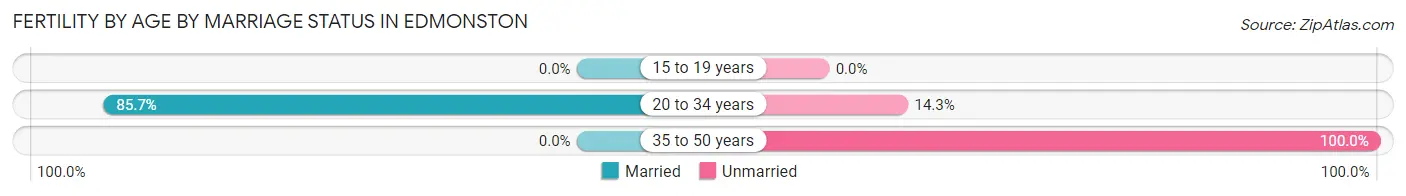
| Age Bracket | Married | Unmarried |
| 15 to 19 years | 0 (0.0%) | 0 (0.0%) |
| 20 to 34 years | 24 (85.7%) | 4 (14.3%) |
| 35 to 50 years | 0 (0.0%) | 27 (100.0%) |
| Total | 24 (43.6%) | 31 (56.4%) |
Fertility by Education in Edmonston
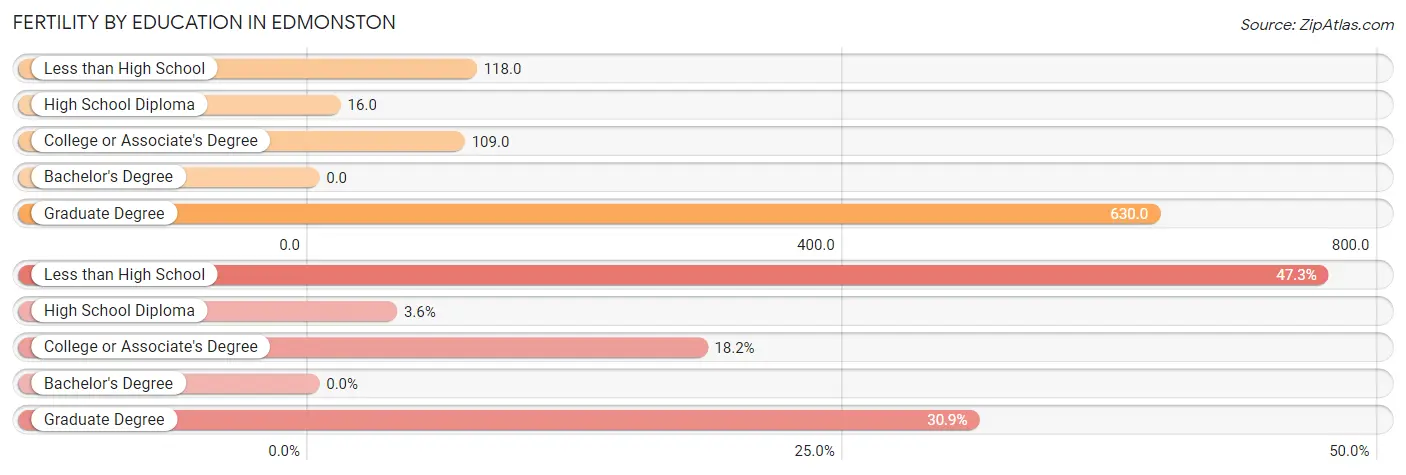
| Educational Attainment | Women with Births | Births / 1,000 Women |
| Less than High School | 26 (47.3%) | 118.0 |
| High School Diploma | 2 (3.6%) | 16.0 |
| College or Associate's Degree | 10 (18.2%) | 109.0 |
| Bachelor's Degree | 0 (0.0%) | 0.0 |
| Graduate Degree | 17 (30.9%) | 630.0 |
| Total | 55 (100.0%) | 115.0 |
Fertility by Education by Marriage Status in Edmonston
56.4% of women with births in Edmonston are unmarried. Women with the educational attainment of graduate degree are most likely to be married with 100.0% of them married at childbirth, while women with the educational attainment of high school diploma are least likely to be married with 100.0% of them unmarried at childbirth.
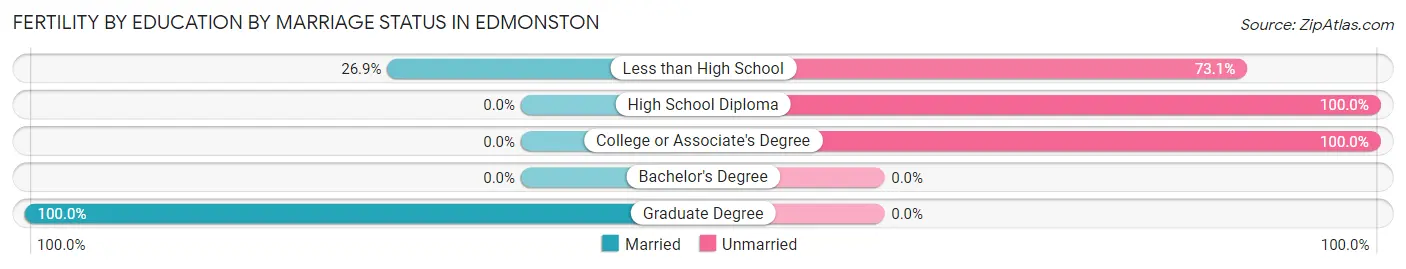
| Educational Attainment | Married | Unmarried |
| Less than High School | 7 (26.9%) | 19 (73.1%) |
| High School Diploma | 0 (0.0%) | 2 (100.0%) |
| College or Associate's Degree | 0 (0.0%) | 10 (100.0%) |
| Bachelor's Degree | 0 (0.0%) | 0 (0.0%) |
| Graduate Degree | 17 (100.0%) | 0 (0.0%) |
| Total | 24 (43.6%) | 31 (56.4%) |
Employment Characteristics in Edmonston
Employment by Class of Employer in Edmonston
Among the 808 employed individuals in Edmonston, private company employees (582 | 72.0%), not-for-profit organizations (58 | 7.2%), and self-employed (incorporated) (44 | 5.4%) make up the most common classes of employment.
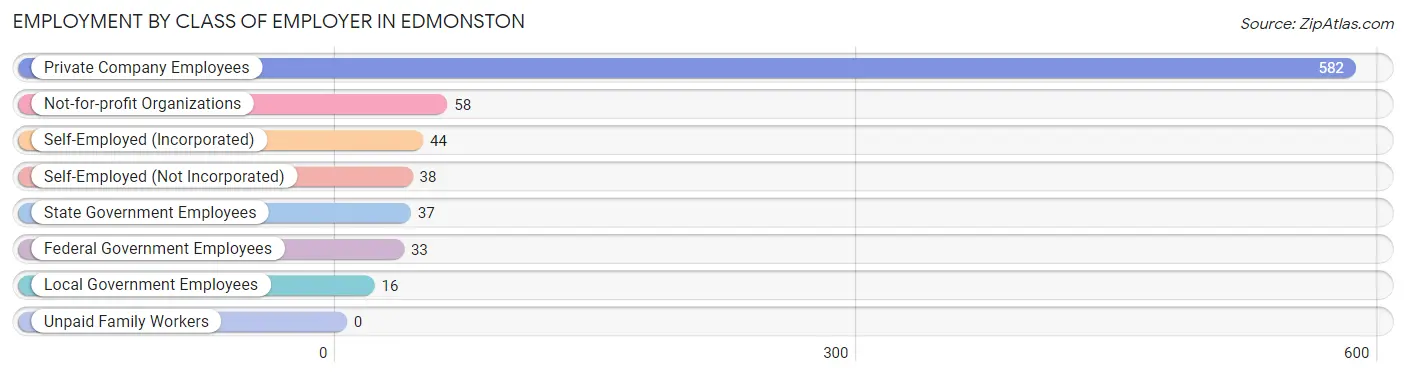
| Employer Class | # Employees | % Employees |
| Private Company Employees | 582 | 72.0% |
| Self-Employed (Incorporated) | 44 | 5.4% |
| Self-Employed (Not Incorporated) | 38 | 4.7% |
| Not-for-profit Organizations | 58 | 7.2% |
| Local Government Employees | 16 | 2.0% |
| State Government Employees | 37 | 4.6% |
| Federal Government Employees | 33 | 4.1% |
| Unpaid Family Workers | 0 | 0.0% |
| Total | 808 | 100.0% |
Employment Status by Age in Edmonston
According to the labor force statistics for Edmonston, out of the total population over 16 years of age (1,224), 75.4% or 923 individuals are in the labor force, with 10.3% or 95 of them unemployed. The age group with the highest labor force participation rate is 35 to 44 years, with 96.1% or 247 individuals in the labor force. Within the labor force, the 65 to 74 years age range has the highest percentage of unemployed individuals, with 41.5% or 22 of them being unemployed.
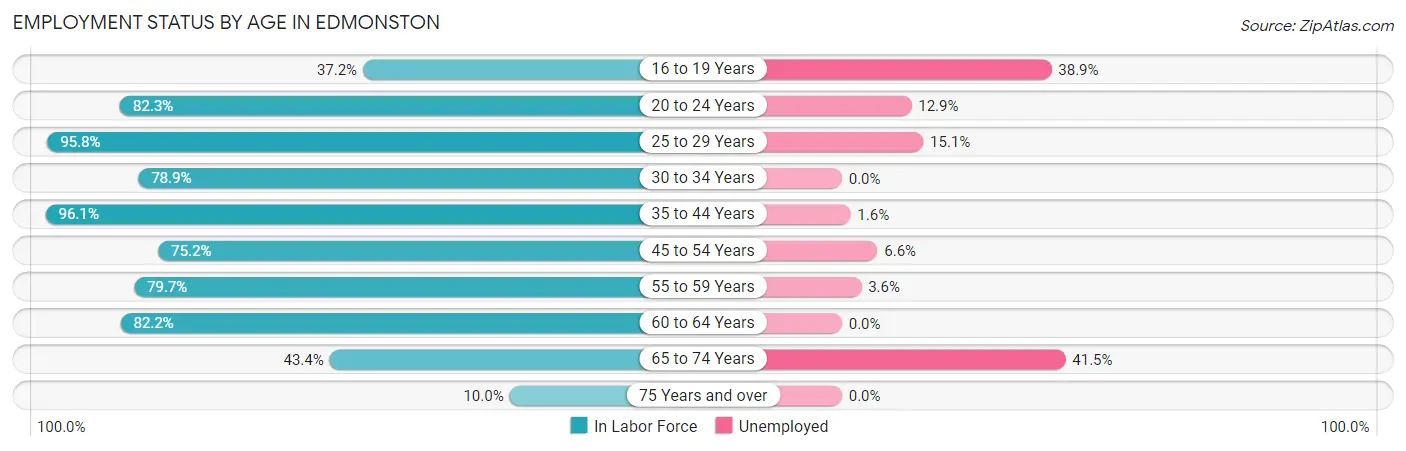
| Age Bracket | In Labor Force | Unemployed |
| 16 to 19 Years | 54 (37.2%) | 21 (38.9%) |
| 20 to 24 Years | 116 (82.3%) | 15 (12.9%) |
| 25 to 29 Years | 159 (95.8%) | 24 (15.1%) |
| 30 to 34 Years | 71 (78.9%) | 0 (0.0%) |
| 35 to 44 Years | 247 (96.1%) | 4 (1.6%) |
| 45 to 54 Years | 106 (75.2%) | 7 (6.6%) |
| 55 to 59 Years | 55 (79.7%) | 2 (3.6%) |
| 60 to 64 Years | 60 (82.2%) | 0 (0.0%) |
| 65 to 74 Years | 53 (43.4%) | 22 (41.5%) |
| 75 Years and over | 2 (10.0%) | 0 (0.0%) |
| Total | 923 (75.4%) | 95 (10.3%) |
Employment Status by Educational Attainment in Edmonston
According to labor force statistics for Edmonston, 87.7% of individuals (698) out of the total population between 25 and 64 years of age (796) are in the labor force, with 5.3% or 37 of them being unemployed. The group with the highest labor force participation rate are those with the educational attainment of high school diploma, with 92.8% or 232 individuals in the labor force. Within the labor force, individuals with high school diploma education have the highest percentage of unemployment, with 10.3% or 24 of them being unemployed.
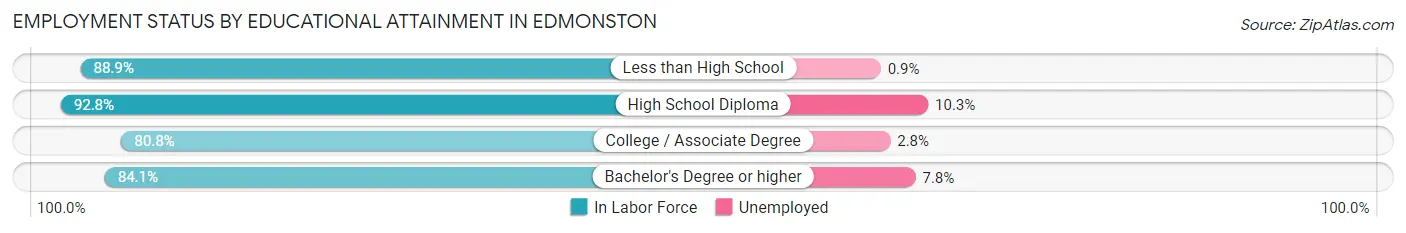
| Educational Attainment | In Labor Force | Unemployed |
| Less than High School | 233 (88.9%) | 2 (0.9%) |
| High School Diploma | 232 (92.8%) | 26 (10.3%) |
| College / Associate Degree | 143 (80.8%) | 5 (2.8%) |
| Bachelor's Degree or higher | 90 (84.1%) | 8 (7.8%) |
| Total | 698 (87.7%) | 42 (5.3%) |
Employment Occupations by Sex in Edmonston
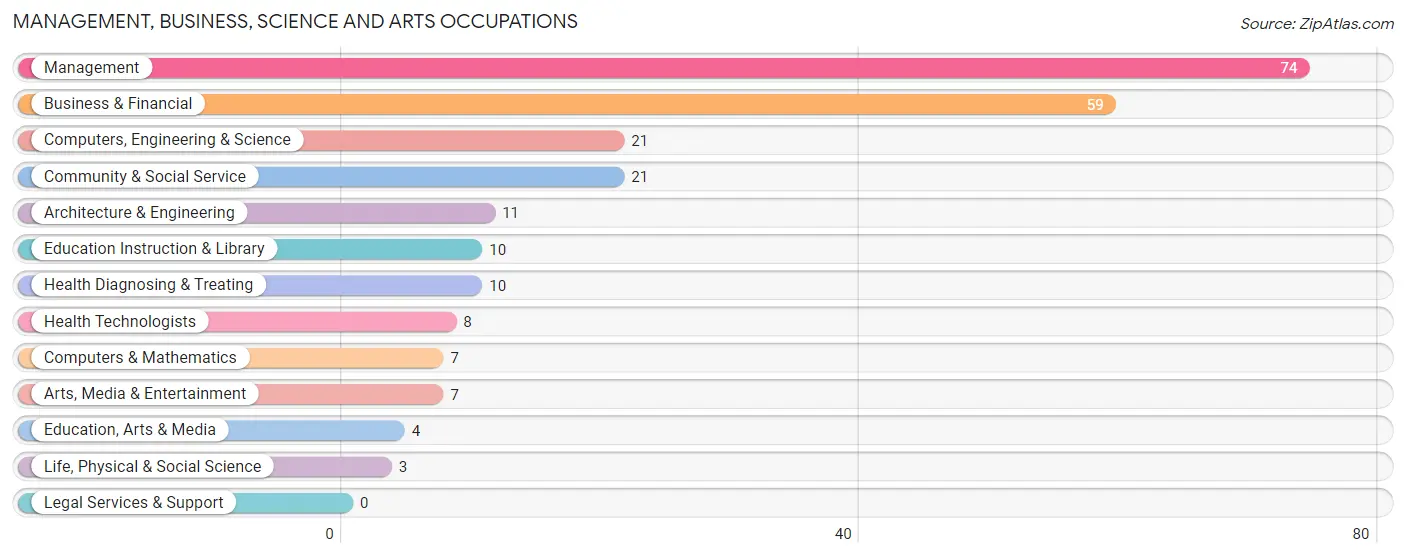
Management, Business, Science and Arts Occupations
The most common Management, Business, Science and Arts occupations in Edmonston are Management (74 | 8.9%), Business & Financial (59 | 7.1%), Computers, Engineering & Science (21 | 2.5%), Community & Social Service (21 | 2.5%), and Architecture & Engineering (11 | 1.3%).
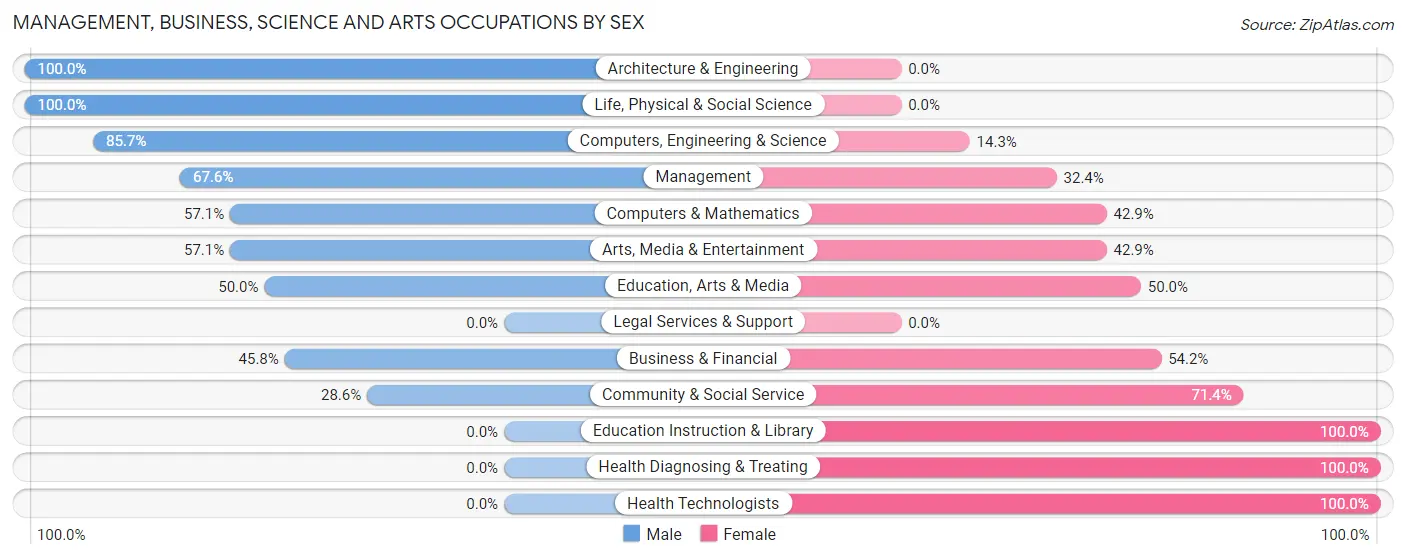
Management, Business, Science and Arts Occupations by Sex
Within the Management, Business, Science and Arts occupations in Edmonston, the most male-oriented occupations are Architecture & Engineering (100.0%), Life, Physical & Social Science (100.0%), and Computers, Engineering & Science (85.7%), while the most female-oriented occupations are Education Instruction & Library (100.0%), Health Diagnosing & Treating (100.0%), and Health Technologists (100.0%).
| Occupation | Male | Female |
| Management | 50 (67.6%) | 24 (32.4%) |
| Business & Financial | 27 (45.8%) | 32 (54.2%) |
| Computers, Engineering & Science | 18 (85.7%) | 3 (14.3%) |
| Computers & Mathematics | 4 (57.1%) | 3 (42.9%) |
| Architecture & Engineering | 11 (100.0%) | 0 (0.0%) |
| Life, Physical & Social Science | 3 (100.0%) | 0 (0.0%) |
| Community & Social Service | 6 (28.6%) | 15 (71.4%) |
| Education, Arts & Media | 2 (50.0%) | 2 (50.0%) |
| Legal Services & Support | 0 (0.0%) | 0 (0.0%) |
| Education Instruction & Library | 0 (0.0%) | 10 (100.0%) |
| Arts, Media & Entertainment | 4 (57.1%) | 3 (42.9%) |
| Health Diagnosing & Treating | 0 (0.0%) | 10 (100.0%) |
| Health Technologists | 0 (0.0%) | 8 (100.0%) |
| Total (Category) | 101 (54.6%) | 84 (45.4%) |
| Total (Overall) | 429 (51.8%) | 399 (48.2%) |
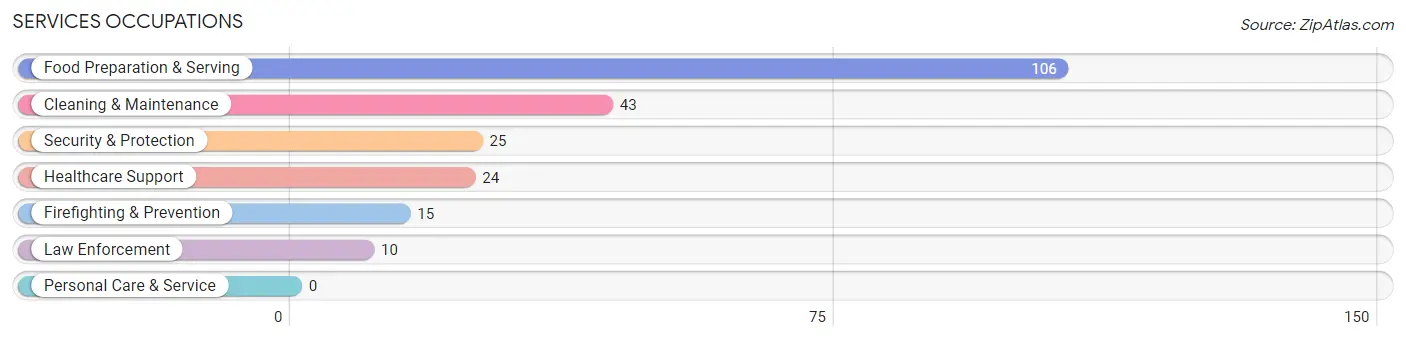
Services Occupations
The most common Services occupations in Edmonston are Food Preparation & Serving (106 | 12.8%), Cleaning & Maintenance (43 | 5.2%), Security & Protection (25 | 3.0%), Healthcare Support (24 | 2.9%), and Firefighting & Prevention (15 | 1.8%).
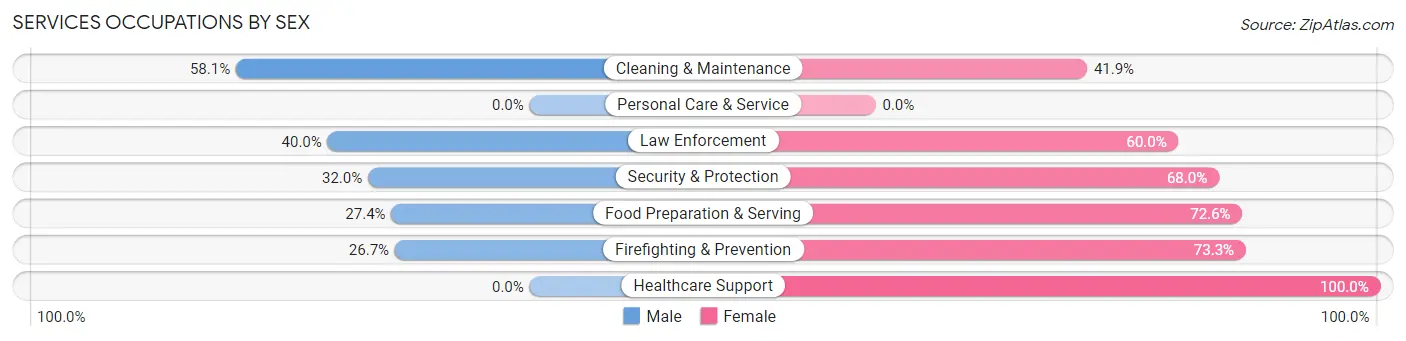
Services Occupations by Sex
Within the Services occupations in Edmonston, the most male-oriented occupations are Cleaning & Maintenance (58.1%), Law Enforcement (40.0%), and Security & Protection (32.0%), while the most female-oriented occupations are Healthcare Support (100.0%), Firefighting & Prevention (73.3%), and Food Preparation & Serving (72.6%).
| Occupation | Male | Female |
| Healthcare Support | 0 (0.0%) | 24 (100.0%) |
| Security & Protection | 8 (32.0%) | 17 (68.0%) |
| Firefighting & Prevention | 4 (26.7%) | 11 (73.3%) |
| Law Enforcement | 4 (40.0%) | 6 (60.0%) |
| Food Preparation & Serving | 29 (27.4%) | 77 (72.6%) |
| Cleaning & Maintenance | 25 (58.1%) | 18 (41.9%) |
| Personal Care & Service | 0 (0.0%) | 0 (0.0%) |
| Total (Category) | 62 (31.3%) | 136 (68.7%) |
| Total (Overall) | 429 (51.8%) | 399 (48.2%) |
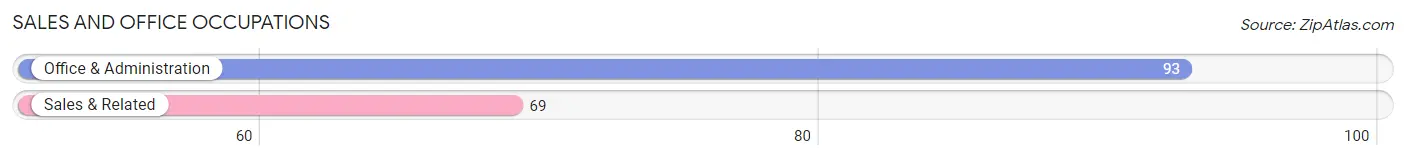
Sales and Office Occupations
The most common Sales and Office occupations in Edmonston are Office & Administration (93 | 11.2%), and Sales & Related (69 | 8.3%).
Sales and Office Occupations by Sex
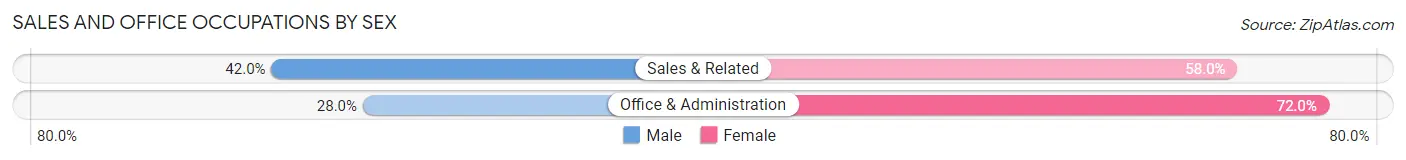
| Occupation | Male | Female |
| Sales & Related | 29 (42.0%) | 40 (58.0%) |
| Office & Administration | 26 (28.0%) | 67 (72.0%) |
| Total (Category) | 55 (34.0%) | 107 (66.0%) |
| Total (Overall) | 429 (51.8%) | 399 (48.2%) |
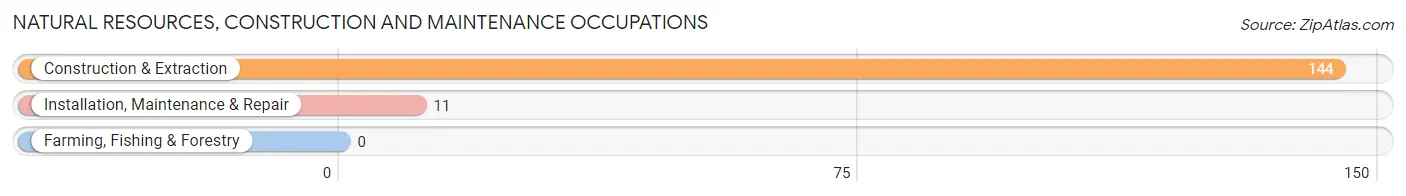
Natural Resources, Construction and Maintenance Occupations
The most common Natural Resources, Construction and Maintenance occupations in Edmonston are Construction & Extraction (144 | 17.4%), and Installation, Maintenance & Repair (11 | 1.3%).
Natural Resources, Construction and Maintenance Occupations by Sex
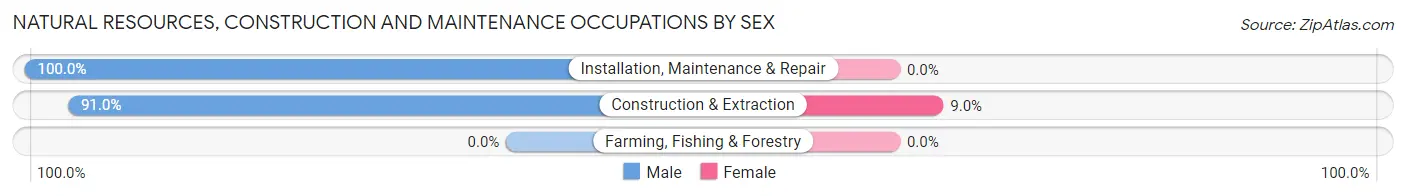
| Occupation | Male | Female |
| Farming, Fishing & Forestry | 0 (0.0%) | 0 (0.0%) |
| Construction & Extraction | 131 (91.0%) | 13 (9.0%) |
| Installation, Maintenance & Repair | 11 (100.0%) | 0 (0.0%) |
| Total (Category) | 142 (91.6%) | 13 (8.4%) |
| Total (Overall) | 429 (51.8%) | 399 (48.2%) |
Production, Transportation and Moving Occupations
The most common Production, Transportation and Moving occupations in Edmonston are Material Moving (55 | 6.6%), Transportation (48 | 5.8%), and Production (25 | 3.0%).
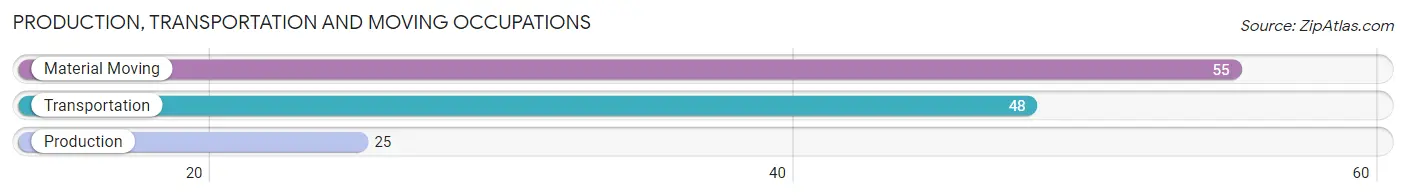
Production, Transportation and Moving Occupations by Sex
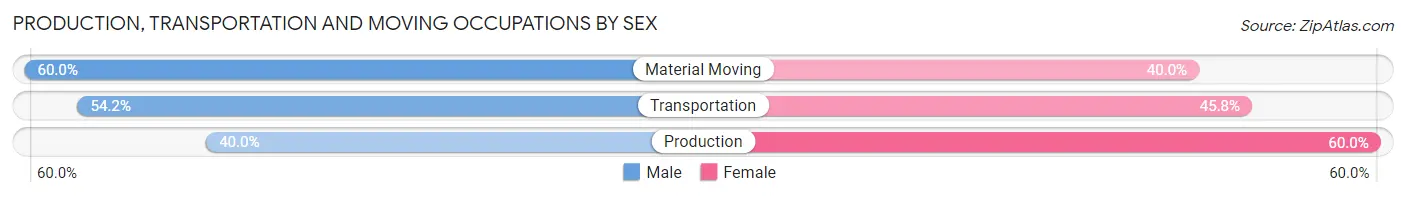
| Occupation | Male | Female |
| Production | 10 (40.0%) | 15 (60.0%) |
| Transportation | 26 (54.2%) | 22 (45.8%) |
| Material Moving | 33 (60.0%) | 22 (40.0%) |
| Total (Category) | 69 (53.9%) | 59 (46.1%) |
| Total (Overall) | 429 (51.8%) | 399 (48.2%) |
Employment Industries by Sex in Edmonston
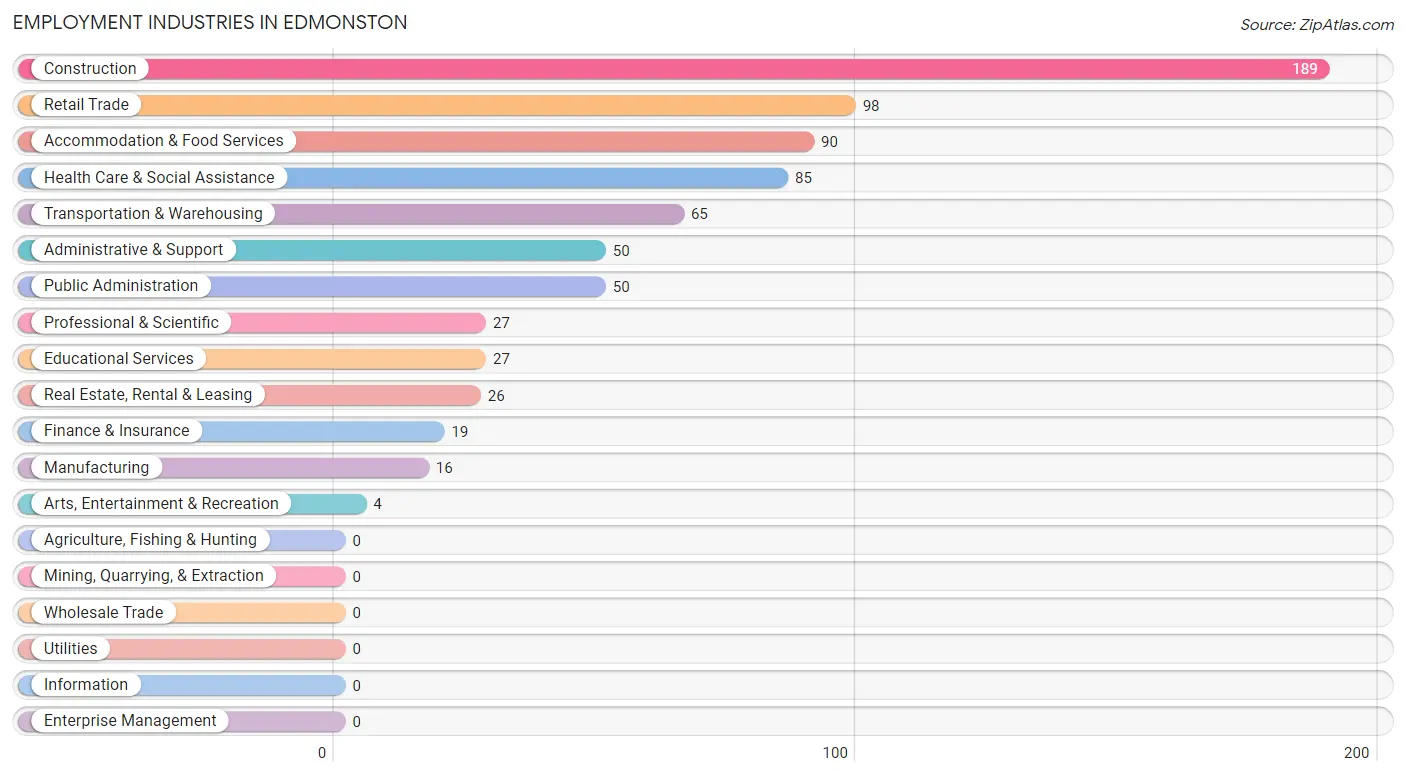
Employment Industries in Edmonston
The major employment industries in Edmonston include Construction (189 | 22.8%), Retail Trade (98 | 11.8%), Accommodation & Food Services (90 | 10.9%), Health Care & Social Assistance (85 | 10.3%), and Transportation & Warehousing (65 | 7.9%).
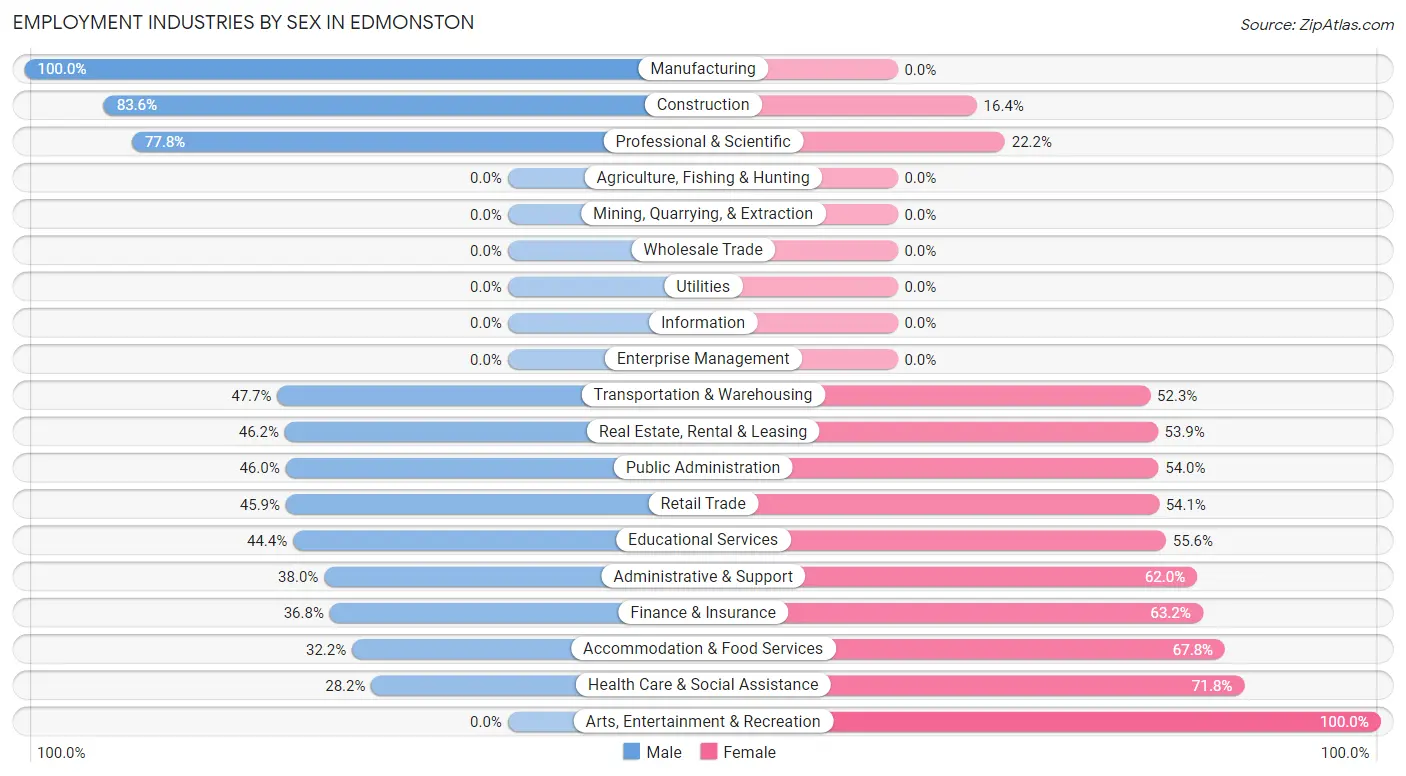
Employment Industries by Sex in Edmonston
The Edmonston industries that see more men than women are Manufacturing (100.0%), Construction (83.6%), and Professional & Scientific (77.8%), whereas the industries that tend to have a higher number of women are Arts, Entertainment & Recreation (100.0%), Health Care & Social Assistance (71.8%), and Accommodation & Food Services (67.8%).
| Industry | Male | Female |
| Agriculture, Fishing & Hunting | 0 (0.0%) | 0 (0.0%) |
| Mining, Quarrying, & Extraction | 0 (0.0%) | 0 (0.0%) |
| Construction | 158 (83.6%) | 31 (16.4%) |
| Manufacturing | 16 (100.0%) | 0 (0.0%) |
| Wholesale Trade | 0 (0.0%) | 0 (0.0%) |
| Retail Trade | 45 (45.9%) | 53 (54.1%) |
| Transportation & Warehousing | 31 (47.7%) | 34 (52.3%) |
| Utilities | 0 (0.0%) | 0 (0.0%) |
| Information | 0 (0.0%) | 0 (0.0%) |
| Finance & Insurance | 7 (36.8%) | 12 (63.2%) |
| Real Estate, Rental & Leasing | 12 (46.2%) | 14 (53.8%) |
| Professional & Scientific | 21 (77.8%) | 6 (22.2%) |
| Enterprise Management | 0 (0.0%) | 0 (0.0%) |
| Administrative & Support | 19 (38.0%) | 31 (62.0%) |
| Educational Services | 12 (44.4%) | 15 (55.6%) |
| Health Care & Social Assistance | 24 (28.2%) | 61 (71.8%) |
| Arts, Entertainment & Recreation | 0 (0.0%) | 4 (100.0%) |
| Accommodation & Food Services | 29 (32.2%) | 61 (67.8%) |
| Public Administration | 23 (46.0%) | 27 (54.0%) |
| Total | 429 (51.8%) | 399 (48.2%) |
Education in Edmonston
School Enrollment in Edmonston
The most common levels of schooling among the 473 students in Edmonston are high school (165 | 34.9%), middle school (140 | 29.6%), and elementary school (77 | 16.3%).
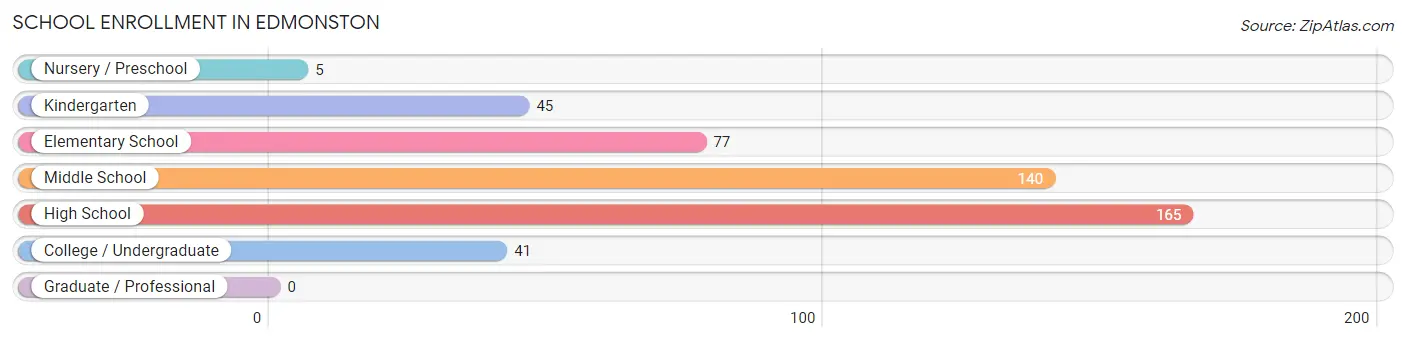
| School Level | # Students | % Students |
| Nursery / Preschool | 5 | 1.1% |
| Kindergarten | 45 | 9.5% |
| Elementary School | 77 | 16.3% |
| Middle School | 140 | 29.6% |
| High School | 165 | 34.9% |
| College / Undergraduate | 41 | 8.7% |
| Graduate / Professional | 0 | 0.0% |
| Total | 473 | 100.0% |
School Enrollment by Age by Funding Source in Edmonston
Out of a total of 473 students who are enrolled in schools in Edmonston, 72 (15.2%) attend a private institution, while the remaining 401 (84.8%) are enrolled in public schools. The age group of 3 to 4 year olds has the highest likelihood of being enrolled in private schools, with 1 (100.0% in the age bracket) enrolled. Conversely, the age group of 18 to 19 year olds has the lowest likelihood of being enrolled in a private school, with 30 (100.0% in the age bracket) attending a public institution.
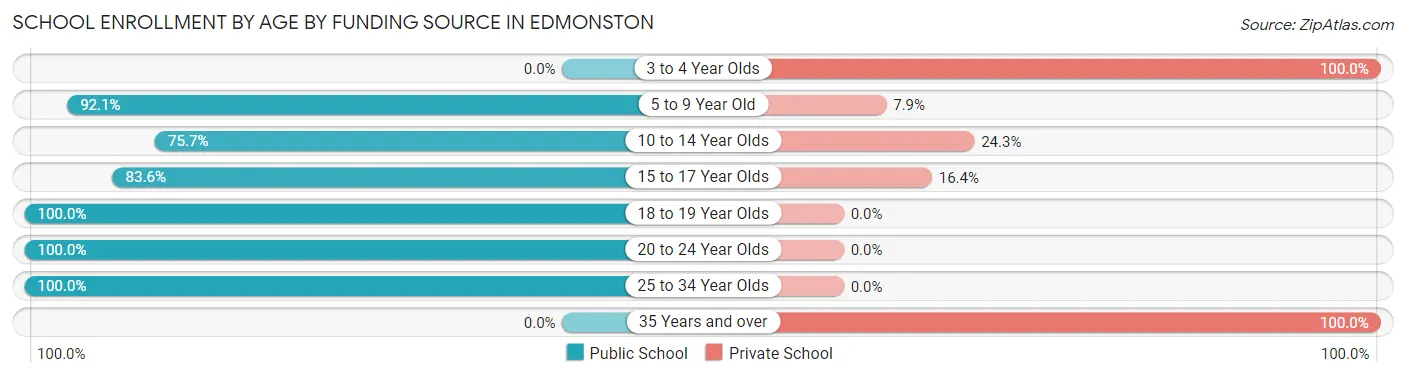
| Age Bracket | Public School | Private School |
| 3 to 4 Year Olds | 0 (0.0%) | 1 (100.0%) |
| 5 to 9 Year Old | 116 (92.1%) | 10 (7.9%) |
| 10 to 14 Year Olds | 112 (75.7%) | 36 (24.3%) |
| 15 to 17 Year Olds | 107 (83.6%) | 21 (16.4%) |
| 18 to 19 Year Olds | 30 (100.0%) | 0 (0.0%) |
| 20 to 24 Year Olds | 24 (100.0%) | 0 (0.0%) |
| 25 to 34 Year Olds | 12 (100.0%) | 0 (0.0%) |
| 35 Years and over | 0 (0.0%) | 4 (100.0%) |
| Total | 401 (84.8%) | 72 (15.2%) |
Educational Attainment by Field of Study in Edmonston
Science & technology (28 | 21.4%), business (24 | 18.3%), engineering (20 | 15.3%), bio, nature & agricultural (11 | 8.4%), and visual & performing arts (11 | 8.4%) are the most common fields of study among 131 individuals in Edmonston who have obtained a bachelor's degree or higher.
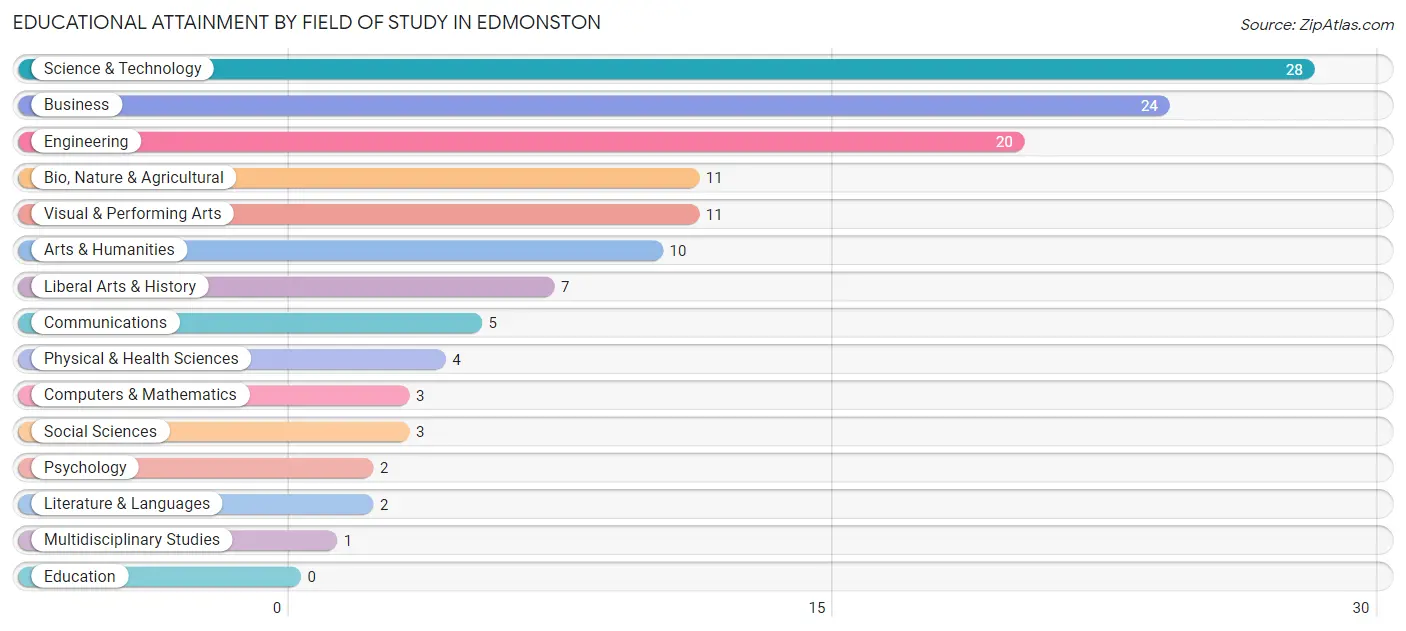
| Field of Study | # Graduates | % Graduates |
| Computers & Mathematics | 3 | 2.3% |
| Bio, Nature & Agricultural | 11 | 8.4% |
| Physical & Health Sciences | 4 | 3.0% |
| Psychology | 2 | 1.5% |
| Social Sciences | 3 | 2.3% |
| Engineering | 20 | 15.3% |
| Multidisciplinary Studies | 1 | 0.8% |
| Science & Technology | 28 | 21.4% |
| Business | 24 | 18.3% |
| Education | 0 | 0.0% |
| Literature & Languages | 2 | 1.5% |
| Liberal Arts & History | 7 | 5.3% |
| Visual & Performing Arts | 11 | 8.4% |
| Communications | 5 | 3.8% |
| Arts & Humanities | 10 | 7.6% |
| Total | 131 | 100.0% |
Transportation & Commute in Edmonston
Vehicle Availability by Sex in Edmonston
The most prevalent vehicle ownership categories in Edmonston are males with 3 vehicles (120, accounting for 28.2%) and females with 3 vehicles (122, making up 31.3%).
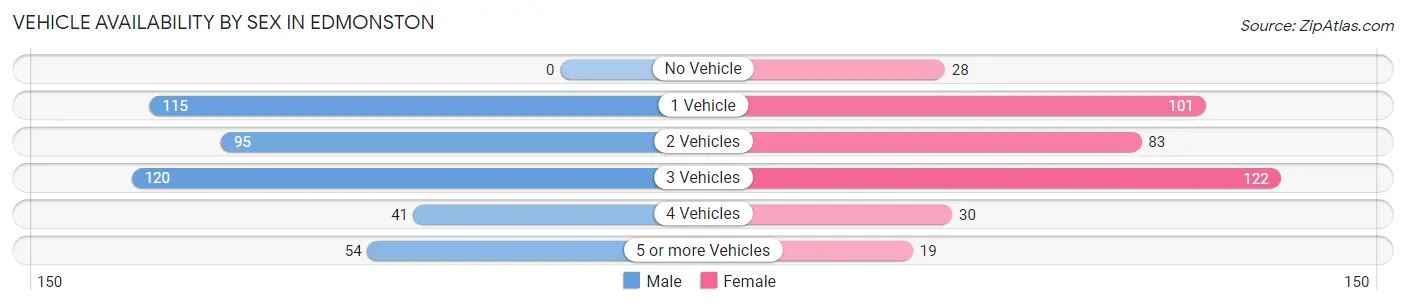
| Vehicles Available | Male | Female |
| No Vehicle | 0 (0.0%) | 28 (7.3%) |
| 1 Vehicle | 115 (27.1%) | 101 (26.4%) |
| 2 Vehicles | 95 (22.4%) | 83 (21.7%) |
| 3 Vehicles | 120 (28.2%) | 122 (31.9%) |
| 4 Vehicles | 41 (9.7%) | 30 (7.8%) |
| 5 or more Vehicles | 54 (12.7%) | 19 (5.0%) |
| Total | 425 (100.0%) | 383 (100.0%) |
Commute Time in Edmonston
The most frequently occuring commute durations in Edmonston are 30 to 34 minutes (138 commuters, 18.1%), 25 to 29 minutes (135 commuters, 17.7%), and 40 to 44 minutes (92 commuters, 12.1%).
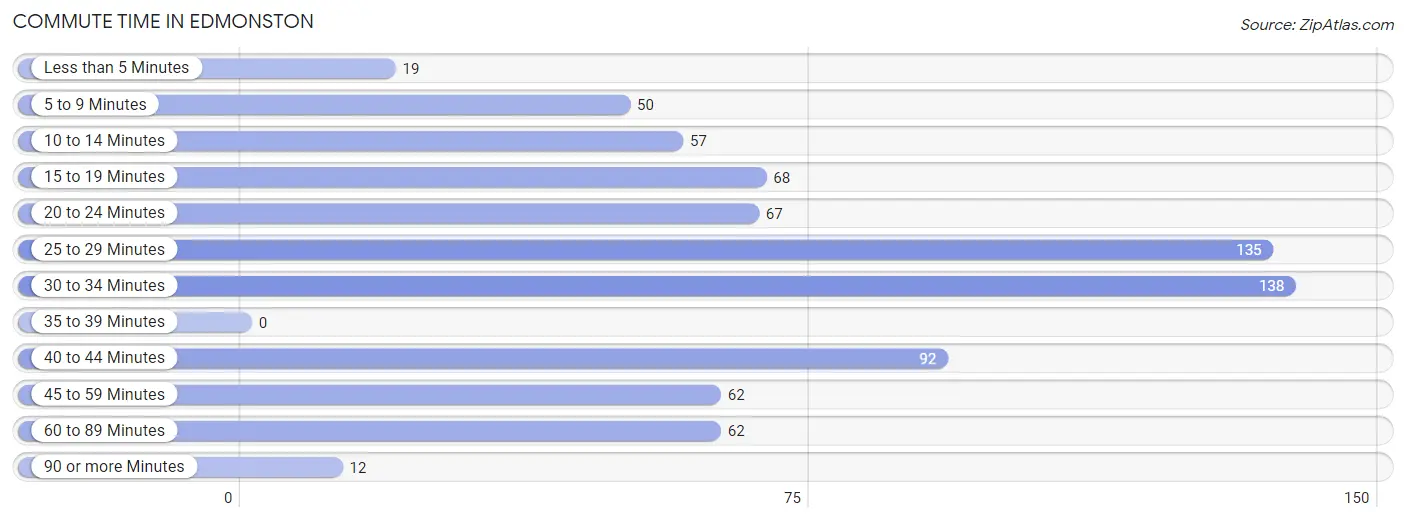
| Commute Time | # Commuters | % Commuters |
| Less than 5 Minutes | 19 | 2.5% |
| 5 to 9 Minutes | 50 | 6.6% |
| 10 to 14 Minutes | 57 | 7.5% |
| 15 to 19 Minutes | 68 | 8.9% |
| 20 to 24 Minutes | 67 | 8.8% |
| 25 to 29 Minutes | 135 | 17.7% |
| 30 to 34 Minutes | 138 | 18.1% |
| 35 to 39 Minutes | 0 | 0.0% |
| 40 to 44 Minutes | 92 | 12.1% |
| 45 to 59 Minutes | 62 | 8.1% |
| 60 to 89 Minutes | 62 | 8.1% |
| 90 or more Minutes | 12 | 1.6% |
Commute Time by Sex in Edmonston
The most common commute times in Edmonston are 25 to 29 minutes (93 commuters, 23.0%) for males and 30 to 34 minutes (80 commuters, 22.4%) for females.
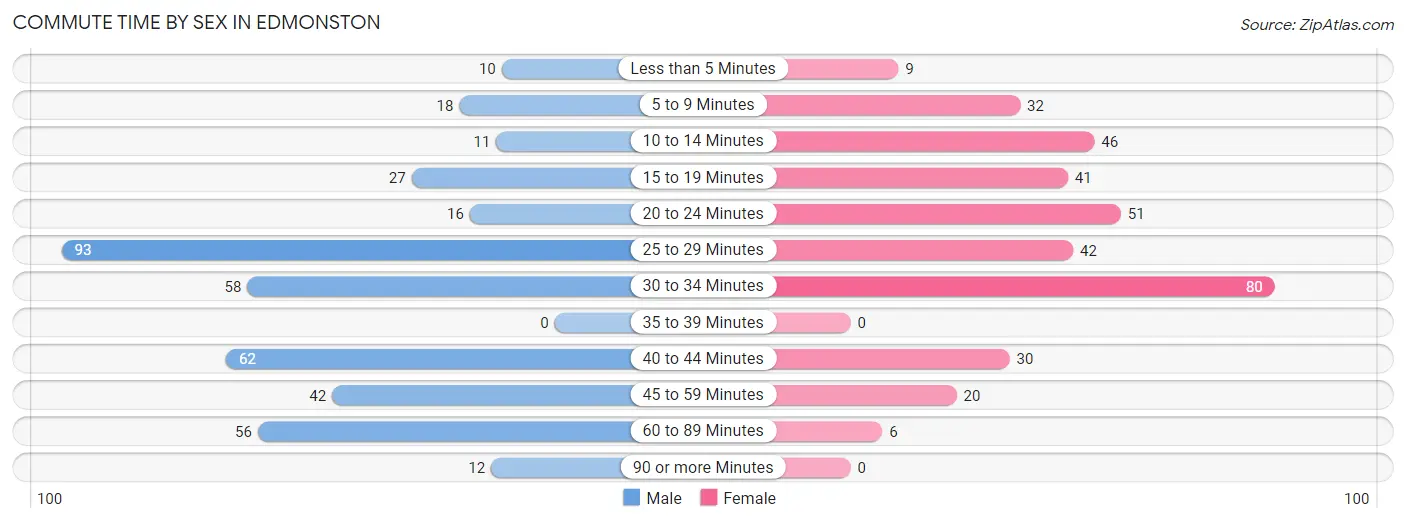
| Commute Time | Male | Female |
| Less than 5 Minutes | 10 (2.5%) | 9 (2.5%) |
| 5 to 9 Minutes | 18 (4.4%) | 32 (9.0%) |
| 10 to 14 Minutes | 11 (2.7%) | 46 (12.9%) |
| 15 to 19 Minutes | 27 (6.7%) | 41 (11.5%) |
| 20 to 24 Minutes | 16 (4.0%) | 51 (14.3%) |
| 25 to 29 Minutes | 93 (23.0%) | 42 (11.8%) |
| 30 to 34 Minutes | 58 (14.3%) | 80 (22.4%) |
| 35 to 39 Minutes | 0 (0.0%) | 0 (0.0%) |
| 40 to 44 Minutes | 62 (15.3%) | 30 (8.4%) |
| 45 to 59 Minutes | 42 (10.4%) | 20 (5.6%) |
| 60 to 89 Minutes | 56 (13.8%) | 6 (1.7%) |
| 90 or more Minutes | 12 (3.0%) | 0 (0.0%) |
Time of Departure to Work by Sex in Edmonston
The most frequent times of departure to work in Edmonston are 8:00 AM to 8:29 AM (52, 12.8%) for males and 4:00 PM to 11:59 PM (68, 19.1%) for females.
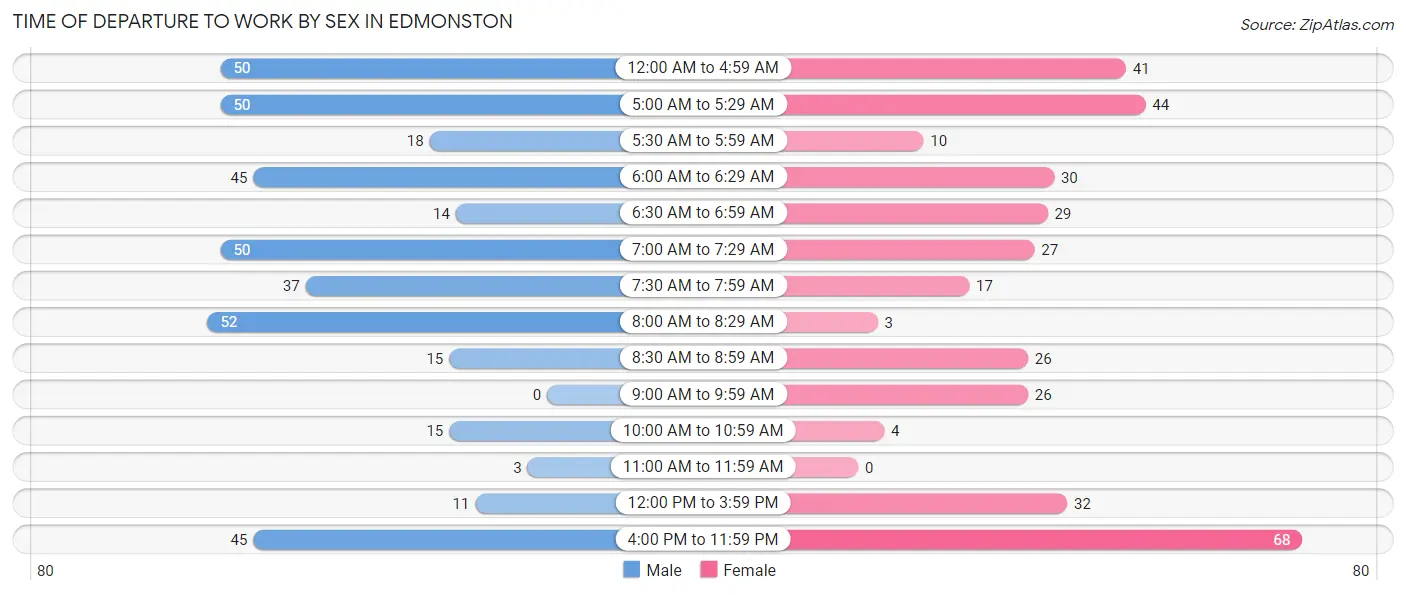
| Time of Departure | Male | Female |
| 12:00 AM to 4:59 AM | 50 (12.3%) | 41 (11.5%) |
| 5:00 AM to 5:29 AM | 50 (12.3%) | 44 (12.3%) |
| 5:30 AM to 5:59 AM | 18 (4.4%) | 10 (2.8%) |
| 6:00 AM to 6:29 AM | 45 (11.1%) | 30 (8.4%) |
| 6:30 AM to 6:59 AM | 14 (3.5%) | 29 (8.1%) |
| 7:00 AM to 7:29 AM | 50 (12.3%) | 27 (7.6%) |
| 7:30 AM to 7:59 AM | 37 (9.1%) | 17 (4.8%) |
| 8:00 AM to 8:29 AM | 52 (12.8%) | 3 (0.8%) |
| 8:30 AM to 8:59 AM | 15 (3.7%) | 26 (7.3%) |
| 9:00 AM to 9:59 AM | 0 (0.0%) | 26 (7.3%) |
| 10:00 AM to 10:59 AM | 15 (3.7%) | 4 (1.1%) |
| 11:00 AM to 11:59 AM | 3 (0.7%) | 0 (0.0%) |
| 12:00 PM to 3:59 PM | 11 (2.7%) | 32 (9.0%) |
| 4:00 PM to 11:59 PM | 45 (11.1%) | 68 (19.1%) |
| Total | 405 (100.0%) | 357 (100.0%) |
Housing Occupancy in Edmonston
Occupancy by Ownership in Edmonston
Of the total 449 dwellings in Edmonston, owner-occupied units account for 259 (57.7%), while renter-occupied units make up 190 (42.3%).
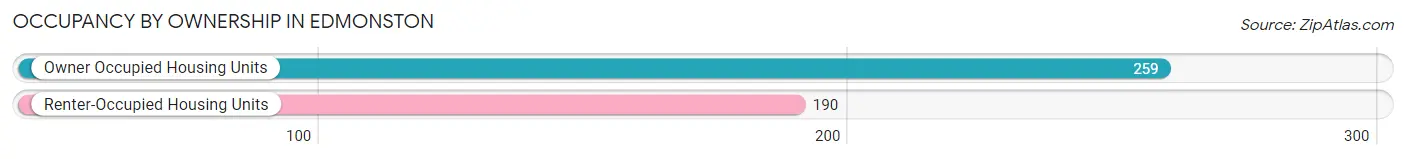
| Occupancy | # Housing Units | % Housing Units |
| Owner Occupied Housing Units | 259 | 57.7% |
| Renter-Occupied Housing Units | 190 | 42.3% |
| Total Occupied Housing Units | 449 | 100.0% |
Occupancy by Household Size in Edmonston
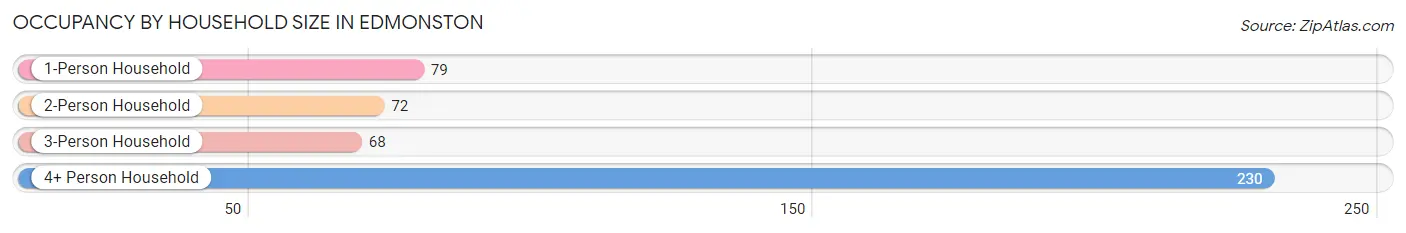
| Household Size | # Housing Units | % Housing Units |
| 1-Person Household | 79 | 17.6% |
| 2-Person Household | 72 | 16.0% |
| 3-Person Household | 68 | 15.1% |
| 4+ Person Household | 230 | 51.2% |
| Total Housing Units | 449 | 100.0% |
Occupancy by Ownership by Household Size in Edmonston
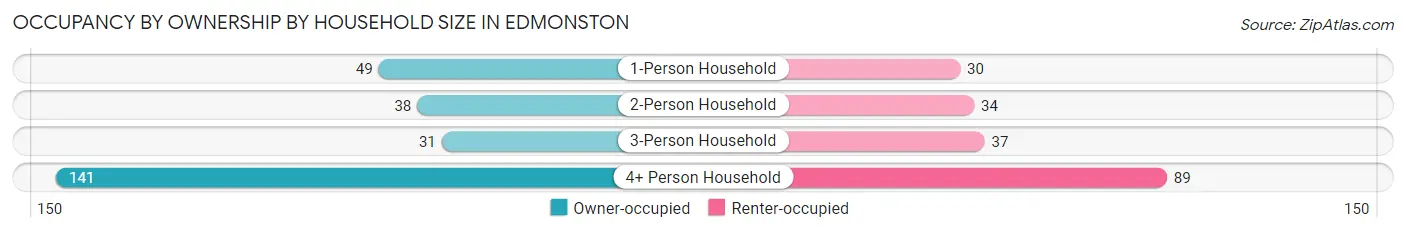
| Household Size | Owner-occupied | Renter-occupied |
| 1-Person Household | 49 (62.0%) | 30 (38.0%) |
| 2-Person Household | 38 (52.8%) | 34 (47.2%) |
| 3-Person Household | 31 (45.6%) | 37 (54.4%) |
| 4+ Person Household | 141 (61.3%) | 89 (38.7%) |
| Total Housing Units | 259 (57.7%) | 190 (42.3%) |
Occupancy by Educational Attainment in Edmonston
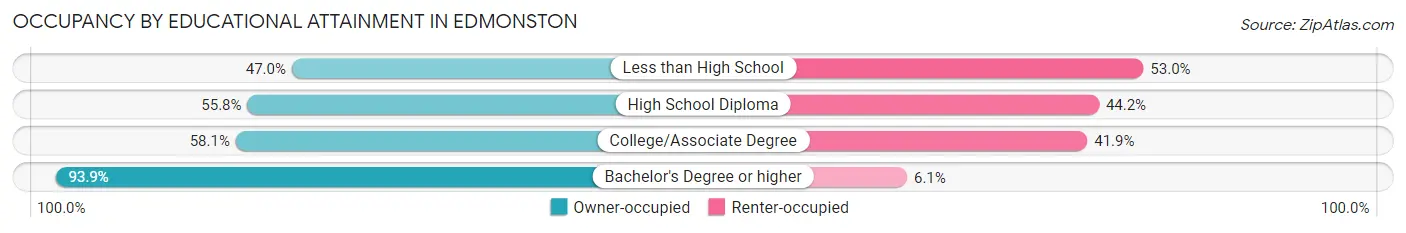
| Household Size | Owner-occupied | Renter-occupied |
| Less than High School | 71 (47.0%) | 80 (53.0%) |
| High School Diploma | 67 (55.8%) | 53 (44.2%) |
| College/Associate Degree | 75 (58.1%) | 54 (41.9%) |
| Bachelor's Degree or higher | 46 (93.9%) | 3 (6.1%) |
Occupancy by Age of Householder in Edmonston
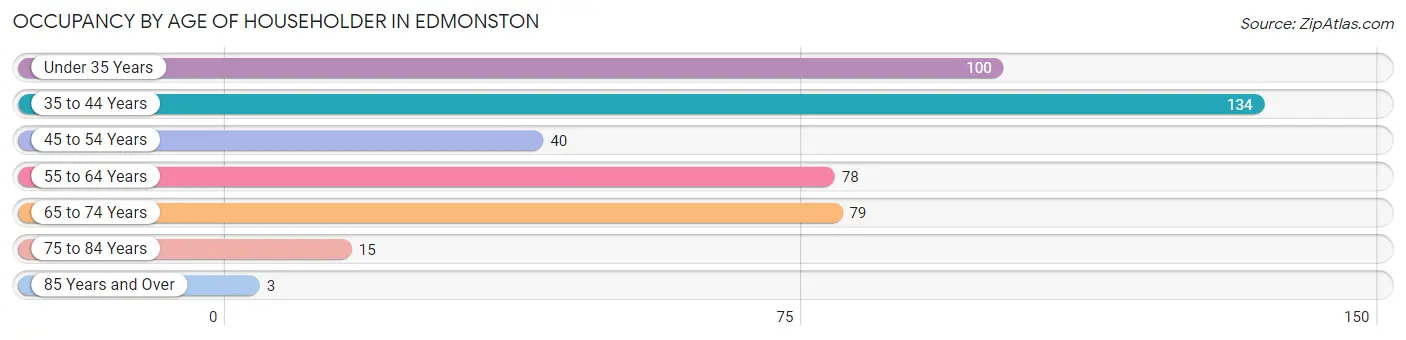
| Age Bracket | # Households | % Households |
| Under 35 Years | 100 | 22.3% |
| 35 to 44 Years | 134 | 29.8% |
| 45 to 54 Years | 40 | 8.9% |
| 55 to 64 Years | 78 | 17.4% |
| 65 to 74 Years | 79 | 17.6% |
| 75 to 84 Years | 15 | 3.3% |
| 85 Years and Over | 3 | 0.7% |
| Total | 449 | 100.0% |
Housing Finances in Edmonston
Median Income by Occupancy in Edmonston
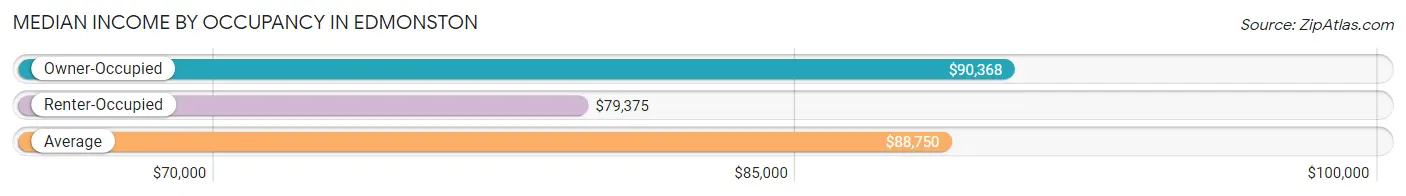
| Occupancy Type | # Households | Median Income |
| Owner-Occupied | 259 (57.7%) | $90,368 |
| Renter-Occupied | 190 (42.3%) | $79,375 |
| Average | 449 (100.0%) | $88,750 |
Occupancy by Householder Income Bracket in Edmonston
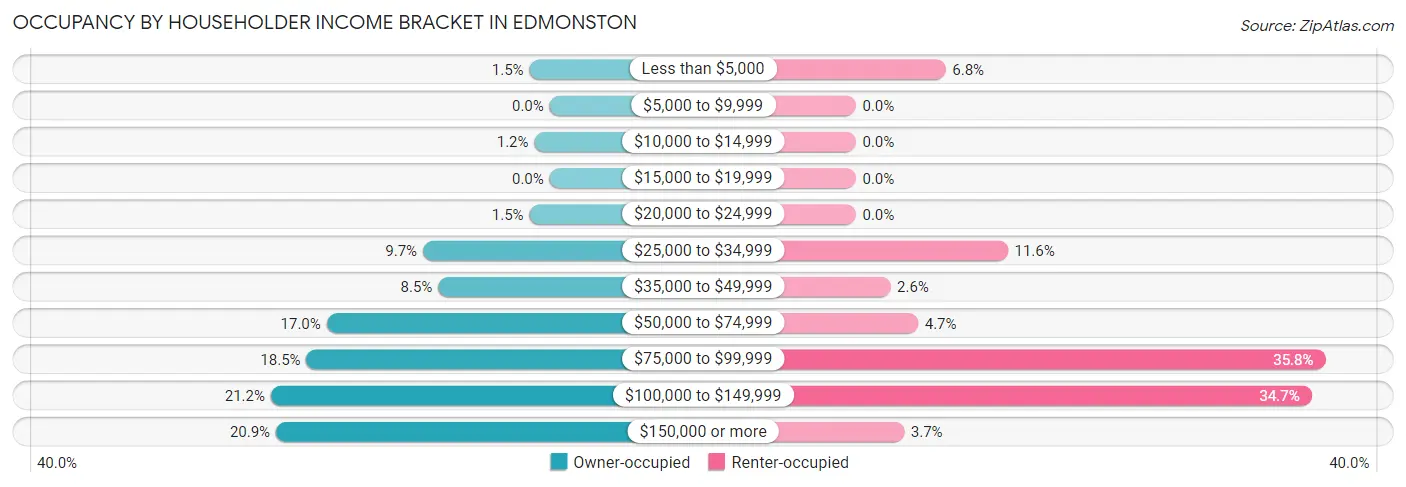
| Income Bracket | Owner-occupied | Renter-occupied |
| Less than $5,000 | 4 (1.5%) | 13 (6.8%) |
| $5,000 to $9,999 | 0 (0.0%) | 0 (0.0%) |
| $10,000 to $14,999 | 3 (1.2%) | 0 (0.0%) |
| $15,000 to $19,999 | 0 (0.0%) | 0 (0.0%) |
| $20,000 to $24,999 | 4 (1.5%) | 0 (0.0%) |
| $25,000 to $34,999 | 25 (9.7%) | 22 (11.6%) |
| $35,000 to $49,999 | 22 (8.5%) | 5 (2.6%) |
| $50,000 to $74,999 | 44 (17.0%) | 9 (4.7%) |
| $75,000 to $99,999 | 48 (18.5%) | 68 (35.8%) |
| $100,000 to $149,999 | 55 (21.2%) | 66 (34.7%) |
| $150,000 or more | 54 (20.8%) | 7 (3.7%) |
| Total | 259 (100.0%) | 190 (100.0%) |
Monthly Housing Cost Tiers in Edmonston
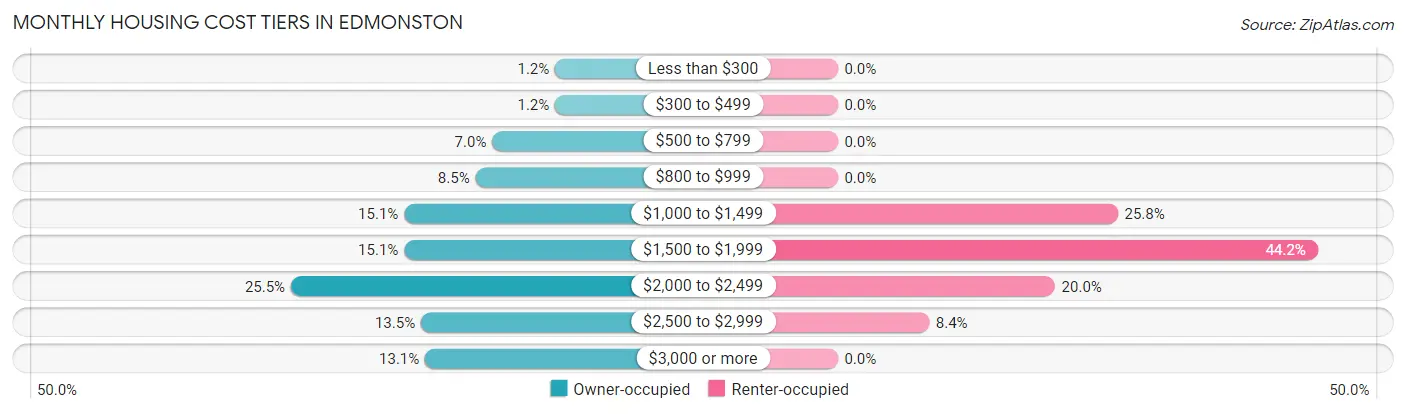
| Monthly Cost | Owner-occupied | Renter-occupied |
| Less than $300 | 3 (1.2%) | 0 (0.0%) |
| $300 to $499 | 3 (1.2%) | 0 (0.0%) |
| $500 to $799 | 18 (7.0%) | 0 (0.0%) |
| $800 to $999 | 22 (8.5%) | 0 (0.0%) |
| $1,000 to $1,499 | 39 (15.1%) | 49 (25.8%) |
| $1,500 to $1,999 | 39 (15.1%) | 84 (44.2%) |
| $2,000 to $2,499 | 66 (25.5%) | 38 (20.0%) |
| $2,500 to $2,999 | 35 (13.5%) | 16 (8.4%) |
| $3,000 or more | 34 (13.1%) | 0 (0.0%) |
| Total | 259 (100.0%) | 190 (100.0%) |
Physical Housing Characteristics in Edmonston
Housing Structures in Edmonston
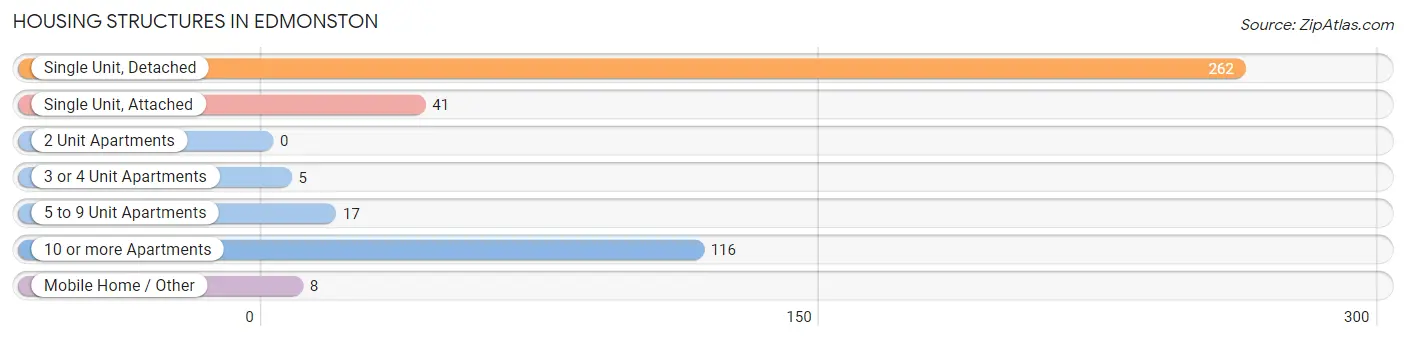
| Structure Type | # Housing Units | % Housing Units |
| Single Unit, Detached | 262 | 58.4% |
| Single Unit, Attached | 41 | 9.1% |
| 2 Unit Apartments | 0 | 0.0% |
| 3 or 4 Unit Apartments | 5 | 1.1% |
| 5 to 9 Unit Apartments | 17 | 3.8% |
| 10 or more Apartments | 116 | 25.8% |
| Mobile Home / Other | 8 | 1.8% |
| Total | 449 | 100.0% |
Housing Structures by Occupancy in Edmonston
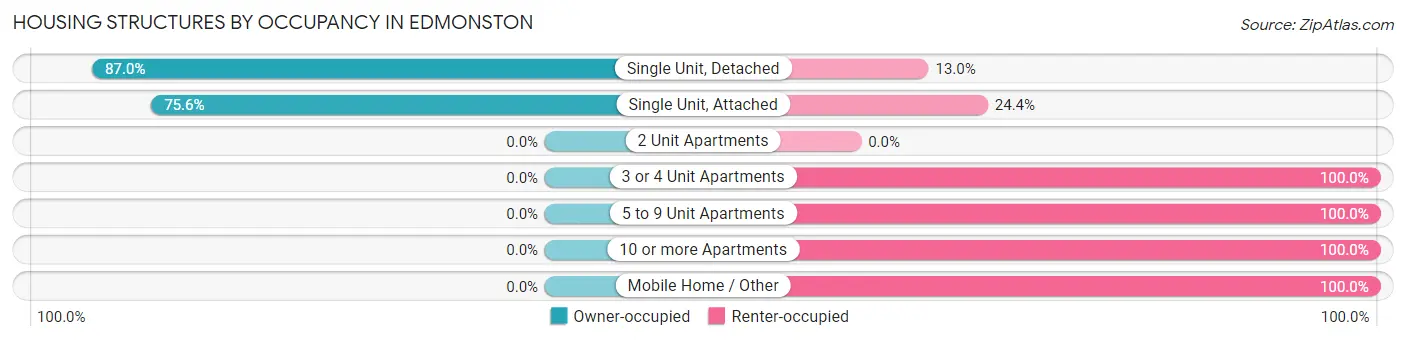
| Structure Type | Owner-occupied | Renter-occupied |
| Single Unit, Detached | 228 (87.0%) | 34 (13.0%) |
| Single Unit, Attached | 31 (75.6%) | 10 (24.4%) |
| 2 Unit Apartments | 0 (0.0%) | 0 (0.0%) |
| 3 or 4 Unit Apartments | 0 (0.0%) | 5 (100.0%) |
| 5 to 9 Unit Apartments | 0 (0.0%) | 17 (100.0%) |
| 10 or more Apartments | 0 (0.0%) | 116 (100.0%) |
| Mobile Home / Other | 0 (0.0%) | 8 (100.0%) |
| Total | 259 (57.7%) | 190 (42.3%) |
Housing Structures by Number of Rooms in Edmonston

| Number of Rooms | Owner-occupied | Renter-occupied |
| 1 Room | 0 (0.0%) | 13 (6.8%) |
| 2 or 3 Rooms | 7 (2.7%) | 68 (35.8%) |
| 4 or 5 Rooms | 36 (13.9%) | 61 (32.1%) |
| 6 or 7 Rooms | 115 (44.4%) | 41 (21.6%) |
| 8 or more Rooms | 101 (39.0%) | 7 (3.7%) |
| Total | 259 (100.0%) | 190 (100.0%) |
Housing Structure by Heating Type in Edmonston
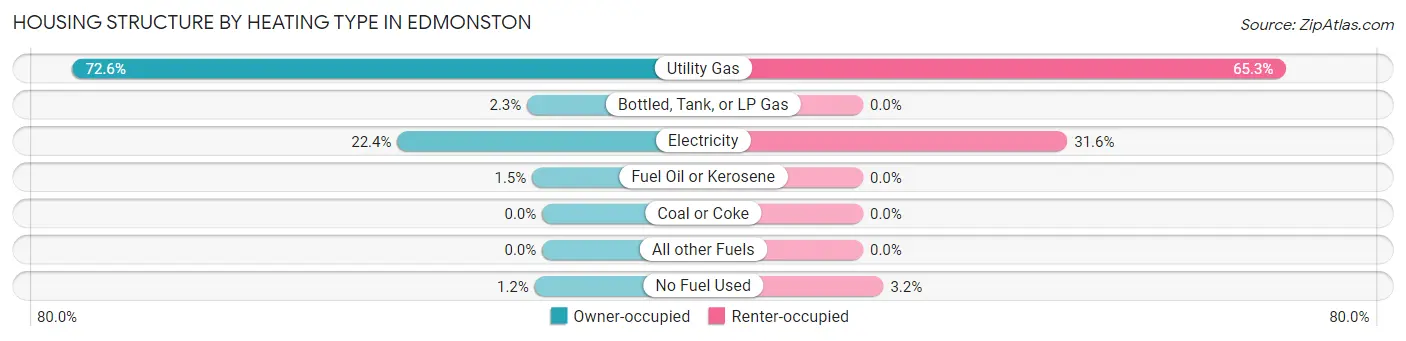
| Heating Type | Owner-occupied | Renter-occupied |
| Utility Gas | 188 (72.6%) | 124 (65.3%) |
| Bottled, Tank, or LP Gas | 6 (2.3%) | 0 (0.0%) |
| Electricity | 58 (22.4%) | 60 (31.6%) |
| Fuel Oil or Kerosene | 4 (1.5%) | 0 (0.0%) |
| Coal or Coke | 0 (0.0%) | 0 (0.0%) |
| All other Fuels | 0 (0.0%) | 0 (0.0%) |
| No Fuel Used | 3 (1.2%) | 6 (3.2%) |
| Total | 259 (100.0%) | 190 (100.0%) |
Household Vehicle Usage in Edmonston
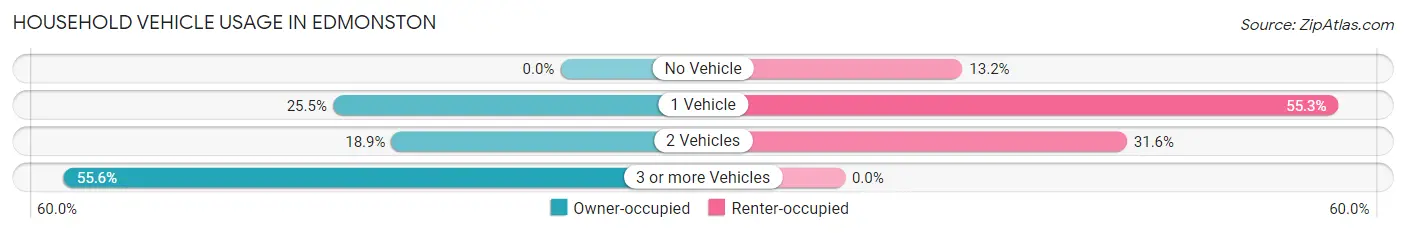
| Vehicles per Household | Owner-occupied | Renter-occupied |
| No Vehicle | 0 (0.0%) | 25 (13.2%) |
| 1 Vehicle | 66 (25.5%) | 105 (55.3%) |
| 2 Vehicles | 49 (18.9%) | 60 (31.6%) |
| 3 or more Vehicles | 144 (55.6%) | 0 (0.0%) |
| Total | 259 (100.0%) | 190 (100.0%) |
Real Estate & Mortgages in Edmonston
Real Estate and Mortgage Overview in Edmonston
| Characteristic | Without Mortgage | With Mortgage |
| Housing Units | 56 | 203 |
| Median Property Value | $322,200 | $368,100 |
| Median Household Income | $63,333 | $47 |
| Monthly Housing Costs | $824 | $34 |
| Real Estate Taxes | $4,583 | $0 |
Property Value by Mortgage Status in Edmonston
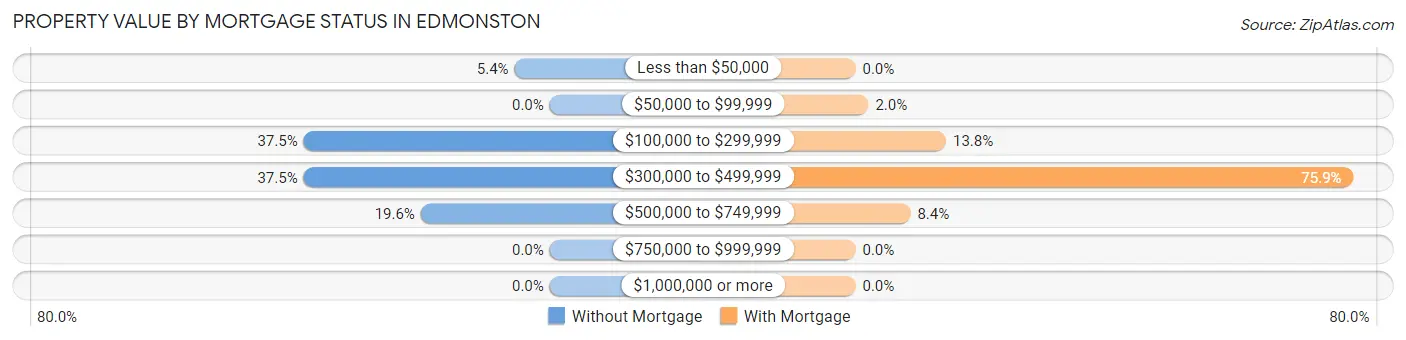
| Property Value | Without Mortgage | With Mortgage |
| Less than $50,000 | 3 (5.4%) | 0 (0.0%) |
| $50,000 to $99,999 | 0 (0.0%) | 4 (2.0%) |
| $100,000 to $299,999 | 21 (37.5%) | 28 (13.8%) |
| $300,000 to $499,999 | 21 (37.5%) | 154 (75.9%) |
| $500,000 to $749,999 | 11 (19.6%) | 17 (8.4%) |
| $750,000 to $999,999 | 0 (0.0%) | 0 (0.0%) |
| $1,000,000 or more | 0 (0.0%) | 0 (0.0%) |
| Total | 56 (100.0%) | 203 (100.0%) |
Household Income by Mortgage Status in Edmonston
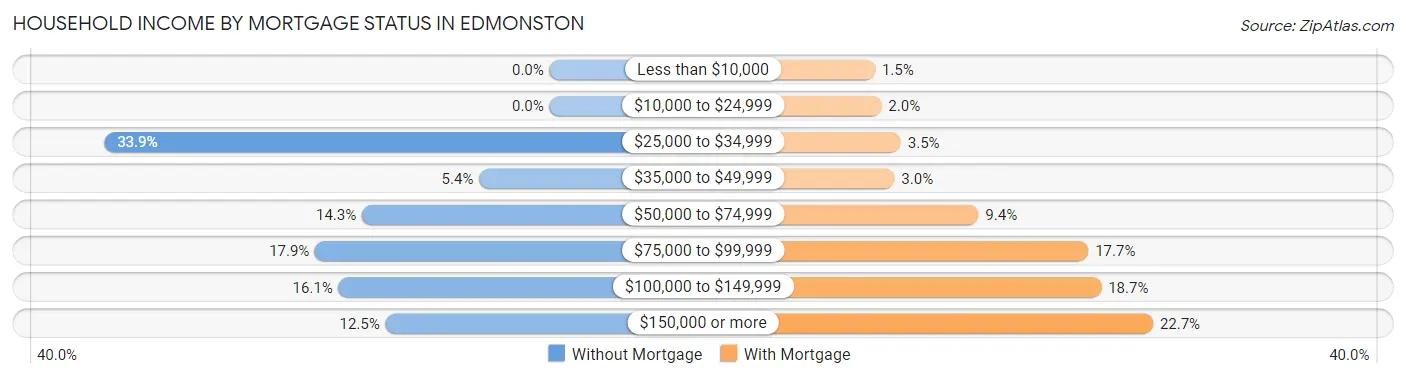
| Household Income | Without Mortgage | With Mortgage |
| Less than $10,000 | 0 (0.0%) | 3 (1.5%) |
| $10,000 to $24,999 | 0 (0.0%) | 4 (2.0%) |
| $25,000 to $34,999 | 19 (33.9%) | 7 (3.5%) |
| $35,000 to $49,999 | 3 (5.4%) | 6 (3.0%) |
| $50,000 to $74,999 | 8 (14.3%) | 19 (9.4%) |
| $75,000 to $99,999 | 10 (17.9%) | 36 (17.7%) |
| $100,000 to $149,999 | 9 (16.1%) | 38 (18.7%) |
| $150,000 or more | 7 (12.5%) | 46 (22.7%) |
| Total | 56 (100.0%) | 203 (100.0%) |
Property Value to Household Income Ratio in Edmonston
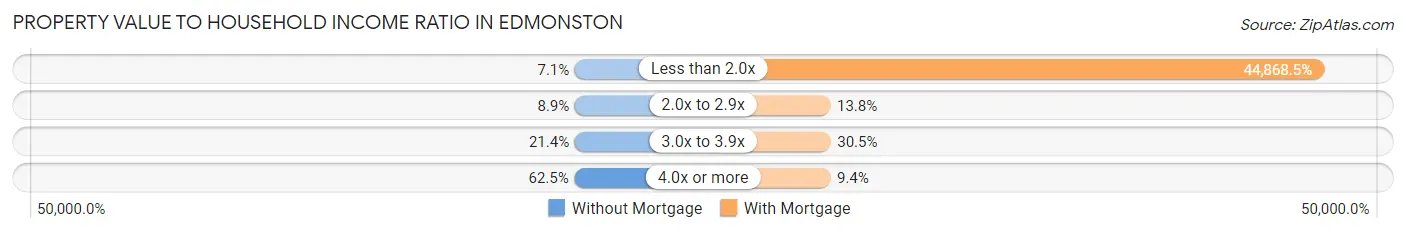
| Value-to-Income Ratio | Without Mortgage | With Mortgage |
| Less than 2.0x | 4 (7.1%) | 91,083 (44,868.5%) |
| 2.0x to 2.9x | 5 (8.9%) | 28 (13.8%) |
| 3.0x to 3.9x | 12 (21.4%) | 62 (30.5%) |
| 4.0x or more | 35 (62.5%) | 19 (9.4%) |
| Total | 56 (100.0%) | 203 (100.0%) |
Real Estate Taxes by Mortgage Status in Edmonston
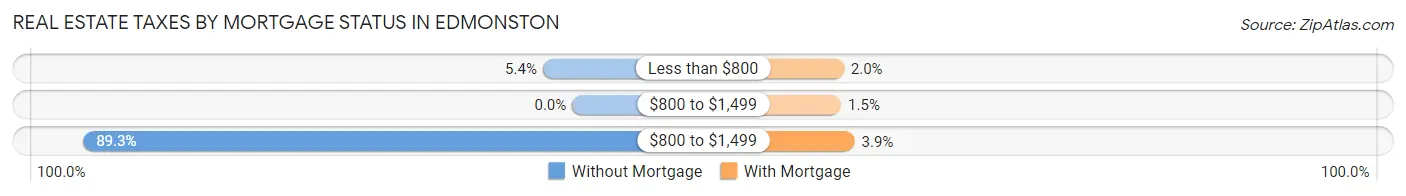
| Property Taxes | Without Mortgage | With Mortgage |
| Less than $800 | 3 (5.4%) | 4 (2.0%) |
| $800 to $1,499 | 0 (0.0%) | 3 (1.5%) |
| $800 to $1,499 | 50 (89.3%) | 8 (3.9%) |
| Total | 56 (100.0%) | 203 (100.0%) |
Health & Disability in Edmonston
Health Insurance Coverage by Age in Edmonston
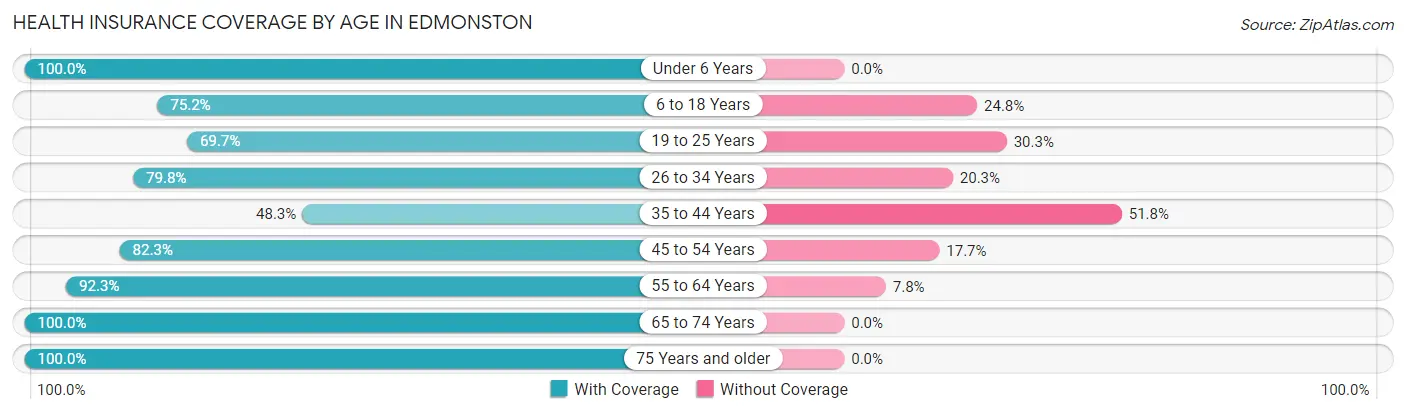
| Age Bracket | With Coverage | Without Coverage |
| Under 6 Years | 220 (100.0%) | 0 (0.0%) |
| 6 to 18 Years | 325 (75.2%) | 107 (24.8%) |
| 19 to 25 Years | 122 (69.7%) | 53 (30.3%) |
| 26 to 34 Years | 193 (79.7%) | 49 (20.3%) |
| 35 to 44 Years | 124 (48.2%) | 133 (51.7%) |
| 45 to 54 Years | 116 (82.3%) | 25 (17.7%) |
| 55 to 64 Years | 131 (92.2%) | 11 (7.7%) |
| 65 to 74 Years | 122 (100.0%) | 0 (0.0%) |
| 75 Years and older | 20 (100.0%) | 0 (0.0%) |
| Total | 1,373 (78.4%) | 378 (21.6%) |
Health Insurance Coverage by Citizenship Status in Edmonston
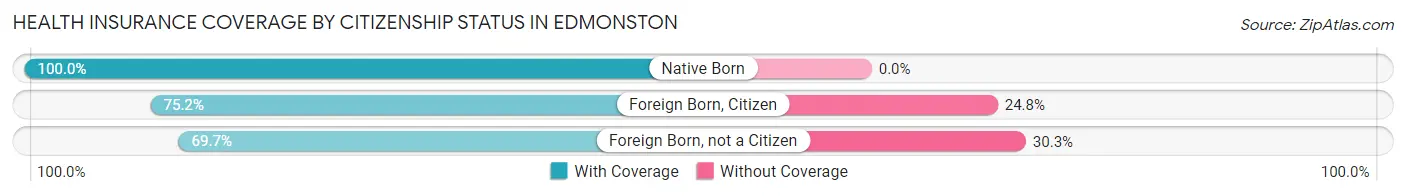
| Citizenship Status | With Coverage | Without Coverage |
| Native Born | 220 (100.0%) | 0 (0.0%) |
| Foreign Born, Citizen | 325 (75.2%) | 107 (24.8%) |
| Foreign Born, not a Citizen | 122 (69.7%) | 53 (30.3%) |
Health Insurance Coverage by Household Income in Edmonston
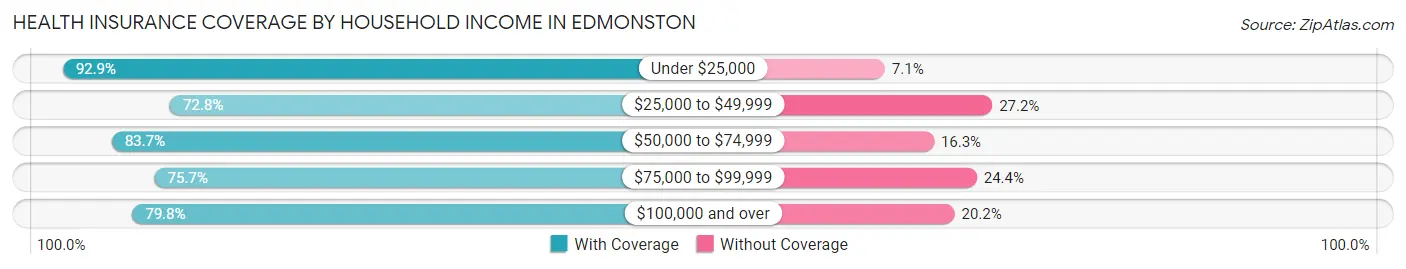
| Household Income | With Coverage | Without Coverage |
| Under $25,000 | 52 (92.9%) | 4 (7.1%) |
| $25,000 to $49,999 | 187 (72.8%) | 70 (27.2%) |
| $50,000 to $74,999 | 123 (83.7%) | 24 (16.3%) |
| $75,000 to $99,999 | 351 (75.6%) | 113 (24.3%) |
| $100,000 and over | 660 (79.8%) | 167 (20.2%) |
Public vs Private Health Insurance Coverage by Age in Edmonston
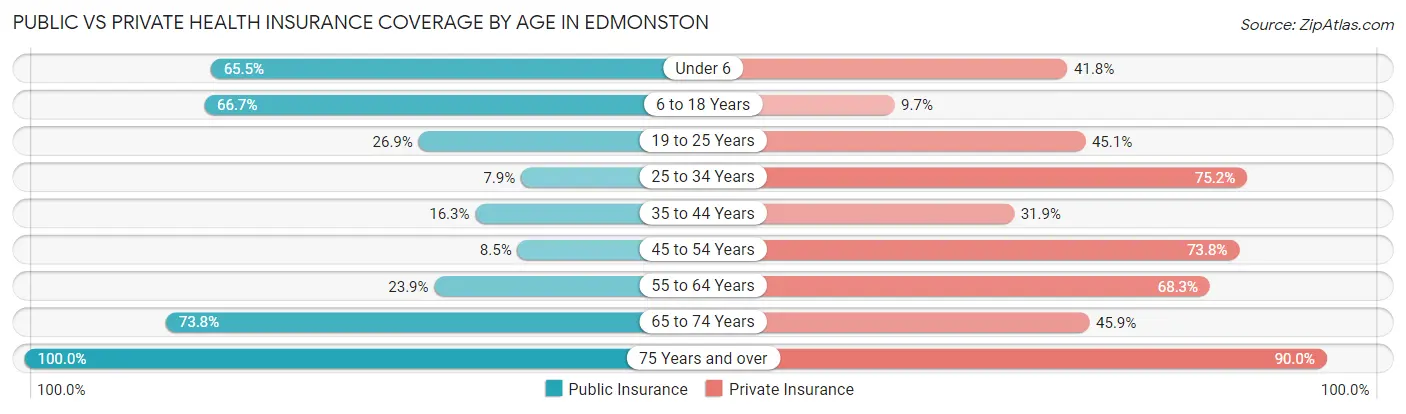
| Age Bracket | Public Insurance | Private Insurance |
| Under 6 | 144 (65.4%) | 92 (41.8%) |
| 6 to 18 Years | 288 (66.7%) | 42 (9.7%) |
| 19 to 25 Years | 47 (26.9%) | 79 (45.1%) |
| 25 to 34 Years | 19 (7.9%) | 182 (75.2%) |
| 35 to 44 Years | 42 (16.3%) | 82 (31.9%) |
| 45 to 54 Years | 12 (8.5%) | 104 (73.8%) |
| 55 to 64 Years | 34 (23.9%) | 97 (68.3%) |
| 65 to 74 Years | 90 (73.8%) | 56 (45.9%) |
| 75 Years and over | 20 (100.0%) | 18 (90.0%) |
| Total | 696 (39.8%) | 752 (42.9%) |
Disability Status by Sex by Age in Edmonston
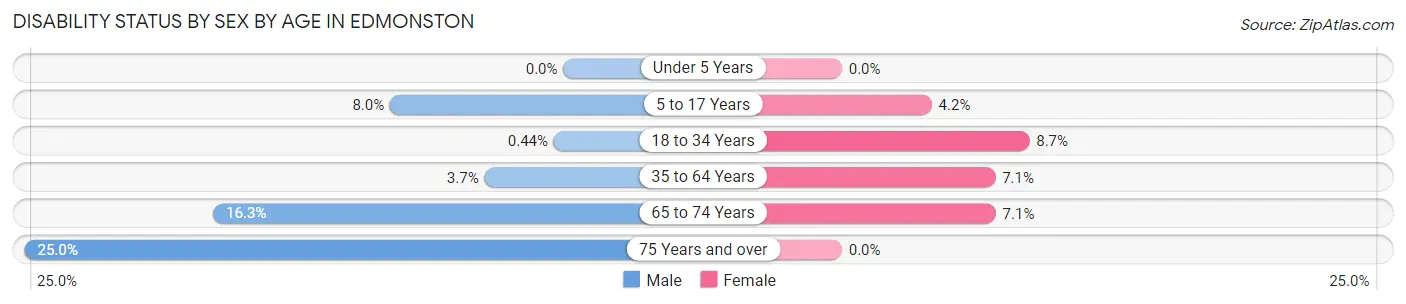
| Age Bracket | Male | Female |
| Under 5 Years | 0 (0.0%) | 0 (0.0%) |
| 5 to 17 Years | 18 (8.0%) | 8 (4.2%) |
| 18 to 34 Years | 1 (0.4%) | 20 (8.7%) |
| 35 to 64 Years | 10 (3.7%) | 19 (7.1%) |
| 65 to 74 Years | 13 (16.3%) | 3 (7.1%) |
| 75 Years and over | 3 (25.0%) | 0 (0.0%) |
Disability Class by Sex by Age in Edmonston
Disability Class: Hearing Difficulty
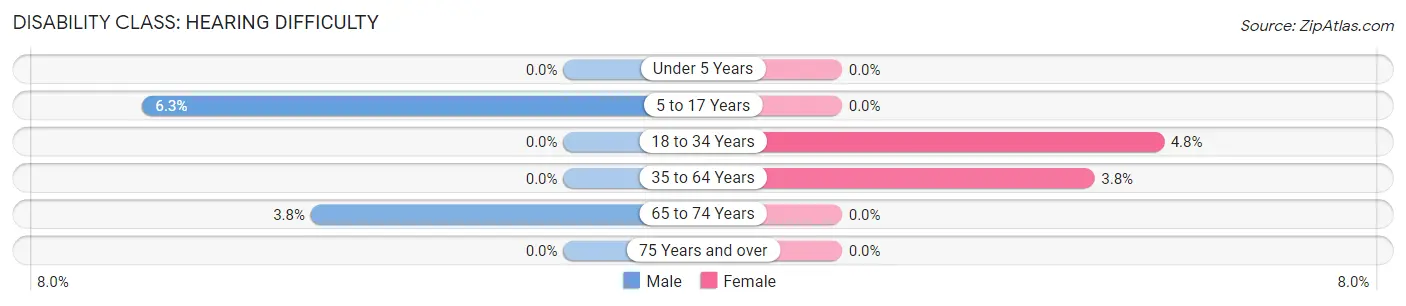
| Age Bracket | Male | Female |
| Under 5 Years | 0 (0.0%) | 0 (0.0%) |
| 5 to 17 Years | 14 (6.2%) | 0 (0.0%) |
| 18 to 34 Years | 0 (0.0%) | 11 (4.8%) |
| 35 to 64 Years | 0 (0.0%) | 10 (3.7%) |
| 65 to 74 Years | 3 (3.7%) | 0 (0.0%) |
| 75 Years and over | 0 (0.0%) | 0 (0.0%) |
Disability Class: Vision Difficulty
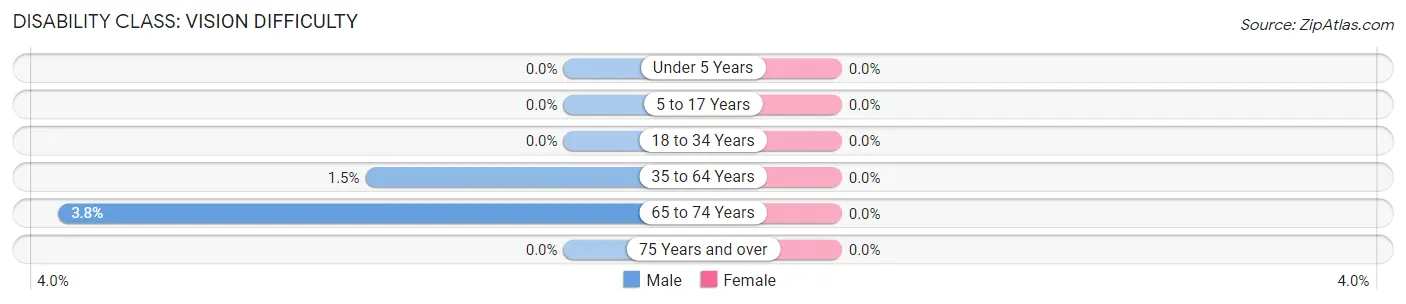
| Age Bracket | Male | Female |
| Under 5 Years | 0 (0.0%) | 0 (0.0%) |
| 5 to 17 Years | 0 (0.0%) | 0 (0.0%) |
| 18 to 34 Years | 0 (0.0%) | 0 (0.0%) |
| 35 to 64 Years | 4 (1.5%) | 0 (0.0%) |
| 65 to 74 Years | 3 (3.7%) | 0 (0.0%) |
| 75 Years and over | 0 (0.0%) | 0 (0.0%) |
Disability Class: Cognitive Difficulty
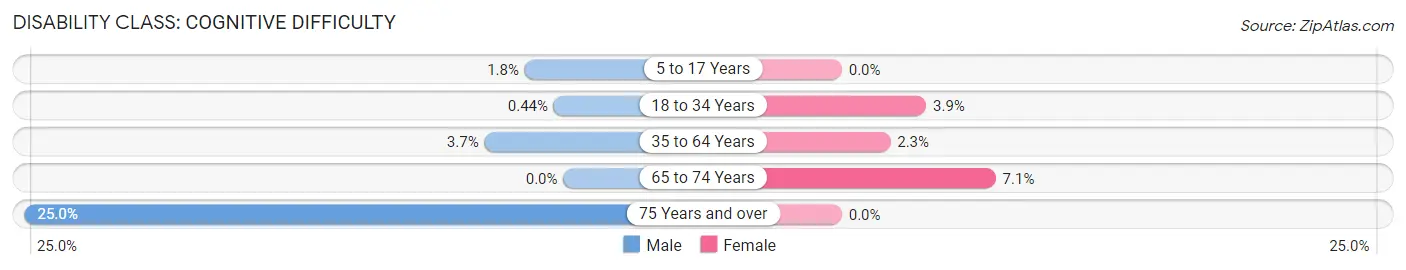
| Age Bracket | Male | Female |
| 5 to 17 Years | 4 (1.8%) | 0 (0.0%) |
| 18 to 34 Years | 1 (0.4%) | 9 (3.9%) |
| 35 to 64 Years | 10 (3.7%) | 6 (2.2%) |
| 65 to 74 Years | 0 (0.0%) | 3 (7.1%) |
| 75 Years and over | 3 (25.0%) | 0 (0.0%) |
Disability Class: Ambulatory Difficulty
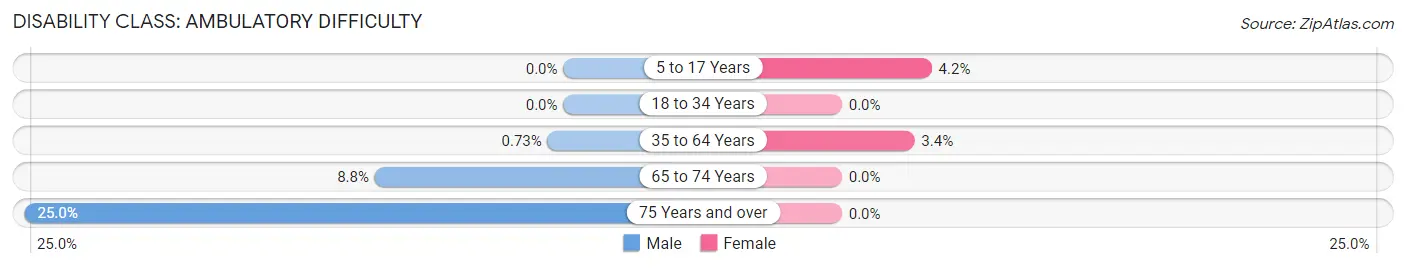
| Age Bracket | Male | Female |
| 5 to 17 Years | 0 (0.0%) | 8 (4.2%) |
| 18 to 34 Years | 0 (0.0%) | 0 (0.0%) |
| 35 to 64 Years | 2 (0.7%) | 9 (3.4%) |
| 65 to 74 Years | 7 (8.7%) | 0 (0.0%) |
| 75 Years and over | 3 (25.0%) | 0 (0.0%) |
Disability Class: Self-Care Difficulty
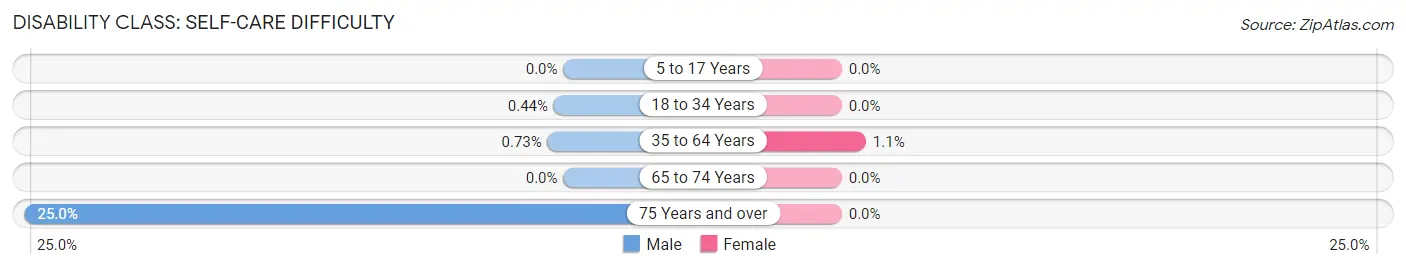
| Age Bracket | Male | Female |
| 5 to 17 Years | 0 (0.0%) | 0 (0.0%) |
| 18 to 34 Years | 1 (0.4%) | 0 (0.0%) |
| 35 to 64 Years | 2 (0.7%) | 3 (1.1%) |
| 65 to 74 Years | 0 (0.0%) | 0 (0.0%) |
| 75 Years and over | 3 (25.0%) | 0 (0.0%) |
Technology Access in Edmonston
Computing Device Access in Edmonston
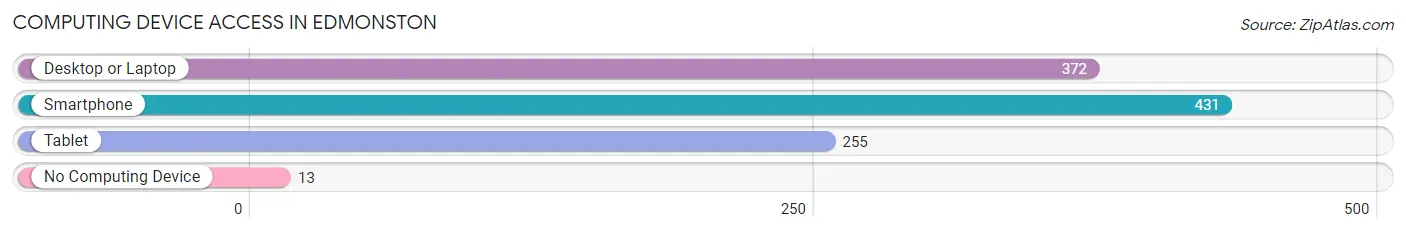
| Device Type | # Households | % Households |
| Desktop or Laptop | 372 | 82.9% |
| Smartphone | 431 | 96.0% |
| Tablet | 255 | 56.8% |
| No Computing Device | 13 | 2.9% |
| Total | 449 | 100.0% |
Internet Access in Edmonston
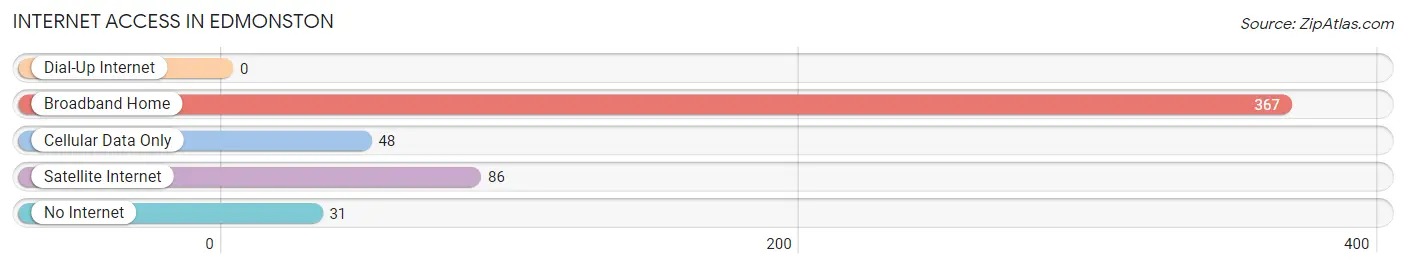
| Internet Type | # Households | % Households |
| Dial-Up Internet | 0 | 0.0% |
| Broadband Home | 367 | 81.7% |
| Cellular Data Only | 48 | 10.7% |
| Satellite Internet | 86 | 19.2% |
| No Internet | 31 | 6.9% |
| Total | 449 | 100.0% |
Edmonston Summary
Edmonston, Maryland is a small town located in Prince George’s County, just outside of Washington, D.C. It is a predominantly African-American community with a population of just over 2,000 people. The town was founded in 1867 by freed slaves and has a rich history of African-American culture and heritage.
History
Edmonston was founded in 1867 by freed slaves who had been living in Washington, D.C. The town was named after William Edmonston, a prominent African-American businessman and philanthropist. Edmonston was one of the first African-American towns in the United States and was a safe haven for freed slaves. The town was incorporated in 1887 and was home to a variety of businesses, churches, and schools.
In the early 20th century, Edmonston was a thriving African-American community. The town was home to a variety of businesses, including a grocery store, a barber shop, a post office, and a movie theater. The town also had a number of churches, including the First Baptist Church of Edmonston, which was founded in 1887.
In the 1950s, Edmonston began to experience a decline in population as many of its residents moved to larger cities in search of better economic opportunities. The town’s population decreased from a peak of over 3,000 in 1950 to just over 2,000 in 2000.
Geography
Edmonston is located in Prince George’s County, Maryland, just outside of Washington, D.C. The town is situated on the banks of the Anacostia River and is bordered by the towns of Hyattsville and Bladensburg. The town covers an area of 0.7 square miles and has a population density of 2,917 people per square mile.
Economy
Edmonston’s economy is largely based on the service industry. The town is home to a variety of businesses, including restaurants, retail stores, and professional services. The town also has a number of government offices, including the Edmonston Police Department and the Edmonston Fire Department.
Demographics
As of the 2010 census, Edmonston had a population of 2,053 people. The town is predominantly African-American, with a population that is 95.3% African-American, 2.2% White, 0.7% Asian, and 0.6% Hispanic or Latino. The median household income in Edmonston is $41,944, and the median age is 37.7 years.
Edmonston is a small town with a rich history and a vibrant African-American culture. The town has a variety of businesses, churches, and government offices, and is a safe and welcoming community for its residents. Edmonston is a great place to live, work, and raise a family.
Common Questions
What is Per Capita Income in Edmonston?
Per Capita income in Edmonston is $25,470.
What is the Median Family Income in Edmonston?
Median Family Income in Edmonston is $92,333.
What is the Median Household income in Edmonston?
Median Household Income in Edmonston is $88,750.
What is Income or Wage Gap in Edmonston?
Income or Wage Gap in Edmonston is 36.7%.
Women in Edmonston earn 63.3 cents for every dollar earned by a man.
What is Family Income Deficit in Edmonston?
Family Income Deficit in Edmonston is $20,900.
Families that are below poverty line in Edmonston earn $20,900 less on average than the poverty threshold level.
What is Inequality or Gini Index in Edmonston?
Inequality or Gini Index in Edmonston is 0.32.
What is the Total Population of Edmonston?
Total Population of Edmonston is 1,751.
What is the Total Male Population of Edmonston?
Total Male Population of Edmonston is 884.
What is the Total Female Population of Edmonston?
Total Female Population of Edmonston is 867.
What is the Ratio of Males per 100 Females in Edmonston?
There are 101.96 Males per 100 Females in Edmonston.
What is the Ratio of Females per 100 Males in Edmonston?
There are 98.08 Females per 100 Males in Edmonston.
What is the Median Population Age in Edmonston?
Median Population Age in Edmonston is 28.6 Years.
What is the Average Family Size in Edmonston
Average Family Size in Edmonston is 4.6 People.
What is the Average Household Size in Edmonston
Average Household Size in Edmonston is 3.9 People.
How Large is the Labor Force in Edmonston?
There are 923 People in the Labor Forcein in Edmonston.
What is the Percentage of People in the Labor Force in Edmonston?
75.4% of People are in the Labor Force in Edmonston.
What is the Unemployment Rate in Edmonston?
Unemployment Rate in Edmonston is 10.3%.