Fairland, MD Map & Demographics
Fairland Map
Fairland Overview
$40,704
PER CAPITA INCOME
$97,949
AVG FAMILY INCOME
$91,265
AVG HOUSEHOLD INCOME
5.8%
WAGE / INCOME GAP [ % ]
94.2¢/ $1
WAGE / INCOME GAP [ $ ]
$13,504
FAMILY INCOME DEFICIT
0.42
INEQUALITY / GINI INDEX
25,987
TOTAL POPULATION
12,318
MALE POPULATION
13,669
FEMALE POPULATION
90.12
MALES / 100 FEMALES
110.97
FEMALES / 100 MALES
36.7
MEDIAN AGE
3.3
AVG FAMILY SIZE
2.8
AVG HOUSEHOLD SIZE
14,915
LABOR FORCE [ PEOPLE ]
74.7%
PERCENT IN LABOR FORCE
7.2%
UNEMPLOYMENT RATE
Income in Fairland
Income Overview in Fairland
Per Capita Income in Fairland is $40,704, while median incomes of families and households are $97,949 and $91,265 respectively.
| Characteristic | Number | Measure |
| Per Capita Income | 25,987 | $40,704 |
| Median Family Income | 6,816 | $97,949 |
| Mean Family Income | 6,816 | $123,171 |
| Median Household Income | 9,254 | $91,265 |
| Mean Household Income | 9,254 | $113,420 |
| Income Deficit | 6,816 | $13,504 |
| Wage / Income Gap (%) | 25,987 | 5.80% |
| Wage / Income Gap ($) | 25,987 | 94.20¢ per $1 |
| Gini / Inequality Index | 25,987 | 0.42 |
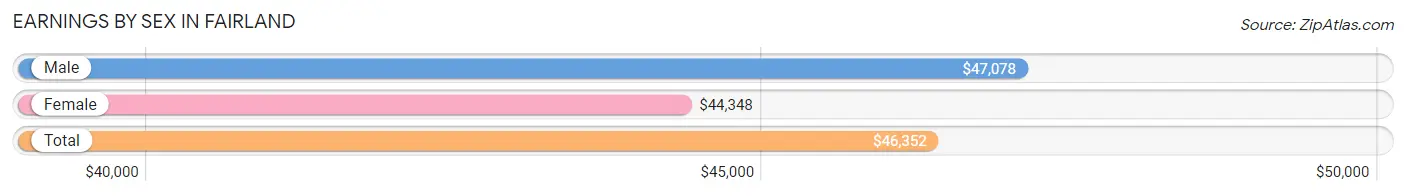
Earnings by Sex in Fairland
Average Earnings in Fairland are $46,352, $47,078 for men and $44,348 for women, a difference of 5.8%.
| Sex | Number | Average Earnings |
| Male | 7,525 (50.2%) | $47,078 |
| Female | 7,472 (49.8%) | $44,348 |
| Total | 14,997 (100.0%) | $46,352 |
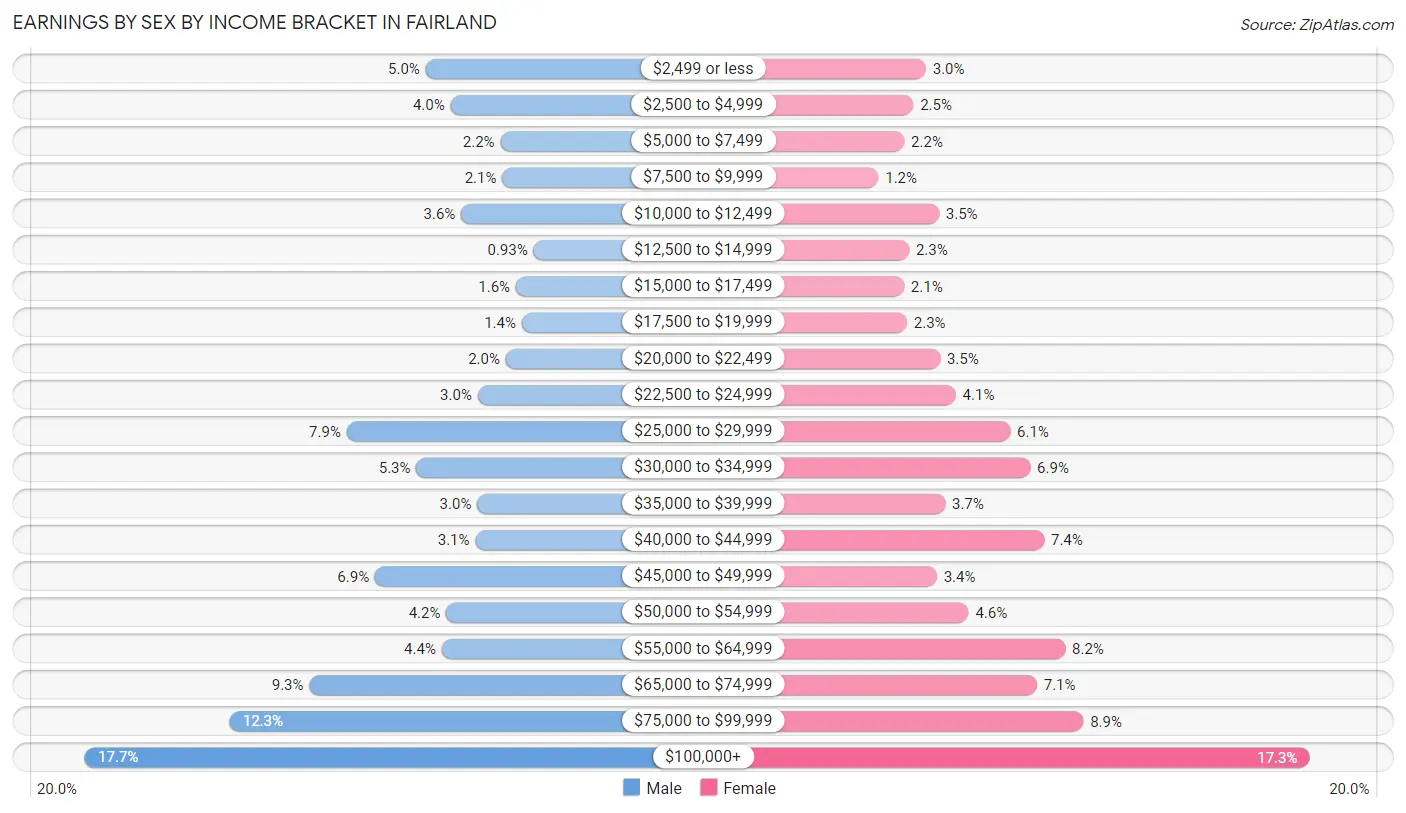
Earnings by Sex by Income Bracket in Fairland
The most common earnings brackets in Fairland are $100,000+ for men (1,334 | 17.7%) and $100,000+ for women (1,295 | 17.3%).
| Income | Male | Female |
| $2,499 or less | 374 (5.0%) | 221 (3.0%) |
| $2,500 to $4,999 | 304 (4.0%) | 186 (2.5%) |
| $5,000 to $7,499 | 163 (2.2%) | 161 (2.1%) |
| $7,500 to $9,999 | 158 (2.1%) | 88 (1.2%) |
| $10,000 to $12,499 | 274 (3.6%) | 258 (3.5%) |
| $12,500 to $14,999 | 70 (0.9%) | 174 (2.3%) |
| $15,000 to $17,499 | 120 (1.6%) | 160 (2.1%) |
| $17,500 to $19,999 | 103 (1.4%) | 168 (2.2%) |
| $20,000 to $22,499 | 148 (2.0%) | 261 (3.5%) |
| $22,500 to $24,999 | 227 (3.0%) | 305 (4.1%) |
| $25,000 to $29,999 | 597 (7.9%) | 457 (6.1%) |
| $30,000 to $34,999 | 400 (5.3%) | 513 (6.9%) |
| $35,000 to $39,999 | 229 (3.0%) | 275 (3.7%) |
| $40,000 to $44,999 | 234 (3.1%) | 552 (7.4%) |
| $45,000 to $49,999 | 517 (6.9%) | 252 (3.4%) |
| $50,000 to $54,999 | 316 (4.2%) | 341 (4.6%) |
| $55,000 to $64,999 | 329 (4.4%) | 611 (8.2%) |
| $65,000 to $74,999 | 702 (9.3%) | 532 (7.1%) |
| $75,000 to $99,999 | 926 (12.3%) | 662 (8.9%) |
| $100,000+ | 1,334 (17.7%) | 1,295 (17.3%) |
| Total | 7,525 (100.0%) | 7,472 (100.0%) |
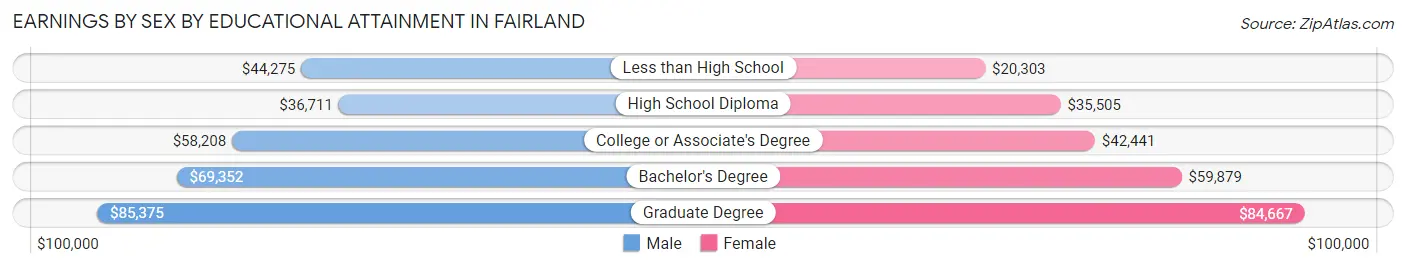
Earnings by Sex by Educational Attainment in Fairland
Average earnings in Fairland are $55,847 for men and $48,495 for women, a difference of 13.2%. Men with an educational attainment of graduate degree enjoy the highest average annual earnings of $85,375, while those with high school diploma education earn the least with $36,711. Women with an educational attainment of graduate degree earn the most with the average annual earnings of $84,667, while those with less than high school education have the smallest earnings of $20,303.
| Educational Attainment | Male Income | Female Income |
| Less than High School | $44,275 | $20,303 |
| High School Diploma | $36,711 | $35,505 |
| College or Associate's Degree | $58,208 | $42,441 |
| Bachelor's Degree | $69,352 | $59,879 |
| Graduate Degree | $85,375 | $84,667 |
| Total | $55,847 | $48,495 |
Family Income in Fairland
Family Income Brackets in Fairland
According to the Fairland family income data, there are 1,227 families falling into the $200,000+ income range, which is the most common income bracket and makes up 18.0% of all families. Conversely, the $10,000 to $14,999 income bracket is the least frequent group with only 116 families (1.7%) belonging to this category.
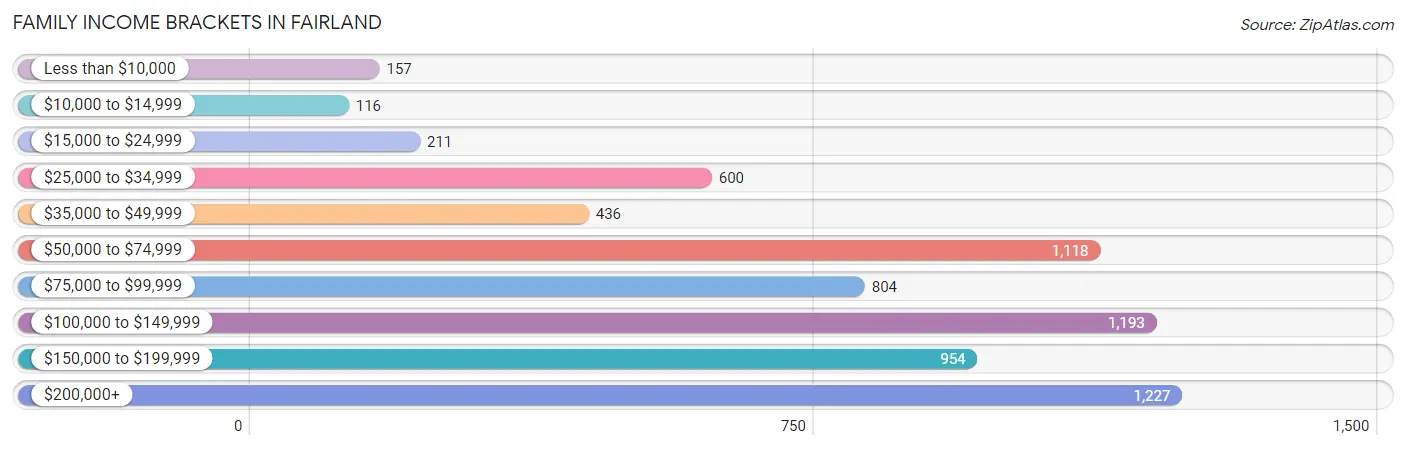
| Income Bracket | # Families | % Families |
| Less than $10,000 | 157 | 2.3% |
| $10,000 to $14,999 | 116 | 1.7% |
| $15,000 to $24,999 | 211 | 3.1% |
| $25,000 to $34,999 | 600 | 8.8% |
| $35,000 to $49,999 | 436 | 6.4% |
| $50,000 to $74,999 | 1,118 | 16.4% |
| $75,000 to $99,999 | 804 | 11.8% |
| $100,000 to $149,999 | 1,193 | 17.5% |
| $150,000 to $199,999 | 954 | 14.0% |
| $200,000+ | 1,227 | 18.0% |
Family Income by Famaliy Size in Fairland
4-person families (1,511 | 22.2%) account for the highest median family income in Fairland with $161,388 per family, while 2-person families (2,604 | 38.2%) have the highest median income of $45,938 per family member.
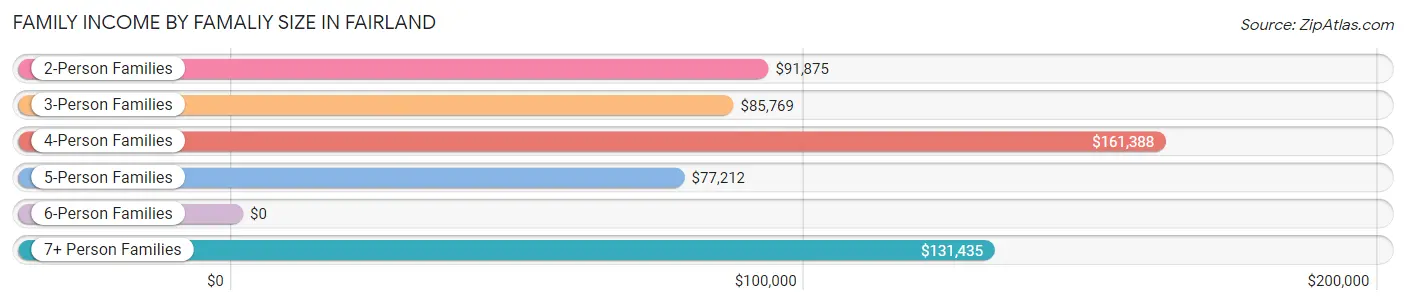
| Income Bracket | # Families | Median Income |
| 2-Person Families | 2,604 (38.2%) | $91,875 |
| 3-Person Families | 1,674 (24.6%) | $85,769 |
| 4-Person Families | 1,511 (22.2%) | $161,388 |
| 5-Person Families | 696 (10.2%) | $77,212 |
| 6-Person Families | 178 (2.6%) | $0 |
| 7+ Person Families | 153 (2.2%) | $131,435 |
| Total | 6,816 (100.0%) | $97,949 |
Family Income by Number of Earners in Fairland
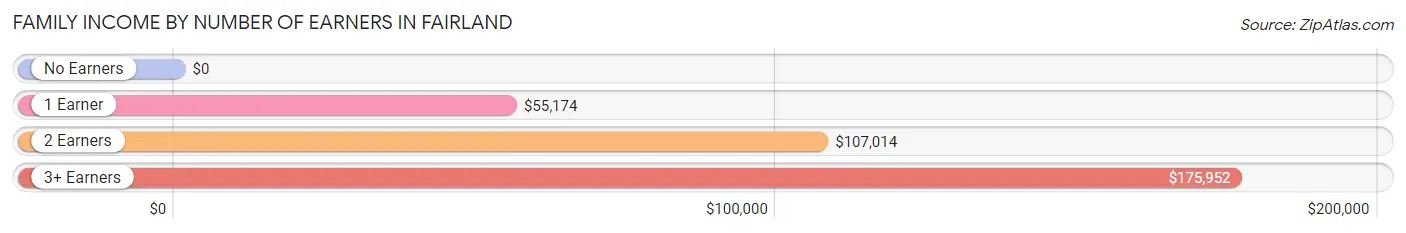
| Number of Earners | # Families | Median Income |
| No Earners | 464 (6.8%) | $0 |
| 1 Earner | 2,138 (31.4%) | $55,174 |
| 2 Earners | 3,034 (44.5%) | $107,014 |
| 3+ Earners | 1,180 (17.3%) | $175,952 |
| Total | 6,816 (100.0%) | $97,949 |
Household Income in Fairland
Household Income Brackets in Fairland
With 1,730 households falling in the category, the $100,000 to $149,999 income range is the most frequent in Fairland, accounting for 18.7% of all households. In contrast, only 259 households (2.8%) fall into the less than $10,000 income bracket, making it the least populous group.
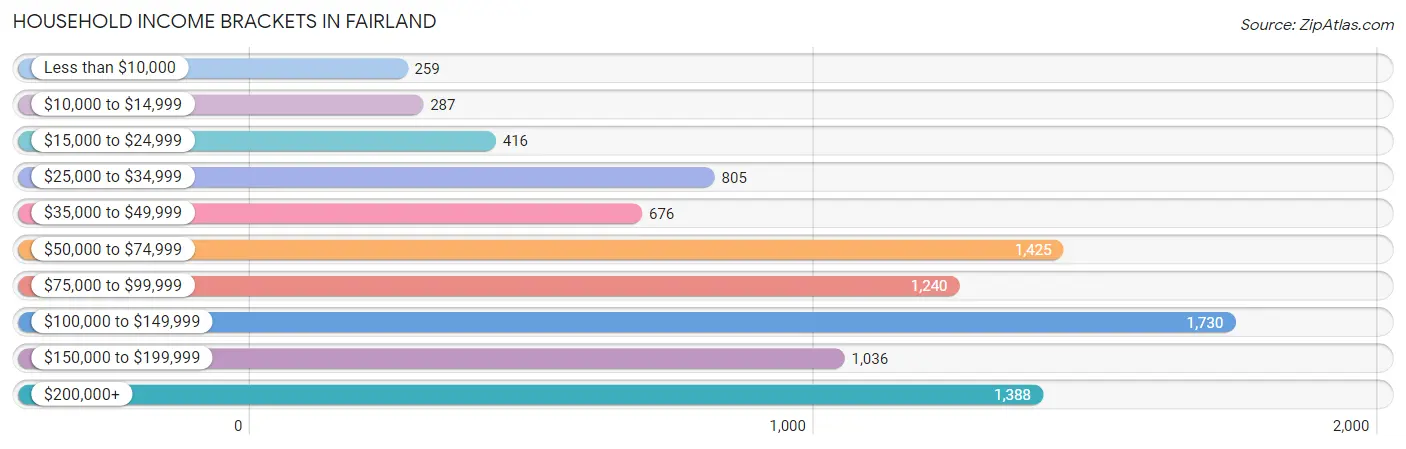
| Income Bracket | # Households | % Households |
| Less than $10,000 | 259 | 2.8% |
| $10,000 to $14,999 | 287 | 3.1% |
| $15,000 to $24,999 | 416 | 4.5% |
| $25,000 to $34,999 | 805 | 8.7% |
| $35,000 to $49,999 | 676 | 7.3% |
| $50,000 to $74,999 | 1,425 | 15.4% |
| $75,000 to $99,999 | 1,240 | 13.4% |
| $100,000 to $149,999 | 1,730 | 18.7% |
| $150,000 to $199,999 | 1,036 | 11.2% |
| $200,000+ | 1,388 | 15.0% |
Household Income by Householder Age in Fairland
The median household income in Fairland is $91,265, with the highest median household income of $106,279 found in the 45 to 64 years age bracket for the primary householder. A total of 4,009 households (43.3%) fall into this category. Meanwhile, the 15 to 24 years age bracket for the primary householder has the lowest median household income of $0, with 157 households (1.7%) in this group.
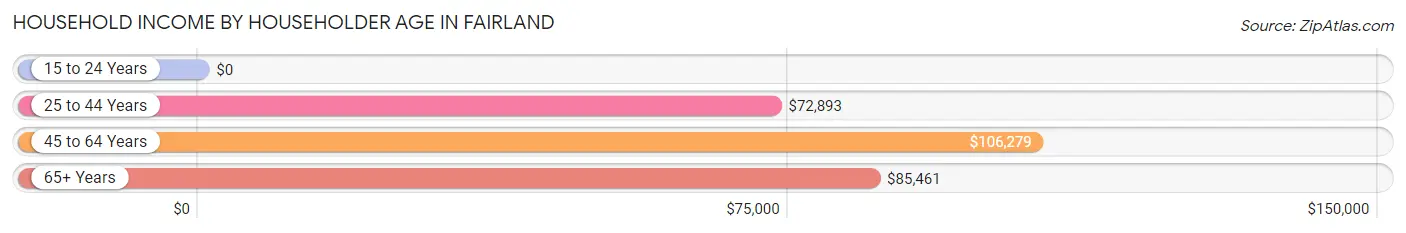
| Income Bracket | # Households | Median Income |
| 15 to 24 Years | 157 (1.7%) | $0 |
| 25 to 44 Years | 3,490 (37.7%) | $72,893 |
| 45 to 64 Years | 4,009 (43.3%) | $106,279 |
| 65+ Years | 1,598 (17.3%) | $85,461 |
| Total | 9,254 (100.0%) | $91,265 |
Poverty in Fairland
Income Below Poverty by Sex and Age in Fairland
With 10.4% poverty level for males and 11.5% for females among the residents of Fairland, 5 year old males and 12 to 14 year old females are the most vulnerable to poverty, with 98 males (59.0%) and 162 females (23.9%) in their respective age groups living below the poverty level.
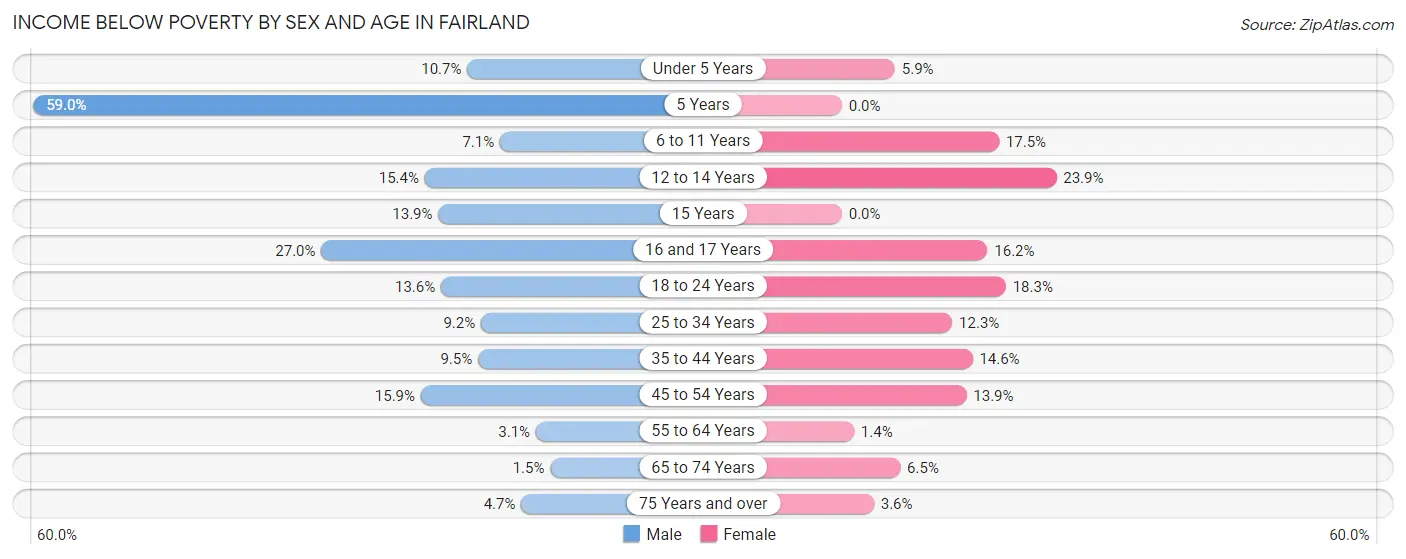
| Age Bracket | Male | Female |
| Under 5 Years | 105 (10.7%) | 56 (5.9%) |
| 5 Years | 98 (59.0%) | 0 (0.0%) |
| 6 to 11 Years | 72 (7.0%) | 263 (17.5%) |
| 12 to 14 Years | 48 (15.4%) | 162 (23.9%) |
| 15 Years | 11 (13.9%) | 0 (0.0%) |
| 16 and 17 Years | 107 (27.0%) | 53 (16.2%) |
| 18 to 24 Years | 163 (13.6%) | 157 (18.3%) |
| 25 to 34 Years | 166 (9.2%) | 236 (12.3%) |
| 35 to 44 Years | 189 (9.5%) | 276 (14.5%) |
| 45 to 54 Years | 236 (15.9%) | 243 (13.9%) |
| 55 to 64 Years | 46 (3.0%) | 26 (1.3%) |
| 65 to 74 Years | 14 (1.5%) | 66 (6.5%) |
| 75 Years and over | 14 (4.7%) | 14 (3.6%) |
| Total | 1,269 (10.4%) | 1,552 (11.5%) |
Income Above Poverty by Sex and Age in Fairland
According to the poverty statistics in Fairland, males aged 65 to 74 years and females aged 5 years are the age groups that are most secure financially, with 98.6% of males and 100.0% of females in these age groups living above the poverty line.
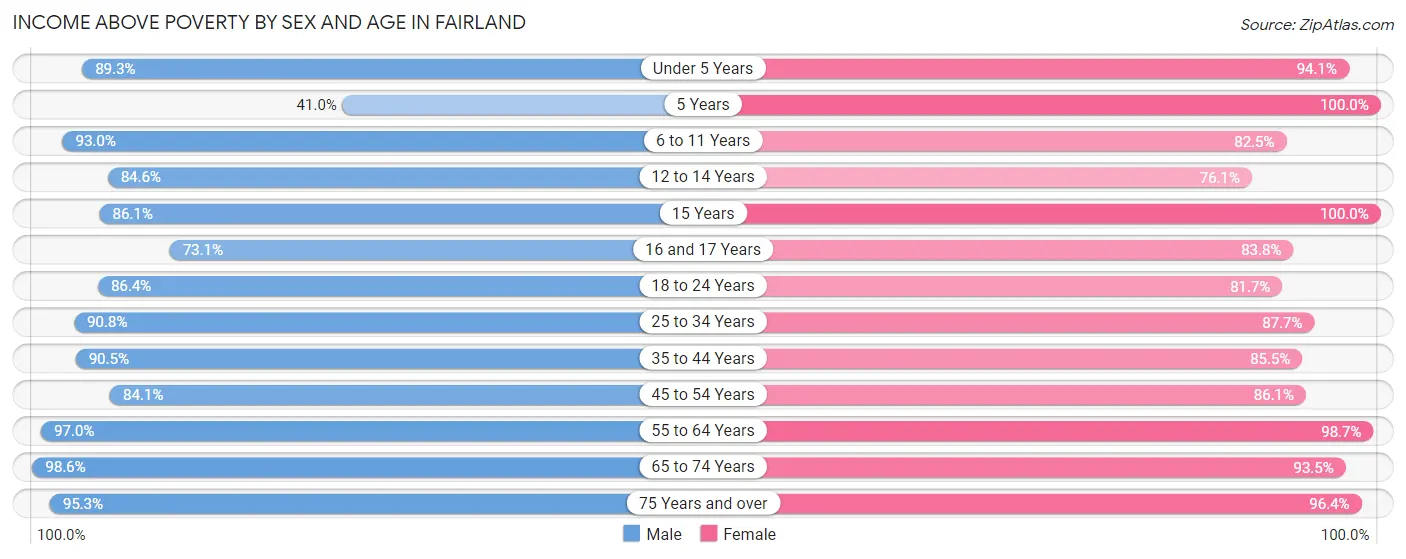
| Age Bracket | Male | Female |
| Under 5 Years | 876 (89.3%) | 891 (94.1%) |
| 5 Years | 68 (41.0%) | 200 (100.0%) |
| 6 to 11 Years | 949 (92.9%) | 1,240 (82.5%) |
| 12 to 14 Years | 263 (84.6%) | 516 (76.1%) |
| 15 Years | 68 (86.1%) | 124 (100.0%) |
| 16 and 17 Years | 290 (73.1%) | 274 (83.8%) |
| 18 to 24 Years | 1,034 (86.4%) | 703 (81.7%) |
| 25 to 34 Years | 1,645 (90.8%) | 1,684 (87.7%) |
| 35 to 44 Years | 1,800 (90.5%) | 1,621 (85.5%) |
| 45 to 54 Years | 1,251 (84.1%) | 1,509 (86.1%) |
| 55 to 64 Years | 1,460 (97.0%) | 1,905 (98.7%) |
| 65 to 74 Years | 951 (98.6%) | 949 (93.5%) |
| 75 Years and over | 285 (95.3%) | 379 (96.4%) |
| Total | 10,940 (89.6%) | 11,995 (88.5%) |
Income Below Poverty Among Married-Couple Families in Fairland
The poverty statistics for married-couple families in Fairland show that 4.0% or 164 of the total 4,126 families live below the poverty line. Families with 3 or 4 children have the highest poverty rate of 26.0%, comprising of 104 families. On the other hand, families with 5 or more children have the lowest poverty rate of 0.0%, which includes 0 families.
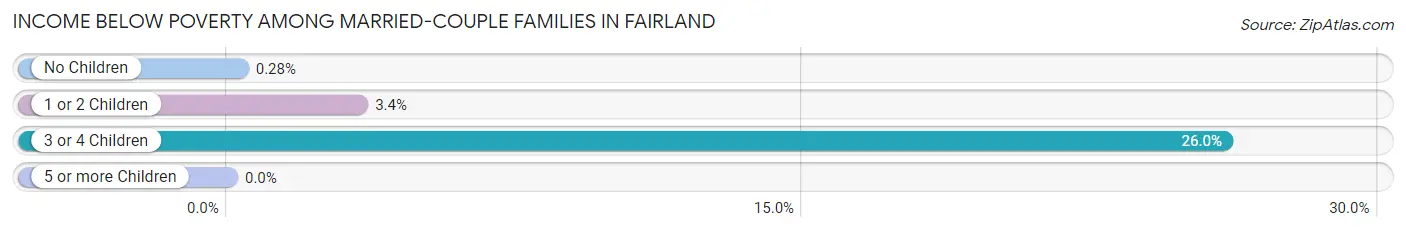
| Children | Above Poverty | Below Poverty |
| No Children | 2,125 (99.7%) | 6 (0.3%) |
| 1 or 2 Children | 1,536 (96.6%) | 54 (3.4%) |
| 3 or 4 Children | 296 (74.0%) | 104 (26.0%) |
| 5 or more Children | 5 (100.0%) | 0 (0.0%) |
| Total | 3,962 (96.0%) | 164 (4.0%) |
Income Below Poverty Among Single-Parent Households in Fairland
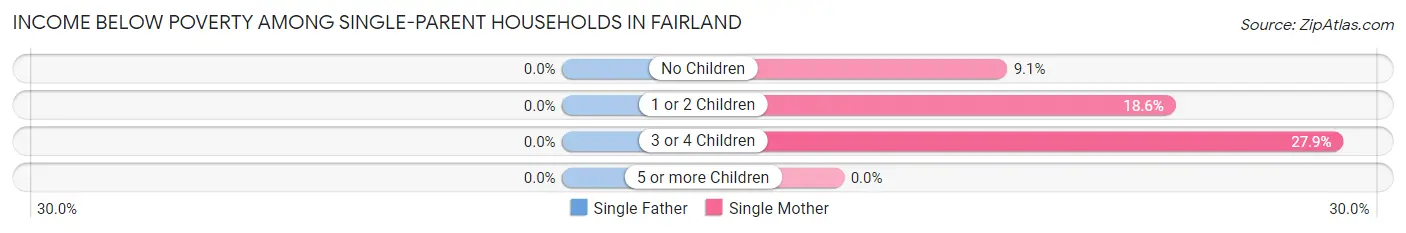
| Children | Single Father | Single Mother |
| No Children | 0 (0.0%) | 69 (9.1%) |
| 1 or 2 Children | 0 (0.0%) | 207 (18.5%) |
| 3 or 4 Children | 0 (0.0%) | 74 (27.9%) |
| 5 or more Children | 0 (0.0%) | 0 (0.0%) |
| Total | 0 (0.0%) | 350 (15.9%) |
Income Below Poverty Among Married-Couple vs Single-Parent Households in Fairland
The poverty data for Fairland shows that 164 of the married-couple family households (4.0%) and 350 of the single-parent households (13.0%) are living below the poverty level. Within the married-couple family households, those with 3 or 4 children have the highest poverty rate, with 104 households (26.0%) falling below the poverty line. Among the single-parent households, those with 3 or 4 children have the highest poverty rate, with 74 household (27.9%) living below poverty.

| Children | Married-Couple Families | Single-Parent Households |
| No Children | 6 (0.3%) | 69 (6.2%) |
| 1 or 2 Children | 54 (3.4%) | 207 (16.5%) |
| 3 or 4 Children | 104 (26.0%) | 74 (27.9%) |
| 5 or more Children | 0 (0.0%) | 0 (0.0%) |
| Total | 164 (4.0%) | 350 (13.0%) |
Race in Fairland
The most populous races in Fairland are Black / African American (15,766 | 60.7%), White / Caucasian (3,759 | 14.5%), and Hispanic or Latino (3,339 | 12.9%).
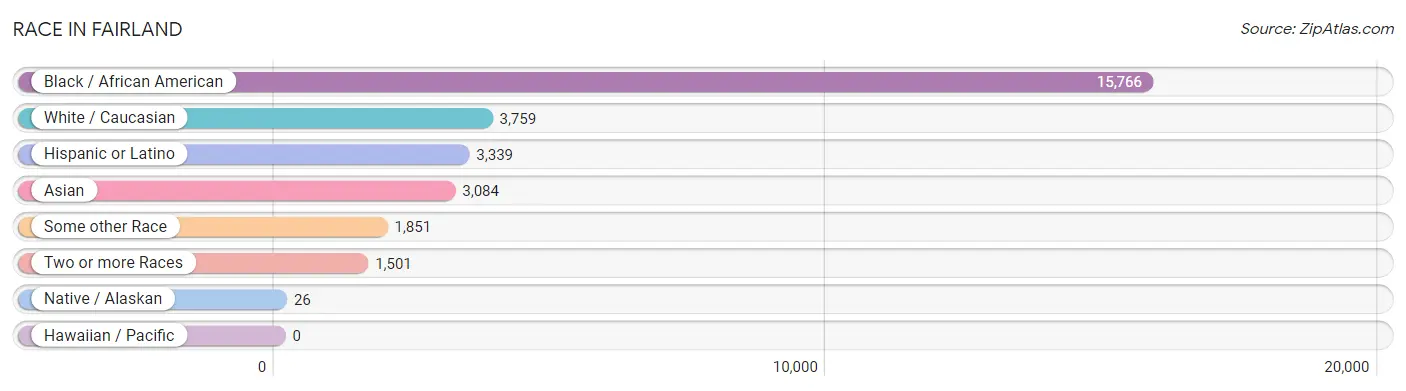
| Race | # Population | % Population |
| Asian | 3,084 | 11.9% |
| Black / African American | 15,766 | 60.7% |
| Hawaiian / Pacific | 0 | 0.0% |
| Hispanic or Latino | 3,339 | 12.9% |
| Native / Alaskan | 26 | 0.1% |
| White / Caucasian | 3,759 | 14.5% |
| Two or more Races | 1,501 | 5.8% |
| Some other Race | 1,851 | 7.1% |
| Total | 25,987 | 100.0% |
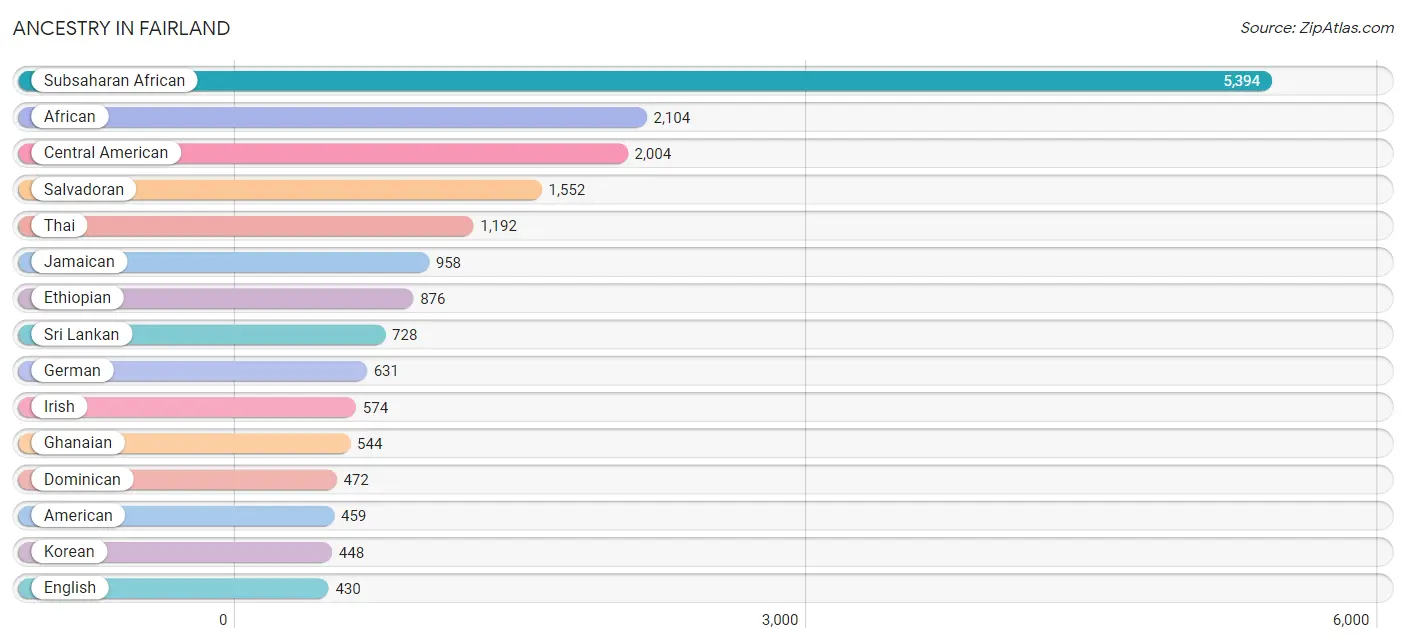
Ancestry in Fairland
The most populous ancestries reported in Fairland are Subsaharan African (5,394 | 20.8%), African (2,104 | 8.1%), Central American (2,004 | 7.7%), Salvadoran (1,552 | 6.0%), and Thai (1,192 | 4.6%), together accounting for 47.1% of all Fairland residents.
| Ancestry | # Population | % Population |
| Afghan | 51 | 0.2% |
| African | 2,104 | 8.1% |
| Albanian | 8 | 0.0% |
| American | 459 | 1.8% |
| Arab | 162 | 0.6% |
| Argentinean | 39 | 0.2% |
| Austrian | 8 | 0.0% |
| Bhutanese | 26 | 0.1% |
| Brazilian | 31 | 0.1% |
| British | 33 | 0.1% |
| Burmese | 314 | 1.2% |
| Canadian | 7 | 0.0% |
| Central American | 2,004 | 7.7% |
| Cherokee | 25 | 0.1% |
| Costa Rican | 13 | 0.1% |
| Creek | 28 | 0.1% |
| Croatian | 49 | 0.2% |
| Cuban | 139 | 0.5% |
| Czech | 46 | 0.2% |
| Czechoslovakian | 15 | 0.1% |
| Danish | 6 | 0.0% |
| Dominican | 472 | 1.8% |
| Eastern European | 15 | 0.1% |
| English | 430 | 1.7% |
| Ethiopian | 876 | 3.4% |
| European | 264 | 1.0% |
| Filipino | 18 | 0.1% |
| Finnish | 14 | 0.1% |
| French | 119 | 0.5% |
| German | 631 | 2.4% |
| Ghanaian | 544 | 2.1% |
| Greek | 62 | 0.2% |
| Guatemalan | 96 | 0.4% |
| Guyanese | 86 | 0.3% |
| Haitian | 170 | 0.6% |
| Honduran | 256 | 1.0% |
| Hungarian | 4 | 0.0% |
| Indian (Asian) | 375 | 1.4% |
| Indonesian | 36 | 0.1% |
| Iranian | 53 | 0.2% |
| Iraqi | 54 | 0.2% |
| Irish | 574 | 2.2% |
| Italian | 249 | 1.0% |
| Jamaican | 958 | 3.7% |
| Japanese | 115 | 0.4% |
| Jordanian | 47 | 0.2% |
| Kenyan | 87 | 0.3% |
| Korean | 448 | 1.7% |
| Laotian | 53 | 0.2% |
| Lebanese | 18 | 0.1% |
| Liberian | 163 | 0.6% |
| Lithuanian | 40 | 0.2% |
| Mexican | 308 | 1.2% |
| Nicaraguan | 70 | 0.3% |
| Nigerian | 329 | 1.3% |
| Norwegian | 21 | 0.1% |
| Pakistani | 74 | 0.3% |
| Panamanian | 17 | 0.1% |
| Paraguayan | 30 | 0.1% |
| Peruvian | 23 | 0.1% |
| Polish | 165 | 0.6% |
| Puerto Rican | 203 | 0.8% |
| Romanian | 34 | 0.1% |
| Russian | 36 | 0.1% |
| Salvadoran | 1,552 | 6.0% |
| Scandinavian | 10 | 0.0% |
| Scotch-Irish | 131 | 0.5% |
| Scottish | 184 | 0.7% |
| Sierra Leonean | 242 | 0.9% |
| Somali | 19 | 0.1% |
| South American | 92 | 0.4% |
| South American Indian | 41 | 0.2% |
| Spaniard | 19 | 0.1% |
| Spanish | 41 | 0.2% |
| Sri Lankan | 728 | 2.8% |
| Subsaharan African | 5,394 | 20.8% |
| Swedish | 37 | 0.1% |
| Swiss | 10 | 0.0% |
| Syrian | 55 | 0.2% |
| Thai | 1,192 | 4.6% |
| Trinidadian and Tobagonian | 253 | 1.0% |
| U.S. Virgin Islander | 5 | 0.0% |
| Ugandan | 55 | 0.2% |
| Welsh | 59 | 0.2% |
| West Indian | 353 | 1.4% |
| Yugoslavian | 11 | 0.0% |
| Zimbabwean | 18 | 0.1% | View All 87 Rows |
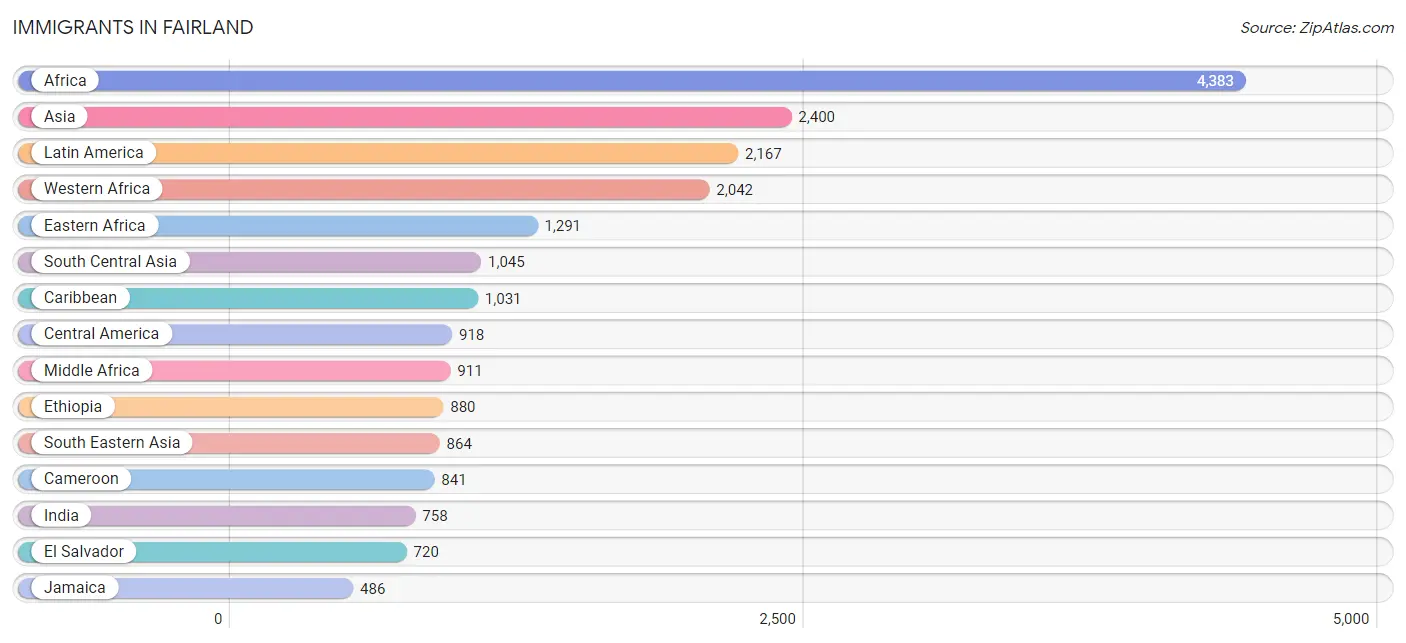
Immigrants in Fairland
The most numerous immigrant groups reported in Fairland came from Africa (4,383 | 16.9%), Asia (2,400 | 9.2%), Latin America (2,167 | 8.3%), Western Africa (2,042 | 7.9%), and Eastern Africa (1,291 | 5.0%), together accounting for 47.3% of all Fairland residents.
| Immigration Origin | # Population | % Population |
| Afghanistan | 45 | 0.2% |
| Africa | 4,383 | 16.9% |
| Asia | 2,400 | 9.2% |
| Bangladesh | 58 | 0.2% |
| Brazil | 39 | 0.2% |
| Cambodia | 56 | 0.2% |
| Cameroon | 841 | 3.2% |
| Canada | 7 | 0.0% |
| Caribbean | 1,031 | 4.0% |
| Central America | 918 | 3.5% |
| China | 227 | 0.9% |
| Congo | 44 | 0.2% |
| Dominican Republic | 203 | 0.8% |
| Eastern Africa | 1,291 | 5.0% |
| Eastern Asia | 363 | 1.4% |
| Eastern Europe | 97 | 0.4% |
| El Salvador | 720 | 2.8% |
| England | 80 | 0.3% |
| Eritrea | 32 | 0.1% |
| Ethiopia | 880 | 3.4% |
| Europe | 250 | 1.0% |
| France | 24 | 0.1% |
| Germany | 44 | 0.2% |
| Ghana | 481 | 1.8% |
| Guatemala | 97 | 0.4% |
| Guyana | 132 | 0.5% |
| Haiti | 89 | 0.3% |
| Honduras | 6 | 0.0% |
| Hong Kong | 18 | 0.1% |
| India | 758 | 2.9% |
| Indonesia | 53 | 0.2% |
| Iran | 53 | 0.2% |
| Iraq | 36 | 0.1% |
| Jamaica | 486 | 1.9% |
| Japan | 14 | 0.1% |
| Jordan | 47 | 0.2% |
| Kenya | 216 | 0.8% |
| Korea | 122 | 0.5% |
| Latin America | 2,167 | 8.3% |
| Liberia | 251 | 1.0% |
| Malaysia | 36 | 0.1% |
| Mexico | 43 | 0.2% |
| Middle Africa | 911 | 3.5% |
| Morocco | 52 | 0.2% |
| Nepal | 64 | 0.3% |
| Nicaragua | 35 | 0.1% |
| Nigeria | 157 | 0.6% |
| Northern Africa | 52 | 0.2% |
| Northern Europe | 85 | 0.3% |
| Pakistan | 14 | 0.1% |
| Panama | 17 | 0.1% |
| Peru | 17 | 0.1% |
| Philippines | 230 | 0.9% |
| Poland | 55 | 0.2% |
| Romania | 34 | 0.1% |
| Senegal | 32 | 0.1% |
| Sierra Leone | 419 | 1.6% |
| Singapore | 19 | 0.1% |
| Somalia | 19 | 0.1% |
| South America | 218 | 0.8% |
| South Central Asia | 1,045 | 4.0% |
| South Eastern Asia | 864 | 3.3% |
| Sri Lanka | 53 | 0.2% |
| Syria | 37 | 0.1% |
| Taiwan | 41 | 0.2% |
| Thailand | 52 | 0.2% |
| Trinidad and Tobago | 253 | 1.0% |
| Uganda | 53 | 0.2% |
| Ukraine | 8 | 0.0% |
| Vietnam | 396 | 1.5% |
| Western Africa | 2,042 | 7.9% |
| Western Asia | 128 | 0.5% |
| Western Europe | 68 | 0.3% |
| Zaire | 18 | 0.1% |
| Zimbabwe | 36 | 0.1% | View All 75 Rows |
Sex and Age in Fairland
Sex and Age in Fairland
The most populous age groups in Fairland are 40 to 44 Years (1,262 | 10.2%) for men and 10 to 14 Years (1,200 | 8.8%) for women.
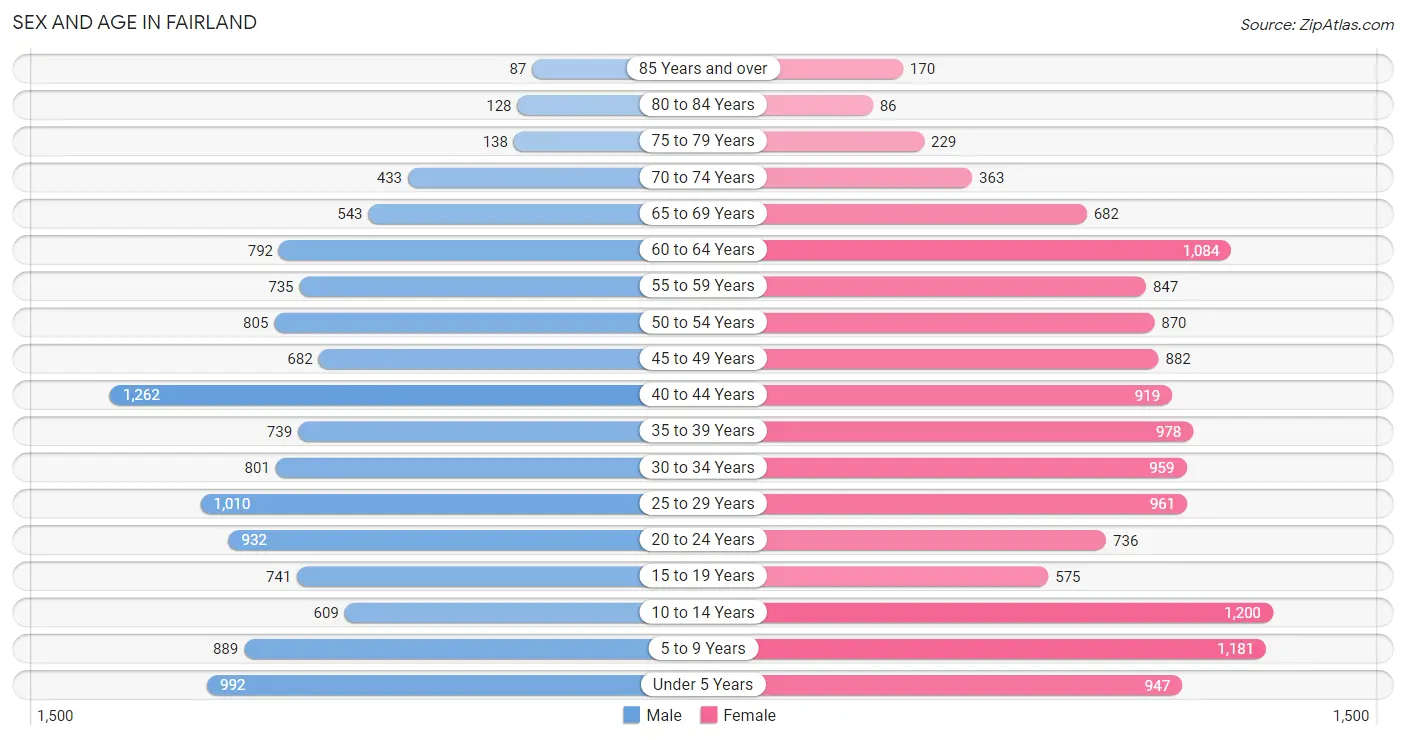
| Age Bracket | Male | Female |
| Under 5 Years | 992 (8.1%) | 947 (6.9%) |
| 5 to 9 Years | 889 (7.2%) | 1,181 (8.6%) |
| 10 to 14 Years | 609 (4.9%) | 1,200 (8.8%) |
| 15 to 19 Years | 741 (6.0%) | 575 (4.2%) |
| 20 to 24 Years | 932 (7.6%) | 736 (5.4%) |
| 25 to 29 Years | 1,010 (8.2%) | 961 (7.0%) |
| 30 to 34 Years | 801 (6.5%) | 959 (7.0%) |
| 35 to 39 Years | 739 (6.0%) | 978 (7.1%) |
| 40 to 44 Years | 1,262 (10.2%) | 919 (6.7%) |
| 45 to 49 Years | 682 (5.5%) | 882 (6.5%) |
| 50 to 54 Years | 805 (6.5%) | 870 (6.4%) |
| 55 to 59 Years | 735 (6.0%) | 847 (6.2%) |
| 60 to 64 Years | 792 (6.4%) | 1,084 (7.9%) |
| 65 to 69 Years | 543 (4.4%) | 682 (5.0%) |
| 70 to 74 Years | 433 (3.5%) | 363 (2.7%) |
| 75 to 79 Years | 138 (1.1%) | 229 (1.7%) |
| 80 to 84 Years | 128 (1.0%) | 86 (0.6%) |
| 85 Years and over | 87 (0.7%) | 170 (1.2%) |
| Total | 12,318 (100.0%) | 13,669 (100.0%) |
Families and Households in Fairland
Median Family Size in Fairland
The median family size in Fairland is 3.28 persons per family, with married-couple families (4,126 | 60.5%) accounting for the largest median family size of 3.46 persons per family. On the other hand, single male/father families (486 | 7.1%) represent the smallest median family size with 2.33 persons per family.
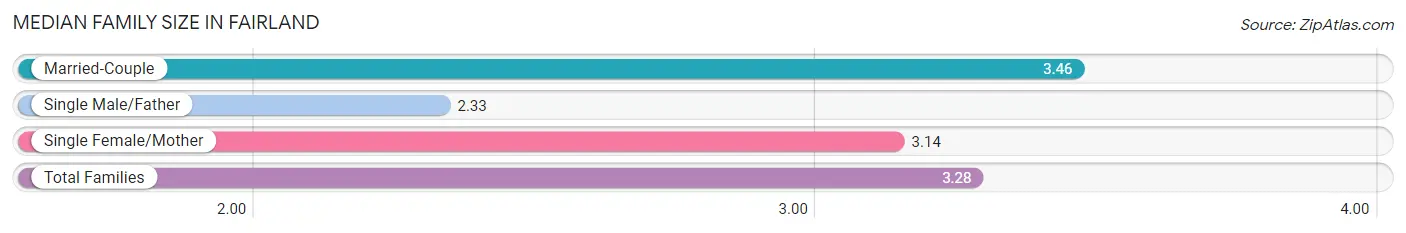
| Family Type | # Families | Family Size |
| Married-Couple | 4,126 (60.5%) | 3.46 |
| Single Male/Father | 486 (7.1%) | 2.33 |
| Single Female/Mother | 2,204 (32.3%) | 3.14 |
| Total Families | 6,816 (100.0%) | 3.28 |
Median Household Size in Fairland
The median household size in Fairland is 2.78 persons per household, with married-couple households (4,126 | 44.6%) accounting for the largest median household size of 3.5 persons per household. non-family households (2,438 | 26.4%) represent the smallest median household size with 1.12 persons per household.
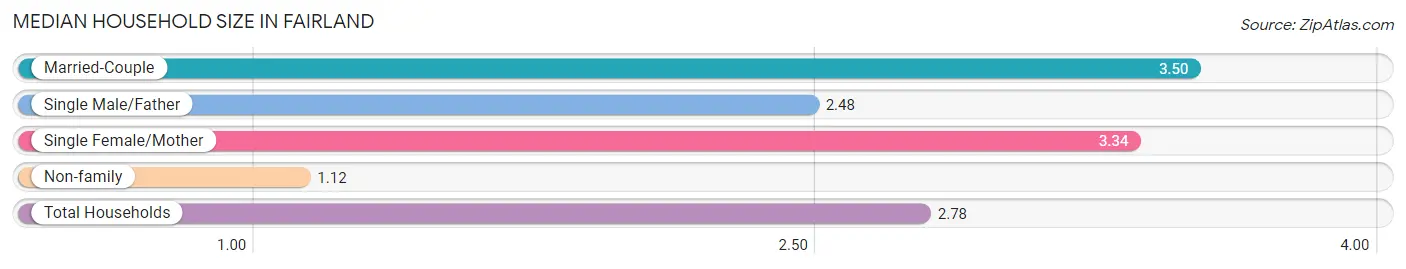
| Household Type | # Households | Household Size |
| Married-Couple | 4,126 (44.6%) | 3.50 |
| Single Male/Father | 486 (5.2%) | 2.48 |
| Single Female/Mother | 2,204 (23.8%) | 3.34 |
| Non-family | 2,438 (26.4%) | 1.12 |
| Total Households | 9,254 (100.0%) | 2.78 |
Household Size by Marriage Status in Fairland
Out of a total of 9,254 households in Fairland, 6,816 (73.7%) are family households, while 2,438 (26.4%) are nonfamily households. The most numerous type of family households are 2-person households, comprising 2,346, and the most common type of nonfamily households are 1-person households, comprising 2,193.
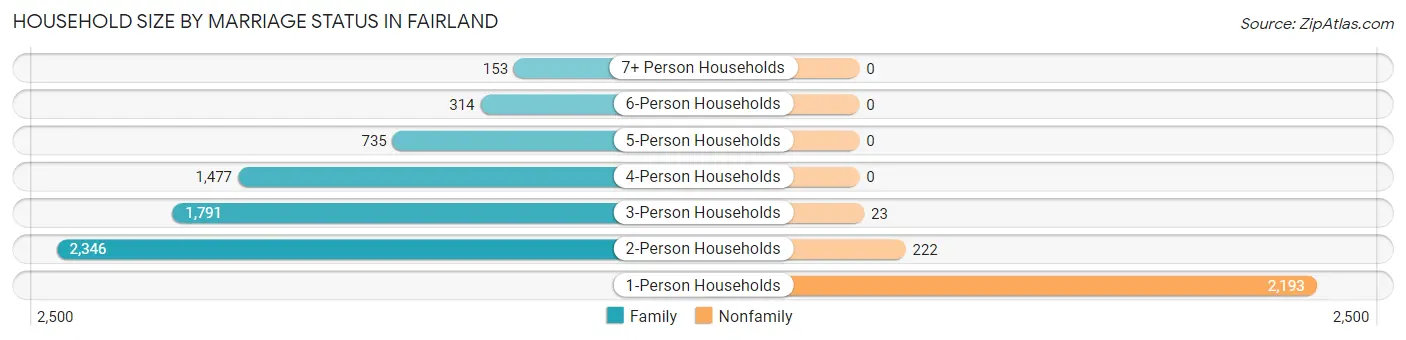
| Household Size | Family Households | Nonfamily Households |
| 1-Person Households | - | 2,193 (23.7%) |
| 2-Person Households | 2,346 (25.4%) | 222 (2.4%) |
| 3-Person Households | 1,791 (19.4%) | 23 (0.3%) |
| 4-Person Households | 1,477 (16.0%) | 0 (0.0%) |
| 5-Person Households | 735 (7.9%) | 0 (0.0%) |
| 6-Person Households | 314 (3.4%) | 0 (0.0%) |
| 7+ Person Households | 153 (1.7%) | 0 (0.0%) |
| Total | 6,816 (73.7%) | 2,438 (26.4%) |
Female Fertility in Fairland
Fertility by Age in Fairland
Average fertility rate in Fairland is 66.0 births per 1,000 women. Women in the age bracket of 20 to 34 years have the highest fertility rate with 93.0 births per 1,000 women. Women in the age bracket of 20 to 34 years acount for 60.9% of all women with births.
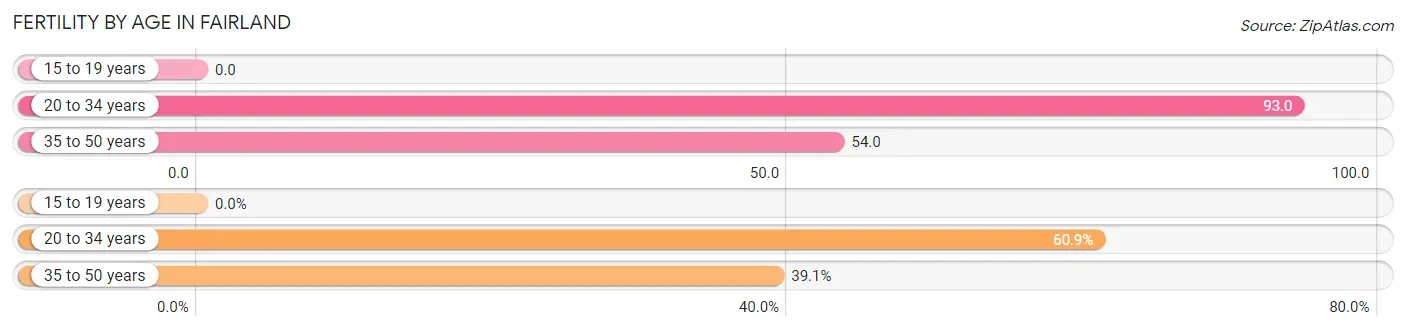
| Age Bracket | Women with Births | Births / 1,000 Women |
| 15 to 19 years | 0 (0.0%) | 0.0 |
| 20 to 34 years | 246 (60.9%) | 93.0 |
| 35 to 50 years | 158 (39.1%) | 54.0 |
| Total | 404 (100.0%) | 66.0 |
Fertility by Age by Marriage Status in Fairland
62.4% of women with births (404) in Fairland are married. The highest percentage of unmarried women with births falls into 20 to 34 years age bracket with 49.2% of them unmarried at the time of birth, while the lowest percentage of unmarried women with births belong to 35 to 50 years age bracket with 19.6% of them unmarried.
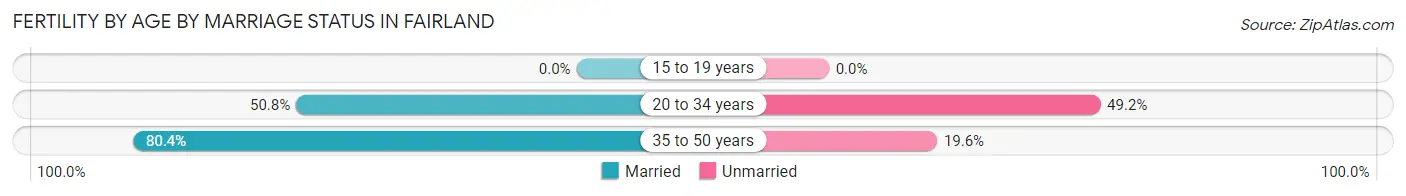
| Age Bracket | Married | Unmarried |
| 15 to 19 years | 0 (0.0%) | 0 (0.0%) |
| 20 to 34 years | 125 (50.8%) | 121 (49.2%) |
| 35 to 50 years | 127 (80.4%) | 31 (19.6%) |
| Total | 252 (62.4%) | 152 (37.6%) |
Fertility by Education in Fairland
Average fertility rate in Fairland is 66.0 births per 1,000 women. Women with the education attainment of college or associate's degree have the highest fertility rate of 124.0 births per 1,000 women, while women with the education attainment of high school diploma have the lowest fertility at 35.0 births per 1,000 women. Women with the education attainment of college or associate's degree represent 50.5% of all women with births.
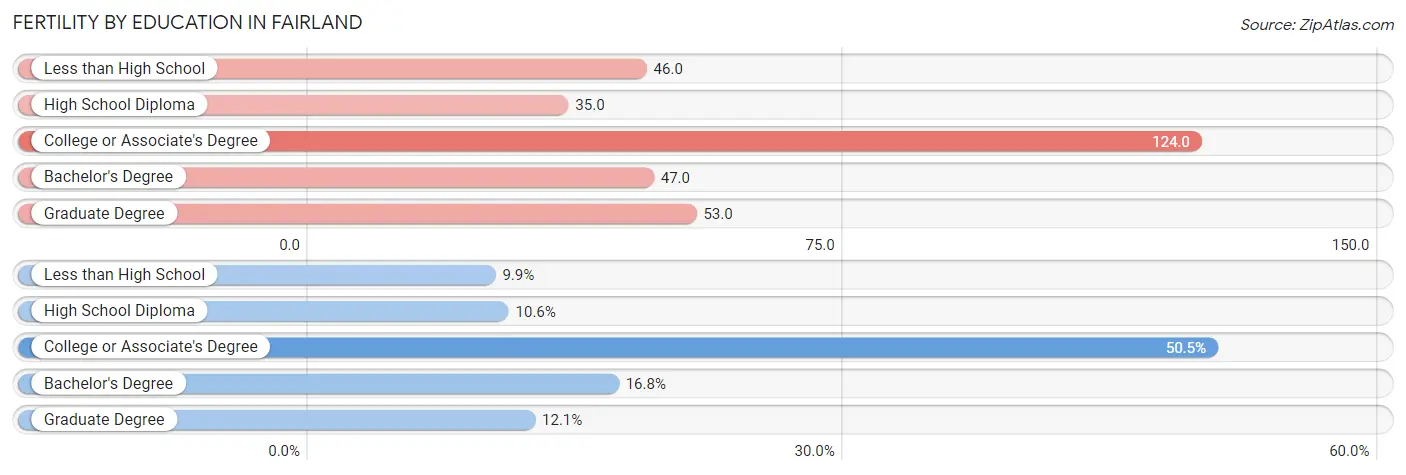
| Educational Attainment | Women with Births | Births / 1,000 Women |
| Less than High School | 40 (9.9%) | 46.0 |
| High School Diploma | 43 (10.6%) | 35.0 |
| College or Associate's Degree | 204 (50.5%) | 124.0 |
| Bachelor's Degree | 68 (16.8%) | 47.0 |
| Graduate Degree | 49 (12.1%) | 53.0 |
| Total | 404 (100.0%) | 66.0 |
Fertility by Education by Marriage Status in Fairland
37.6% of women with births in Fairland are unmarried. Women with the educational attainment of graduate degree are most likely to be married with 100.0% of them married at childbirth, while women with the educational attainment of less than high school are least likely to be married with 72.5% of them unmarried at childbirth.
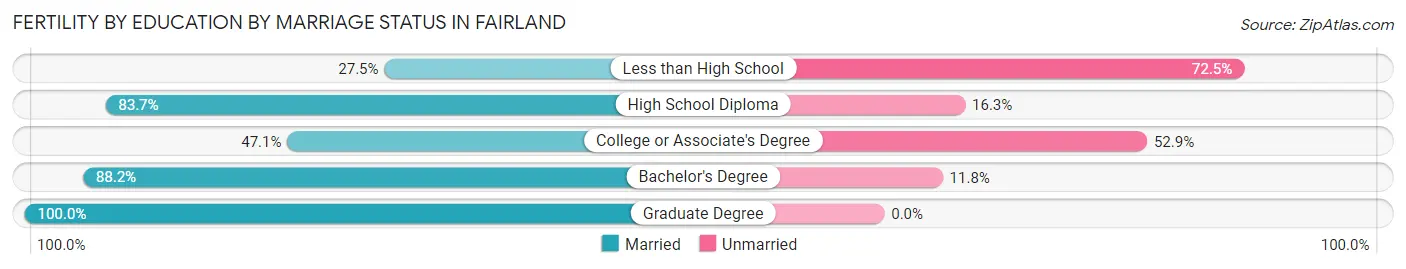
| Educational Attainment | Married | Unmarried |
| Less than High School | 11 (27.5%) | 29 (72.5%) |
| High School Diploma | 36 (83.7%) | 7 (16.3%) |
| College or Associate's Degree | 96 (47.1%) | 108 (52.9%) |
| Bachelor's Degree | 60 (88.2%) | 8 (11.8%) |
| Graduate Degree | 49 (100.0%) | 0 (0.0%) |
| Total | 252 (62.4%) | 152 (37.6%) |
Employment Characteristics in Fairland
Employment by Class of Employer in Fairland
Among the 13,499 employed individuals in Fairland, private company employees (7,960 | 59.0%), not-for-profit organizations (1,991 | 14.7%), and federal government employees (1,101 | 8.2%) make up the most common classes of employment.
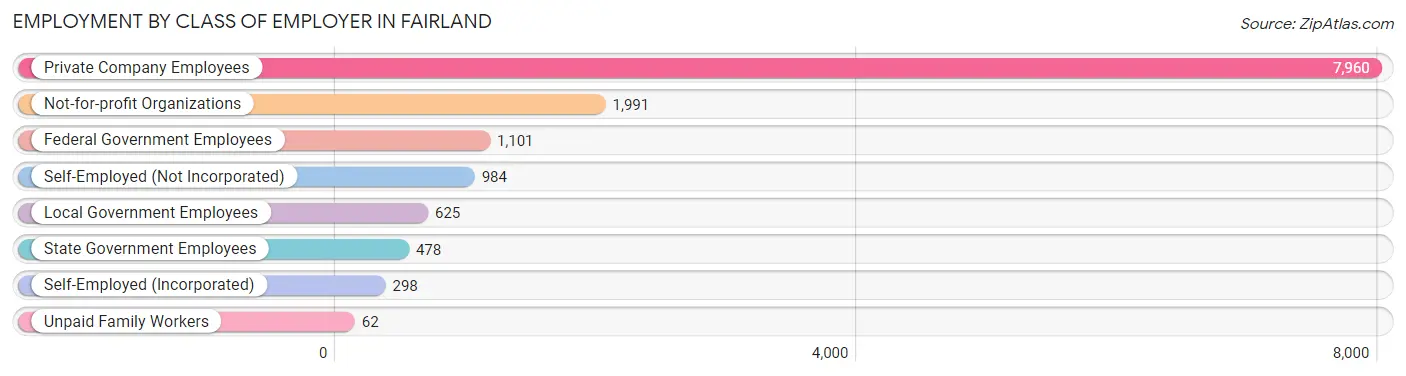
| Employer Class | # Employees | % Employees |
| Private Company Employees | 7,960 | 59.0% |
| Self-Employed (Incorporated) | 298 | 2.2% |
| Self-Employed (Not Incorporated) | 984 | 7.3% |
| Not-for-profit Organizations | 1,991 | 14.7% |
| Local Government Employees | 625 | 4.6% |
| State Government Employees | 478 | 3.5% |
| Federal Government Employees | 1,101 | 8.2% |
| Unpaid Family Workers | 62 | 0.5% |
| Total | 13,499 | 100.0% |
Employment Status by Age in Fairland
According to the labor force statistics for Fairland, out of the total population over 16 years of age (19,966), 74.7% or 14,915 individuals are in the labor force, with 7.2% or 1,074 of them unemployed. The age group with the highest labor force participation rate is 35 to 44 years, with 91.2% or 3,555 individuals in the labor force. Within the labor force, the 20 to 24 years age range has the highest percentage of unemployed individuals, with 28.4% or 333 of them being unemployed.
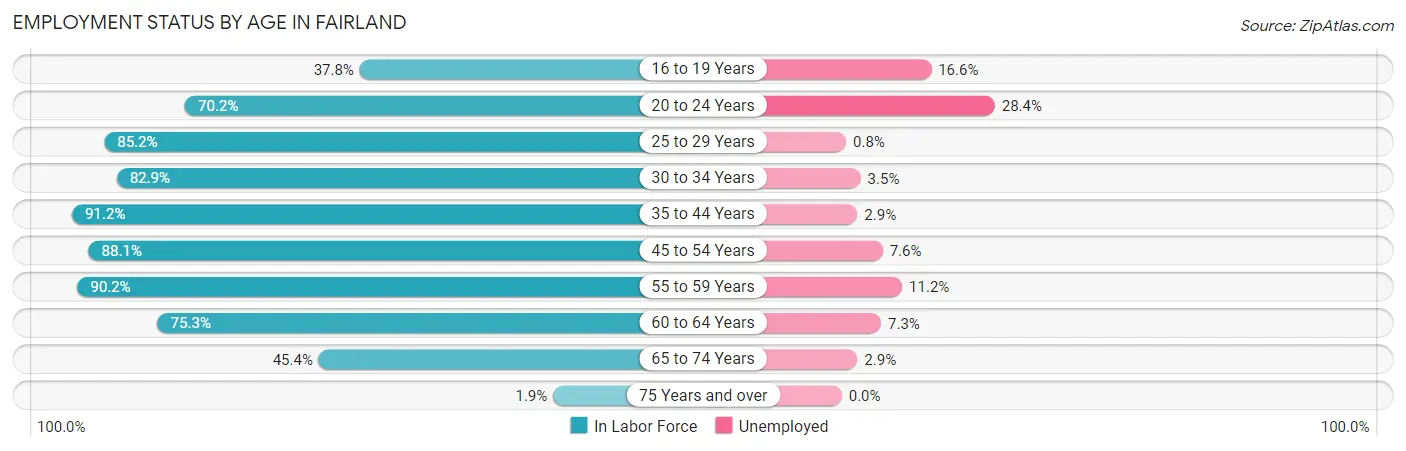
| Age Bracket | In Labor Force | Unemployed |
| 16 to 19 Years | 421 (37.8%) | 70 (16.6%) |
| 20 to 24 Years | 1,171 (70.2%) | 333 (28.4%) |
| 25 to 29 Years | 1,679 (85.2%) | 13 (0.8%) |
| 30 to 34 Years | 1,459 (82.9%) | 51 (3.5%) |
| 35 to 44 Years | 3,555 (91.2%) | 103 (2.9%) |
| 45 to 54 Years | 2,854 (88.1%) | 217 (7.6%) |
| 55 to 59 Years | 1,427 (90.2%) | 160 (11.2%) |
| 60 to 64 Years | 1,413 (75.3%) | 103 (7.3%) |
| 65 to 74 Years | 918 (45.4%) | 27 (2.9%) |
| 75 Years and over | 16 (1.9%) | 0 (0.0%) |
| Total | 14,915 (74.7%) | 1,074 (7.2%) |
Employment Status by Educational Attainment in Fairland
According to labor force statistics for Fairland, 86.5% of individuals (12,392) out of the total population between 25 and 64 years of age (14,326) are in the labor force, with 5.2% or 644 of them being unemployed. The group with the highest labor force participation rate are those with the educational attainment of bachelor's degree or higher, with 90.8% or 5,763 individuals in the labor force. Within the labor force, individuals with college / associate degree education have the highest percentage of unemployment, with 6.5% or 199 of them being unemployed.
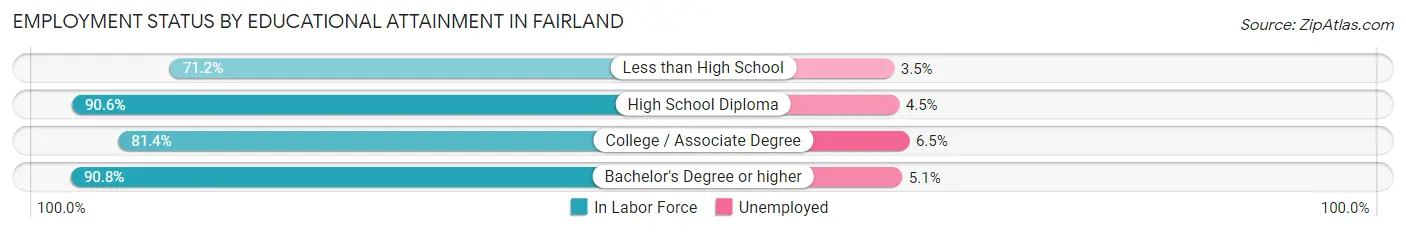
| Educational Attainment | In Labor Force | Unemployed |
| Less than High School | 935 (71.2%) | 46 (3.5%) |
| High School Diploma | 2,628 (90.6%) | 131 (4.5%) |
| College / Associate Degree | 3,065 (81.4%) | 245 (6.5%) |
| Bachelor's Degree or higher | 5,763 (90.8%) | 324 (5.1%) |
| Total | 12,392 (86.5%) | 745 (5.2%) |
Employment Occupations by Sex in Fairland
Management, Business, Science and Arts Occupations
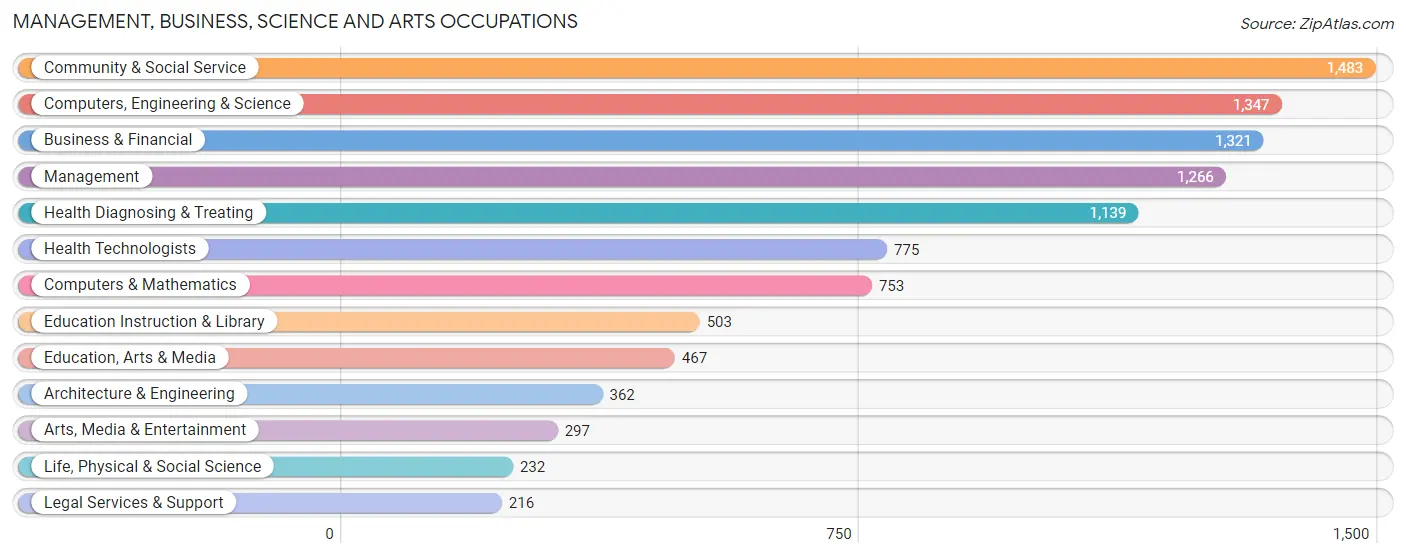
The most common Management, Business, Science and Arts occupations in Fairland are Community & Social Service (1,483 | 10.7%), Computers, Engineering & Science (1,347 | 9.8%), Business & Financial (1,321 | 9.6%), Management (1,266 | 9.2%), and Health Diagnosing & Treating (1,139 | 8.3%).
Management, Business, Science and Arts Occupations by Sex
Within the Management, Business, Science and Arts occupations in Fairland, the most male-oriented occupations are Computers & Mathematics (79.5%), Architecture & Engineering (76.0%), and Computers, Engineering & Science (73.6%), while the most female-oriented occupations are Education Instruction & Library (74.8%), Education, Arts & Media (69.8%), and Health Technologists (69.4%).
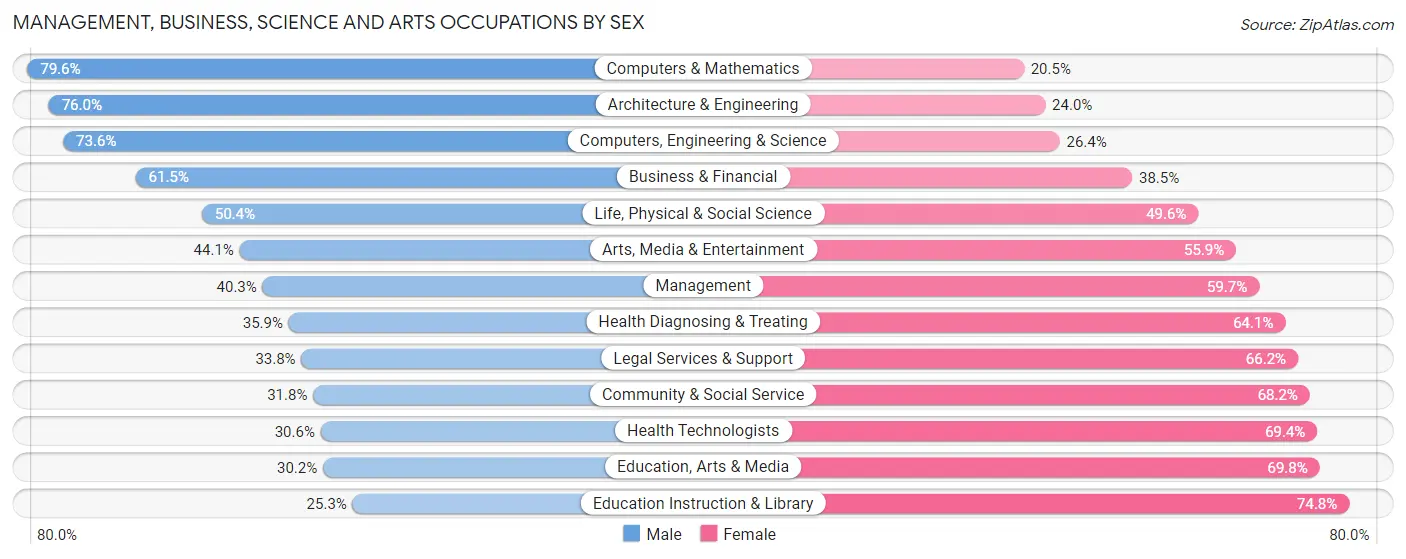
| Occupation | Male | Female |
| Management | 510 (40.3%) | 756 (59.7%) |
| Business & Financial | 812 (61.5%) | 509 (38.5%) |
| Computers, Engineering & Science | 991 (73.6%) | 356 (26.4%) |
| Computers & Mathematics | 599 (79.5%) | 154 (20.4%) |
| Architecture & Engineering | 275 (76.0%) | 87 (24.0%) |
| Life, Physical & Social Science | 117 (50.4%) | 115 (49.6%) |
| Community & Social Service | 472 (31.8%) | 1,011 (68.2%) |
| Education, Arts & Media | 141 (30.2%) | 326 (69.8%) |
| Legal Services & Support | 73 (33.8%) | 143 (66.2%) |
| Education Instruction & Library | 127 (25.3%) | 376 (74.8%) |
| Arts, Media & Entertainment | 131 (44.1%) | 166 (55.9%) |
| Health Diagnosing & Treating | 409 (35.9%) | 730 (64.1%) |
| Health Technologists | 237 (30.6%) | 538 (69.4%) |
| Total (Category) | 3,194 (48.7%) | 3,362 (51.3%) |
| Total (Overall) | 6,977 (50.6%) | 6,820 (49.4%) |
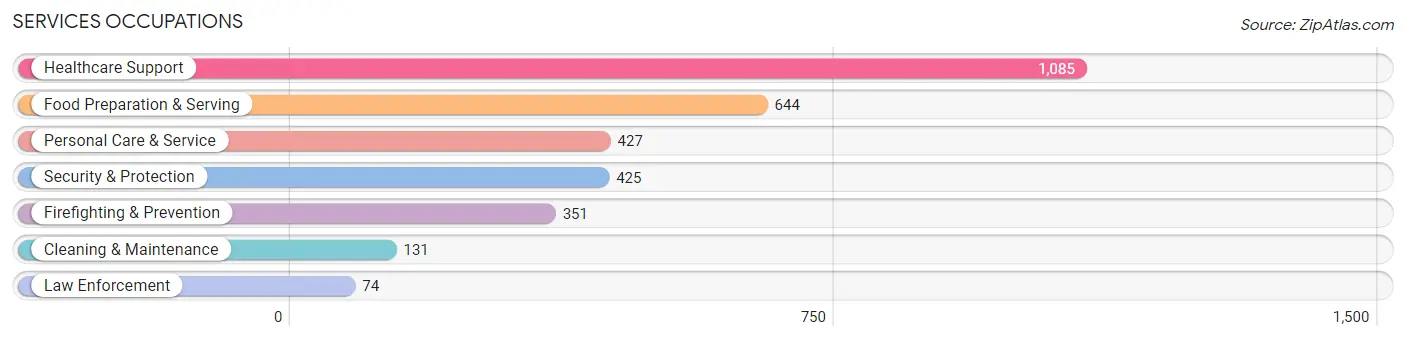
Services Occupations
The most common Services occupations in Fairland are Healthcare Support (1,085 | 7.9%), Food Preparation & Serving (644 | 4.7%), Personal Care & Service (427 | 3.1%), Security & Protection (425 | 3.1%), and Firefighting & Prevention (351 | 2.5%).
Services Occupations by Sex
Within the Services occupations in Fairland, the most male-oriented occupations are Firefighting & Prevention (98.6%), Security & Protection (95.5%), and Law Enforcement (81.1%), while the most female-oriented occupations are Healthcare Support (77.4%), Personal Care & Service (70.5%), and Food Preparation & Serving (47.4%).
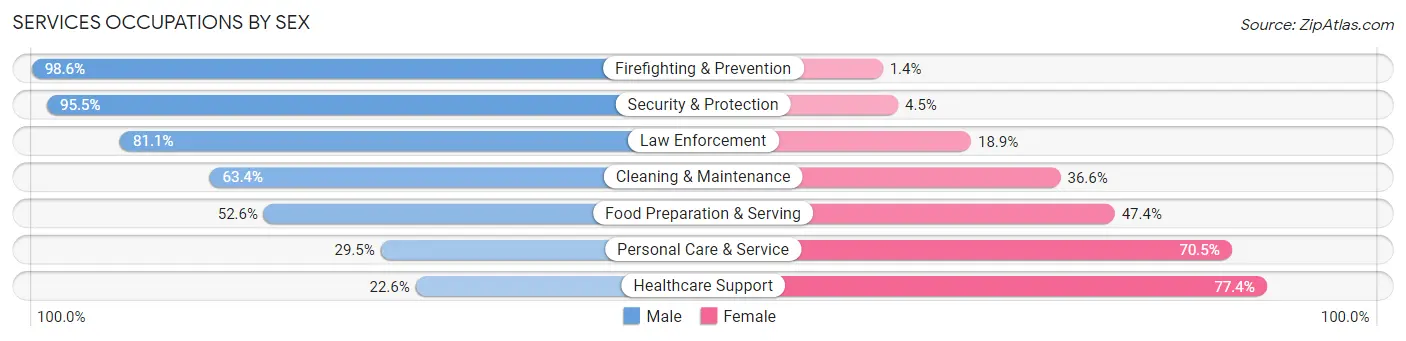
| Occupation | Male | Female |
| Healthcare Support | 245 (22.6%) | 840 (77.4%) |
| Security & Protection | 406 (95.5%) | 19 (4.5%) |
| Firefighting & Prevention | 346 (98.6%) | 5 (1.4%) |
| Law Enforcement | 60 (81.1%) | 14 (18.9%) |
| Food Preparation & Serving | 339 (52.6%) | 305 (47.4%) |
| Cleaning & Maintenance | 83 (63.4%) | 48 (36.6%) |
| Personal Care & Service | 126 (29.5%) | 301 (70.5%) |
| Total (Category) | 1,199 (44.2%) | 1,513 (55.8%) |
| Total (Overall) | 6,977 (50.6%) | 6,820 (49.4%) |
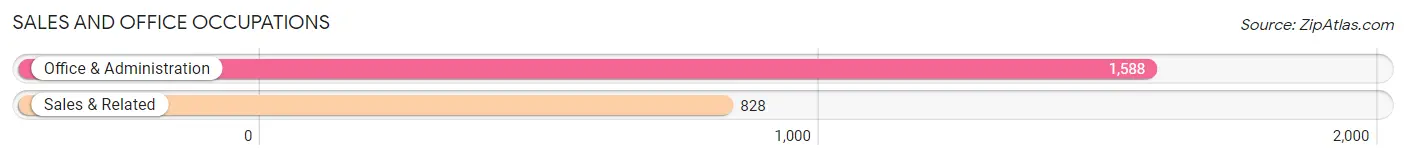
Sales and Office Occupations
The most common Sales and Office occupations in Fairland are Office & Administration (1,588 | 11.5%), and Sales & Related (828 | 6.0%).
Sales and Office Occupations by Sex
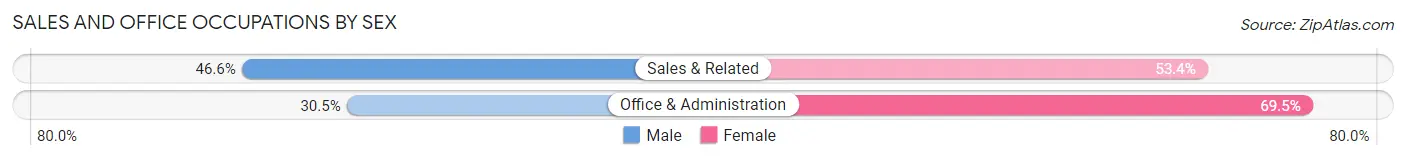
| Occupation | Male | Female |
| Sales & Related | 386 (46.6%) | 442 (53.4%) |
| Office & Administration | 484 (30.5%) | 1,104 (69.5%) |
| Total (Category) | 870 (36.0%) | 1,546 (64.0%) |
| Total (Overall) | 6,977 (50.6%) | 6,820 (49.4%) |
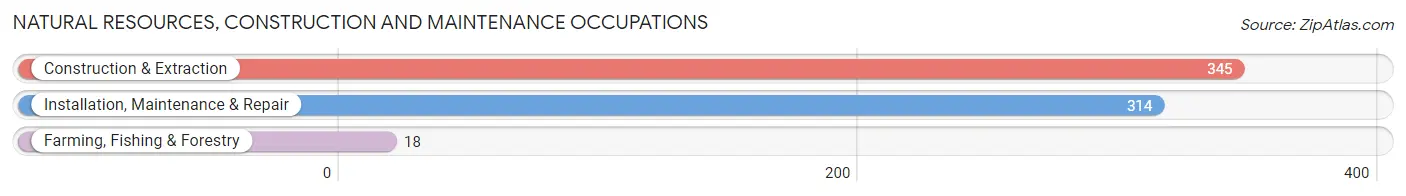
Natural Resources, Construction and Maintenance Occupations
The most common Natural Resources, Construction and Maintenance occupations in Fairland are Construction & Extraction (345 | 2.5%), Installation, Maintenance & Repair (314 | 2.3%), and Farming, Fishing & Forestry (18 | 0.1%).
Natural Resources, Construction and Maintenance Occupations by Sex
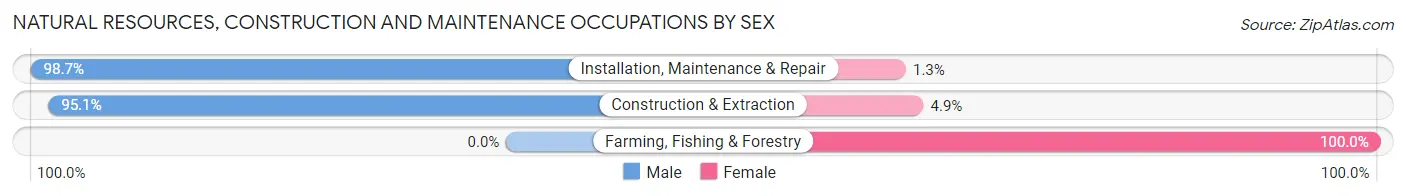
| Occupation | Male | Female |
| Farming, Fishing & Forestry | 0 (0.0%) | 18 (100.0%) |
| Construction & Extraction | 328 (95.1%) | 17 (4.9%) |
| Installation, Maintenance & Repair | 310 (98.7%) | 4 (1.3%) |
| Total (Category) | 638 (94.2%) | 39 (5.8%) |
| Total (Overall) | 6,977 (50.6%) | 6,820 (49.4%) |
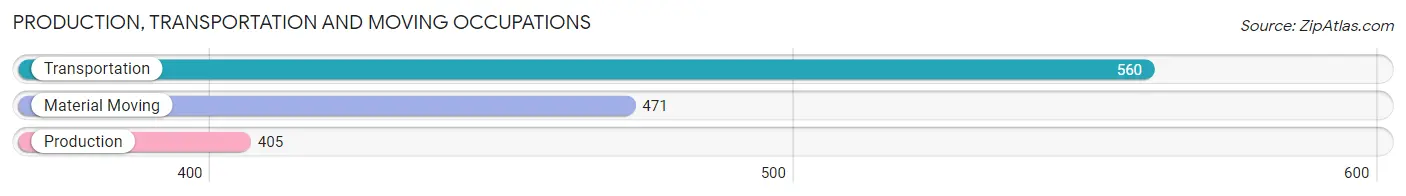
Production, Transportation and Moving Occupations
The most common Production, Transportation and Moving occupations in Fairland are Transportation (560 | 4.1%), Material Moving (471 | 3.4%), and Production (405 | 2.9%).
Production, Transportation and Moving Occupations by Sex
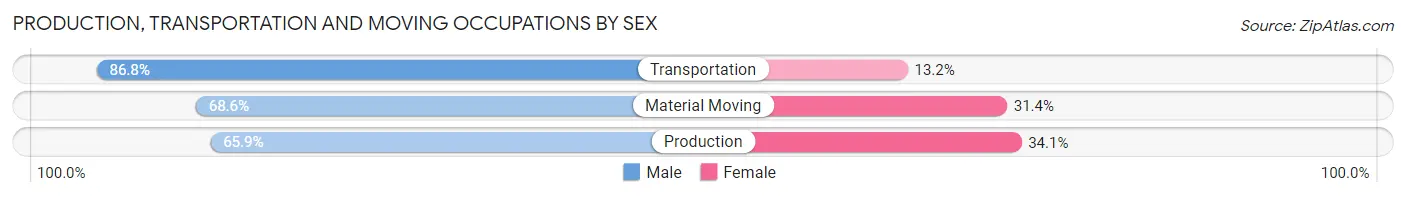
| Occupation | Male | Female |
| Production | 267 (65.9%) | 138 (34.1%) |
| Transportation | 486 (86.8%) | 74 (13.2%) |
| Material Moving | 323 (68.6%) | 148 (31.4%) |
| Total (Category) | 1,076 (74.9%) | 360 (25.1%) |
| Total (Overall) | 6,977 (50.6%) | 6,820 (49.4%) |
Employment Industries by Sex in Fairland
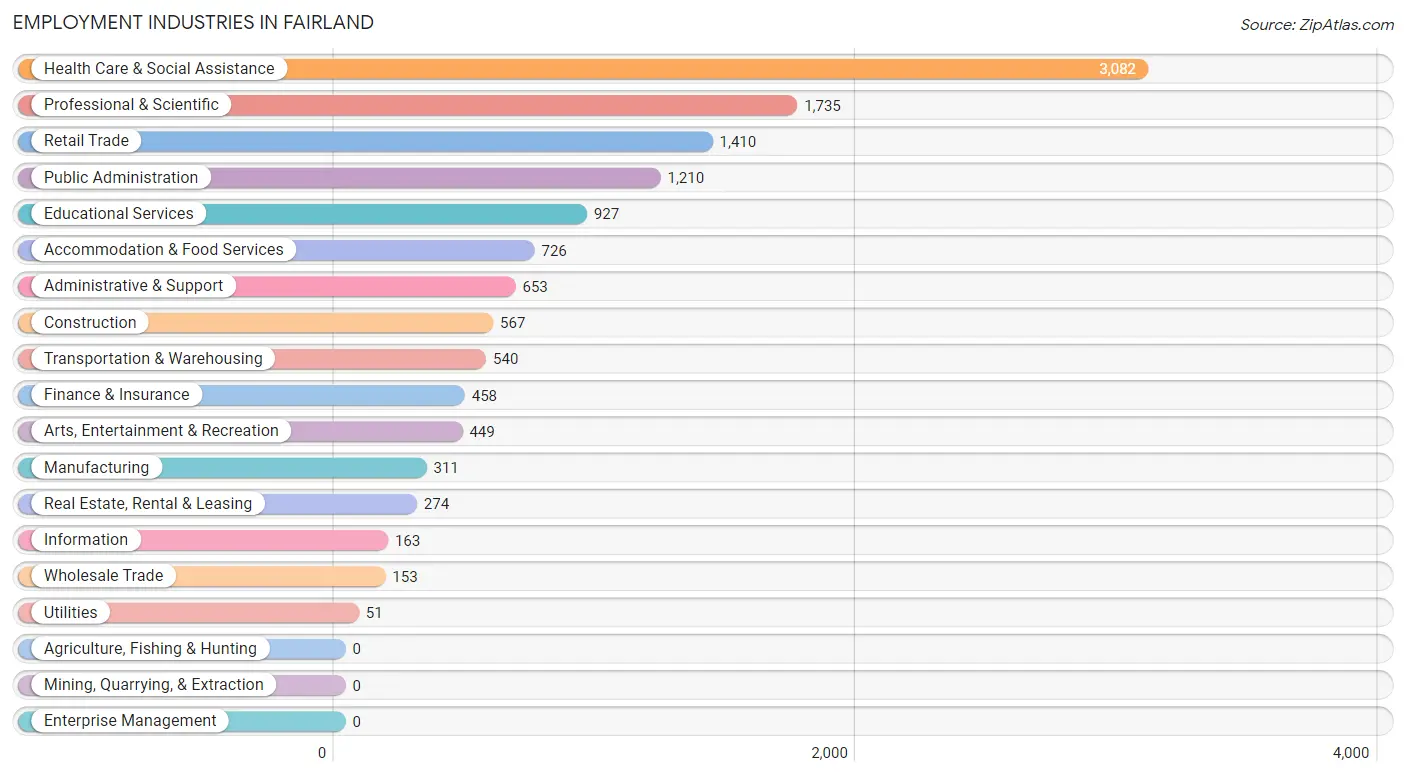
Employment Industries in Fairland
The major employment industries in Fairland include Health Care & Social Assistance (3,082 | 22.3%), Professional & Scientific (1,735 | 12.6%), Retail Trade (1,410 | 10.2%), Public Administration (1,210 | 8.8%), and Educational Services (927 | 6.7%).
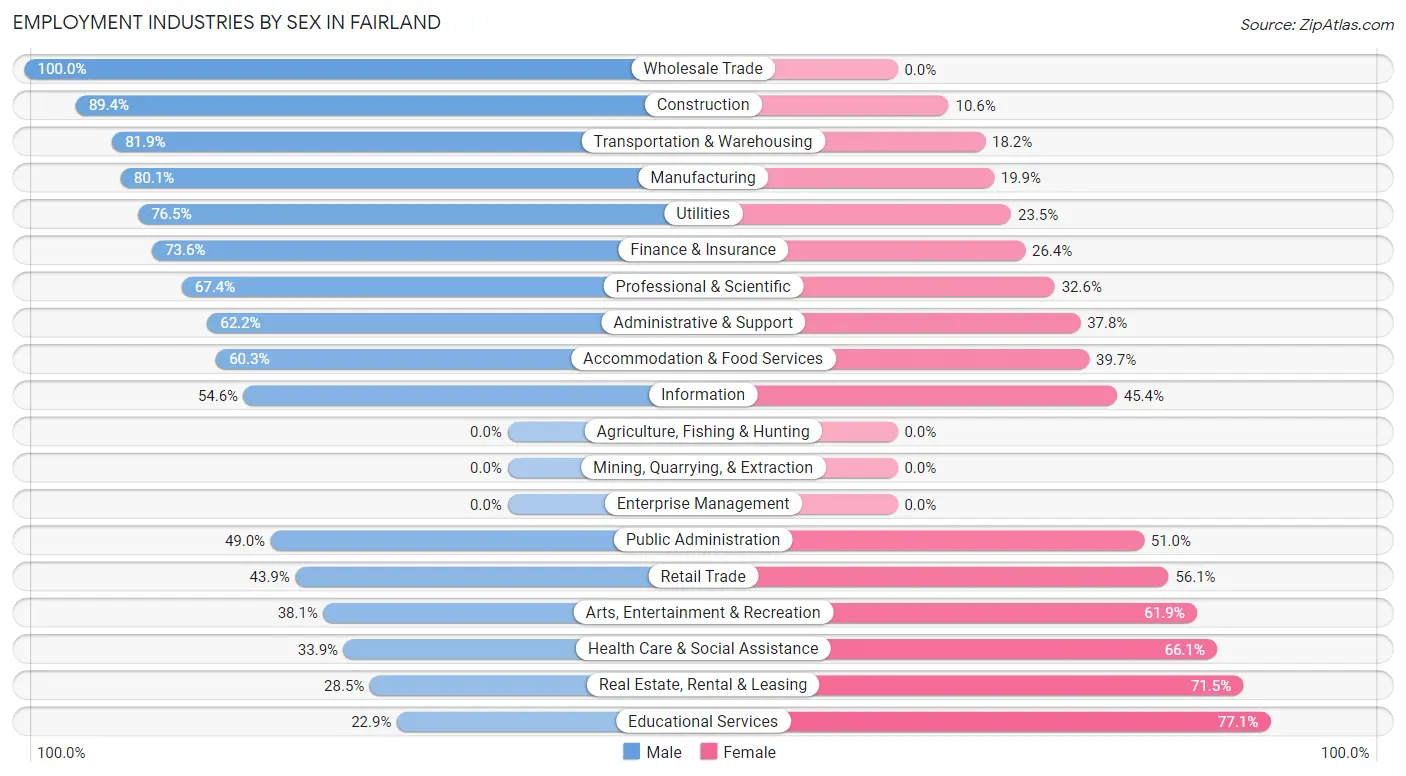
Employment Industries by Sex in Fairland
The Fairland industries that see more men than women are Wholesale Trade (100.0%), Construction (89.4%), and Transportation & Warehousing (81.9%), whereas the industries that tend to have a higher number of women are Educational Services (77.1%), Real Estate, Rental & Leasing (71.5%), and Health Care & Social Assistance (66.1%).
| Industry | Male | Female |
| Agriculture, Fishing & Hunting | 0 (0.0%) | 0 (0.0%) |
| Mining, Quarrying, & Extraction | 0 (0.0%) | 0 (0.0%) |
| Construction | 507 (89.4%) | 60 (10.6%) |
| Manufacturing | 249 (80.1%) | 62 (19.9%) |
| Wholesale Trade | 153 (100.0%) | 0 (0.0%) |
| Retail Trade | 619 (43.9%) | 791 (56.1%) |
| Transportation & Warehousing | 442 (81.9%) | 98 (18.1%) |
| Utilities | 39 (76.5%) | 12 (23.5%) |
| Information | 89 (54.6%) | 74 (45.4%) |
| Finance & Insurance | 337 (73.6%) | 121 (26.4%) |
| Real Estate, Rental & Leasing | 78 (28.5%) | 196 (71.5%) |
| Professional & Scientific | 1,170 (67.4%) | 565 (32.6%) |
| Enterprise Management | 0 (0.0%) | 0 (0.0%) |
| Administrative & Support | 406 (62.2%) | 247 (37.8%) |
| Educational Services | 212 (22.9%) | 715 (77.1%) |
| Health Care & Social Assistance | 1,045 (33.9%) | 2,037 (66.1%) |
| Arts, Entertainment & Recreation | 171 (38.1%) | 278 (61.9%) |
| Accommodation & Food Services | 438 (60.3%) | 288 (39.7%) |
| Public Administration | 593 (49.0%) | 617 (51.0%) |
| Total | 6,977 (50.6%) | 6,820 (49.4%) |
Education in Fairland
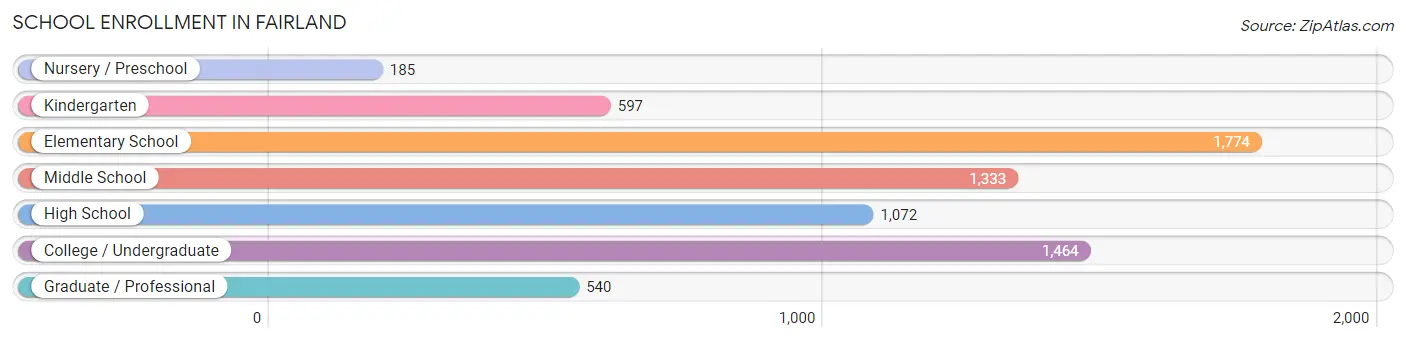
School Enrollment in Fairland
The most common levels of schooling among the 6,965 students in Fairland are elementary school (1,774 | 25.5%), college / undergraduate (1,464 | 21.0%), and middle school (1,333 | 19.1%).
| School Level | # Students | % Students |
| Nursery / Preschool | 185 | 2.7% |
| Kindergarten | 597 | 8.6% |
| Elementary School | 1,774 | 25.5% |
| Middle School | 1,333 | 19.1% |
| High School | 1,072 | 15.4% |
| College / Undergraduate | 1,464 | 21.0% |
| Graduate / Professional | 540 | 7.7% |
| Total | 6,965 | 100.0% |
School Enrollment by Age by Funding Source in Fairland
Out of a total of 6,965 students who are enrolled in schools in Fairland, 947 (13.6%) attend a private institution, while the remaining 6,018 (86.4%) are enrolled in public schools. The age group of 25 to 34 year olds has the highest likelihood of being enrolled in private schools, with 184 (37.5% in the age bracket) enrolled. Conversely, the age group of 18 to 19 year olds has the lowest likelihood of being enrolled in a private school, with 353 (100.0% in the age bracket) attending a public institution.
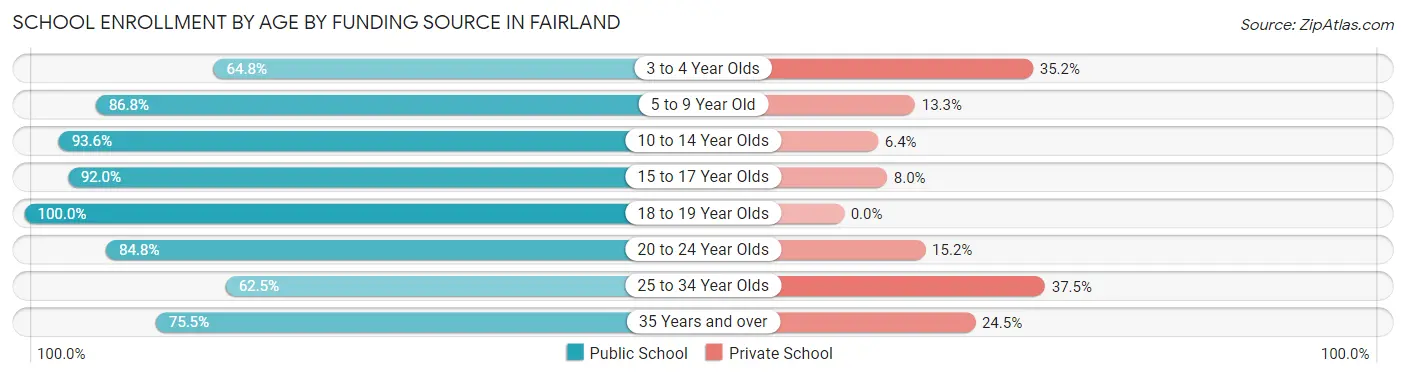
| Age Bracket | Public School | Private School |
| 3 to 4 Year Olds | 149 (64.8%) | 81 (35.2%) |
| 5 to 9 Year Old | 1,741 (86.8%) | 266 (13.3%) |
| 10 to 14 Year Olds | 1,631 (93.6%) | 111 (6.4%) |
| 15 to 17 Year Olds | 824 (92.0%) | 72 (8.0%) |
| 18 to 19 Year Olds | 353 (100.0%) | 0 (0.0%) |
| 20 to 24 Year Olds | 665 (84.8%) | 119 (15.2%) |
| 25 to 34 Year Olds | 307 (62.5%) | 184 (37.5%) |
| 35 Years and over | 349 (75.5%) | 113 (24.5%) |
| Total | 6,018 (86.4%) | 947 (13.6%) |
Educational Attainment by Field of Study in Fairland
Business (1,450 | 18.0%), social sciences (1,050 | 13.1%), science & technology (883 | 11.0%), engineering (670 | 8.3%), and bio, nature & agricultural (625 | 7.8%) are the most common fields of study among 8,037 individuals in Fairland who have obtained a bachelor's degree or higher.
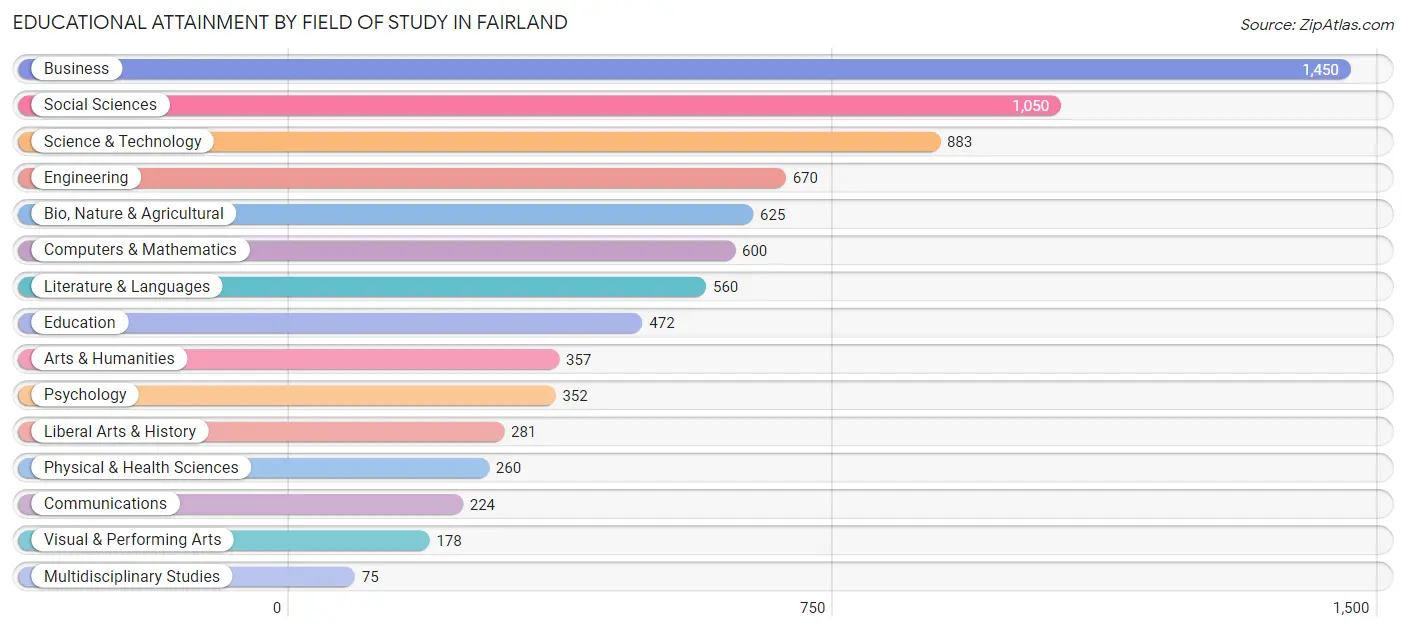
| Field of Study | # Graduates | % Graduates |
| Computers & Mathematics | 600 | 7.5% |
| Bio, Nature & Agricultural | 625 | 7.8% |
| Physical & Health Sciences | 260 | 3.2% |
| Psychology | 352 | 4.4% |
| Social Sciences | 1,050 | 13.1% |
| Engineering | 670 | 8.3% |
| Multidisciplinary Studies | 75 | 0.9% |
| Science & Technology | 883 | 11.0% |
| Business | 1,450 | 18.0% |
| Education | 472 | 5.9% |
| Literature & Languages | 560 | 7.0% |
| Liberal Arts & History | 281 | 3.5% |
| Visual & Performing Arts | 178 | 2.2% |
| Communications | 224 | 2.8% |
| Arts & Humanities | 357 | 4.4% |
| Total | 8,037 | 100.0% |
Transportation & Commute in Fairland
Vehicle Availability by Sex in Fairland
The most prevalent vehicle ownership categories in Fairland are males with 2 vehicles (3,103, accounting for 45.2%) and females with 2 vehicles (2,532, making up 46.8%).
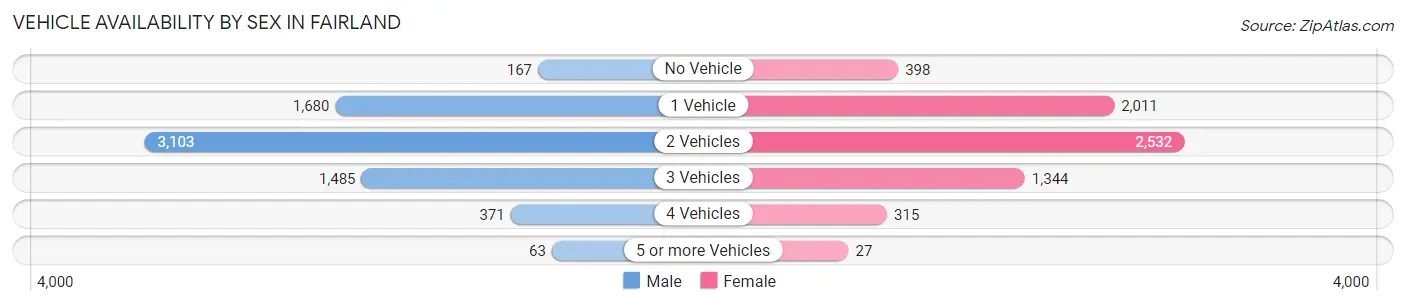
| Vehicles Available | Male | Female |
| No Vehicle | 167 (2.4%) | 398 (6.0%) |
| 1 Vehicle | 1,680 (24.5%) | 2,011 (30.3%) |
| 2 Vehicles | 3,103 (45.2%) | 2,532 (38.2%) |
| 3 Vehicles | 1,485 (21.6%) | 1,344 (20.3%) |
| 4 Vehicles | 371 (5.4%) | 315 (4.8%) |
| 5 or more Vehicles | 63 (0.9%) | 27 (0.4%) |
| Total | 6,869 (100.0%) | 6,627 (100.0%) |
Commute Time in Fairland
The most frequently occuring commute durations in Fairland are 30 to 34 minutes (2,446 commuters, 21.2%), 45 to 59 minutes (1,559 commuters, 13.5%), and 60 to 89 minutes (1,345 commuters, 11.7%).
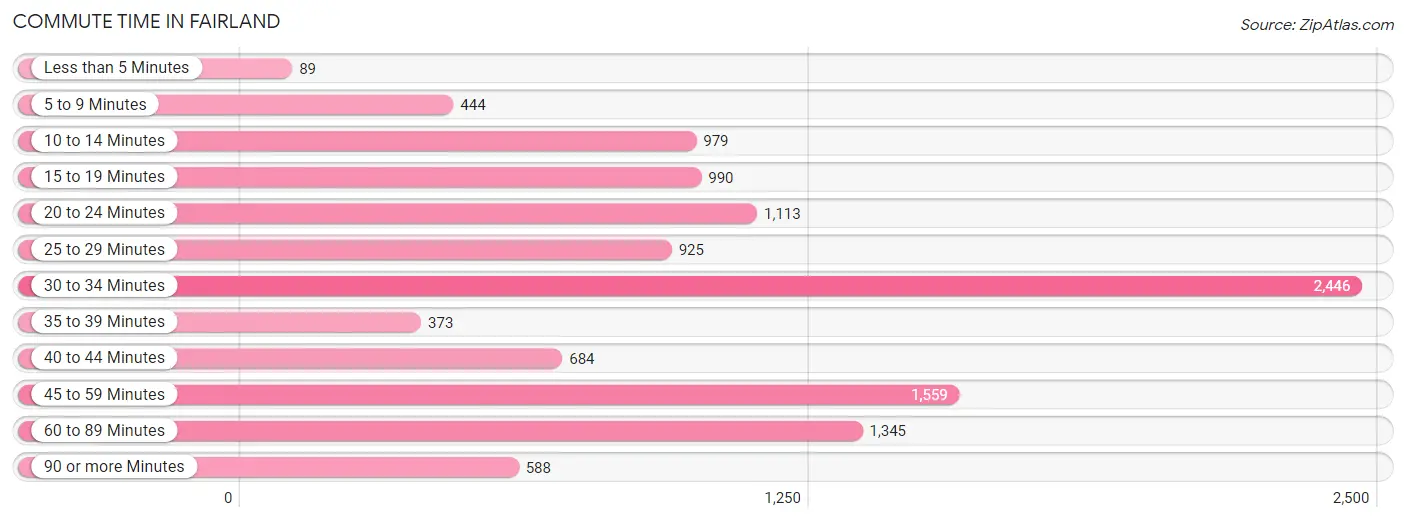
| Commute Time | # Commuters | % Commuters |
| Less than 5 Minutes | 89 | 0.8% |
| 5 to 9 Minutes | 444 | 3.8% |
| 10 to 14 Minutes | 979 | 8.5% |
| 15 to 19 Minutes | 990 | 8.6% |
| 20 to 24 Minutes | 1,113 | 9.7% |
| 25 to 29 Minutes | 925 | 8.0% |
| 30 to 34 Minutes | 2,446 | 21.2% |
| 35 to 39 Minutes | 373 | 3.2% |
| 40 to 44 Minutes | 684 | 5.9% |
| 45 to 59 Minutes | 1,559 | 13.5% |
| 60 to 89 Minutes | 1,345 | 11.7% |
| 90 or more Minutes | 588 | 5.1% |
Commute Time by Sex in Fairland
The most common commute times in Fairland are 30 to 34 minutes (1,427 commuters, 24.7%) for males and 30 to 34 minutes (1,019 commuters, 17.7%) for females.
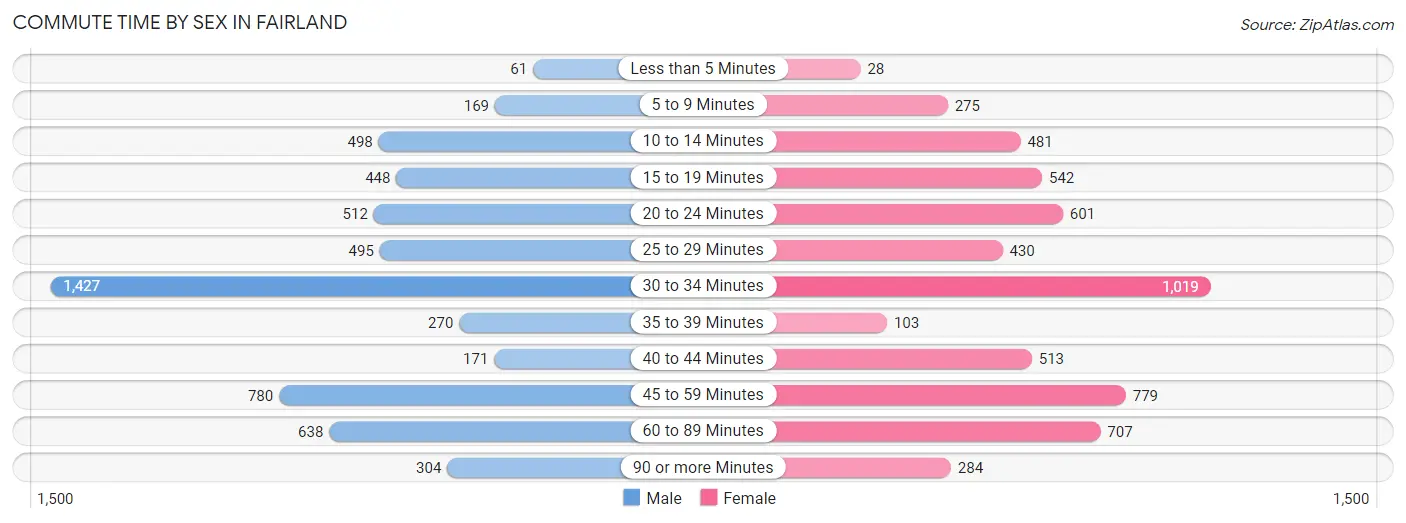
| Commute Time | Male | Female |
| Less than 5 Minutes | 61 (1.1%) | 28 (0.5%) |
| 5 to 9 Minutes | 169 (2.9%) | 275 (4.8%) |
| 10 to 14 Minutes | 498 (8.6%) | 481 (8.4%) |
| 15 to 19 Minutes | 448 (7.8%) | 542 (9.4%) |
| 20 to 24 Minutes | 512 (8.9%) | 601 (10.4%) |
| 25 to 29 Minutes | 495 (8.6%) | 430 (7.5%) |
| 30 to 34 Minutes | 1,427 (24.7%) | 1,019 (17.7%) |
| 35 to 39 Minutes | 270 (4.7%) | 103 (1.8%) |
| 40 to 44 Minutes | 171 (3.0%) | 513 (8.9%) |
| 45 to 59 Minutes | 780 (13.5%) | 779 (13.5%) |
| 60 to 89 Minutes | 638 (11.1%) | 707 (12.3%) |
| 90 or more Minutes | 304 (5.3%) | 284 (4.9%) |
Time of Departure to Work by Sex in Fairland
The most frequent times of departure to work in Fairland are 7:30 AM to 7:59 AM (955, 16.5%) for males and 6:00 AM to 6:29 AM (858, 14.9%) for females.
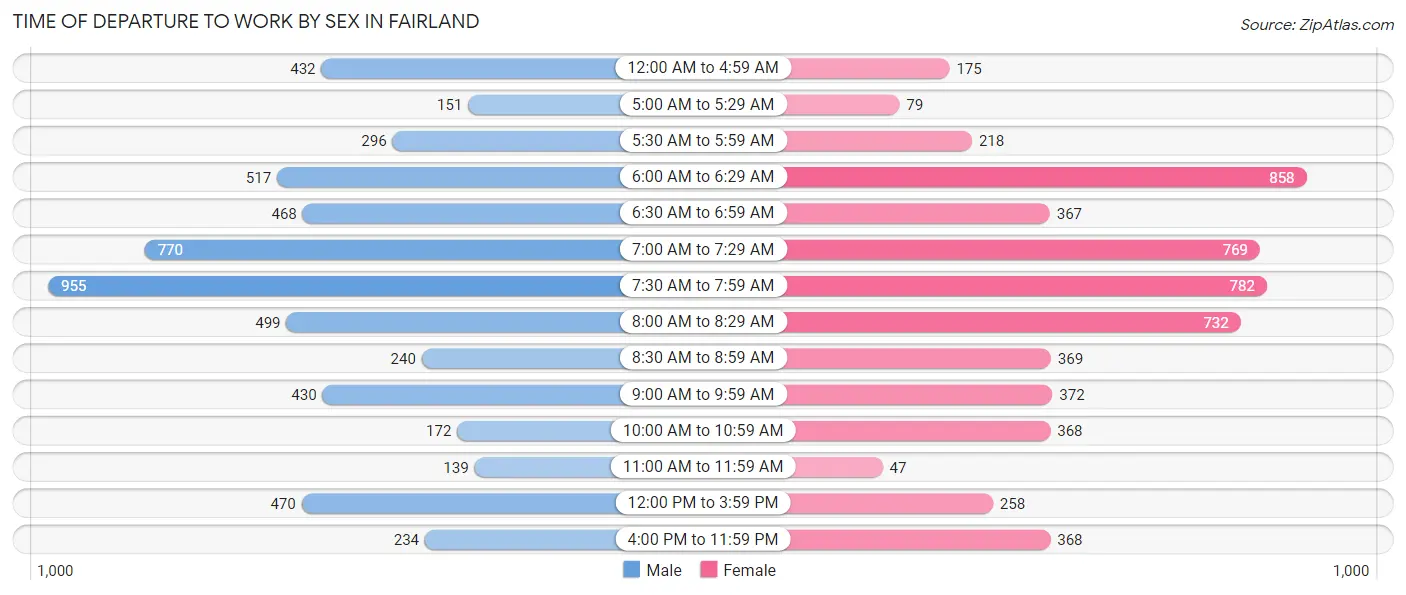
| Time of Departure | Male | Female |
| 12:00 AM to 4:59 AM | 432 (7.5%) | 175 (3.0%) |
| 5:00 AM to 5:29 AM | 151 (2.6%) | 79 (1.4%) |
| 5:30 AM to 5:59 AM | 296 (5.1%) | 218 (3.8%) |
| 6:00 AM to 6:29 AM | 517 (9.0%) | 858 (14.9%) |
| 6:30 AM to 6:59 AM | 468 (8.1%) | 367 (6.4%) |
| 7:00 AM to 7:29 AM | 770 (13.3%) | 769 (13.4%) |
| 7:30 AM to 7:59 AM | 955 (16.5%) | 782 (13.6%) |
| 8:00 AM to 8:29 AM | 499 (8.6%) | 732 (12.7%) |
| 8:30 AM to 8:59 AM | 240 (4.2%) | 369 (6.4%) |
| 9:00 AM to 9:59 AM | 430 (7.4%) | 372 (6.5%) |
| 10:00 AM to 10:59 AM | 172 (3.0%) | 368 (6.4%) |
| 11:00 AM to 11:59 AM | 139 (2.4%) | 47 (0.8%) |
| 12:00 PM to 3:59 PM | 470 (8.1%) | 258 (4.5%) |
| 4:00 PM to 11:59 PM | 234 (4.1%) | 368 (6.4%) |
| Total | 5,773 (100.0%) | 5,762 (100.0%) |
Housing Occupancy in Fairland
Occupancy by Ownership in Fairland
Of the total 9,254 dwellings in Fairland, owner-occupied units account for 4,278 (46.2%), while renter-occupied units make up 4,976 (53.8%).
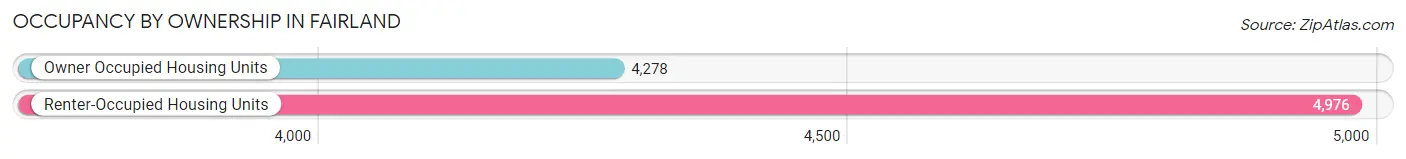
| Occupancy | # Housing Units | % Housing Units |
| Owner Occupied Housing Units | 4,278 | 46.2% |
| Renter-Occupied Housing Units | 4,976 | 53.8% |
| Total Occupied Housing Units | 9,254 | 100.0% |
Occupancy by Household Size in Fairland
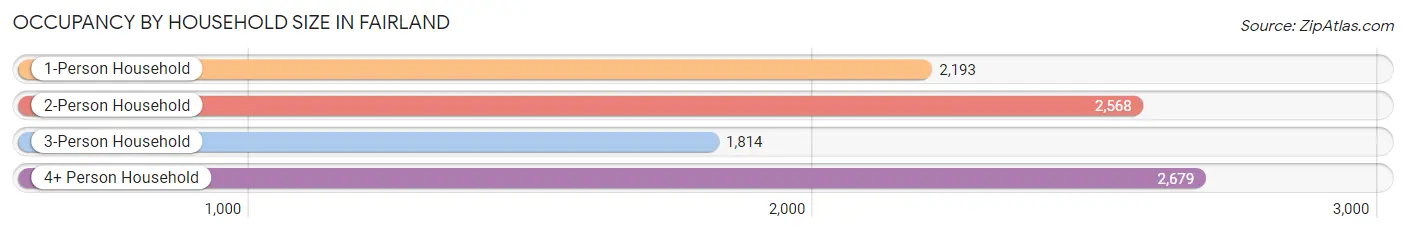
| Household Size | # Housing Units | % Housing Units |
| 1-Person Household | 2,193 | 23.7% |
| 2-Person Household | 2,568 | 27.8% |
| 3-Person Household | 1,814 | 19.6% |
| 4+ Person Household | 2,679 | 28.9% |
| Total Housing Units | 9,254 | 100.0% |
Occupancy by Ownership by Household Size in Fairland
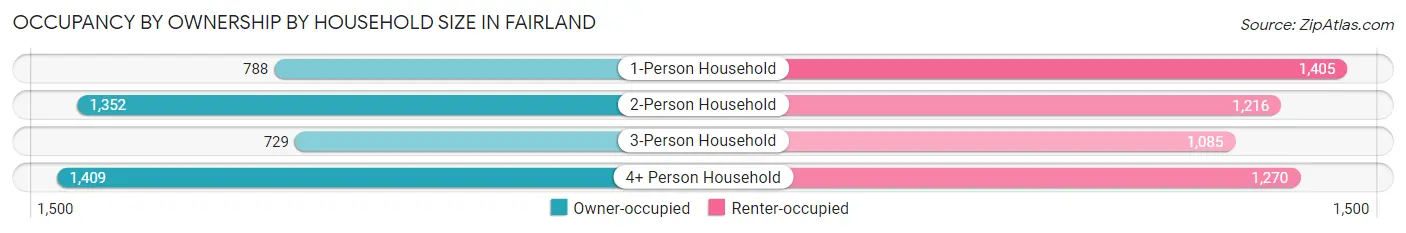
| Household Size | Owner-occupied | Renter-occupied |
| 1-Person Household | 788 (35.9%) | 1,405 (64.1%) |
| 2-Person Household | 1,352 (52.6%) | 1,216 (47.3%) |
| 3-Person Household | 729 (40.2%) | 1,085 (59.8%) |
| 4+ Person Household | 1,409 (52.6%) | 1,270 (47.4%) |
| Total Housing Units | 4,278 (46.2%) | 4,976 (53.8%) |
Occupancy by Educational Attainment in Fairland
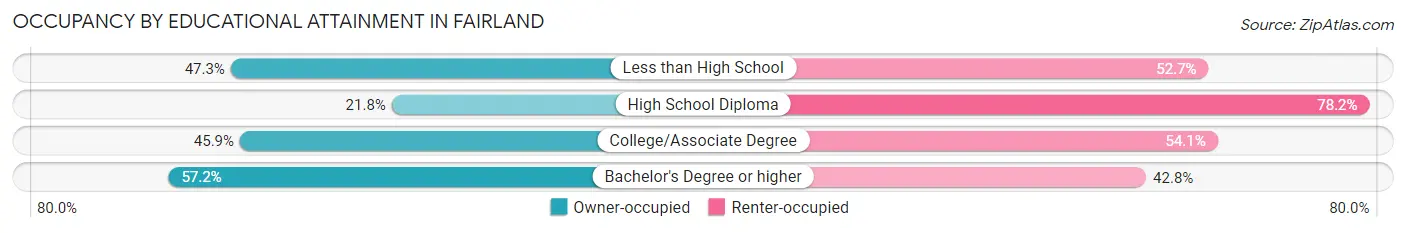
| Household Size | Owner-occupied | Renter-occupied |
| Less than High School | 229 (47.3%) | 255 (52.7%) |
| High School Diploma | 436 (21.8%) | 1,566 (78.2%) |
| College/Associate Degree | 1,040 (45.9%) | 1,228 (54.1%) |
| Bachelor's Degree or higher | 2,573 (57.2%) | 1,927 (42.8%) |
Occupancy by Age of Householder in Fairland
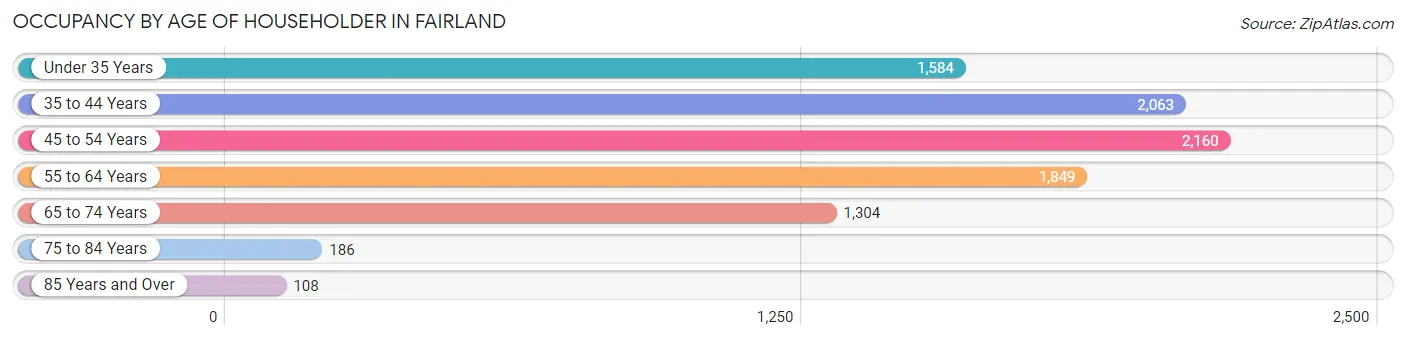
| Age Bracket | # Households | % Households |
| Under 35 Years | 1,584 | 17.1% |
| 35 to 44 Years | 2,063 | 22.3% |
| 45 to 54 Years | 2,160 | 23.3% |
| 55 to 64 Years | 1,849 | 20.0% |
| 65 to 74 Years | 1,304 | 14.1% |
| 75 to 84 Years | 186 | 2.0% |
| 85 Years and Over | 108 | 1.2% |
| Total | 9,254 | 100.0% |
Housing Finances in Fairland
Median Income by Occupancy in Fairland
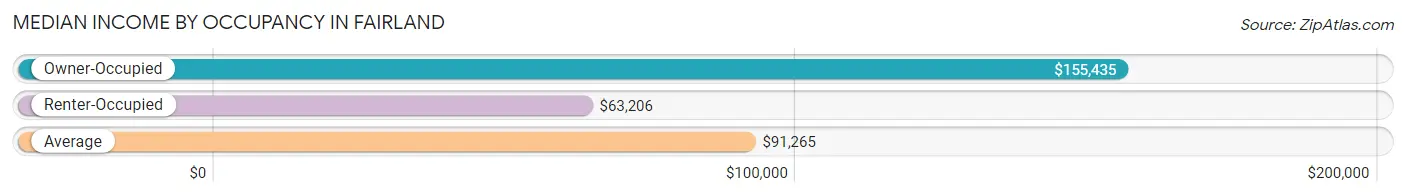
| Occupancy Type | # Households | Median Income |
| Owner-Occupied | 4,278 (46.2%) | $155,435 |
| Renter-Occupied | 4,976 (53.8%) | $63,206 |
| Average | 9,254 (100.0%) | $91,265 |
Occupancy by Householder Income Bracket in Fairland
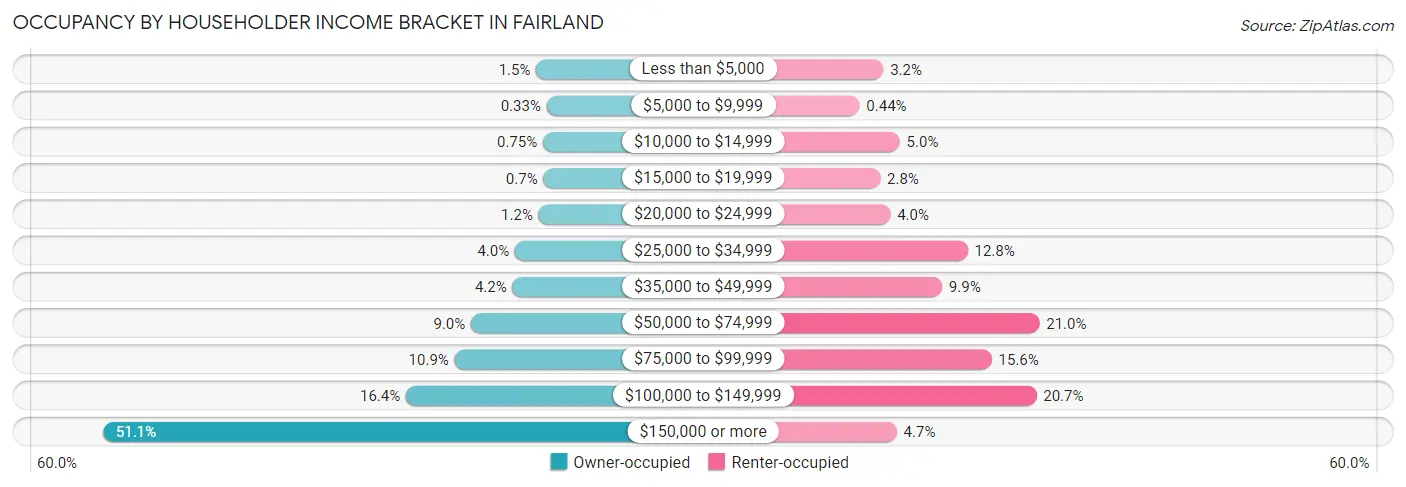
| Income Bracket | Owner-occupied | Renter-occupied |
| Less than $5,000 | 65 (1.5%) | 157 (3.2%) |
| $5,000 to $9,999 | 14 (0.3%) | 22 (0.4%) |
| $10,000 to $14,999 | 32 (0.7%) | 251 (5.0%) |
| $15,000 to $19,999 | 30 (0.7%) | 140 (2.8%) |
| $20,000 to $24,999 | 53 (1.2%) | 197 (4.0%) |
| $25,000 to $34,999 | 169 (4.0%) | 637 (12.8%) |
| $35,000 to $49,999 | 181 (4.2%) | 491 (9.9%) |
| $50,000 to $74,999 | 384 (9.0%) | 1,045 (21.0%) |
| $75,000 to $99,999 | 464 (10.8%) | 774 (15.5%) |
| $100,000 to $149,999 | 702 (16.4%) | 1,028 (20.7%) |
| $150,000 or more | 2,184 (51.0%) | 234 (4.7%) |
| Total | 4,278 (100.0%) | 4,976 (100.0%) |
Monthly Housing Cost Tiers in Fairland
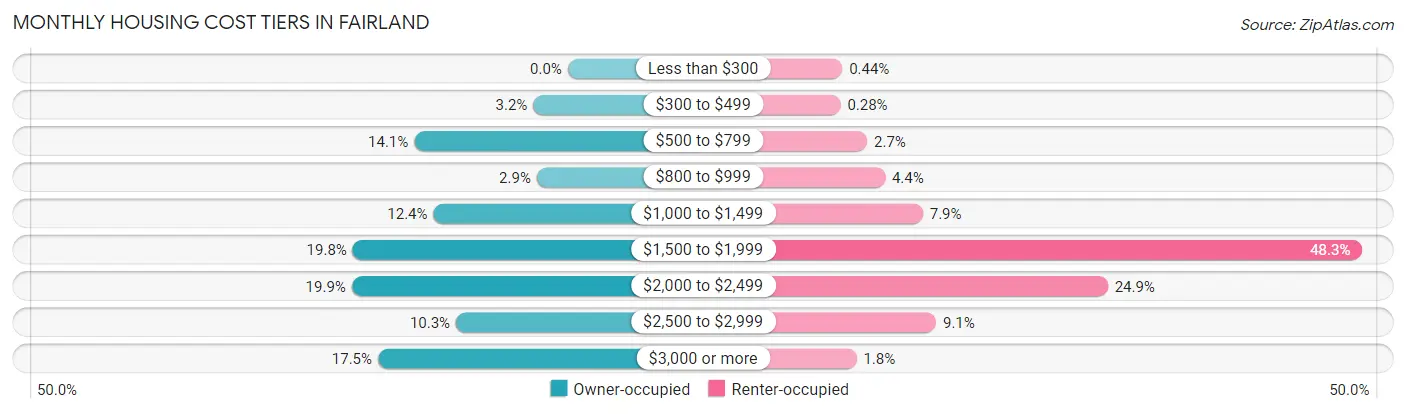
| Monthly Cost | Owner-occupied | Renter-occupied |
| Less than $300 | 0 (0.0%) | 22 (0.4%) |
| $300 to $499 | 136 (3.2%) | 14 (0.3%) |
| $500 to $799 | 605 (14.1%) | 136 (2.7%) |
| $800 to $999 | 122 (2.9%) | 218 (4.4%) |
| $1,000 to $1,499 | 529 (12.4%) | 391 (7.9%) |
| $1,500 to $1,999 | 847 (19.8%) | 2,404 (48.3%) |
| $2,000 to $2,499 | 851 (19.9%) | 1,238 (24.9%) |
| $2,500 to $2,999 | 440 (10.3%) | 452 (9.1%) |
| $3,000 or more | 748 (17.5%) | 87 (1.8%) |
| Total | 4,278 (100.0%) | 4,976 (100.0%) |
Physical Housing Characteristics in Fairland
Housing Structures in Fairland
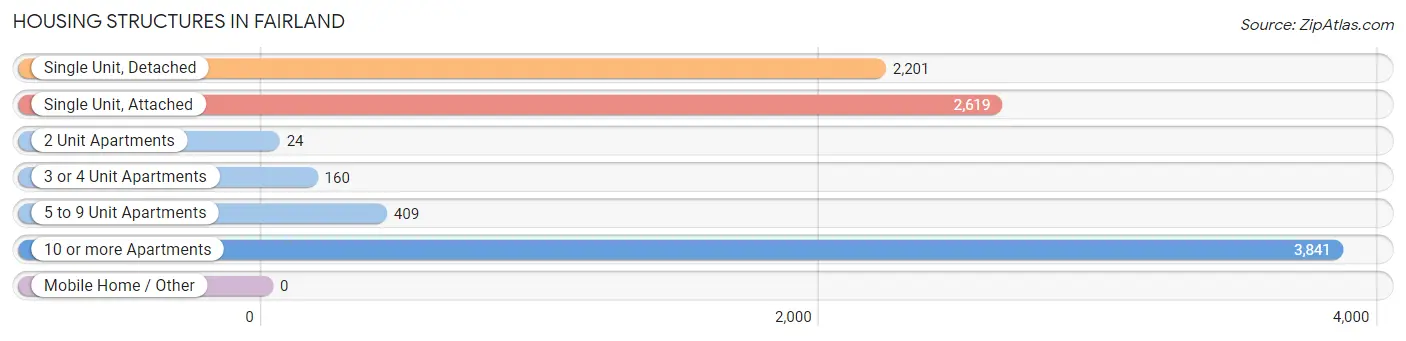
| Structure Type | # Housing Units | % Housing Units |
| Single Unit, Detached | 2,201 | 23.8% |
| Single Unit, Attached | 2,619 | 28.3% |
| 2 Unit Apartments | 24 | 0.3% |
| 3 or 4 Unit Apartments | 160 | 1.7% |
| 5 to 9 Unit Apartments | 409 | 4.4% |
| 10 or more Apartments | 3,841 | 41.5% |
| Mobile Home / Other | 0 | 0.0% |
| Total | 9,254 | 100.0% |
Housing Structures by Occupancy in Fairland
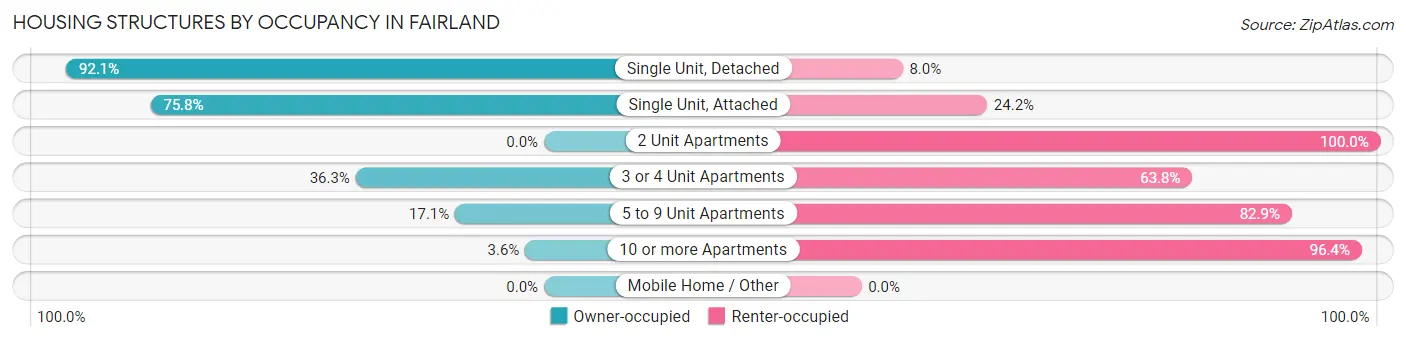
| Structure Type | Owner-occupied | Renter-occupied |
| Single Unit, Detached | 2,026 (92.0%) | 175 (8.0%) |
| Single Unit, Attached | 1,985 (75.8%) | 634 (24.2%) |
| 2 Unit Apartments | 0 (0.0%) | 24 (100.0%) |
| 3 or 4 Unit Apartments | 58 (36.2%) | 102 (63.7%) |
| 5 to 9 Unit Apartments | 70 (17.1%) | 339 (82.9%) |
| 10 or more Apartments | 139 (3.6%) | 3,702 (96.4%) |
| Mobile Home / Other | 0 (0.0%) | 0 (0.0%) |
| Total | 4,278 (46.2%) | 4,976 (53.8%) |
Housing Structures by Number of Rooms in Fairland
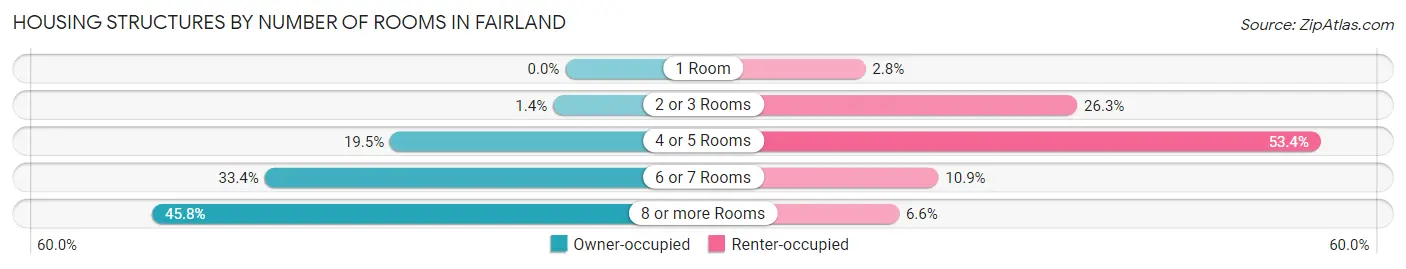
| Number of Rooms | Owner-occupied | Renter-occupied |
| 1 Room | 0 (0.0%) | 141 (2.8%) |
| 2 or 3 Rooms | 58 (1.4%) | 1,310 (26.3%) |
| 4 or 5 Rooms | 832 (19.5%) | 2,655 (53.4%) |
| 6 or 7 Rooms | 1,427 (33.4%) | 544 (10.9%) |
| 8 or more Rooms | 1,961 (45.8%) | 326 (6.6%) |
| Total | 4,278 (100.0%) | 4,976 (100.0%) |
Housing Structure by Heating Type in Fairland
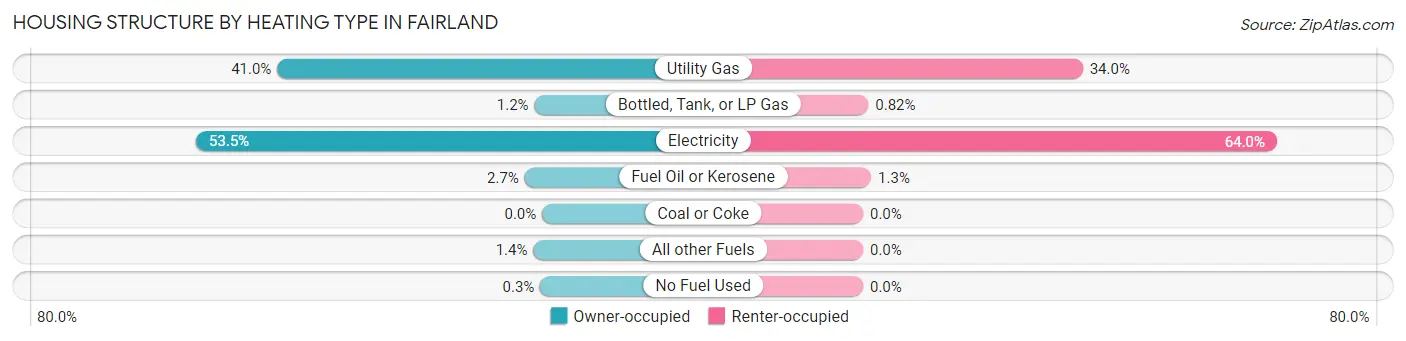
| Heating Type | Owner-occupied | Renter-occupied |
| Utility Gas | 1,752 (40.9%) | 1,690 (34.0%) |
| Bottled, Tank, or LP Gas | 51 (1.2%) | 41 (0.8%) |
| Electricity | 2,289 (53.5%) | 3,183 (64.0%) |
| Fuel Oil or Kerosene | 115 (2.7%) | 62 (1.3%) |
| Coal or Coke | 0 (0.0%) | 0 (0.0%) |
| All other Fuels | 58 (1.4%) | 0 (0.0%) |
| No Fuel Used | 13 (0.3%) | 0 (0.0%) |
| Total | 4,278 (100.0%) | 4,976 (100.0%) |
Household Vehicle Usage in Fairland
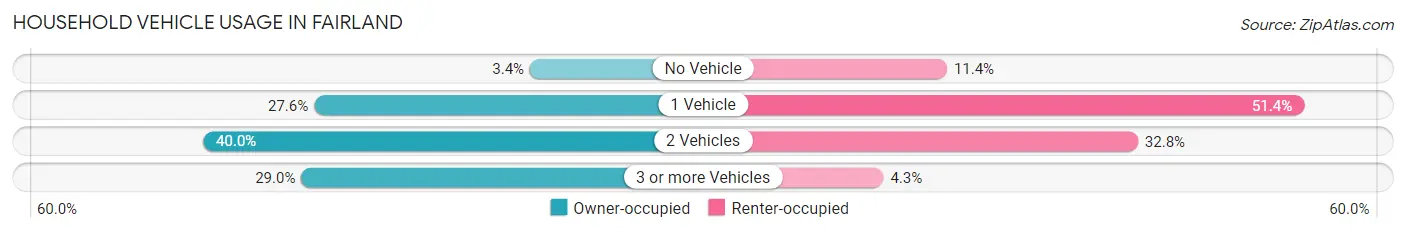
| Vehicles per Household | Owner-occupied | Renter-occupied |
| No Vehicle | 145 (3.4%) | 569 (11.4%) |
| 1 Vehicle | 1,180 (27.6%) | 2,559 (51.4%) |
| 2 Vehicles | 1,712 (40.0%) | 1,633 (32.8%) |
| 3 or more Vehicles | 1,241 (29.0%) | 215 (4.3%) |
| Total | 4,278 (100.0%) | 4,976 (100.0%) |
Real Estate & Mortgages in Fairland
Real Estate and Mortgage Overview in Fairland
| Characteristic | Without Mortgage | With Mortgage |
| Housing Units | 1,133 | 3,145 |
| Median Property Value | $486,600 | $411,400 |
| Median Household Income | $131,528 | $1,655 |
| Monthly Housing Costs | $747 | $748 |
| Real Estate Taxes | $4,273 | $74 |
Property Value by Mortgage Status in Fairland
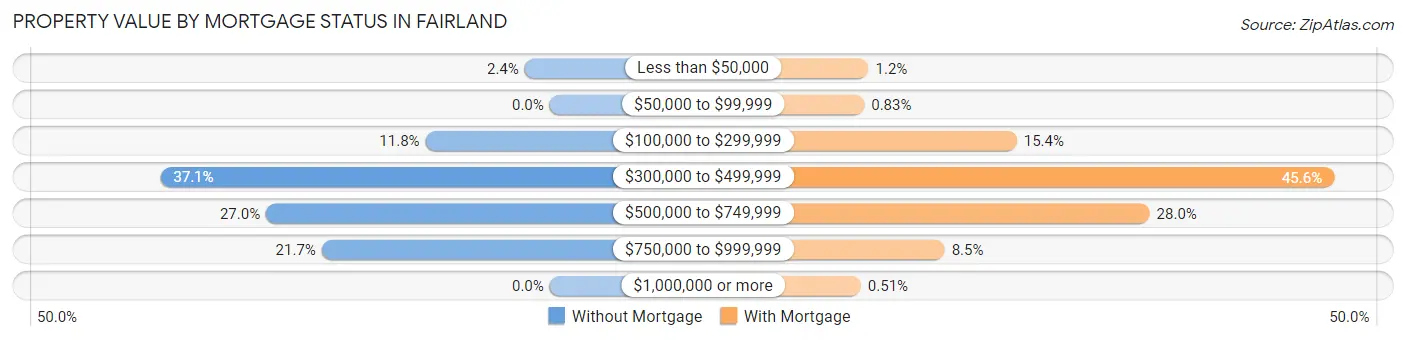
| Property Value | Without Mortgage | With Mortgage |
| Less than $50,000 | 27 (2.4%) | 39 (1.2%) |
| $50,000 to $99,999 | 0 (0.0%) | 26 (0.8%) |
| $100,000 to $299,999 | 134 (11.8%) | 483 (15.4%) |
| $300,000 to $499,999 | 420 (37.1%) | 1,433 (45.6%) |
| $500,000 to $749,999 | 306 (27.0%) | 881 (28.0%) |
| $750,000 to $999,999 | 246 (21.7%) | 267 (8.5%) |
| $1,000,000 or more | 0 (0.0%) | 16 (0.5%) |
| Total | 1,133 (100.0%) | 3,145 (100.0%) |
Household Income by Mortgage Status in Fairland
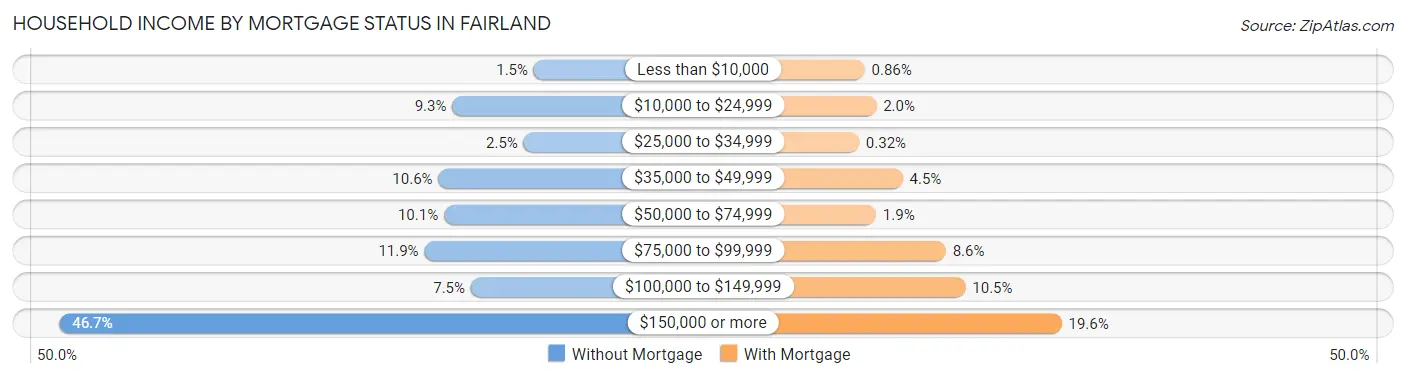
| Household Income | Without Mortgage | With Mortgage |
| Less than $10,000 | 17 (1.5%) | 27 (0.9%) |
| $10,000 to $24,999 | 105 (9.3%) | 62 (2.0%) |
| $25,000 to $34,999 | 28 (2.5%) | 10 (0.3%) |
| $35,000 to $49,999 | 120 (10.6%) | 141 (4.5%) |
| $50,000 to $74,999 | 114 (10.1%) | 61 (1.9%) |
| $75,000 to $99,999 | 135 (11.9%) | 270 (8.6%) |
| $100,000 to $149,999 | 85 (7.5%) | 329 (10.5%) |
| $150,000 or more | 529 (46.7%) | 617 (19.6%) |
| Total | 1,133 (100.0%) | 3,145 (100.0%) |
Property Value to Household Income Ratio in Fairland
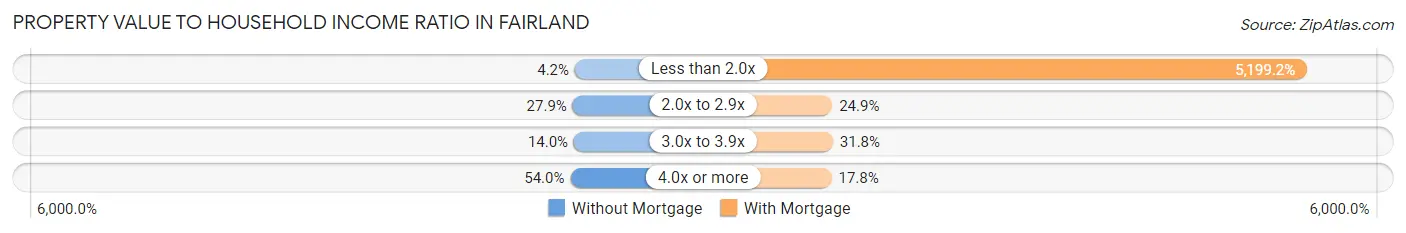
| Value-to-Income Ratio | Without Mortgage | With Mortgage |
| Less than 2.0x | 47 (4.2%) | 163,516 (5,199.2%) |
| 2.0x to 2.9x | 316 (27.9%) | 784 (24.9%) |
| 3.0x to 3.9x | 158 (14.0%) | 1,000 (31.8%) |
| 4.0x or more | 612 (54.0%) | 559 (17.8%) |
| Total | 1,133 (100.0%) | 3,145 (100.0%) |
Real Estate Taxes by Mortgage Status in Fairland
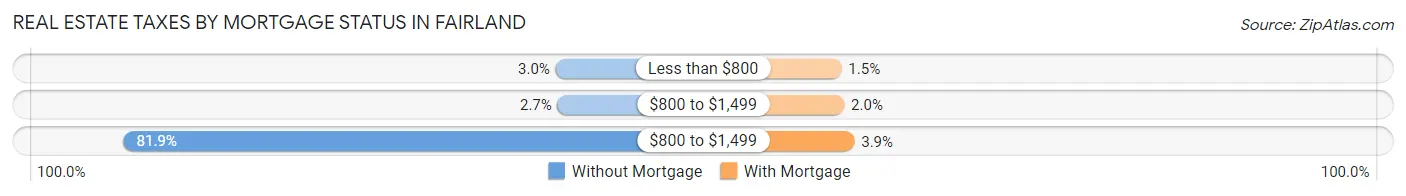
| Property Taxes | Without Mortgage | With Mortgage |
| Less than $800 | 34 (3.0%) | 48 (1.5%) |
| $800 to $1,499 | 30 (2.6%) | 64 (2.0%) |
| $800 to $1,499 | 928 (81.9%) | 122 (3.9%) |
| Total | 1,133 (100.0%) | 3,145 (100.0%) |
Health & Disability in Fairland
Health Insurance Coverage by Age in Fairland
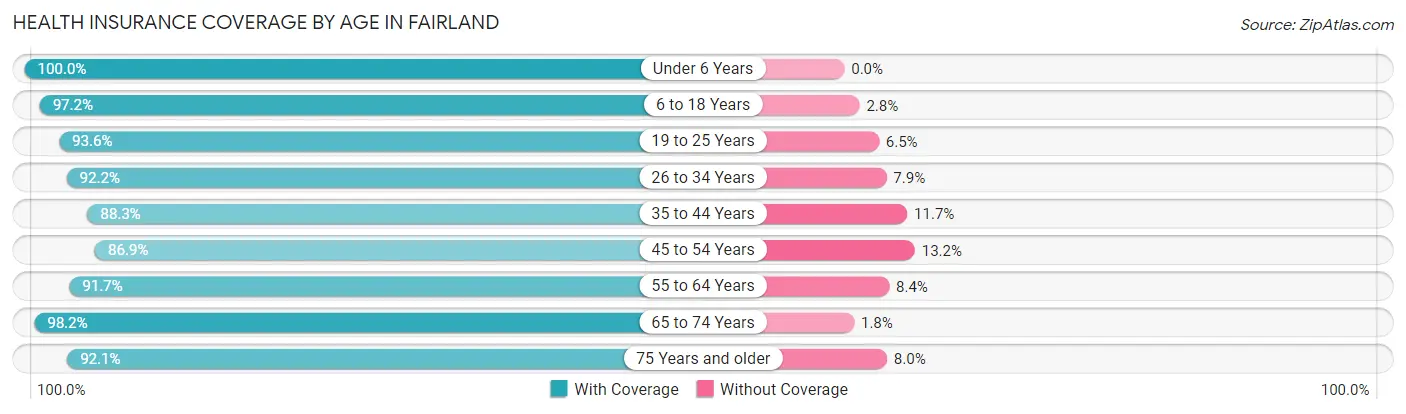
| Age Bracket | With Coverage | Without Coverage |
| Under 6 Years | 2,305 (100.0%) | 0 (0.0%) |
| 6 to 18 Years | 4,461 (97.2%) | 130 (2.8%) |
| 19 to 25 Years | 2,058 (93.5%) | 142 (6.5%) |
| 26 to 34 Years | 3,148 (92.1%) | 268 (7.9%) |
| 35 to 44 Years | 3,411 (88.3%) | 453 (11.7%) |
| 45 to 54 Years | 2,813 (86.9%) | 426 (13.2%) |
| 55 to 64 Years | 3,150 (91.6%) | 287 (8.4%) |
| 65 to 74 Years | 1,944 (98.2%) | 36 (1.8%) |
| 75 Years and older | 637 (92.0%) | 55 (8.0%) |
| Total | 23,927 (93.0%) | 1,797 (7.0%) |
Health Insurance Coverage by Citizenship Status in Fairland
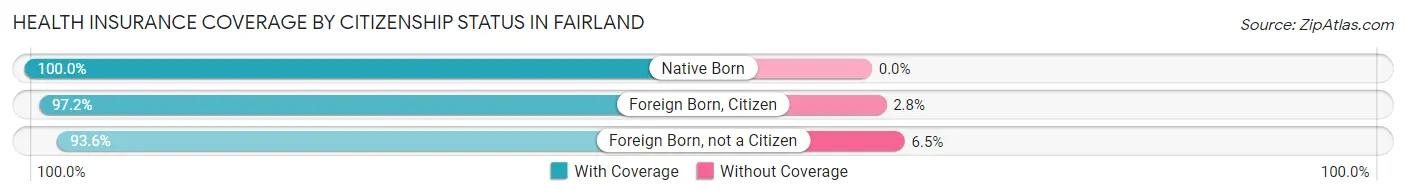
| Citizenship Status | With Coverage | Without Coverage |
| Native Born | 2,305 (100.0%) | 0 (0.0%) |
| Foreign Born, Citizen | 4,461 (97.2%) | 130 (2.8%) |
| Foreign Born, not a Citizen | 2,058 (93.5%) | 142 (6.5%) |
Health Insurance Coverage by Household Income in Fairland
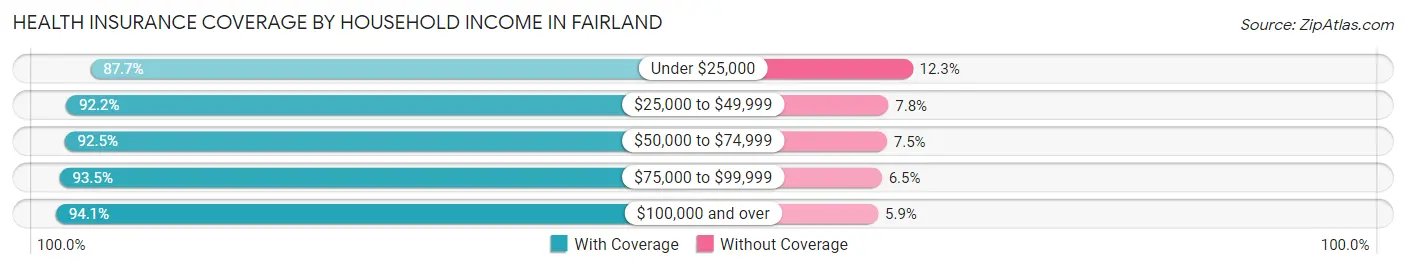
| Household Income | With Coverage | Without Coverage |
| Under $25,000 | 1,753 (87.7%) | 246 (12.3%) |
| $25,000 to $49,999 | 3,722 (92.2%) | 314 (7.8%) |
| $50,000 to $74,999 | 3,633 (92.5%) | 295 (7.5%) |
| $75,000 to $99,999 | 2,642 (93.5%) | 185 (6.5%) |
| $100,000 and over | 12,160 (94.1%) | 757 (5.9%) |
Public vs Private Health Insurance Coverage by Age in Fairland
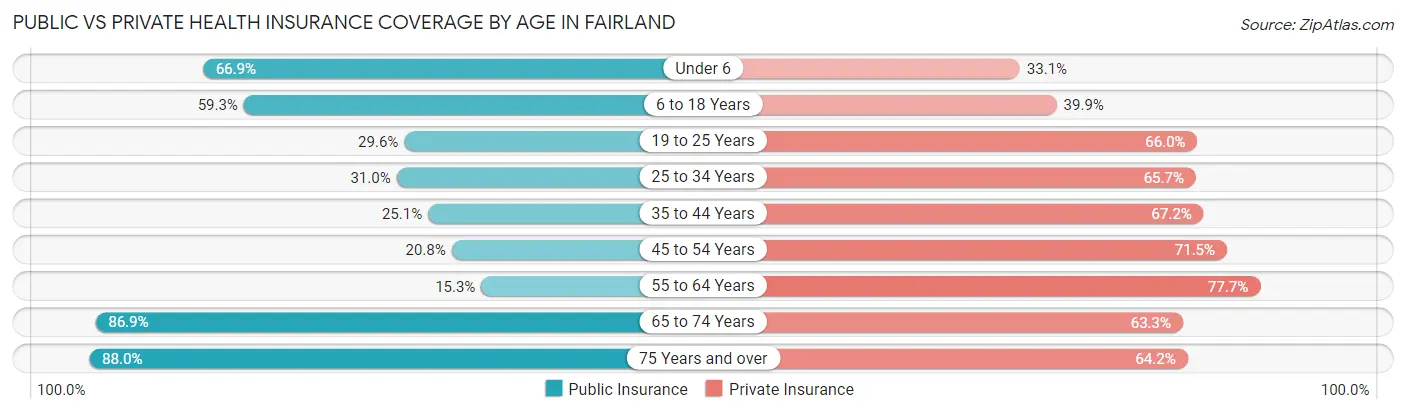
| Age Bracket | Public Insurance | Private Insurance |
| Under 6 | 1,543 (66.9%) | 762 (33.1%) |
| 6 to 18 Years | 2,724 (59.3%) | 1,831 (39.9%) |
| 19 to 25 Years | 650 (29.5%) | 1,452 (66.0%) |
| 25 to 34 Years | 1,058 (31.0%) | 2,244 (65.7%) |
| 35 to 44 Years | 971 (25.1%) | 2,595 (67.2%) |
| 45 to 54 Years | 672 (20.7%) | 2,315 (71.5%) |
| 55 to 64 Years | 524 (15.2%) | 2,669 (77.6%) |
| 65 to 74 Years | 1,720 (86.9%) | 1,253 (63.3%) |
| 75 Years and over | 609 (88.0%) | 444 (64.2%) |
| Total | 10,471 (40.7%) | 15,565 (60.5%) |
Disability Status by Sex by Age in Fairland
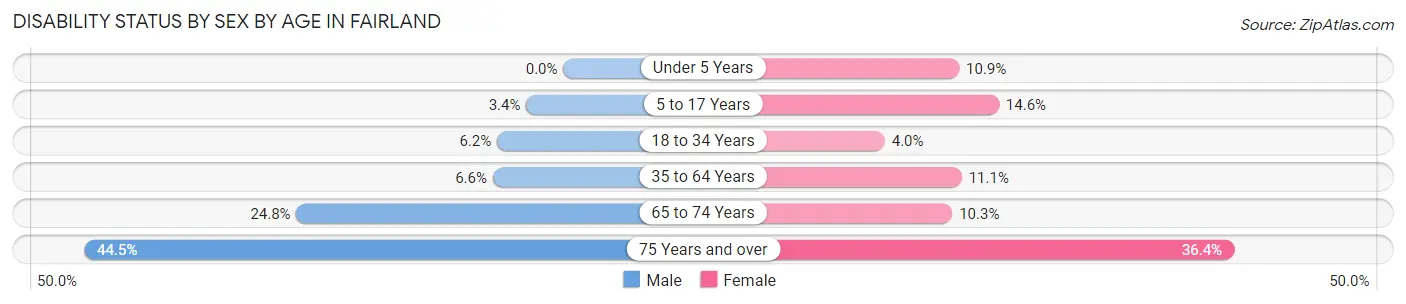
| Age Bracket | Male | Female |
| Under 5 Years | 0 (0.0%) | 103 (10.9%) |
| 5 to 17 Years | 68 (3.4%) | 413 (14.6%) |
| 18 to 34 Years | 185 (6.1%) | 110 (4.0%) |
| 35 to 64 Years | 325 (6.6%) | 621 (11.1%) |
| 65 to 74 Years | 239 (24.8%) | 104 (10.2%) |
| 75 Years and over | 133 (44.5%) | 143 (36.4%) |
Disability Class by Sex by Age in Fairland
Disability Class: Hearing Difficulty
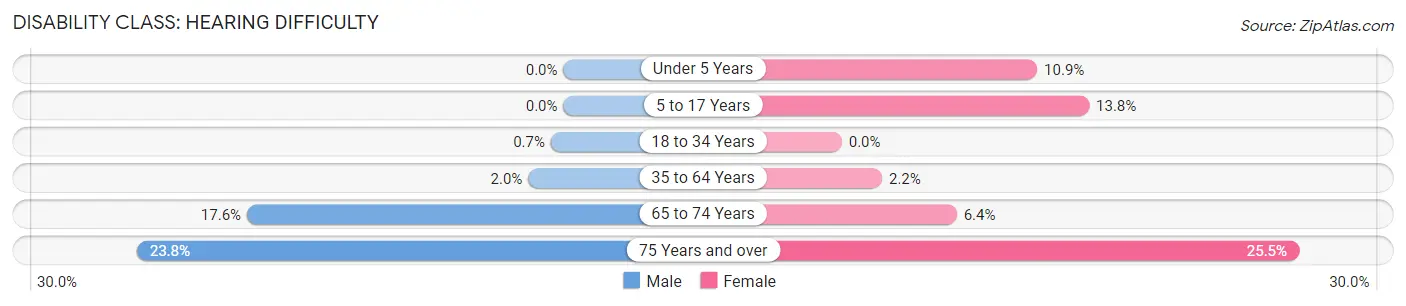
| Age Bracket | Male | Female |
| Under 5 Years | 0 (0.0%) | 103 (10.9%) |
| 5 to 17 Years | 0 (0.0%) | 390 (13.8%) |
| 18 to 34 Years | 21 (0.7%) | 0 (0.0%) |
| 35 to 64 Years | 97 (2.0%) | 125 (2.2%) |
| 65 to 74 Years | 170 (17.6%) | 65 (6.4%) |
| 75 Years and over | 71 (23.7%) | 100 (25.5%) |
Disability Class: Vision Difficulty
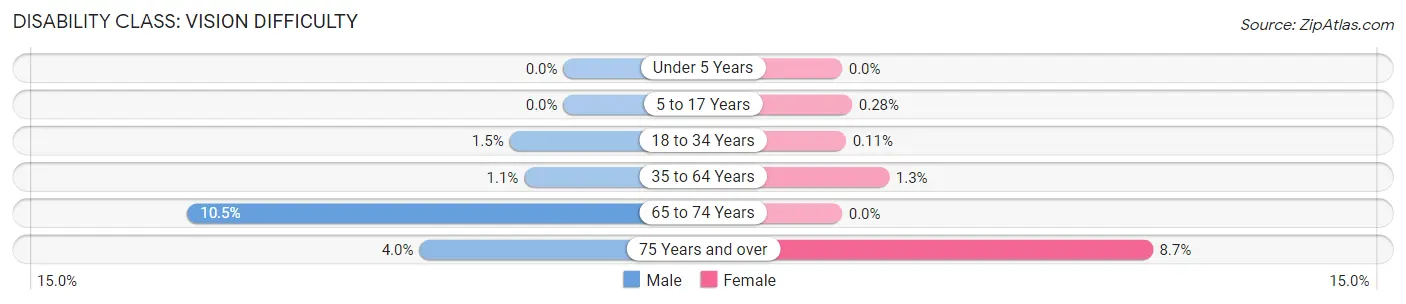
| Age Bracket | Male | Female |
| Under 5 Years | 0 (0.0%) | 0 (0.0%) |
| 5 to 17 Years | 0 (0.0%) | 8 (0.3%) |
| 18 to 34 Years | 45 (1.5%) | 3 (0.1%) |
| 35 to 64 Years | 54 (1.1%) | 73 (1.3%) |
| 65 to 74 Years | 101 (10.5%) | 0 (0.0%) |
| 75 Years and over | 12 (4.0%) | 34 (8.6%) |
Disability Class: Cognitive Difficulty
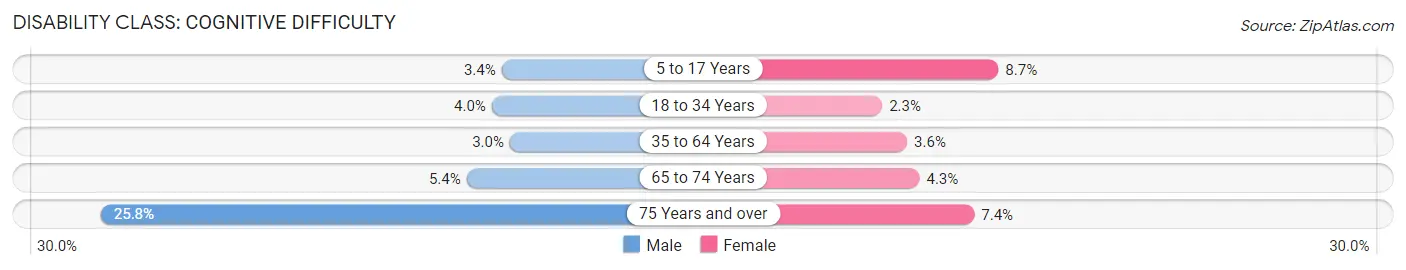
| Age Bracket | Male | Female |
| 5 to 17 Years | 68 (3.4%) | 247 (8.7%) |
| 18 to 34 Years | 120 (4.0%) | 62 (2.2%) |
| 35 to 64 Years | 148 (3.0%) | 203 (3.6%) |
| 65 to 74 Years | 52 (5.4%) | 44 (4.3%) |
| 75 Years and over | 77 (25.8%) | 29 (7.4%) |
Disability Class: Ambulatory Difficulty
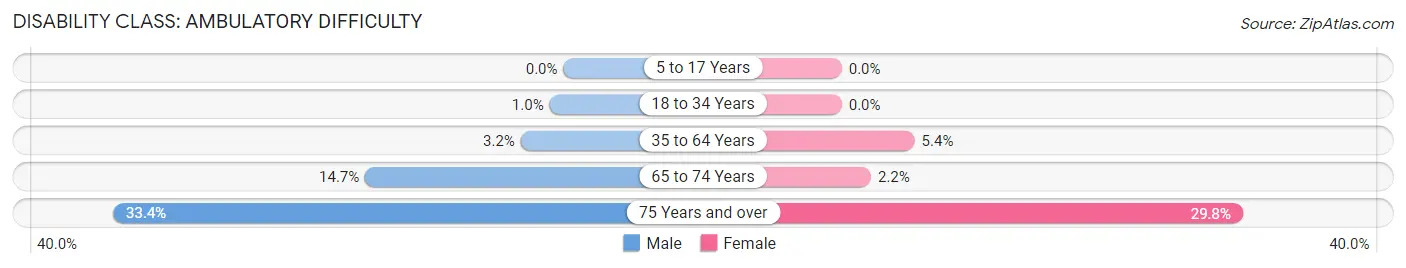
| Age Bracket | Male | Female |
| 5 to 17 Years | 0 (0.0%) | 0 (0.0%) |
| 18 to 34 Years | 31 (1.0%) | 0 (0.0%) |
| 35 to 64 Years | 157 (3.2%) | 302 (5.4%) |
| 65 to 74 Years | 142 (14.7%) | 22 (2.2%) |
| 75 Years and over | 100 (33.4%) | 117 (29.8%) |
Disability Class: Self-Care Difficulty
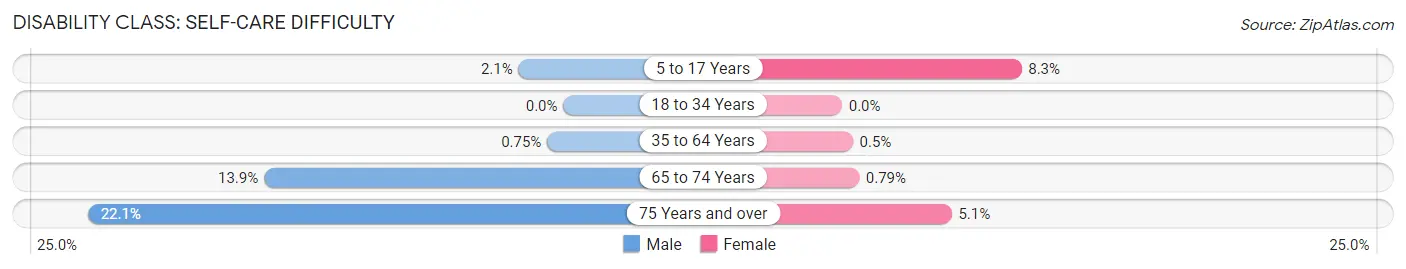
| Age Bracket | Male | Female |
| 5 to 17 Years | 41 (2.1%) | 236 (8.3%) |
| 18 to 34 Years | 0 (0.0%) | 0 (0.0%) |
| 35 to 64 Years | 37 (0.7%) | 28 (0.5%) |
| 65 to 74 Years | 134 (13.9%) | 8 (0.8%) |
| 75 Years and over | 66 (22.1%) | 20 (5.1%) |
Technology Access in Fairland
Computing Device Access in Fairland
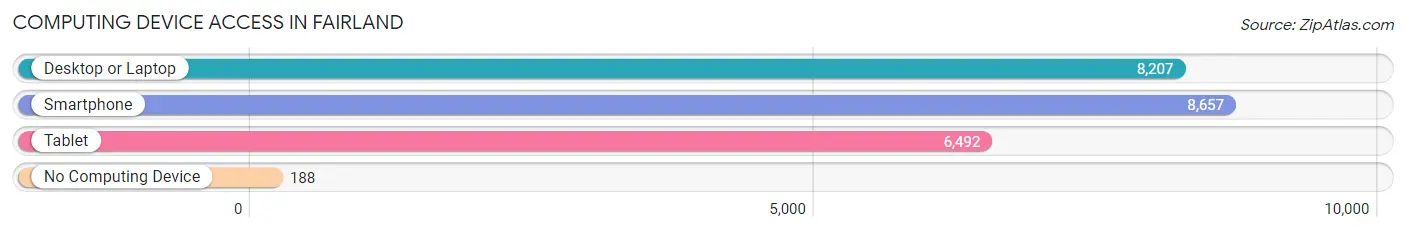
| Device Type | # Households | % Households |
| Desktop or Laptop | 8,207 | 88.7% |
| Smartphone | 8,657 | 93.5% |
| Tablet | 6,492 | 70.2% |
| No Computing Device | 188 | 2.0% |
| Total | 9,254 | 100.0% |
Internet Access in Fairland
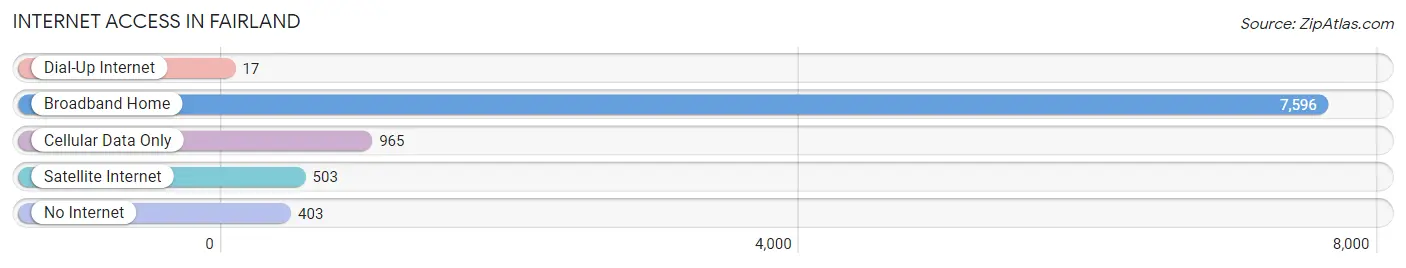
| Internet Type | # Households | % Households |
| Dial-Up Internet | 17 | 0.2% |
| Broadband Home | 7,596 | 82.1% |
| Cellular Data Only | 965 | 10.4% |
| Satellite Internet | 503 | 5.4% |
| No Internet | 403 | 4.3% |
| Total | 9,254 | 100.0% |
Fairland Summary
History
Fairland, Maryland is a small unincorporated community located in Montgomery County, Maryland. It is situated between the towns of Silver Spring and Burtonsville, and is part of the Washington Metropolitan Area. The area was first settled in the late 1700s by German and English immigrants, and was originally known as “Fairland Crossroads”. The name was changed to Fairland in 1887, when the post office was established.
The area was primarily agricultural until the 1950s, when the population began to grow rapidly due to the expansion of the Washington Metropolitan Area. The area was annexed by Montgomery County in 1954, and the population continued to grow. By the 2000 census, the population of Fairland was 8,845.
Geography
Fairland is located in Montgomery County, Maryland, approximately 20 miles north of Washington, D.C. It is situated between the towns of Silver Spring and Burtonsville, and is part of the Washington Metropolitan Area. The area is primarily residential, with some commercial and industrial development.
The terrain of Fairland is mostly flat, with some rolling hills. The area is drained by the Little Paint Branch and the Paint Branch, which are both tributaries of the Anacostia River. The climate is humid subtropical, with hot, humid summers and mild winters.
Economy
Fairland’s economy is primarily based on the service industry, with many residents employed in retail, hospitality, and healthcare. The area is also home to several small businesses, including restaurants, auto repair shops, and other local businesses.
The area is also home to several large employers, including the National Institutes of Health, the National Institute of Standards and Technology, and the National Oceanic and Atmospheric Administration.
Demographics
As of the 2000 census, the population of Fairland was 8,845. The racial makeup of the area was 57.3% White, 28.2% African American, 0.3% Native American, 8.2% Asian, 0.1% Pacific Islander, 2.3% from other races, and 3.6% from two or more races. Hispanic or Latino of any race were 5.3% of the population.
The median income for a household in Fairland was $63,945, and the median income for a family was $71,945. The per capita income for the area was $27,945. About 4.3% of families and 6.2% of the population were below the poverty line, including 8.2% of those under age 18 and 4.3% of those age 65 or over.
Common Questions
What is Per Capita Income in Fairland?
Per Capita income in Fairland is $40,704.
What is the Median Family Income in Fairland?
Median Family Income in Fairland is $97,949.
What is the Median Household income in Fairland?
Median Household Income in Fairland is $91,265.
What is Income or Wage Gap in Fairland?
Income or Wage Gap in Fairland is 5.8%.
Women in Fairland earn 94.2 cents for every dollar earned by a man.
What is Family Income Deficit in Fairland?
Family Income Deficit in Fairland is $13,504.
Families that are below poverty line in Fairland earn $13,504 less on average than the poverty threshold level.
What is Inequality or Gini Index in Fairland?
Inequality or Gini Index in Fairland is 0.42.
What is the Total Population of Fairland?
Total Population of Fairland is 25,987.
What is the Total Male Population of Fairland?
Total Male Population of Fairland is 12,318.
What is the Total Female Population of Fairland?
Total Female Population of Fairland is 13,669.
What is the Ratio of Males per 100 Females in Fairland?
There are 90.12 Males per 100 Females in Fairland.
What is the Ratio of Females per 100 Males in Fairland?
There are 110.97 Females per 100 Males in Fairland.
What is the Median Population Age in Fairland?
Median Population Age in Fairland is 36.7 Years.
What is the Average Family Size in Fairland
Average Family Size in Fairland is 3.3 People.
What is the Average Household Size in Fairland
Average Household Size in Fairland is 2.8 People.
How Large is the Labor Force in Fairland?
There are 14,915 People in the Labor Forcein in Fairland.
What is the Percentage of People in the Labor Force in Fairland?
74.7% of People are in the Labor Force in Fairland.
What is the Unemployment Rate in Fairland?
Unemployment Rate in Fairland is 7.2%.