Calverton, MD Map & Demographics
Calverton Map
Calverton Overview
$42,167
PER CAPITA INCOME
$117,234
AVG FAMILY INCOME
$103,781
AVG HOUSEHOLD INCOME
0.1%
WAGE / INCOME GAP [ % ]
99.9¢/ $1
WAGE / INCOME GAP [ $ ]
0.38
INEQUALITY / GINI INDEX
18,324
TOTAL POPULATION
8,514
MALE POPULATION
9,810
FEMALE POPULATION
86.79
MALES / 100 FEMALES
115.22
FEMALES / 100 MALES
42.2
MEDIAN AGE
3.5
AVG FAMILY SIZE
2.9
AVG HOUSEHOLD SIZE
9,232
LABOR FORCE [ PEOPLE ]
63.4%
PERCENT IN LABOR FORCE
6.1%
UNEMPLOYMENT RATE
Income in Calverton
Income Overview in Calverton
Per Capita Income in Calverton is $42,167, while median incomes of families and households are $117,234 and $103,781 respectively.
| Characteristic | Number | Measure |
| Per Capita Income | 18,324 | $42,167 |
| Median Family Income | 4,263 | $117,234 |
| Mean Family Income | 4,263 | $135,016 |
| Median Household Income | 6,139 | $103,781 |
| Mean Household Income | 6,139 | $122,459 |
| Income Deficit | 4,263 | $0 |
| Wage / Income Gap (%) | 18,324 | 0.11% |
| Wage / Income Gap ($) | 18,324 | 99.89¢ per $1 |
| Gini / Inequality Index | 18,324 | 0.38 |
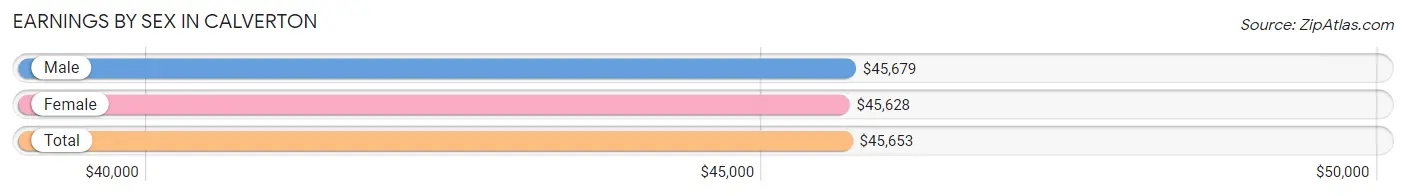
Earnings by Sex in Calverton
Average Earnings in Calverton are $45,653, $45,679 for men and $45,628 for women, a difference of 0.1%.
| Sex | Number | Average Earnings |
| Male | 5,160 (55.3%) | $45,679 |
| Female | 4,166 (44.7%) | $45,628 |
| Total | 9,326 (100.0%) | $45,653 |
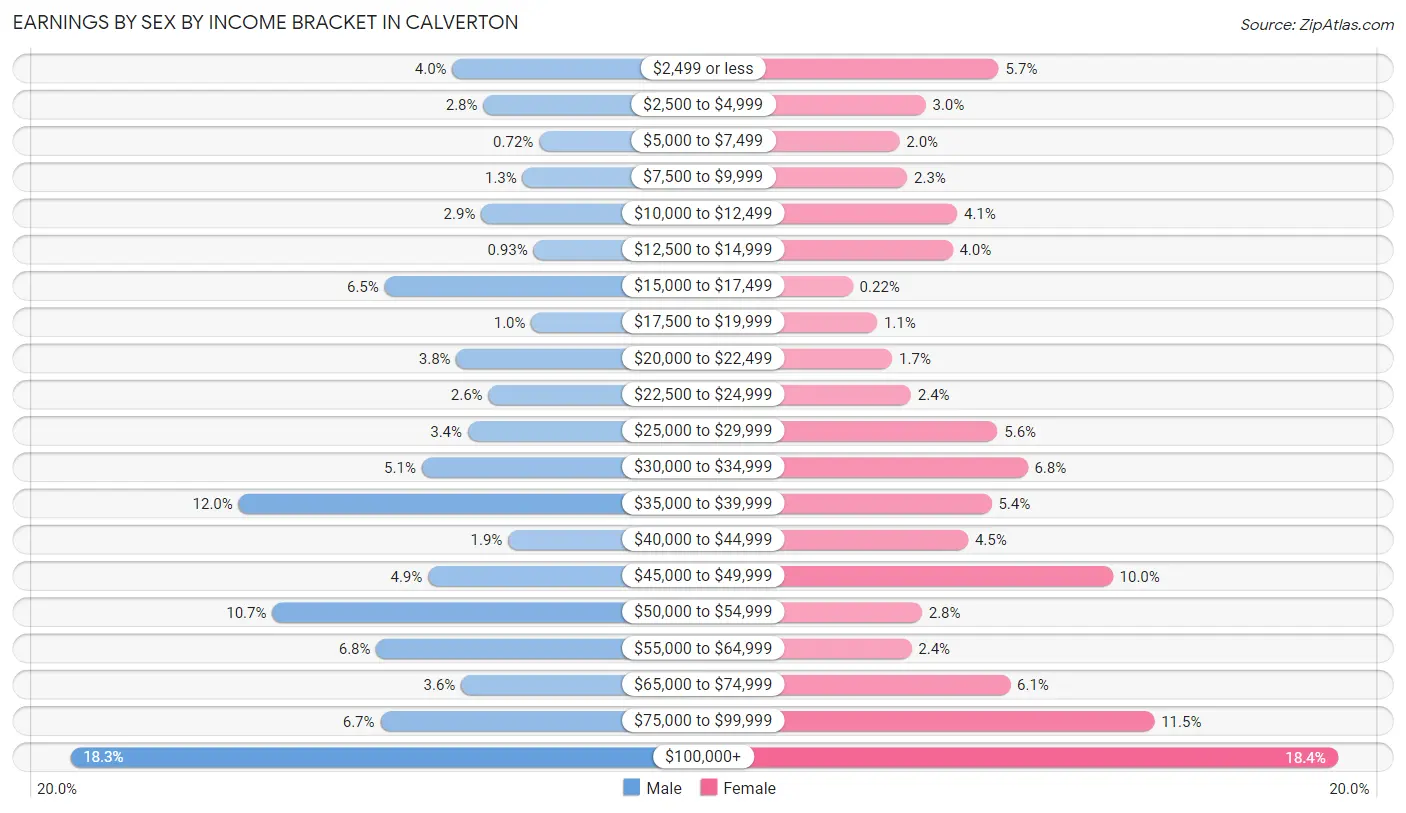
Earnings by Sex by Income Bracket in Calverton
The most common earnings brackets in Calverton are $100,000+ for men (944 | 18.3%) and $100,000+ for women (766 | 18.4%).
| Income | Male | Female |
| $2,499 or less | 205 (4.0%) | 237 (5.7%) |
| $2,500 to $4,999 | 145 (2.8%) | 123 (2.9%) |
| $5,000 to $7,499 | 37 (0.7%) | 82 (2.0%) |
| $7,500 to $9,999 | 69 (1.3%) | 94 (2.3%) |
| $10,000 to $12,499 | 149 (2.9%) | 172 (4.1%) |
| $12,500 to $14,999 | 48 (0.9%) | 165 (4.0%) |
| $15,000 to $17,499 | 336 (6.5%) | 9 (0.2%) |
| $17,500 to $19,999 | 52 (1.0%) | 47 (1.1%) |
| $20,000 to $22,499 | 197 (3.8%) | 71 (1.7%) |
| $22,500 to $24,999 | 135 (2.6%) | 100 (2.4%) |
| $25,000 to $29,999 | 175 (3.4%) | 235 (5.6%) |
| $30,000 to $34,999 | 264 (5.1%) | 282 (6.8%) |
| $35,000 to $39,999 | 618 (12.0%) | 226 (5.4%) |
| $40,000 to $44,999 | 97 (1.9%) | 189 (4.5%) |
| $45,000 to $49,999 | 252 (4.9%) | 415 (10.0%) |
| $50,000 to $54,999 | 553 (10.7%) | 117 (2.8%) |
| $55,000 to $64,999 | 352 (6.8%) | 101 (2.4%) |
| $65,000 to $74,999 | 188 (3.6%) | 255 (6.1%) |
| $75,000 to $99,999 | 344 (6.7%) | 480 (11.5%) |
| $100,000+ | 944 (18.3%) | 766 (18.4%) |
| Total | 5,160 (100.0%) | 4,166 (100.0%) |
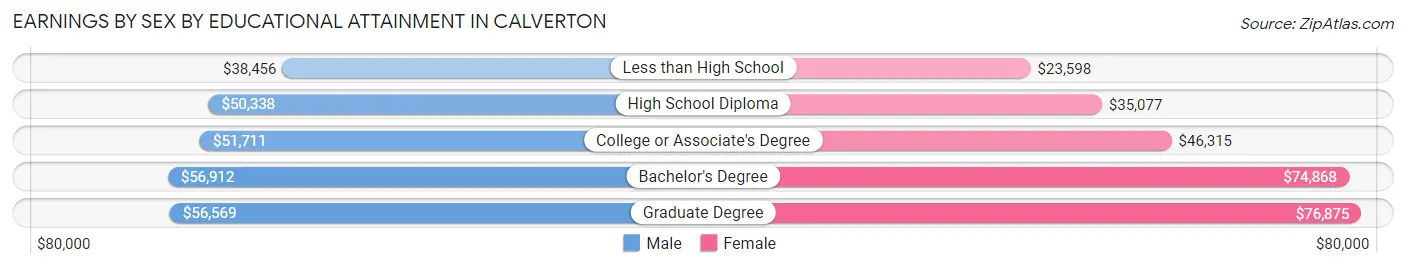
Earnings by Sex by Educational Attainment in Calverton
Average earnings in Calverton are $50,390 for men and $48,219 for women, a difference of 4.3%. Men with an educational attainment of bachelor's degree enjoy the highest average annual earnings of $56,912, while those with less than high school education earn the least with $38,456. Women with an educational attainment of graduate degree earn the most with the average annual earnings of $76,875, while those with less than high school education have the smallest earnings of $23,598.
| Educational Attainment | Male Income | Female Income |
| Less than High School | $38,456 | $23,598 |
| High School Diploma | $50,338 | $35,077 |
| College or Associate's Degree | $51,711 | $46,315 |
| Bachelor's Degree | $56,912 | $74,868 |
| Graduate Degree | $56,569 | $76,875 |
| Total | $50,390 | $48,219 |
Family Income in Calverton
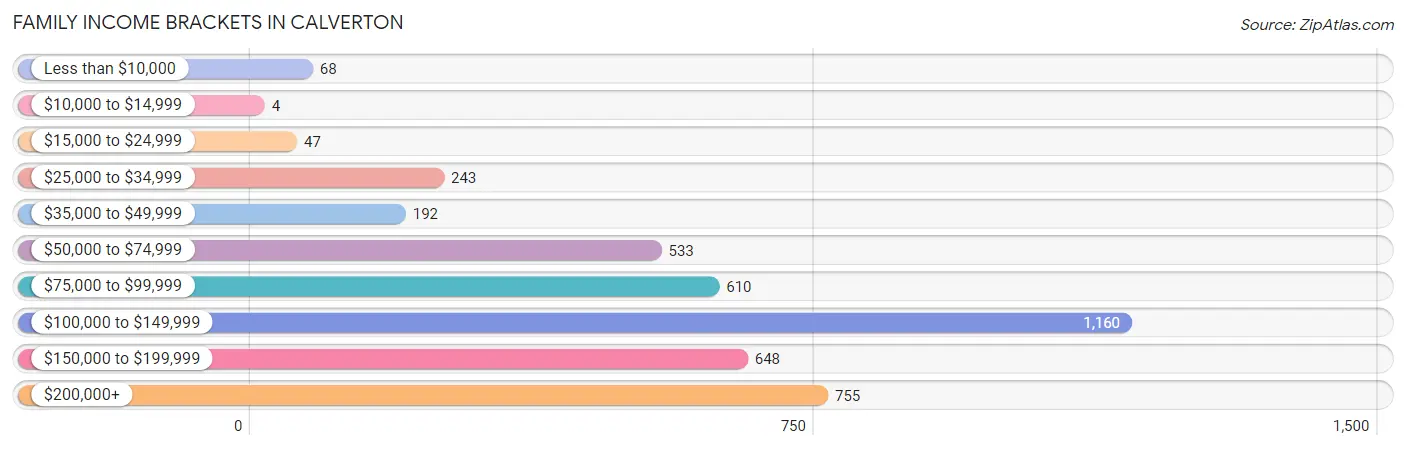
Family Income Brackets in Calverton
According to the Calverton family income data, there are 1,160 families falling into the $100,000 to $149,999 income range, which is the most common income bracket and makes up 27.2% of all families. Conversely, the $10,000 to $14,999 income bracket is the least frequent group with only 4 families (0.1%) belonging to this category.
| Income Bracket | # Families | % Families |
| Less than $10,000 | 68 | 1.6% |
| $10,000 to $14,999 | 4 | 0.1% |
| $15,000 to $24,999 | 47 | 1.1% |
| $25,000 to $34,999 | 243 | 5.7% |
| $35,000 to $49,999 | 192 | 4.5% |
| $50,000 to $74,999 | 533 | 12.5% |
| $75,000 to $99,999 | 610 | 14.3% |
| $100,000 to $149,999 | 1,160 | 27.2% |
| $150,000 to $199,999 | 648 | 15.2% |
| $200,000+ | 755 | 17.7% |
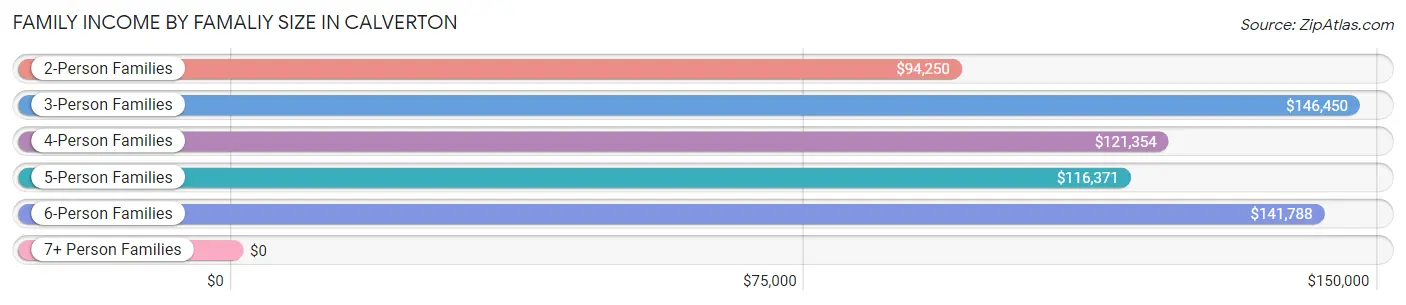
Family Income by Famaliy Size in Calverton
3-person families (687 | 16.1%) account for the highest median family income in Calverton with $146,450 per family, while 3-person families (687 | 16.1%) have the highest median income of $48,817 per family member.
| Income Bracket | # Families | Median Income |
| 2-Person Families | 1,841 (43.2%) | $94,250 |
| 3-Person Families | 687 (16.1%) | $146,450 |
| 4-Person Families | 614 (14.4%) | $121,354 |
| 5-Person Families | 513 (12.0%) | $116,371 |
| 6-Person Families | 451 (10.6%) | $141,788 |
| 7+ Person Families | 157 (3.7%) | $0 |
| Total | 4,263 (100.0%) | $117,234 |
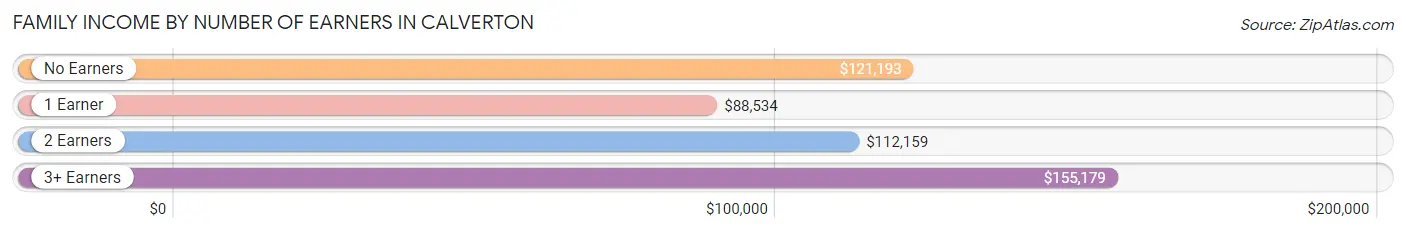
Family Income by Number of Earners in Calverton
The median family income in Calverton is $117,234, with families comprising 3+ earners (891) having the highest median family income of $155,179, while families with 1 earner (1,220) have the lowest median family income of $88,534, accounting for 20.9% and 28.6% of families, respectively.
| Number of Earners | # Families | Median Income |
| No Earners | 596 (14.0%) | $121,193 |
| 1 Earner | 1,220 (28.6%) | $88,534 |
| 2 Earners | 1,556 (36.5%) | $112,159 |
| 3+ Earners | 891 (20.9%) | $155,179 |
| Total | 4,263 (100.0%) | $117,234 |
Household Income in Calverton
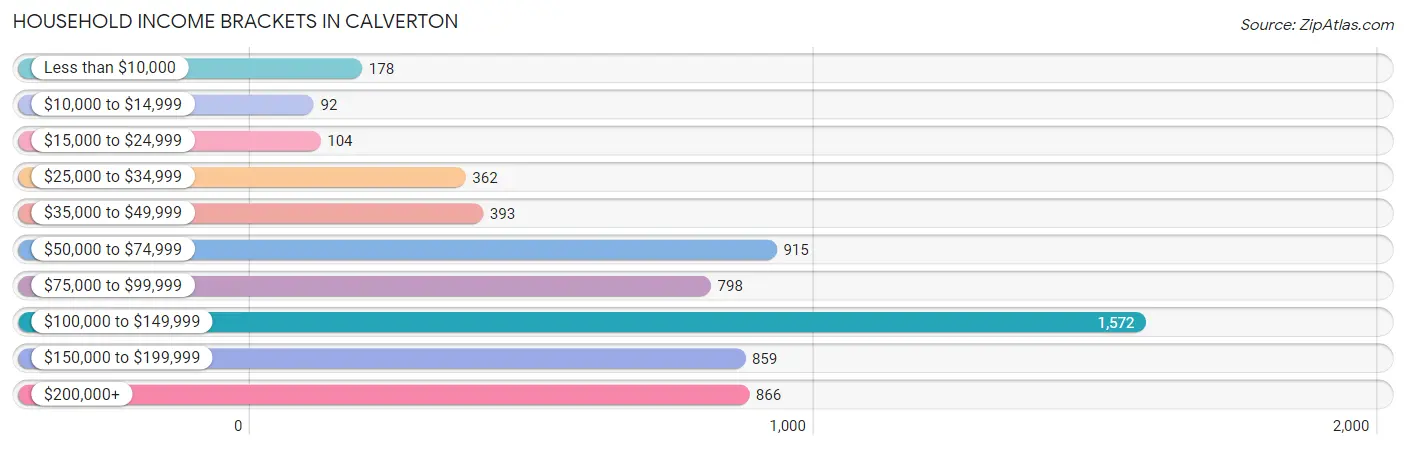
Household Income Brackets in Calverton
With 1,572 households falling in the category, the $100,000 to $149,999 income range is the most frequent in Calverton, accounting for 25.6% of all households. In contrast, only 92 households (1.5%) fall into the $10,000 to $14,999 income bracket, making it the least populous group.
| Income Bracket | # Households | % Households |
| Less than $10,000 | 178 | 2.9% |
| $10,000 to $14,999 | 92 | 1.5% |
| $15,000 to $24,999 | 104 | 1.7% |
| $25,000 to $34,999 | 362 | 5.9% |
| $35,000 to $49,999 | 393 | 6.4% |
| $50,000 to $74,999 | 915 | 14.9% |
| $75,000 to $99,999 | 798 | 13.0% |
| $100,000 to $149,999 | 1,572 | 25.6% |
| $150,000 to $199,999 | 859 | 14.0% |
| $200,000+ | 866 | 14.1% |
Household Income by Householder Age in Calverton
The median household income in Calverton is $103,781, with the highest median household income of $121,594 found in the 45 to 64 years age bracket for the primary householder. A total of 2,485 households (40.5%) fall into this category. Meanwhile, the 15 to 24 years age bracket for the primary householder has the lowest median household income of $44,583, with 25 households (0.4%) in this group.
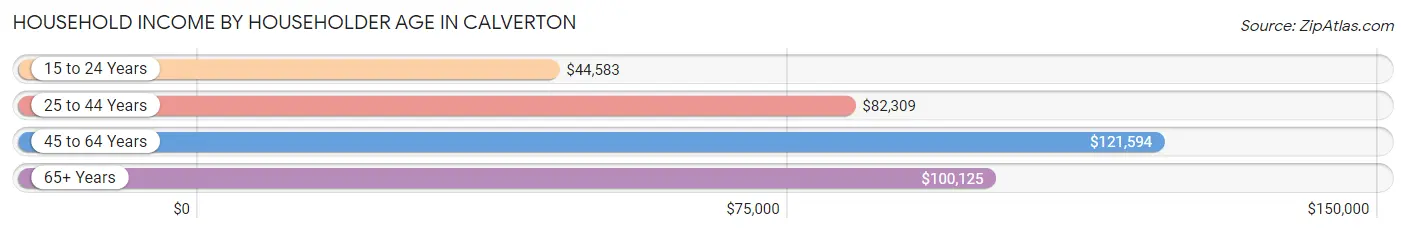
| Income Bracket | # Households | Median Income |
| 15 to 24 Years | 25 (0.4%) | $44,583 |
| 25 to 44 Years | 1,452 (23.6%) | $82,309 |
| 45 to 64 Years | 2,485 (40.5%) | $121,594 |
| 65+ Years | 2,177 (35.5%) | $100,125 |
| Total | 6,139 (100.0%) | $103,781 |
Poverty in Calverton
Income Below Poverty by Sex and Age in Calverton
With 9.1% poverty level for males and 12.0% for females among the residents of Calverton, 6 to 11 year old males and 15 year old females are the most vulnerable to poverty, with 163 males (24.7%) and 54 females (32.9%) in their respective age groups living below the poverty level.
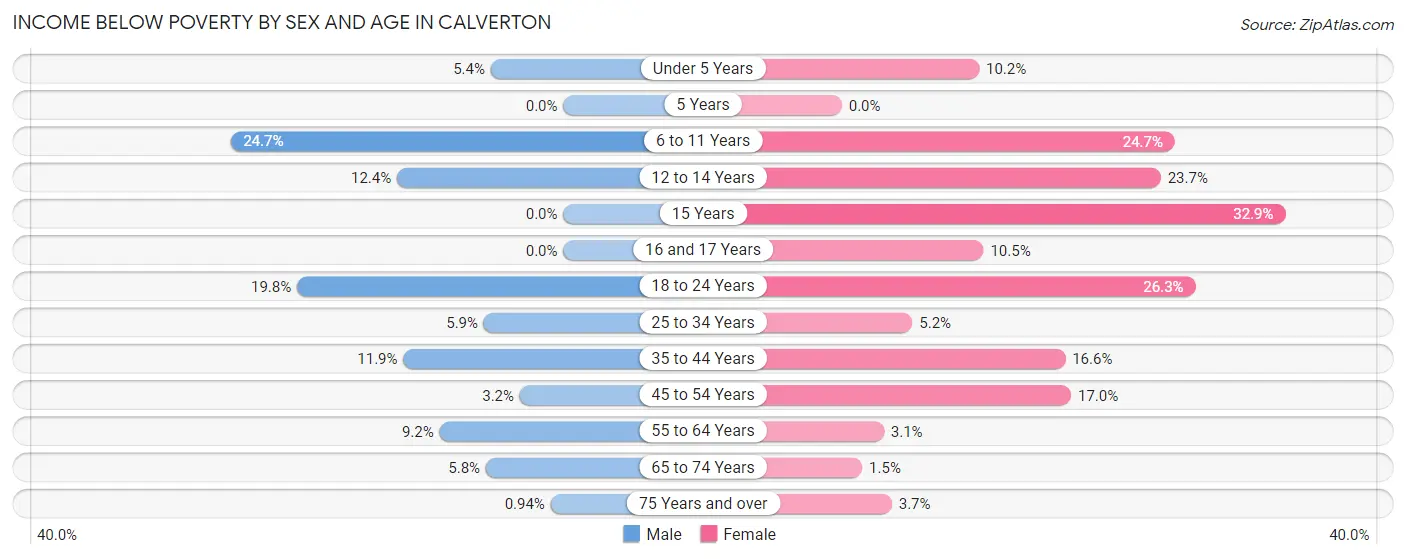
| Age Bracket | Male | Female |
| Under 5 Years | 22 (5.4%) | 59 (10.2%) |
| 5 Years | 0 (0.0%) | 0 (0.0%) |
| 6 to 11 Years | 163 (24.7%) | 134 (24.7%) |
| 12 to 14 Years | 41 (12.3%) | 166 (23.7%) |
| 15 Years | 0 (0.0%) | 54 (32.9%) |
| 16 and 17 Years | 0 (0.0%) | 49 (10.5%) |
| 18 to 24 Years | 138 (19.8%) | 179 (26.3%) |
| 25 to 34 Years | 71 (5.9%) | 40 (5.2%) |
| 35 to 44 Years | 134 (11.9%) | 208 (16.6%) |
| 45 to 54 Years | 36 (3.2%) | 169 (17.0%) |
| 55 to 64 Years | 106 (9.2%) | 36 (3.1%) |
| 65 to 74 Years | 41 (5.8%) | 14 (1.5%) |
| 75 Years and over | 8 (0.9%) | 46 (3.7%) |
| Total | 760 (9.1%) | 1,154 (12.0%) |
Income Above Poverty by Sex and Age in Calverton
According to the poverty statistics in Calverton, males aged 5 years and females aged 5 years are the age groups that are most secure financially, with 100.0% of males and 100.0% of females in these age groups living above the poverty line.
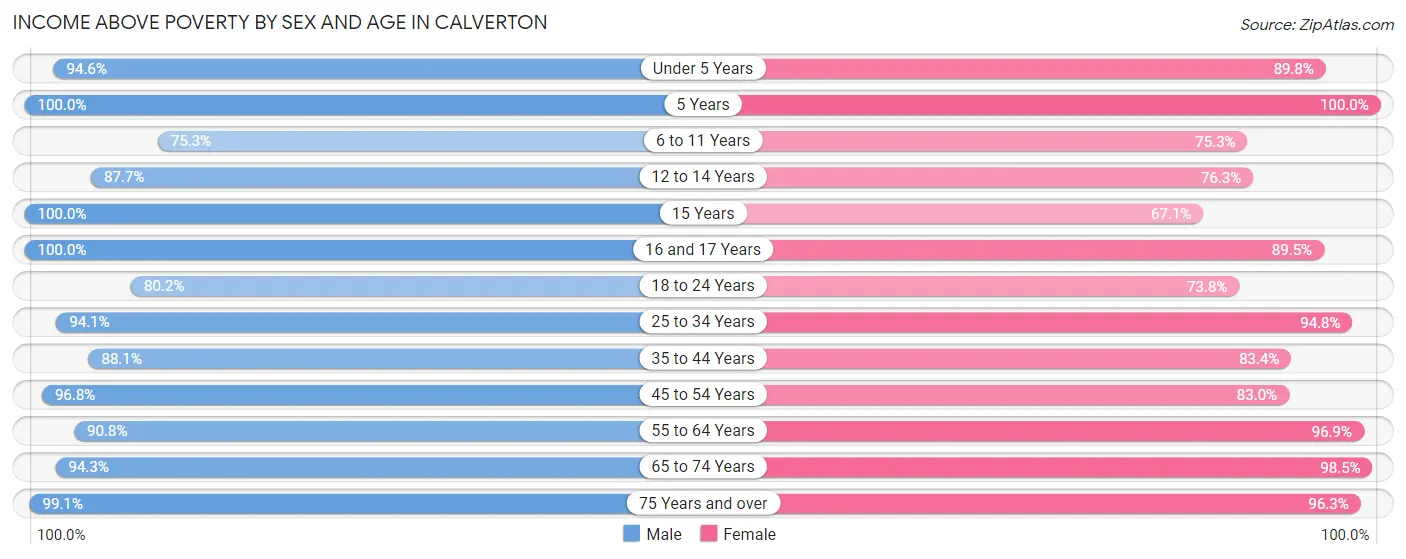
| Age Bracket | Male | Female |
| Under 5 Years | 386 (94.6%) | 520 (89.8%) |
| 5 Years | 21 (100.0%) | 157 (100.0%) |
| 6 to 11 Years | 496 (75.3%) | 408 (75.3%) |
| 12 to 14 Years | 291 (87.6%) | 535 (76.3%) |
| 15 Years | 60 (100.0%) | 110 (67.1%) |
| 16 and 17 Years | 41 (100.0%) | 417 (89.5%) |
| 18 to 24 Years | 560 (80.2%) | 503 (73.8%) |
| 25 to 34 Years | 1,132 (94.1%) | 724 (94.8%) |
| 35 to 44 Years | 994 (88.1%) | 1,046 (83.4%) |
| 45 to 54 Years | 1,078 (96.8%) | 824 (83.0%) |
| 55 to 64 Years | 1,048 (90.8%) | 1,117 (96.9%) |
| 65 to 74 Years | 672 (94.3%) | 915 (98.5%) |
| 75 Years and over | 844 (99.1%) | 1,194 (96.3%) |
| Total | 7,623 (90.9%) | 8,470 (88.0%) |
Income Below Poverty Among Married-Couple Families in Calverton
The poverty statistics for married-couple families in Calverton show that 5.8% or 170 of the total 2,928 families live below the poverty line. Families with 1 or 2 children have the highest poverty rate of 16.7%, comprising of 148 families. On the other hand, families with no children have the lowest poverty rate of 0.0%, which includes 0 families.
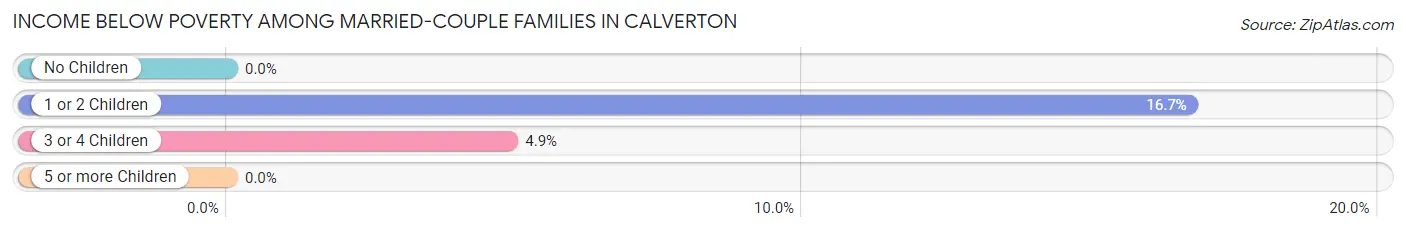
| Children | Above Poverty | Below Poverty |
| No Children | 1,561 (100.0%) | 0 (0.0%) |
| 1 or 2 Children | 737 (83.3%) | 148 (16.7%) |
| 3 or 4 Children | 429 (95.1%) | 22 (4.9%) |
| 5 or more Children | 31 (100.0%) | 0 (0.0%) |
| Total | 2,758 (94.2%) | 170 (5.8%) |
Income Below Poverty Among Single-Parent Households in Calverton
According to the poverty data in Calverton, 6.5% or 25 single-father households and 11.2% or 107 single-mother households are living below the poverty line. Among single-father households, those with 1 or 2 children have the highest poverty rate, with 25 households (59.5%) experiencing poverty. Likewise, among single-mother households, those with 3 or 4 children have the highest poverty rate, with 61 households (100.0%) falling below the poverty line.
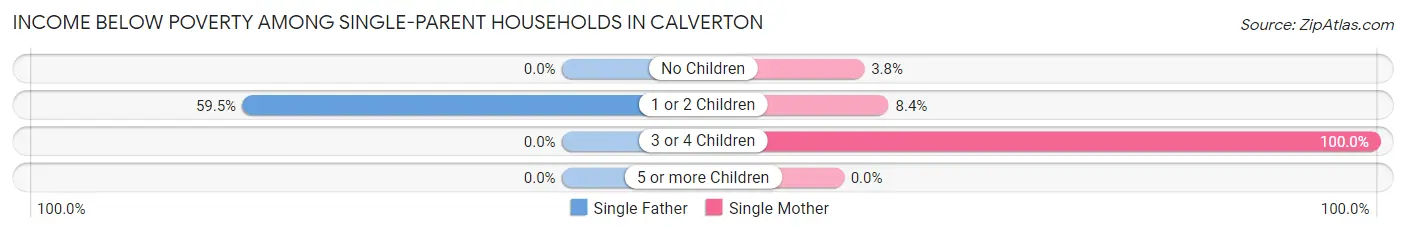
| Children | Single Father | Single Mother |
| No Children | 0 (0.0%) | 24 (3.8%) |
| 1 or 2 Children | 25 (59.5%) | 22 (8.4%) |
| 3 or 4 Children | 0 (0.0%) | 61 (100.0%) |
| 5 or more Children | 0 (0.0%) | 0 (0.0%) |
| Total | 25 (6.5%) | 107 (11.2%) |
Income Below Poverty Among Married-Couple vs Single-Parent Households in Calverton
The poverty data for Calverton shows that 170 of the married-couple family households (5.8%) and 132 of the single-parent households (9.9%) are living below the poverty level. Within the married-couple family households, those with 1 or 2 children have the highest poverty rate, with 148 households (16.7%) falling below the poverty line. Among the single-parent households, those with 3 or 4 children have the highest poverty rate, with 61 household (34.9%) living below poverty.
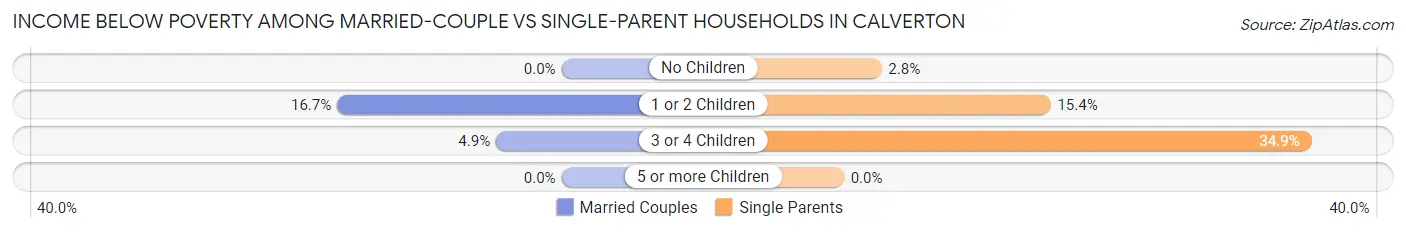
| Children | Married-Couple Families | Single-Parent Households |
| No Children | 0 (0.0%) | 24 (2.8%) |
| 1 or 2 Children | 148 (16.7%) | 47 (15.4%) |
| 3 or 4 Children | 22 (4.9%) | 61 (34.9%) |
| 5 or more Children | 0 (0.0%) | 0 (0.0%) |
| Total | 170 (5.8%) | 132 (9.9%) |
Race in Calverton
The most populous races in Calverton are Black / African American (7,480 | 40.8%), White / Caucasian (4,453 | 24.3%), and Hispanic or Latino (4,452 | 24.3%).
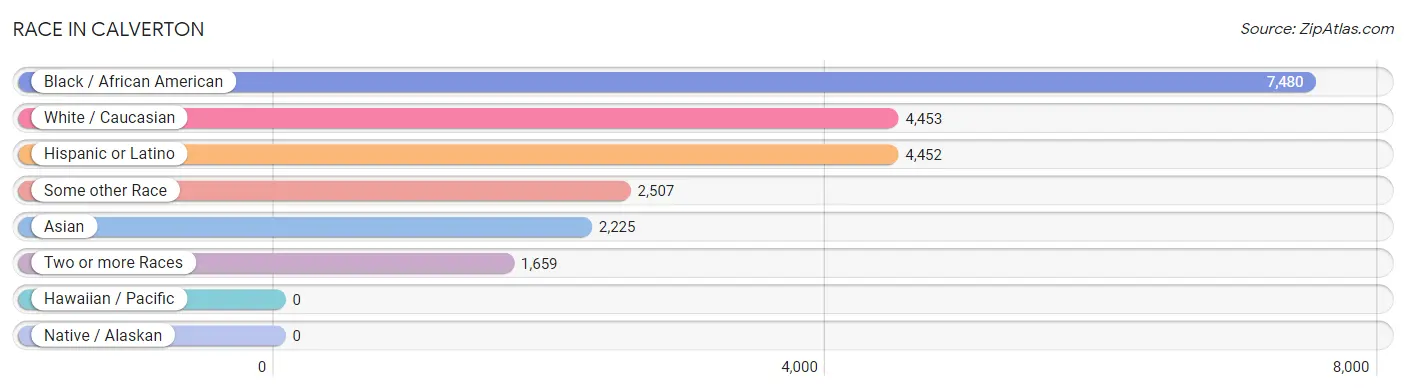
| Race | # Population | % Population |
| Asian | 2,225 | 12.1% |
| Black / African American | 7,480 | 40.8% |
| Hawaiian / Pacific | 0 | 0.0% |
| Hispanic or Latino | 4,452 | 24.3% |
| Native / Alaskan | 0 | 0.0% |
| White / Caucasian | 4,453 | 24.3% |
| Two or more Races | 1,659 | 9.0% |
| Some other Race | 2,507 | 13.7% |
| Total | 18,324 | 100.0% |
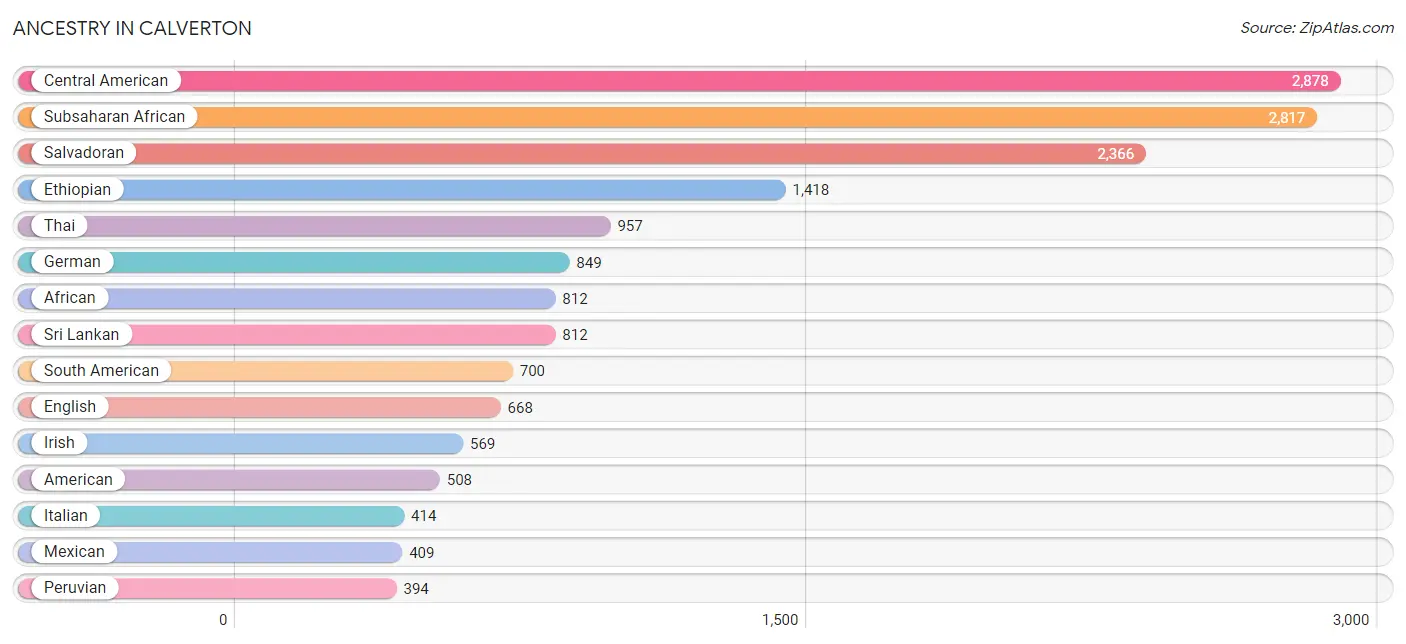
Ancestry in Calverton
The most populous ancestries reported in Calverton are Central American (2,878 | 15.7%), Subsaharan African (2,817 | 15.4%), Salvadoran (2,366 | 12.9%), Ethiopian (1,418 | 7.7%), and Thai (957 | 5.2%), together accounting for 57.0% of all Calverton residents.
| Ancestry | # Population | % Population |
| African | 812 | 4.4% |
| American | 508 | 2.8% |
| Arab | 30 | 0.2% |
| Austrian | 27 | 0.2% |
| Bhutanese | 11 | 0.1% |
| Bolivian | 13 | 0.1% |
| Brazilian | 134 | 0.7% |
| British | 46 | 0.3% |
| British West Indian | 18 | 0.1% |
| Burmese | 48 | 0.3% |
| Central American | 2,878 | 15.7% |
| Central American Indian | 33 | 0.2% |
| Chilean | 36 | 0.2% |
| Colombian | 120 | 0.6% |
| Costa Rican | 12 | 0.1% |
| Cuban | 22 | 0.1% |
| Czechoslovakian | 8 | 0.0% |
| Danish | 18 | 0.1% |
| Dominican | 175 | 1.0% |
| Dutch | 104 | 0.6% |
| Eastern European | 19 | 0.1% |
| Ecuadorian | 33 | 0.2% |
| English | 668 | 3.6% |
| Ethiopian | 1,418 | 7.7% |
| European | 88 | 0.5% |
| Filipino | 9 | 0.1% |
| French | 19 | 0.1% |
| French Canadian | 50 | 0.3% |
| German | 849 | 4.6% |
| Ghanaian | 215 | 1.2% |
| Greek | 45 | 0.3% |
| Guatemalan | 54 | 0.3% |
| Guyanese | 29 | 0.2% |
| Haitian | 82 | 0.4% |
| Honduran | 386 | 2.1% |
| Hungarian | 22 | 0.1% |
| Indian (Asian) | 222 | 1.2% |
| Indonesian | 15 | 0.1% |
| Irish | 569 | 3.1% |
| Israeli | 17 | 0.1% |
| Italian | 414 | 2.3% |
| Jamaican | 132 | 0.7% |
| Japanese | 231 | 1.3% |
| Jordanian | 11 | 0.1% |
| Korean | 45 | 0.3% |
| Lebanese | 11 | 0.1% |
| Liberian | 5 | 0.0% |
| Lithuanian | 6 | 0.0% |
| Malaysian | 3 | 0.0% |
| Mexican | 409 | 2.2% |
| Mexican American Indian | 15 | 0.1% |
| Native Hawaiian | 34 | 0.2% |
| Nigerian | 70 | 0.4% |
| Norwegian | 5 | 0.0% |
| Panamanian | 60 | 0.3% |
| Pennsylvania German | 10 | 0.1% |
| Peruvian | 394 | 2.1% |
| Polish | 238 | 1.3% |
| Puerto Rican | 62 | 0.3% |
| Romanian | 49 | 0.3% |
| Russian | 86 | 0.5% |
| Salvadoran | 2,366 | 12.9% |
| Scandinavian | 47 | 0.3% |
| Scotch-Irish | 29 | 0.2% |
| Scottish | 83 | 0.4% |
| Sierra Leonean | 131 | 0.7% |
| Slavic | 11 | 0.1% |
| Slovak | 11 | 0.1% |
| South American | 700 | 3.8% |
| Spaniard | 5 | 0.0% |
| Spanish | 115 | 0.6% |
| Sri Lankan | 812 | 4.4% |
| Subsaharan African | 2,817 | 15.4% |
| Swedish | 172 | 0.9% |
| Swiss | 21 | 0.1% |
| Thai | 957 | 5.2% |
| Trinidadian and Tobagonian | 18 | 0.1% |
| Ugandan | 103 | 0.6% |
| Venezuelan | 38 | 0.2% |
| Vietnamese | 44 | 0.2% |
| Welsh | 17 | 0.1% |
| West Indian | 8 | 0.0% |
| Yugoslavian | 18 | 0.1% | View All 83 Rows |
Immigrants in Calverton
The most numerous immigrant groups reported in Calverton came from Latin America (3,173 | 17.3%), Africa (2,742 | 15.0%), Central America (2,035 | 11.1%), Eastern Africa (1,709 | 9.3%), and Asia (1,616 | 8.8%), together accounting for 61.5% of all Calverton residents.
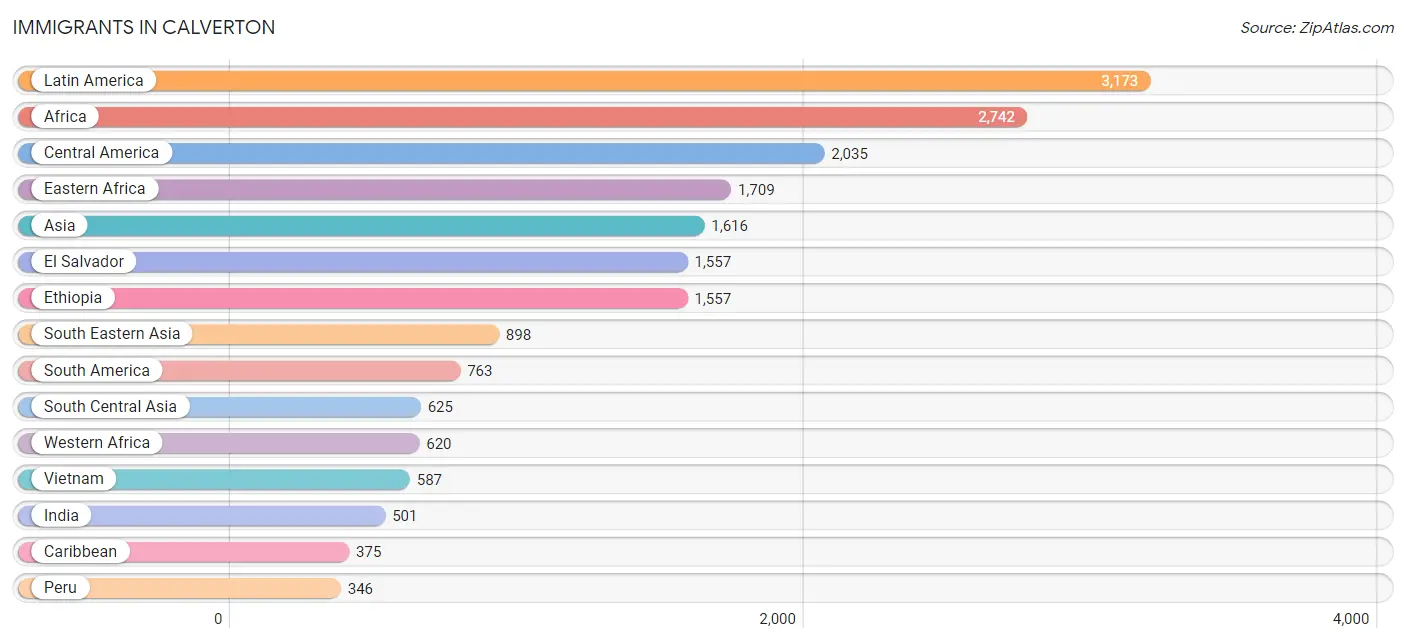
| Immigration Origin | # Population | % Population |
| Africa | 2,742 | 15.0% |
| Asia | 1,616 | 8.8% |
| Bangladesh | 19 | 0.1% |
| Bolivia | 20 | 0.1% |
| Brazil | 251 | 1.4% |
| Cambodia | 99 | 0.5% |
| Cameroon | 295 | 1.6% |
| Canada | 29 | 0.2% |
| Caribbean | 375 | 2.1% |
| Central America | 2,035 | 11.1% |
| China | 41 | 0.2% |
| Colombia | 92 | 0.5% |
| Costa Rica | 48 | 0.3% |
| Dominican Republic | 106 | 0.6% |
| Eastern Africa | 1,709 | 9.3% |
| Eastern Asia | 72 | 0.4% |
| Eastern Europe | 26 | 0.1% |
| Ecuador | 33 | 0.2% |
| El Salvador | 1,557 | 8.5% |
| England | 15 | 0.1% |
| Eritrea | 56 | 0.3% |
| Ethiopia | 1,557 | 8.5% |
| Europe | 93 | 0.5% |
| Germany | 30 | 0.2% |
| Ghana | 154 | 0.8% |
| Guatemala | 8 | 0.0% |
| Haiti | 48 | 0.3% |
| Honduras | 175 | 1.0% |
| India | 501 | 2.7% |
| Ireland | 10 | 0.1% |
| Jamaica | 195 | 1.1% |
| Japan | 17 | 0.1% |
| Jordan | 21 | 0.1% |
| Korea | 14 | 0.1% |
| Latin America | 3,173 | 17.3% |
| Liberia | 141 | 0.8% |
| Mexico | 187 | 1.0% |
| Middle Africa | 295 | 1.6% |
| Nigeria | 69 | 0.4% |
| Northern Europe | 37 | 0.2% |
| Pakistan | 97 | 0.5% |
| Panama | 60 | 0.3% |
| Peru | 346 | 1.9% |
| Philippines | 28 | 0.2% |
| Poland | 10 | 0.1% |
| Romania | 16 | 0.1% |
| Sierra Leone | 140 | 0.8% |
| South Africa | 118 | 0.6% |
| South America | 763 | 4.2% |
| South Central Asia | 625 | 3.4% |
| South Eastern Asia | 898 | 4.9% |
| Sri Lanka | 8 | 0.0% |
| Taiwan | 17 | 0.1% |
| Trinidad and Tobago | 10 | 0.1% |
| Uganda | 96 | 0.5% |
| Venezuela | 21 | 0.1% |
| Vietnam | 587 | 3.2% |
| Western Africa | 620 | 3.4% |
| Western Asia | 21 | 0.1% |
| Western Europe | 30 | 0.2% | View All 60 Rows |
Sex and Age in Calverton
Sex and Age in Calverton
The most populous age groups in Calverton are 35 to 39 Years (744 | 8.7%) for men and 15 to 19 Years (893 | 9.1%) for women.
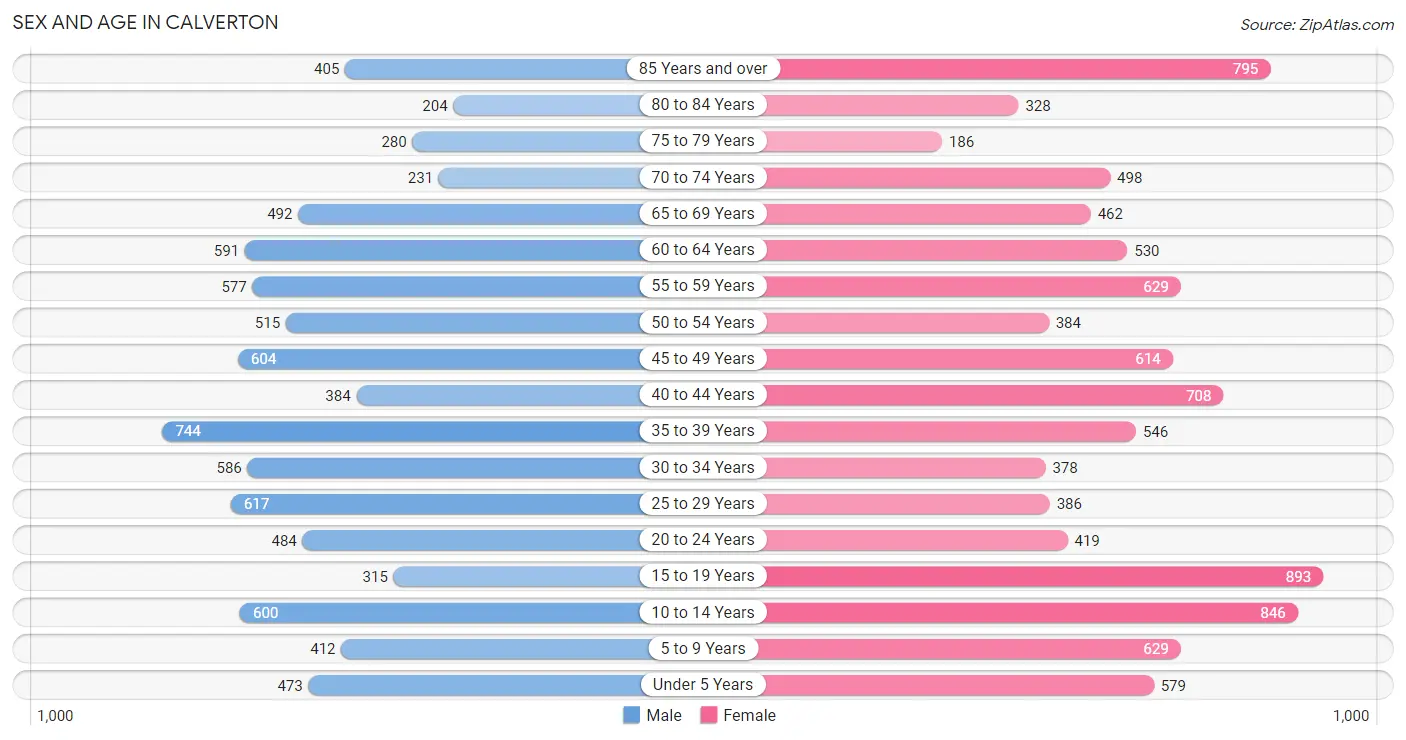
| Age Bracket | Male | Female |
| Under 5 Years | 473 (5.6%) | 579 (5.9%) |
| 5 to 9 Years | 412 (4.8%) | 629 (6.4%) |
| 10 to 14 Years | 600 (7.0%) | 846 (8.6%) |
| 15 to 19 Years | 315 (3.7%) | 893 (9.1%) |
| 20 to 24 Years | 484 (5.7%) | 419 (4.3%) |
| 25 to 29 Years | 617 (7.2%) | 386 (3.9%) |
| 30 to 34 Years | 586 (6.9%) | 378 (3.8%) |
| 35 to 39 Years | 744 (8.7%) | 546 (5.6%) |
| 40 to 44 Years | 384 (4.5%) | 708 (7.2%) |
| 45 to 49 Years | 604 (7.1%) | 614 (6.3%) |
| 50 to 54 Years | 515 (6.0%) | 384 (3.9%) |
| 55 to 59 Years | 577 (6.8%) | 629 (6.4%) |
| 60 to 64 Years | 591 (6.9%) | 530 (5.4%) |
| 65 to 69 Years | 492 (5.8%) | 462 (4.7%) |
| 70 to 74 Years | 231 (2.7%) | 498 (5.1%) |
| 75 to 79 Years | 280 (3.3%) | 186 (1.9%) |
| 80 to 84 Years | 204 (2.4%) | 328 (3.3%) |
| 85 Years and over | 405 (4.8%) | 795 (8.1%) |
| Total | 8,514 (100.0%) | 9,810 (100.0%) |
Families and Households in Calverton
Median Family Size in Calverton
The median family size in Calverton is 3.52 persons per family, with married-couple families (2,928 | 68.7%) accounting for the largest median family size of 3.75 persons per family. On the other hand, single female/mother families (953 | 22.4%) represent the smallest median family size with 3.01 persons per family.
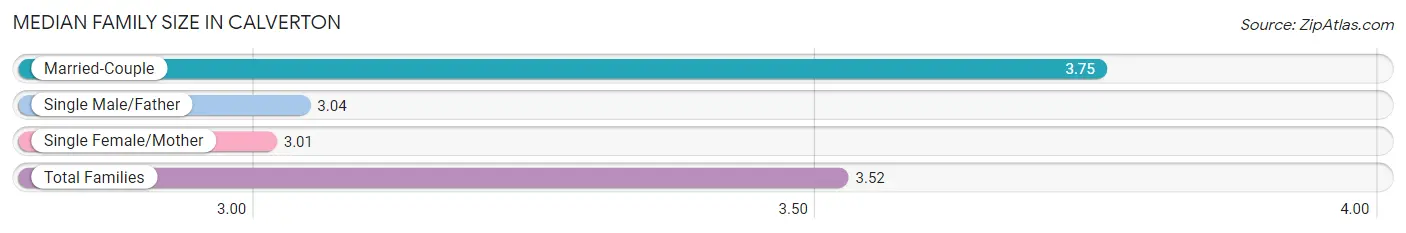
| Family Type | # Families | Family Size |
| Married-Couple | 2,928 (68.7%) | 3.75 |
| Single Male/Father | 382 (9.0%) | 3.04 |
| Single Female/Mother | 953 (22.4%) | 3.01 |
| Total Families | 4,263 (100.0%) | 3.52 |
Median Household Size in Calverton
The median household size in Calverton is 2.94 persons per household, with married-couple households (2,928 | 47.7%) accounting for the largest median household size of 3.89 persons per household. non-family households (1,876 | 30.6%) represent the smallest median household size with 1.21 persons per household.
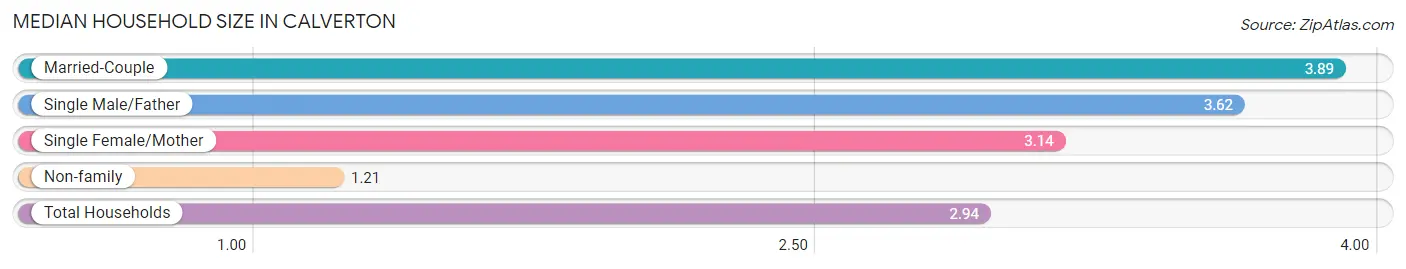
| Household Type | # Households | Household Size |
| Married-Couple | 2,928 (47.7%) | 3.89 |
| Single Male/Father | 382 (6.2%) | 3.62 |
| Single Female/Mother | 953 (15.5%) | 3.14 |
| Non-family | 1,876 (30.6%) | 1.21 |
| Total Households | 6,139 (100.0%) | 2.94 |
Household Size by Marriage Status in Calverton
Out of a total of 6,139 households in Calverton, 4,263 (69.4%) are family households, while 1,876 (30.6%) are nonfamily households. The most numerous type of family households are 2-person households, comprising 1,603, and the most common type of nonfamily households are 1-person households, comprising 1,634.
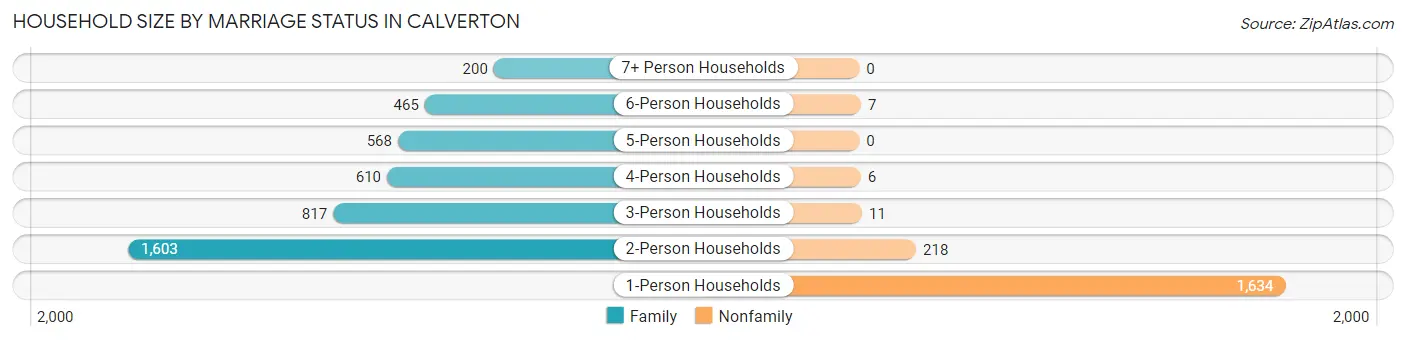
| Household Size | Family Households | Nonfamily Households |
| 1-Person Households | - | 1,634 (26.6%) |
| 2-Person Households | 1,603 (26.1%) | 218 (3.5%) |
| 3-Person Households | 817 (13.3%) | 11 (0.2%) |
| 4-Person Households | 610 (9.9%) | 6 (0.1%) |
| 5-Person Households | 568 (9.2%) | 0 (0.0%) |
| 6-Person Households | 465 (7.6%) | 7 (0.1%) |
| 7+ Person Households | 200 (3.3%) | 0 (0.0%) |
| Total | 4,263 (69.4%) | 1,876 (30.6%) |
Female Fertility in Calverton
Fertility by Age in Calverton
Average fertility rate in Calverton is 54.0 births per 1,000 women. Women in the age bracket of 35 to 50 years have the highest fertility rate with 73.0 births per 1,000 women. Women in the age bracket of 35 to 50 years acount for 65.1% of all women with births.
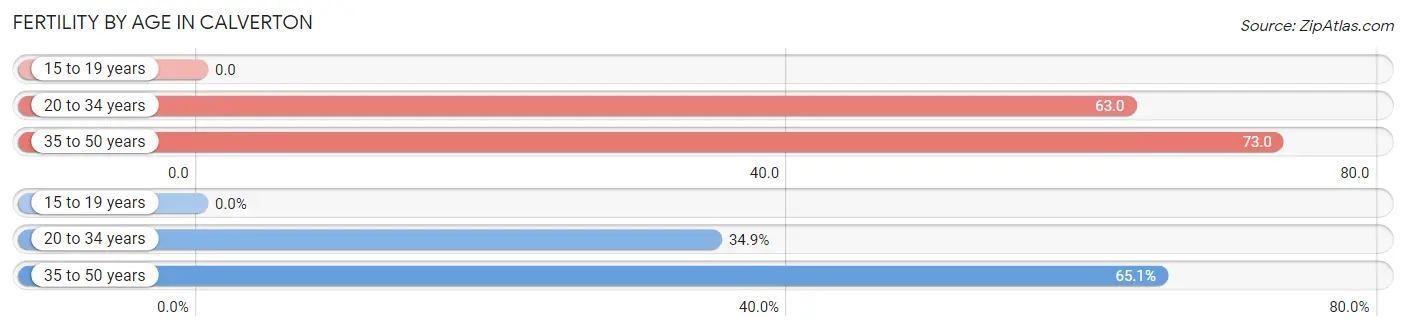
| Age Bracket | Women with Births | Births / 1,000 Women |
| 15 to 19 years | 0 (0.0%) | 0.0 |
| 20 to 34 years | 75 (34.9%) | 63.0 |
| 35 to 50 years | 140 (65.1%) | 73.0 |
| Total | 215 (100.0%) | 54.0 |
Fertility by Age by Marriage Status in Calverton
96.3% of women with births (215) in Calverton are married. The highest percentage of unmarried women with births falls into 20 to 34 years age bracket with 10.7% of them unmarried at the time of birth, while the lowest percentage of unmarried women with births belong to 35 to 50 years age bracket with 0.0% of them unmarried.
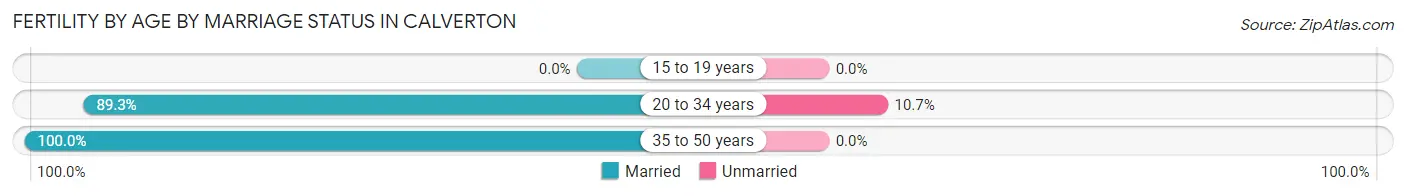
| Age Bracket | Married | Unmarried |
| 15 to 19 years | 0 (0.0%) | 0 (0.0%) |
| 20 to 34 years | 67 (89.3%) | 8 (10.7%) |
| 35 to 50 years | 140 (100.0%) | 0 (0.0%) |
| Total | 207 (96.3%) | 8 (3.7%) |
Fertility by Education in Calverton
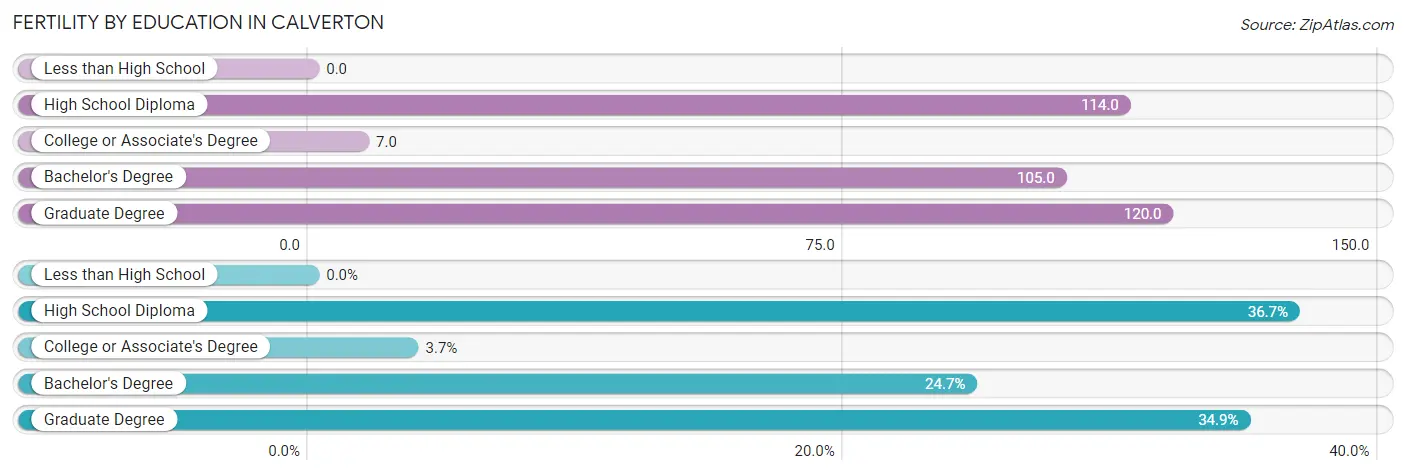
| Educational Attainment | Women with Births | Births / 1,000 Women |
| Less than High School | 0 (0.0%) | 0.0 |
| High School Diploma | 79 (36.7%) | 114.0 |
| College or Associate's Degree | 8 (3.7%) | 7.0 |
| Bachelor's Degree | 53 (24.6%) | 105.0 |
| Graduate Degree | 75 (34.9%) | 120.0 |
| Total | 215 (100.0%) | 54.0 |
Fertility by Education by Marriage Status in Calverton
3.7% of women with births in Calverton are unmarried. Women with the educational attainment of high school diploma are most likely to be married with 100.0% of them married at childbirth, while women with the educational attainment of college or associate's degree are least likely to be married with 100.0% of them unmarried at childbirth.
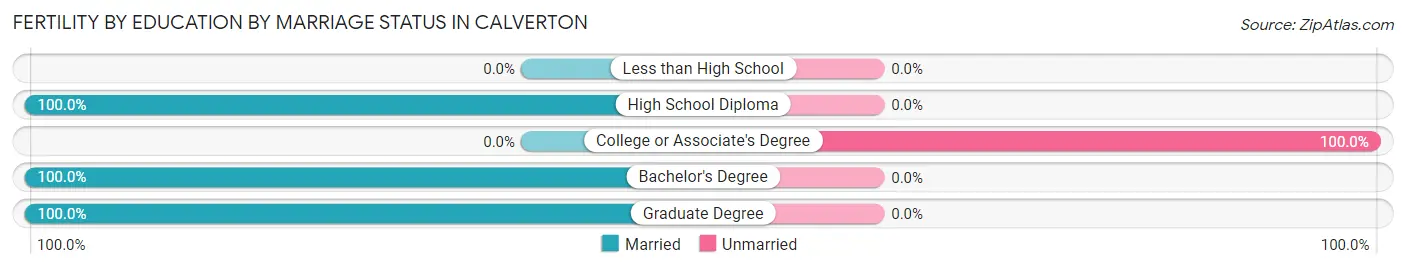
| Educational Attainment | Married | Unmarried |
| Less than High School | 0 (0.0%) | 0 (0.0%) |
| High School Diploma | 79 (100.0%) | 0 (0.0%) |
| College or Associate's Degree | 0 (0.0%) | 8 (100.0%) |
| Bachelor's Degree | 53 (100.0%) | 0 (0.0%) |
| Graduate Degree | 75 (100.0%) | 0 (0.0%) |
| Total | 207 (96.3%) | 8 (3.7%) |
Employment Characteristics in Calverton
Employment by Class of Employer in Calverton
Among the 8,343 employed individuals in Calverton, private company employees (4,864 | 58.3%), not-for-profit organizations (1,040 | 12.5%), and self-employed (not incorporated) (765 | 9.2%) make up the most common classes of employment.
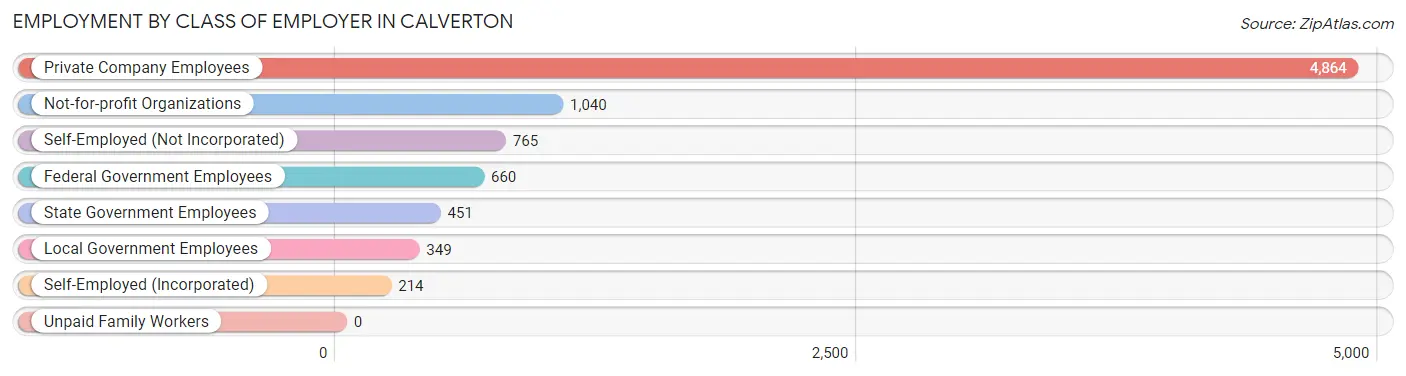
| Employer Class | # Employees | % Employees |
| Private Company Employees | 4,864 | 58.3% |
| Self-Employed (Incorporated) | 214 | 2.6% |
| Self-Employed (Not Incorporated) | 765 | 9.2% |
| Not-for-profit Organizations | 1,040 | 12.5% |
| Local Government Employees | 349 | 4.2% |
| State Government Employees | 451 | 5.4% |
| Federal Government Employees | 660 | 7.9% |
| Unpaid Family Workers | 0 | 0.0% |
| Total | 8,343 | 100.0% |
Employment Status by Age in Calverton
According to the labor force statistics for Calverton, out of the total population over 16 years of age (14,561), 63.4% or 9,232 individuals are in the labor force, with 6.1% or 563 of them unemployed. The age group with the highest labor force participation rate is 20 to 24 years, with 90.9% or 821 individuals in the labor force. Within the labor force, the 16 to 19 years age range has the highest percentage of unemployed individuals, with 51.0% or 151 of them being unemployed.
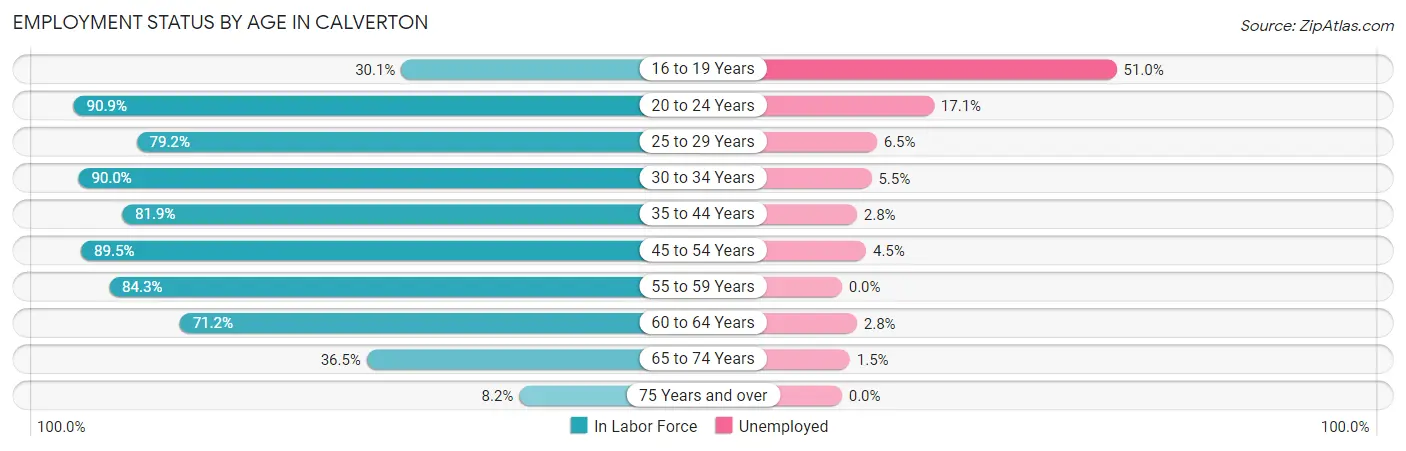
| Age Bracket | In Labor Force | Unemployed |
| 16 to 19 Years | 296 (30.1%) | 151 (51.0%) |
| 20 to 24 Years | 821 (90.9%) | 140 (17.1%) |
| 25 to 29 Years | 794 (79.2%) | 52 (6.5%) |
| 30 to 34 Years | 868 (90.0%) | 48 (5.5%) |
| 35 to 44 Years | 1,951 (81.9%) | 55 (2.8%) |
| 45 to 54 Years | 1,895 (89.5%) | 85 (4.5%) |
| 55 to 59 Years | 1,017 (84.3%) | 0 (0.0%) |
| 60 to 64 Years | 798 (71.2%) | 22 (2.8%) |
| 65 to 74 Years | 614 (36.5%) | 9 (1.5%) |
| 75 Years and over | 180 (8.2%) | 0 (0.0%) |
| Total | 9,232 (63.4%) | 563 (6.1%) |
Employment Status by Educational Attainment in Calverton
According to labor force statistics for Calverton, 83.3% of individuals (7,325) out of the total population between 25 and 64 years of age (8,793) are in the labor force, with 3.6% or 264 of them being unemployed. The group with the highest labor force participation rate are those with the educational attainment of bachelor's degree or higher, with 90.3% or 3,159 individuals in the labor force. Within the labor force, individuals with less than high school education have the highest percentage of unemployment, with 6.3% or 58 of them being unemployed.
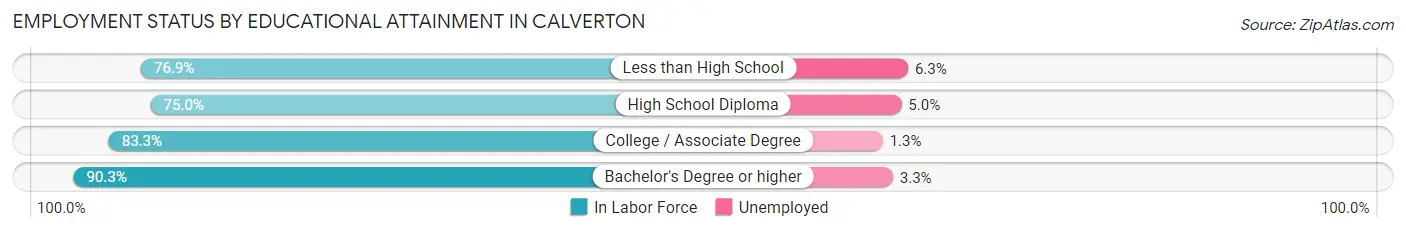
| Educational Attainment | In Labor Force | Unemployed |
| Less than High School | 917 (76.9%) | 75 (6.3%) |
| High School Diploma | 1,544 (75.0%) | 103 (5.0%) |
| College / Associate Degree | 1,703 (83.3%) | 27 (1.3%) |
| Bachelor's Degree or higher | 3,159 (90.3%) | 115 (3.3%) |
| Total | 7,325 (83.3%) | 317 (3.6%) |
Employment Occupations by Sex in Calverton
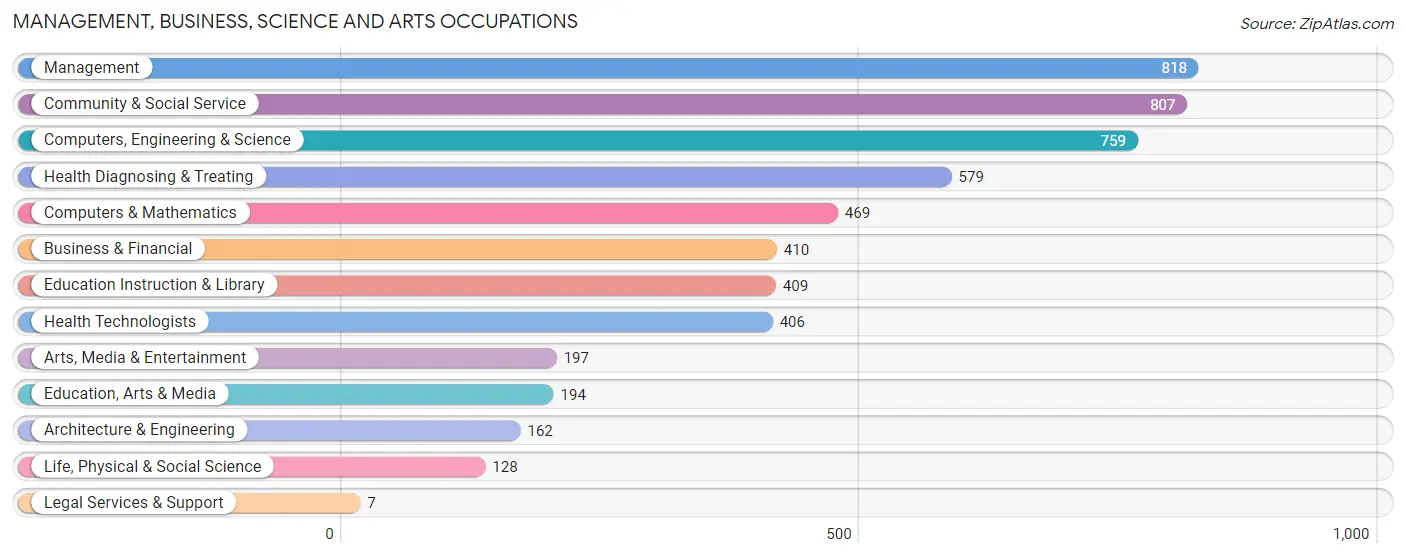
Management, Business, Science and Arts Occupations
The most common Management, Business, Science and Arts occupations in Calverton are Management (818 | 9.5%), Community & Social Service (807 | 9.3%), Computers, Engineering & Science (759 | 8.8%), Health Diagnosing & Treating (579 | 6.7%), and Computers & Mathematics (469 | 5.4%).
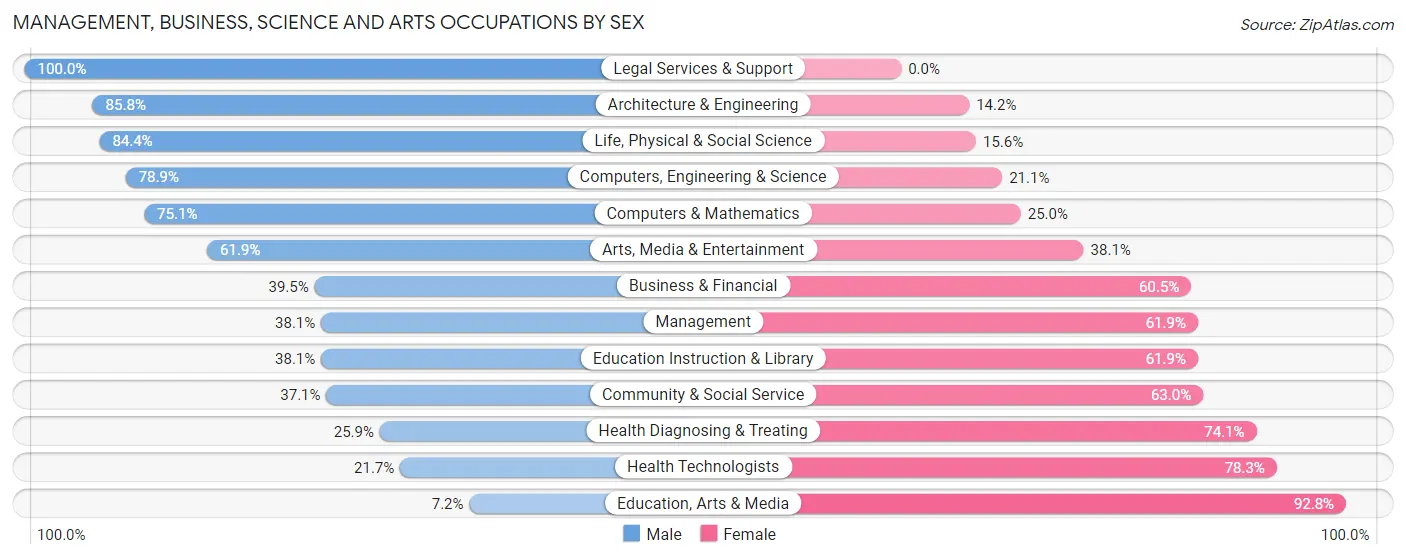
Management, Business, Science and Arts Occupations by Sex
Within the Management, Business, Science and Arts occupations in Calverton, the most male-oriented occupations are Legal Services & Support (100.0%), Architecture & Engineering (85.8%), and Life, Physical & Social Science (84.4%), while the most female-oriented occupations are Education, Arts & Media (92.8%), Health Technologists (78.3%), and Health Diagnosing & Treating (74.1%).
| Occupation | Male | Female |
| Management | 312 (38.1%) | 506 (61.9%) |
| Business & Financial | 162 (39.5%) | 248 (60.5%) |
| Computers, Engineering & Science | 599 (78.9%) | 160 (21.1%) |
| Computers & Mathematics | 352 (75.0%) | 117 (24.9%) |
| Architecture & Engineering | 139 (85.8%) | 23 (14.2%) |
| Life, Physical & Social Science | 108 (84.4%) | 20 (15.6%) |
| Community & Social Service | 299 (37.0%) | 508 (62.9%) |
| Education, Arts & Media | 14 (7.2%) | 180 (92.8%) |
| Legal Services & Support | 7 (100.0%) | 0 (0.0%) |
| Education Instruction & Library | 156 (38.1%) | 253 (61.9%) |
| Arts, Media & Entertainment | 122 (61.9%) | 75 (38.1%) |
| Health Diagnosing & Treating | 150 (25.9%) | 429 (74.1%) |
| Health Technologists | 88 (21.7%) | 318 (78.3%) |
| Total (Category) | 1,522 (45.1%) | 1,851 (54.9%) |
| Total (Overall) | 4,854 (56.1%) | 3,805 (43.9%) |
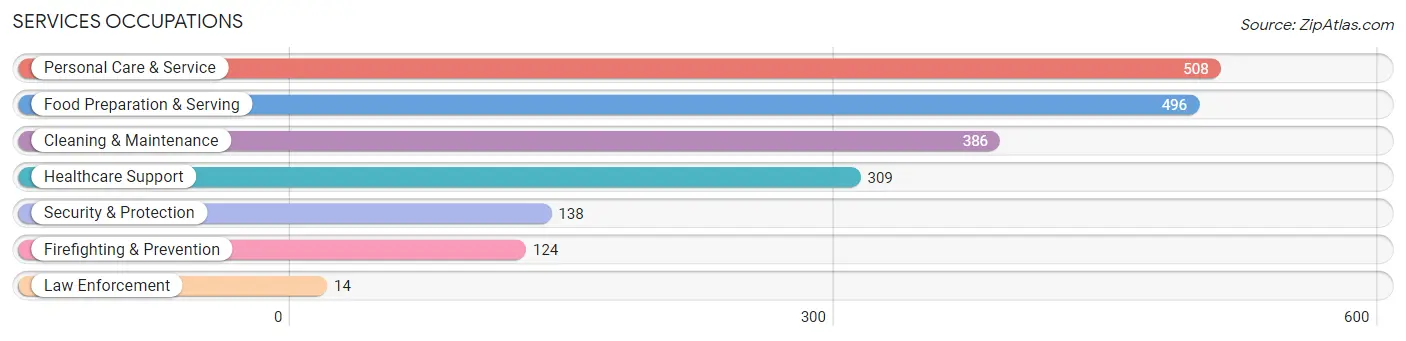
Services Occupations
The most common Services occupations in Calverton are Personal Care & Service (508 | 5.9%), Food Preparation & Serving (496 | 5.7%), Cleaning & Maintenance (386 | 4.5%), Healthcare Support (309 | 3.6%), and Security & Protection (138 | 1.6%).
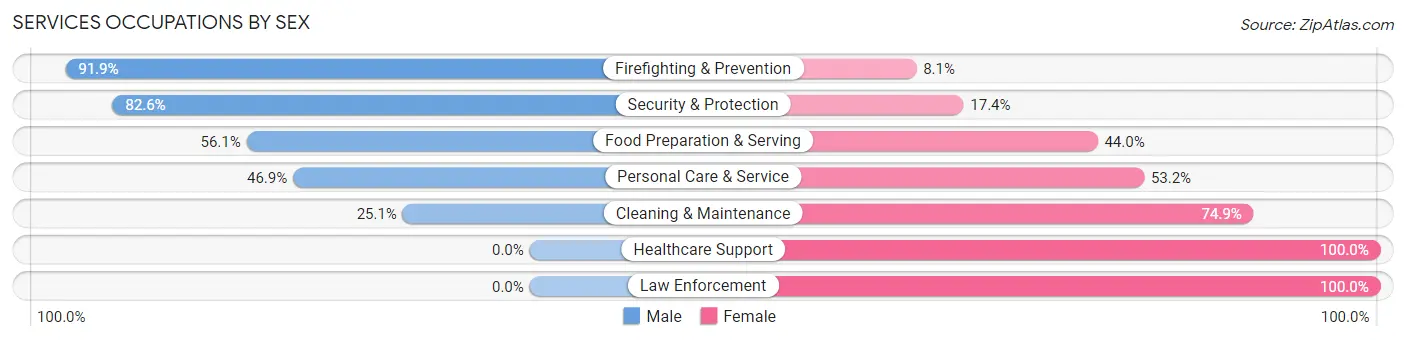
Services Occupations by Sex
Within the Services occupations in Calverton, the most male-oriented occupations are Firefighting & Prevention (91.9%), Security & Protection (82.6%), and Food Preparation & Serving (56.0%), while the most female-oriented occupations are Healthcare Support (100.0%), Law Enforcement (100.0%), and Cleaning & Maintenance (74.9%).
| Occupation | Male | Female |
| Healthcare Support | 0 (0.0%) | 309 (100.0%) |
| Security & Protection | 114 (82.6%) | 24 (17.4%) |
| Firefighting & Prevention | 114 (91.9%) | 10 (8.1%) |
| Law Enforcement | 0 (0.0%) | 14 (100.0%) |
| Food Preparation & Serving | 278 (56.0%) | 218 (44.0%) |
| Cleaning & Maintenance | 97 (25.1%) | 289 (74.9%) |
| Personal Care & Service | 238 (46.9%) | 270 (53.1%) |
| Total (Category) | 727 (39.6%) | 1,110 (60.4%) |
| Total (Overall) | 4,854 (56.1%) | 3,805 (43.9%) |
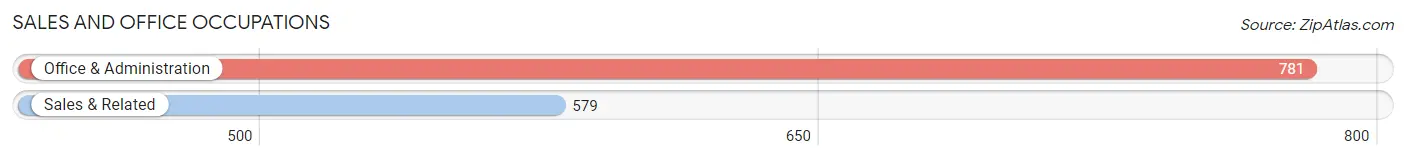
Sales and Office Occupations
The most common Sales and Office occupations in Calverton are Office & Administration (781 | 9.0%), and Sales & Related (579 | 6.7%).
Sales and Office Occupations by Sex
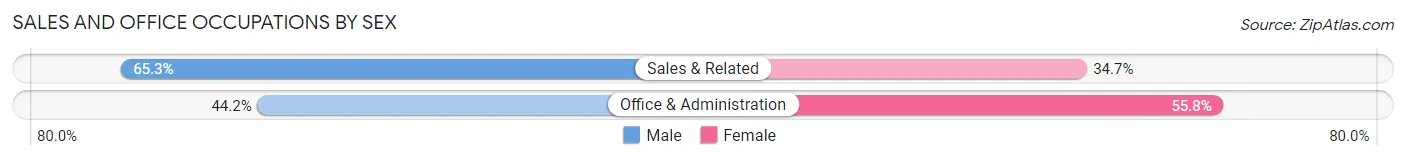
| Occupation | Male | Female |
| Sales & Related | 378 (65.3%) | 201 (34.7%) |
| Office & Administration | 345 (44.2%) | 436 (55.8%) |
| Total (Category) | 723 (53.2%) | 637 (46.8%) |
| Total (Overall) | 4,854 (56.1%) | 3,805 (43.9%) |
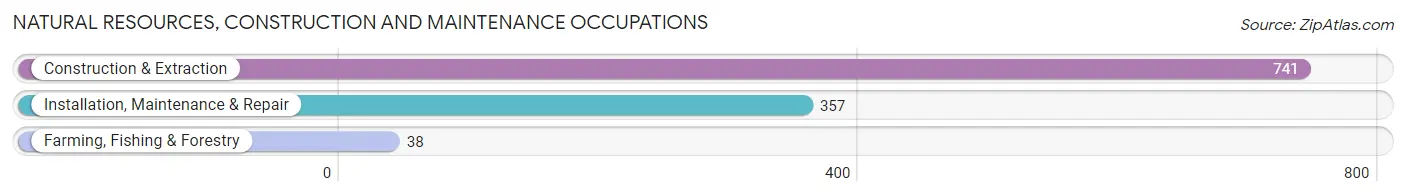
Natural Resources, Construction and Maintenance Occupations
The most common Natural Resources, Construction and Maintenance occupations in Calverton are Construction & Extraction (741 | 8.6%), Installation, Maintenance & Repair (357 | 4.1%), and Farming, Fishing & Forestry (38 | 0.4%).
Natural Resources, Construction and Maintenance Occupations by Sex
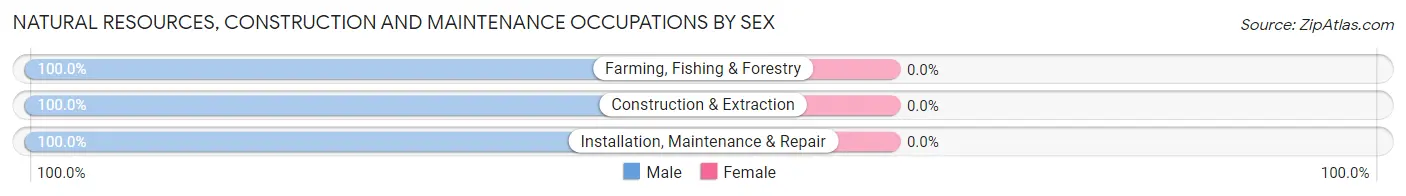
| Occupation | Male | Female |
| Farming, Fishing & Forestry | 38 (100.0%) | 0 (0.0%) |
| Construction & Extraction | 741 (100.0%) | 0 (0.0%) |
| Installation, Maintenance & Repair | 357 (100.0%) | 0 (0.0%) |
| Total (Category) | 1,136 (100.0%) | 0 (0.0%) |
| Total (Overall) | 4,854 (56.1%) | 3,805 (43.9%) |
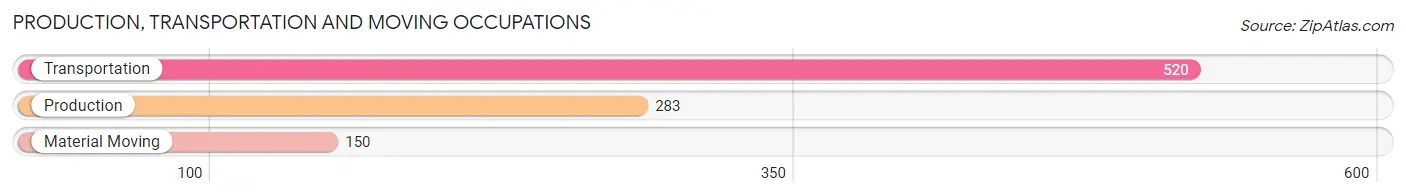
Production, Transportation and Moving Occupations
The most common Production, Transportation and Moving occupations in Calverton are Transportation (520 | 6.0%), Production (283 | 3.3%), and Material Moving (150 | 1.7%).
Production, Transportation and Moving Occupations by Sex
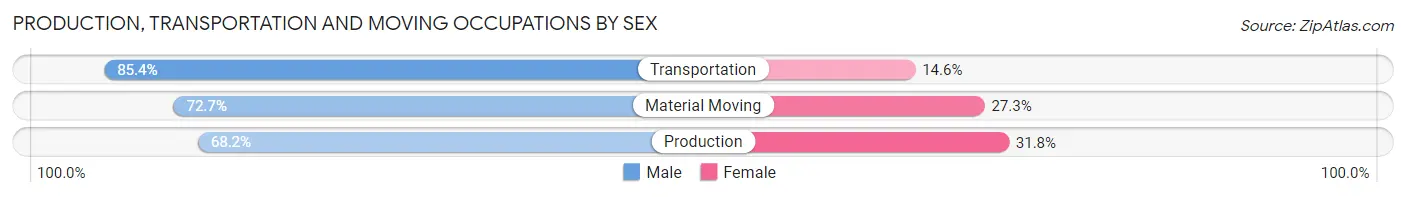
| Occupation | Male | Female |
| Production | 193 (68.2%) | 90 (31.8%) |
| Transportation | 444 (85.4%) | 76 (14.6%) |
| Material Moving | 109 (72.7%) | 41 (27.3%) |
| Total (Category) | 746 (78.3%) | 207 (21.7%) |
| Total (Overall) | 4,854 (56.1%) | 3,805 (43.9%) |
Employment Industries by Sex in Calverton
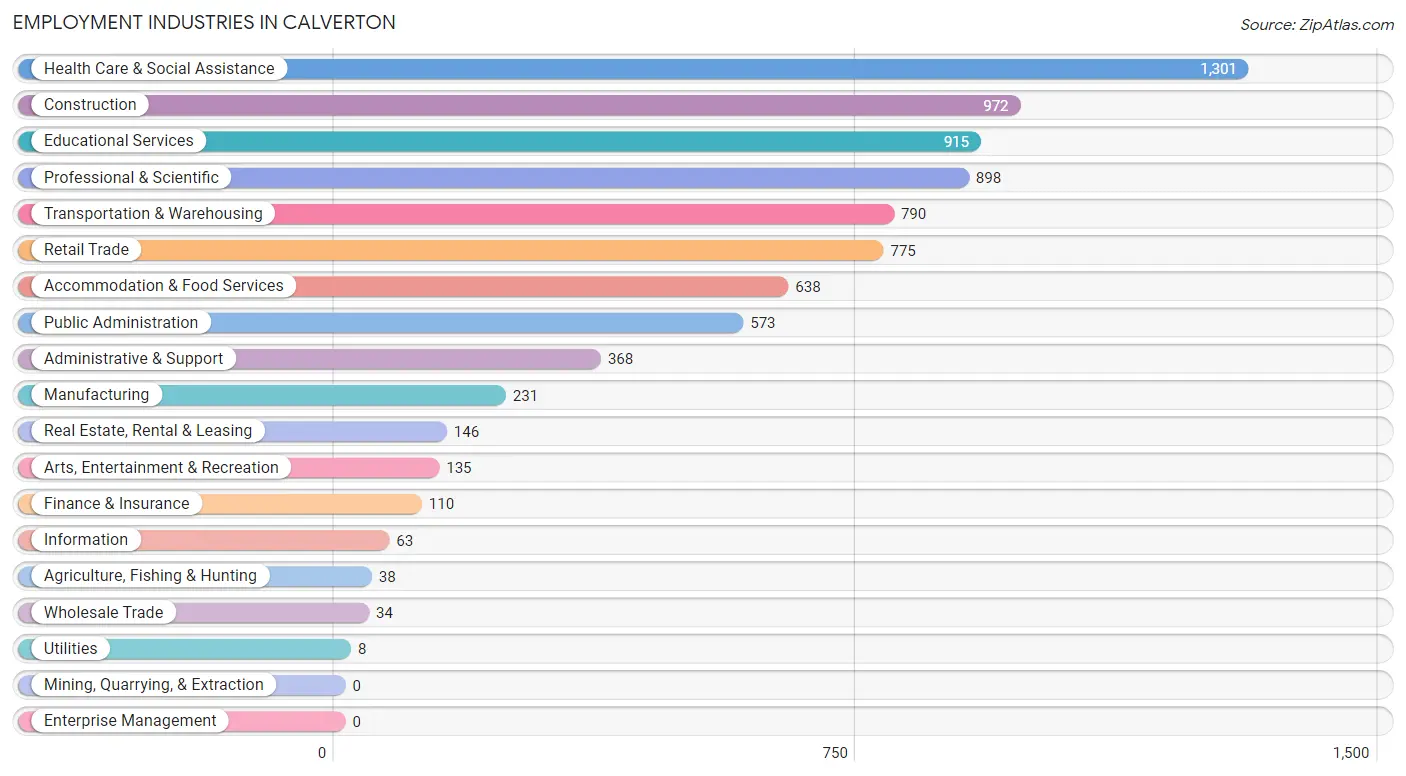
Employment Industries in Calverton
The major employment industries in Calverton include Health Care & Social Assistance (1,301 | 15.0%), Construction (972 | 11.2%), Educational Services (915 | 10.6%), Professional & Scientific (898 | 10.4%), and Transportation & Warehousing (790 | 9.1%).
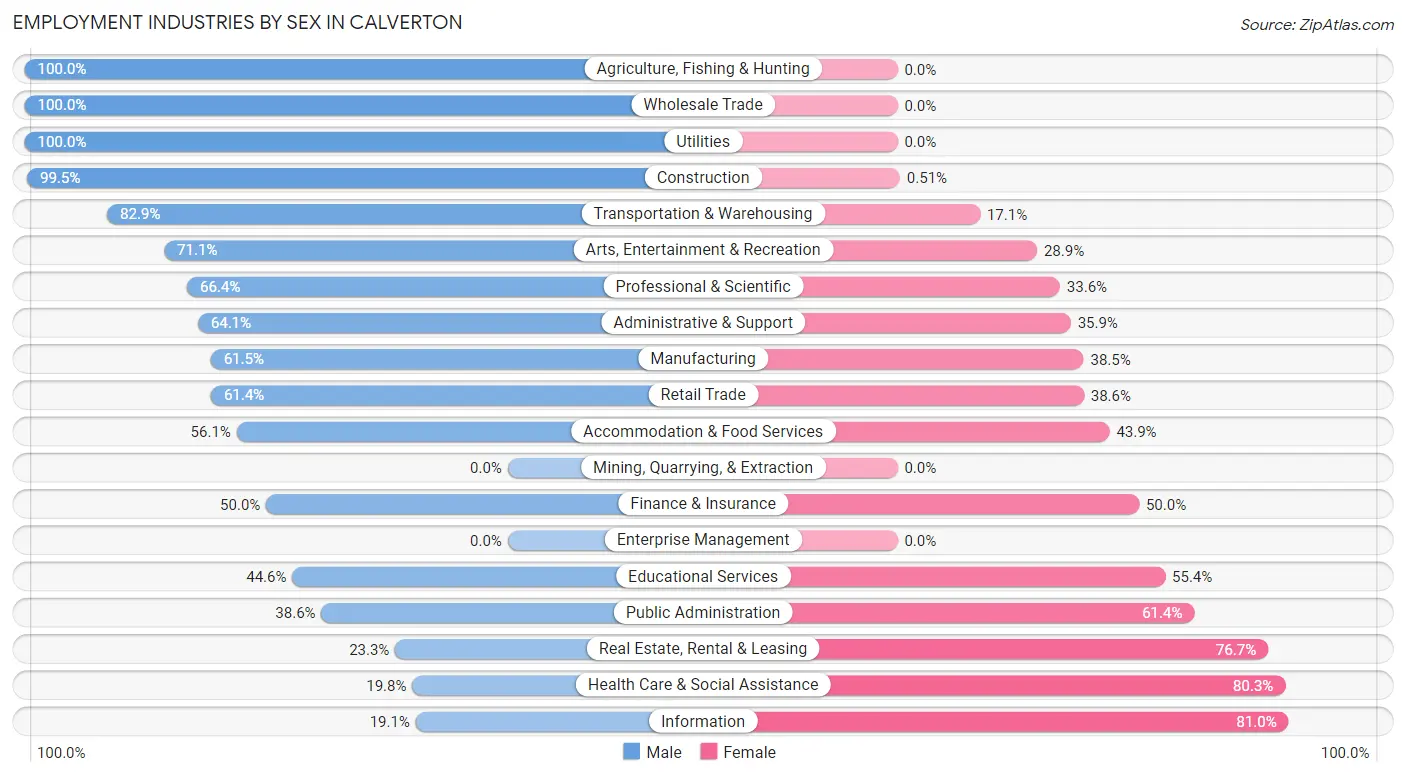
Employment Industries by Sex in Calverton
The Calverton industries that see more men than women are Agriculture, Fishing & Hunting (100.0%), Wholesale Trade (100.0%), and Utilities (100.0%), whereas the industries that tend to have a higher number of women are Information (80.9%), Health Care & Social Assistance (80.2%), and Real Estate, Rental & Leasing (76.7%).
| Industry | Male | Female |
| Agriculture, Fishing & Hunting | 38 (100.0%) | 0 (0.0%) |
| Mining, Quarrying, & Extraction | 0 (0.0%) | 0 (0.0%) |
| Construction | 967 (99.5%) | 5 (0.5%) |
| Manufacturing | 142 (61.5%) | 89 (38.5%) |
| Wholesale Trade | 34 (100.0%) | 0 (0.0%) |
| Retail Trade | 476 (61.4%) | 299 (38.6%) |
| Transportation & Warehousing | 655 (82.9%) | 135 (17.1%) |
| Utilities | 8 (100.0%) | 0 (0.0%) |
| Information | 12 (19.1%) | 51 (80.9%) |
| Finance & Insurance | 55 (50.0%) | 55 (50.0%) |
| Real Estate, Rental & Leasing | 34 (23.3%) | 112 (76.7%) |
| Professional & Scientific | 596 (66.4%) | 302 (33.6%) |
| Enterprise Management | 0 (0.0%) | 0 (0.0%) |
| Administrative & Support | 236 (64.1%) | 132 (35.9%) |
| Educational Services | 408 (44.6%) | 507 (55.4%) |
| Health Care & Social Assistance | 257 (19.8%) | 1,044 (80.2%) |
| Arts, Entertainment & Recreation | 96 (71.1%) | 39 (28.9%) |
| Accommodation & Food Services | 358 (56.1%) | 280 (43.9%) |
| Public Administration | 221 (38.6%) | 352 (61.4%) |
| Total | 4,854 (56.1%) | 3,805 (43.9%) |
Education in Calverton
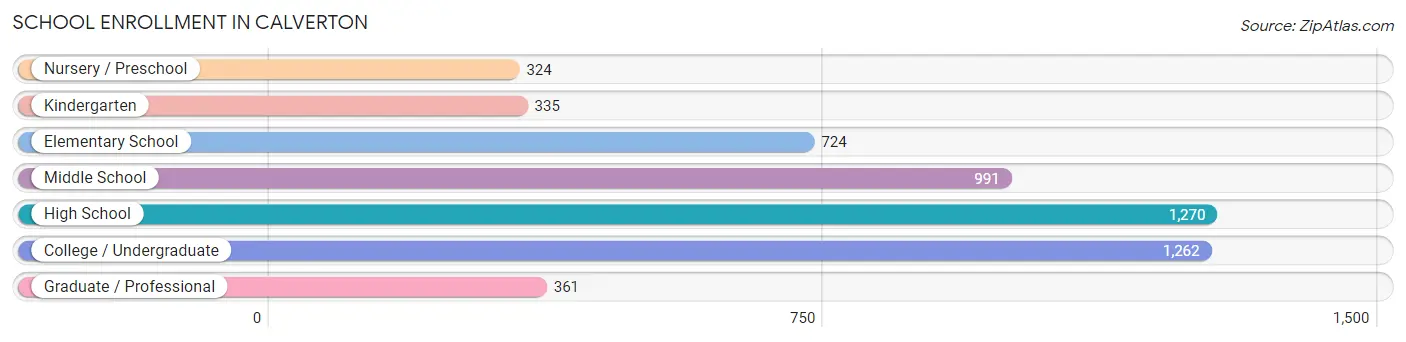
School Enrollment in Calverton
The most common levels of schooling among the 5,267 students in Calverton are high school (1,270 | 24.1%), college / undergraduate (1,262 | 24.0%), and middle school (991 | 18.8%).
| School Level | # Students | % Students |
| Nursery / Preschool | 324 | 6.1% |
| Kindergarten | 335 | 6.4% |
| Elementary School | 724 | 13.8% |
| Middle School | 991 | 18.8% |
| High School | 1,270 | 24.1% |
| College / Undergraduate | 1,262 | 24.0% |
| Graduate / Professional | 361 | 6.9% |
| Total | 5,267 | 100.0% |
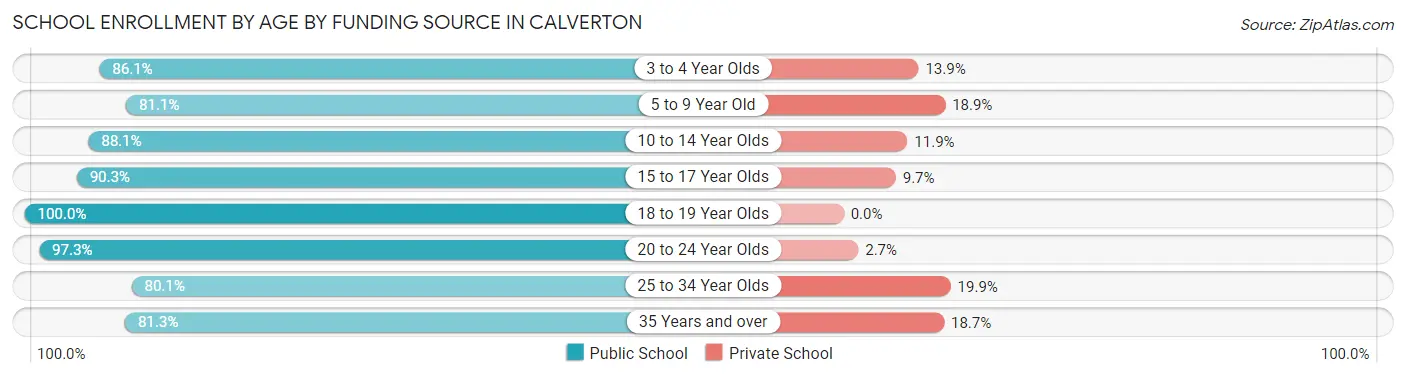
School Enrollment by Age by Funding Source in Calverton
Out of a total of 5,267 students who are enrolled in schools in Calverton, 658 (12.5%) attend a private institution, while the remaining 4,609 (87.5%) are enrolled in public schools. The age group of 25 to 34 year olds has the highest likelihood of being enrolled in private schools, with 58 (19.9% in the age bracket) enrolled. Conversely, the age group of 18 to 19 year olds has the lowest likelihood of being enrolled in a private school, with 391 (100.0% in the age bracket) attending a public institution.
| Age Bracket | Public School | Private School |
| 3 to 4 Year Olds | 247 (86.1%) | 40 (13.9%) |
| 5 to 9 Year Old | 836 (81.1%) | 195 (18.9%) |
| 10 to 14 Year Olds | 1,225 (88.1%) | 165 (11.9%) |
| 15 to 17 Year Olds | 660 (90.3%) | 71 (9.7%) |
| 18 to 19 Year Olds | 391 (100.0%) | 0 (0.0%) |
| 20 to 24 Year Olds | 501 (97.3%) | 14 (2.7%) |
| 25 to 34 Year Olds | 233 (80.1%) | 58 (19.9%) |
| 35 Years and over | 513 (81.3%) | 118 (18.7%) |
| Total | 4,609 (87.5%) | 658 (12.5%) |
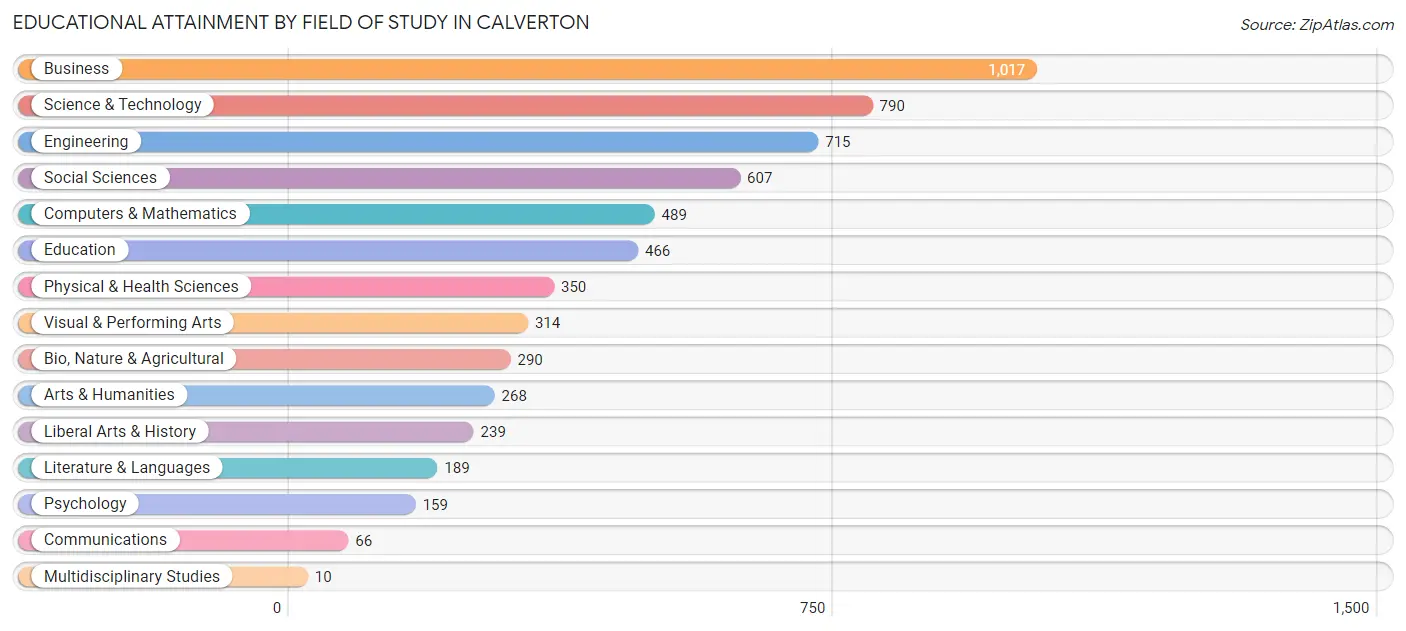
Educational Attainment by Field of Study in Calverton
Business (1,017 | 17.0%), science & technology (790 | 13.2%), engineering (715 | 12.0%), social sciences (607 | 10.2%), and computers & mathematics (489 | 8.2%) are the most common fields of study among 5,969 individuals in Calverton who have obtained a bachelor's degree or higher.
| Field of Study | # Graduates | % Graduates |
| Computers & Mathematics | 489 | 8.2% |
| Bio, Nature & Agricultural | 290 | 4.9% |
| Physical & Health Sciences | 350 | 5.9% |
| Psychology | 159 | 2.7% |
| Social Sciences | 607 | 10.2% |
| Engineering | 715 | 12.0% |
| Multidisciplinary Studies | 10 | 0.2% |
| Science & Technology | 790 | 13.2% |
| Business | 1,017 | 17.0% |
| Education | 466 | 7.8% |
| Literature & Languages | 189 | 3.2% |
| Liberal Arts & History | 239 | 4.0% |
| Visual & Performing Arts | 314 | 5.3% |
| Communications | 66 | 1.1% |
| Arts & Humanities | 268 | 4.5% |
| Total | 5,969 | 100.0% |
Transportation & Commute in Calverton
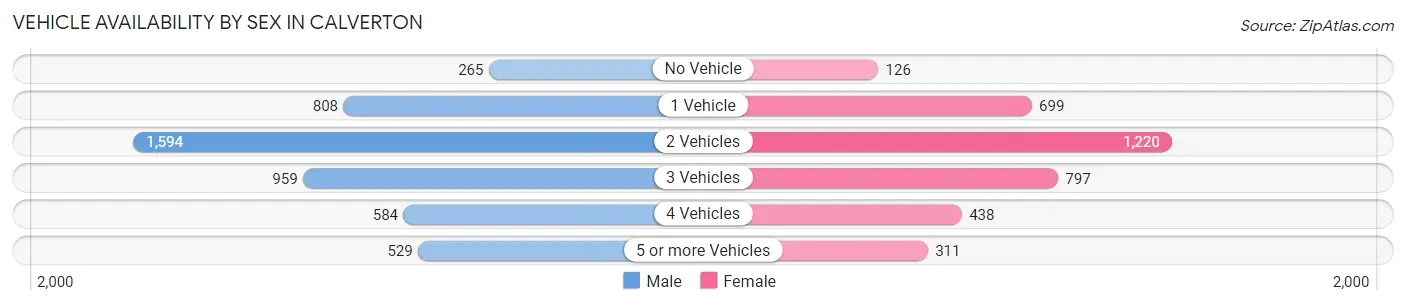
Vehicle Availability by Sex in Calverton
The most prevalent vehicle ownership categories in Calverton are males with 2 vehicles (1,594, accounting for 33.6%) and females with 2 vehicles (1,220, making up 44.4%).
| Vehicles Available | Male | Female |
| No Vehicle | 265 (5.6%) | 126 (3.5%) |
| 1 Vehicle | 808 (17.1%) | 699 (19.5%) |
| 2 Vehicles | 1,594 (33.6%) | 1,220 (34.0%) |
| 3 Vehicles | 959 (20.2%) | 797 (22.2%) |
| 4 Vehicles | 584 (12.3%) | 438 (12.2%) |
| 5 or more Vehicles | 529 (11.2%) | 311 (8.7%) |
| Total | 4,739 (100.0%) | 3,591 (100.0%) |
Commute Time in Calverton
The most frequently occuring commute durations in Calverton are 30 to 34 minutes (1,882 commuters, 24.0%), 45 to 59 minutes (1,155 commuters, 14.7%), and 20 to 24 minutes (803 commuters, 10.2%).
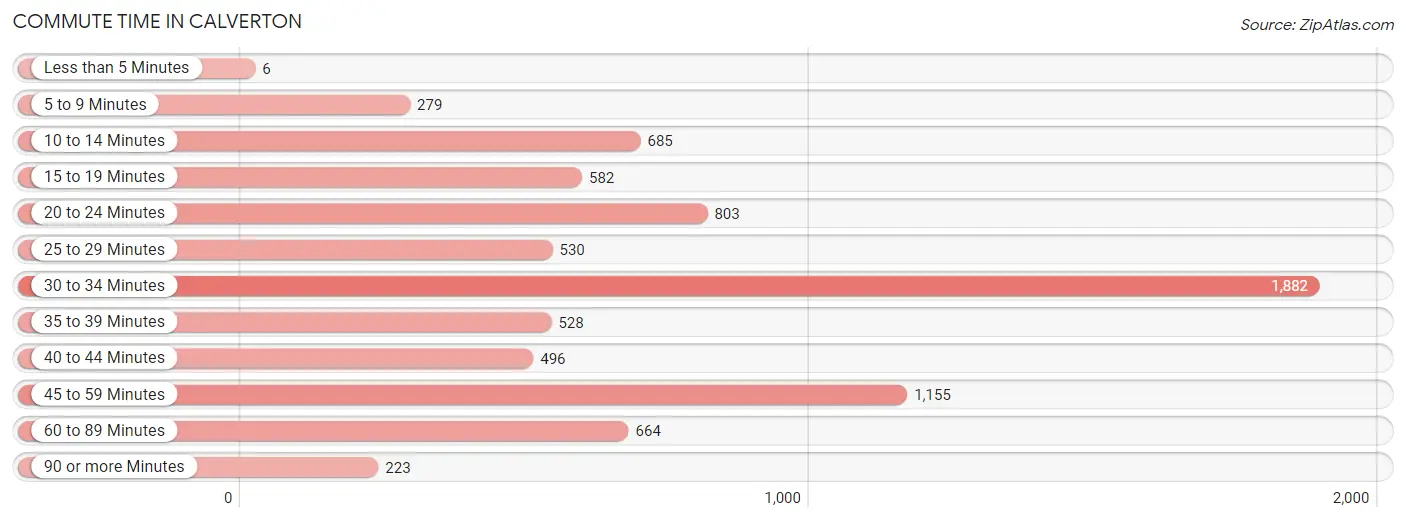
| Commute Time | # Commuters | % Commuters |
| Less than 5 Minutes | 6 | 0.1% |
| 5 to 9 Minutes | 279 | 3.6% |
| 10 to 14 Minutes | 685 | 8.7% |
| 15 to 19 Minutes | 582 | 7.4% |
| 20 to 24 Minutes | 803 | 10.2% |
| 25 to 29 Minutes | 530 | 6.8% |
| 30 to 34 Minutes | 1,882 | 24.0% |
| 35 to 39 Minutes | 528 | 6.7% |
| 40 to 44 Minutes | 496 | 6.3% |
| 45 to 59 Minutes | 1,155 | 14.7% |
| 60 to 89 Minutes | 664 | 8.5% |
| 90 or more Minutes | 223 | 2.9% |
Commute Time by Sex in Calverton
The most common commute times in Calverton are 30 to 34 minutes (1,369 commuters, 29.6%) for males and 45 to 59 minutes (518 commuters, 16.1%) for females.
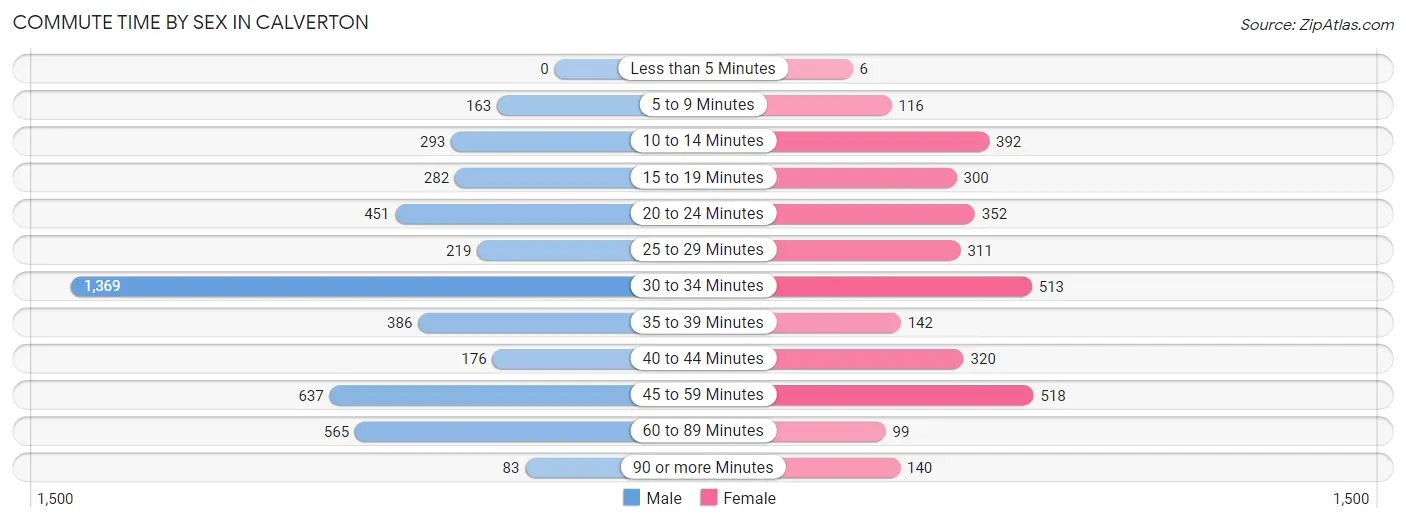
| Commute Time | Male | Female |
| Less than 5 Minutes | 0 (0.0%) | 6 (0.2%) |
| 5 to 9 Minutes | 163 (3.5%) | 116 (3.6%) |
| 10 to 14 Minutes | 293 (6.3%) | 392 (12.2%) |
| 15 to 19 Minutes | 282 (6.1%) | 300 (9.3%) |
| 20 to 24 Minutes | 451 (9.8%) | 352 (11.0%) |
| 25 to 29 Minutes | 219 (4.7%) | 311 (9.7%) |
| 30 to 34 Minutes | 1,369 (29.6%) | 513 (16.0%) |
| 35 to 39 Minutes | 386 (8.4%) | 142 (4.4%) |
| 40 to 44 Minutes | 176 (3.8%) | 320 (10.0%) |
| 45 to 59 Minutes | 637 (13.8%) | 518 (16.1%) |
| 60 to 89 Minutes | 565 (12.2%) | 99 (3.1%) |
| 90 or more Minutes | 83 (1.8%) | 140 (4.4%) |
Time of Departure to Work by Sex in Calverton
The most frequent times of departure to work in Calverton are 7:00 AM to 7:29 AM (797, 17.2%) for males and 7:00 AM to 7:29 AM (731, 22.8%) for females.
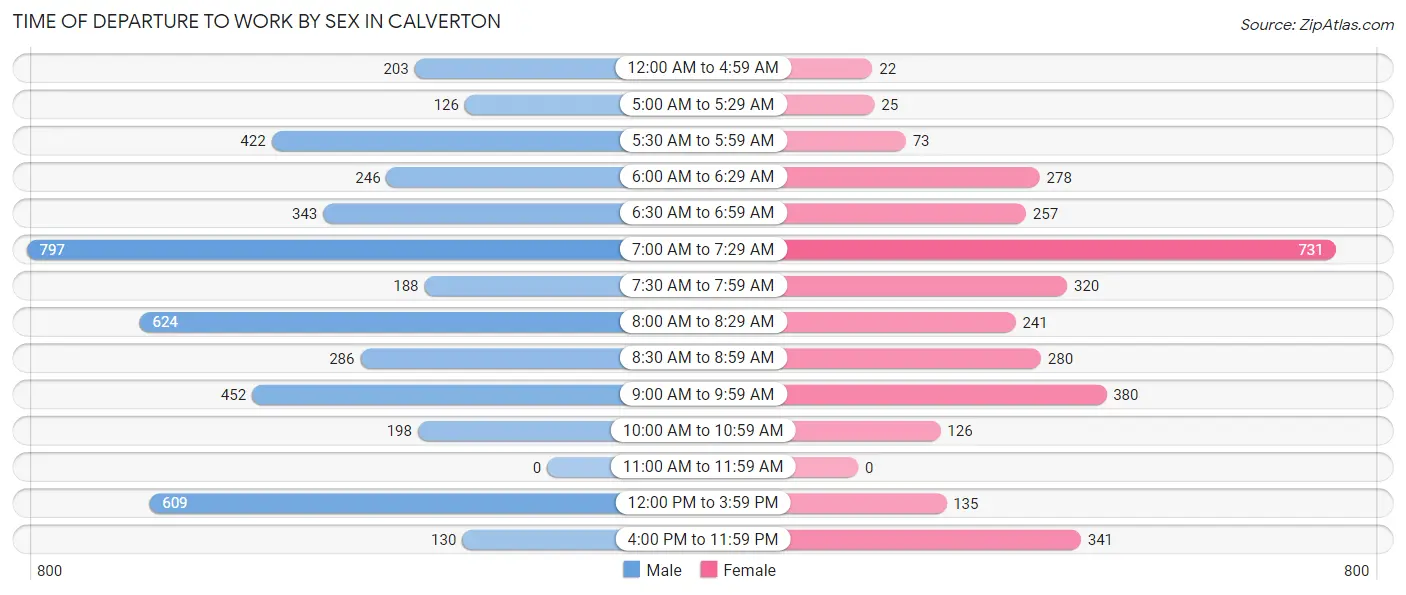
| Time of Departure | Male | Female |
| 12:00 AM to 4:59 AM | 203 (4.4%) | 22 (0.7%) |
| 5:00 AM to 5:29 AM | 126 (2.7%) | 25 (0.8%) |
| 5:30 AM to 5:59 AM | 422 (9.1%) | 73 (2.3%) |
| 6:00 AM to 6:29 AM | 246 (5.3%) | 278 (8.7%) |
| 6:30 AM to 6:59 AM | 343 (7.4%) | 257 (8.0%) |
| 7:00 AM to 7:29 AM | 797 (17.2%) | 731 (22.8%) |
| 7:30 AM to 7:59 AM | 188 (4.1%) | 320 (10.0%) |
| 8:00 AM to 8:29 AM | 624 (13.5%) | 241 (7.5%) |
| 8:30 AM to 8:59 AM | 286 (6.2%) | 280 (8.7%) |
| 9:00 AM to 9:59 AM | 452 (9.8%) | 380 (11.8%) |
| 10:00 AM to 10:59 AM | 198 (4.3%) | 126 (3.9%) |
| 11:00 AM to 11:59 AM | 0 (0.0%) | 0 (0.0%) |
| 12:00 PM to 3:59 PM | 609 (13.2%) | 135 (4.2%) |
| 4:00 PM to 11:59 PM | 130 (2.8%) | 341 (10.6%) |
| Total | 4,624 (100.0%) | 3,209 (100.0%) |
Housing Occupancy in Calverton
Occupancy by Ownership in Calverton
Of the total 6,139 dwellings in Calverton, owner-occupied units account for 4,303 (70.1%), while renter-occupied units make up 1,836 (29.9%).
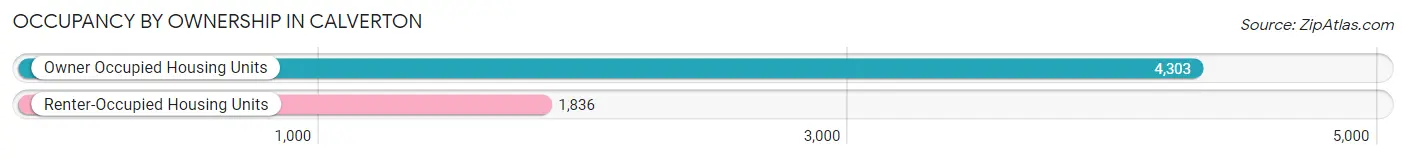
| Occupancy | # Housing Units | % Housing Units |
| Owner Occupied Housing Units | 4,303 | 70.1% |
| Renter-Occupied Housing Units | 1,836 | 29.9% |
| Total Occupied Housing Units | 6,139 | 100.0% |
Occupancy by Household Size in Calverton
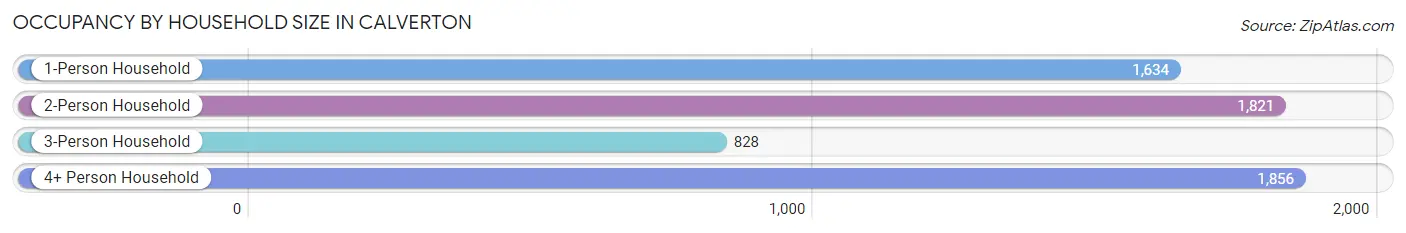
| Household Size | # Housing Units | % Housing Units |
| 1-Person Household | 1,634 | 26.6% |
| 2-Person Household | 1,821 | 29.7% |
| 3-Person Household | 828 | 13.5% |
| 4+ Person Household | 1,856 | 30.2% |
| Total Housing Units | 6,139 | 100.0% |
Occupancy by Ownership by Household Size in Calverton
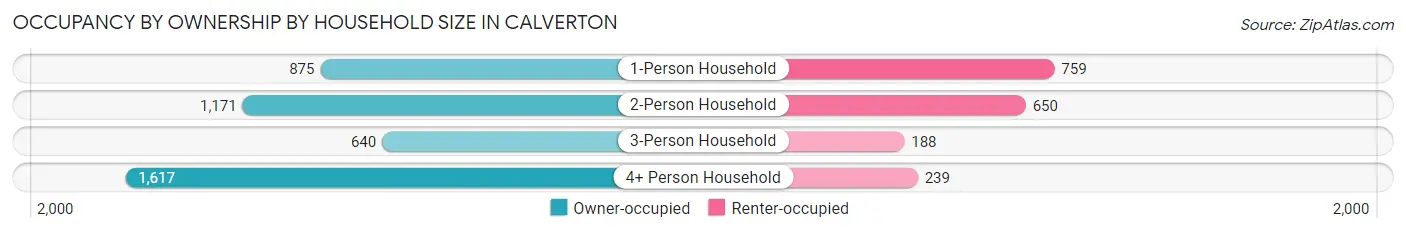
| Household Size | Owner-occupied | Renter-occupied |
| 1-Person Household | 875 (53.5%) | 759 (46.5%) |
| 2-Person Household | 1,171 (64.3%) | 650 (35.7%) |
| 3-Person Household | 640 (77.3%) | 188 (22.7%) |
| 4+ Person Household | 1,617 (87.1%) | 239 (12.9%) |
| Total Housing Units | 4,303 (70.1%) | 1,836 (29.9%) |
Occupancy by Educational Attainment in Calverton
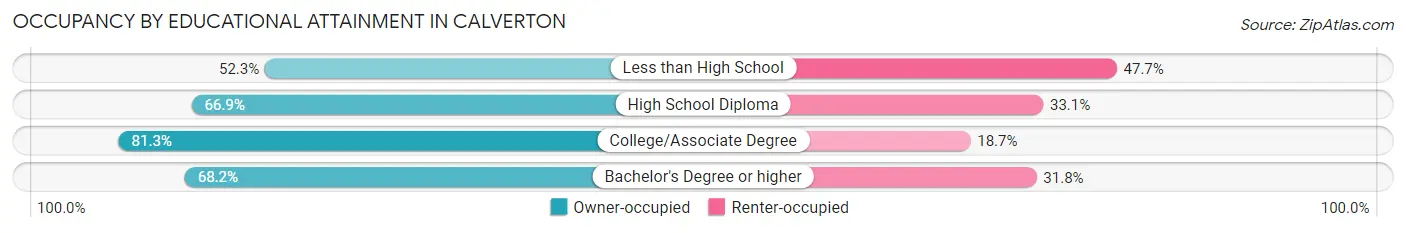
| Household Size | Owner-occupied | Renter-occupied |
| Less than High School | 202 (52.3%) | 184 (47.7%) |
| High School Diploma | 815 (66.9%) | 403 (33.1%) |
| College/Associate Degree | 1,190 (81.3%) | 273 (18.7%) |
| Bachelor's Degree or higher | 2,096 (68.2%) | 976 (31.8%) |
Occupancy by Age of Householder in Calverton
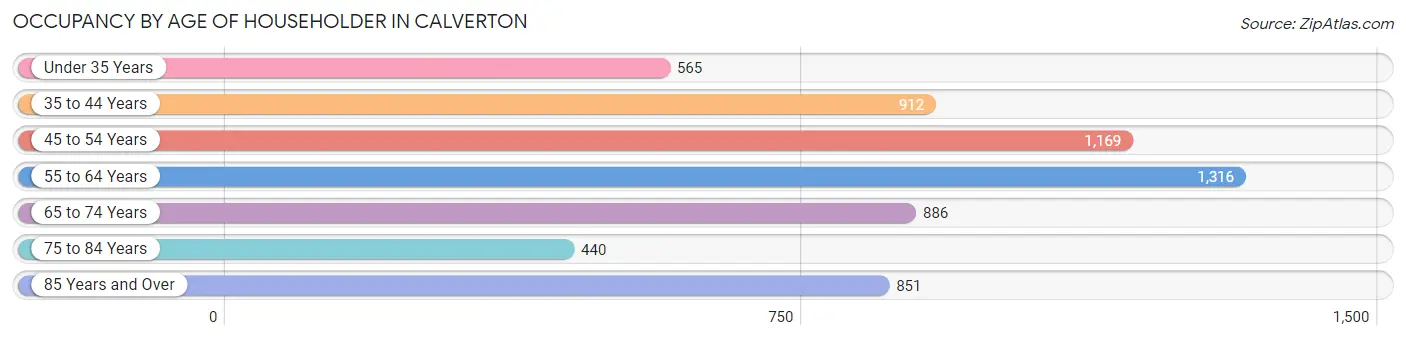
| Age Bracket | # Households | % Households |
| Under 35 Years | 565 | 9.2% |
| 35 to 44 Years | 912 | 14.9% |
| 45 to 54 Years | 1,169 | 19.0% |
| 55 to 64 Years | 1,316 | 21.4% |
| 65 to 74 Years | 886 | 14.4% |
| 75 to 84 Years | 440 | 7.2% |
| 85 Years and Over | 851 | 13.9% |
| Total | 6,139 | 100.0% |
Housing Finances in Calverton
Median Income by Occupancy in Calverton
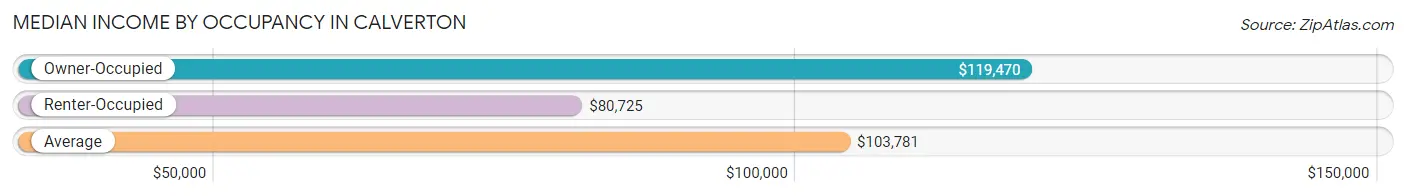
| Occupancy Type | # Households | Median Income |
| Owner-Occupied | 4,303 (70.1%) | $119,470 |
| Renter-Occupied | 1,836 (29.9%) | $80,725 |
| Average | 6,139 (100.0%) | $103,781 |
Occupancy by Householder Income Bracket in Calverton
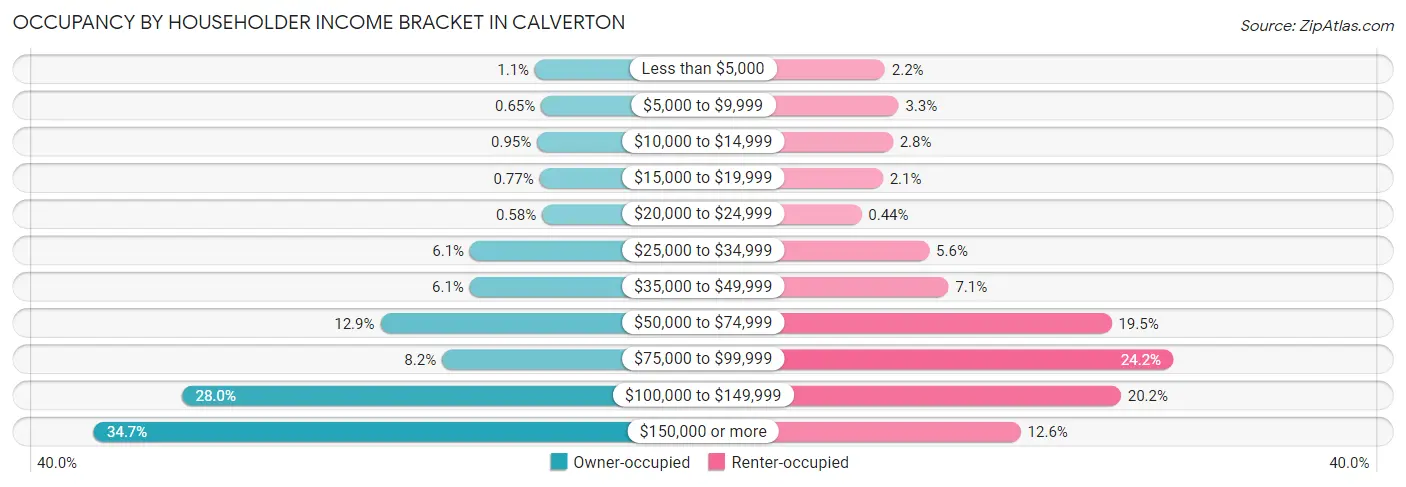
| Income Bracket | Owner-occupied | Renter-occupied |
| Less than $5,000 | 48 (1.1%) | 41 (2.2%) |
| $5,000 to $9,999 | 28 (0.6%) | 60 (3.3%) |
| $10,000 to $14,999 | 41 (0.9%) | 52 (2.8%) |
| $15,000 to $19,999 | 33 (0.8%) | 38 (2.1%) |
| $20,000 to $24,999 | 25 (0.6%) | 8 (0.4%) |
| $25,000 to $34,999 | 261 (6.1%) | 103 (5.6%) |
| $35,000 to $49,999 | 262 (6.1%) | 130 (7.1%) |
| $50,000 to $74,999 | 555 (12.9%) | 358 (19.5%) |
| $75,000 to $99,999 | 353 (8.2%) | 444 (24.2%) |
| $100,000 to $149,999 | 1,203 (28.0%) | 371 (20.2%) |
| $150,000 or more | 1,494 (34.7%) | 231 (12.6%) |
| Total | 4,303 (100.0%) | 1,836 (100.0%) |
Monthly Housing Cost Tiers in Calverton

| Monthly Cost | Owner-occupied | Renter-occupied |
| Less than $300 | 181 (4.2%) | 5 (0.3%) |
| $300 to $499 | 184 (4.3%) | 14 (0.8%) |
| $500 to $799 | 501 (11.6%) | 56 (3.0%) |
| $800 to $999 | 204 (4.7%) | 0 (0.0%) |
| $1,000 to $1,499 | 338 (7.9%) | 328 (17.9%) |
| $1,500 to $1,999 | 725 (16.9%) | 436 (23.7%) |
| $2,000 to $2,499 | 797 (18.5%) | 257 (14.0%) |
| $2,500 to $2,999 | 677 (15.7%) | 234 (12.8%) |
| $3,000 or more | 696 (16.2%) | 416 (22.7%) |
| Total | 4,303 (100.0%) | 1,836 (100.0%) |
Physical Housing Characteristics in Calverton
Housing Structures in Calverton
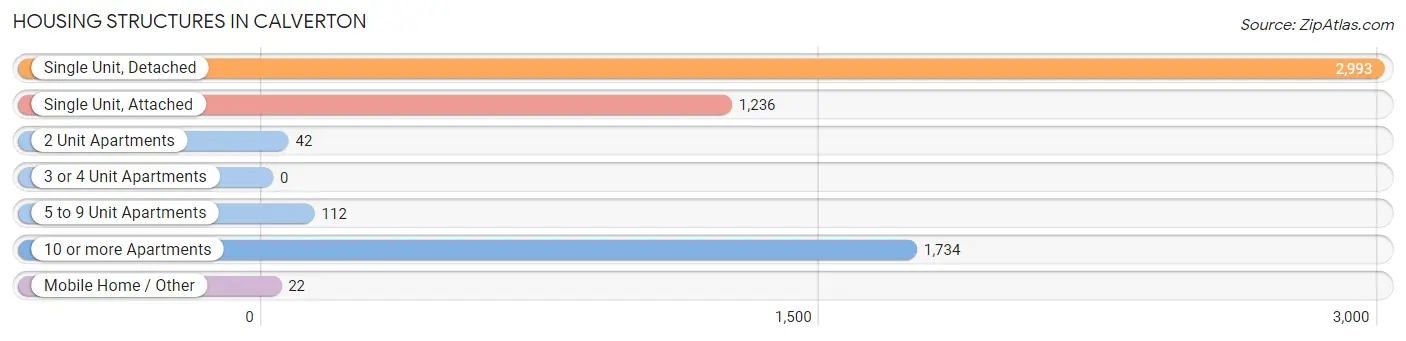
| Structure Type | # Housing Units | % Housing Units |
| Single Unit, Detached | 2,993 | 48.7% |
| Single Unit, Attached | 1,236 | 20.1% |
| 2 Unit Apartments | 42 | 0.7% |
| 3 or 4 Unit Apartments | 0 | 0.0% |
| 5 to 9 Unit Apartments | 112 | 1.8% |
| 10 or more Apartments | 1,734 | 28.2% |
| Mobile Home / Other | 22 | 0.4% |
| Total | 6,139 | 100.0% |
Housing Structures by Occupancy in Calverton
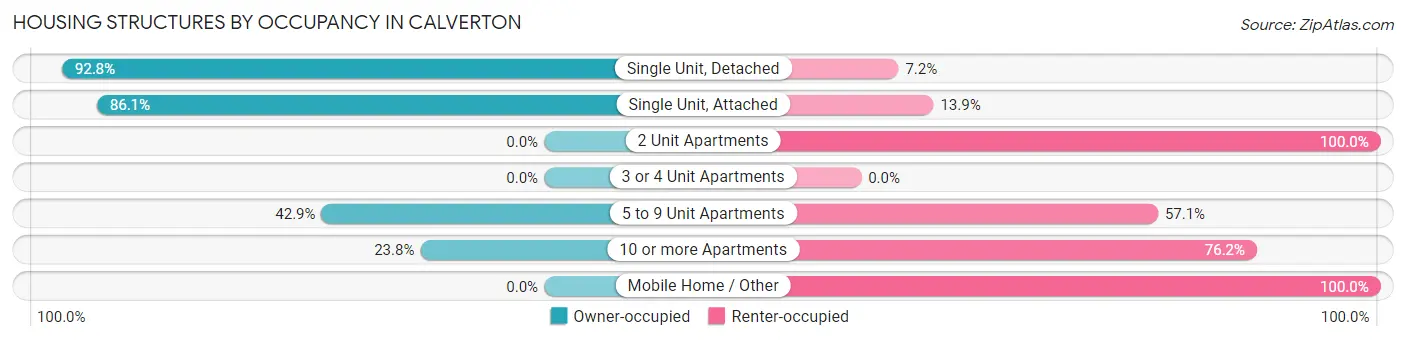
| Structure Type | Owner-occupied | Renter-occupied |
| Single Unit, Detached | 2,778 (92.8%) | 215 (7.2%) |
| Single Unit, Attached | 1,064 (86.1%) | 172 (13.9%) |
| 2 Unit Apartments | 0 (0.0%) | 42 (100.0%) |
| 3 or 4 Unit Apartments | 0 (0.0%) | 0 (0.0%) |
| 5 to 9 Unit Apartments | 48 (42.9%) | 64 (57.1%) |
| 10 or more Apartments | 413 (23.8%) | 1,321 (76.2%) |
| Mobile Home / Other | 0 (0.0%) | 22 (100.0%) |
| Total | 4,303 (70.1%) | 1,836 (29.9%) |
Housing Structures by Number of Rooms in Calverton
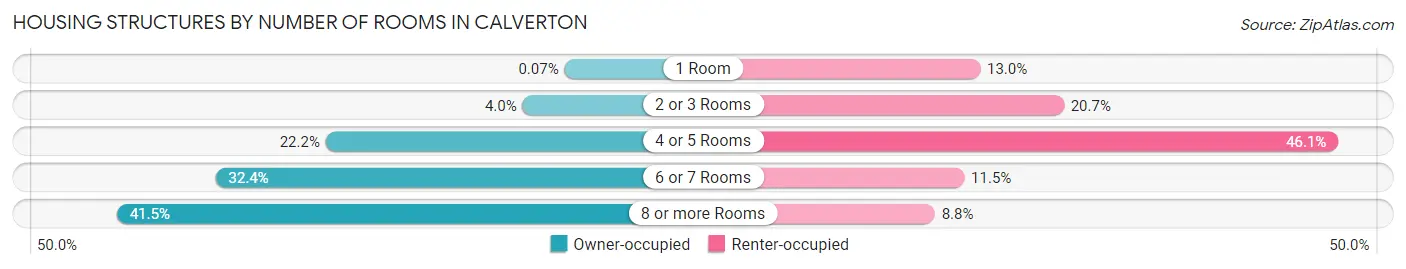
| Number of Rooms | Owner-occupied | Renter-occupied |
| 1 Room | 3 (0.1%) | 238 (13.0%) |
| 2 or 3 Rooms | 170 (4.0%) | 380 (20.7%) |
| 4 or 5 Rooms | 953 (22.2%) | 846 (46.1%) |
| 6 or 7 Rooms | 1,392 (32.4%) | 211 (11.5%) |
| 8 or more Rooms | 1,785 (41.5%) | 161 (8.8%) |
| Total | 4,303 (100.0%) | 1,836 (100.0%) |
Housing Structure by Heating Type in Calverton
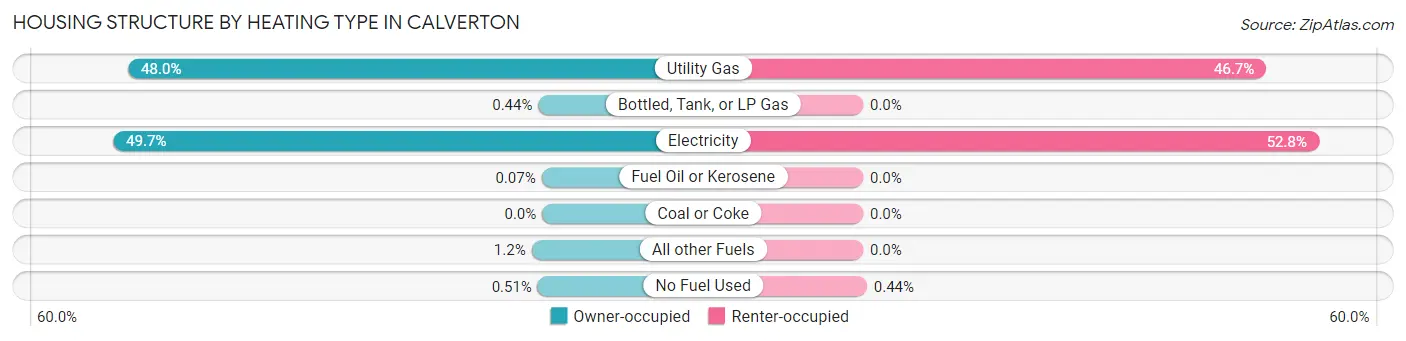
| Heating Type | Owner-occupied | Renter-occupied |
| Utility Gas | 2,066 (48.0%) | 858 (46.7%) |
| Bottled, Tank, or LP Gas | 19 (0.4%) | 0 (0.0%) |
| Electricity | 2,140 (49.7%) | 970 (52.8%) |
| Fuel Oil or Kerosene | 3 (0.1%) | 0 (0.0%) |
| Coal or Coke | 0 (0.0%) | 0 (0.0%) |
| All other Fuels | 53 (1.2%) | 0 (0.0%) |
| No Fuel Used | 22 (0.5%) | 8 (0.4%) |
| Total | 4,303 (100.0%) | 1,836 (100.0%) |
Household Vehicle Usage in Calverton
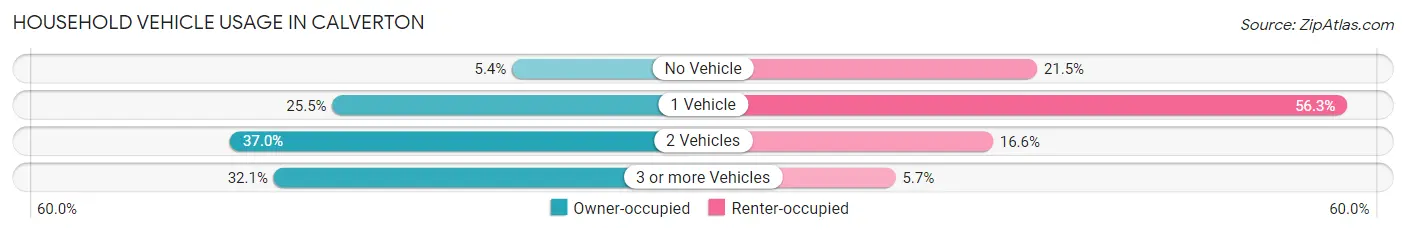
| Vehicles per Household | Owner-occupied | Renter-occupied |
| No Vehicle | 232 (5.4%) | 395 (21.5%) |
| 1 Vehicle | 1,098 (25.5%) | 1,033 (56.3%) |
| 2 Vehicles | 1,592 (37.0%) | 304 (16.6%) |
| 3 or more Vehicles | 1,381 (32.1%) | 104 (5.7%) |
| Total | 4,303 (100.0%) | 1,836 (100.0%) |
Real Estate & Mortgages in Calverton
Real Estate and Mortgage Overview in Calverton
| Characteristic | Without Mortgage | With Mortgage |
| Housing Units | 1,181 | 3,122 |
| Median Property Value | $439,200 | $447,700 |
| Median Household Income | $102,813 | $1,089 |
| Monthly Housing Costs | $706 | $674 |
| Real Estate Taxes | $4,178 | $29 |
Property Value by Mortgage Status in Calverton
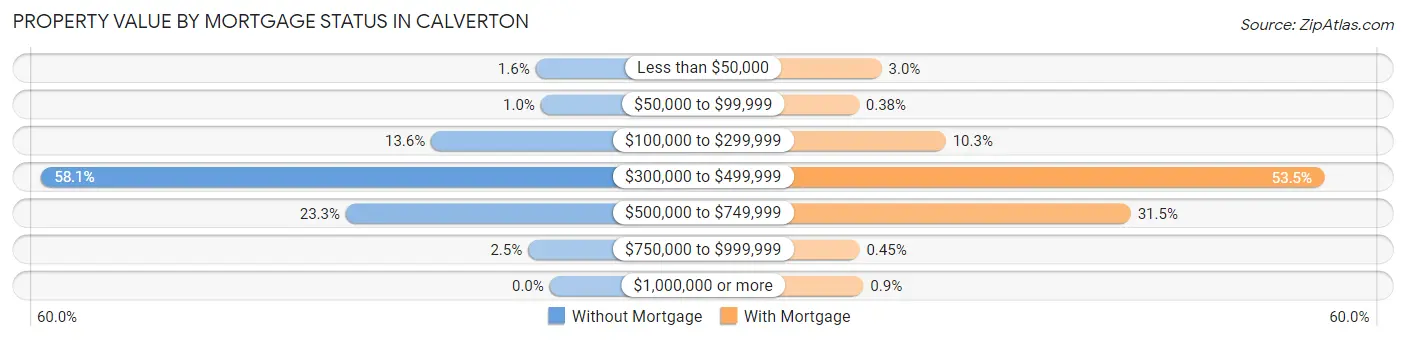
| Property Value | Without Mortgage | With Mortgage |
| Less than $50,000 | 19 (1.6%) | 93 (3.0%) |
| $50,000 to $99,999 | 12 (1.0%) | 12 (0.4%) |
| $100,000 to $299,999 | 160 (13.6%) | 322 (10.3%) |
| $300,000 to $499,999 | 686 (58.1%) | 1,671 (53.5%) |
| $500,000 to $749,999 | 275 (23.3%) | 982 (31.5%) |
| $750,000 to $999,999 | 29 (2.5%) | 14 (0.4%) |
| $1,000,000 or more | 0 (0.0%) | 28 (0.9%) |
| Total | 1,181 (100.0%) | 3,122 (100.0%) |
Household Income by Mortgage Status in Calverton
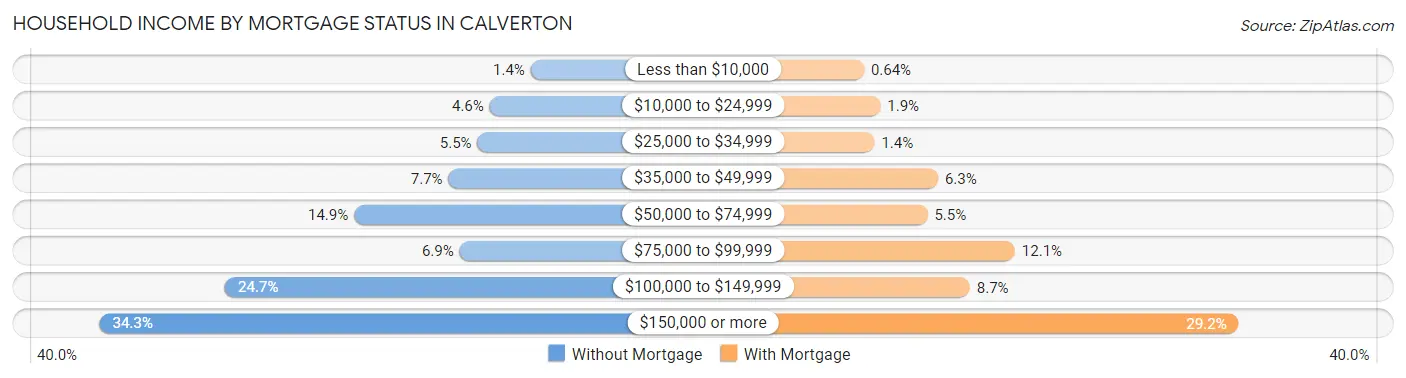
| Household Income | Without Mortgage | With Mortgage |
| Less than $10,000 | 17 (1.4%) | 20 (0.6%) |
| $10,000 to $24,999 | 54 (4.6%) | 59 (1.9%) |
| $25,000 to $34,999 | 65 (5.5%) | 45 (1.4%) |
| $35,000 to $49,999 | 91 (7.7%) | 196 (6.3%) |
| $50,000 to $74,999 | 176 (14.9%) | 171 (5.5%) |
| $75,000 to $99,999 | 81 (6.9%) | 379 (12.1%) |
| $100,000 to $149,999 | 292 (24.7%) | 272 (8.7%) |
| $150,000 or more | 405 (34.3%) | 911 (29.2%) |
| Total | 1,181 (100.0%) | 3,122 (100.0%) |
Property Value to Household Income Ratio in Calverton
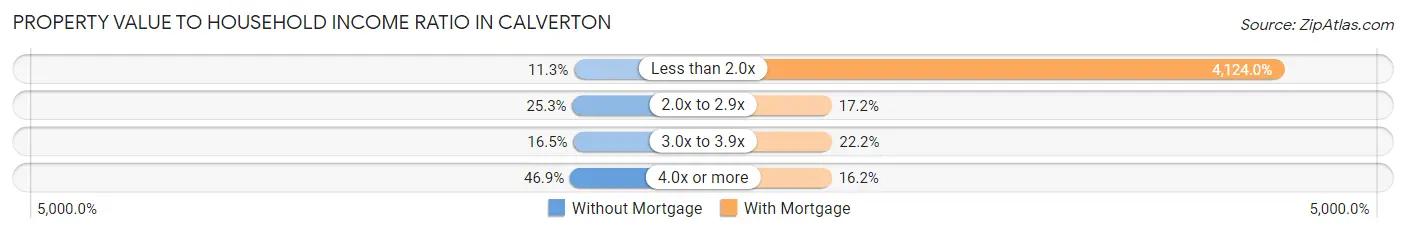
| Value-to-Income Ratio | Without Mortgage | With Mortgage |
| Less than 2.0x | 133 (11.3%) | 128,750 (4,124.0%) |
| 2.0x to 2.9x | 299 (25.3%) | 537 (17.2%) |
| 3.0x to 3.9x | 195 (16.5%) | 694 (22.2%) |
| 4.0x or more | 554 (46.9%) | 506 (16.2%) |
| Total | 1,181 (100.0%) | 3,122 (100.0%) |
Real Estate Taxes by Mortgage Status in Calverton
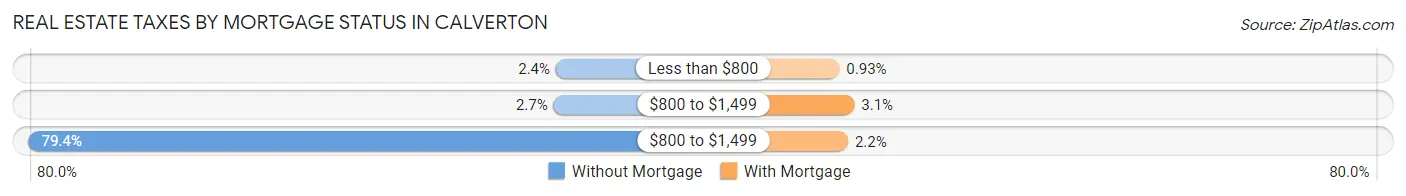
| Property Taxes | Without Mortgage | With Mortgage |
| Less than $800 | 28 (2.4%) | 29 (0.9%) |
| $800 to $1,499 | 32 (2.7%) | 97 (3.1%) |
| $800 to $1,499 | 938 (79.4%) | 68 (2.2%) |
| Total | 1,181 (100.0%) | 3,122 (100.0%) |
Health & Disability in Calverton
Health Insurance Coverage by Age in Calverton
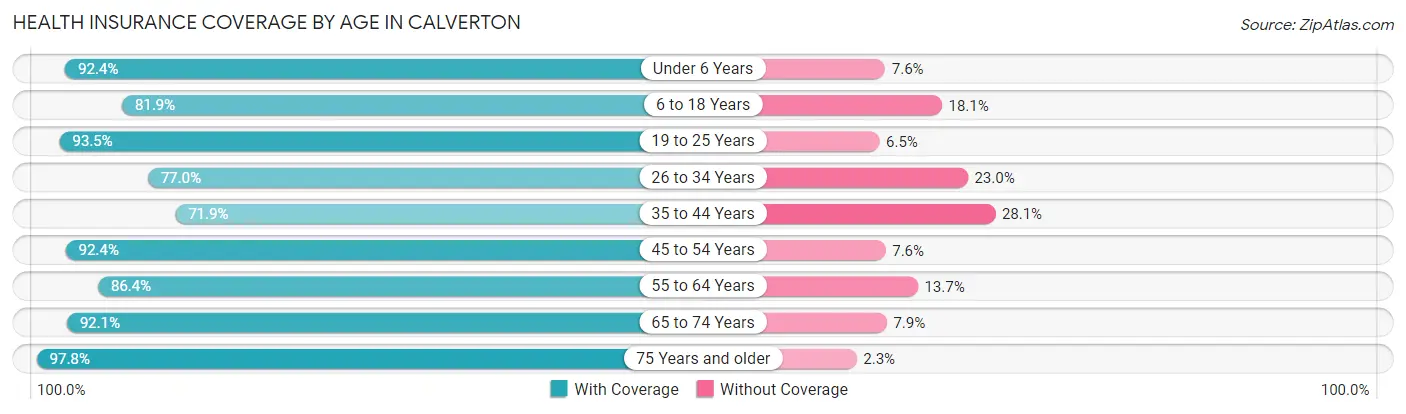
| Age Bracket | With Coverage | Without Coverage |
| Under 6 Years | 1,137 (92.4%) | 93 (7.6%) |
| 6 to 18 Years | 2,722 (81.9%) | 603 (18.1%) |
| 19 to 25 Years | 1,253 (93.5%) | 87 (6.5%) |
| 26 to 34 Years | 1,325 (77.0%) | 395 (23.0%) |
| 35 to 44 Years | 1,713 (71.9%) | 669 (28.1%) |
| 45 to 54 Years | 1,934 (92.4%) | 160 (7.6%) |
| 55 to 64 Years | 1,992 (86.4%) | 315 (13.7%) |
| 65 to 74 Years | 1,513 (92.1%) | 129 (7.9%) |
| 75 Years and older | 2,045 (97.8%) | 47 (2.2%) |
| Total | 15,634 (86.2%) | 2,498 (13.8%) |
Health Insurance Coverage by Citizenship Status in Calverton
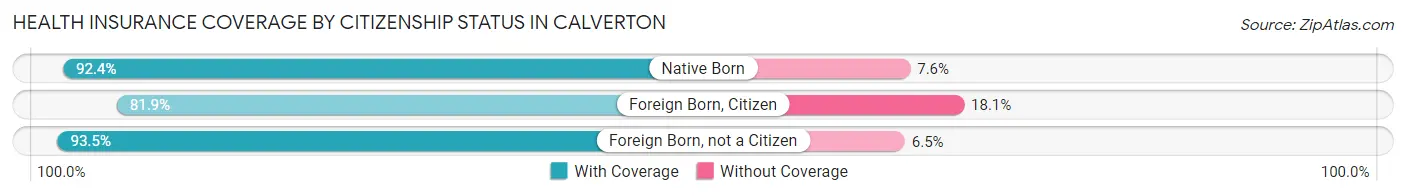
| Citizenship Status | With Coverage | Without Coverage |
| Native Born | 1,137 (92.4%) | 93 (7.6%) |
| Foreign Born, Citizen | 2,722 (81.9%) | 603 (18.1%) |
| Foreign Born, not a Citizen | 1,253 (93.5%) | 87 (6.5%) |
Health Insurance Coverage by Household Income in Calverton
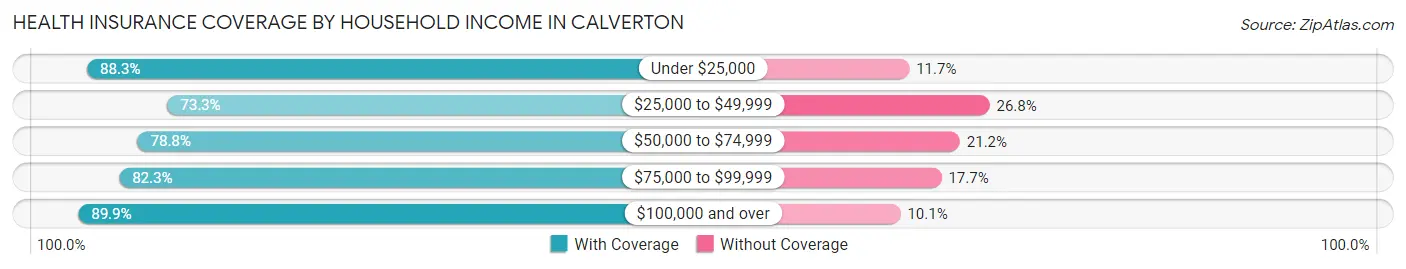
| Household Income | With Coverage | Without Coverage |
| Under $25,000 | 694 (88.3%) | 92 (11.7%) |
| $25,000 to $49,999 | 1,361 (73.3%) | 497 (26.8%) |
| $50,000 to $74,999 | 1,384 (78.8%) | 372 (21.2%) |
| $75,000 to $99,999 | 1,595 (82.3%) | 344 (17.7%) |
| $100,000 and over | 10,492 (89.9%) | 1,174 (10.1%) |
Public vs Private Health Insurance Coverage by Age in Calverton
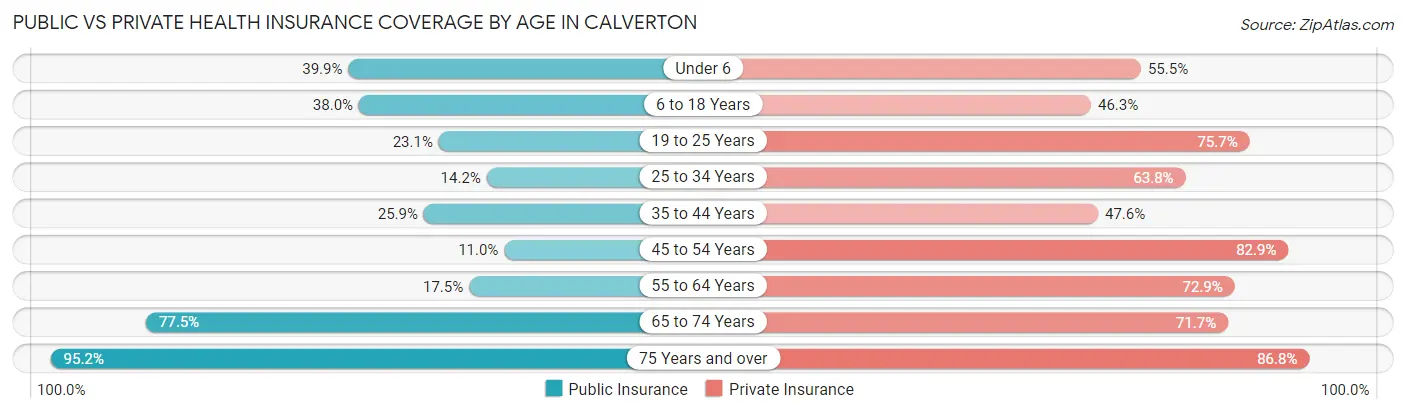
| Age Bracket | Public Insurance | Private Insurance |
| Under 6 | 491 (39.9%) | 683 (55.5%) |
| 6 to 18 Years | 1,262 (38.0%) | 1,538 (46.3%) |
| 19 to 25 Years | 310 (23.1%) | 1,014 (75.7%) |
| 25 to 34 Years | 245 (14.2%) | 1,097 (63.8%) |
| 35 to 44 Years | 617 (25.9%) | 1,133 (47.6%) |
| 45 to 54 Years | 230 (11.0%) | 1,735 (82.9%) |
| 55 to 64 Years | 404 (17.5%) | 1,682 (72.9%) |
| 65 to 74 Years | 1,272 (77.5%) | 1,177 (71.7%) |
| 75 Years and over | 1,991 (95.2%) | 1,815 (86.8%) |
| Total | 6,822 (37.6%) | 11,874 (65.5%) |
Disability Status by Sex by Age in Calverton
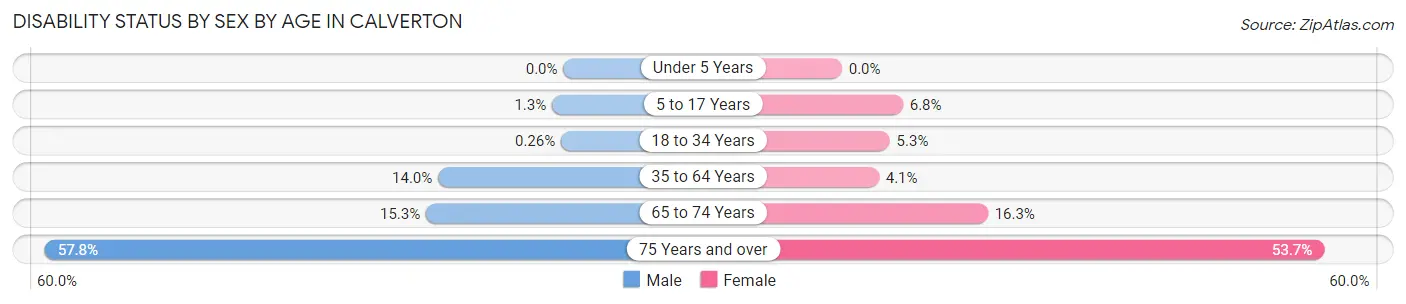
| Age Bracket | Male | Female |
| Under 5 Years | 0 (0.0%) | 0 (0.0%) |
| 5 to 17 Years | 14 (1.3%) | 143 (6.8%) |
| 18 to 34 Years | 5 (0.3%) | 77 (5.3%) |
| 35 to 64 Years | 472 (14.0%) | 140 (4.1%) |
| 65 to 74 Years | 109 (15.3%) | 151 (16.3%) |
| 75 Years and over | 492 (57.8%) | 666 (53.7%) |
Disability Class by Sex by Age in Calverton
Disability Class: Hearing Difficulty
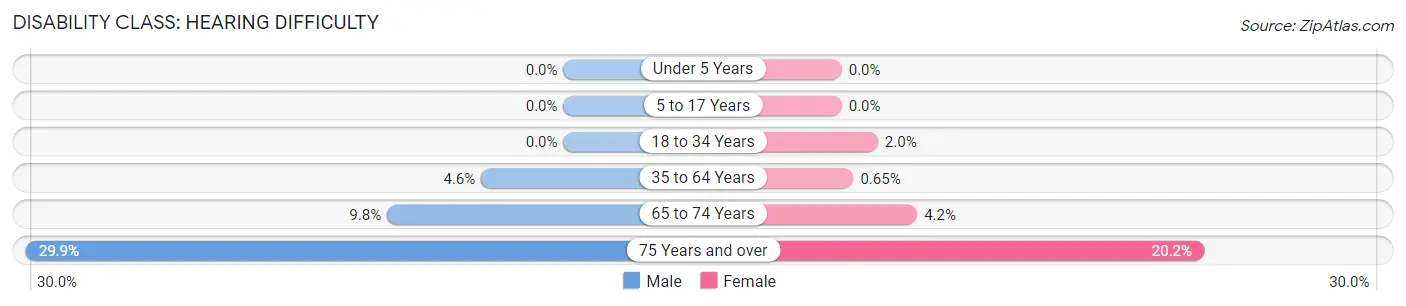
| Age Bracket | Male | Female |
| Under 5 Years | 0 (0.0%) | 0 (0.0%) |
| 5 to 17 Years | 0 (0.0%) | 0 (0.0%) |
| 18 to 34 Years | 0 (0.0%) | 29 (2.0%) |
| 35 to 64 Years | 155 (4.6%) | 22 (0.6%) |
| 65 to 74 Years | 70 (9.8%) | 39 (4.2%) |
| 75 Years and over | 255 (29.9%) | 250 (20.2%) |
Disability Class: Vision Difficulty
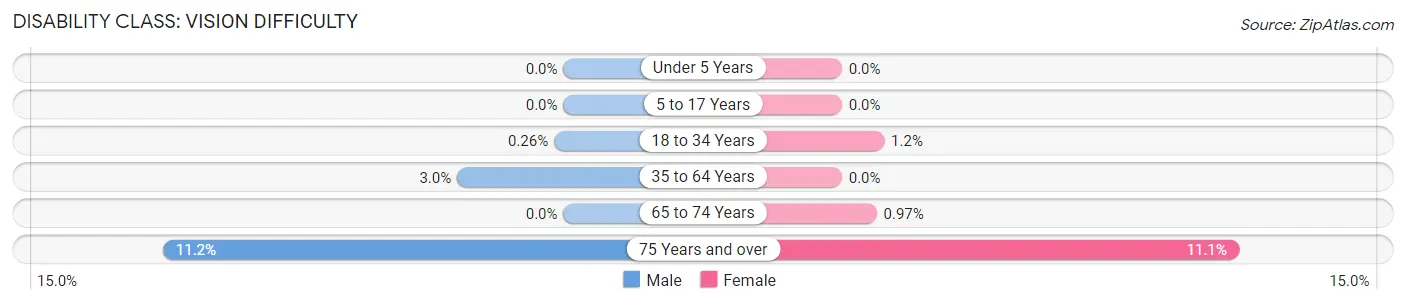
| Age Bracket | Male | Female |
| Under 5 Years | 0 (0.0%) | 0 (0.0%) |
| 5 to 17 Years | 0 (0.0%) | 0 (0.0%) |
| 18 to 34 Years | 5 (0.3%) | 17 (1.2%) |
| 35 to 64 Years | 100 (3.0%) | 0 (0.0%) |
| 65 to 74 Years | 0 (0.0%) | 9 (1.0%) |
| 75 Years and over | 95 (11.2%) | 137 (11.1%) |
Disability Class: Cognitive Difficulty
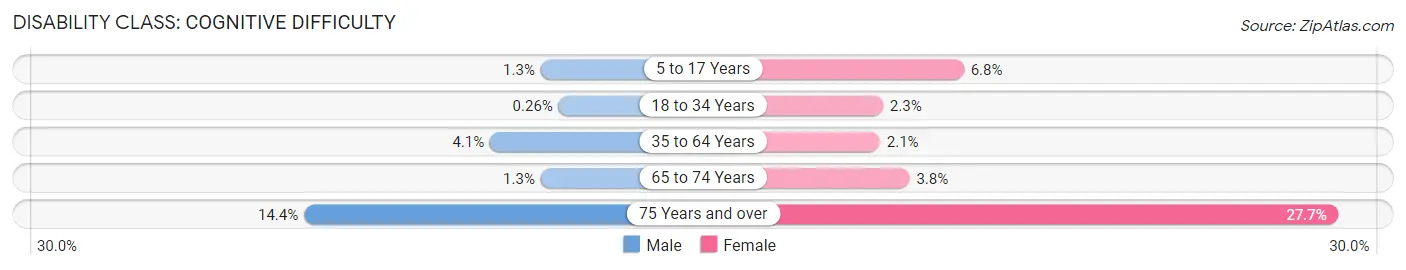
| Age Bracket | Male | Female |
| 5 to 17 Years | 14 (1.3%) | 143 (6.8%) |
| 18 to 34 Years | 5 (0.3%) | 33 (2.3%) |
| 35 to 64 Years | 138 (4.1%) | 72 (2.1%) |
| 65 to 74 Years | 9 (1.3%) | 35 (3.8%) |
| 75 Years and over | 123 (14.4%) | 343 (27.7%) |
Disability Class: Ambulatory Difficulty
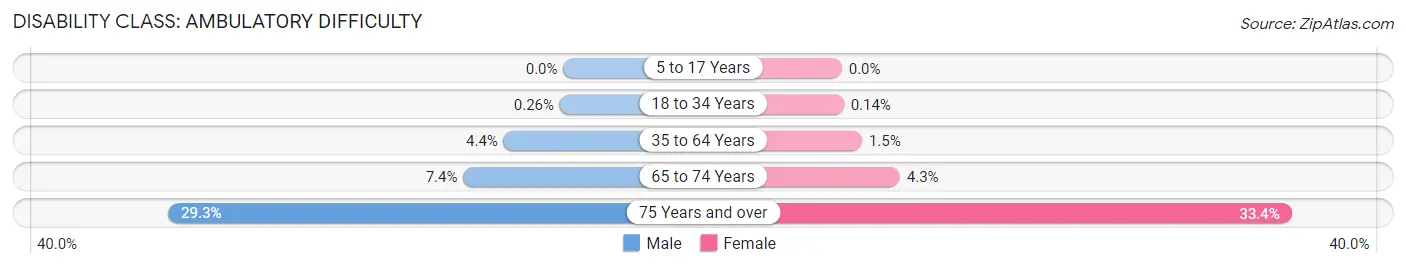
| Age Bracket | Male | Female |
| 5 to 17 Years | 0 (0.0%) | 0 (0.0%) |
| 18 to 34 Years | 5 (0.3%) | 2 (0.1%) |
| 35 to 64 Years | 150 (4.4%) | 51 (1.5%) |
| 65 to 74 Years | 53 (7.4%) | 40 (4.3%) |
| 75 Years and over | 250 (29.3%) | 414 (33.4%) |
Disability Class: Self-Care Difficulty
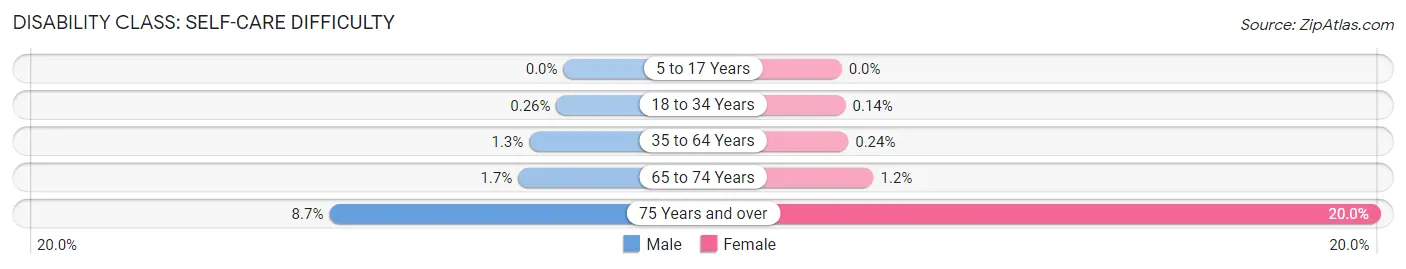
| Age Bracket | Male | Female |
| 5 to 17 Years | 0 (0.0%) | 0 (0.0%) |
| 18 to 34 Years | 5 (0.3%) | 2 (0.1%) |
| 35 to 64 Years | 43 (1.3%) | 8 (0.2%) |
| 65 to 74 Years | 12 (1.7%) | 11 (1.2%) |
| 75 Years and over | 74 (8.7%) | 248 (20.0%) |
Technology Access in Calverton
Computing Device Access in Calverton
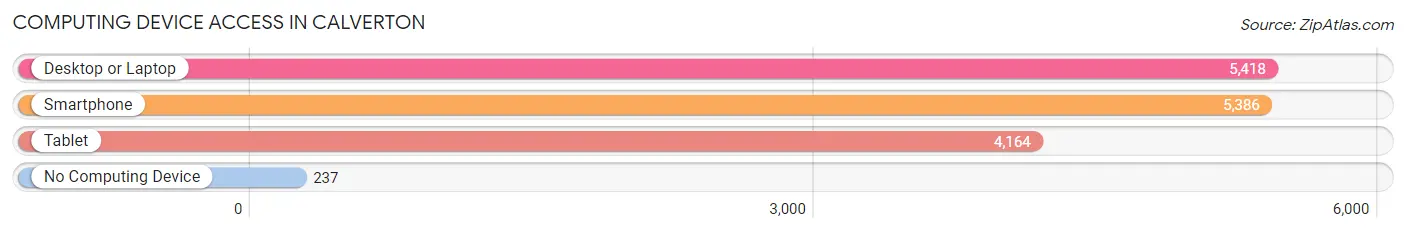
| Device Type | # Households | % Households |
| Desktop or Laptop | 5,418 | 88.3% |
| Smartphone | 5,386 | 87.7% |
| Tablet | 4,164 | 67.8% |
| No Computing Device | 237 | 3.9% |
| Total | 6,139 | 100.0% |
Internet Access in Calverton
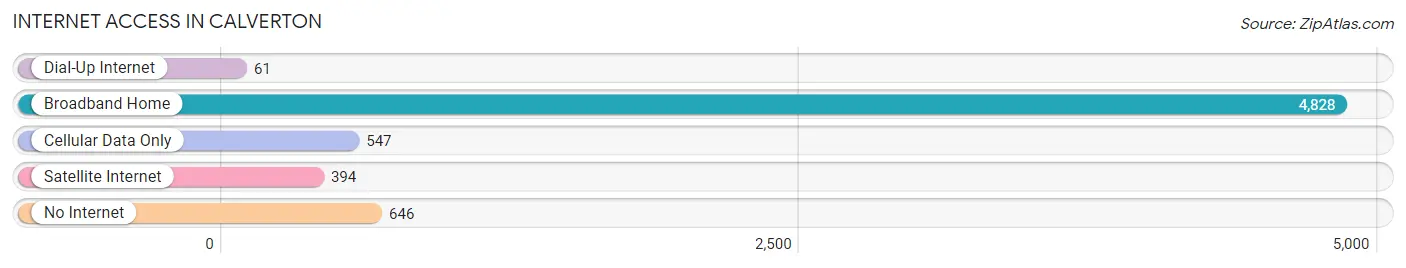
| Internet Type | # Households | % Households |
| Dial-Up Internet | 61 | 1.0% |
| Broadband Home | 4,828 | 78.6% |
| Cellular Data Only | 547 | 8.9% |
| Satellite Internet | 394 | 6.4% |
| No Internet | 646 | 10.5% |
| Total | 6,139 | 100.0% |
Calverton Summary
Calverton, Maryland is a small unincorporated community located in Prince George’s County, Maryland. It is situated in the southeastern corner of the county, just north of the Patuxent River and south of the Washington, D.C. metropolitan area. The community is bordered by the towns of Bowie, Upper Marlboro, and Clinton.
History
Calverton was first settled in the late 1700s by a group of Quakers from Pennsylvania. The community was originally known as “Calvert’s Town” after the family of William Calvert, who owned a large tract of land in the area. The town was officially incorporated in 1872 and was named Calverton in honor of the Calvert family.
In the late 1800s, Calverton was a thriving agricultural community. The town was home to several farms, a general store, a post office, and a school. In the early 1900s, the town began to experience a period of growth and development. The town was connected to the Washington, D.C. metropolitan area by the Washington, Baltimore and Annapolis Electric Railway in 1908.
In the mid-1900s, Calverton began to experience a period of decline. The town’s population decreased as residents moved to larger cities in search of better job opportunities. The town’s economy also suffered as the agricultural industry declined.
Geography
Calverton is located in the southeastern corner of Prince George’s County, Maryland. It is situated just north of the Patuxent River and south of the Washington, D.C. metropolitan area. The community is bordered by the towns of Bowie, Upper Marlboro, and Clinton.
The town is located in a rural area and is surrounded by farmland and wooded areas. The terrain is mostly flat with some rolling hills. The climate is humid subtropical with hot, humid summers and mild winters.
Economy
Calverton’s economy is largely based on agriculture. The town is home to several farms that produce a variety of crops, including corn, soybeans, wheat, and hay. The town is also home to several small businesses, including a general store, a post office, and a school.
Demographics
As of the 2010 census, Calverton had a population of 1,845. The racial makeup of the town was 79.3% White, 15.2% African American, 0.7% Native American, 0.7% Asian, 0.1% Pacific Islander, and 3.9% from other races. The median household income was $60,938 and the median family income was $68,750.
Calverton is a small, rural community with a close-knit community. The town is home to a variety of churches, including Baptist, Methodist, and Catholic. The town also has a volunteer fire department and a community center.
Common Questions
What is Per Capita Income in Calverton?
Per Capita income in Calverton is $42,167.
What is the Median Family Income in Calverton?
Median Family Income in Calverton is $117,234.
What is the Median Household income in Calverton?
Median Household Income in Calverton is $103,781.
What is Income or Wage Gap in Calverton?
Income or Wage Gap in Calverton is 0.1%.
Women in Calverton earn 99.9 cents for every dollar earned by a man.
What is Inequality or Gini Index in Calverton?
Inequality or Gini Index in Calverton is 0.38.
What is the Total Population of Calverton?
Total Population of Calverton is 18,324.
What is the Total Male Population of Calverton?
Total Male Population of Calverton is 8,514.
What is the Total Female Population of Calverton?
Total Female Population of Calverton is 9,810.
What is the Ratio of Males per 100 Females in Calverton?
There are 86.79 Males per 100 Females in Calverton.
What is the Ratio of Females per 100 Males in Calverton?
There are 115.22 Females per 100 Males in Calverton.
What is the Median Population Age in Calverton?
Median Population Age in Calverton is 42.2 Years.
What is the Average Family Size in Calverton
Average Family Size in Calverton is 3.5 People.
What is the Average Household Size in Calverton
Average Household Size in Calverton is 2.9 People.
How Large is the Labor Force in Calverton?
There are 9,232 People in the Labor Forcein in Calverton.
What is the Percentage of People in the Labor Force in Calverton?
63.4% of People are in the Labor Force in Calverton.
What is the Unemployment Rate in Calverton?
Unemployment Rate in Calverton is 6.1%.