Peppermill Village, MD Map & Demographics
Peppermill Village Map
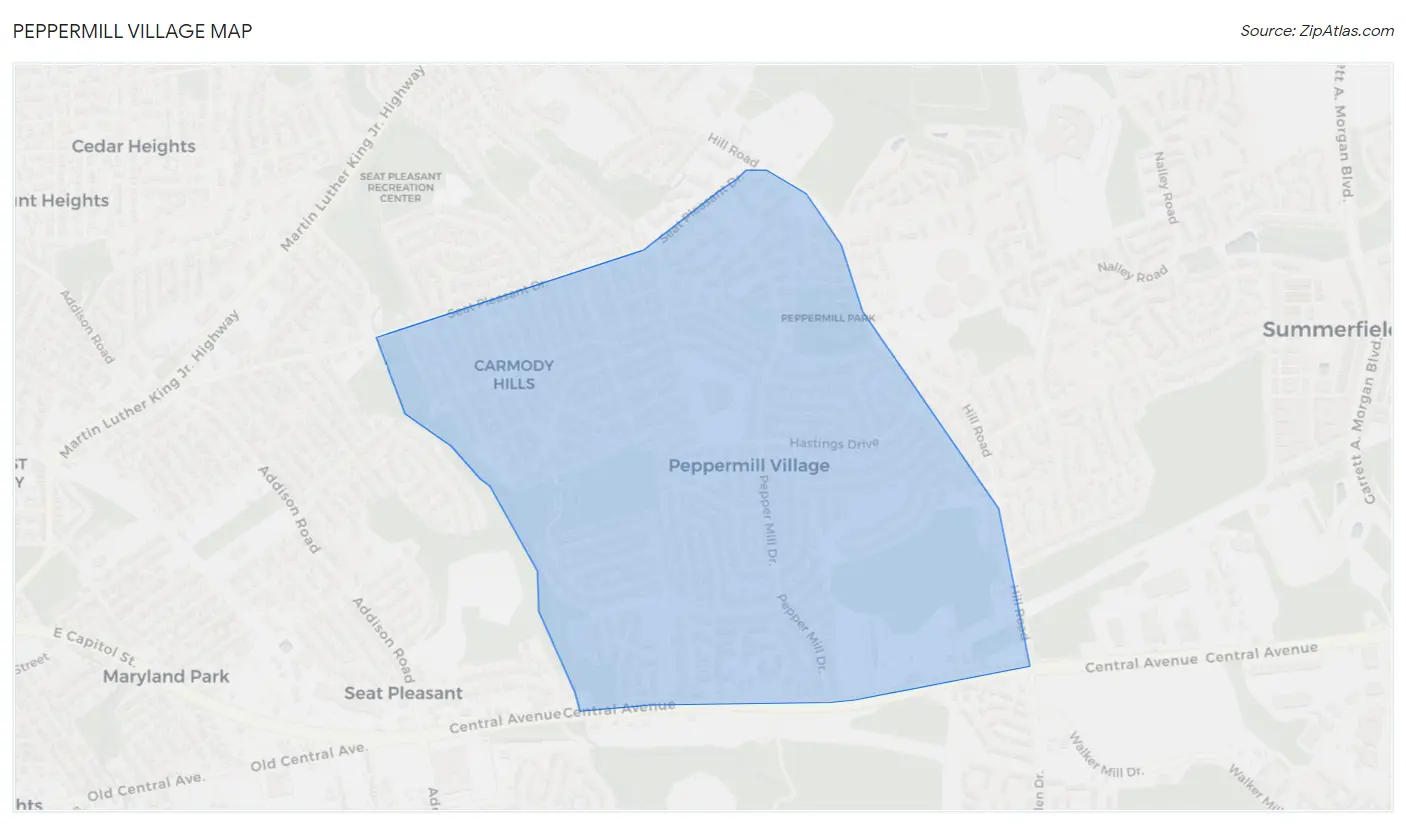
Peppermill Village Overview
$36,542
PER CAPITA INCOME
$102,570
AVG FAMILY INCOME
$88,250
AVG HOUSEHOLD INCOME
30.1%
WAGE / INCOME GAP [ % ]
69.9¢/ $1
WAGE / INCOME GAP [ $ ]
0.35
INEQUALITY / GINI INDEX
5,633
TOTAL POPULATION
2,638
MALE POPULATION
2,995
FEMALE POPULATION
88.08
MALES / 100 FEMALES
113.53
FEMALES / 100 MALES
37.9
MEDIAN AGE
3.6
AVG FAMILY SIZE
3.0
AVG HOUSEHOLD SIZE
2,865
LABOR FORCE [ PEOPLE ]
63.9%
PERCENT IN LABOR FORCE
9.8%
UNEMPLOYMENT RATE
Income in Peppermill Village
Income Overview in Peppermill Village
Per Capita Income in Peppermill Village is $36,542, while median incomes of families and households are $102,570 and $88,250 respectively.
| Characteristic | Number | Measure |
| Per Capita Income | 5,633 | $36,542 |
| Median Family Income | 1,388 | $102,570 |
| Mean Family Income | 1,388 | $112,761 |
| Median Household Income | 1,862 | $88,250 |
| Mean Household Income | 1,862 | $105,359 |
| Income Deficit | 1,388 | $0 |
| Wage / Income Gap (%) | 5,633 | 30.07% |
| Wage / Income Gap ($) | 5,633 | 69.93¢ per $1 |
| Gini / Inequality Index | 5,633 | 0.35 |
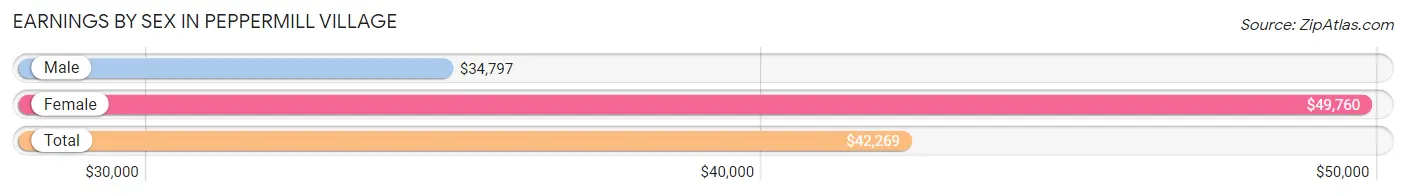
Earnings by Sex in Peppermill Village
Average Earnings in Peppermill Village are $42,269, $34,797 for men and $49,760 for women, a difference of 30.1%.
| Sex | Number | Average Earnings |
| Male | 1,449 (51.0%) | $34,797 |
| Female | 1,393 (49.0%) | $49,760 |
| Total | 2,842 (100.0%) | $42,269 |
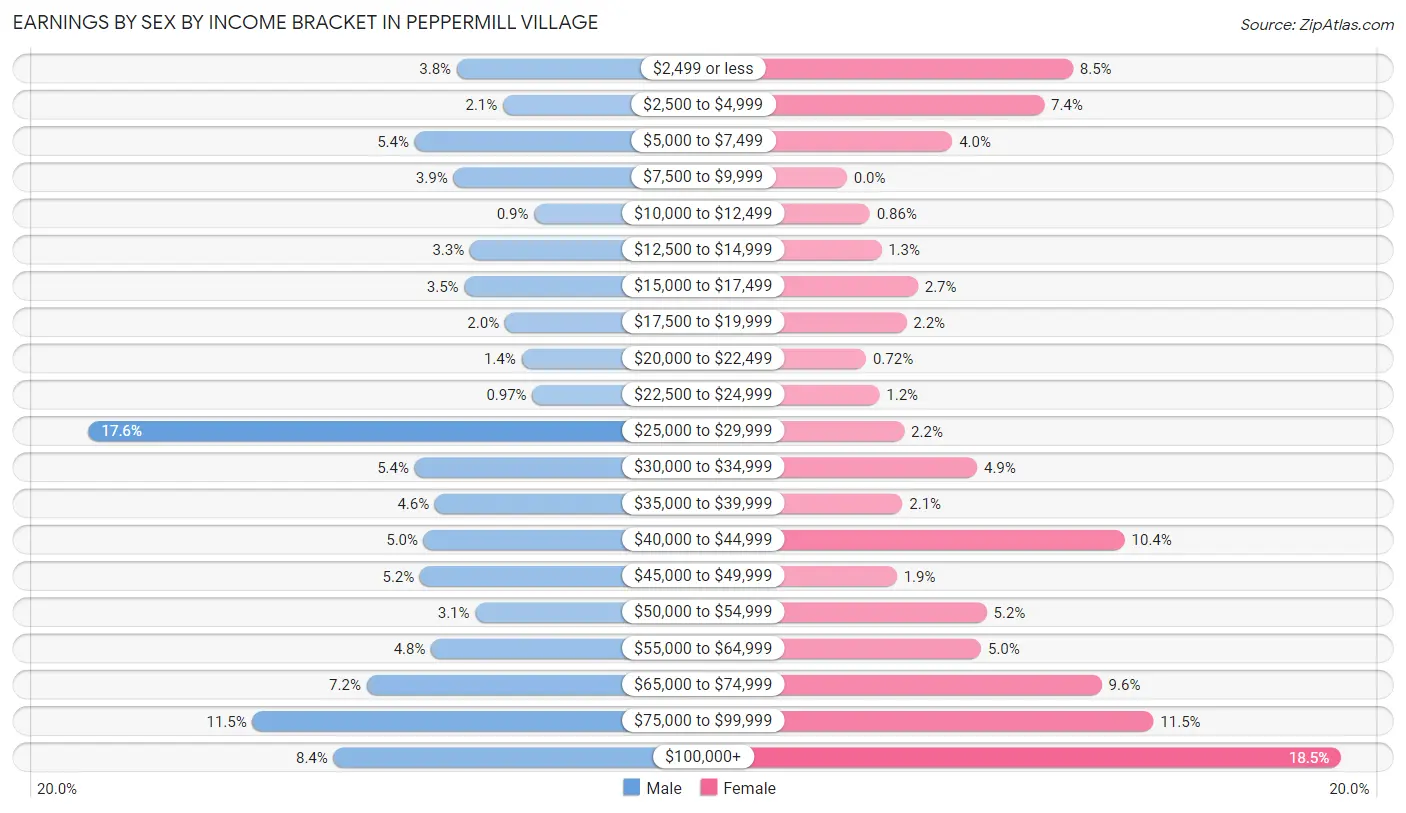
Earnings by Sex by Income Bracket in Peppermill Village
The most common earnings brackets in Peppermill Village are $25,000 to $29,999 for men (255 | 17.6%) and $100,000+ for women (258 | 18.5%).
| Income | Male | Female |
| $2,499 or less | 55 (3.8%) | 118 (8.5%) |
| $2,500 to $4,999 | 30 (2.1%) | 103 (7.4%) |
| $5,000 to $7,499 | 78 (5.4%) | 55 (4.0%) |
| $7,500 to $9,999 | 57 (3.9%) | 0 (0.0%) |
| $10,000 to $12,499 | 13 (0.9%) | 12 (0.9%) |
| $12,500 to $14,999 | 48 (3.3%) | 18 (1.3%) |
| $15,000 to $17,499 | 51 (3.5%) | 37 (2.7%) |
| $17,500 to $19,999 | 29 (2.0%) | 31 (2.2%) |
| $20,000 to $22,499 | 20 (1.4%) | 10 (0.7%) |
| $22,500 to $24,999 | 14 (1.0%) | 17 (1.2%) |
| $25,000 to $29,999 | 255 (17.6%) | 30 (2.1%) |
| $30,000 to $34,999 | 78 (5.4%) | 68 (4.9%) |
| $35,000 to $39,999 | 67 (4.6%) | 29 (2.1%) |
| $40,000 to $44,999 | 73 (5.0%) | 145 (10.4%) |
| $45,000 to $49,999 | 75 (5.2%) | 26 (1.9%) |
| $50,000 to $54,999 | 45 (3.1%) | 73 (5.2%) |
| $55,000 to $64,999 | 69 (4.8%) | 70 (5.0%) |
| $65,000 to $74,999 | 104 (7.2%) | 133 (9.6%) |
| $75,000 to $99,999 | 166 (11.5%) | 160 (11.5%) |
| $100,000+ | 122 (8.4%) | 258 (18.5%) |
| Total | 1,449 (100.0%) | 1,393 (100.0%) |
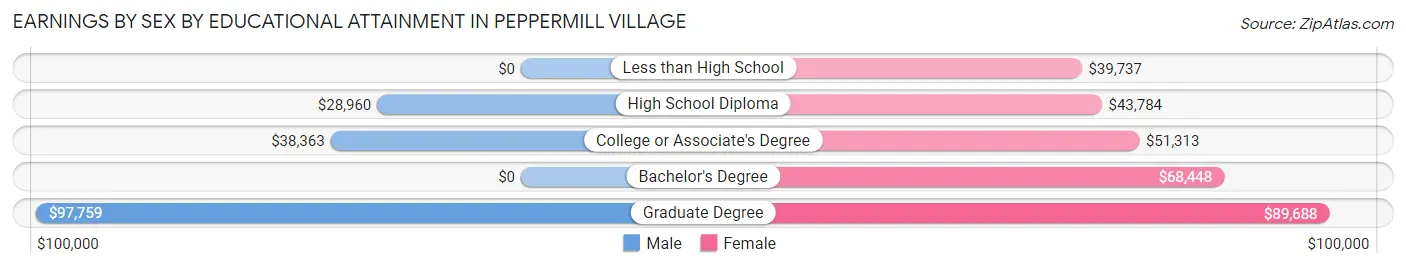
Earnings by Sex by Educational Attainment in Peppermill Village
Average earnings in Peppermill Village are $38,313 for men and $64,449 for women, a difference of 40.6%. Men with an educational attainment of graduate degree enjoy the highest average annual earnings of $97,759, while those with high school diploma education earn the least with $28,960. Women with an educational attainment of graduate degree earn the most with the average annual earnings of $89,688, while those with less than high school education have the smallest earnings of $39,737.
| Educational Attainment | Male Income | Female Income |
| Less than High School | - | - |
| High School Diploma | $28,960 | $43,784 |
| College or Associate's Degree | $38,363 | $51,313 |
| Bachelor's Degree | - | - |
| Graduate Degree | $97,759 | $89,688 |
| Total | $38,313 | $64,449 |
Family Income in Peppermill Village
Family Income Brackets in Peppermill Village
According to the Peppermill Village family income data, there are 486 families falling into the $100,000 to $149,999 income range, which is the most common income bracket and makes up 35.0% of all families. Conversely, the $10,000 to $14,999 income bracket is the least frequent group with only 12 families (0.9%) belonging to this category.
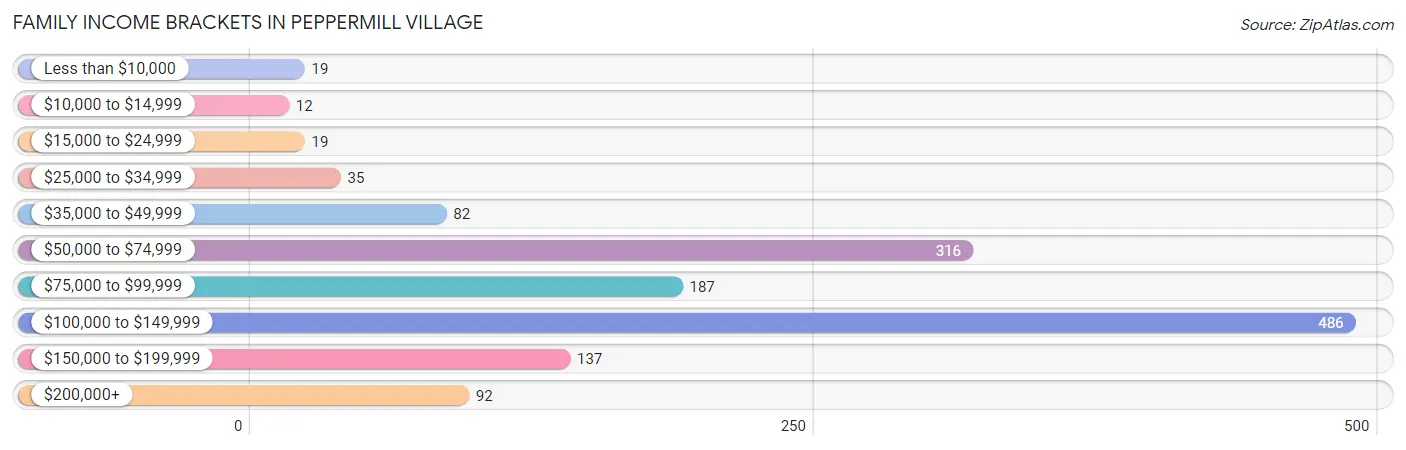
| Income Bracket | # Families | % Families |
| Less than $10,000 | 19 | 1.4% |
| $10,000 to $14,999 | 12 | 0.9% |
| $15,000 to $24,999 | 19 | 1.4% |
| $25,000 to $34,999 | 35 | 2.5% |
| $35,000 to $49,999 | 82 | 5.9% |
| $50,000 to $74,999 | 316 | 22.8% |
| $75,000 to $99,999 | 187 | 13.5% |
| $100,000 to $149,999 | 486 | 35.0% |
| $150,000 to $199,999 | 137 | 9.9% |
| $200,000+ | 92 | 6.6% |
Family Income by Famaliy Size in Peppermill Village
3-person families (350 | 25.2%) account for the highest median family income in Peppermill Village with $120,132 per family, while 2-person families (513 | 37.0%) have the highest median income of $51,986 per family member.
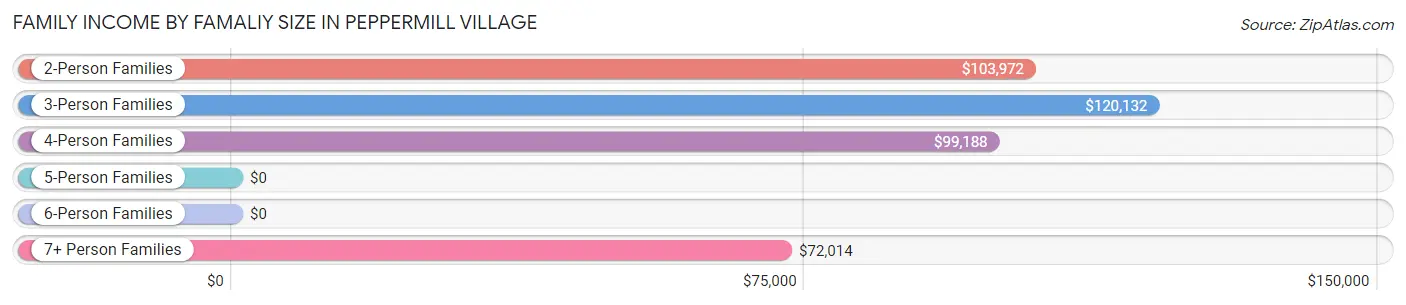
| Income Bracket | # Families | Median Income |
| 2-Person Families | 513 (37.0%) | $103,972 |
| 3-Person Families | 350 (25.2%) | $120,132 |
| 4-Person Families | 244 (17.6%) | $99,188 |
| 5-Person Families | 150 (10.8%) | $0 |
| 6-Person Families | 73 (5.3%) | $0 |
| 7+ Person Families | 58 (4.2%) | $72,014 |
| Total | 1,388 (100.0%) | $102,570 |
Family Income by Number of Earners in Peppermill Village
The median family income in Peppermill Village is $102,570, with families comprising 3+ earners (211) having the highest median family income of $123,958, while families with no earners (184) have the lowest median family income of $69,792, accounting for 15.2% and 13.3% of families, respectively.
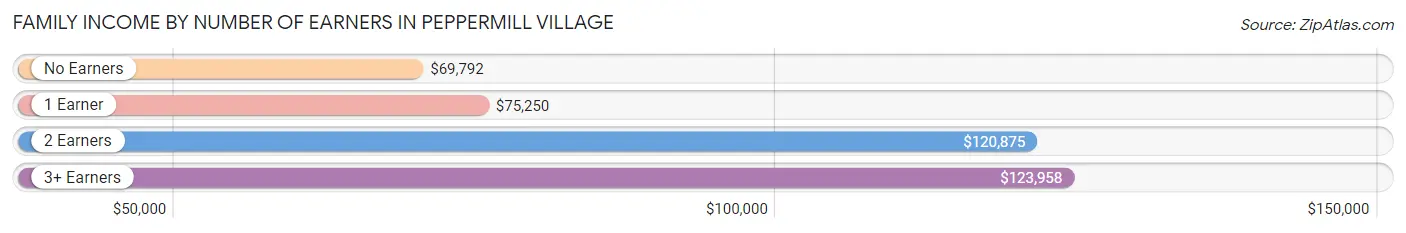
| Number of Earners | # Families | Median Income |
| No Earners | 184 (13.3%) | $69,792 |
| 1 Earner | 511 (36.8%) | $75,250 |
| 2 Earners | 482 (34.7%) | $120,875 |
| 3+ Earners | 211 (15.2%) | $123,958 |
| Total | 1,388 (100.0%) | $102,570 |
Household Income in Peppermill Village
Household Income Brackets in Peppermill Village
With 538 households falling in the category, the $100,000 to $149,999 income range is the most frequent in Peppermill Village, accounting for 28.9% of all households. In contrast, only 19 households (1.0%) fall into the $15,000 to $24,999 income bracket, making it the least populous group.
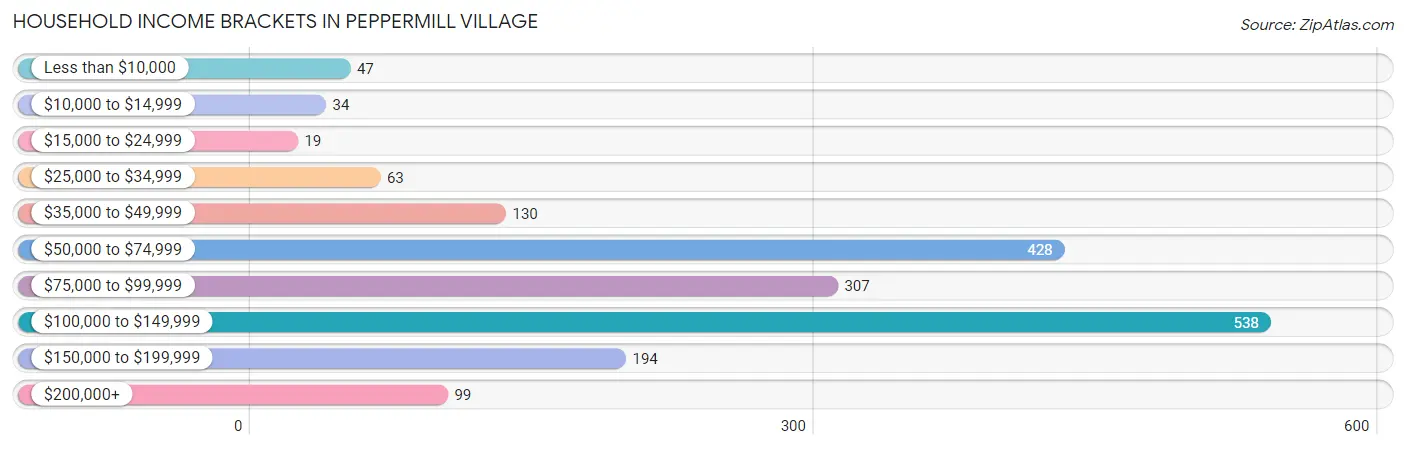
| Income Bracket | # Households | % Households |
| Less than $10,000 | 47 | 2.5% |
| $10,000 to $14,999 | 34 | 1.8% |
| $15,000 to $24,999 | 19 | 1.0% |
| $25,000 to $34,999 | 63 | 3.4% |
| $35,000 to $49,999 | 130 | 7.0% |
| $50,000 to $74,999 | 428 | 23.0% |
| $75,000 to $99,999 | 307 | 16.5% |
| $100,000 to $149,999 | 538 | 28.9% |
| $150,000 to $199,999 | 194 | 10.4% |
| $200,000+ | 99 | 5.3% |
Household Income by Householder Age in Peppermill Village
The median household income in Peppermill Village is $88,250, with the highest median household income of $106,625 found in the 25 to 44 years age bracket for the primary householder. A total of 556 households (29.9%) fall into this category. Meanwhile, the 15 to 24 years age bracket for the primary householder has the lowest median household income of $0, with 8 households (0.4%) in this group.
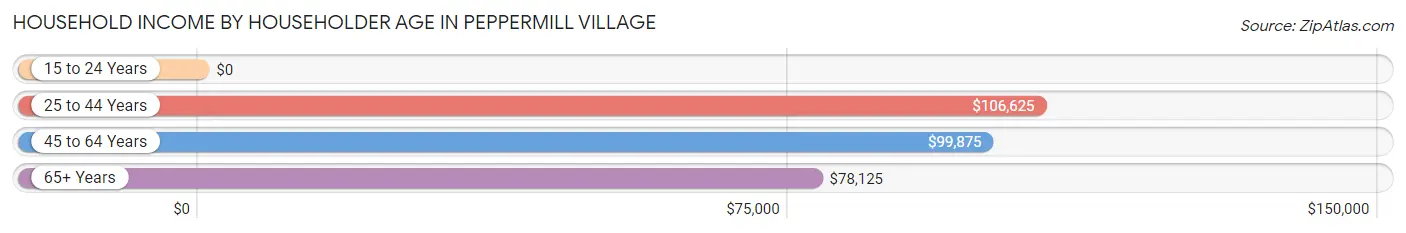
| Income Bracket | # Households | Median Income |
| 15 to 24 Years | 8 (0.4%) | $0 |
| 25 to 44 Years | 556 (29.9%) | $106,625 |
| 45 to 64 Years | 642 (34.5%) | $99,875 |
| 65+ Years | 656 (35.2%) | $78,125 |
| Total | 1,862 (100.0%) | $88,250 |
Poverty in Peppermill Village
Income Below Poverty by Sex and Age in Peppermill Village
With 3.8% poverty level for males and 3.3% for females among the residents of Peppermill Village, 6 to 11 year old males and 12 to 14 year old females are the most vulnerable to poverty, with 28 males (14.1%) and 8 females (16.7%) in their respective age groups living below the poverty level.
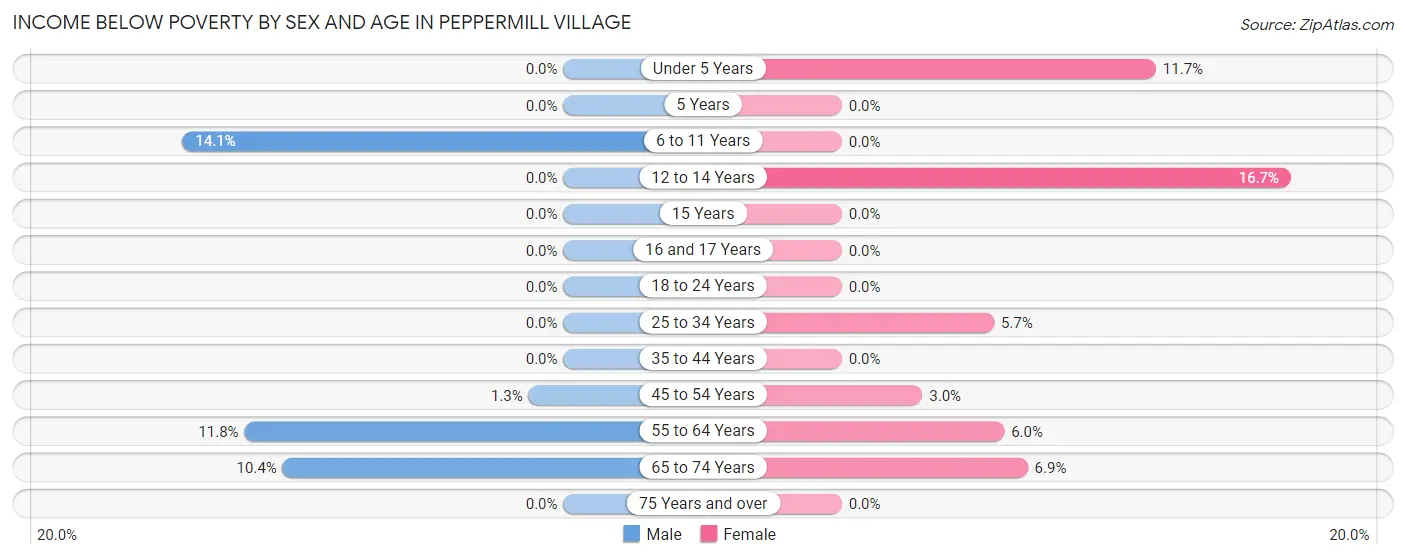
| Age Bracket | Male | Female |
| Under 5 Years | 0 (0.0%) | 19 (11.7%) |
| 5 Years | 0 (0.0%) | 0 (0.0%) |
| 6 to 11 Years | 28 (14.1%) | 0 (0.0%) |
| 12 to 14 Years | 0 (0.0%) | 8 (16.7%) |
| 15 Years | 0 (0.0%) | 0 (0.0%) |
| 16 and 17 Years | 0 (0.0%) | 0 (0.0%) |
| 18 to 24 Years | 0 (0.0%) | 0 (0.0%) |
| 25 to 34 Years | 0 (0.0%) | 20 (5.7%) |
| 35 to 44 Years | 0 (0.0%) | 0 (0.0%) |
| 45 to 54 Years | 4 (1.3%) | 12 (3.0%) |
| 55 to 64 Years | 38 (11.8%) | 22 (6.0%) |
| 65 to 74 Years | 30 (10.4%) | 18 (6.9%) |
| 75 Years and over | 0 (0.0%) | 0 (0.0%) |
| Total | 100 (3.8%) | 99 (3.3%) |
Income Above Poverty by Sex and Age in Peppermill Village
According to the poverty statistics in Peppermill Village, males aged under 5 years and females aged 5 years are the age groups that are most secure financially, with 100.0% of males and 100.0% of females in these age groups living above the poverty line.
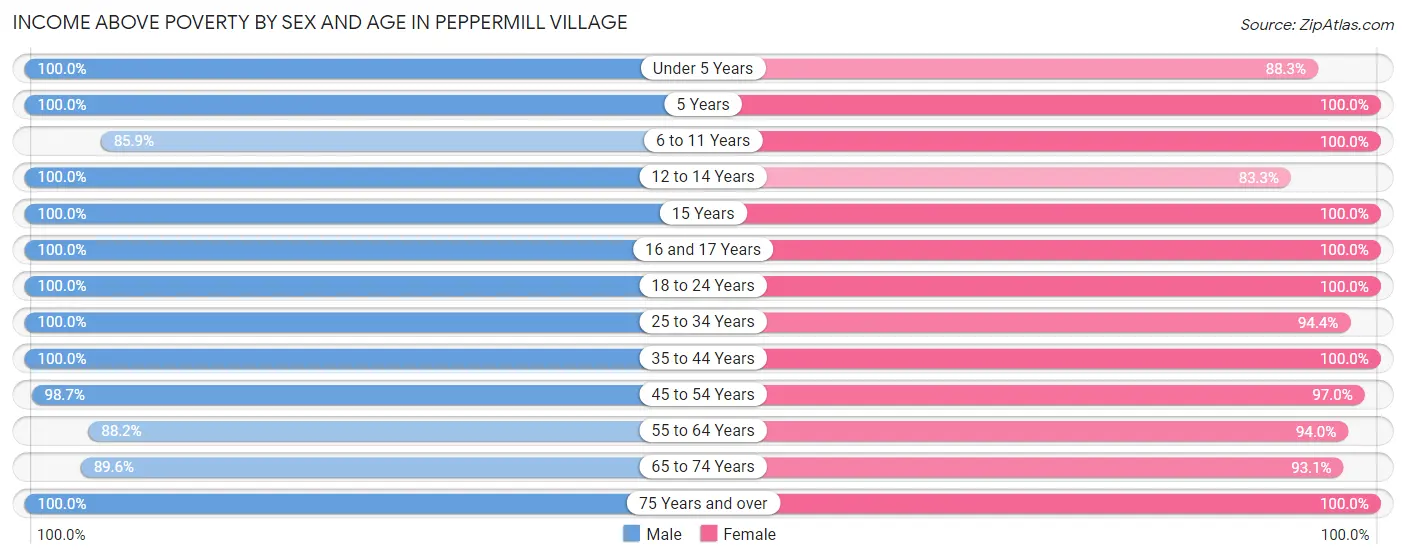
| Age Bracket | Male | Female |
| Under 5 Years | 125 (100.0%) | 144 (88.3%) |
| 5 Years | 85 (100.0%) | 100 (100.0%) |
| 6 to 11 Years | 170 (85.9%) | 168 (100.0%) |
| 12 to 14 Years | 119 (100.0%) | 40 (83.3%) |
| 15 Years | 61 (100.0%) | 37 (100.0%) |
| 16 and 17 Years | 82 (100.0%) | 115 (100.0%) |
| 18 to 24 Years | 112 (100.0%) | 321 (100.0%) |
| 25 to 34 Years | 476 (100.0%) | 334 (94.4%) |
| 35 to 44 Years | 266 (100.0%) | 383 (100.0%) |
| 45 to 54 Years | 305 (98.7%) | 389 (97.0%) |
| 55 to 64 Years | 283 (88.2%) | 343 (94.0%) |
| 65 to 74 Years | 258 (89.6%) | 243 (93.1%) |
| 75 Years and over | 173 (100.0%) | 257 (100.0%) |
| Total | 2,515 (96.2%) | 2,874 (96.7%) |
Income Below Poverty Among Married-Couple Families in Peppermill Village
The poverty statistics for married-couple families in Peppermill Village show that 3.3% or 23 of the total 708 families live below the poverty line. Families with 1 or 2 children have the highest poverty rate of 5.5%, comprising of 10 families. On the other hand, families with 3 or 4 children have the lowest poverty rate of 0.0%, which includes 0 families.
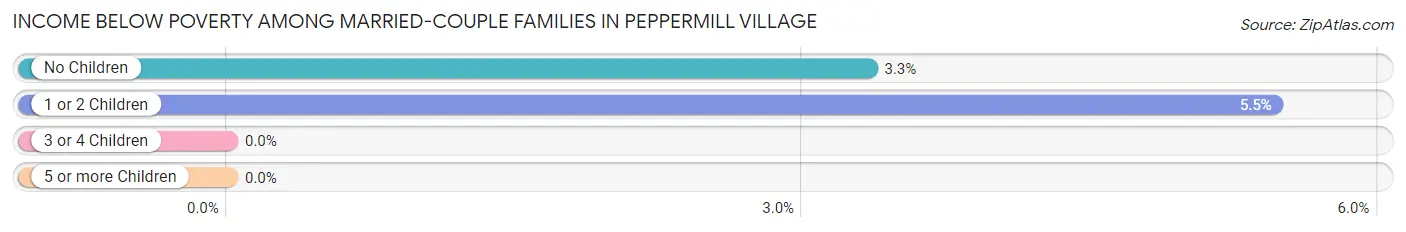
| Children | Above Poverty | Below Poverty |
| No Children | 376 (96.7%) | 13 (3.3%) |
| 1 or 2 Children | 173 (94.5%) | 10 (5.5%) |
| 3 or 4 Children | 136 (100.0%) | 0 (0.0%) |
| 5 or more Children | 0 (0.0%) | 0 (0.0%) |
| Total | 685 (96.8%) | 23 (3.3%) |
Income Below Poverty Among Single-Parent Households in Peppermill Village
According to the poverty data in Peppermill Village, 5.6% or 11 single-father households and 1.7% or 8 single-mother households are living below the poverty line. Among single-father households, those with 1 or 2 children have the highest poverty rate, with 11 households (12.8%) experiencing poverty. Likewise, among single-mother households, those with 3 or 4 children have the highest poverty rate, with 8 households (7.9%) falling below the poverty line.
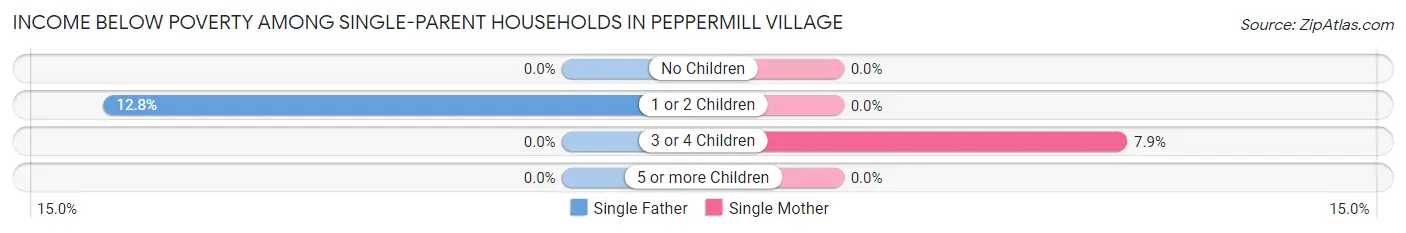
| Children | Single Father | Single Mother |
| No Children | 0 (0.0%) | 0 (0.0%) |
| 1 or 2 Children | 11 (12.8%) | 0 (0.0%) |
| 3 or 4 Children | 0 (0.0%) | 8 (7.9%) |
| 5 or more Children | 0 (0.0%) | 0 (0.0%) |
| Total | 11 (5.6%) | 8 (1.7%) |
Income Below Poverty Among Married-Couple vs Single-Parent Households in Peppermill Village
The poverty data for Peppermill Village shows that 23 of the married-couple family households (3.3%) and 19 of the single-parent households (2.8%) are living below the poverty level. Within the married-couple family households, those with 1 or 2 children have the highest poverty rate, with 10 households (5.5%) falling below the poverty line. Among the single-parent households, those with 3 or 4 children have the highest poverty rate, with 8 household (7.9%) living below poverty.
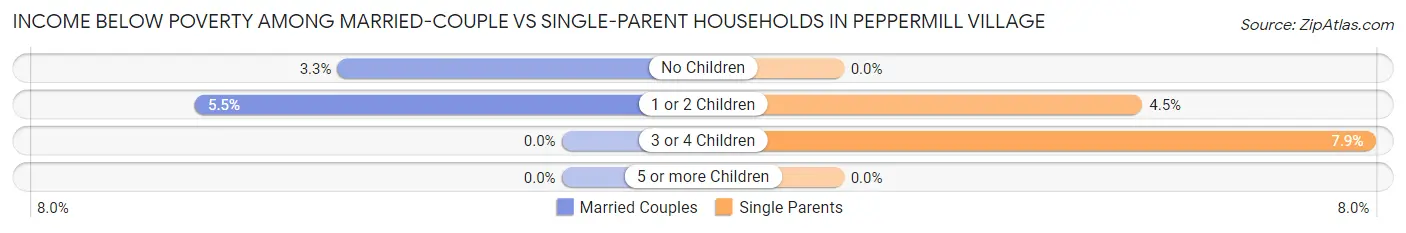
| Children | Married-Couple Families | Single-Parent Households |
| No Children | 13 (3.3%) | 0 (0.0%) |
| 1 or 2 Children | 10 (5.5%) | 11 (4.4%) |
| 3 or 4 Children | 0 (0.0%) | 8 (7.9%) |
| 5 or more Children | 0 (0.0%) | 0 (0.0%) |
| Total | 23 (3.3%) | 19 (2.8%) |
Race in Peppermill Village
The most populous races in Peppermill Village are Black / African American (4,632 | 82.2%), Hispanic or Latino (778 | 13.8%), and Some other Race (565 | 10.0%).
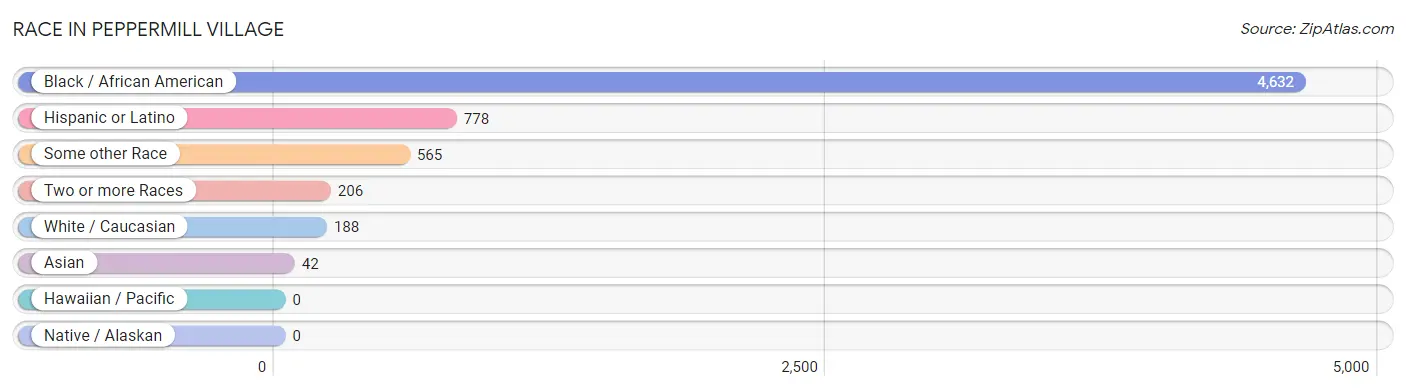
| Race | # Population | % Population |
| Asian | 42 | 0.7% |
| Black / African American | 4,632 | 82.2% |
| Hawaiian / Pacific | 0 | 0.0% |
| Hispanic or Latino | 778 | 13.8% |
| Native / Alaskan | 0 | 0.0% |
| White / Caucasian | 188 | 3.3% |
| Two or more Races | 206 | 3.7% |
| Some other Race | 565 | 10.0% |
| Total | 5,633 | 100.0% |
Ancestry in Peppermill Village
The most populous ancestries reported in Peppermill Village are Central American (703 | 12.5%), Salvadoran (454 | 8.1%), Subsaharan African (396 | 7.0%), African (197 | 3.5%), and American (134 | 2.4%), together accounting for 33.4% of all Peppermill Village residents.
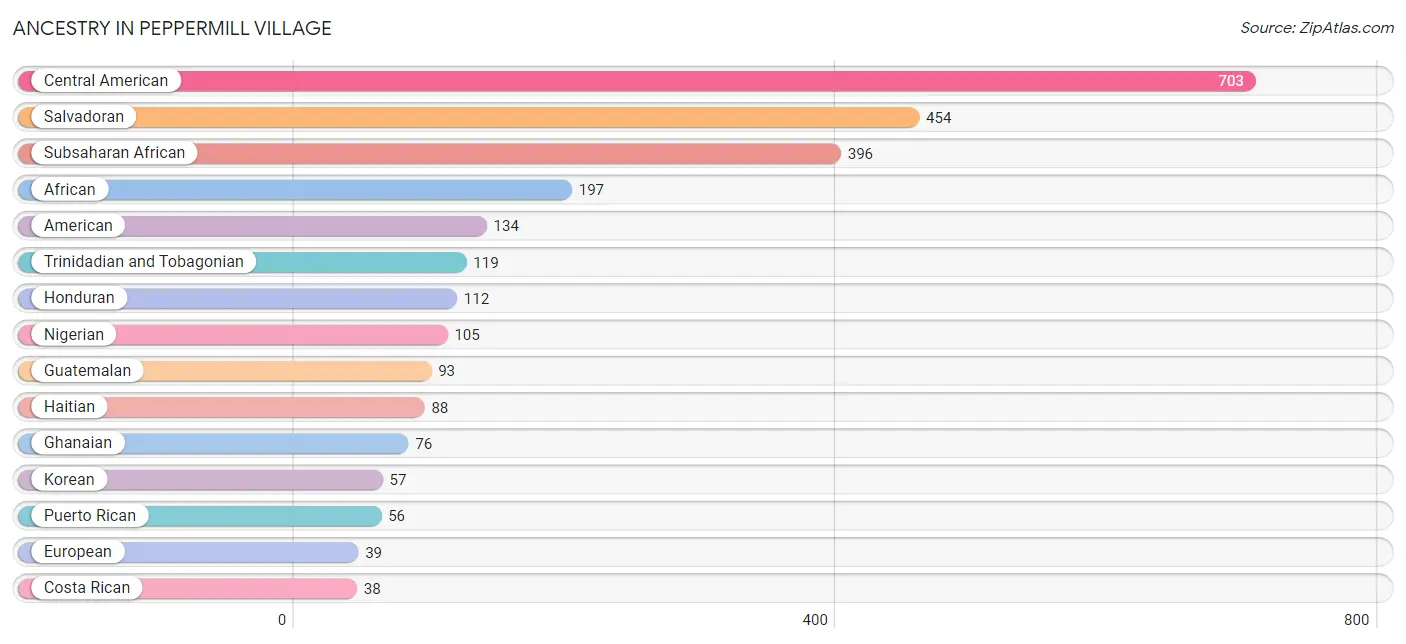
| Ancestry | # Population | % Population |
| African | 197 | 3.5% |
| American | 134 | 2.4% |
| British West Indian | 9 | 0.2% |
| Burmese | 30 | 0.5% |
| Central American | 703 | 12.5% |
| Cherokee | 10 | 0.2% |
| Costa Rican | 38 | 0.7% |
| English | 8 | 0.1% |
| European | 39 | 0.7% |
| French | 10 | 0.2% |
| German | 13 | 0.2% |
| Ghanaian | 76 | 1.3% |
| Guatemalan | 93 | 1.7% |
| Guyanese | 29 | 0.5% |
| Haitian | 88 | 1.6% |
| Honduran | 112 | 2.0% |
| Irish | 20 | 0.4% |
| Jamaican | 28 | 0.5% |
| Korean | 57 | 1.0% |
| Mexican | 11 | 0.2% |
| Nigerian | 105 | 1.9% |
| Panamanian | 6 | 0.1% |
| Puerto Rican | 56 | 1.0% |
| Salvadoran | 454 | 8.1% |
| Subsaharan African | 396 | 7.0% |
| Trinidadian and Tobagonian | 119 | 2.1% | View All 26 Rows |
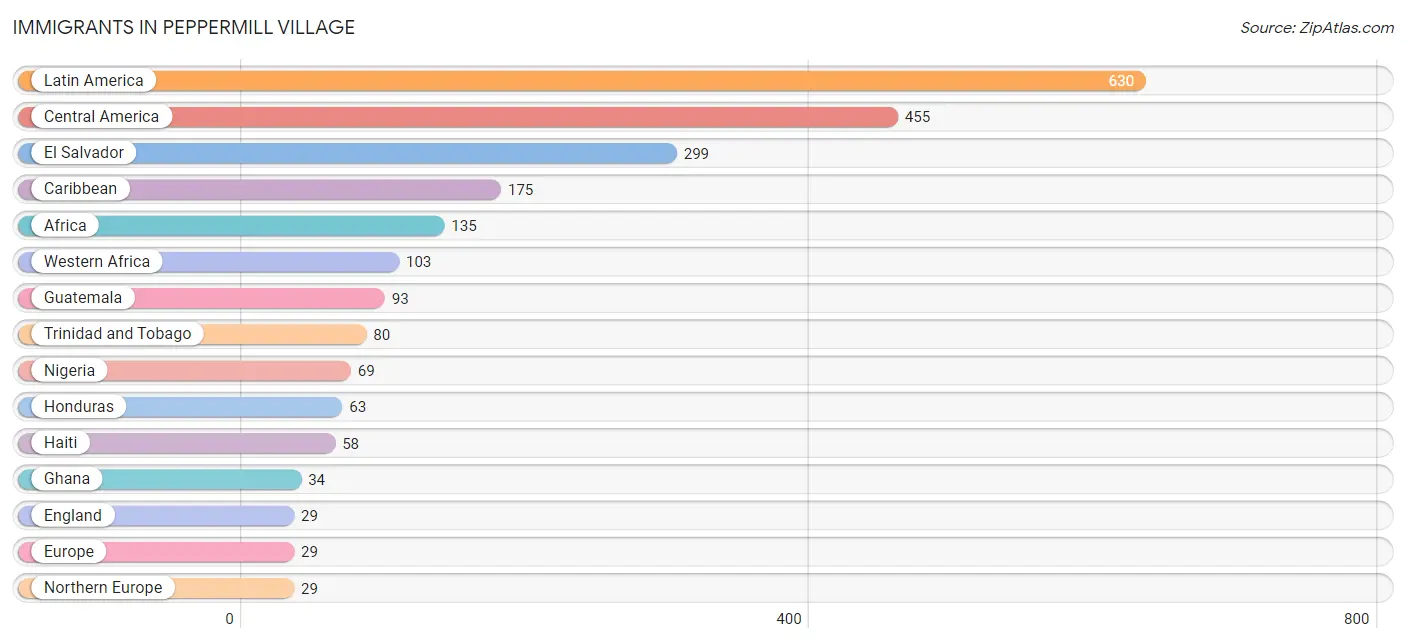
Immigrants in Peppermill Village
The most numerous immigrant groups reported in Peppermill Village came from Latin America (630 | 11.2%), Central America (455 | 8.1%), El Salvador (299 | 5.3%), Caribbean (175 | 3.1%), and Africa (135 | 2.4%), together accounting for 30.1% of all Peppermill Village residents.
| Immigration Origin | # Population | % Population |
| Africa | 135 | 2.4% |
| Asia | 11 | 0.2% |
| Cameroon | 18 | 0.3% |
| Caribbean | 175 | 3.1% |
| Central America | 455 | 8.1% |
| Eastern Africa | 14 | 0.3% |
| Eastern Asia | 11 | 0.2% |
| El Salvador | 299 | 5.3% |
| England | 29 | 0.5% |
| Europe | 29 | 0.5% |
| Ghana | 34 | 0.6% |
| Guatemala | 93 | 1.7% |
| Haiti | 58 | 1.0% |
| Honduras | 63 | 1.1% |
| Jamaica | 28 | 0.5% |
| Korea | 11 | 0.2% |
| Latin America | 630 | 11.2% |
| Middle Africa | 18 | 0.3% |
| Nigeria | 69 | 1.2% |
| Northern Europe | 29 | 0.5% |
| Trinidad and Tobago | 80 | 1.4% |
| Western Africa | 103 | 1.8% |
| Zimbabwe | 14 | 0.3% | View All 23 Rows |
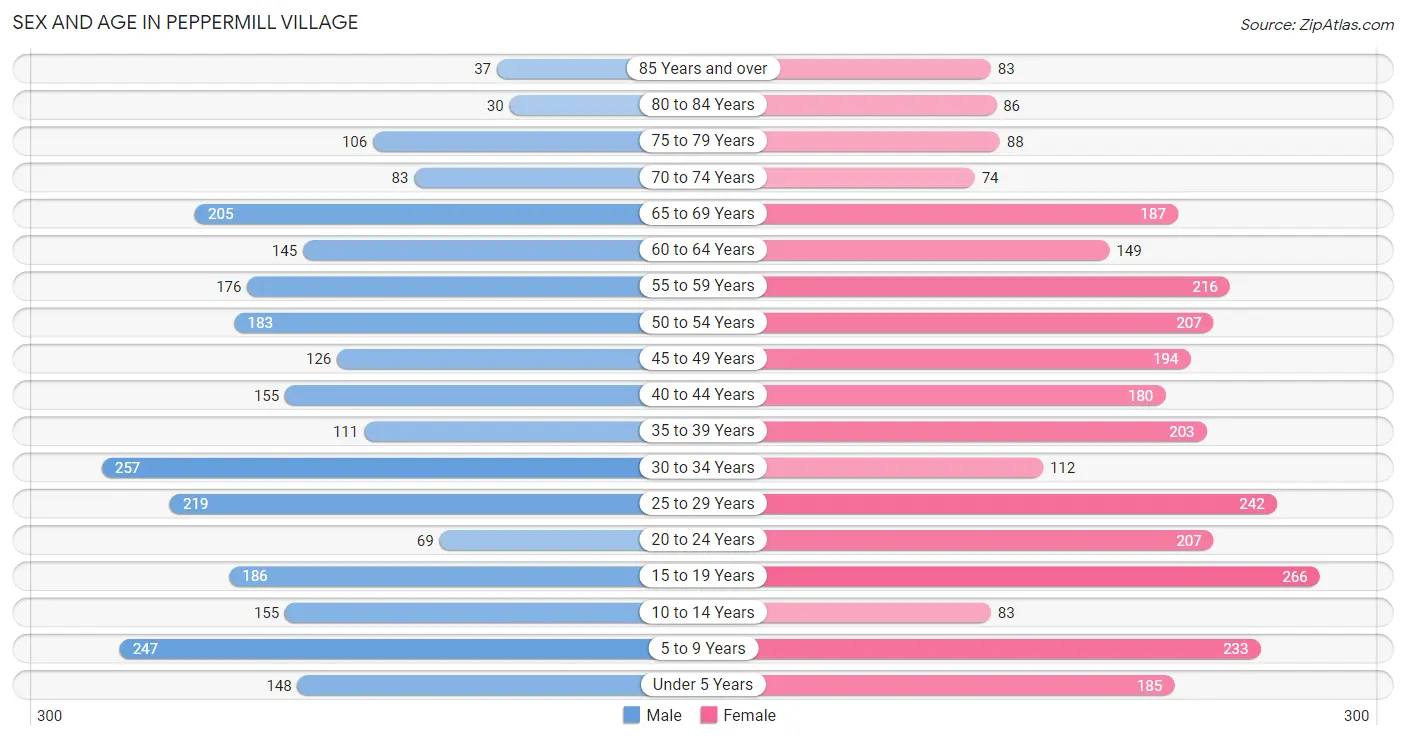
Sex and Age in Peppermill Village
Sex and Age in Peppermill Village
The most populous age groups in Peppermill Village are 30 to 34 Years (257 | 9.7%) for men and 15 to 19 Years (266 | 8.9%) for women.
| Age Bracket | Male | Female |
| Under 5 Years | 148 (5.6%) | 185 (6.2%) |
| 5 to 9 Years | 247 (9.4%) | 233 (7.8%) |
| 10 to 14 Years | 155 (5.9%) | 83 (2.8%) |
| 15 to 19 Years | 186 (7.0%) | 266 (8.9%) |
| 20 to 24 Years | 69 (2.6%) | 207 (6.9%) |
| 25 to 29 Years | 219 (8.3%) | 242 (8.1%) |
| 30 to 34 Years | 257 (9.7%) | 112 (3.7%) |
| 35 to 39 Years | 111 (4.2%) | 203 (6.8%) |
| 40 to 44 Years | 155 (5.9%) | 180 (6.0%) |
| 45 to 49 Years | 126 (4.8%) | 194 (6.5%) |
| 50 to 54 Years | 183 (6.9%) | 207 (6.9%) |
| 55 to 59 Years | 176 (6.7%) | 216 (7.2%) |
| 60 to 64 Years | 145 (5.5%) | 149 (5.0%) |
| 65 to 69 Years | 205 (7.8%) | 187 (6.2%) |
| 70 to 74 Years | 83 (3.2%) | 74 (2.5%) |
| 75 to 79 Years | 106 (4.0%) | 88 (2.9%) |
| 80 to 84 Years | 30 (1.1%) | 86 (2.9%) |
| 85 Years and over | 37 (1.4%) | 83 (2.8%) |
| Total | 2,638 (100.0%) | 2,995 (100.0%) |
Families and Households in Peppermill Village
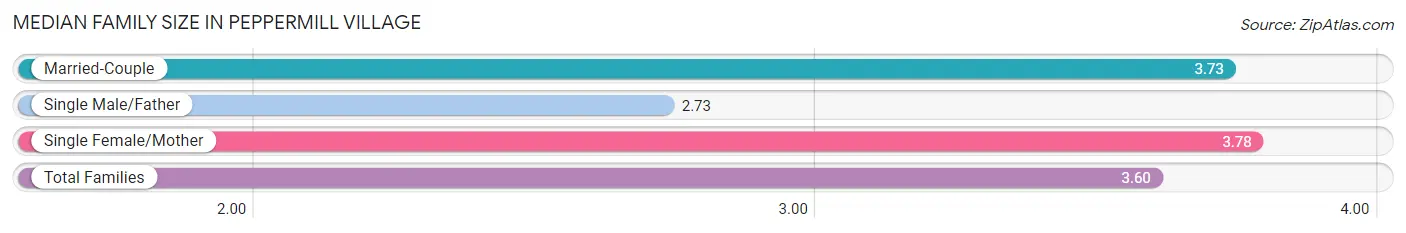
Median Family Size in Peppermill Village
The median family size in Peppermill Village is 3.60 persons per family, with single female/mother families (483 | 34.8%) accounting for the largest median family size of 3.78 persons per family. On the other hand, single male/father families (197 | 14.2%) represent the smallest median family size with 2.73 persons per family.
| Family Type | # Families | Family Size |
| Married-Couple | 708 (51.0%) | 3.73 |
| Single Male/Father | 197 (14.2%) | 2.73 |
| Single Female/Mother | 483 (34.8%) | 3.78 |
| Total Families | 1,388 (100.0%) | 3.60 |
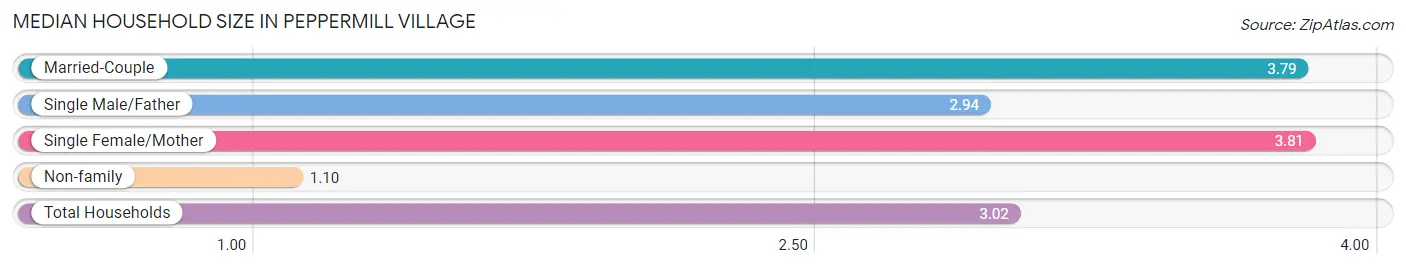
Median Household Size in Peppermill Village
The median household size in Peppermill Village is 3.02 persons per household, with single female/mother households (483 | 25.9%) accounting for the largest median household size of 3.81 persons per household. non-family households (474 | 25.5%) represent the smallest median household size with 1.10 persons per household.
| Household Type | # Households | Household Size |
| Married-Couple | 708 (38.0%) | 3.79 |
| Single Male/Father | 197 (10.6%) | 2.94 |
| Single Female/Mother | 483 (25.9%) | 3.81 |
| Non-family | 474 (25.5%) | 1.10 |
| Total Households | 1,862 (100.0%) | 3.02 |
Household Size by Marriage Status in Peppermill Village
Out of a total of 1,862 households in Peppermill Village, 1,388 (74.5%) are family households, while 474 (25.5%) are nonfamily households. The most numerous type of family households are 2-person households, comprising 475, and the most common type of nonfamily households are 1-person households, comprising 449.
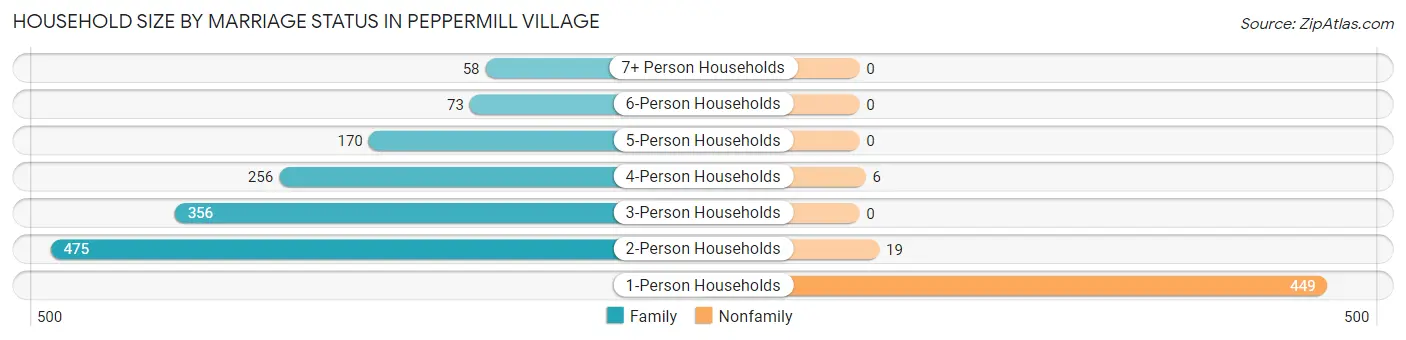
| Household Size | Family Households | Nonfamily Households |
| 1-Person Households | - | 449 (24.1%) |
| 2-Person Households | 475 (25.5%) | 19 (1.0%) |
| 3-Person Households | 356 (19.1%) | 0 (0.0%) |
| 4-Person Households | 256 (13.8%) | 6 (0.3%) |
| 5-Person Households | 170 (9.1%) | 0 (0.0%) |
| 6-Person Households | 73 (3.9%) | 0 (0.0%) |
| 7+ Person Households | 58 (3.1%) | 0 (0.0%) |
| Total | 1,388 (74.5%) | 474 (25.5%) |
Female Fertility in Peppermill Village
Fertility by Age in Peppermill Village
Average fertility rate in Peppermill Village is 69.0 births per 1,000 women. Women in the age bracket of 20 to 34 years have the highest fertility rate with 162.0 births per 1,000 women. Women in the age bracket of 20 to 34 years acount for 93.8% of all women with births.
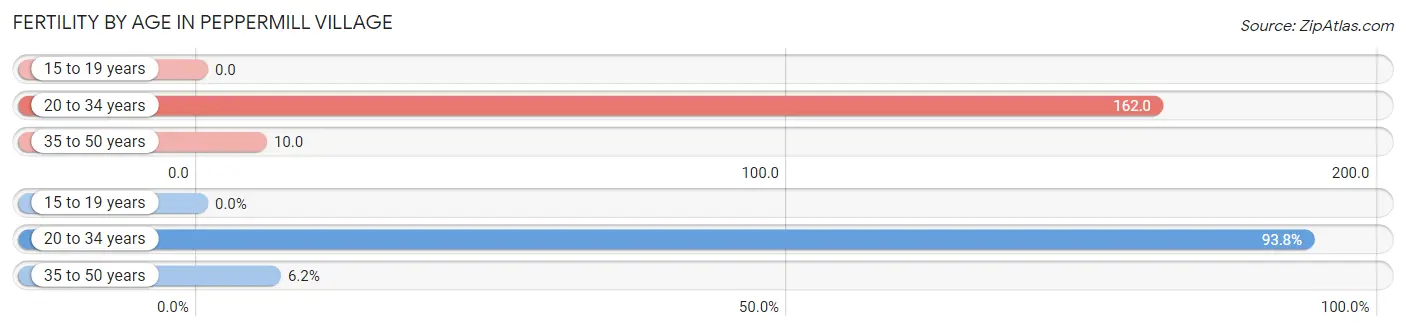
| Age Bracket | Women with Births | Births / 1,000 Women |
| 15 to 19 years | 0 (0.0%) | 0.0 |
| 20 to 34 years | 91 (93.8%) | 162.0 |
| 35 to 50 years | 6 (6.2%) | 10.0 |
| Total | 97 (100.0%) | 69.0 |
Fertility by Age by Marriage Status in Peppermill Village
80.4% of women with births (97) in Peppermill Village are married. The highest percentage of unmarried women with births falls into 20 to 34 years age bracket with 20.9% of them unmarried at the time of birth, while the lowest percentage of unmarried women with births belong to 35 to 50 years age bracket with 0.0% of them unmarried.
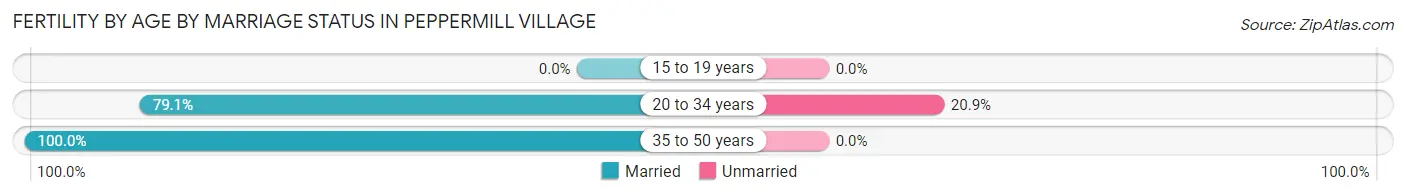
| Age Bracket | Married | Unmarried |
| 15 to 19 years | 0 (0.0%) | 0 (0.0%) |
| 20 to 34 years | 72 (79.1%) | 19 (20.9%) |
| 35 to 50 years | 6 (100.0%) | 0 (0.0%) |
| Total | 78 (80.4%) | 19 (19.6%) |
Fertility by Education in Peppermill Village
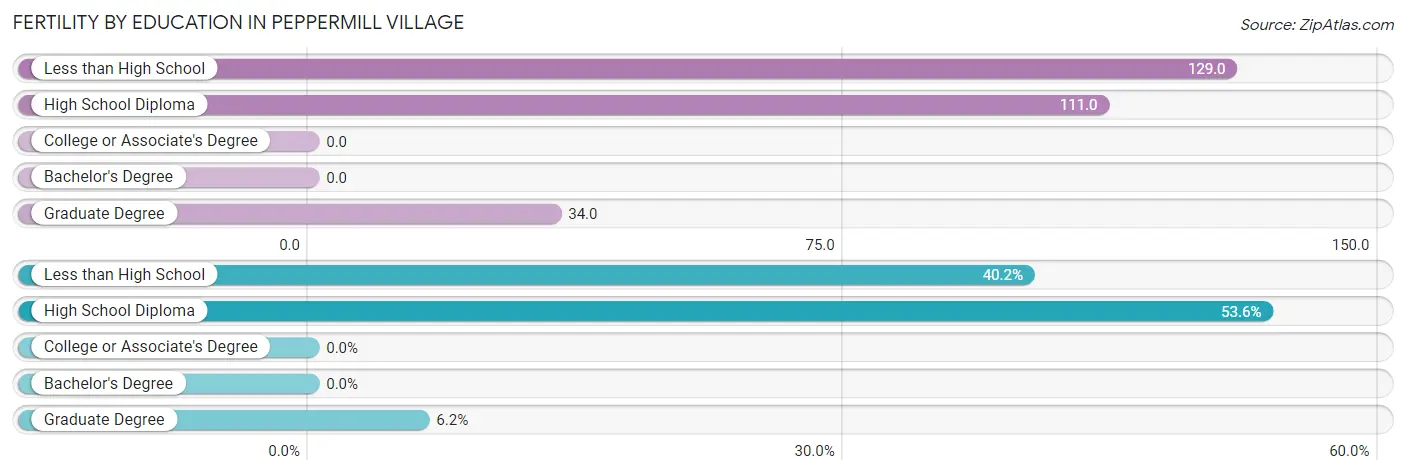
| Educational Attainment | Women with Births | Births / 1,000 Women |
| Less than High School | 39 (40.2%) | 129.0 |
| High School Diploma | 52 (53.6%) | 111.0 |
| College or Associate's Degree | 0 (0.0%) | 0.0 |
| Bachelor's Degree | 0 (0.0%) | 0.0 |
| Graduate Degree | 6 (6.2%) | 34.0 |
| Total | 97 (100.0%) | 69.0 |
Fertility by Education by Marriage Status in Peppermill Village
19.6% of women with births in Peppermill Village are unmarried. Women with the educational attainment of less than high school are most likely to be married with 100.0% of them married at childbirth, while women with the educational attainment of high school diploma are least likely to be married with 36.5% of them unmarried at childbirth.
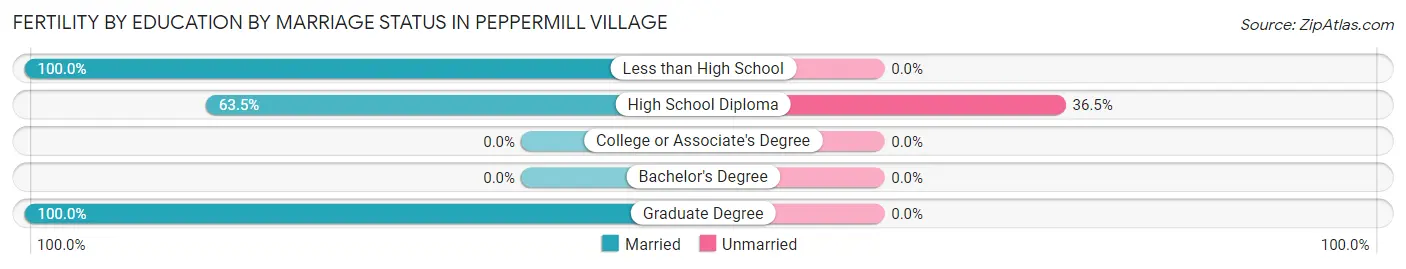
| Educational Attainment | Married | Unmarried |
| Less than High School | 39 (100.0%) | 0 (0.0%) |
| High School Diploma | 33 (63.5%) | 19 (36.5%) |
| College or Associate's Degree | 0 (0.0%) | 0 (0.0%) |
| Bachelor's Degree | 0 (0.0%) | 0 (0.0%) |
| Graduate Degree | 6 (100.0%) | 0 (0.0%) |
| Total | 78 (80.4%) | 19 (19.6%) |
Employment Characteristics in Peppermill Village
Employment by Class of Employer in Peppermill Village
Among the 2,496 employed individuals in Peppermill Village, private company employees (1,289 | 51.6%), federal government employees (525 | 21.0%), and not-for-profit organizations (349 | 14.0%) make up the most common classes of employment.
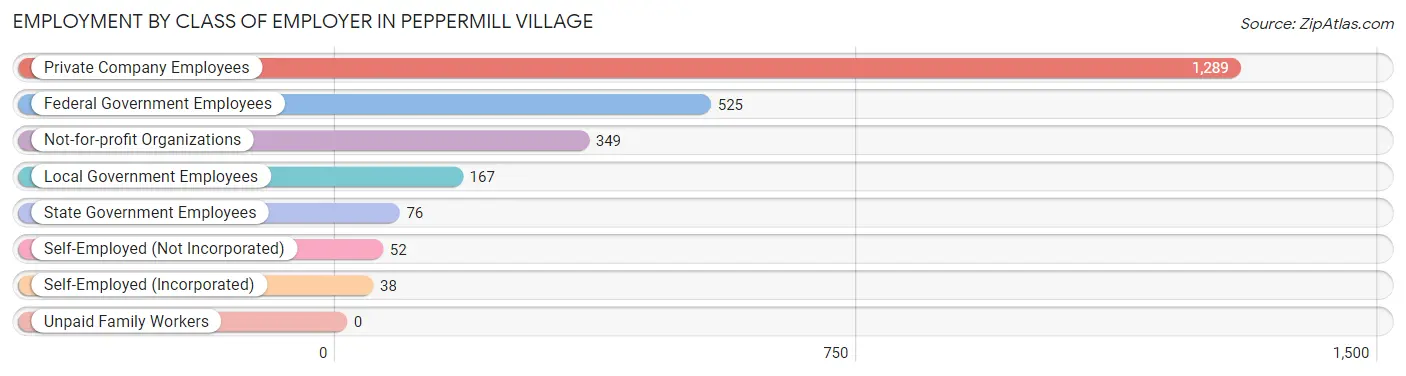
| Employer Class | # Employees | % Employees |
| Private Company Employees | 1,289 | 51.6% |
| Self-Employed (Incorporated) | 38 | 1.5% |
| Self-Employed (Not Incorporated) | 52 | 2.1% |
| Not-for-profit Organizations | 349 | 14.0% |
| Local Government Employees | 167 | 6.7% |
| State Government Employees | 76 | 3.0% |
| Federal Government Employees | 525 | 21.0% |
| Unpaid Family Workers | 0 | 0.0% |
| Total | 2,496 | 100.0% |
Employment Status by Age in Peppermill Village
According to the labor force statistics for Peppermill Village, out of the total population over 16 years of age (4,484), 63.9% or 2,865 individuals are in the labor force, with 9.8% or 281 of them unemployed. The age group with the highest labor force participation rate is 30 to 34 years, with 96.2% or 355 individuals in the labor force. Within the labor force, the 20 to 24 years age range has the highest percentage of unemployed individuals, with 29.2% or 62 of them being unemployed.
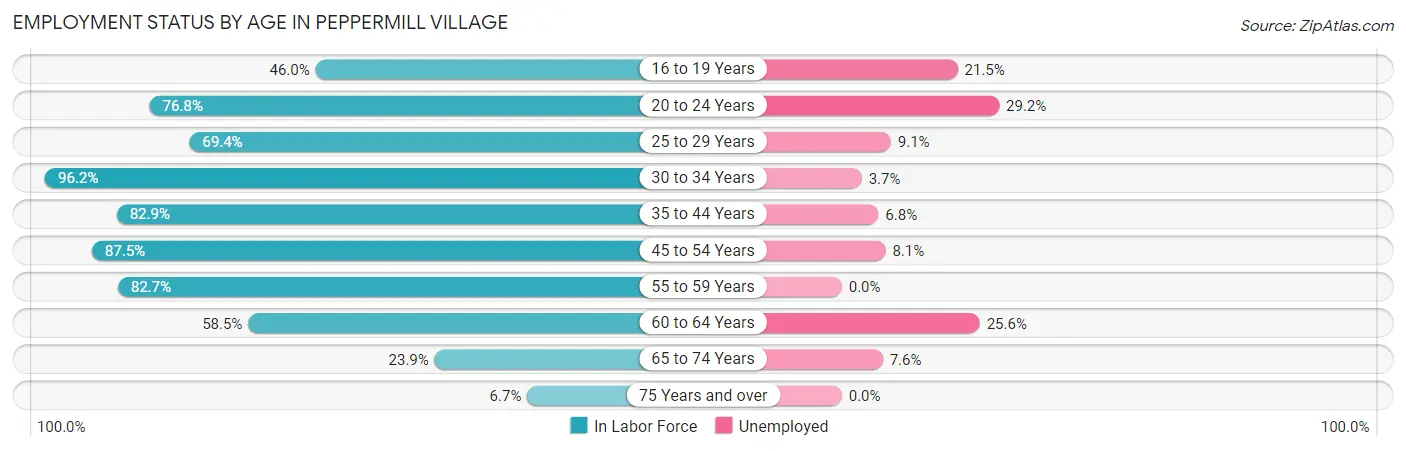
| Age Bracket | In Labor Force | Unemployed |
| 16 to 19 Years | 163 (46.0%) | 35 (21.5%) |
| 20 to 24 Years | 212 (76.8%) | 62 (29.2%) |
| 25 to 29 Years | 320 (69.4%) | 29 (9.1%) |
| 30 to 34 Years | 355 (96.2%) | 13 (3.7%) |
| 35 to 44 Years | 538 (82.9%) | 37 (6.8%) |
| 45 to 54 Years | 621 (87.5%) | 50 (8.1%) |
| 55 to 59 Years | 324 (82.7%) | 0 (0.0%) |
| 60 to 64 Years | 172 (58.5%) | 44 (25.6%) |
| 65 to 74 Years | 131 (23.9%) | 10 (7.6%) |
| 75 Years and over | 29 (6.7%) | 0 (0.0%) |
| Total | 2,865 (63.9%) | 281 (9.8%) |
Employment Status by Educational Attainment in Peppermill Village
According to labor force statistics for Peppermill Village, 81.0% of individuals (2,329) out of the total population between 25 and 64 years of age (2,875) are in the labor force, with 7.4% or 172 of them being unemployed. The group with the highest labor force participation rate are those with the educational attainment of bachelor's degree or higher, with 96.8% or 723 individuals in the labor force. Within the labor force, individuals with less than high school education have the highest percentage of unemployment, with 11.6% or 23 of them being unemployed.
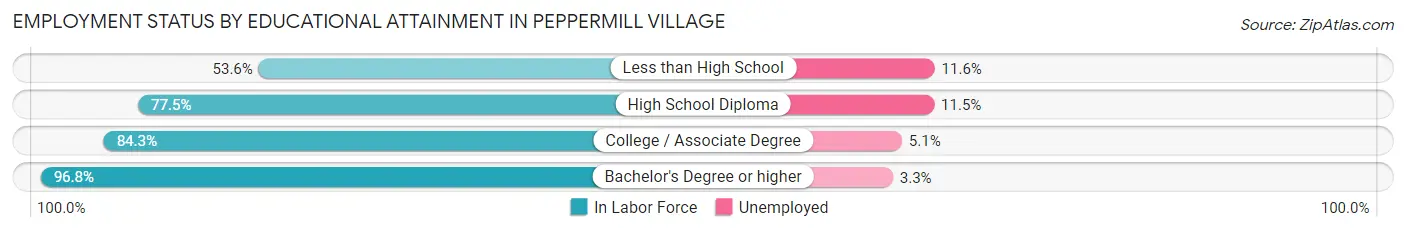
| Educational Attainment | In Labor Force | Unemployed |
| Less than High School | 199 (53.6%) | 43 (11.6%) |
| High School Diploma | 838 (77.5%) | 124 (11.5%) |
| College / Associate Degree | 570 (84.3%) | 34 (5.1%) |
| Bachelor's Degree or higher | 723 (96.8%) | 25 (3.3%) |
| Total | 2,329 (81.0%) | 213 (7.4%) |
Employment Occupations by Sex in Peppermill Village
Management, Business, Science and Arts Occupations
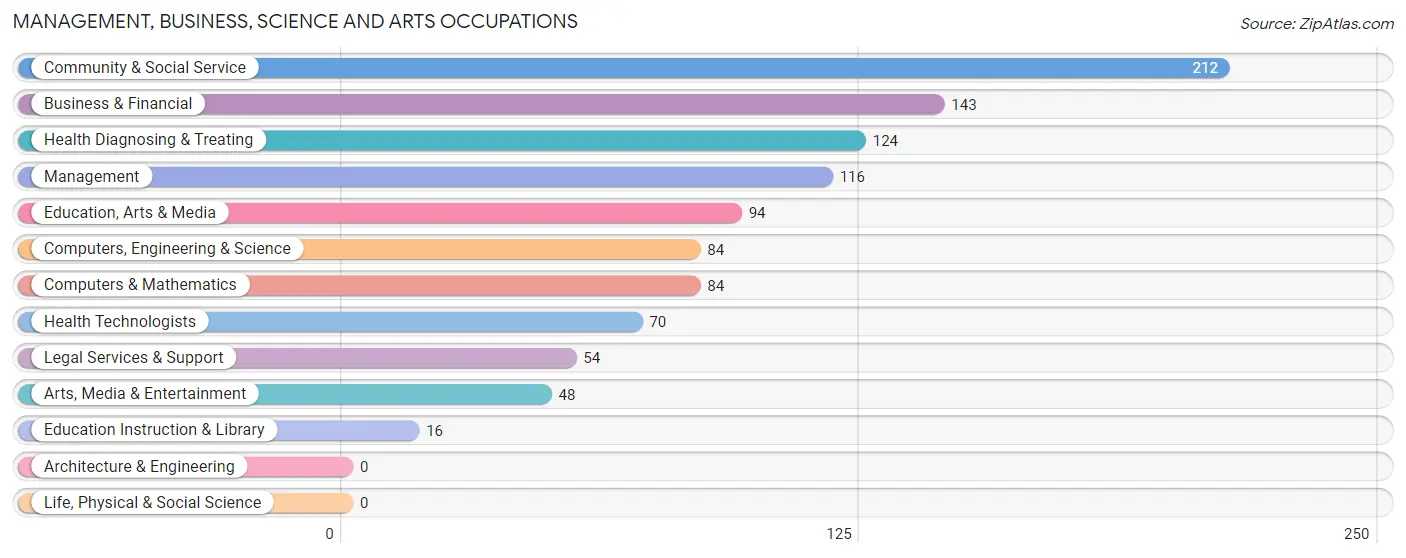
The most common Management, Business, Science and Arts occupations in Peppermill Village are Community & Social Service (212 | 8.2%), Business & Financial (143 | 5.5%), Health Diagnosing & Treating (124 | 4.8%), Management (116 | 4.5%), and Education, Arts & Media (94 | 3.6%).
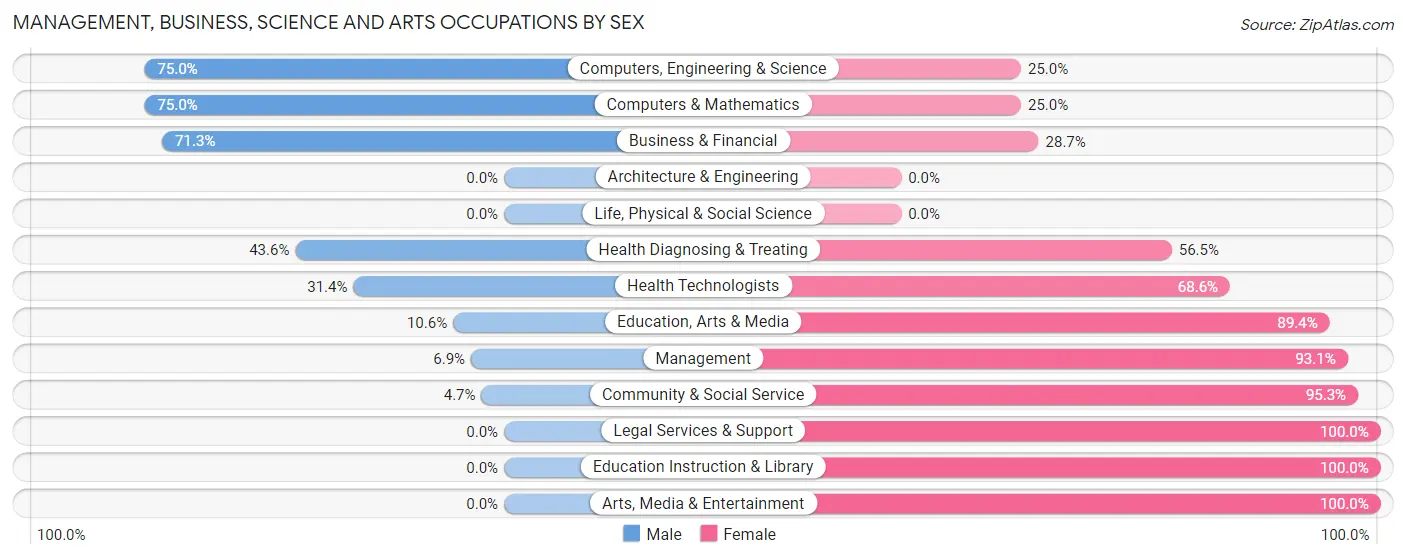
Management, Business, Science and Arts Occupations by Sex
Within the Management, Business, Science and Arts occupations in Peppermill Village, the most male-oriented occupations are Computers, Engineering & Science (75.0%), Computers & Mathematics (75.0%), and Business & Financial (71.3%), while the most female-oriented occupations are Legal Services & Support (100.0%), Education Instruction & Library (100.0%), and Arts, Media & Entertainment (100.0%).
| Occupation | Male | Female |
| Management | 8 (6.9%) | 108 (93.1%) |
| Business & Financial | 102 (71.3%) | 41 (28.7%) |
| Computers, Engineering & Science | 63 (75.0%) | 21 (25.0%) |
| Computers & Mathematics | 63 (75.0%) | 21 (25.0%) |
| Architecture & Engineering | 0 (0.0%) | 0 (0.0%) |
| Life, Physical & Social Science | 0 (0.0%) | 0 (0.0%) |
| Community & Social Service | 10 (4.7%) | 202 (95.3%) |
| Education, Arts & Media | 10 (10.6%) | 84 (89.4%) |
| Legal Services & Support | 0 (0.0%) | 54 (100.0%) |
| Education Instruction & Library | 0 (0.0%) | 16 (100.0%) |
| Arts, Media & Entertainment | 0 (0.0%) | 48 (100.0%) |
| Health Diagnosing & Treating | 54 (43.5%) | 70 (56.5%) |
| Health Technologists | 22 (31.4%) | 48 (68.6%) |
| Total (Category) | 237 (34.9%) | 442 (65.1%) |
| Total (Overall) | 1,297 (50.2%) | 1,284 (49.7%) |
Services Occupations
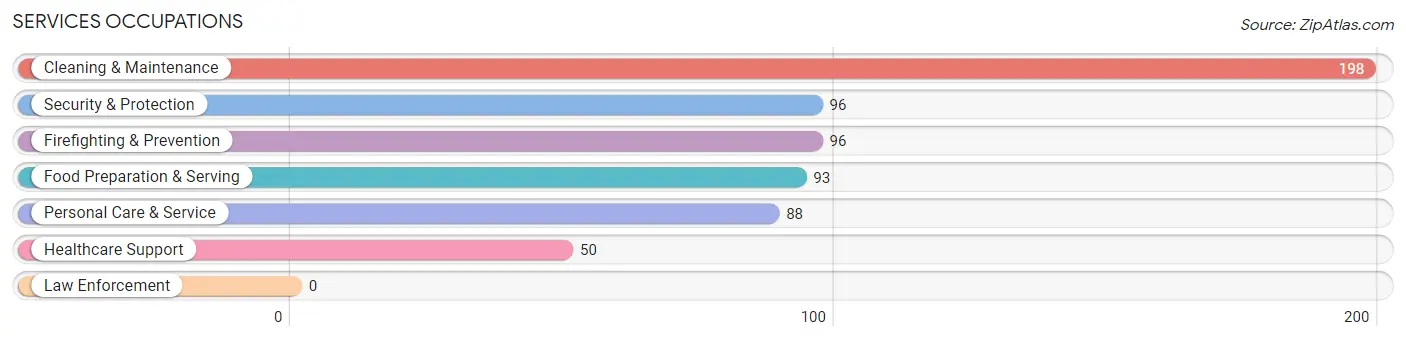
The most common Services occupations in Peppermill Village are Cleaning & Maintenance (198 | 7.7%), Security & Protection (96 | 3.7%), Firefighting & Prevention (96 | 3.7%), Food Preparation & Serving (93 | 3.6%), and Personal Care & Service (88 | 3.4%).
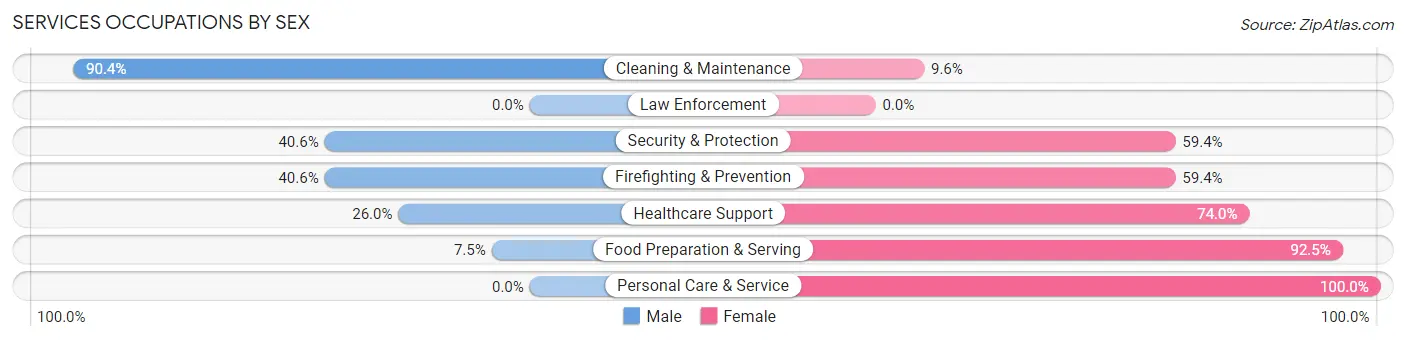
Services Occupations by Sex
Within the Services occupations in Peppermill Village, the most male-oriented occupations are Cleaning & Maintenance (90.4%), Security & Protection (40.6%), and Firefighting & Prevention (40.6%), while the most female-oriented occupations are Personal Care & Service (100.0%), Food Preparation & Serving (92.5%), and Healthcare Support (74.0%).
| Occupation | Male | Female |
| Healthcare Support | 13 (26.0%) | 37 (74.0%) |
| Security & Protection | 39 (40.6%) | 57 (59.4%) |
| Firefighting & Prevention | 39 (40.6%) | 57 (59.4%) |
| Law Enforcement | 0 (0.0%) | 0 (0.0%) |
| Food Preparation & Serving | 7 (7.5%) | 86 (92.5%) |
| Cleaning & Maintenance | 179 (90.4%) | 19 (9.6%) |
| Personal Care & Service | 0 (0.0%) | 88 (100.0%) |
| Total (Category) | 238 (45.3%) | 287 (54.7%) |
| Total (Overall) | 1,297 (50.2%) | 1,284 (49.7%) |
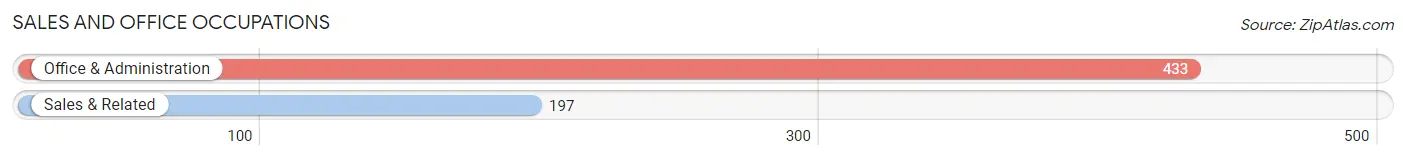
Sales and Office Occupations
The most common Sales and Office occupations in Peppermill Village are Office & Administration (433 | 16.8%), and Sales & Related (197 | 7.6%).
Sales and Office Occupations by Sex
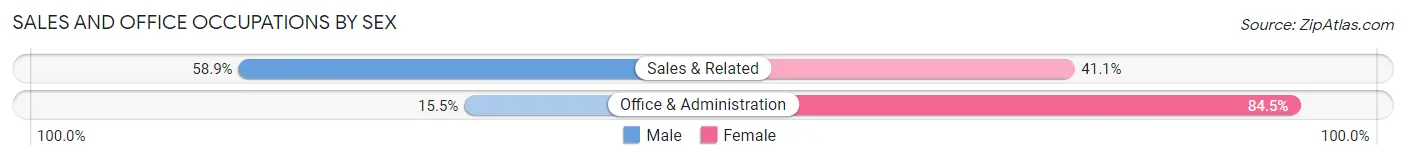
| Occupation | Male | Female |
| Sales & Related | 116 (58.9%) | 81 (41.1%) |
| Office & Administration | 67 (15.5%) | 366 (84.5%) |
| Total (Category) | 183 (29.0%) | 447 (71.0%) |
| Total (Overall) | 1,297 (50.2%) | 1,284 (49.7%) |
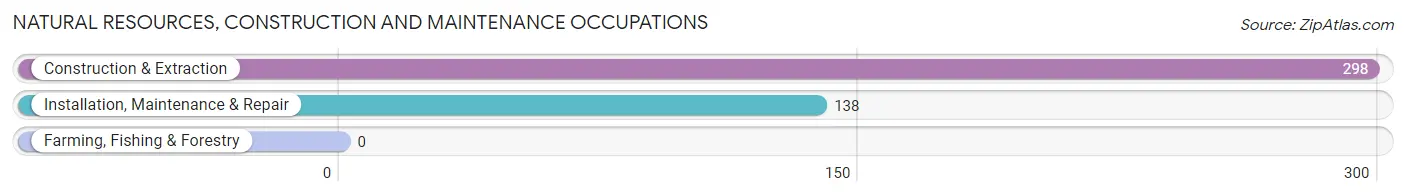
Natural Resources, Construction and Maintenance Occupations
The most common Natural Resources, Construction and Maintenance occupations in Peppermill Village are Construction & Extraction (298 | 11.6%), and Installation, Maintenance & Repair (138 | 5.3%).
Natural Resources, Construction and Maintenance Occupations by Sex
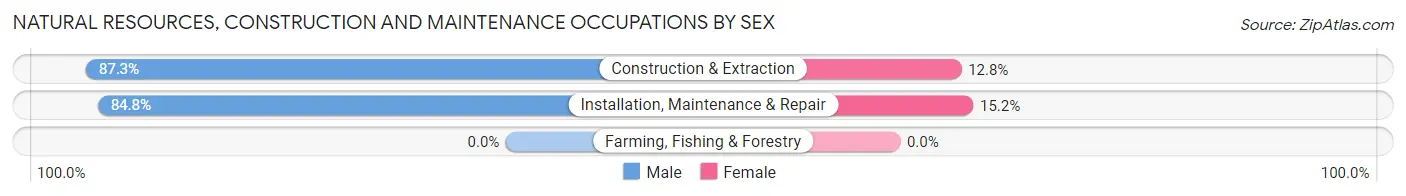
| Occupation | Male | Female |
| Farming, Fishing & Forestry | 0 (0.0%) | 0 (0.0%) |
| Construction & Extraction | 260 (87.3%) | 38 (12.8%) |
| Installation, Maintenance & Repair | 117 (84.8%) | 21 (15.2%) |
| Total (Category) | 377 (86.5%) | 59 (13.5%) |
| Total (Overall) | 1,297 (50.2%) | 1,284 (49.7%) |
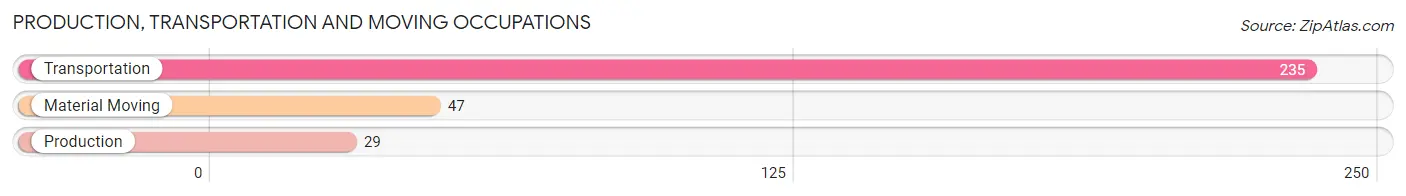
Production, Transportation and Moving Occupations
The most common Production, Transportation and Moving occupations in Peppermill Village are Transportation (235 | 9.1%), Material Moving (47 | 1.8%), and Production (29 | 1.1%).
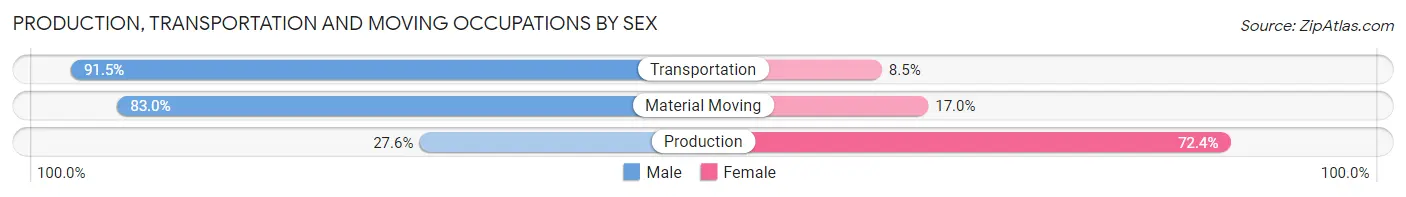
Production, Transportation and Moving Occupations by Sex
| Occupation | Male | Female |
| Production | 8 (27.6%) | 21 (72.4%) |
| Transportation | 215 (91.5%) | 20 (8.5%) |
| Material Moving | 39 (83.0%) | 8 (17.0%) |
| Total (Category) | 262 (84.2%) | 49 (15.8%) |
| Total (Overall) | 1,297 (50.2%) | 1,284 (49.7%) |
Employment Industries by Sex in Peppermill Village
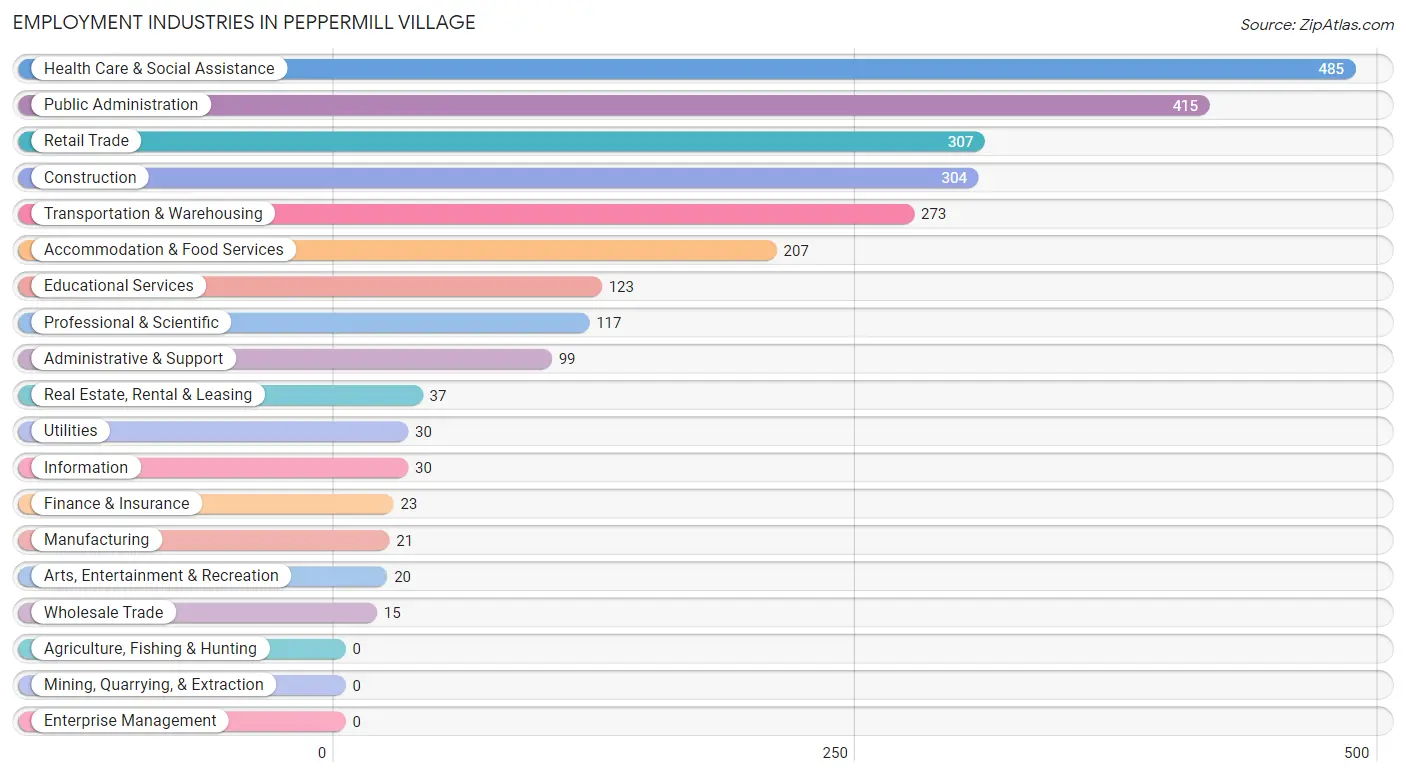
Employment Industries in Peppermill Village
The major employment industries in Peppermill Village include Health Care & Social Assistance (485 | 18.8%), Public Administration (415 | 16.1%), Retail Trade (307 | 11.9%), Construction (304 | 11.8%), and Transportation & Warehousing (273 | 10.6%).
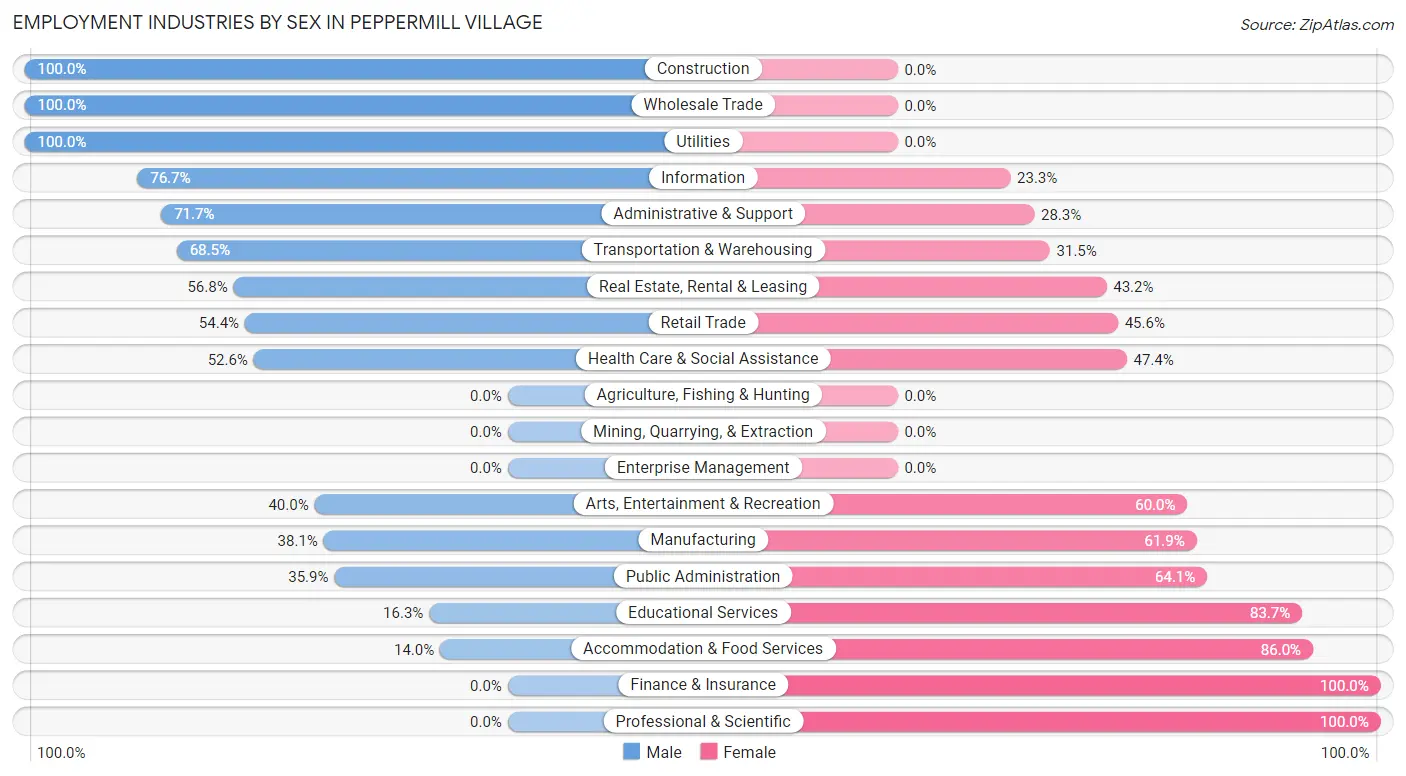
Employment Industries by Sex in Peppermill Village
The Peppermill Village industries that see more men than women are Construction (100.0%), Wholesale Trade (100.0%), and Utilities (100.0%), whereas the industries that tend to have a higher number of women are Finance & Insurance (100.0%), Professional & Scientific (100.0%), and Accommodation & Food Services (86.0%).
| Industry | Male | Female |
| Agriculture, Fishing & Hunting | 0 (0.0%) | 0 (0.0%) |
| Mining, Quarrying, & Extraction | 0 (0.0%) | 0 (0.0%) |
| Construction | 304 (100.0%) | 0 (0.0%) |
| Manufacturing | 8 (38.1%) | 13 (61.9%) |
| Wholesale Trade | 15 (100.0%) | 0 (0.0%) |
| Retail Trade | 167 (54.4%) | 140 (45.6%) |
| Transportation & Warehousing | 187 (68.5%) | 86 (31.5%) |
| Utilities | 30 (100.0%) | 0 (0.0%) |
| Information | 23 (76.7%) | 7 (23.3%) |
| Finance & Insurance | 0 (0.0%) | 23 (100.0%) |
| Real Estate, Rental & Leasing | 21 (56.8%) | 16 (43.2%) |
| Professional & Scientific | 0 (0.0%) | 117 (100.0%) |
| Enterprise Management | 0 (0.0%) | 0 (0.0%) |
| Administrative & Support | 71 (71.7%) | 28 (28.3%) |
| Educational Services | 20 (16.3%) | 103 (83.7%) |
| Health Care & Social Assistance | 255 (52.6%) | 230 (47.4%) |
| Arts, Entertainment & Recreation | 8 (40.0%) | 12 (60.0%) |
| Accommodation & Food Services | 29 (14.0%) | 178 (86.0%) |
| Public Administration | 149 (35.9%) | 266 (64.1%) |
| Total | 1,297 (50.2%) | 1,284 (49.7%) |
Education in Peppermill Village
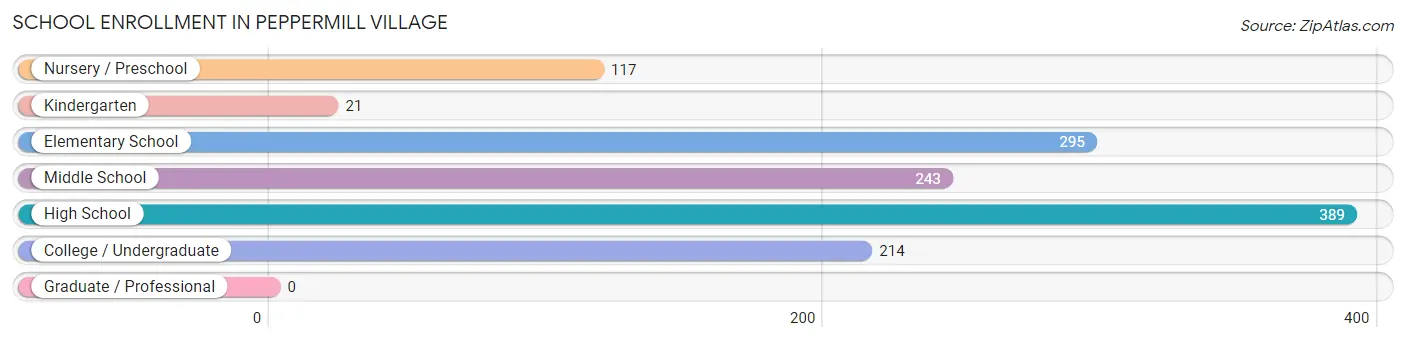
School Enrollment in Peppermill Village
The most common levels of schooling among the 1,279 students in Peppermill Village are high school (389 | 30.4%), elementary school (295 | 23.1%), and middle school (243 | 19.0%).
| School Level | # Students | % Students |
| Nursery / Preschool | 117 | 9.1% |
| Kindergarten | 21 | 1.6% |
| Elementary School | 295 | 23.1% |
| Middle School | 243 | 19.0% |
| High School | 389 | 30.4% |
| College / Undergraduate | 214 | 16.7% |
| Graduate / Professional | 0 | 0.0% |
| Total | 1,279 | 100.0% |
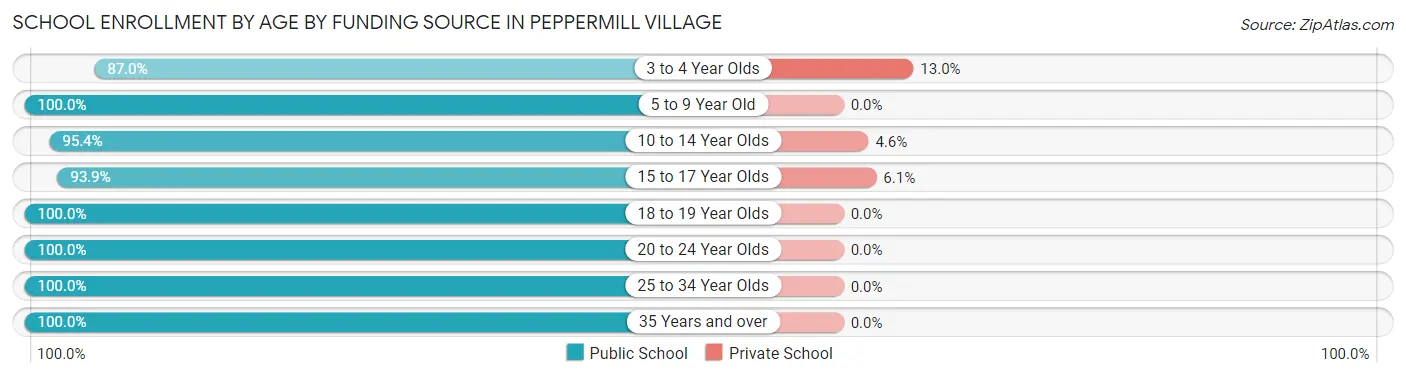
School Enrollment by Age by Funding Source in Peppermill Village
Out of a total of 1,279 students who are enrolled in schools in Peppermill Village, 38 (3.0%) attend a private institution, while the remaining 1,241 (97.0%) are enrolled in public schools. The age group of 3 to 4 year olds has the highest likelihood of being enrolled in private schools, with 10 (13.0% in the age bracket) enrolled. Conversely, the age group of 5 to 9 year old has the lowest likelihood of being enrolled in a private school, with 356 (100.0% in the age bracket) attending a public institution.
| Age Bracket | Public School | Private School |
| 3 to 4 Year Olds | 67 (87.0%) | 10 (13.0%) |
| 5 to 9 Year Old | 356 (100.0%) | 0 (0.0%) |
| 10 to 14 Year Olds | 227 (95.4%) | 11 (4.6%) |
| 15 to 17 Year Olds | 277 (93.9%) | 18 (6.1%) |
| 18 to 19 Year Olds | 103 (100.0%) | 0 (0.0%) |
| 20 to 24 Year Olds | 125 (100.0%) | 0 (0.0%) |
| 25 to 34 Year Olds | 49 (100.0%) | 0 (0.0%) |
| 35 Years and over | 36 (100.0%) | 0 (0.0%) |
| Total | 1,241 (97.0%) | 38 (3.0%) |
Educational Attainment by Field of Study in Peppermill Village
Business (243 | 27.4%), arts & humanities (176 | 19.8%), science & technology (102 | 11.5%), social sciences (90 | 10.1%), and bio, nature & agricultural (81 | 9.1%) are the most common fields of study among 888 individuals in Peppermill Village who have obtained a bachelor's degree or higher.
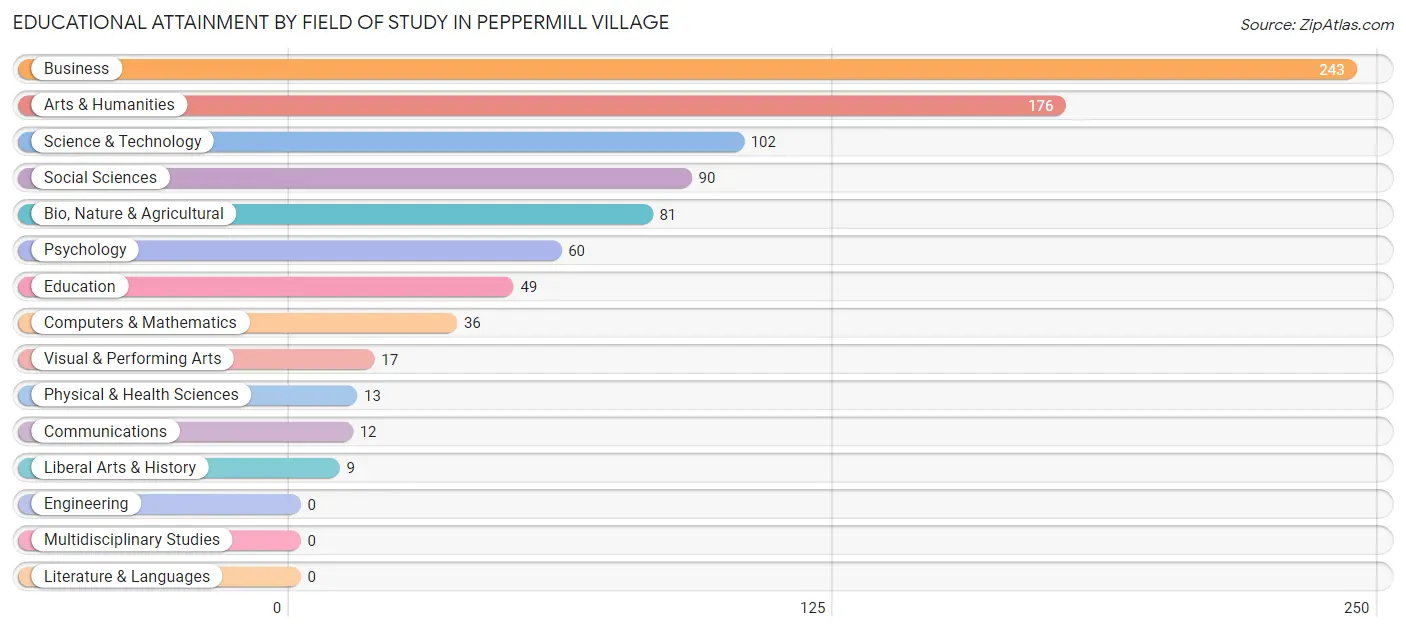
| Field of Study | # Graduates | % Graduates |
| Computers & Mathematics | 36 | 4.1% |
| Bio, Nature & Agricultural | 81 | 9.1% |
| Physical & Health Sciences | 13 | 1.5% |
| Psychology | 60 | 6.8% |
| Social Sciences | 90 | 10.1% |
| Engineering | 0 | 0.0% |
| Multidisciplinary Studies | 0 | 0.0% |
| Science & Technology | 102 | 11.5% |
| Business | 243 | 27.4% |
| Education | 49 | 5.5% |
| Literature & Languages | 0 | 0.0% |
| Liberal Arts & History | 9 | 1.0% |
| Visual & Performing Arts | 17 | 1.9% |
| Communications | 12 | 1.3% |
| Arts & Humanities | 176 | 19.8% |
| Total | 888 | 100.0% |
Transportation & Commute in Peppermill Village
Vehicle Availability by Sex in Peppermill Village
The most prevalent vehicle ownership categories in Peppermill Village are males with 2 vehicles (490, accounting for 38.3%) and females with 2 vehicles (455, making up 40.5%).
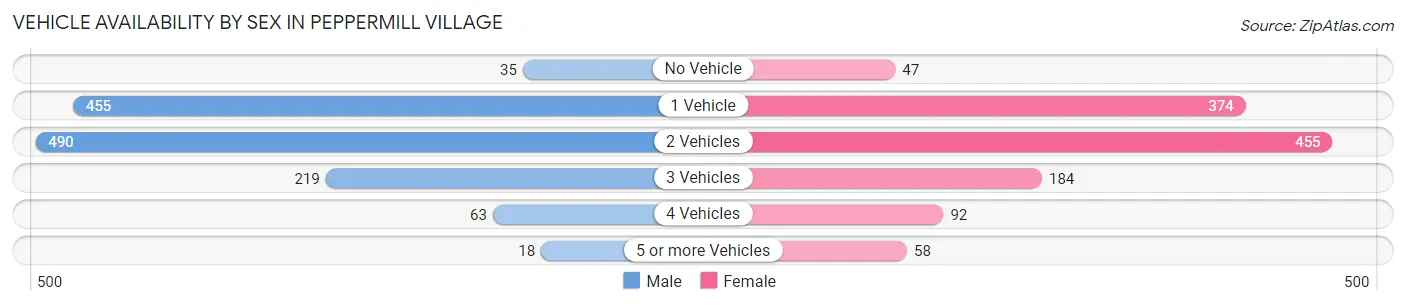
| Vehicles Available | Male | Female |
| No Vehicle | 35 (2.7%) | 47 (3.9%) |
| 1 Vehicle | 455 (35.5%) | 374 (30.9%) |
| 2 Vehicles | 490 (38.3%) | 455 (37.6%) |
| 3 Vehicles | 219 (17.1%) | 184 (15.2%) |
| 4 Vehicles | 63 (4.9%) | 92 (7.6%) |
| 5 or more Vehicles | 18 (1.4%) | 58 (4.8%) |
| Total | 1,280 (100.0%) | 1,210 (100.0%) |
Commute Time in Peppermill Village
The most frequently occuring commute durations in Peppermill Village are 20 to 24 minutes (434 commuters, 18.4%), 60 to 89 minutes (417 commuters, 17.7%), and 45 to 59 minutes (363 commuters, 15.4%).
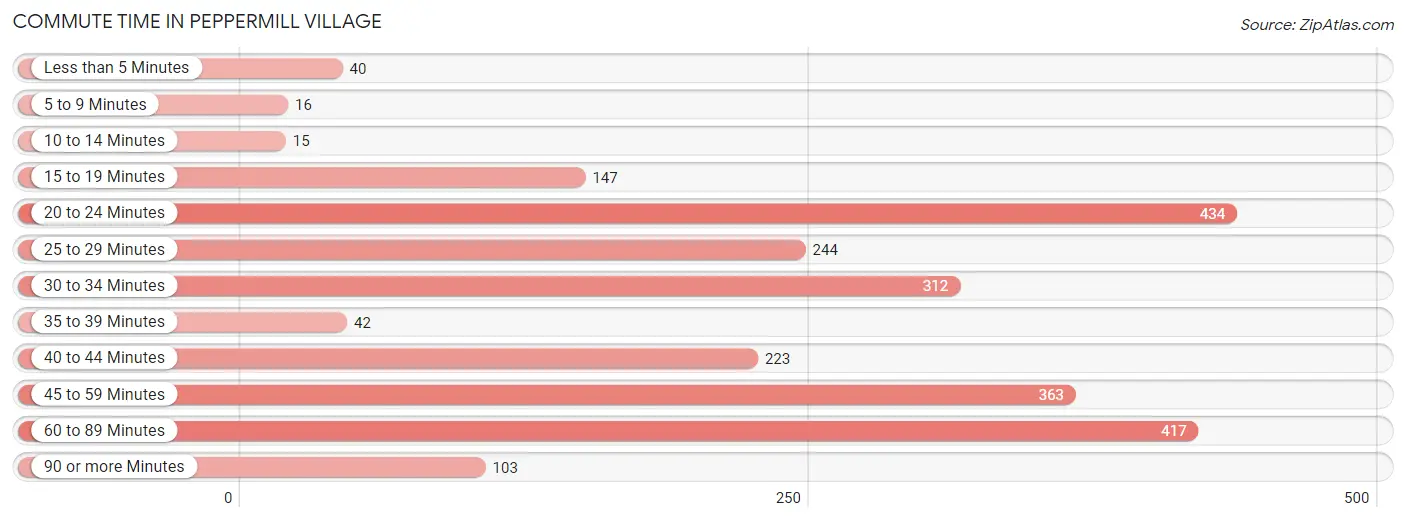
| Commute Time | # Commuters | % Commuters |
| Less than 5 Minutes | 40 | 1.7% |
| 5 to 9 Minutes | 16 | 0.7% |
| 10 to 14 Minutes | 15 | 0.6% |
| 15 to 19 Minutes | 147 | 6.2% |
| 20 to 24 Minutes | 434 | 18.4% |
| 25 to 29 Minutes | 244 | 10.4% |
| 30 to 34 Minutes | 312 | 13.2% |
| 35 to 39 Minutes | 42 | 1.8% |
| 40 to 44 Minutes | 223 | 9.5% |
| 45 to 59 Minutes | 363 | 15.4% |
| 60 to 89 Minutes | 417 | 17.7% |
| 90 or more Minutes | 103 | 4.4% |
Commute Time by Sex in Peppermill Village
The most common commute times in Peppermill Village are 45 to 59 minutes (240 commuters, 19.3%) for males and 20 to 24 minutes (290 commuters, 26.1%) for females.
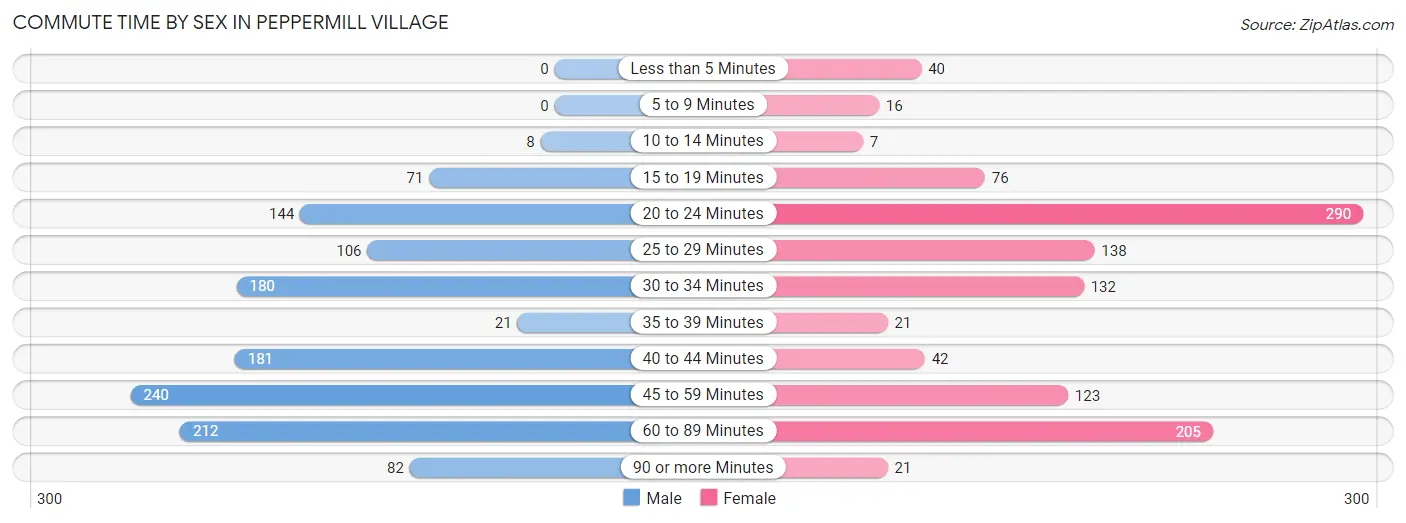
| Commute Time | Male | Female |
| Less than 5 Minutes | 0 (0.0%) | 40 (3.6%) |
| 5 to 9 Minutes | 0 (0.0%) | 16 (1.4%) |
| 10 to 14 Minutes | 8 (0.6%) | 7 (0.6%) |
| 15 to 19 Minutes | 71 (5.7%) | 76 (6.8%) |
| 20 to 24 Minutes | 144 (11.6%) | 290 (26.1%) |
| 25 to 29 Minutes | 106 (8.5%) | 138 (12.4%) |
| 30 to 34 Minutes | 180 (14.5%) | 132 (11.9%) |
| 35 to 39 Minutes | 21 (1.7%) | 21 (1.9%) |
| 40 to 44 Minutes | 181 (14.5%) | 42 (3.8%) |
| 45 to 59 Minutes | 240 (19.3%) | 123 (11.1%) |
| 60 to 89 Minutes | 212 (17.0%) | 205 (18.4%) |
| 90 or more Minutes | 82 (6.6%) | 21 (1.9%) |
Time of Departure to Work by Sex in Peppermill Village
The most frequent times of departure to work in Peppermill Village are 6:00 AM to 6:29 AM (215, 17.3%) for males and 7:30 AM to 7:59 AM (227, 20.4%) for females.
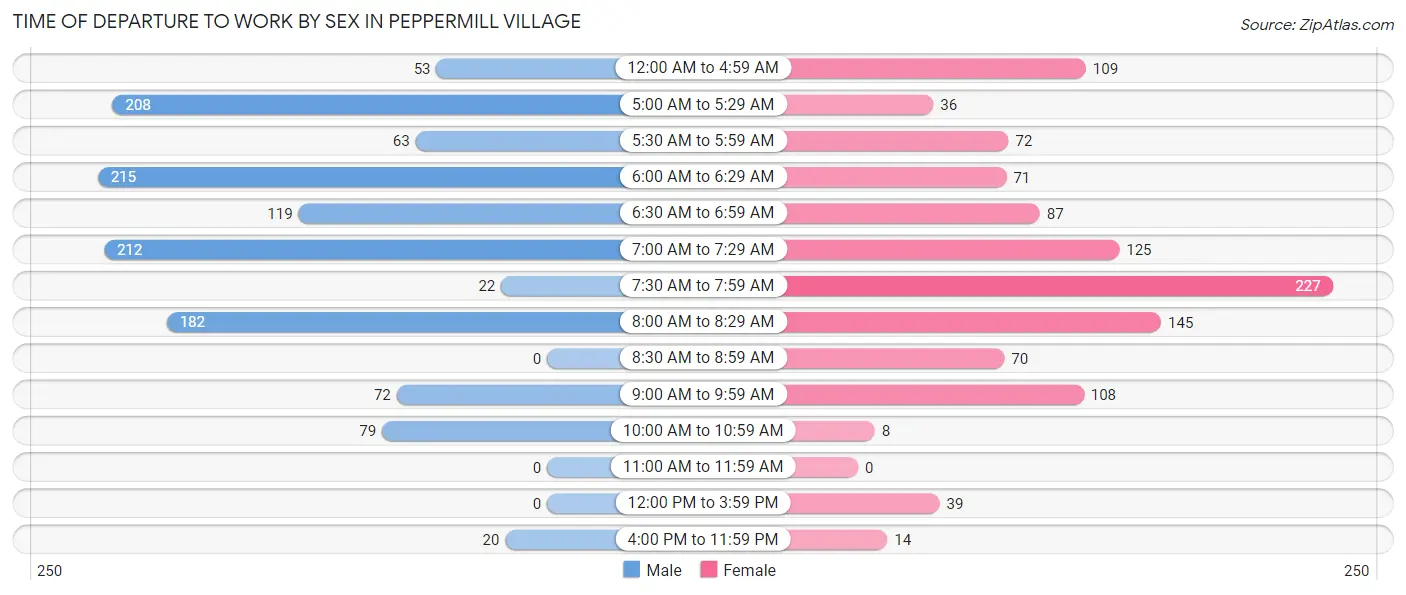
| Time of Departure | Male | Female |
| 12:00 AM to 4:59 AM | 53 (4.3%) | 109 (9.8%) |
| 5:00 AM to 5:29 AM | 208 (16.7%) | 36 (3.2%) |
| 5:30 AM to 5:59 AM | 63 (5.1%) | 72 (6.5%) |
| 6:00 AM to 6:29 AM | 215 (17.3%) | 71 (6.4%) |
| 6:30 AM to 6:59 AM | 119 (9.6%) | 87 (7.8%) |
| 7:00 AM to 7:29 AM | 212 (17.0%) | 125 (11.3%) |
| 7:30 AM to 7:59 AM | 22 (1.8%) | 227 (20.4%) |
| 8:00 AM to 8:29 AM | 182 (14.6%) | 145 (13.1%) |
| 8:30 AM to 8:59 AM | 0 (0.0%) | 70 (6.3%) |
| 9:00 AM to 9:59 AM | 72 (5.8%) | 108 (9.7%) |
| 10:00 AM to 10:59 AM | 79 (6.4%) | 8 (0.7%) |
| 11:00 AM to 11:59 AM | 0 (0.0%) | 0 (0.0%) |
| 12:00 PM to 3:59 PM | 0 (0.0%) | 39 (3.5%) |
| 4:00 PM to 11:59 PM | 20 (1.6%) | 14 (1.3%) |
| Total | 1,245 (100.0%) | 1,111 (100.0%) |
Housing Occupancy in Peppermill Village
Occupancy by Ownership in Peppermill Village
Of the total 1,862 dwellings in Peppermill Village, owner-occupied units account for 1,505 (80.8%), while renter-occupied units make up 357 (19.2%).
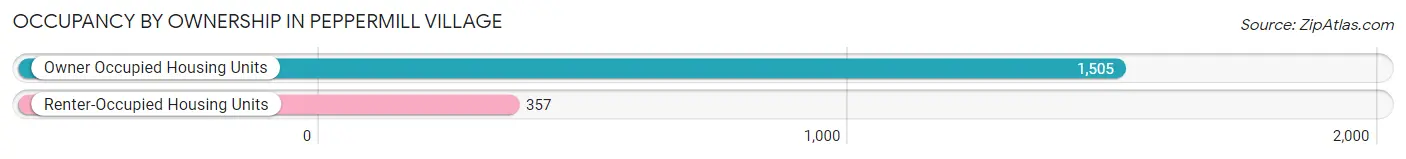
| Occupancy | # Housing Units | % Housing Units |
| Owner Occupied Housing Units | 1,505 | 80.8% |
| Renter-Occupied Housing Units | 357 | 19.2% |
| Total Occupied Housing Units | 1,862 | 100.0% |
Occupancy by Household Size in Peppermill Village
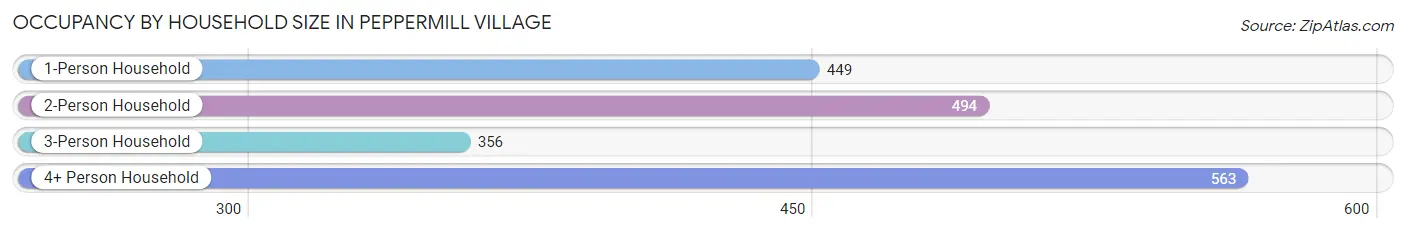
| Household Size | # Housing Units | % Housing Units |
| 1-Person Household | 449 | 24.1% |
| 2-Person Household | 494 | 26.5% |
| 3-Person Household | 356 | 19.1% |
| 4+ Person Household | 563 | 30.2% |
| Total Housing Units | 1,862 | 100.0% |
Occupancy by Ownership by Household Size in Peppermill Village
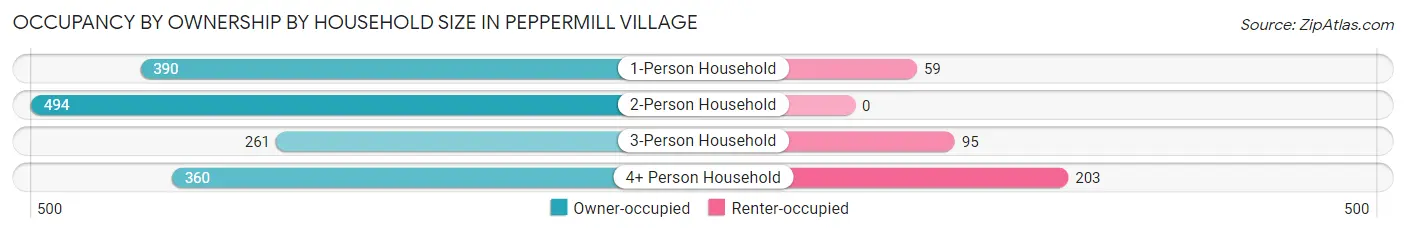
| Household Size | Owner-occupied | Renter-occupied |
| 1-Person Household | 390 (86.9%) | 59 (13.1%) |
| 2-Person Household | 494 (100.0%) | 0 (0.0%) |
| 3-Person Household | 261 (73.3%) | 95 (26.7%) |
| 4+ Person Household | 360 (63.9%) | 203 (36.1%) |
| Total Housing Units | 1,505 (80.8%) | 357 (19.2%) |
Occupancy by Educational Attainment in Peppermill Village
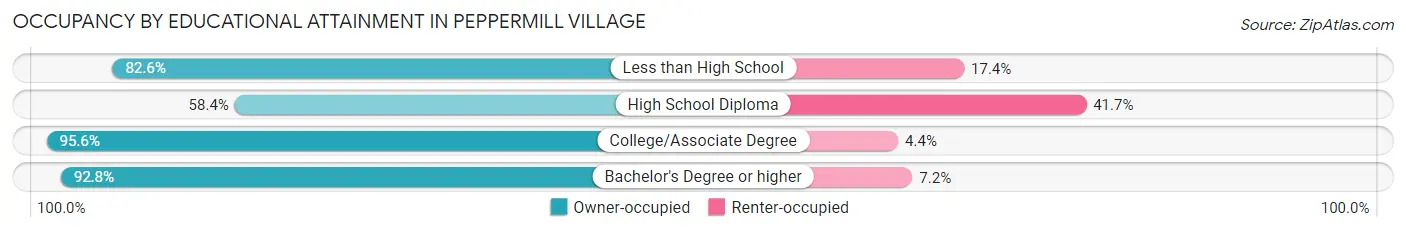
| Household Size | Owner-occupied | Renter-occupied |
| Less than High School | 90 (82.6%) | 19 (17.4%) |
| High School Diploma | 381 (58.4%) | 272 (41.6%) |
| College/Associate Degree | 439 (95.6%) | 20 (4.4%) |
| Bachelor's Degree or higher | 595 (92.8%) | 46 (7.2%) |
Occupancy by Age of Householder in Peppermill Village
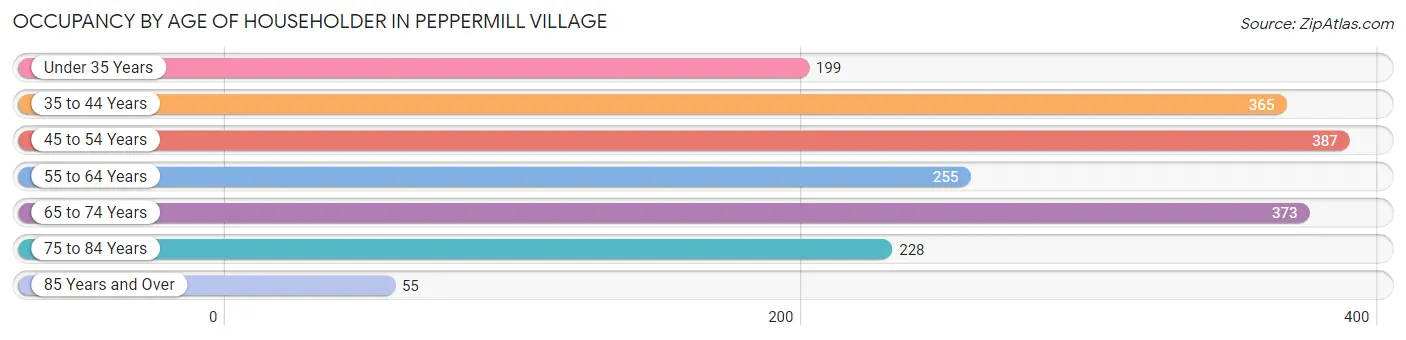
| Age Bracket | # Households | % Households |
| Under 35 Years | 199 | 10.7% |
| 35 to 44 Years | 365 | 19.6% |
| 45 to 54 Years | 387 | 20.8% |
| 55 to 64 Years | 255 | 13.7% |
| 65 to 74 Years | 373 | 20.0% |
| 75 to 84 Years | 228 | 12.2% |
| 85 Years and Over | 55 | 2.9% |
| Total | 1,862 | 100.0% |
Housing Finances in Peppermill Village
Median Income by Occupancy in Peppermill Village
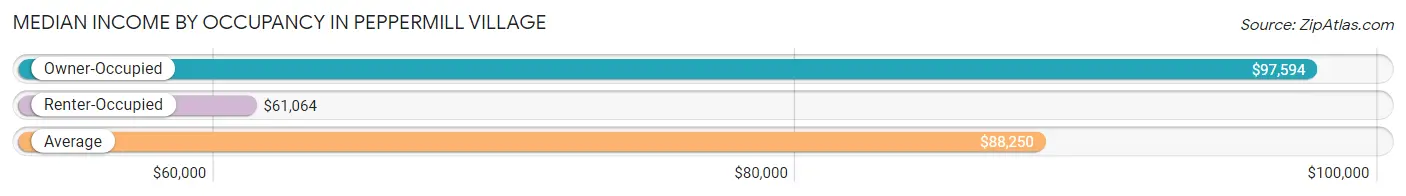
| Occupancy Type | # Households | Median Income |
| Owner-Occupied | 1,505 (80.8%) | $97,594 |
| Renter-Occupied | 357 (19.2%) | $61,064 |
| Average | 1,862 (100.0%) | $88,250 |
Occupancy by Householder Income Bracket in Peppermill Village
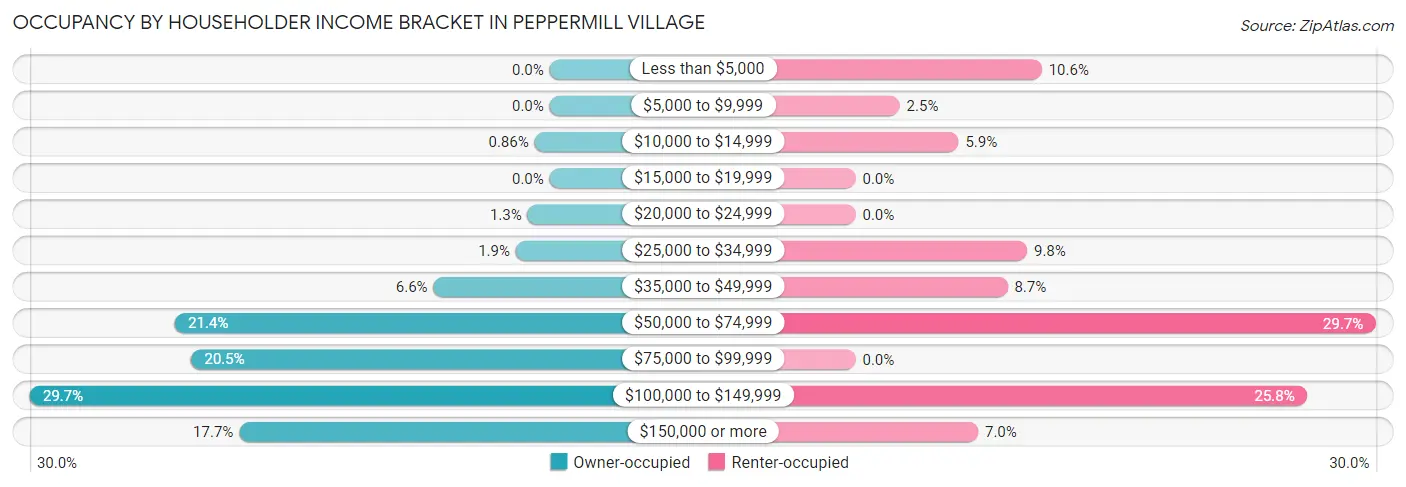
| Income Bracket | Owner-occupied | Renter-occupied |
| Less than $5,000 | 0 (0.0%) | 38 (10.6%) |
| $5,000 to $9,999 | 0 (0.0%) | 9 (2.5%) |
| $10,000 to $14,999 | 13 (0.9%) | 21 (5.9%) |
| $15,000 to $19,999 | 0 (0.0%) | 0 (0.0%) |
| $20,000 to $24,999 | 19 (1.3%) | 0 (0.0%) |
| $25,000 to $34,999 | 29 (1.9%) | 35 (9.8%) |
| $35,000 to $49,999 | 100 (6.6%) | 31 (8.7%) |
| $50,000 to $74,999 | 322 (21.4%) | 106 (29.7%) |
| $75,000 to $99,999 | 308 (20.5%) | 0 (0.0%) |
| $100,000 to $149,999 | 447 (29.7%) | 92 (25.8%) |
| $150,000 or more | 267 (17.7%) | 25 (7.0%) |
| Total | 1,505 (100.0%) | 357 (100.0%) |
Monthly Housing Cost Tiers in Peppermill Village
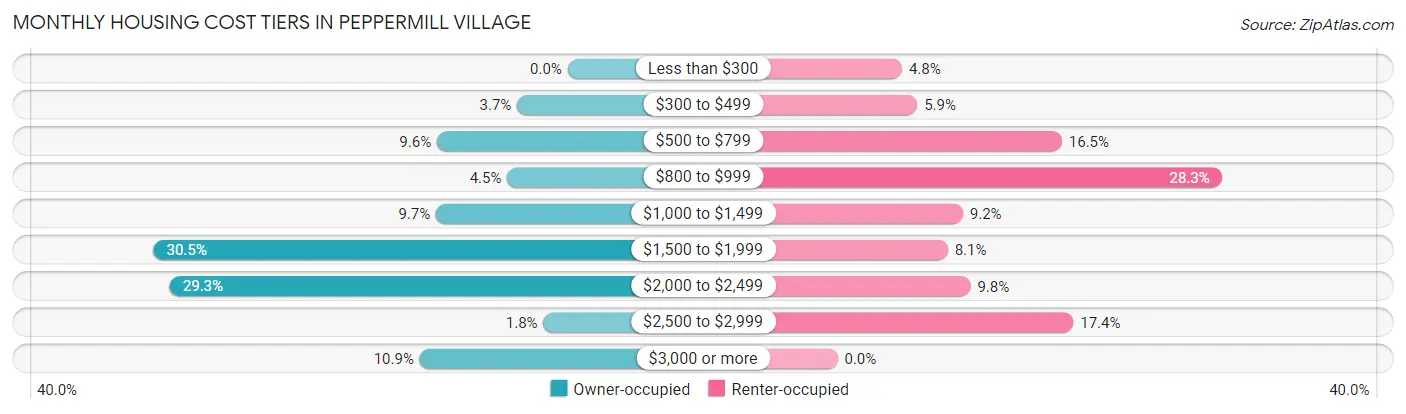
| Monthly Cost | Owner-occupied | Renter-occupied |
| Less than $300 | 0 (0.0%) | 17 (4.8%) |
| $300 to $499 | 56 (3.7%) | 21 (5.9%) |
| $500 to $799 | 145 (9.6%) | 59 (16.5%) |
| $800 to $999 | 67 (4.4%) | 101 (28.3%) |
| $1,000 to $1,499 | 146 (9.7%) | 33 (9.2%) |
| $1,500 to $1,999 | 459 (30.5%) | 29 (8.1%) |
| $2,000 to $2,499 | 441 (29.3%) | 35 (9.8%) |
| $2,500 to $2,999 | 27 (1.8%) | 62 (17.4%) |
| $3,000 or more | 164 (10.9%) | 0 (0.0%) |
| Total | 1,505 (100.0%) | 357 (100.0%) |
Physical Housing Characteristics in Peppermill Village
Housing Structures in Peppermill Village
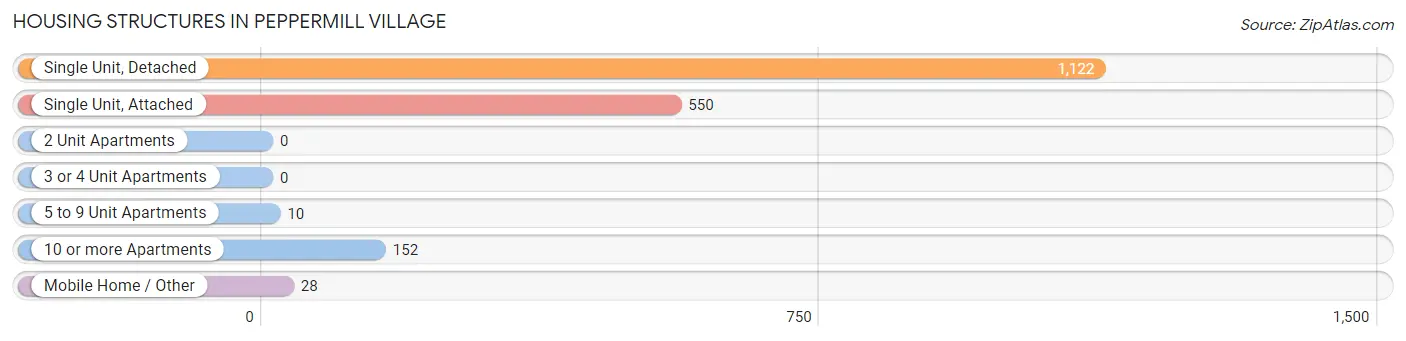
| Structure Type | # Housing Units | % Housing Units |
| Single Unit, Detached | 1,122 | 60.3% |
| Single Unit, Attached | 550 | 29.5% |
| 2 Unit Apartments | 0 | 0.0% |
| 3 or 4 Unit Apartments | 0 | 0.0% |
| 5 to 9 Unit Apartments | 10 | 0.5% |
| 10 or more Apartments | 152 | 8.2% |
| Mobile Home / Other | 28 | 1.5% |
| Total | 1,862 | 100.0% |
Housing Structures by Occupancy in Peppermill Village
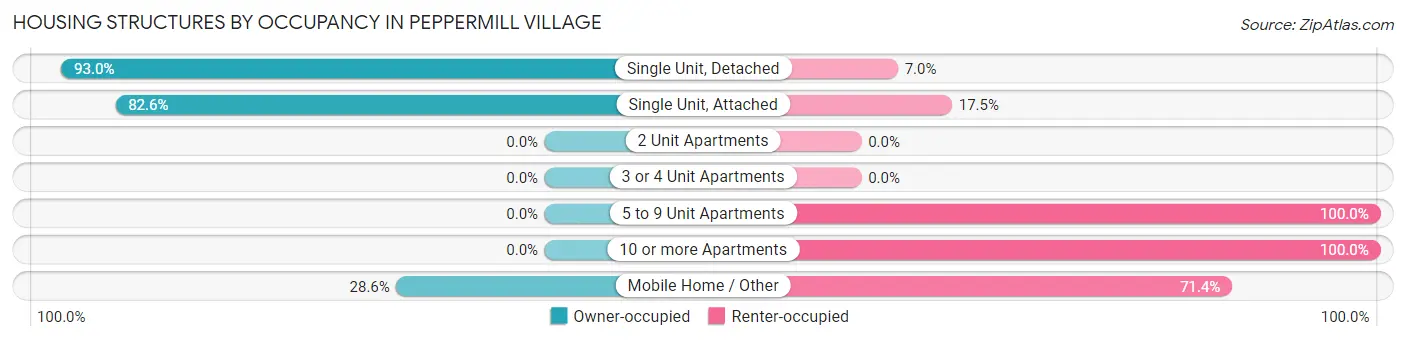
| Structure Type | Owner-occupied | Renter-occupied |
| Single Unit, Detached | 1,043 (93.0%) | 79 (7.0%) |
| Single Unit, Attached | 454 (82.6%) | 96 (17.4%) |
| 2 Unit Apartments | 0 (0.0%) | 0 (0.0%) |
| 3 or 4 Unit Apartments | 0 (0.0%) | 0 (0.0%) |
| 5 to 9 Unit Apartments | 0 (0.0%) | 10 (100.0%) |
| 10 or more Apartments | 0 (0.0%) | 152 (100.0%) |
| Mobile Home / Other | 8 (28.6%) | 20 (71.4%) |
| Total | 1,505 (80.8%) | 357 (19.2%) |
Housing Structures by Number of Rooms in Peppermill Village
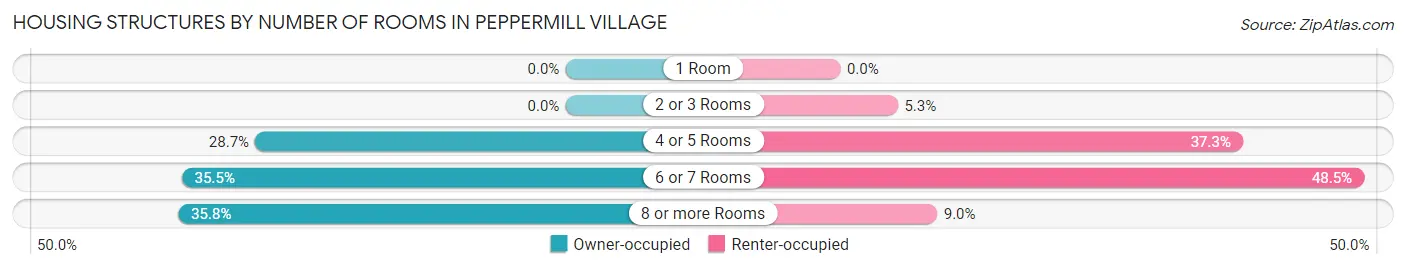
| Number of Rooms | Owner-occupied | Renter-occupied |
| 1 Room | 0 (0.0%) | 0 (0.0%) |
| 2 or 3 Rooms | 0 (0.0%) | 19 (5.3%) |
| 4 or 5 Rooms | 432 (28.7%) | 133 (37.2%) |
| 6 or 7 Rooms | 534 (35.5%) | 173 (48.5%) |
| 8 or more Rooms | 539 (35.8%) | 32 (9.0%) |
| Total | 1,505 (100.0%) | 357 (100.0%) |
Housing Structure by Heating Type in Peppermill Village
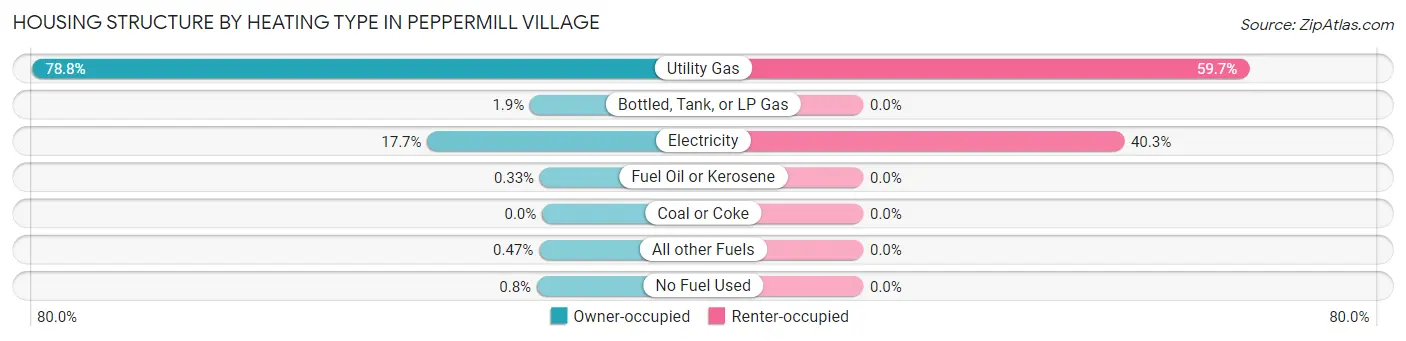
| Heating Type | Owner-occupied | Renter-occupied |
| Utility Gas | 1,186 (78.8%) | 213 (59.7%) |
| Bottled, Tank, or LP Gas | 28 (1.9%) | 0 (0.0%) |
| Electricity | 267 (17.7%) | 144 (40.3%) |
| Fuel Oil or Kerosene | 5 (0.3%) | 0 (0.0%) |
| Coal or Coke | 0 (0.0%) | 0 (0.0%) |
| All other Fuels | 7 (0.5%) | 0 (0.0%) |
| No Fuel Used | 12 (0.8%) | 0 (0.0%) |
| Total | 1,505 (100.0%) | 357 (100.0%) |
Household Vehicle Usage in Peppermill Village
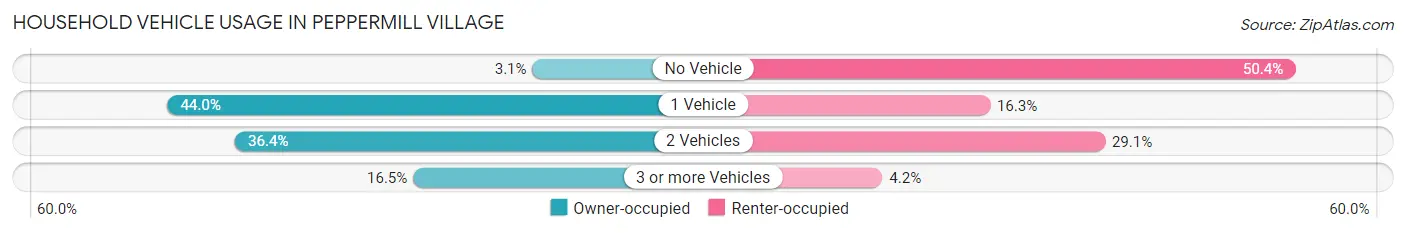
| Vehicles per Household | Owner-occupied | Renter-occupied |
| No Vehicle | 47 (3.1%) | 180 (50.4%) |
| 1 Vehicle | 662 (44.0%) | 58 (16.3%) |
| 2 Vehicles | 548 (36.4%) | 104 (29.1%) |
| 3 or more Vehicles | 248 (16.5%) | 15 (4.2%) |
| Total | 1,505 (100.0%) | 357 (100.0%) |
Real Estate & Mortgages in Peppermill Village
Real Estate and Mortgage Overview in Peppermill Village
| Characteristic | Without Mortgage | With Mortgage |
| Housing Units | 268 | 1,237 |
| Median Property Value | $306,600 | $326,600 |
| Median Household Income | $88,438 | $208 |
| Monthly Housing Costs | $673 | $164 |
| Real Estate Taxes | $3,132 | $62 |
Property Value by Mortgage Status in Peppermill Village
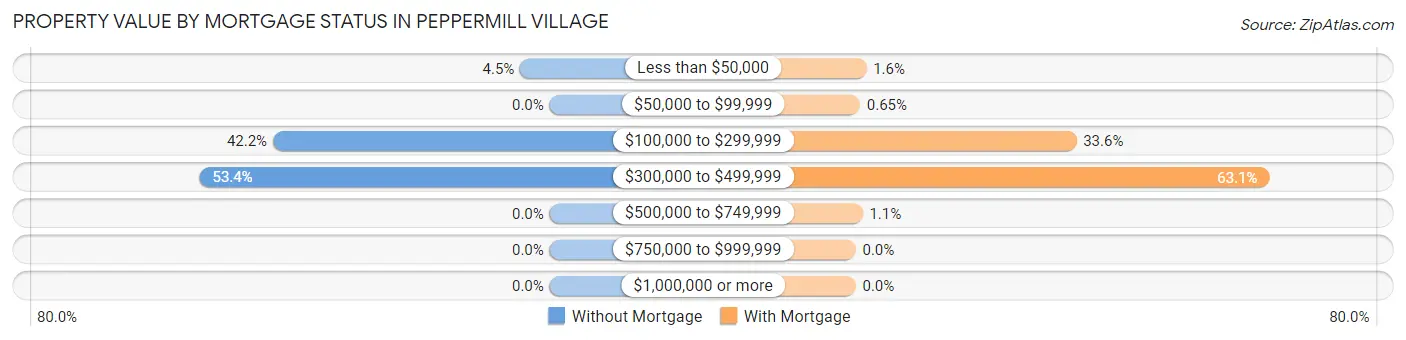
| Property Value | Without Mortgage | With Mortgage |
| Less than $50,000 | 12 (4.5%) | 20 (1.6%) |
| $50,000 to $99,999 | 0 (0.0%) | 8 (0.6%) |
| $100,000 to $299,999 | 113 (42.2%) | 416 (33.6%) |
| $300,000 to $499,999 | 143 (53.4%) | 780 (63.1%) |
| $500,000 to $749,999 | 0 (0.0%) | 13 (1.1%) |
| $750,000 to $999,999 | 0 (0.0%) | 0 (0.0%) |
| $1,000,000 or more | 0 (0.0%) | 0 (0.0%) |
| Total | 268 (100.0%) | 1,237 (100.0%) |
Household Income by Mortgage Status in Peppermill Village
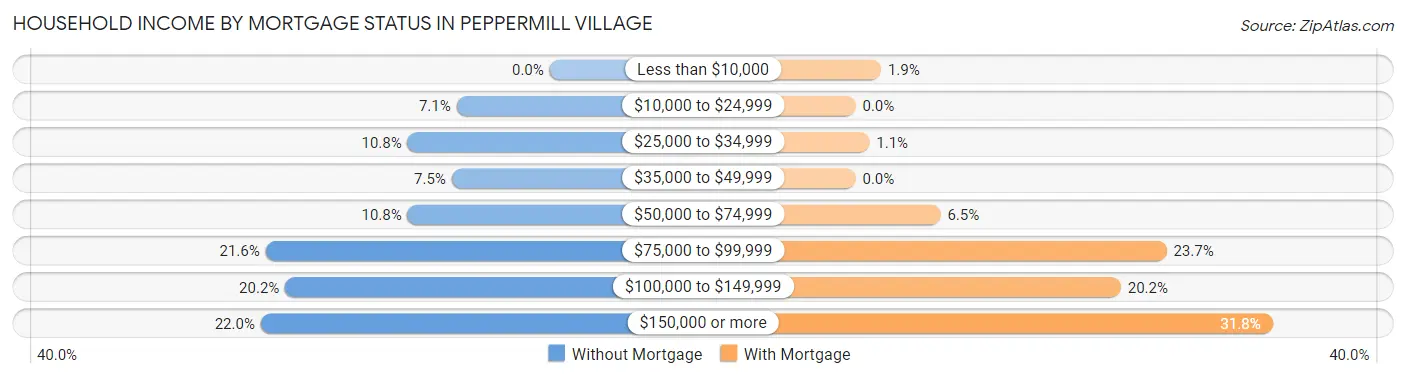
| Household Income | Without Mortgage | With Mortgage |
| Less than $10,000 | 0 (0.0%) | 24 (1.9%) |
| $10,000 to $24,999 | 19 (7.1%) | 0 (0.0%) |
| $25,000 to $34,999 | 29 (10.8%) | 13 (1.1%) |
| $35,000 to $49,999 | 20 (7.5%) | 0 (0.0%) |
| $50,000 to $74,999 | 29 (10.8%) | 80 (6.5%) |
| $75,000 to $99,999 | 58 (21.6%) | 293 (23.7%) |
| $100,000 to $149,999 | 54 (20.2%) | 250 (20.2%) |
| $150,000 or more | 59 (22.0%) | 393 (31.8%) |
| Total | 268 (100.0%) | 1,237 (100.0%) |
Property Value to Household Income Ratio in Peppermill Village
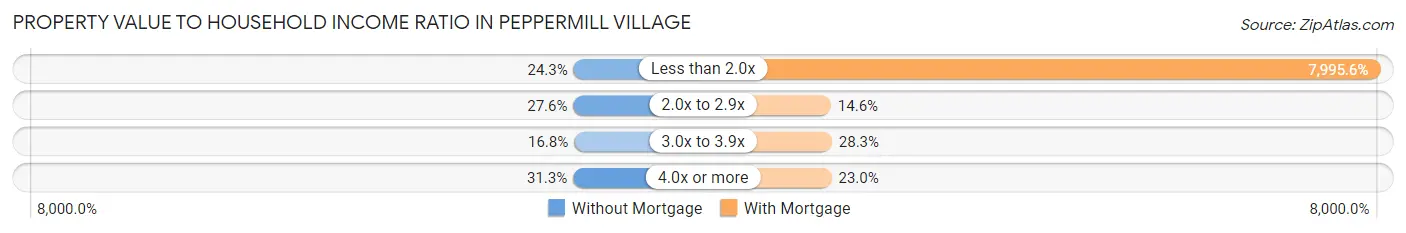
| Value-to-Income Ratio | Without Mortgage | With Mortgage |
| Less than 2.0x | 65 (24.2%) | 98,906 (7,995.6%) |
| 2.0x to 2.9x | 74 (27.6%) | 181 (14.6%) |
| 3.0x to 3.9x | 45 (16.8%) | 350 (28.3%) |
| 4.0x or more | 84 (31.3%) | 285 (23.0%) |
| Total | 268 (100.0%) | 1,237 (100.0%) |
Real Estate Taxes by Mortgage Status in Peppermill Village
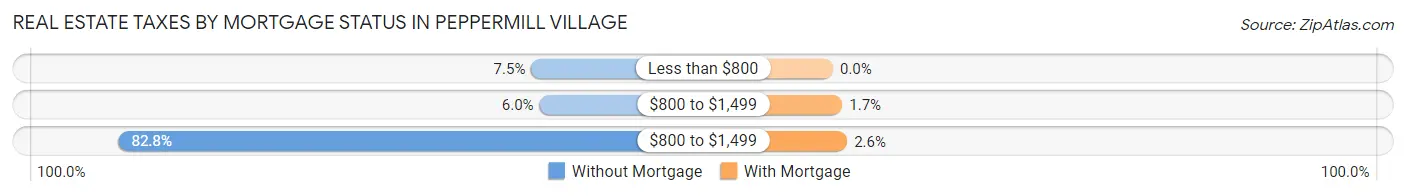
| Property Taxes | Without Mortgage | With Mortgage |
| Less than $800 | 20 (7.5%) | 0 (0.0%) |
| $800 to $1,499 | 16 (6.0%) | 21 (1.7%) |
| $800 to $1,499 | 222 (82.8%) | 32 (2.6%) |
| Total | 268 (100.0%) | 1,237 (100.0%) |
Health & Disability in Peppermill Village
Health Insurance Coverage by Age in Peppermill Village
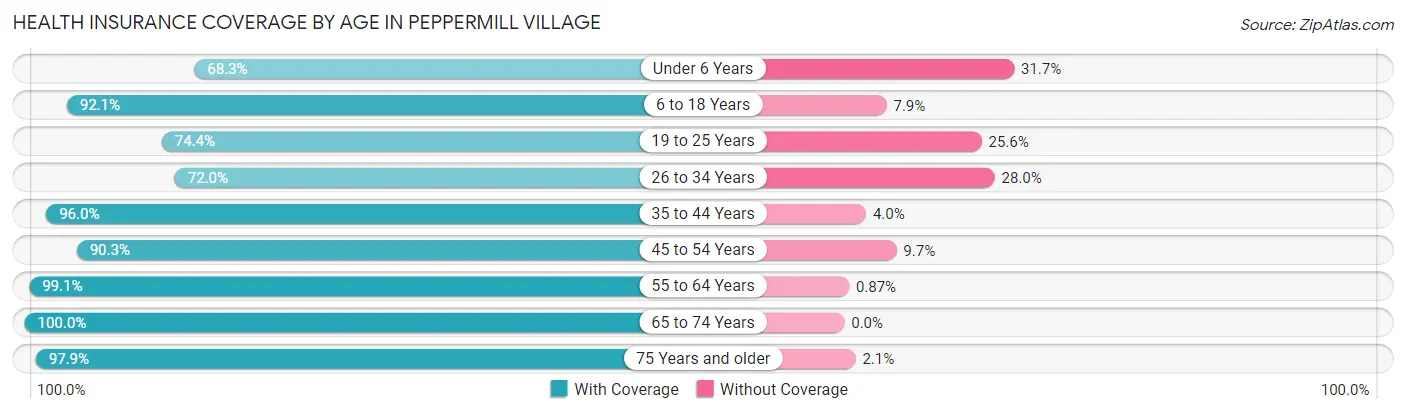
| Age Bracket | With Coverage | Without Coverage |
| Under 6 Years | 354 (68.3%) | 164 (31.7%) |
| 6 to 18 Years | 900 (92.1%) | 77 (7.9%) |
| 19 to 25 Years | 314 (74.4%) | 108 (25.6%) |
| 26 to 34 Years | 498 (72.0%) | 194 (28.0%) |
| 35 to 44 Years | 618 (96.0%) | 26 (4.0%) |
| 45 to 54 Years | 641 (90.3%) | 69 (9.7%) |
| 55 to 64 Years | 680 (99.1%) | 6 (0.9%) |
| 65 to 74 Years | 549 (100.0%) | 0 (0.0%) |
| 75 Years and older | 421 (97.9%) | 9 (2.1%) |
| Total | 4,975 (88.4%) | 653 (11.6%) |
Health Insurance Coverage by Citizenship Status in Peppermill Village
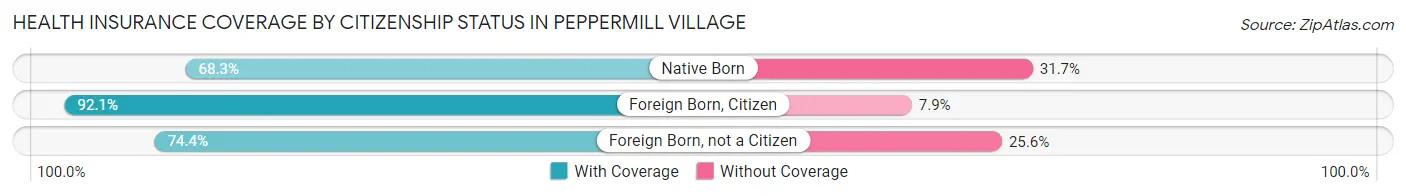
| Citizenship Status | With Coverage | Without Coverage |
| Native Born | 354 (68.3%) | 164 (31.7%) |
| Foreign Born, Citizen | 900 (92.1%) | 77 (7.9%) |
| Foreign Born, not a Citizen | 314 (74.4%) | 108 (25.6%) |
Health Insurance Coverage by Household Income in Peppermill Village
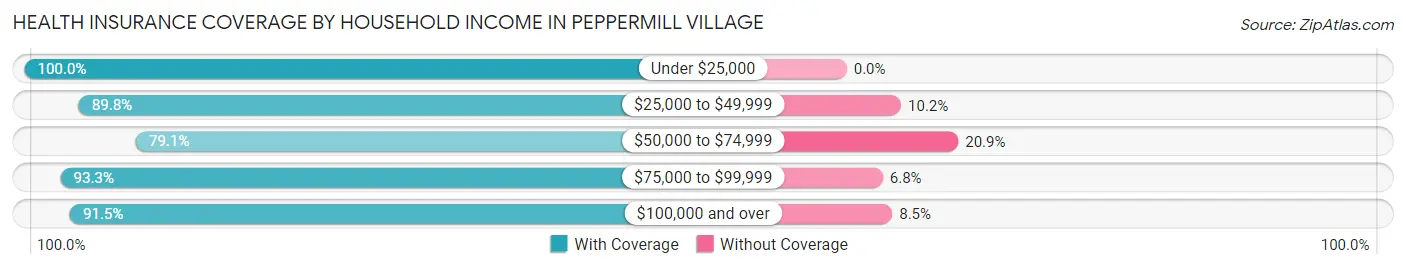
| Household Income | With Coverage | Without Coverage |
| Under $25,000 | 175 (100.0%) | 0 (0.0%) |
| $25,000 to $49,999 | 441 (89.8%) | 50 (10.2%) |
| $50,000 to $74,999 | 1,227 (79.1%) | 324 (20.9%) |
| $75,000 to $99,999 | 774 (93.2%) | 56 (6.8%) |
| $100,000 and over | 2,350 (91.5%) | 219 (8.5%) |
Public vs Private Health Insurance Coverage by Age in Peppermill Village
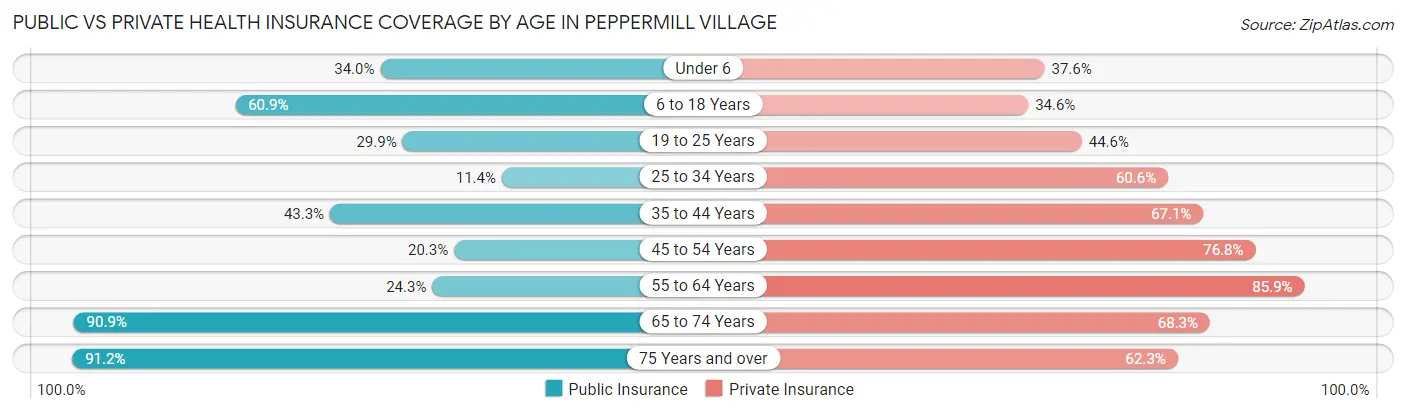
| Age Bracket | Public Insurance | Private Insurance |
| Under 6 | 176 (34.0%) | 195 (37.6%) |
| 6 to 18 Years | 595 (60.9%) | 338 (34.6%) |
| 19 to 25 Years | 126 (29.9%) | 188 (44.6%) |
| 25 to 34 Years | 79 (11.4%) | 419 (60.6%) |
| 35 to 44 Years | 279 (43.3%) | 432 (67.1%) |
| 45 to 54 Years | 144 (20.3%) | 545 (76.8%) |
| 55 to 64 Years | 167 (24.3%) | 589 (85.9%) |
| 65 to 74 Years | 499 (90.9%) | 375 (68.3%) |
| 75 Years and over | 392 (91.2%) | 268 (62.3%) |
| Total | 2,457 (43.7%) | 3,349 (59.5%) |
Disability Status by Sex by Age in Peppermill Village
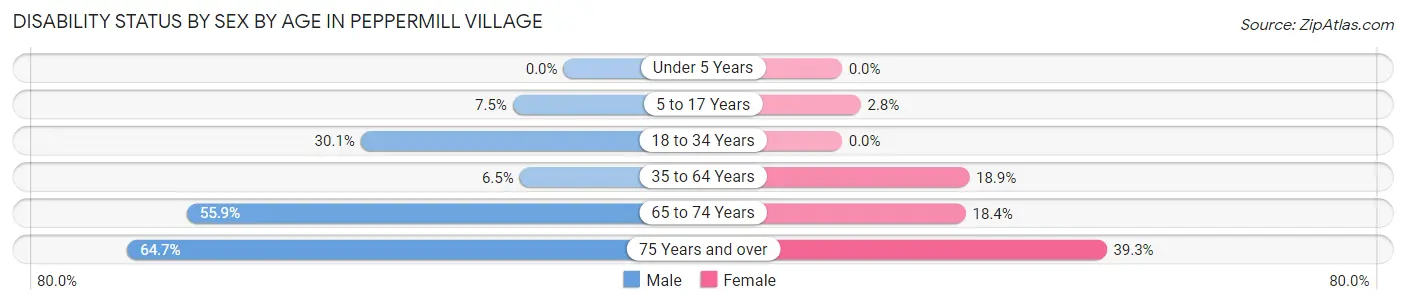
| Age Bracket | Male | Female |
| Under 5 Years | 0 (0.0%) | 0 (0.0%) |
| 5 to 17 Years | 41 (7.5%) | 13 (2.8%) |
| 18 to 34 Years | 177 (30.1%) | 0 (0.0%) |
| 35 to 64 Years | 58 (6.5%) | 217 (18.9%) |
| 65 to 74 Years | 161 (55.9%) | 48 (18.4%) |
| 75 Years and over | 112 (64.7%) | 101 (39.3%) |
Disability Class by Sex by Age in Peppermill Village
Disability Class: Hearing Difficulty
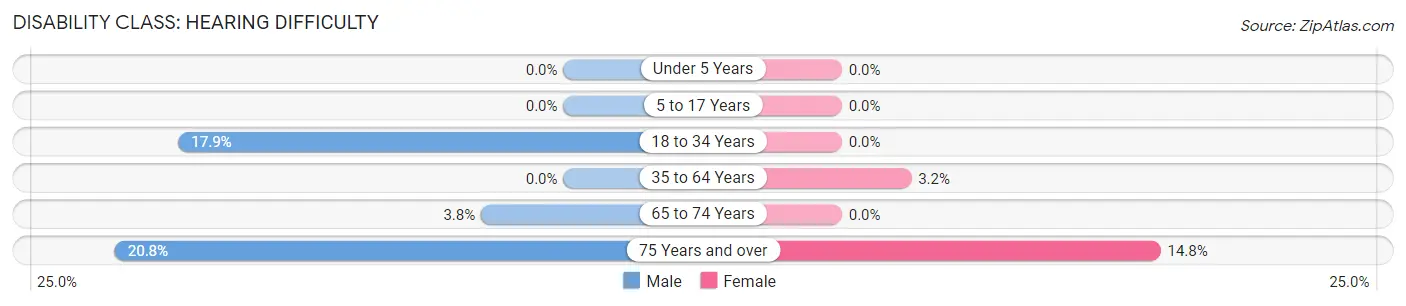
| Age Bracket | Male | Female |
| Under 5 Years | 0 (0.0%) | 0 (0.0%) |
| 5 to 17 Years | 0 (0.0%) | 0 (0.0%) |
| 18 to 34 Years | 105 (17.9%) | 0 (0.0%) |
| 35 to 64 Years | 0 (0.0%) | 37 (3.2%) |
| 65 to 74 Years | 11 (3.8%) | 0 (0.0%) |
| 75 Years and over | 36 (20.8%) | 38 (14.8%) |
Disability Class: Vision Difficulty
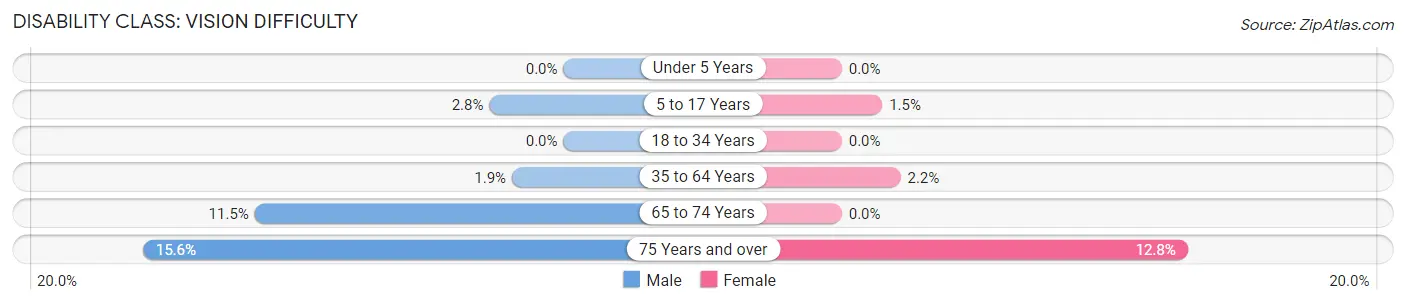
| Age Bracket | Male | Female |
| Under 5 Years | 0 (0.0%) | 0 (0.0%) |
| 5 to 17 Years | 15 (2.8%) | 7 (1.5%) |
| 18 to 34 Years | 0 (0.0%) | 0 (0.0%) |
| 35 to 64 Years | 17 (1.9%) | 25 (2.2%) |
| 65 to 74 Years | 33 (11.5%) | 0 (0.0%) |
| 75 Years and over | 27 (15.6%) | 33 (12.8%) |
Disability Class: Cognitive Difficulty
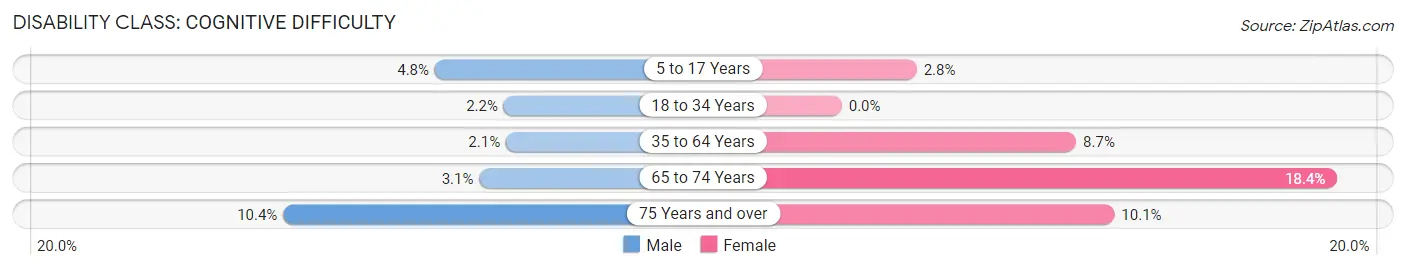
| Age Bracket | Male | Female |
| 5 to 17 Years | 26 (4.8%) | 13 (2.8%) |
| 18 to 34 Years | 13 (2.2%) | 0 (0.0%) |
| 35 to 64 Years | 19 (2.1%) | 100 (8.7%) |
| 65 to 74 Years | 9 (3.1%) | 48 (18.4%) |
| 75 Years and over | 18 (10.4%) | 26 (10.1%) |
Disability Class: Ambulatory Difficulty
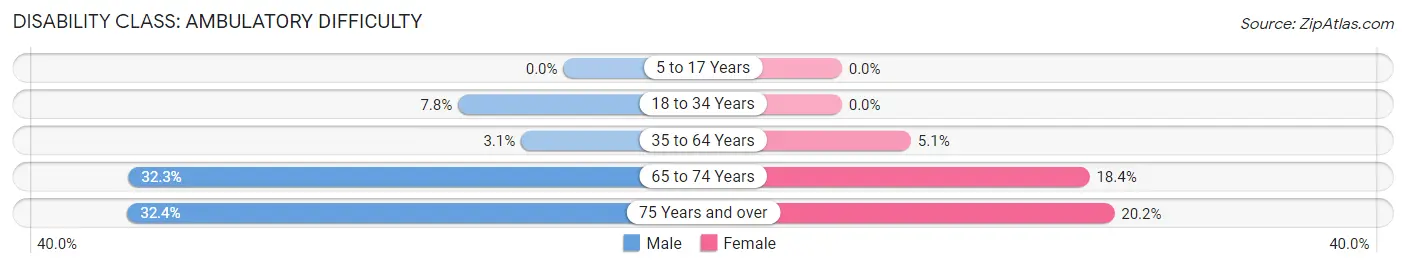
| Age Bracket | Male | Female |
| 5 to 17 Years | 0 (0.0%) | 0 (0.0%) |
| 18 to 34 Years | 46 (7.8%) | 0 (0.0%) |
| 35 to 64 Years | 28 (3.1%) | 59 (5.1%) |
| 65 to 74 Years | 93 (32.3%) | 48 (18.4%) |
| 75 Years and over | 56 (32.4%) | 52 (20.2%) |
Disability Class: Self-Care Difficulty
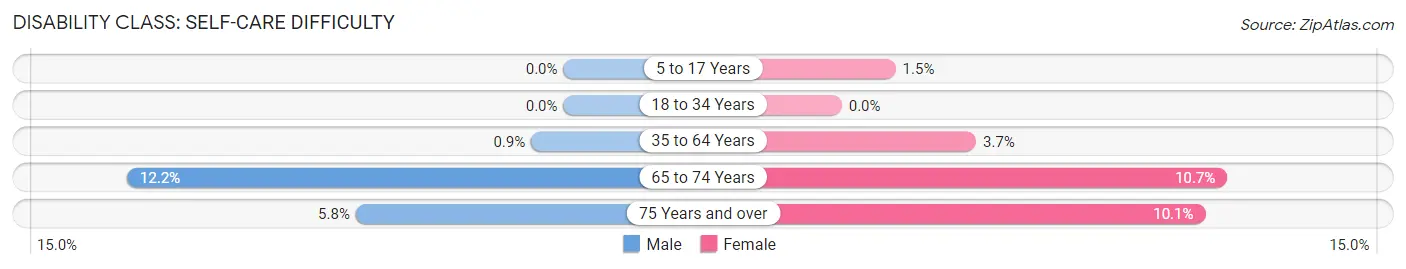
| Age Bracket | Male | Female |
| 5 to 17 Years | 0 (0.0%) | 7 (1.5%) |
| 18 to 34 Years | 0 (0.0%) | 0 (0.0%) |
| 35 to 64 Years | 8 (0.9%) | 43 (3.7%) |
| 65 to 74 Years | 35 (12.1%) | 28 (10.7%) |
| 75 Years and over | 10 (5.8%) | 26 (10.1%) |
Technology Access in Peppermill Village
Computing Device Access in Peppermill Village
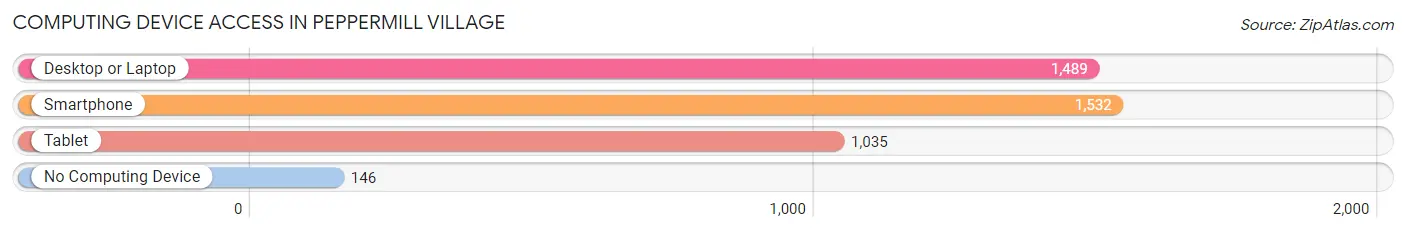
| Device Type | # Households | % Households |
| Desktop or Laptop | 1,489 | 80.0% |
| Smartphone | 1,532 | 82.3% |
| Tablet | 1,035 | 55.6% |
| No Computing Device | 146 | 7.8% |
| Total | 1,862 | 100.0% |
Internet Access in Peppermill Village
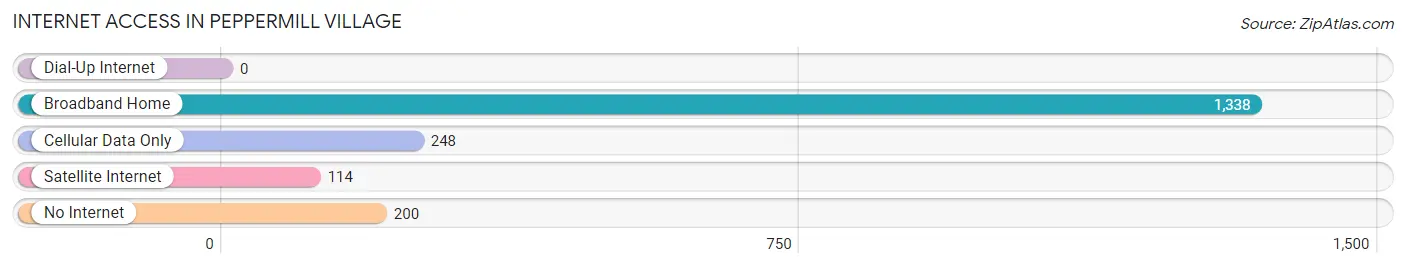
| Internet Type | # Households | % Households |
| Dial-Up Internet | 0 | 0.0% |
| Broadband Home | 1,338 | 71.9% |
| Cellular Data Only | 248 | 13.3% |
| Satellite Internet | 114 | 6.1% |
| No Internet | 200 | 10.7% |
| Total | 1,862 | 100.0% |
Peppermill Village Summary
Peppermill Village is a small, unincorporated community located in Montgomery County, Maryland. It is situated in the northern part of the county, just south of the Potomac River. The village is bordered by the towns of Poolesville and Barnesville to the north, and the city of Rockville to the south. The population of Peppermill Village was estimated to be 1,845 in 2020.
History
Peppermill Village was first settled in the late 1700s by a group of German immigrants. The village was originally known as “Pepper Mill” due to the abundance of pepper mills in the area. The village was officially incorporated in 1887 and was named after the pepper mills.
In the early 1900s, the village was a popular destination for summer vacationers. The village was home to several resorts, including the Peppermill Hotel, which was built in 1910. The hotel was a popular destination for wealthy Washingtonians and was known for its luxurious accommodations and fine dining.
The village was also home to a number of small businesses, including a general store, a blacksmith, and a post office. The village was also home to a number of churches, including the Peppermill Methodist Church, which was founded in 1891.
Geography
Peppermill Village is located in the northern part of Montgomery County, Maryland. It is situated in the Piedmont region of the state, which is characterized by rolling hills and valleys. The village is bordered by the towns of Poolesville and Barnesville to the north, and the city of Rockville to the south.
The village is located approximately 25 miles northwest of Washington, D.C. and is accessible via Interstate 270. The village is also served by the MARC commuter rail line, which provides service to Washington, D.C. and other nearby cities.
Economy
The economy of Peppermill Village is largely based on agriculture and tourism. The village is home to several farms, which produce a variety of crops, including corn, soybeans, and wheat. The village is also home to several wineries, which produce a variety of wines.
The village is also home to several small businesses, including a general store, a blacksmith, and a post office. The village is also home to a number of churches, including the Peppermill Methodist Church, which was founded in 1891.
Demographics
As of 2020, the population of Peppermill Village was estimated to be 1,845. The racial makeup of the village was 87.3% White, 8.2% African American, 0.7% Asian, 0.3% Native American, and 3.5% from other races. The median household income in the village was $76,944, and the median home value was $521,000.
Conclusion
Peppermill Village is a small, unincorporated community located in Montgomery County, Maryland. It is situated in the northern part of the county, just south of the Potomac River. The village is bordered by the towns of Poolesville and Barnesville to the north, and the city of Rockville to the south. The population of Peppermill Village was estimated to be 1,845 in 2020. The economy of the village is largely based on agriculture and tourism, and the village is home to several small businesses, churches, and wineries. The racial makeup of the village is predominantly White, with a small percentage of African American, Asian, and Native American residents. The median household income in the village is $76,944, and the median home value is $521,000.
Common Questions
What is Per Capita Income in Peppermill Village?
Per Capita income in Peppermill Village is $36,542.
What is the Median Family Income in Peppermill Village?
Median Family Income in Peppermill Village is $102,570.
What is the Median Household income in Peppermill Village?
Median Household Income in Peppermill Village is $88,250.
What is Income or Wage Gap in Peppermill Village?
Income or Wage Gap in Peppermill Village is 30.1%.
Women in Peppermill Village earn 69.9 cents for every dollar earned by a man.
What is Inequality or Gini Index in Peppermill Village?
Inequality or Gini Index in Peppermill Village is 0.35.
What is the Total Population of Peppermill Village?
Total Population of Peppermill Village is 5,633.
What is the Total Male Population of Peppermill Village?
Total Male Population of Peppermill Village is 2,638.
What is the Total Female Population of Peppermill Village?
Total Female Population of Peppermill Village is 2,995.
What is the Ratio of Males per 100 Females in Peppermill Village?
There are 88.08 Males per 100 Females in Peppermill Village.
What is the Ratio of Females per 100 Males in Peppermill Village?
There are 113.53 Females per 100 Males in Peppermill Village.
What is the Median Population Age in Peppermill Village?
Median Population Age in Peppermill Village is 37.9 Years.
What is the Average Family Size in Peppermill Village
Average Family Size in Peppermill Village is 3.6 People.
What is the Average Household Size in Peppermill Village
Average Household Size in Peppermill Village is 3.0 People.
How Large is the Labor Force in Peppermill Village?
There are 2,865 People in the Labor Forcein in Peppermill Village.
What is the Percentage of People in the Labor Force in Peppermill Village?
63.9% of People are in the Labor Force in Peppermill Village.
What is the Unemployment Rate in Peppermill Village?
Unemployment Rate in Peppermill Village is 9.8%.