Westphalia, MD Map & Demographics
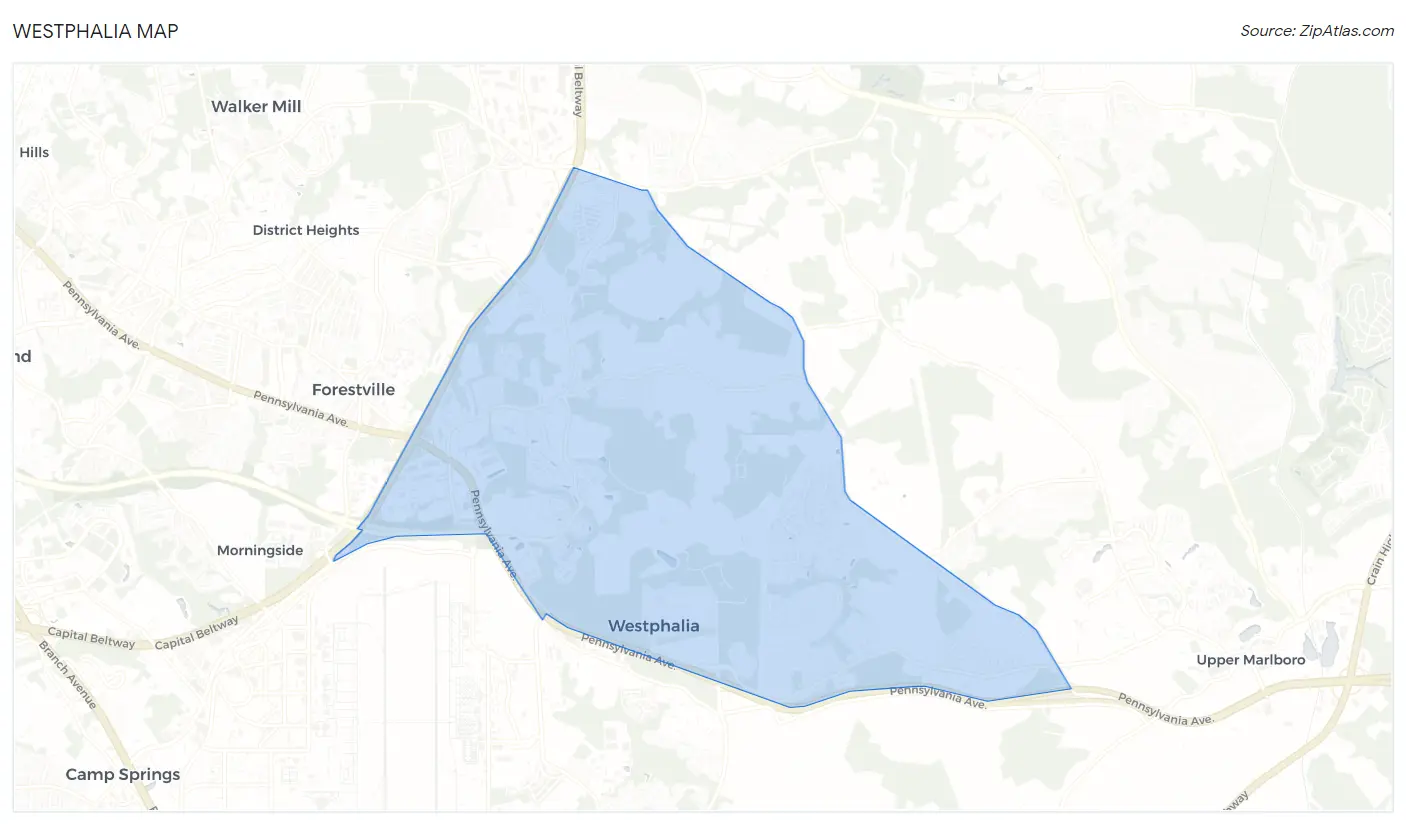
Westphalia Map
Westphalia Overview
$65,425
PER CAPITA INCOME
$178,805
AVG FAMILY INCOME
$150,603
AVG HOUSEHOLD INCOME
15.6%
WAGE / INCOME GAP [ % ]
84.4¢/ $1
WAGE / INCOME GAP [ $ ]
0.31
INEQUALITY / GINI INDEX
11,260
TOTAL POPULATION
5,365
MALE POPULATION
5,895
FEMALE POPULATION
91.01
MALES / 100 FEMALES
109.88
FEMALES / 100 MALES
40.4
MEDIAN AGE
3.3
AVG FAMILY SIZE
2.6
AVG HOUSEHOLD SIZE
7,141
LABOR FORCE [ PEOPLE ]
78.6%
PERCENT IN LABOR FORCE
7.0%
UNEMPLOYMENT RATE
Income in Westphalia
Income Overview in Westphalia
Per Capita Income in Westphalia is $65,425, while median incomes of families and households are $178,805 and $150,603 respectively.
| Characteristic | Number | Measure |
| Per Capita Income | 11,260 | $65,425 |
| Median Family Income | 2,741 | $178,805 |
| Mean Family Income | 2,741 | $180,930 |
| Median Household Income | 4,362 | $150,603 |
| Mean Household Income | 4,362 | $159,303 |
| Income Deficit | 2,741 | $0 |
| Wage / Income Gap (%) | 11,260 | 15.62% |
| Wage / Income Gap ($) | 11,260 | 84.38¢ per $1 |
| Gini / Inequality Index | 11,260 | 0.31 |
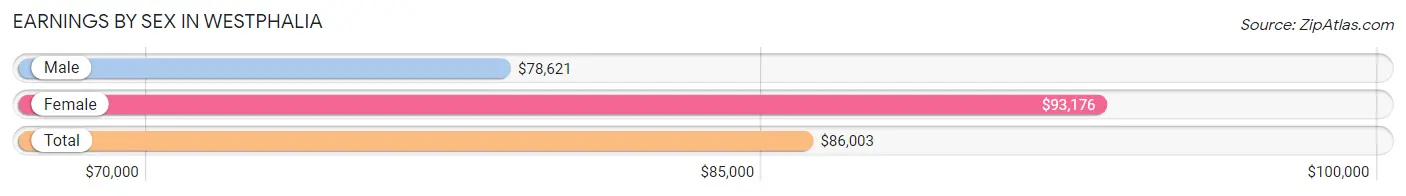
Earnings by Sex in Westphalia
Average Earnings in Westphalia are $86,003, $78,621 for men and $93,176 for women, a difference of 15.6%.
| Sex | Number | Average Earnings |
| Male | 3,500 (49.2%) | $78,621 |
| Female | 3,620 (50.8%) | $93,176 |
| Total | 7,120 (100.0%) | $86,003 |
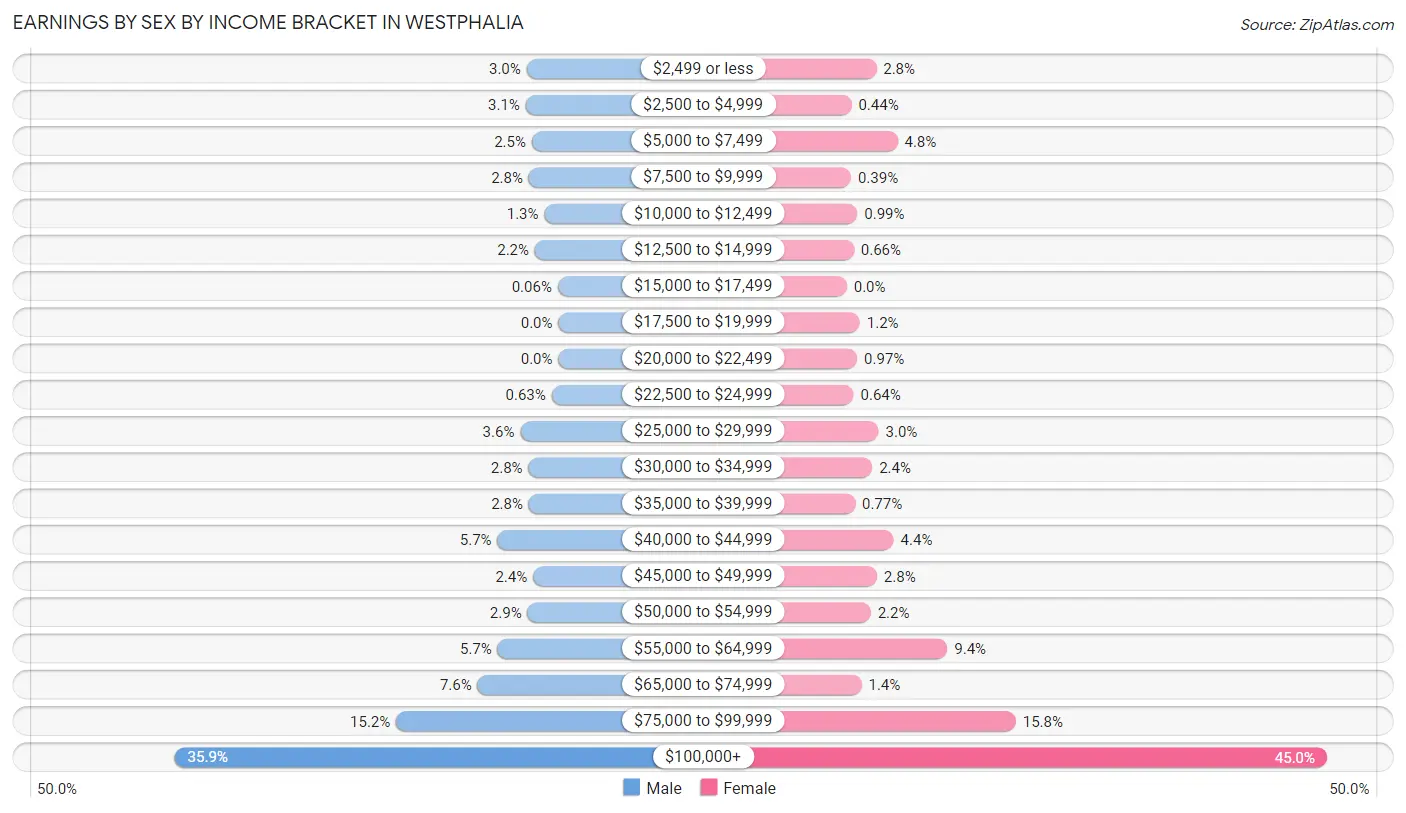
Earnings by Sex by Income Bracket in Westphalia
The most common earnings brackets in Westphalia are $100,000+ for men (1,258 | 35.9%) and $100,000+ for women (1,628 | 45.0%).
| Income | Male | Female |
| $2,499 or less | 104 (3.0%) | 100 (2.8%) |
| $2,500 to $4,999 | 107 (3.1%) | 16 (0.4%) |
| $5,000 to $7,499 | 87 (2.5%) | 172 (4.8%) |
| $7,500 to $9,999 | 97 (2.8%) | 14 (0.4%) |
| $10,000 to $12,499 | 46 (1.3%) | 36 (1.0%) |
| $12,500 to $14,999 | 77 (2.2%) | 24 (0.7%) |
| $15,000 to $17,499 | 2 (0.1%) | 0 (0.0%) |
| $17,500 to $19,999 | 0 (0.0%) | 44 (1.2%) |
| $20,000 to $22,499 | 0 (0.0%) | 35 (1.0%) |
| $22,500 to $24,999 | 22 (0.6%) | 23 (0.6%) |
| $25,000 to $29,999 | 125 (3.6%) | 108 (3.0%) |
| $30,000 to $34,999 | 98 (2.8%) | 86 (2.4%) |
| $35,000 to $39,999 | 97 (2.8%) | 28 (0.8%) |
| $40,000 to $44,999 | 200 (5.7%) | 159 (4.4%) |
| $45,000 to $49,999 | 83 (2.4%) | 102 (2.8%) |
| $50,000 to $54,999 | 101 (2.9%) | 81 (2.2%) |
| $55,000 to $64,999 | 199 (5.7%) | 341 (9.4%) |
| $65,000 to $74,999 | 265 (7.6%) | 50 (1.4%) |
| $75,000 to $99,999 | 532 (15.2%) | 573 (15.8%) |
| $100,000+ | 1,258 (35.9%) | 1,628 (45.0%) |
| Total | 3,500 (100.0%) | 3,620 (100.0%) |
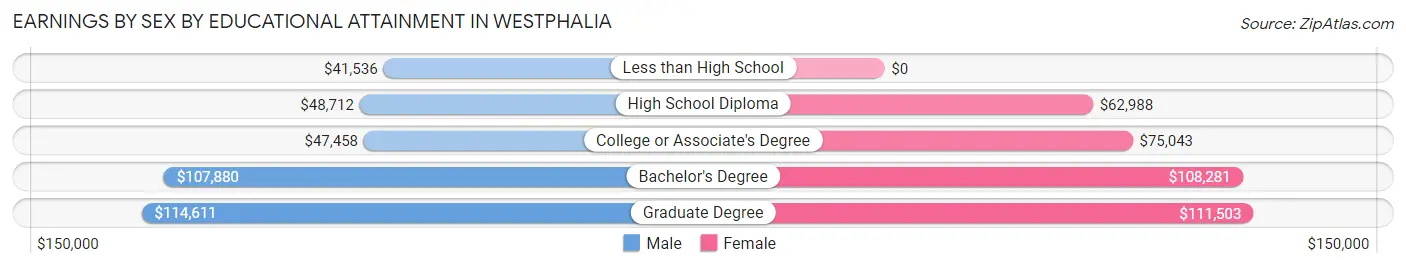
Earnings by Sex by Educational Attainment in Westphalia
Average earnings in Westphalia are $83,099 for men and $97,117 for women, a difference of 14.4%. Men with an educational attainment of graduate degree enjoy the highest average annual earnings of $114,611, while those with less than high school education earn the least with $41,536. Women with an educational attainment of graduate degree earn the most with the average annual earnings of $111,503, while those with high school diploma education have the smallest earnings of $62,988.
| Educational Attainment | Male Income | Female Income |
| Less than High School | $41,536 | $0 |
| High School Diploma | $48,712 | $62,988 |
| College or Associate's Degree | $47,458 | $75,043 |
| Bachelor's Degree | $107,880 | $108,281 |
| Graduate Degree | $114,611 | $111,503 |
| Total | $83,099 | $97,117 |
Family Income in Westphalia
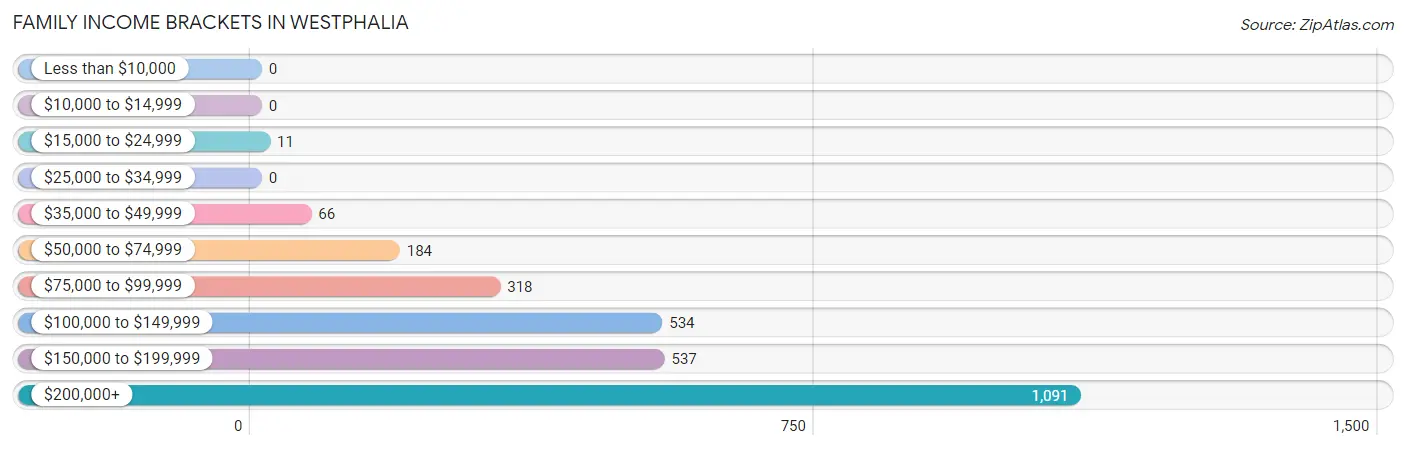
Family Income Brackets in Westphalia
According to the Westphalia family income data, there are 1,091 families falling into the $200,000+ income range, which is the most common income bracket and makes up 39.8% of all families.
| Income Bracket | # Families | % Families |
| Less than $10,000 | 0 | 0.0% |
| $10,000 to $14,999 | 0 | 0.0% |
| $15,000 to $24,999 | 11 | 0.4% |
| $25,000 to $34,999 | 0 | 0.0% |
| $35,000 to $49,999 | 66 | 2.4% |
| $50,000 to $74,999 | 184 | 6.7% |
| $75,000 to $99,999 | 318 | 11.6% |
| $100,000 to $149,999 | 534 | 19.5% |
| $150,000 to $199,999 | 537 | 19.6% |
| $200,000+ | 1,091 | 39.8% |
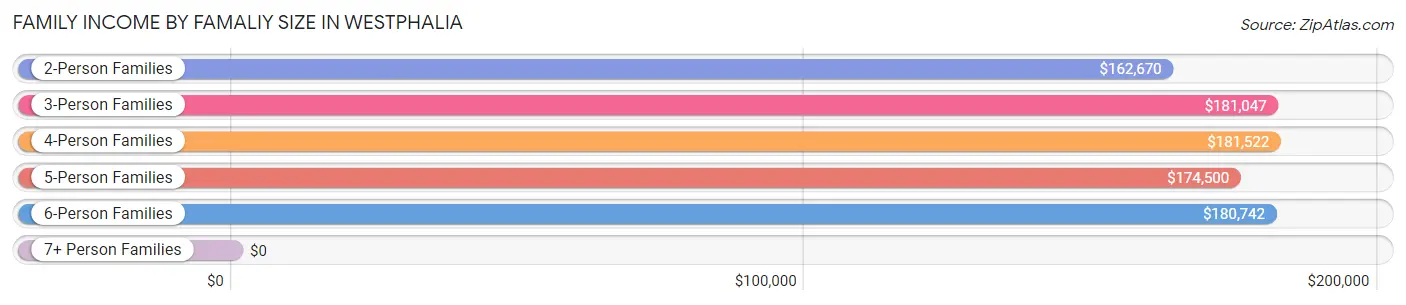
Family Income by Famaliy Size in Westphalia
4-person families (558 | 20.4%) account for the highest median family income in Westphalia with $181,522 per family, while 2-person families (1,037 | 37.8%) have the highest median income of $81,335 per family member.
| Income Bracket | # Families | Median Income |
| 2-Person Families | 1,037 (37.8%) | $162,670 |
| 3-Person Families | 859 (31.3%) | $181,047 |
| 4-Person Families | 558 (20.4%) | $181,522 |
| 5-Person Families | 198 (7.2%) | $174,500 |
| 6-Person Families | 89 (3.3%) | $180,742 |
| 7+ Person Families | 0 (0.0%) | $0 |
| Total | 2,741 (100.0%) | $178,805 |
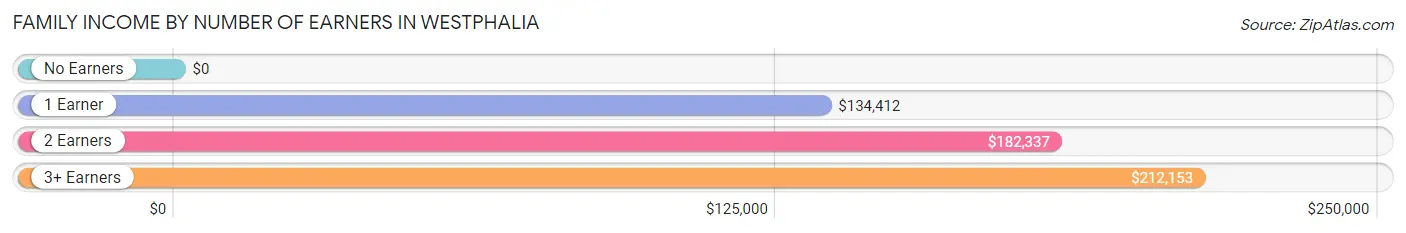
Family Income by Number of Earners in Westphalia
| Number of Earners | # Families | Median Income |
| No Earners | 138 (5.0%) | $0 |
| 1 Earner | 686 (25.0%) | $134,412 |
| 2 Earners | 1,574 (57.4%) | $182,337 |
| 3+ Earners | 343 (12.5%) | $212,153 |
| Total | 2,741 (100.0%) | $178,805 |
Household Income in Westphalia
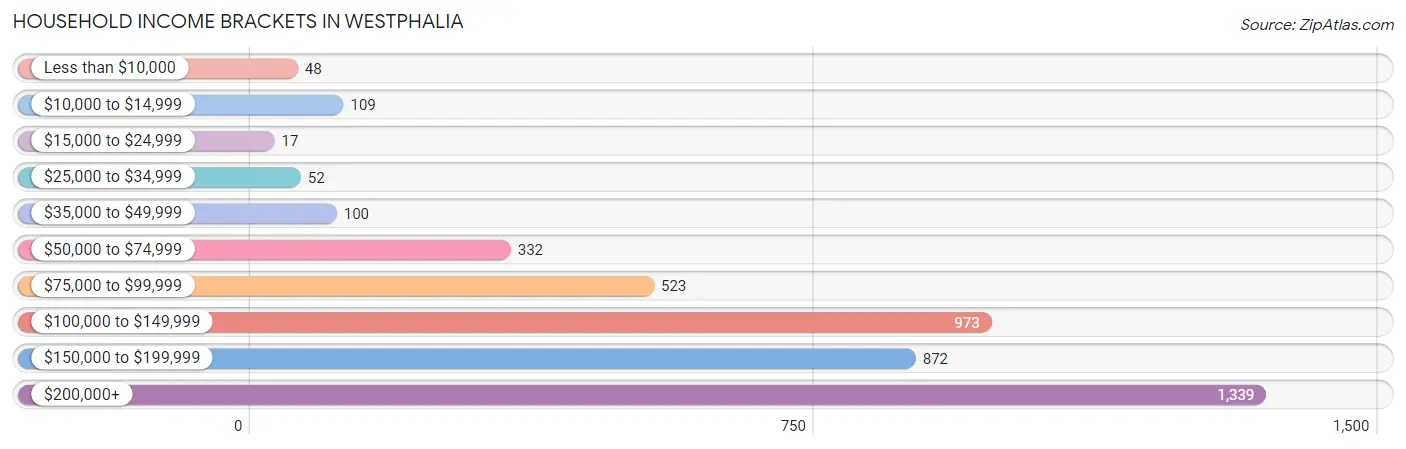
Household Income Brackets in Westphalia
With 1,339 households falling in the category, the $200,000+ income range is the most frequent in Westphalia, accounting for 30.7% of all households. In contrast, only 17 households (0.4%) fall into the $15,000 to $24,999 income bracket, making it the least populous group.
| Income Bracket | # Households | % Households |
| Less than $10,000 | 48 | 1.1% |
| $10,000 to $14,999 | 109 | 2.5% |
| $15,000 to $24,999 | 17 | 0.4% |
| $25,000 to $34,999 | 52 | 1.2% |
| $35,000 to $49,999 | 100 | 2.3% |
| $50,000 to $74,999 | 332 | 7.6% |
| $75,000 to $99,999 | 523 | 12.0% |
| $100,000 to $149,999 | 973 | 22.3% |
| $150,000 to $199,999 | 872 | 20.0% |
| $200,000+ | 1,339 | 30.7% |
Household Income by Householder Age in Westphalia
The median household income in Westphalia is $150,603, with the highest median household income of $178,200 found in the 45 to 64 years age bracket for the primary householder. A total of 1,876 households (43.0%) fall into this category.
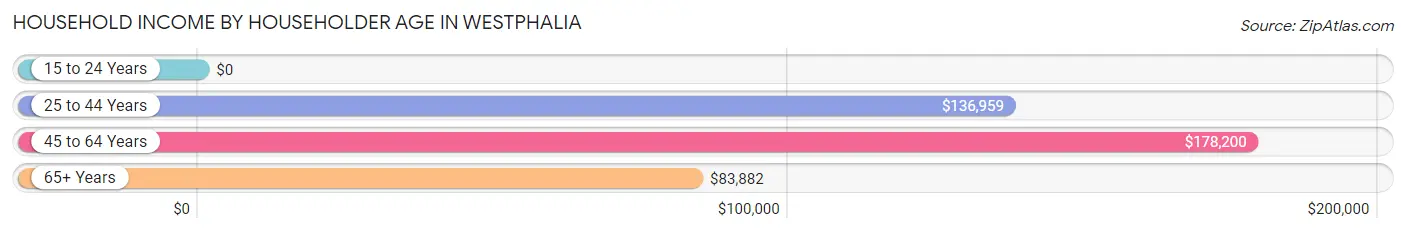
| Income Bracket | # Households | Median Income |
| 15 to 24 Years | 0 (0.0%) | $0 |
| 25 to 44 Years | 1,889 (43.3%) | $136,959 |
| 45 to 64 Years | 1,876 (43.0%) | $178,200 |
| 65+ Years | 597 (13.7%) | $83,882 |
| Total | 4,362 (100.0%) | $150,603 |
Poverty in Westphalia
Income Below Poverty by Sex and Age in Westphalia
With 2.8% poverty level for males and 1.5% for females among the residents of Westphalia, 35 to 44 year old males and 65 to 74 year old females are the most vulnerable to poverty, with 78 males (10.6%) and 52 females (10.3%) in their respective age groups living below the poverty level.
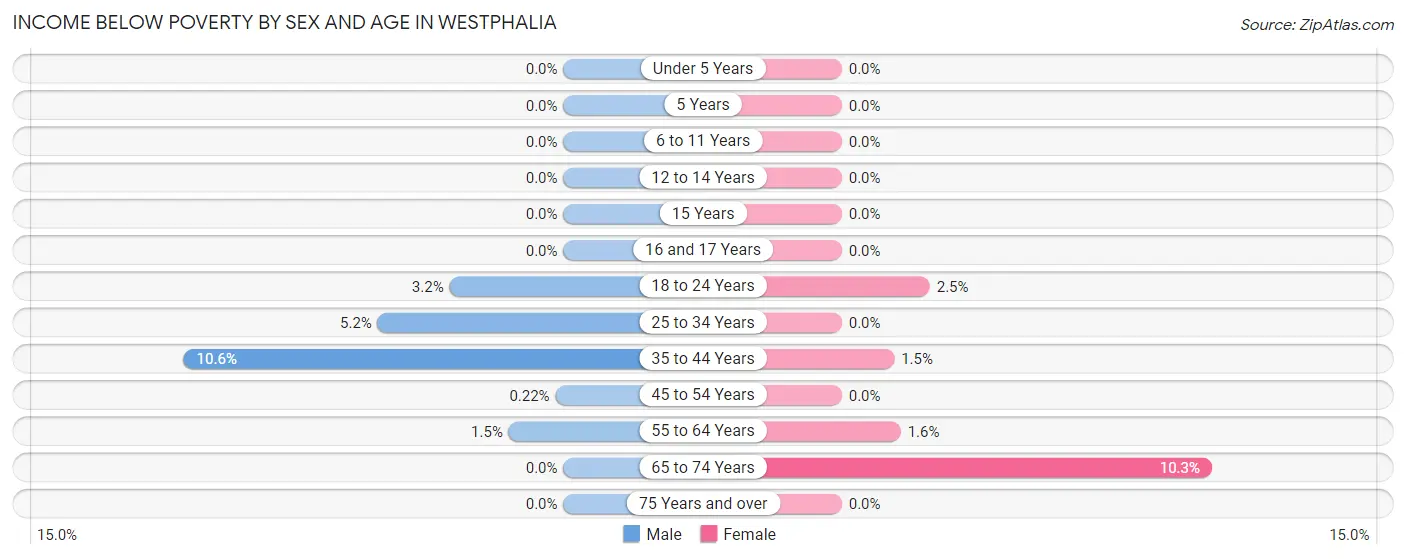
| Age Bracket | Male | Female |
| Under 5 Years | 0 (0.0%) | 0 (0.0%) |
| 5 Years | 0 (0.0%) | 0 (0.0%) |
| 6 to 11 Years | 0 (0.0%) | 0 (0.0%) |
| 12 to 14 Years | 0 (0.0%) | 0 (0.0%) |
| 15 Years | 0 (0.0%) | 0 (0.0%) |
| 16 and 17 Years | 0 (0.0%) | 0 (0.0%) |
| 18 to 24 Years | 7 (3.2%) | 8 (2.5%) |
| 25 to 34 Years | 51 (5.2%) | 0 (0.0%) |
| 35 to 44 Years | 78 (10.6%) | 16 (1.5%) |
| 45 to 54 Years | 2 (0.2%) | 0 (0.0%) |
| 55 to 64 Years | 13 (1.5%) | 14 (1.6%) |
| 65 to 74 Years | 0 (0.0%) | 52 (10.3%) |
| 75 Years and over | 0 (0.0%) | 0 (0.0%) |
| Total | 151 (2.8%) | 90 (1.5%) |
Income Above Poverty by Sex and Age in Westphalia
According to the poverty statistics in Westphalia, males aged under 5 years and females aged under 5 years are the age groups that are most secure financially, with 100.0% of males and 100.0% of females in these age groups living above the poverty line.
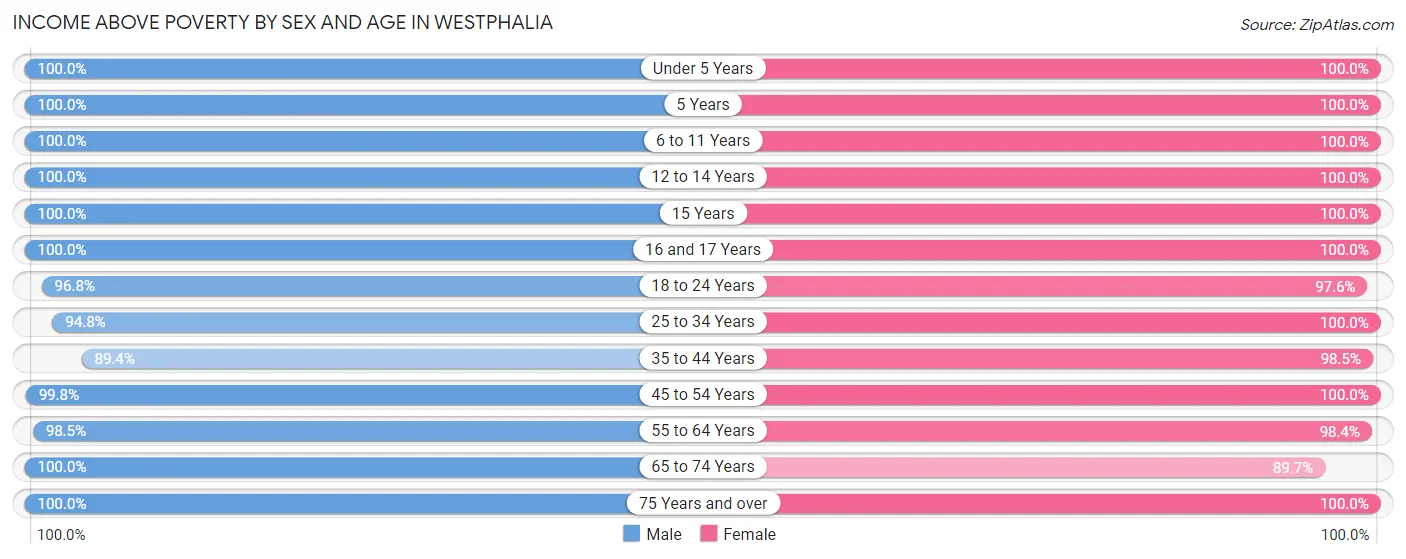
| Age Bracket | Male | Female |
| Under 5 Years | 560 (100.0%) | 478 (100.0%) |
| 5 Years | 77 (100.0%) | 6 (100.0%) |
| 6 to 11 Years | 327 (100.0%) | 327 (100.0%) |
| 12 to 14 Years | 93 (100.0%) | 201 (100.0%) |
| 15 Years | 48 (100.0%) | 28 (100.0%) |
| 16 and 17 Years | 64 (100.0%) | 65 (100.0%) |
| 18 to 24 Years | 214 (96.8%) | 318 (97.6%) |
| 25 to 34 Years | 936 (94.8%) | 940 (100.0%) |
| 35 to 44 Years | 660 (89.4%) | 1,078 (98.5%) |
| 45 to 54 Years | 926 (99.8%) | 837 (100.0%) |
| 55 to 64 Years | 844 (98.5%) | 842 (98.4%) |
| 65 to 74 Years | 290 (100.0%) | 453 (89.7%) |
| 75 Years and over | 145 (100.0%) | 232 (100.0%) |
| Total | 5,184 (97.2%) | 5,805 (98.5%) |
Income Below Poverty Among Married-Couple Families in Westphalia
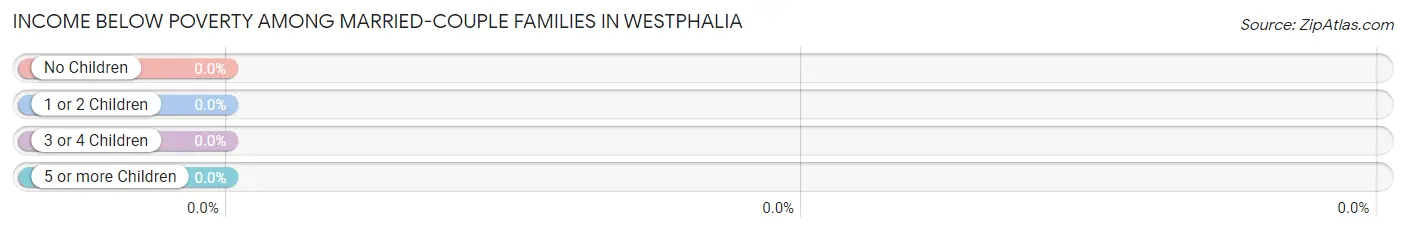
| Children | Above Poverty | Below Poverty |
| No Children | 917 (100.0%) | 0 (0.0%) |
| 1 or 2 Children | 912 (100.0%) | 0 (0.0%) |
| 3 or 4 Children | 115 (100.0%) | 0 (0.0%) |
| 5 or more Children | 0 (0.0%) | 0 (0.0%) |
| Total | 1,944 (100.0%) | 0 (0.0%) |
Income Below Poverty Among Single-Parent Households in Westphalia
| Children | Single Father | Single Mother |
| No Children | 0 (0.0%) | 0 (0.0%) |
| 1 or 2 Children | 0 (0.0%) | 0 (0.0%) |
| 3 or 4 Children | 0 (0.0%) | 0 (0.0%) |
| 5 or more Children | 0 (0.0%) | 0 (0.0%) |
| Total | 0 (0.0%) | 0 (0.0%) |
Income Below Poverty Among Married-Couple vs Single-Parent Households in Westphalia
| Children | Married-Couple Families | Single-Parent Households |
| No Children | 0 (0.0%) | 0 (0.0%) |
| 1 or 2 Children | 0 (0.0%) | 0 (0.0%) |
| 3 or 4 Children | 0 (0.0%) | 0 (0.0%) |
| 5 or more Children | 0 (0.0%) | 0 (0.0%) |
| Total | 0 (0.0%) | 0 (0.0%) |
Race in Westphalia
The most populous races in Westphalia are Black / African American (8,763 | 77.8%), White / Caucasian (1,428 | 12.7%), and Hispanic or Latino (1,120 | 10.0%).
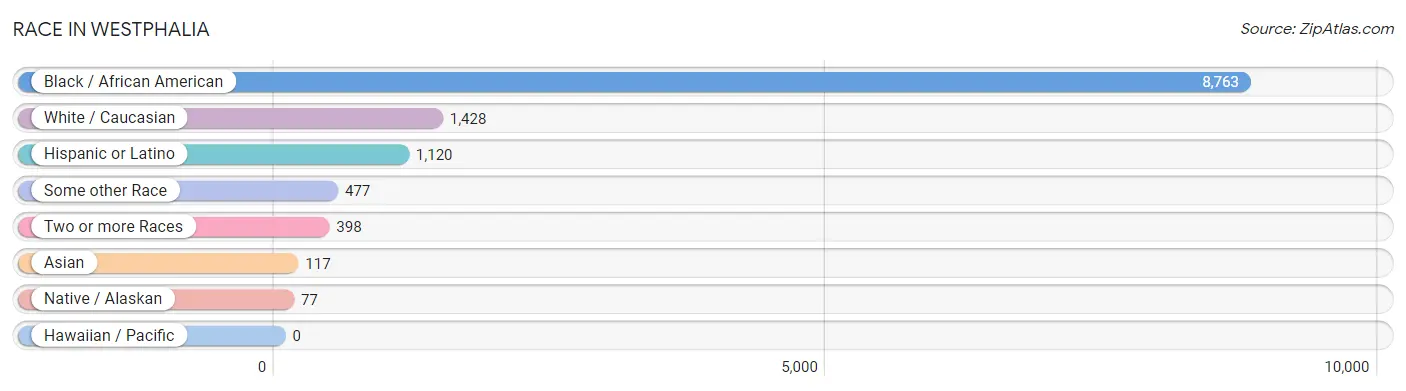
| Race | # Population | % Population |
| Asian | 117 | 1.0% |
| Black / African American | 8,763 | 77.8% |
| Hawaiian / Pacific | 0 | 0.0% |
| Hispanic or Latino | 1,120 | 10.0% |
| Native / Alaskan | 77 | 0.7% |
| White / Caucasian | 1,428 | 12.7% |
| Two or more Races | 398 | 3.5% |
| Some other Race | 477 | 4.2% |
| Total | 11,260 | 100.0% |
Ancestry in Westphalia
The most populous ancestries reported in Westphalia are Subsaharan African (850 | 7.5%), Jamaican (420 | 3.7%), Nigerian (386 | 3.4%), Mexican (334 | 3.0%), and Puerto Rican (320 | 2.8%), together accounting for 20.5% of all Westphalia residents.
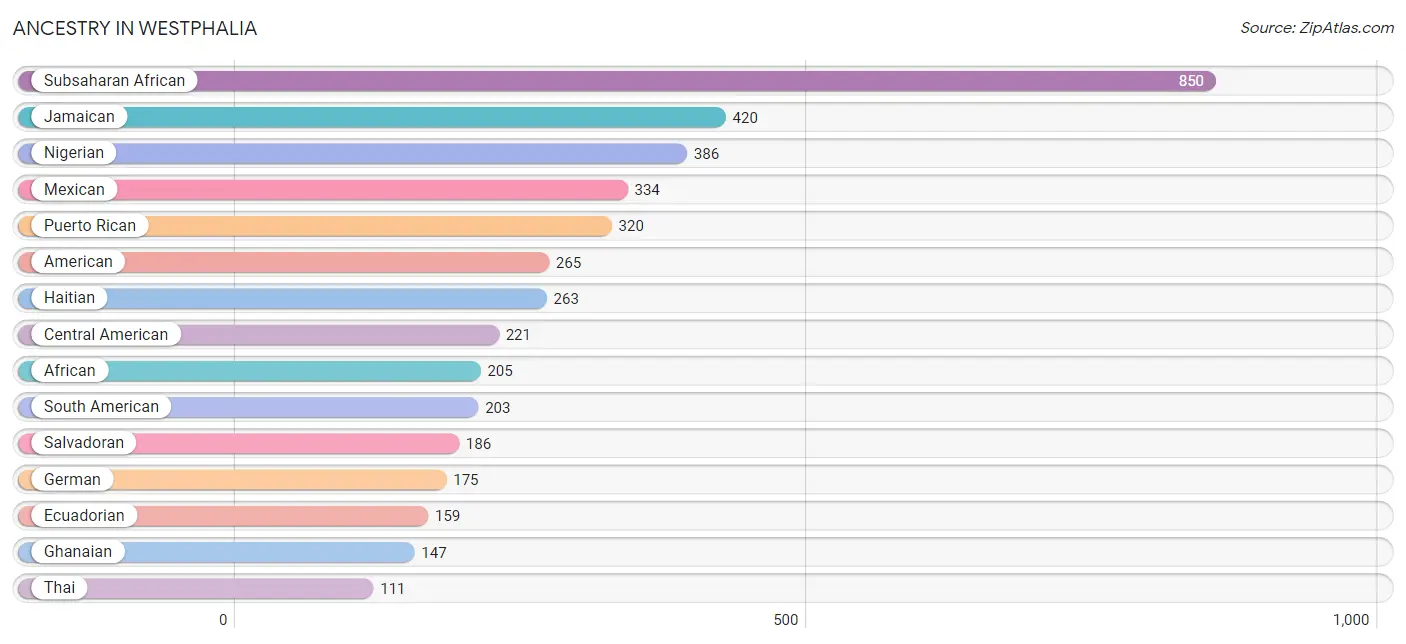
| Ancestry | # Population | % Population |
| African | 205 | 1.8% |
| American | 265 | 2.4% |
| Bahamian | 78 | 0.7% |
| Bolivian | 23 | 0.2% |
| British West Indian | 22 | 0.2% |
| Canadian | 54 | 0.5% |
| Central American | 221 | 2.0% |
| Central American Indian | 31 | 0.3% |
| Cuban | 8 | 0.1% |
| Czech | 52 | 0.5% |
| Dominican | 14 | 0.1% |
| Dutch | 12 | 0.1% |
| Ecuadorian | 159 | 1.4% |
| English | 89 | 0.8% |
| French | 31 | 0.3% |
| German | 175 | 1.5% |
| Ghanaian | 147 | 1.3% |
| Guatemalan | 19 | 0.2% |
| Guyanese | 14 | 0.1% |
| Haitian | 263 | 2.3% |
| Indian (Asian) | 43 | 0.4% |
| Irish | 102 | 0.9% |
| Italian | 67 | 0.6% |
| Jamaican | 420 | 3.7% |
| Korean | 53 | 0.5% |
| Liberian | 65 | 0.6% |
| Mexican | 334 | 3.0% |
| Mexican American Indian | 101 | 0.9% |
| Nigerian | 386 | 3.4% |
| Northern European | 11 | 0.1% |
| Panamanian | 16 | 0.1% |
| Peruvian | 21 | 0.2% |
| Polish | 101 | 0.9% |
| Puerto Rican | 320 | 2.8% |
| Salvadoran | 186 | 1.7% |
| Scottish | 13 | 0.1% |
| Sioux | 45 | 0.4% |
| South American | 203 | 1.8% |
| Spaniard | 20 | 0.2% |
| Sri Lankan | 22 | 0.2% |
| Subsaharan African | 850 | 7.5% |
| Thai | 111 | 1.0% |
| Trinidadian and Tobagonian | 89 | 0.8% |
| West Indian | 104 | 0.9% | View All 44 Rows |
Immigrants in Westphalia
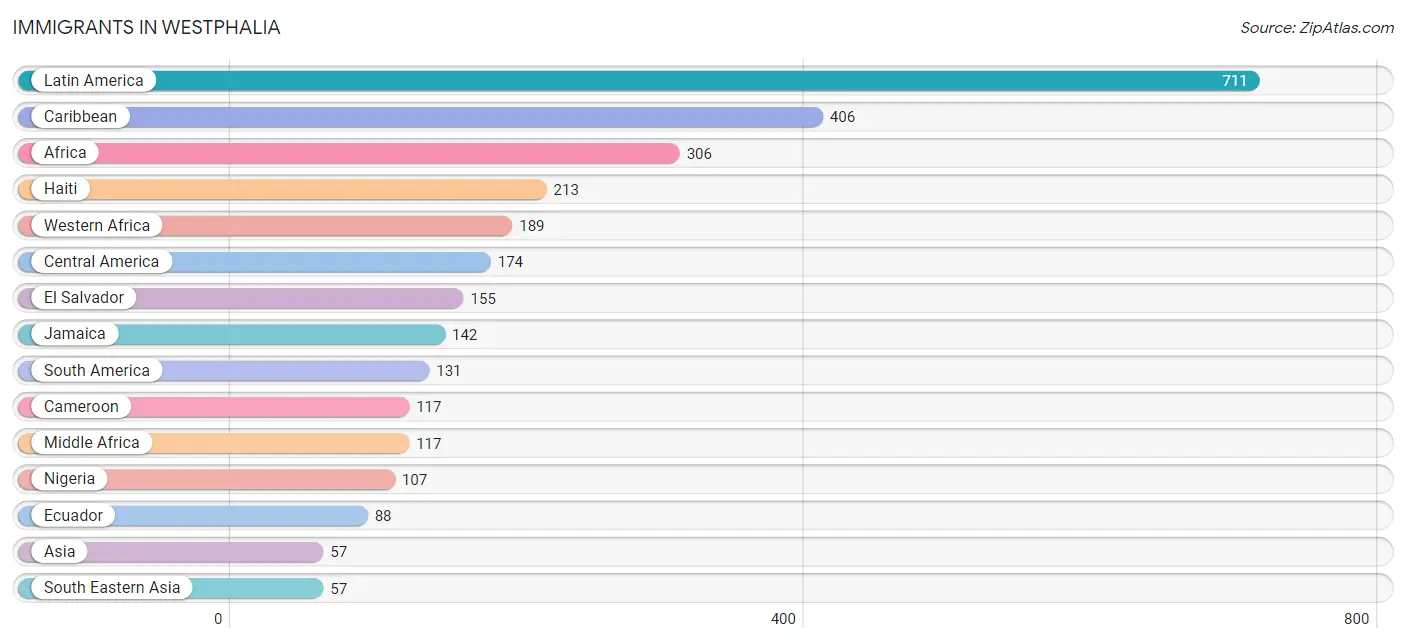
The most numerous immigrant groups reported in Westphalia came from Latin America (711 | 6.3%), Caribbean (406 | 3.6%), Africa (306 | 2.7%), Haiti (213 | 1.9%), and Western Africa (189 | 1.7%), together accounting for 16.2% of all Westphalia residents.
| Immigration Origin | # Population | % Population |
| Africa | 306 | 2.7% |
| Asia | 57 | 0.5% |
| Bolivia | 23 | 0.2% |
| Cameroon | 117 | 1.0% |
| Caribbean | 406 | 3.6% |
| Central America | 174 | 1.5% |
| Dominica | 10 | 0.1% |
| Ecuador | 88 | 0.8% |
| El Salvador | 155 | 1.4% |
| Europe | 18 | 0.2% |
| Germany | 18 | 0.2% |
| Ghana | 35 | 0.3% |
| Guatemala | 19 | 0.2% |
| Guyana | 20 | 0.2% |
| Haiti | 213 | 1.9% |
| Jamaica | 142 | 1.3% |
| Latin America | 711 | 6.3% |
| Liberia | 47 | 0.4% |
| Middle Africa | 117 | 1.0% |
| Nigeria | 107 | 0.9% |
| Philippines | 35 | 0.3% |
| South America | 131 | 1.2% |
| South Eastern Asia | 57 | 0.5% |
| Trinidad and Tobago | 29 | 0.3% |
| Vietnam | 22 | 0.2% |
| Western Africa | 189 | 1.7% |
| Western Europe | 18 | 0.2% | View All 27 Rows |
Sex and Age in Westphalia
Sex and Age in Westphalia
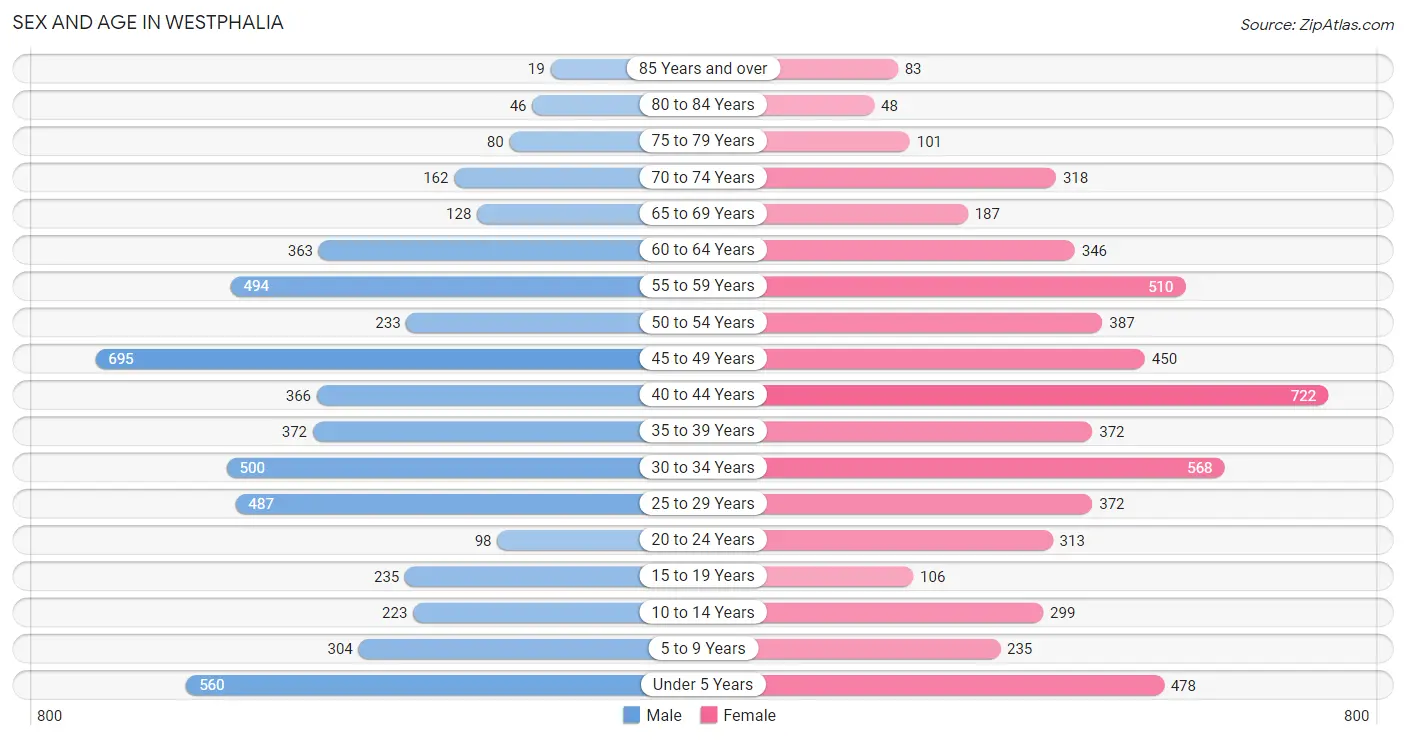
The most populous age groups in Westphalia are 45 to 49 Years (695 | 13.0%) for men and 40 to 44 Years (722 | 12.2%) for women.
| Age Bracket | Male | Female |
| Under 5 Years | 560 (10.4%) | 478 (8.1%) |
| 5 to 9 Years | 304 (5.7%) | 235 (4.0%) |
| 10 to 14 Years | 223 (4.2%) | 299 (5.1%) |
| 15 to 19 Years | 235 (4.4%) | 106 (1.8%) |
| 20 to 24 Years | 98 (1.8%) | 313 (5.3%) |
| 25 to 29 Years | 487 (9.1%) | 372 (6.3%) |
| 30 to 34 Years | 500 (9.3%) | 568 (9.6%) |
| 35 to 39 Years | 372 (6.9%) | 372 (6.3%) |
| 40 to 44 Years | 366 (6.8%) | 722 (12.2%) |
| 45 to 49 Years | 695 (13.0%) | 450 (7.6%) |
| 50 to 54 Years | 233 (4.3%) | 387 (6.6%) |
| 55 to 59 Years | 494 (9.2%) | 510 (8.6%) |
| 60 to 64 Years | 363 (6.8%) | 346 (5.9%) |
| 65 to 69 Years | 128 (2.4%) | 187 (3.2%) |
| 70 to 74 Years | 162 (3.0%) | 318 (5.4%) |
| 75 to 79 Years | 80 (1.5%) | 101 (1.7%) |
| 80 to 84 Years | 46 (0.9%) | 48 (0.8%) |
| 85 Years and over | 19 (0.4%) | 83 (1.4%) |
| Total | 5,365 (100.0%) | 5,895 (100.0%) |
Families and Households in Westphalia
Median Family Size in Westphalia
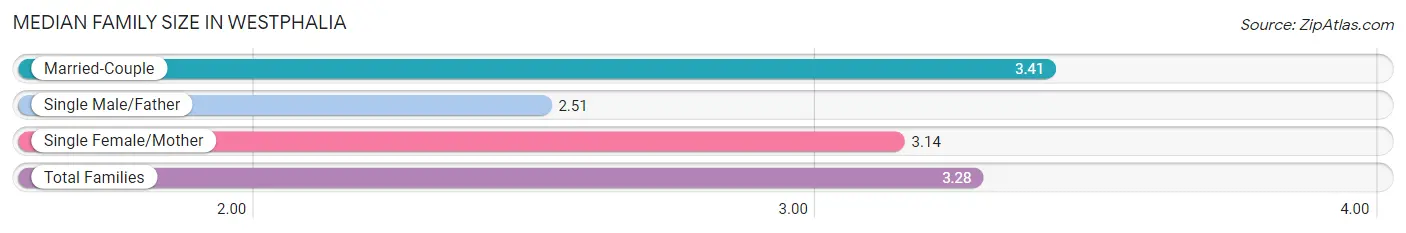
The median family size in Westphalia is 3.28 persons per family, with married-couple families (1,944 | 70.9%) accounting for the largest median family size of 3.41 persons per family. On the other hand, single male/father families (241 | 8.8%) represent the smallest median family size with 2.51 persons per family.
| Family Type | # Families | Family Size |
| Married-Couple | 1,944 (70.9%) | 3.41 |
| Single Male/Father | 241 (8.8%) | 2.51 |
| Single Female/Mother | 556 (20.3%) | 3.14 |
| Total Families | 2,741 (100.0%) | 3.28 |
Median Household Size in Westphalia
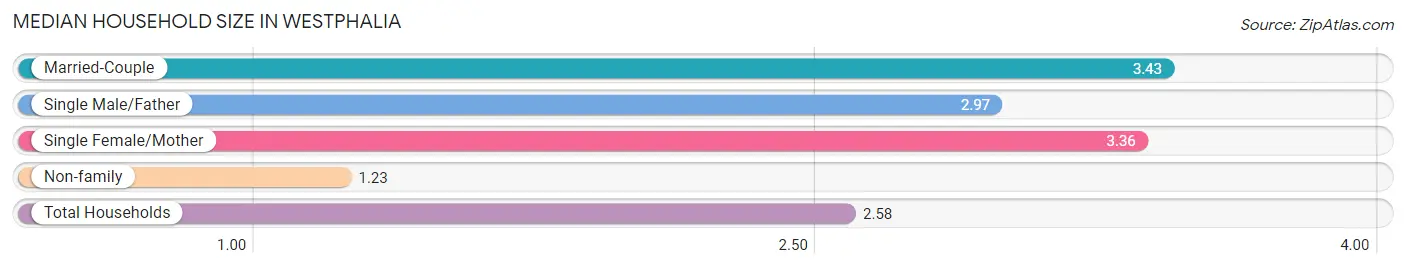
The median household size in Westphalia is 2.58 persons per household, with married-couple households (1,944 | 44.6%) accounting for the largest median household size of 3.43 persons per household. non-family households (1,621 | 37.2%) represent the smallest median household size with 1.23 persons per household.
| Household Type | # Households | Household Size |
| Married-Couple | 1,944 (44.6%) | 3.43 |
| Single Male/Father | 241 (5.5%) | 2.97 |
| Single Female/Mother | 556 (12.8%) | 3.36 |
| Non-family | 1,621 (37.2%) | 1.23 |
| Total Households | 4,362 (100.0%) | 2.58 |
Household Size by Marriage Status in Westphalia
Out of a total of 4,362 households in Westphalia, 2,741 (62.8%) are family households, while 1,621 (37.2%) are nonfamily households. The most numerous type of family households are 3-person households, comprising 988, and the most common type of nonfamily households are 1-person households, comprising 1,381.
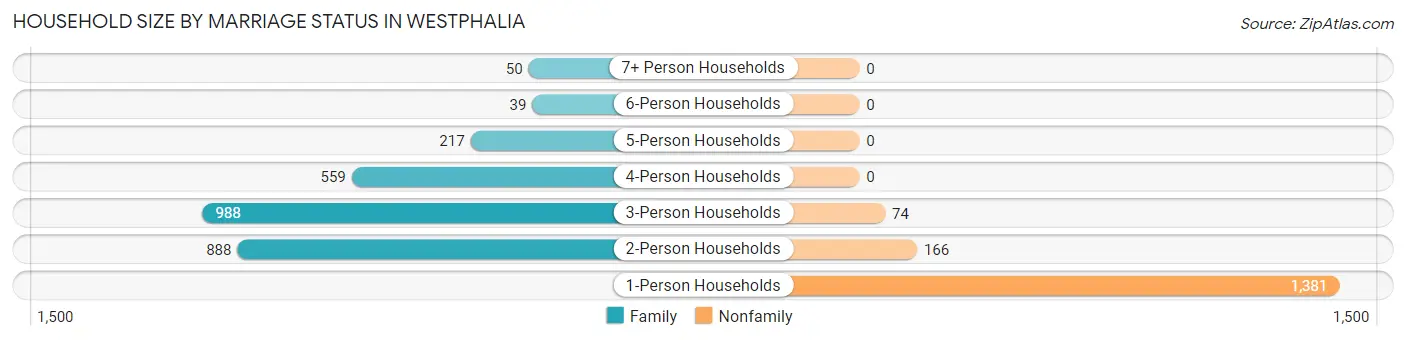
| Household Size | Family Households | Nonfamily Households |
| 1-Person Households | - | 1,381 (31.7%) |
| 2-Person Households | 888 (20.4%) | 166 (3.8%) |
| 3-Person Households | 988 (22.7%) | 74 (1.7%) |
| 4-Person Households | 559 (12.8%) | 0 (0.0%) |
| 5-Person Households | 217 (5.0%) | 0 (0.0%) |
| 6-Person Households | 39 (0.9%) | 0 (0.0%) |
| 7+ Person Households | 50 (1.1%) | 0 (0.0%) |
| Total | 2,741 (62.8%) | 1,621 (37.2%) |
Female Fertility in Westphalia
Fertility by Age in Westphalia
Average fertility rate in Westphalia is 40.0 births per 1,000 women. Women in the age bracket of 20 to 34 years have the highest fertility rate with 74.0 births per 1,000 women. Women in the age bracket of 20 to 34 years acount for 76.9% of all women with births.
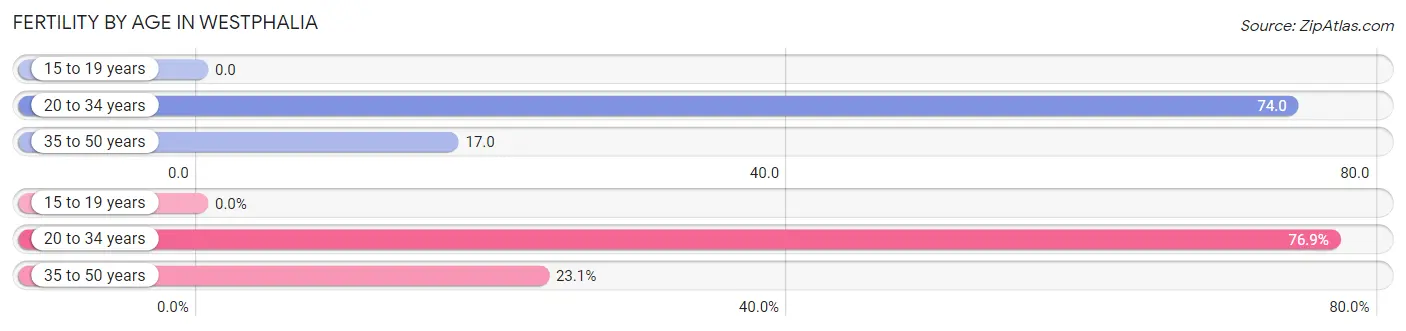
| Age Bracket | Women with Births | Births / 1,000 Women |
| 15 to 19 years | 0 (0.0%) | 0.0 |
| 20 to 34 years | 93 (76.9%) | 74.0 |
| 35 to 50 years | 28 (23.1%) | 17.0 |
| Total | 121 (100.0%) | 40.0 |
Fertility by Age by Marriage Status in Westphalia
85.1% of women with births (121) in Westphalia are married. The highest percentage of unmarried women with births falls into 20 to 34 years age bracket with 19.4% of them unmarried at the time of birth, while the lowest percentage of unmarried women with births belong to 35 to 50 years age bracket with 0.0% of them unmarried.
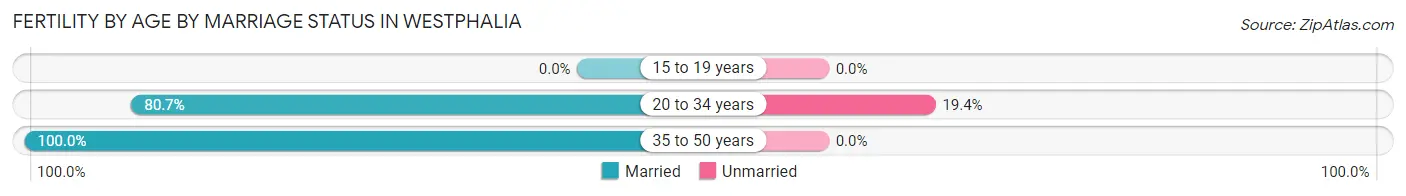
| Age Bracket | Married | Unmarried |
| 15 to 19 years | 0 (0.0%) | 0 (0.0%) |
| 20 to 34 years | 75 (80.6%) | 18 (19.4%) |
| 35 to 50 years | 28 (100.0%) | 0 (0.0%) |
| Total | 103 (85.1%) | 18 (14.9%) |
Fertility by Education in Westphalia
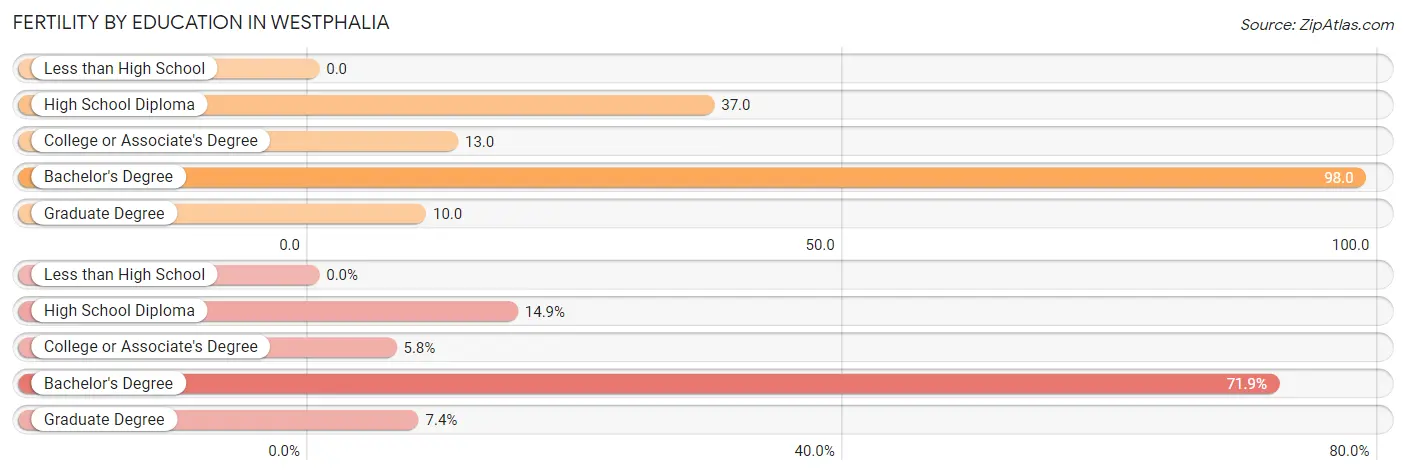
| Educational Attainment | Women with Births | Births / 1,000 Women |
| Less than High School | 0 (0.0%) | 0.0 |
| High School Diploma | 18 (14.9%) | 37.0 |
| College or Associate's Degree | 7 (5.8%) | 13.0 |
| Bachelor's Degree | 87 (71.9%) | 98.0 |
| Graduate Degree | 9 (7.4%) | 10.0 |
| Total | 121 (100.0%) | 40.0 |
Fertility by Education by Marriage Status in Westphalia
14.9% of women with births in Westphalia are unmarried. Women with the educational attainment of college or associate's degree are most likely to be married with 100.0% of them married at childbirth, while women with the educational attainment of high school diploma are least likely to be married with 100.0% of them unmarried at childbirth.
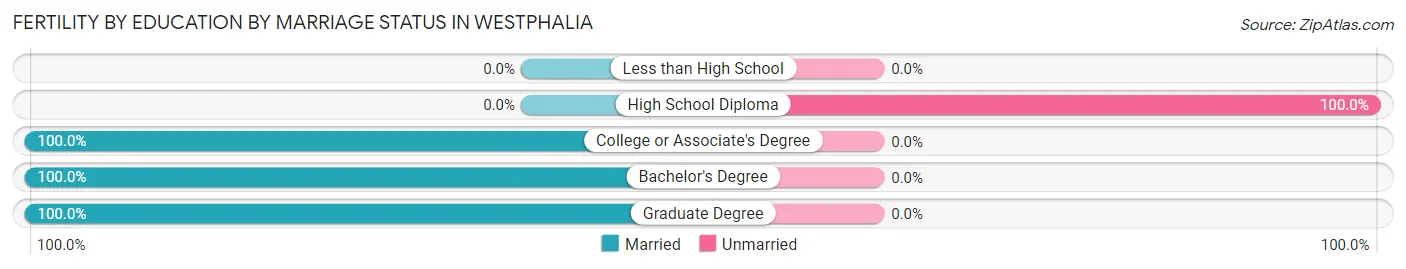
| Educational Attainment | Married | Unmarried |
| Less than High School | 0 (0.0%) | 0 (0.0%) |
| High School Diploma | 0 (0.0%) | 18 (100.0%) |
| College or Associate's Degree | 7 (100.0%) | 0 (0.0%) |
| Bachelor's Degree | 87 (100.0%) | 0 (0.0%) |
| Graduate Degree | 9 (100.0%) | 0 (0.0%) |
| Total | 103 (85.1%) | 18 (14.9%) |
Employment Characteristics in Westphalia
Employment by Class of Employer in Westphalia
Among the 6,590 employed individuals in Westphalia, private company employees (3,118 | 47.3%), federal government employees (1,907 | 28.9%), and local government employees (601 | 9.1%) make up the most common classes of employment.
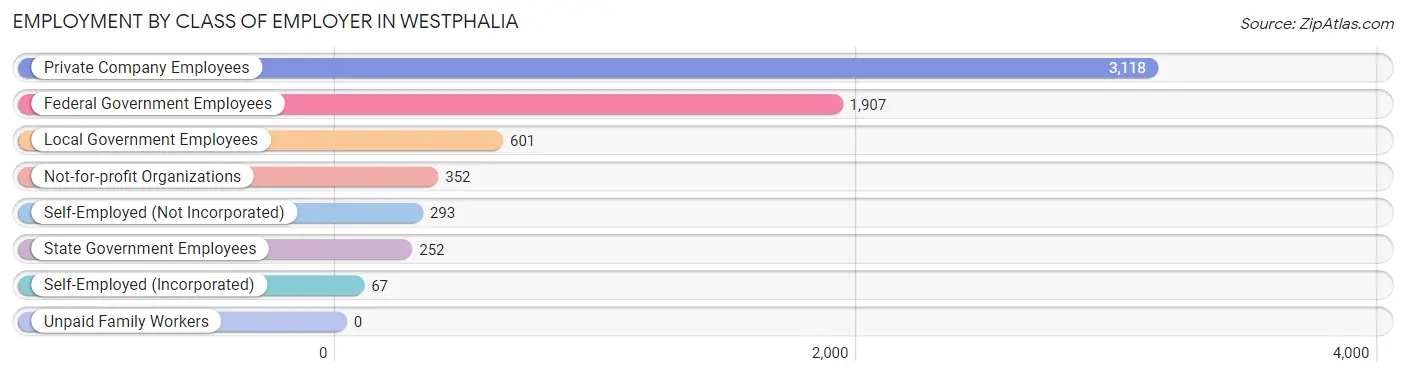
| Employer Class | # Employees | % Employees |
| Private Company Employees | 3,118 | 47.3% |
| Self-Employed (Incorporated) | 67 | 1.0% |
| Self-Employed (Not Incorporated) | 293 | 4.4% |
| Not-for-profit Organizations | 352 | 5.3% |
| Local Government Employees | 601 | 9.1% |
| State Government Employees | 252 | 3.8% |
| Federal Government Employees | 1,907 | 28.9% |
| Unpaid Family Workers | 0 | 0.0% |
| Total | 6,590 | 100.0% |
Employment Status by Age in Westphalia
According to the labor force statistics for Westphalia, out of the total population over 16 years of age (9,085), 78.6% or 7,141 individuals are in the labor force, with 7.0% or 500 of them unemployed. The age group with the highest labor force participation rate is 25 to 29 years, with 98.1% or 843 individuals in the labor force. Within the labor force, the 20 to 24 years age range has the highest percentage of unemployed individuals, with 23.0% or 76 of them being unemployed.
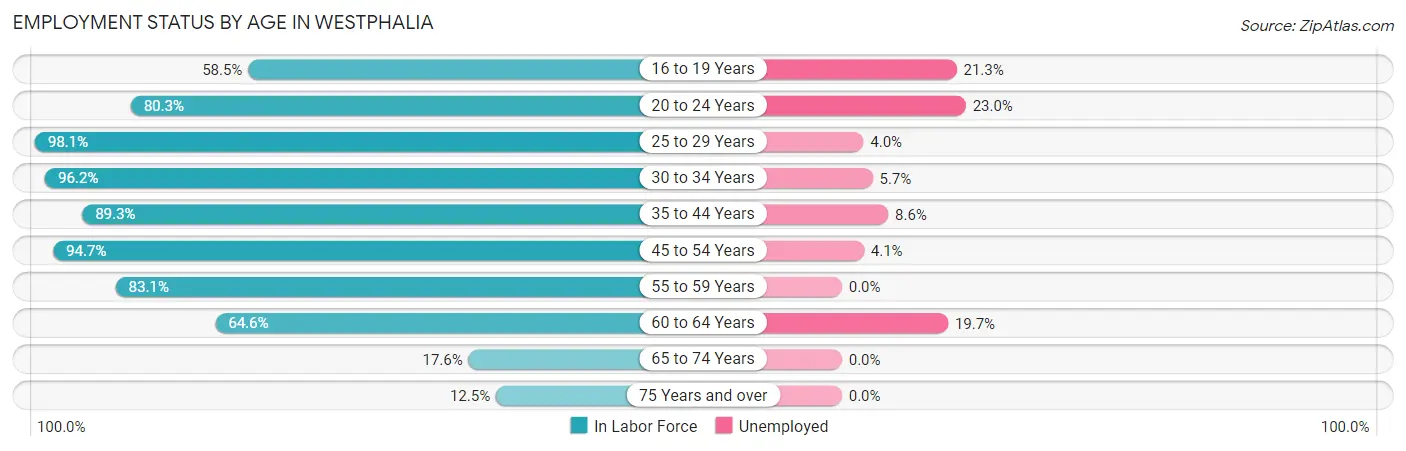
| Age Bracket | In Labor Force | Unemployed |
| 16 to 19 Years | 155 (58.5%) | 33 (21.3%) |
| 20 to 24 Years | 330 (80.3%) | 76 (23.0%) |
| 25 to 29 Years | 843 (98.1%) | 34 (4.0%) |
| 30 to 34 Years | 1,027 (96.2%) | 59 (5.7%) |
| 35 to 44 Years | 1,636 (89.3%) | 141 (8.6%) |
| 45 to 54 Years | 1,671 (94.7%) | 69 (4.1%) |
| 55 to 59 Years | 834 (83.1%) | 0 (0.0%) |
| 60 to 64 Years | 458 (64.6%) | 90 (19.7%) |
| 65 to 74 Years | 140 (17.6%) | 0 (0.0%) |
| 75 Years and over | 47 (12.5%) | 0 (0.0%) |
| Total | 7,141 (78.6%) | 500 (7.0%) |
Employment Status by Educational Attainment in Westphalia
According to labor force statistics for Westphalia, 89.4% of individuals (6,470) out of the total population between 25 and 64 years of age (7,237) are in the labor force, with 6.0% or 388 of them being unemployed. The group with the highest labor force participation rate are those with the educational attainment of bachelor's degree or higher, with 94.2% or 3,786 individuals in the labor force. Within the labor force, individuals with high school diploma education have the highest percentage of unemployment, with 9.6% or 89 of them being unemployed.
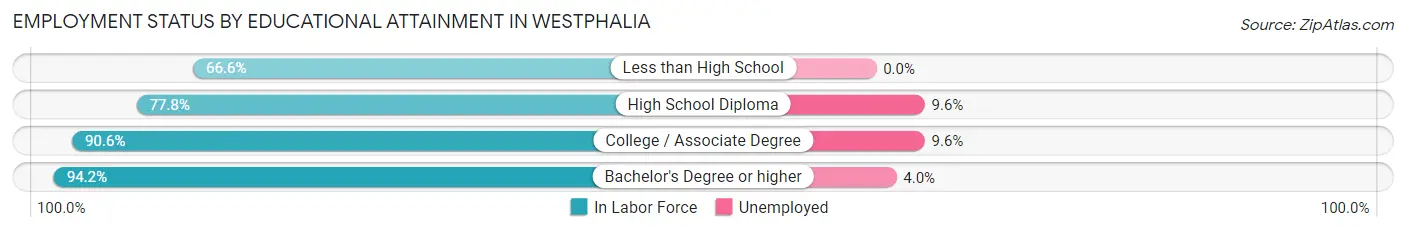
| Educational Attainment | In Labor Force | Unemployed |
| Less than High School | 219 (66.6%) | 0 (0.0%) |
| High School Diploma | 927 (77.8%) | 114 (9.6%) |
| College / Associate Degree | 1,537 (90.6%) | 163 (9.6%) |
| Bachelor's Degree or higher | 3,786 (94.2%) | 161 (4.0%) |
| Total | 6,470 (89.4%) | 434 (6.0%) |
Employment Occupations by Sex in Westphalia
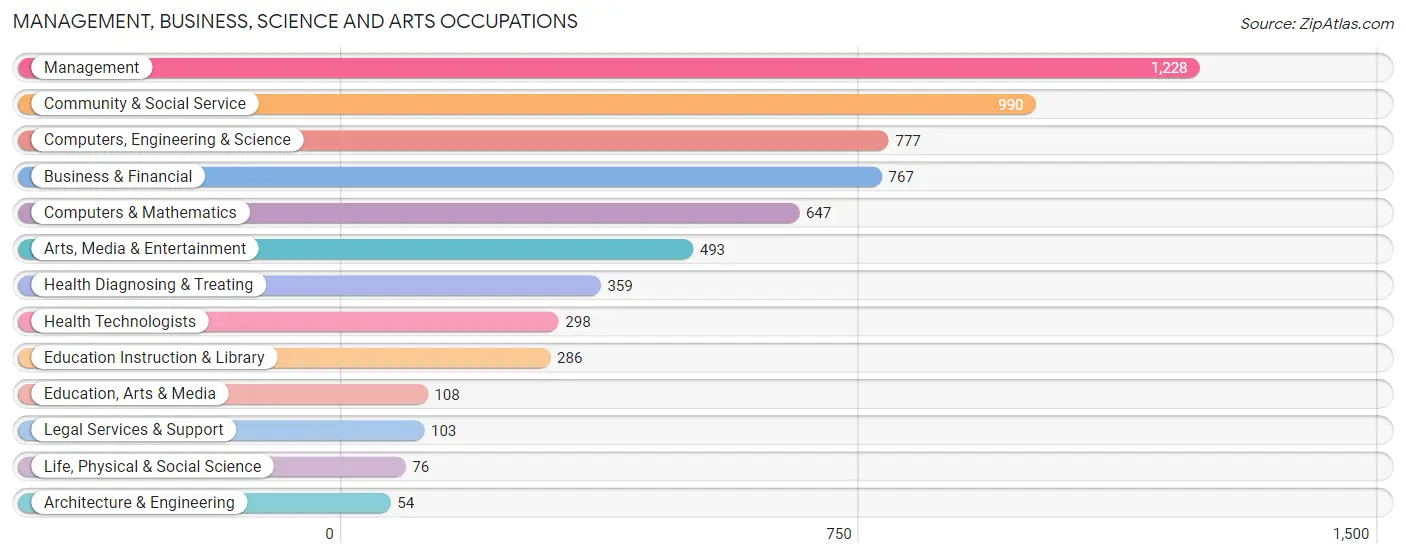
Management, Business, Science and Arts Occupations
The most common Management, Business, Science and Arts occupations in Westphalia are Management (1,228 | 18.6%), Community & Social Service (990 | 15.0%), Computers, Engineering & Science (777 | 11.8%), Business & Financial (767 | 11.7%), and Computers & Mathematics (647 | 9.8%).
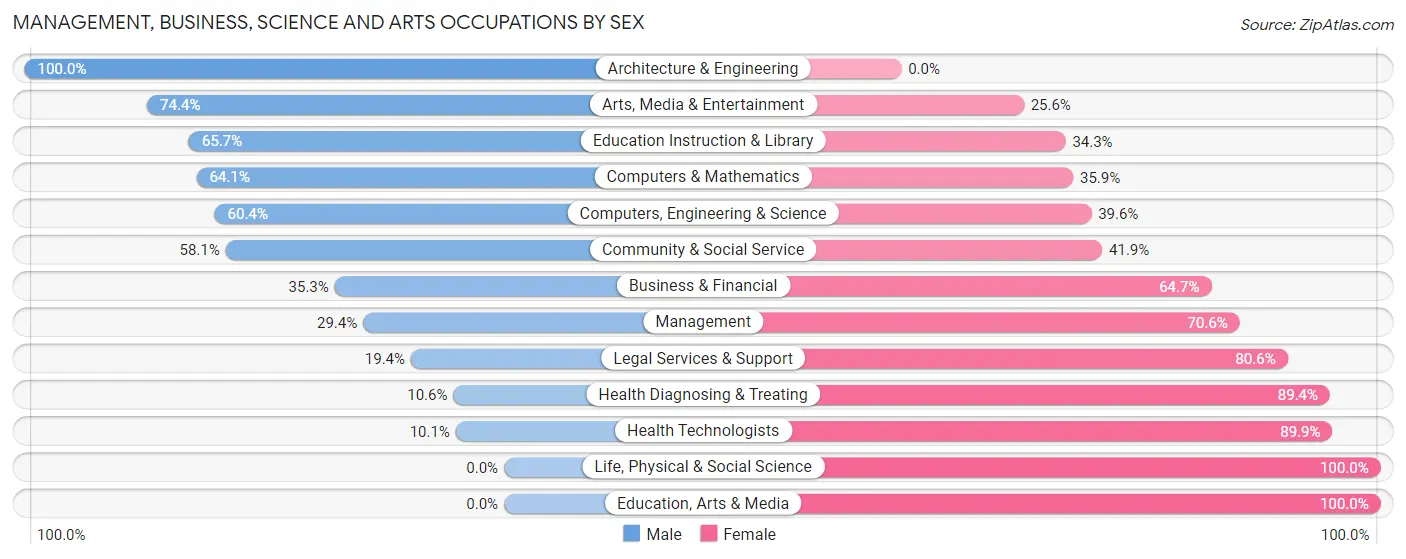
Management, Business, Science and Arts Occupations by Sex
Within the Management, Business, Science and Arts occupations in Westphalia, the most male-oriented occupations are Architecture & Engineering (100.0%), Arts, Media & Entertainment (74.4%), and Education Instruction & Library (65.7%), while the most female-oriented occupations are Life, Physical & Social Science (100.0%), Education, Arts & Media (100.0%), and Health Technologists (89.9%).
| Occupation | Male | Female |
| Management | 361 (29.4%) | 867 (70.6%) |
| Business & Financial | 271 (35.3%) | 496 (64.7%) |
| Computers, Engineering & Science | 469 (60.4%) | 308 (39.6%) |
| Computers & Mathematics | 415 (64.1%) | 232 (35.9%) |
| Architecture & Engineering | 54 (100.0%) | 0 (0.0%) |
| Life, Physical & Social Science | 0 (0.0%) | 76 (100.0%) |
| Community & Social Service | 575 (58.1%) | 415 (41.9%) |
| Education, Arts & Media | 0 (0.0%) | 108 (100.0%) |
| Legal Services & Support | 20 (19.4%) | 83 (80.6%) |
| Education Instruction & Library | 188 (65.7%) | 98 (34.3%) |
| Arts, Media & Entertainment | 367 (74.4%) | 126 (25.6%) |
| Health Diagnosing & Treating | 38 (10.6%) | 321 (89.4%) |
| Health Technologists | 30 (10.1%) | 268 (89.9%) |
| Total (Category) | 1,714 (41.6%) | 2,407 (58.4%) |
| Total (Overall) | 3,194 (48.5%) | 3,392 (51.5%) |
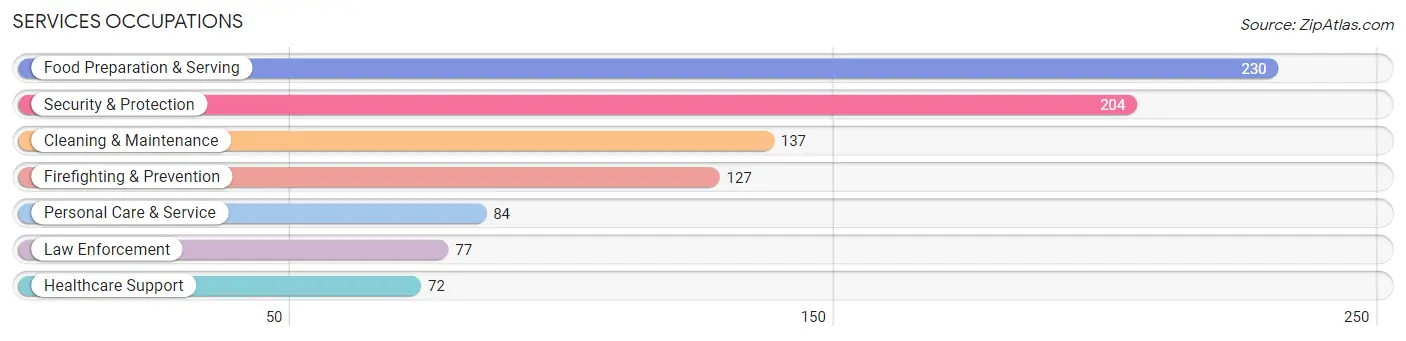
Services Occupations
The most common Services occupations in Westphalia are Food Preparation & Serving (230 | 3.5%), Security & Protection (204 | 3.1%), Cleaning & Maintenance (137 | 2.1%), Firefighting & Prevention (127 | 1.9%), and Personal Care & Service (84 | 1.3%).
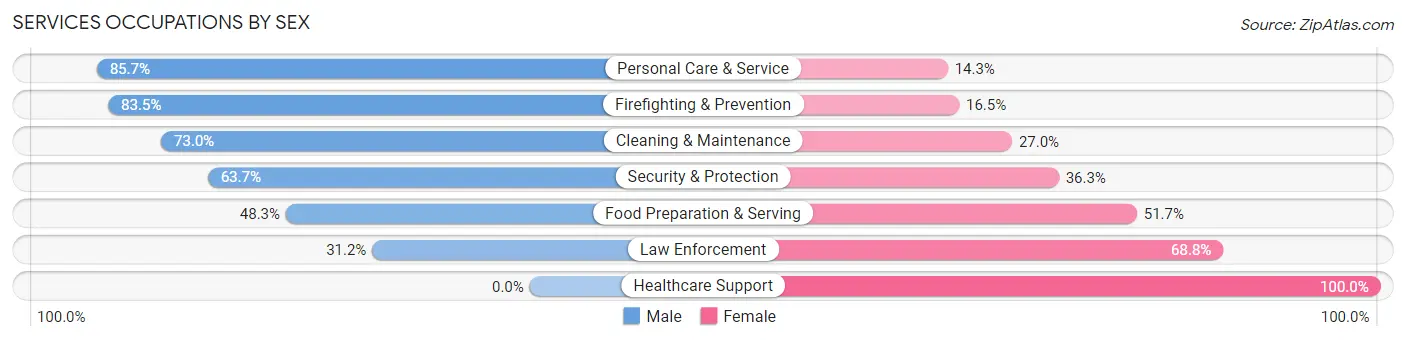
Services Occupations by Sex
Within the Services occupations in Westphalia, the most male-oriented occupations are Personal Care & Service (85.7%), Firefighting & Prevention (83.5%), and Cleaning & Maintenance (73.0%), while the most female-oriented occupations are Healthcare Support (100.0%), Law Enforcement (68.8%), and Food Preparation & Serving (51.7%).
| Occupation | Male | Female |
| Healthcare Support | 0 (0.0%) | 72 (100.0%) |
| Security & Protection | 130 (63.7%) | 74 (36.3%) |
| Firefighting & Prevention | 106 (83.5%) | 21 (16.5%) |
| Law Enforcement | 24 (31.2%) | 53 (68.8%) |
| Food Preparation & Serving | 111 (48.3%) | 119 (51.7%) |
| Cleaning & Maintenance | 100 (73.0%) | 37 (27.0%) |
| Personal Care & Service | 72 (85.7%) | 12 (14.3%) |
| Total (Category) | 413 (56.8%) | 314 (43.2%) |
| Total (Overall) | 3,194 (48.5%) | 3,392 (51.5%) |
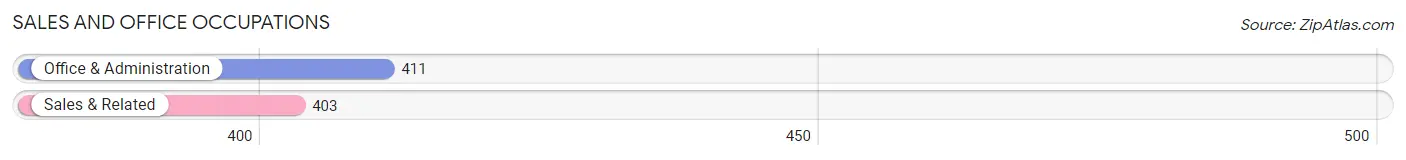
Sales and Office Occupations
The most common Sales and Office occupations in Westphalia are Office & Administration (411 | 6.2%), and Sales & Related (403 | 6.1%).
Sales and Office Occupations by Sex
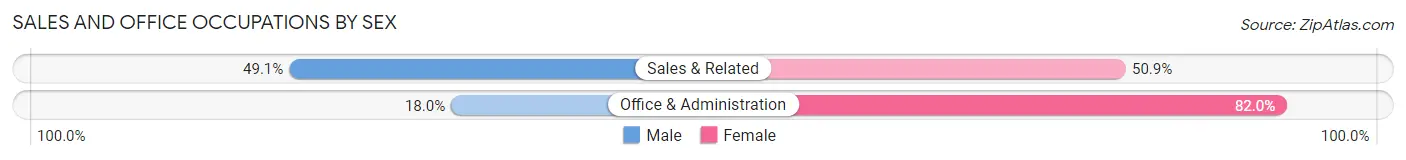
| Occupation | Male | Female |
| Sales & Related | 198 (49.1%) | 205 (50.9%) |
| Office & Administration | 74 (18.0%) | 337 (82.0%) |
| Total (Category) | 272 (33.4%) | 542 (66.6%) |
| Total (Overall) | 3,194 (48.5%) | 3,392 (51.5%) |
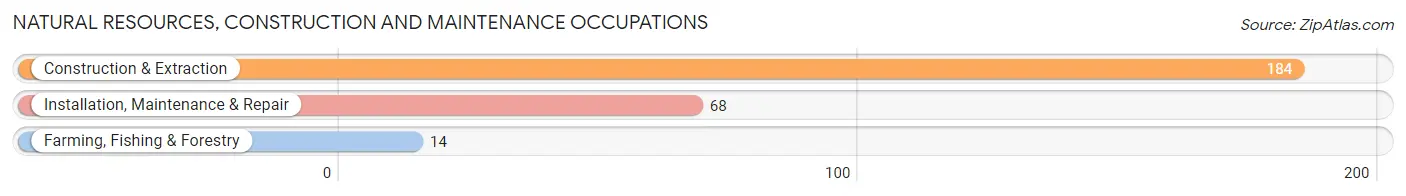
Natural Resources, Construction and Maintenance Occupations
The most common Natural Resources, Construction and Maintenance occupations in Westphalia are Construction & Extraction (184 | 2.8%), Installation, Maintenance & Repair (68 | 1.0%), and Farming, Fishing & Forestry (14 | 0.2%).
Natural Resources, Construction and Maintenance Occupations by Sex

| Occupation | Male | Female |
| Farming, Fishing & Forestry | 0 (0.0%) | 14 (100.0%) |
| Construction & Extraction | 184 (100.0%) | 0 (0.0%) |
| Installation, Maintenance & Repair | 52 (76.5%) | 16 (23.5%) |
| Total (Category) | 236 (88.7%) | 30 (11.3%) |
| Total (Overall) | 3,194 (48.5%) | 3,392 (51.5%) |
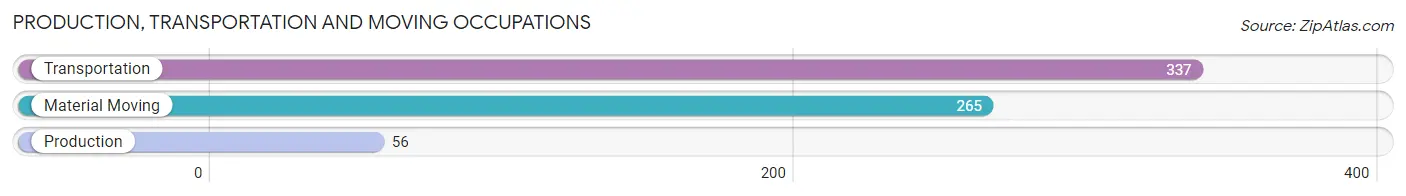
Production, Transportation and Moving Occupations
The most common Production, Transportation and Moving occupations in Westphalia are Transportation (337 | 5.1%), Material Moving (265 | 4.0%), and Production (56 | 0.9%).
Production, Transportation and Moving Occupations by Sex
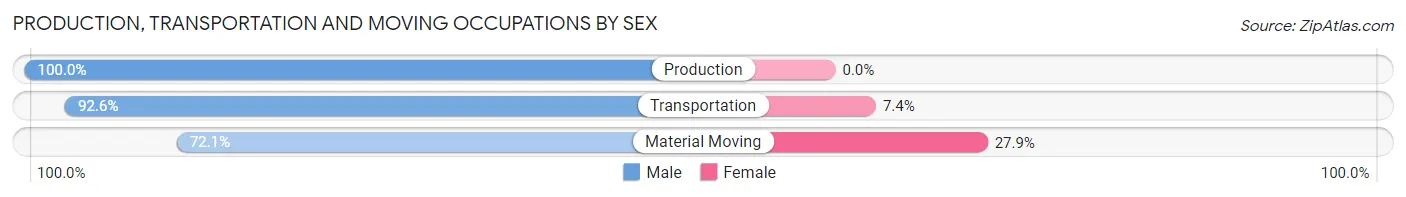
| Occupation | Male | Female |
| Production | 56 (100.0%) | 0 (0.0%) |
| Transportation | 312 (92.6%) | 25 (7.4%) |
| Material Moving | 191 (72.1%) | 74 (27.9%) |
| Total (Category) | 559 (85.0%) | 99 (15.0%) |
| Total (Overall) | 3,194 (48.5%) | 3,392 (51.5%) |
Employment Industries by Sex in Westphalia
Employment Industries in Westphalia
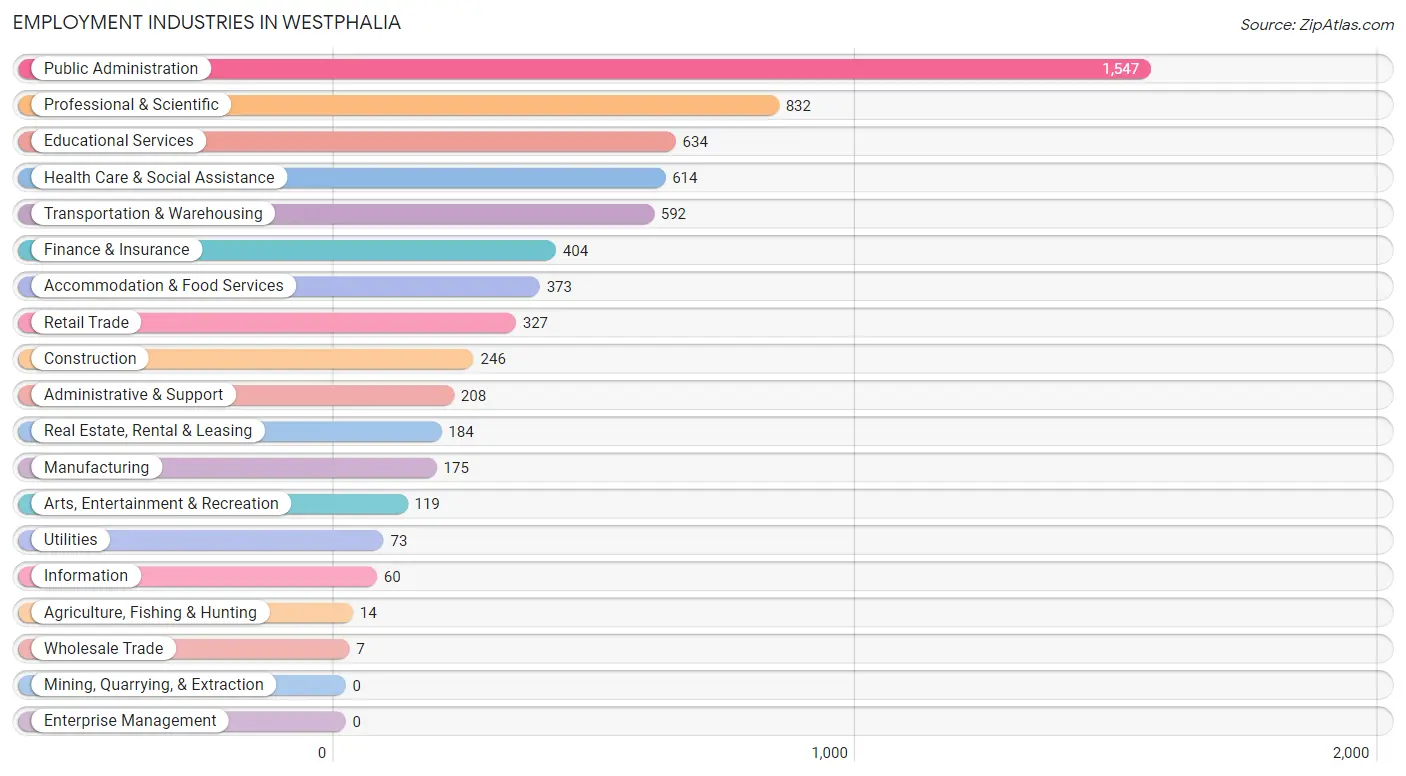
The major employment industries in Westphalia include Public Administration (1,547 | 23.5%), Professional & Scientific (832 | 12.6%), Educational Services (634 | 9.6%), Health Care & Social Assistance (614 | 9.3%), and Transportation & Warehousing (592 | 9.0%).
Employment Industries by Sex in Westphalia
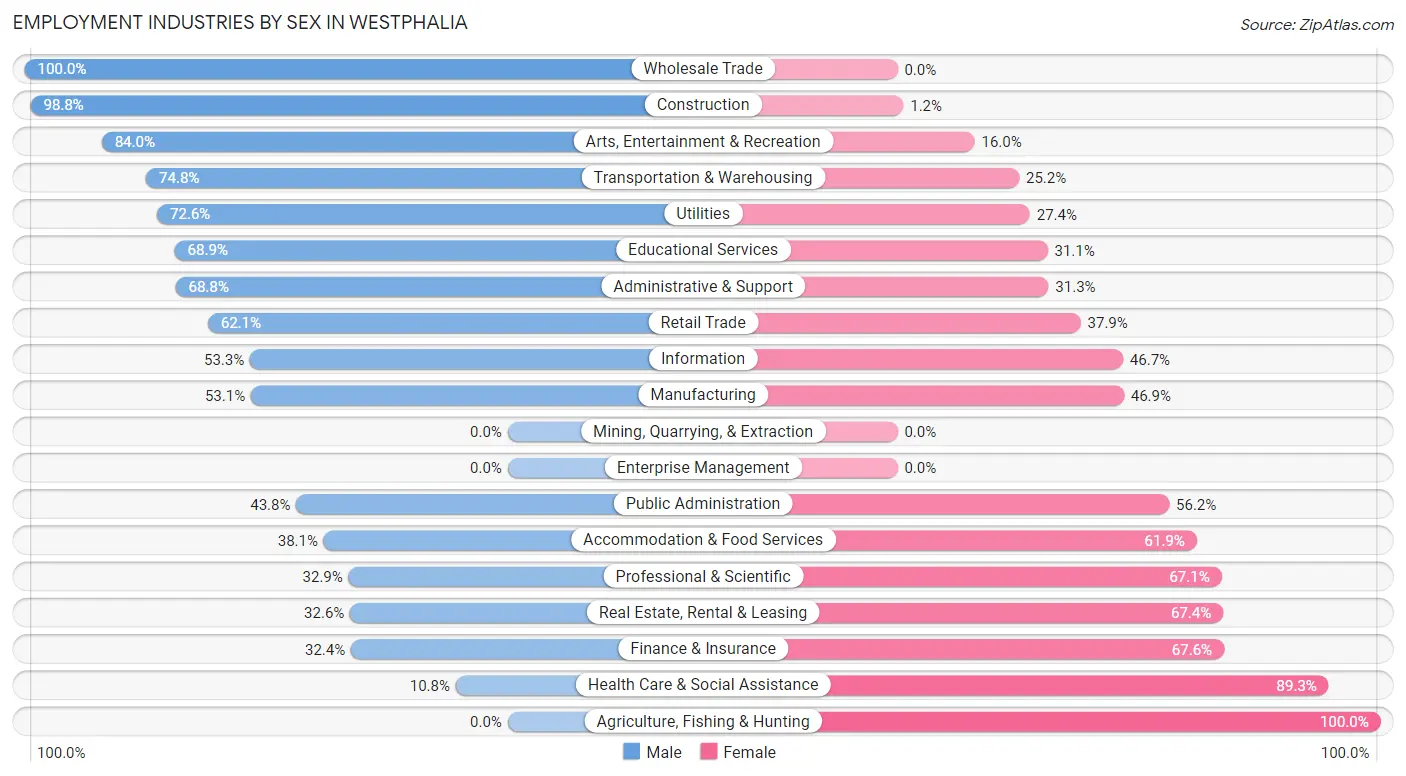
The Westphalia industries that see more men than women are Wholesale Trade (100.0%), Construction (98.8%), and Arts, Entertainment & Recreation (84.0%), whereas the industries that tend to have a higher number of women are Agriculture, Fishing & Hunting (100.0%), Health Care & Social Assistance (89.2%), and Finance & Insurance (67.6%).
| Industry | Male | Female |
| Agriculture, Fishing & Hunting | 0 (0.0%) | 14 (100.0%) |
| Mining, Quarrying, & Extraction | 0 (0.0%) | 0 (0.0%) |
| Construction | 243 (98.8%) | 3 (1.2%) |
| Manufacturing | 93 (53.1%) | 82 (46.9%) |
| Wholesale Trade | 7 (100.0%) | 0 (0.0%) |
| Retail Trade | 203 (62.1%) | 124 (37.9%) |
| Transportation & Warehousing | 443 (74.8%) | 149 (25.2%) |
| Utilities | 53 (72.6%) | 20 (27.4%) |
| Information | 32 (53.3%) | 28 (46.7%) |
| Finance & Insurance | 131 (32.4%) | 273 (67.6%) |
| Real Estate, Rental & Leasing | 60 (32.6%) | 124 (67.4%) |
| Professional & Scientific | 274 (32.9%) | 558 (67.1%) |
| Enterprise Management | 0 (0.0%) | 0 (0.0%) |
| Administrative & Support | 143 (68.8%) | 65 (31.2%) |
| Educational Services | 437 (68.9%) | 197 (31.1%) |
| Health Care & Social Assistance | 66 (10.7%) | 548 (89.2%) |
| Arts, Entertainment & Recreation | 100 (84.0%) | 19 (16.0%) |
| Accommodation & Food Services | 142 (38.1%) | 231 (61.9%) |
| Public Administration | 677 (43.8%) | 870 (56.2%) |
| Total | 3,194 (48.5%) | 3,392 (51.5%) |
Education in Westphalia
School Enrollment in Westphalia
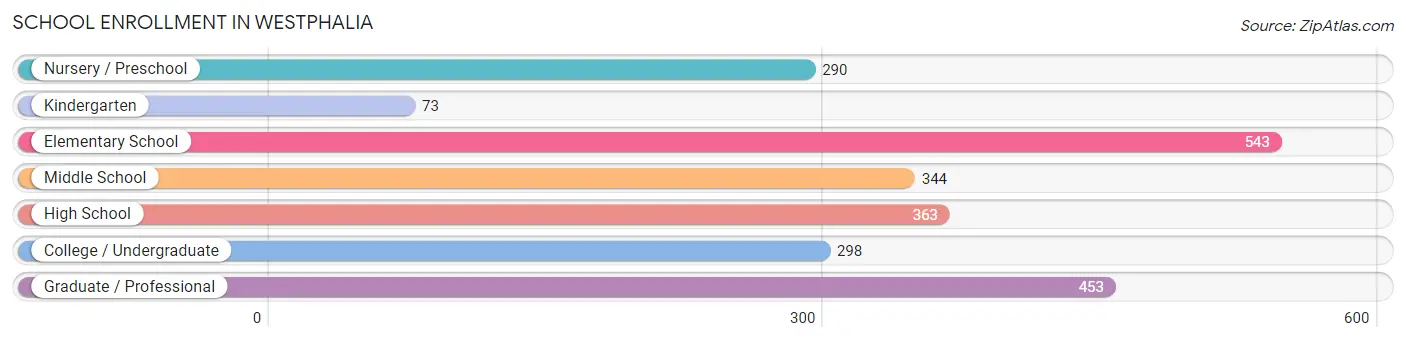
The most common levels of schooling among the 2,364 students in Westphalia are elementary school (543 | 23.0%), graduate / professional (453 | 19.2%), and high school (363 | 15.4%).
| School Level | # Students | % Students |
| Nursery / Preschool | 290 | 12.3% |
| Kindergarten | 73 | 3.1% |
| Elementary School | 543 | 23.0% |
| Middle School | 344 | 14.5% |
| High School | 363 | 15.4% |
| College / Undergraduate | 298 | 12.6% |
| Graduate / Professional | 453 | 19.2% |
| Total | 2,364 | 100.0% |
School Enrollment by Age by Funding Source in Westphalia
Out of a total of 2,364 students who are enrolled in schools in Westphalia, 615 (26.0%) attend a private institution, while the remaining 1,749 (74.0%) are enrolled in public schools. The age group of 3 to 4 year olds has the highest likelihood of being enrolled in private schools, with 116 (48.9% in the age bracket) enrolled. Conversely, the age group of 20 to 24 year olds has the lowest likelihood of being enrolled in a private school, with 144 (100.0% in the age bracket) attending a public institution.
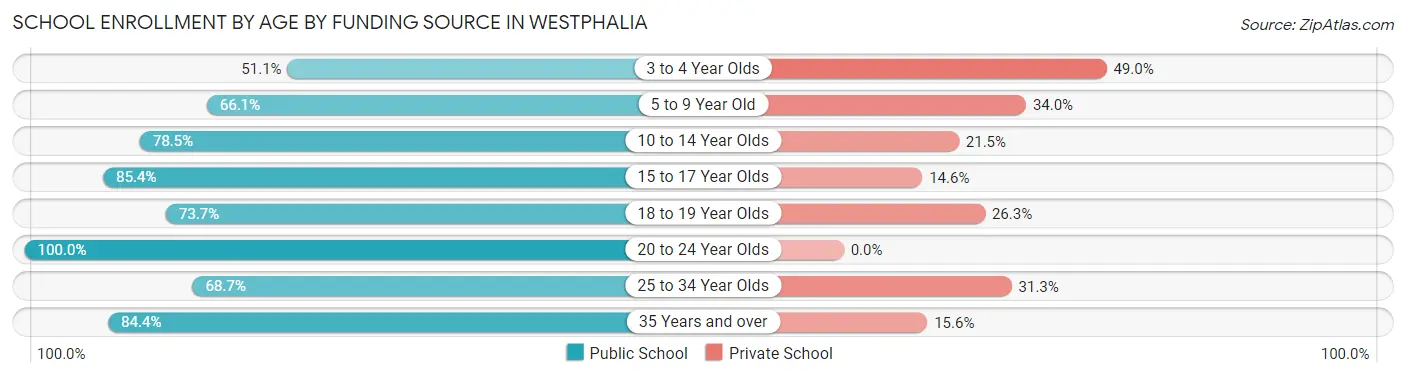
| Age Bracket | Public School | Private School |
| 3 to 4 Year Olds | 121 (51.0%) | 116 (48.9%) |
| 5 to 9 Year Old | 356 (66.0%) | 183 (34.0%) |
| 10 to 14 Year Olds | 410 (78.5%) | 112 (21.5%) |
| 15 to 17 Year Olds | 175 (85.4%) | 30 (14.6%) |
| 18 to 19 Year Olds | 42 (73.7%) | 15 (26.3%) |
| 20 to 24 Year Olds | 144 (100.0%) | 0 (0.0%) |
| 25 to 34 Year Olds | 246 (68.7%) | 112 (31.3%) |
| 35 Years and over | 255 (84.4%) | 47 (15.6%) |
| Total | 1,749 (74.0%) | 615 (26.0%) |
Educational Attainment by Field of Study in Westphalia
Business (1,207 | 26.4%), science & technology (660 | 14.4%), arts & humanities (523 | 11.5%), social sciences (467 | 10.2%), and computers & mathematics (456 | 10.0%) are the most common fields of study among 4,568 individuals in Westphalia who have obtained a bachelor's degree or higher.
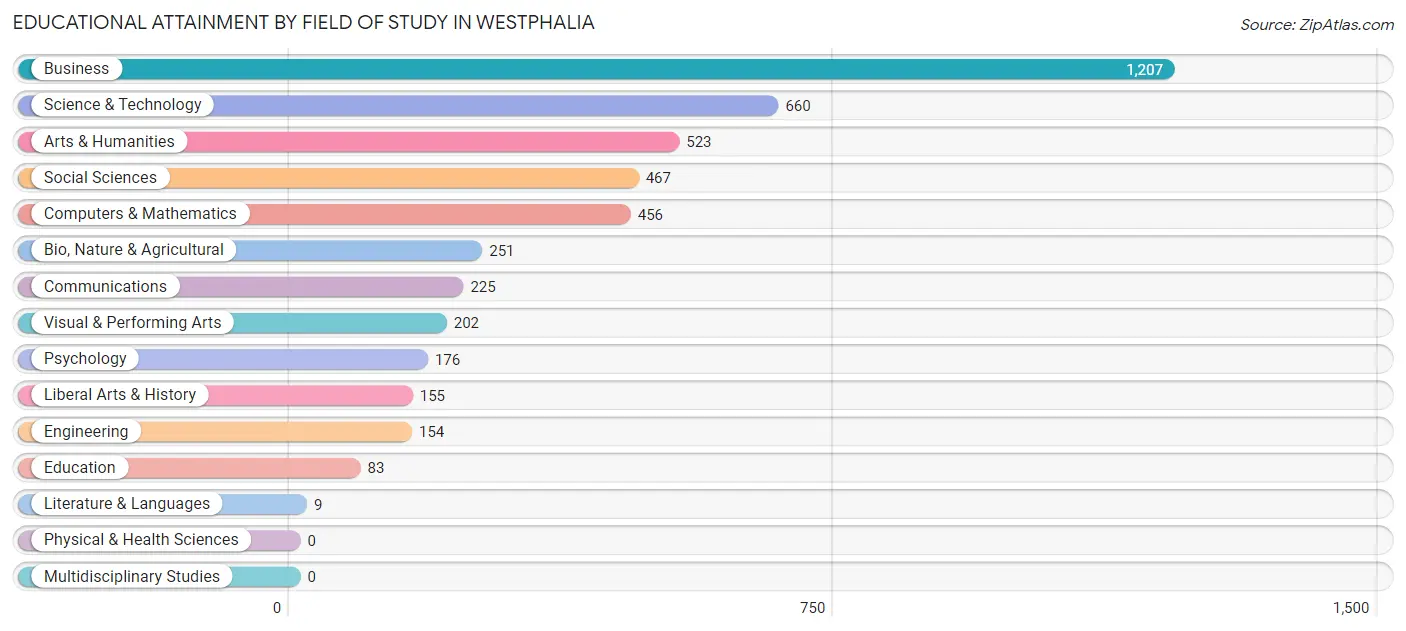
| Field of Study | # Graduates | % Graduates |
| Computers & Mathematics | 456 | 10.0% |
| Bio, Nature & Agricultural | 251 | 5.5% |
| Physical & Health Sciences | 0 | 0.0% |
| Psychology | 176 | 3.8% |
| Social Sciences | 467 | 10.2% |
| Engineering | 154 | 3.4% |
| Multidisciplinary Studies | 0 | 0.0% |
| Science & Technology | 660 | 14.4% |
| Business | 1,207 | 26.4% |
| Education | 83 | 1.8% |
| Literature & Languages | 9 | 0.2% |
| Liberal Arts & History | 155 | 3.4% |
| Visual & Performing Arts | 202 | 4.4% |
| Communications | 225 | 4.9% |
| Arts & Humanities | 523 | 11.5% |
| Total | 4,568 | 100.0% |
Transportation & Commute in Westphalia
Vehicle Availability by Sex in Westphalia
The most prevalent vehicle ownership categories in Westphalia are males with 2 vehicles (1,489, accounting for 46.5%) and females with 2 vehicles (1,430, making up 44.0%).
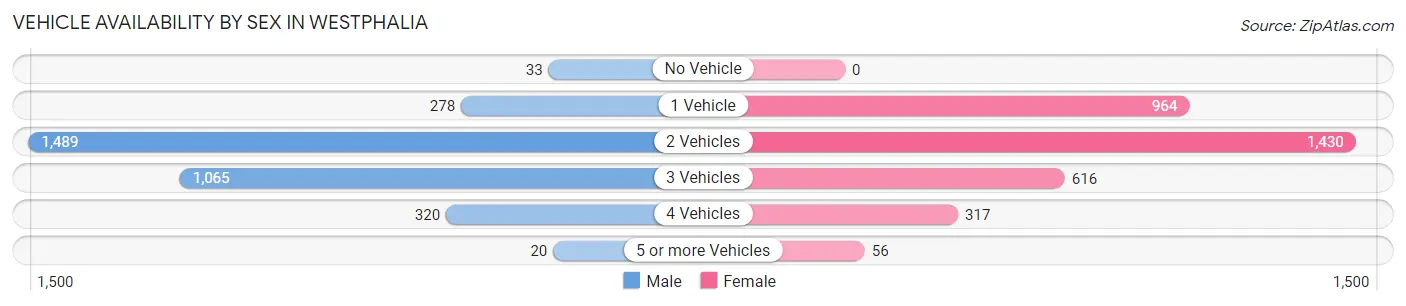
| Vehicles Available | Male | Female |
| No Vehicle | 33 (1.0%) | 0 (0.0%) |
| 1 Vehicle | 278 (8.7%) | 964 (28.5%) |
| 2 Vehicles | 1,489 (46.5%) | 1,430 (42.3%) |
| 3 Vehicles | 1,065 (33.2%) | 616 (18.2%) |
| 4 Vehicles | 320 (10.0%) | 317 (9.4%) |
| 5 or more Vehicles | 20 (0.6%) | 56 (1.7%) |
| Total | 3,205 (100.0%) | 3,383 (100.0%) |
Commute Time in Westphalia
The most frequently occuring commute durations in Westphalia are 45 to 59 minutes (1,361 commuters, 26.7%), 30 to 34 minutes (744 commuters, 14.6%), and 40 to 44 minutes (622 commuters, 12.2%).
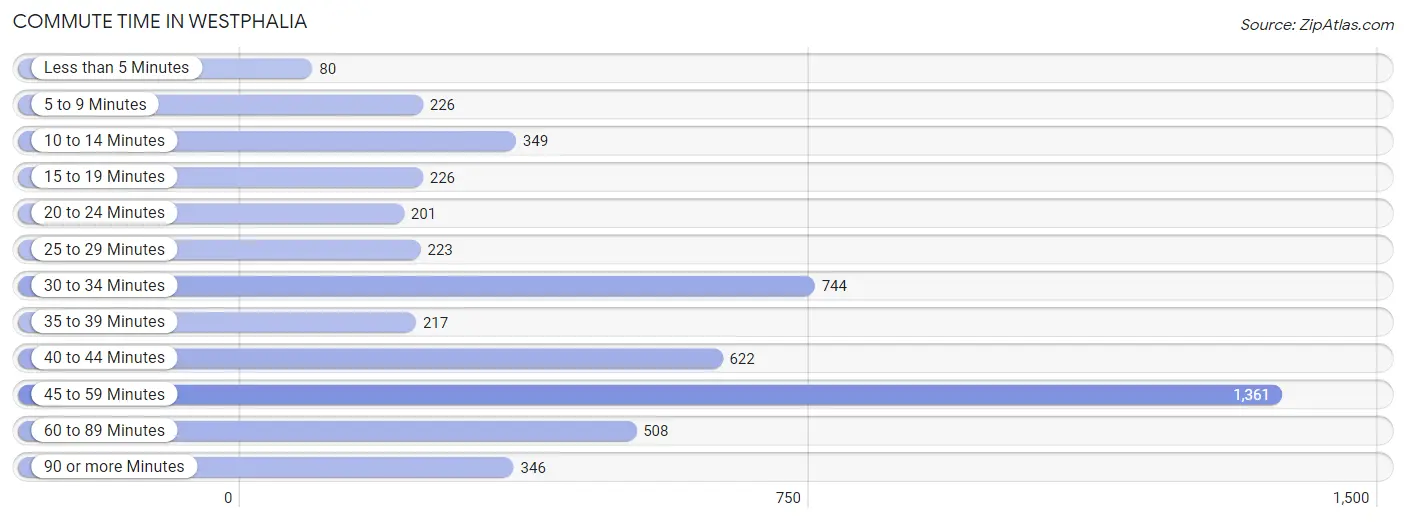
| Commute Time | # Commuters | % Commuters |
| Less than 5 Minutes | 80 | 1.6% |
| 5 to 9 Minutes | 226 | 4.4% |
| 10 to 14 Minutes | 349 | 6.8% |
| 15 to 19 Minutes | 226 | 4.4% |
| 20 to 24 Minutes | 201 | 3.9% |
| 25 to 29 Minutes | 223 | 4.4% |
| 30 to 34 Minutes | 744 | 14.6% |
| 35 to 39 Minutes | 217 | 4.3% |
| 40 to 44 Minutes | 622 | 12.2% |
| 45 to 59 Minutes | 1,361 | 26.7% |
| 60 to 89 Minutes | 508 | 10.0% |
| 90 or more Minutes | 346 | 6.8% |
Commute Time by Sex in Westphalia
The most common commute times in Westphalia are 45 to 59 minutes (650 commuters, 25.2%) for males and 45 to 59 minutes (711 commuters, 28.2%) for females.
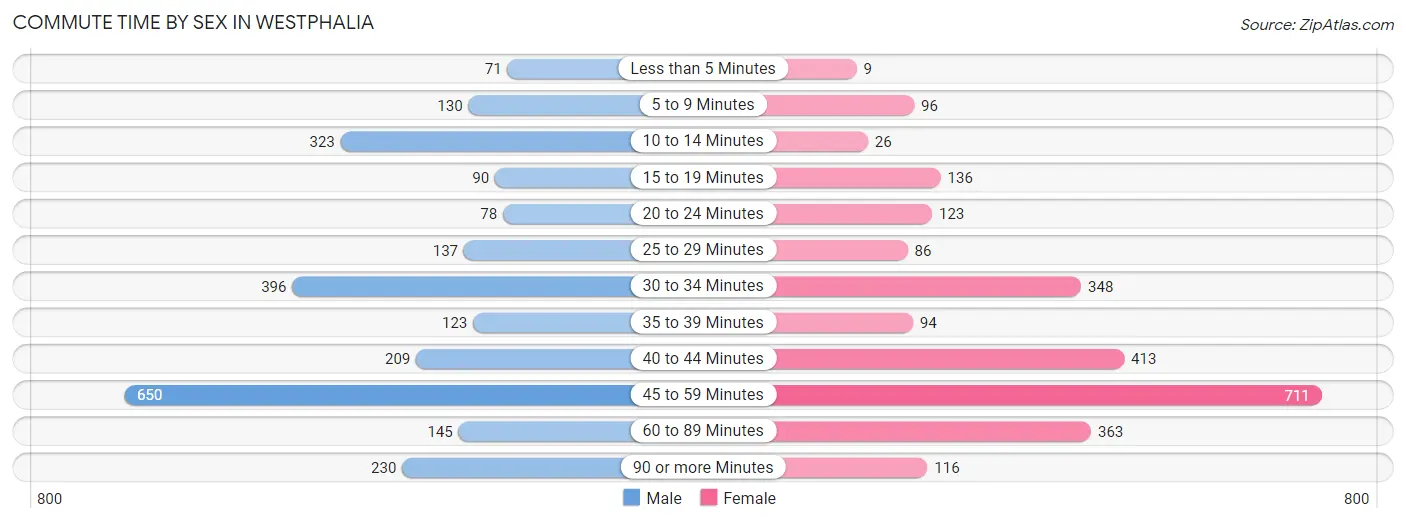
| Commute Time | Male | Female |
| Less than 5 Minutes | 71 (2.8%) | 9 (0.4%) |
| 5 to 9 Minutes | 130 (5.0%) | 96 (3.8%) |
| 10 to 14 Minutes | 323 (12.5%) | 26 (1.0%) |
| 15 to 19 Minutes | 90 (3.5%) | 136 (5.4%) |
| 20 to 24 Minutes | 78 (3.0%) | 123 (4.9%) |
| 25 to 29 Minutes | 137 (5.3%) | 86 (3.4%) |
| 30 to 34 Minutes | 396 (15.3%) | 348 (13.8%) |
| 35 to 39 Minutes | 123 (4.8%) | 94 (3.7%) |
| 40 to 44 Minutes | 209 (8.1%) | 413 (16.4%) |
| 45 to 59 Minutes | 650 (25.2%) | 711 (28.2%) |
| 60 to 89 Minutes | 145 (5.6%) | 363 (14.4%) |
| 90 or more Minutes | 230 (8.9%) | 116 (4.6%) |
Time of Departure to Work by Sex in Westphalia
The most frequent times of departure to work in Westphalia are 7:00 AM to 7:29 AM (621, 24.0%) for males and 8:00 AM to 8:29 AM (634, 25.2%) for females.
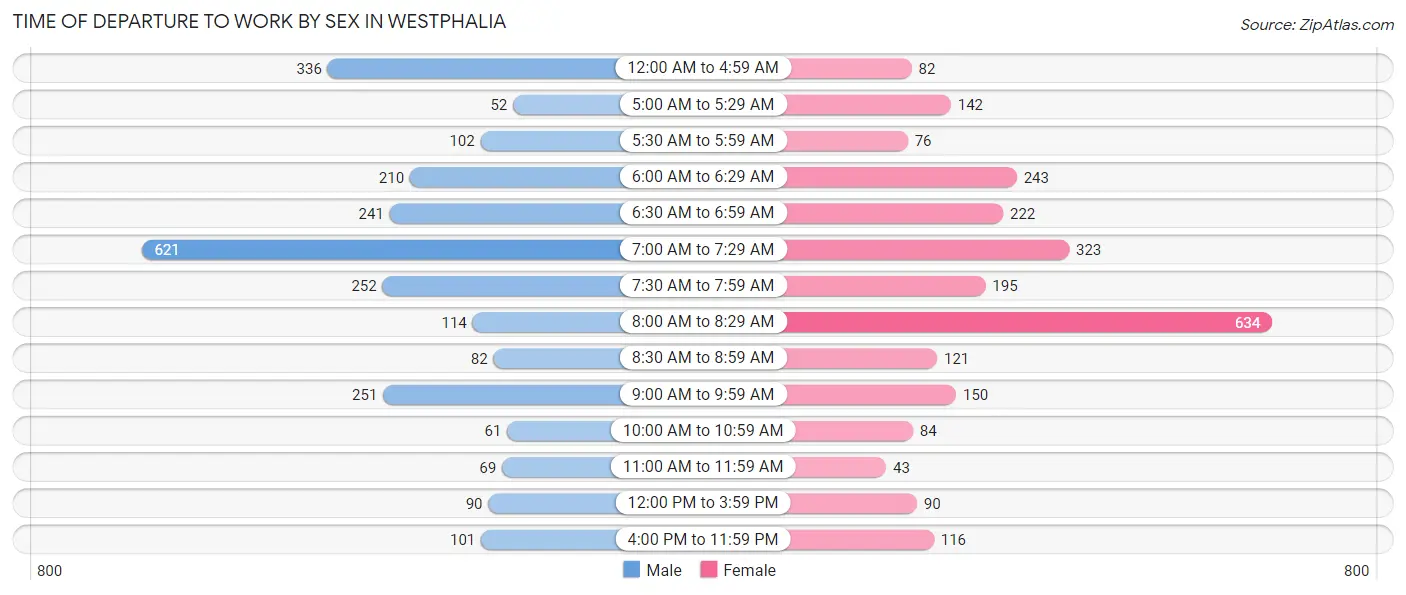
| Time of Departure | Male | Female |
| 12:00 AM to 4:59 AM | 336 (13.0%) | 82 (3.3%) |
| 5:00 AM to 5:29 AM | 52 (2.0%) | 142 (5.6%) |
| 5:30 AM to 5:59 AM | 102 (4.0%) | 76 (3.0%) |
| 6:00 AM to 6:29 AM | 210 (8.1%) | 243 (9.6%) |
| 6:30 AM to 6:59 AM | 241 (9.3%) | 222 (8.8%) |
| 7:00 AM to 7:29 AM | 621 (24.0%) | 323 (12.8%) |
| 7:30 AM to 7:59 AM | 252 (9.8%) | 195 (7.7%) |
| 8:00 AM to 8:29 AM | 114 (4.4%) | 634 (25.2%) |
| 8:30 AM to 8:59 AM | 82 (3.2%) | 121 (4.8%) |
| 9:00 AM to 9:59 AM | 251 (9.7%) | 150 (5.9%) |
| 10:00 AM to 10:59 AM | 61 (2.4%) | 84 (3.3%) |
| 11:00 AM to 11:59 AM | 69 (2.7%) | 43 (1.7%) |
| 12:00 PM to 3:59 PM | 90 (3.5%) | 90 (3.6%) |
| 4:00 PM to 11:59 PM | 101 (3.9%) | 116 (4.6%) |
| Total | 2,582 (100.0%) | 2,521 (100.0%) |
Housing Occupancy in Westphalia
Occupancy by Ownership in Westphalia
Of the total 4,362 dwellings in Westphalia, owner-occupied units account for 3,980 (91.2%), while renter-occupied units make up 382 (8.8%).
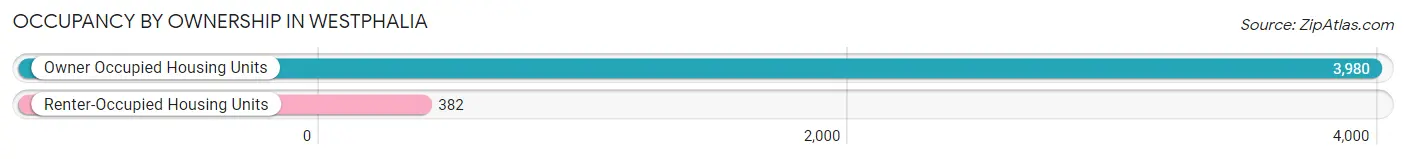
| Occupancy | # Housing Units | % Housing Units |
| Owner Occupied Housing Units | 3,980 | 91.2% |
| Renter-Occupied Housing Units | 382 | 8.8% |
| Total Occupied Housing Units | 4,362 | 100.0% |
Occupancy by Household Size in Westphalia
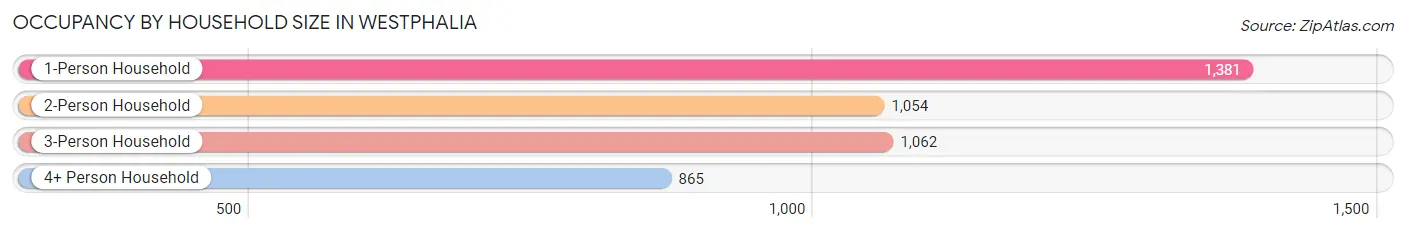
| Household Size | # Housing Units | % Housing Units |
| 1-Person Household | 1,381 | 31.7% |
| 2-Person Household | 1,054 | 24.2% |
| 3-Person Household | 1,062 | 24.3% |
| 4+ Person Household | 865 | 19.8% |
| Total Housing Units | 4,362 | 100.0% |
Occupancy by Ownership by Household Size in Westphalia
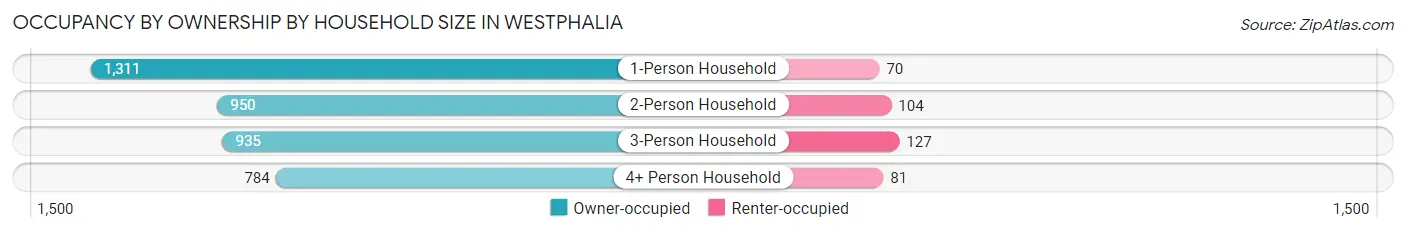
| Household Size | Owner-occupied | Renter-occupied |
| 1-Person Household | 1,311 (94.9%) | 70 (5.1%) |
| 2-Person Household | 950 (90.1%) | 104 (9.9%) |
| 3-Person Household | 935 (88.0%) | 127 (12.0%) |
| 4+ Person Household | 784 (90.6%) | 81 (9.4%) |
| Total Housing Units | 3,980 (91.2%) | 382 (8.8%) |
Occupancy by Educational Attainment in Westphalia
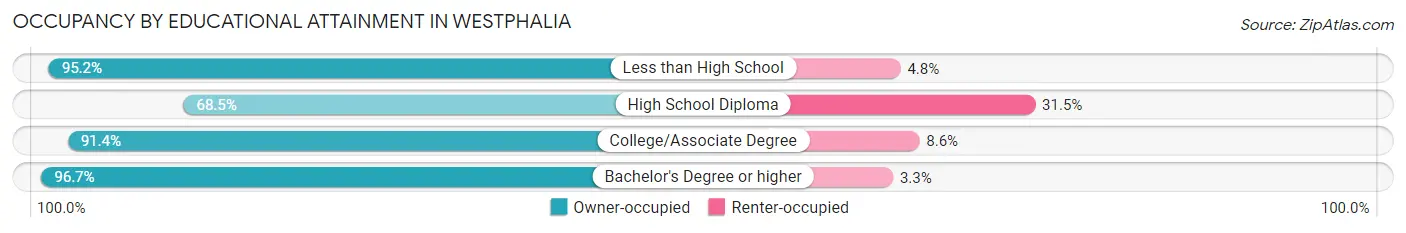
| Household Size | Owner-occupied | Renter-occupied |
| Less than High School | 198 (95.2%) | 10 (4.8%) |
| High School Diploma | 428 (68.5%) | 197 (31.5%) |
| College/Associate Degree | 1,004 (91.4%) | 94 (8.6%) |
| Bachelor's Degree or higher | 2,350 (96.7%) | 81 (3.3%) |
Occupancy by Age of Householder in Westphalia
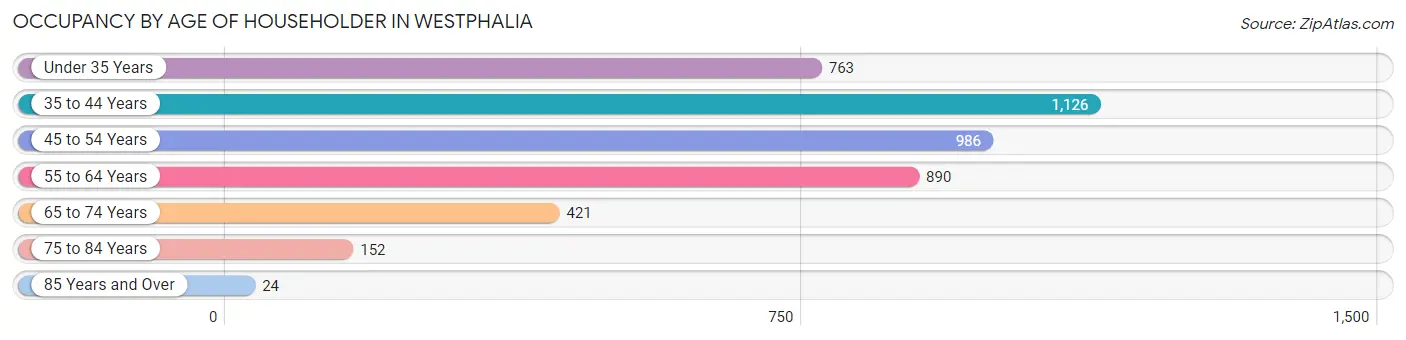
| Age Bracket | # Households | % Households |
| Under 35 Years | 763 | 17.5% |
| 35 to 44 Years | 1,126 | 25.8% |
| 45 to 54 Years | 986 | 22.6% |
| 55 to 64 Years | 890 | 20.4% |
| 65 to 74 Years | 421 | 9.7% |
| 75 to 84 Years | 152 | 3.5% |
| 85 Years and Over | 24 | 0.5% |
| Total | 4,362 | 100.0% |
Housing Finances in Westphalia
Median Income by Occupancy in Westphalia
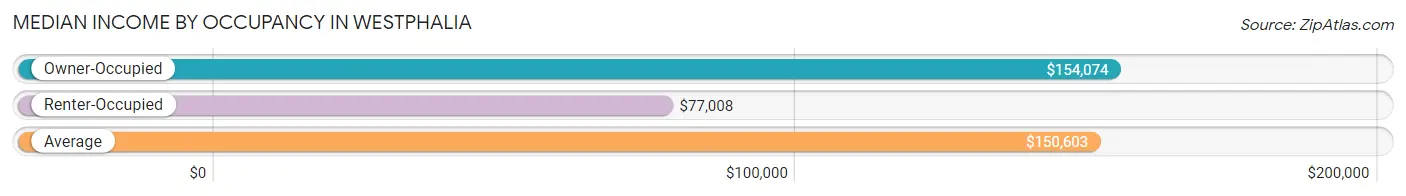
| Occupancy Type | # Households | Median Income |
| Owner-Occupied | 3,980 (91.2%) | $154,074 |
| Renter-Occupied | 382 (8.8%) | $77,008 |
| Average | 4,362 (100.0%) | $150,603 |
Occupancy by Householder Income Bracket in Westphalia
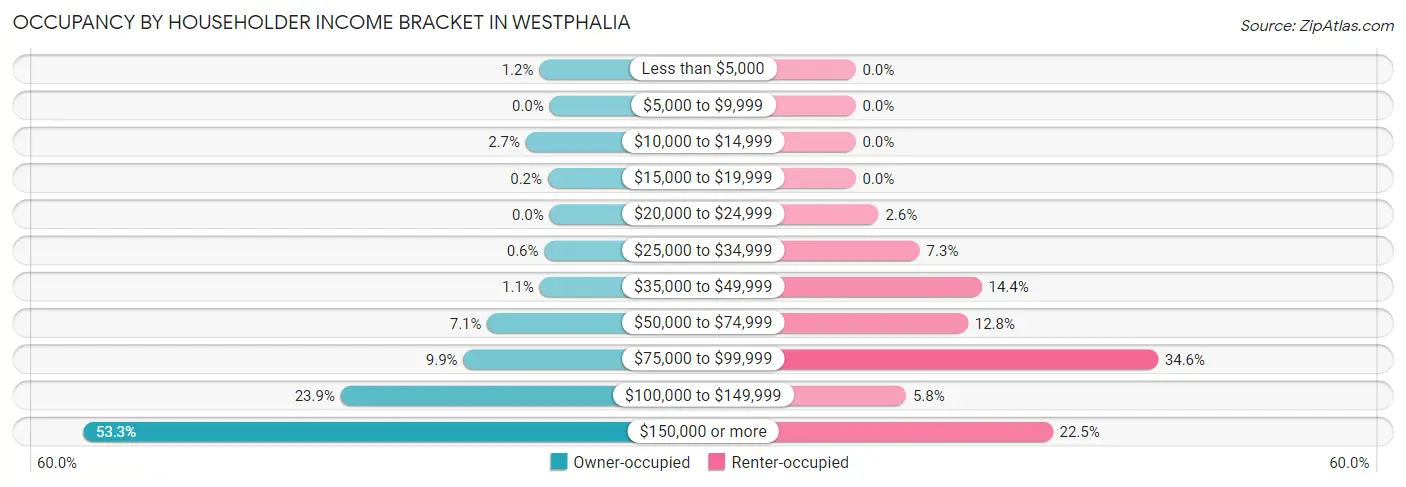
| Income Bracket | Owner-occupied | Renter-occupied |
| Less than $5,000 | 47 (1.2%) | 0 (0.0%) |
| $5,000 to $9,999 | 0 (0.0%) | 0 (0.0%) |
| $10,000 to $14,999 | 108 (2.7%) | 0 (0.0%) |
| $15,000 to $19,999 | 8 (0.2%) | 0 (0.0%) |
| $20,000 to $24,999 | 0 (0.0%) | 10 (2.6%) |
| $25,000 to $34,999 | 24 (0.6%) | 28 (7.3%) |
| $35,000 to $49,999 | 45 (1.1%) | 55 (14.4%) |
| $50,000 to $74,999 | 283 (7.1%) | 49 (12.8%) |
| $75,000 to $99,999 | 392 (9.9%) | 132 (34.5%) |
| $100,000 to $149,999 | 950 (23.9%) | 22 (5.8%) |
| $150,000 or more | 2,123 (53.3%) | 86 (22.5%) |
| Total | 3,980 (100.0%) | 382 (100.0%) |
Monthly Housing Cost Tiers in Westphalia
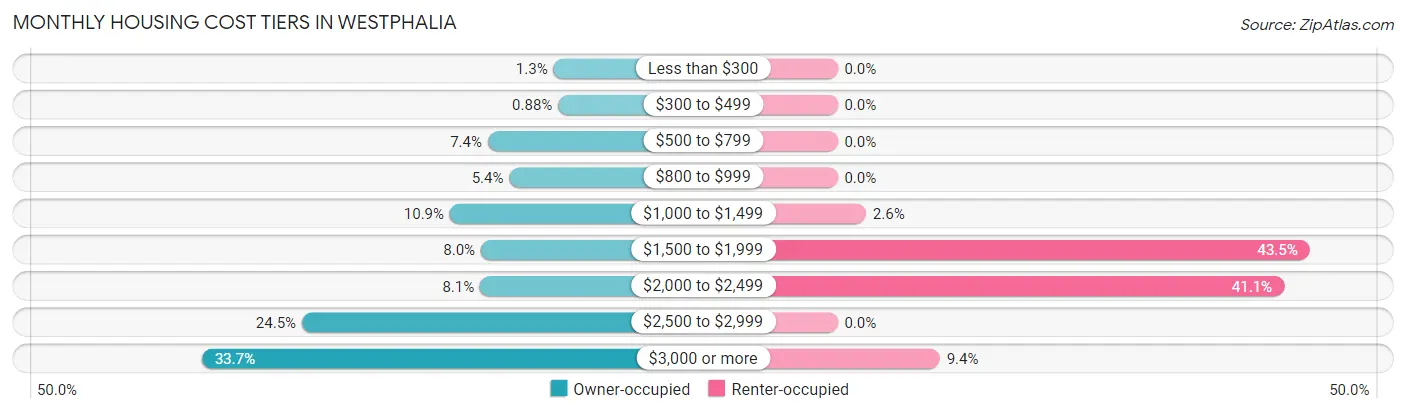
| Monthly Cost | Owner-occupied | Renter-occupied |
| Less than $300 | 52 (1.3%) | 0 (0.0%) |
| $300 to $499 | 35 (0.9%) | 0 (0.0%) |
| $500 to $799 | 293 (7.4%) | 0 (0.0%) |
| $800 to $999 | 214 (5.4%) | 0 (0.0%) |
| $1,000 to $1,499 | 432 (10.8%) | 10 (2.6%) |
| $1,500 to $1,999 | 318 (8.0%) | 166 (43.5%) |
| $2,000 to $2,499 | 321 (8.1%) | 157 (41.1%) |
| $2,500 to $2,999 | 974 (24.5%) | 0 (0.0%) |
| $3,000 or more | 1,341 (33.7%) | 36 (9.4%) |
| Total | 3,980 (100.0%) | 382 (100.0%) |
Physical Housing Characteristics in Westphalia
Housing Structures in Westphalia
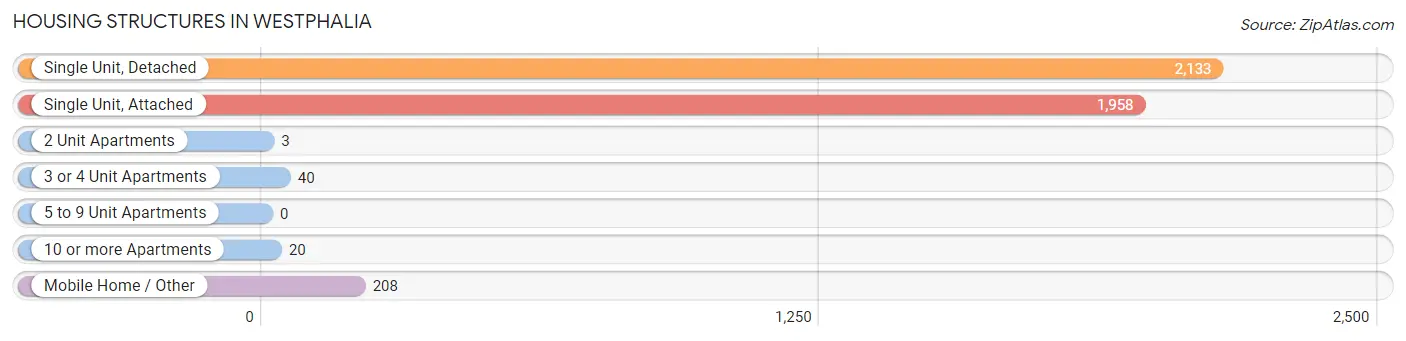
| Structure Type | # Housing Units | % Housing Units |
| Single Unit, Detached | 2,133 | 48.9% |
| Single Unit, Attached | 1,958 | 44.9% |
| 2 Unit Apartments | 3 | 0.1% |
| 3 or 4 Unit Apartments | 40 | 0.9% |
| 5 to 9 Unit Apartments | 0 | 0.0% |
| 10 or more Apartments | 20 | 0.5% |
| Mobile Home / Other | 208 | 4.8% |
| Total | 4,362 | 100.0% |
Housing Structures by Occupancy in Westphalia
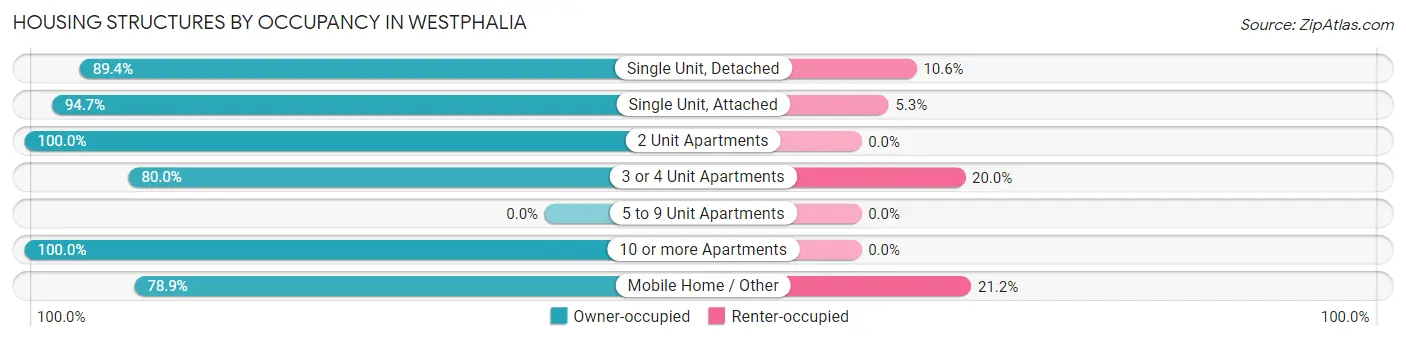
| Structure Type | Owner-occupied | Renter-occupied |
| Single Unit, Detached | 1,906 (89.4%) | 227 (10.6%) |
| Single Unit, Attached | 1,855 (94.7%) | 103 (5.3%) |
| 2 Unit Apartments | 3 (100.0%) | 0 (0.0%) |
| 3 or 4 Unit Apartments | 32 (80.0%) | 8 (20.0%) |
| 5 to 9 Unit Apartments | 0 (0.0%) | 0 (0.0%) |
| 10 or more Apartments | 20 (100.0%) | 0 (0.0%) |
| Mobile Home / Other | 164 (78.8%) | 44 (21.1%) |
| Total | 3,980 (91.2%) | 382 (8.8%) |
Housing Structures by Number of Rooms in Westphalia
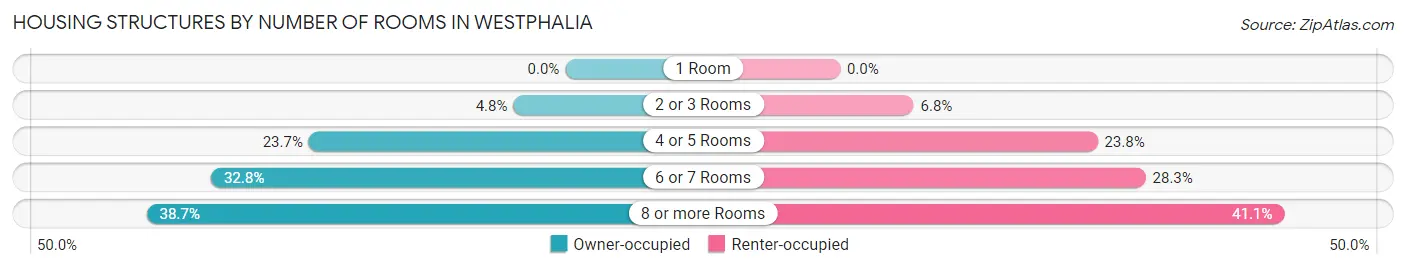
| Number of Rooms | Owner-occupied | Renter-occupied |
| 1 Room | 0 (0.0%) | 0 (0.0%) |
| 2 or 3 Rooms | 191 (4.8%) | 26 (6.8%) |
| 4 or 5 Rooms | 944 (23.7%) | 91 (23.8%) |
| 6 or 7 Rooms | 1,304 (32.8%) | 108 (28.3%) |
| 8 or more Rooms | 1,541 (38.7%) | 157 (41.1%) |
| Total | 3,980 (100.0%) | 382 (100.0%) |
Housing Structure by Heating Type in Westphalia
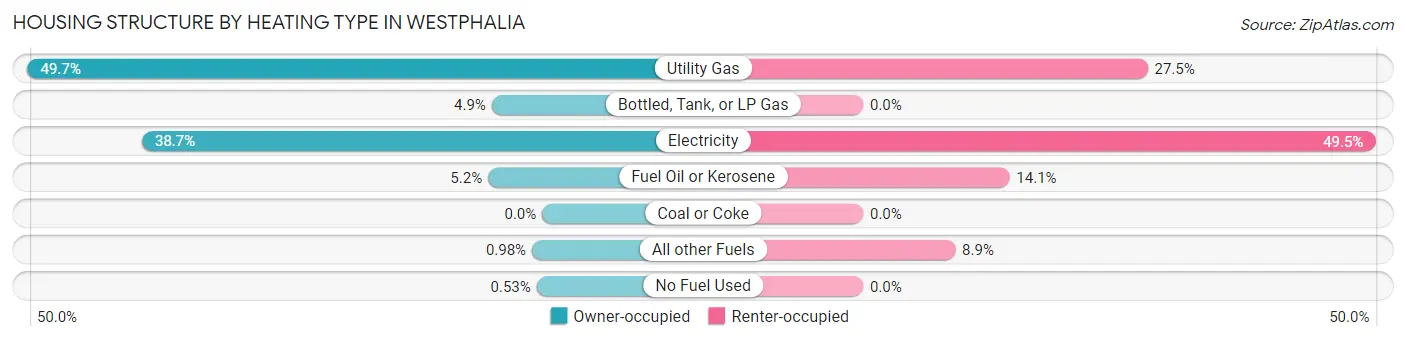
| Heating Type | Owner-occupied | Renter-occupied |
| Utility Gas | 1,979 (49.7%) | 105 (27.5%) |
| Bottled, Tank, or LP Gas | 194 (4.9%) | 0 (0.0%) |
| Electricity | 1,539 (38.7%) | 189 (49.5%) |
| Fuel Oil or Kerosene | 208 (5.2%) | 54 (14.1%) |
| Coal or Coke | 0 (0.0%) | 0 (0.0%) |
| All other Fuels | 39 (1.0%) | 34 (8.9%) |
| No Fuel Used | 21 (0.5%) | 0 (0.0%) |
| Total | 3,980 (100.0%) | 382 (100.0%) |
Household Vehicle Usage in Westphalia
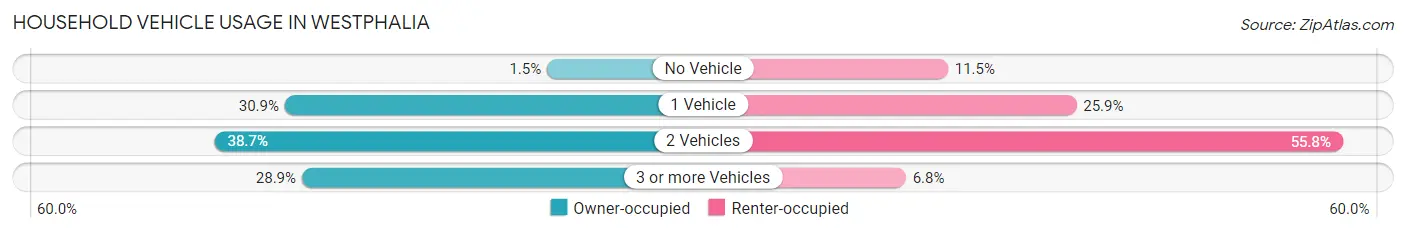
| Vehicles per Household | Owner-occupied | Renter-occupied |
| No Vehicle | 59 (1.5%) | 44 (11.5%) |
| 1 Vehicle | 1,228 (30.8%) | 99 (25.9%) |
| 2 Vehicles | 1,541 (38.7%) | 213 (55.8%) |
| 3 or more Vehicles | 1,152 (28.9%) | 26 (6.8%) |
| Total | 3,980 (100.0%) | 382 (100.0%) |
Real Estate & Mortgages in Westphalia
Real Estate and Mortgage Overview in Westphalia
| Characteristic | Without Mortgage | With Mortgage |
| Housing Units | 575 | 3,405 |
| Median Property Value | $336,400 | $461,700 |
| Median Household Income | $125,179 | $1,881 |
| Monthly Housing Costs | $784 | $1,341 |
| Real Estate Taxes | $4,799 | $170 |
Property Value by Mortgage Status in Westphalia
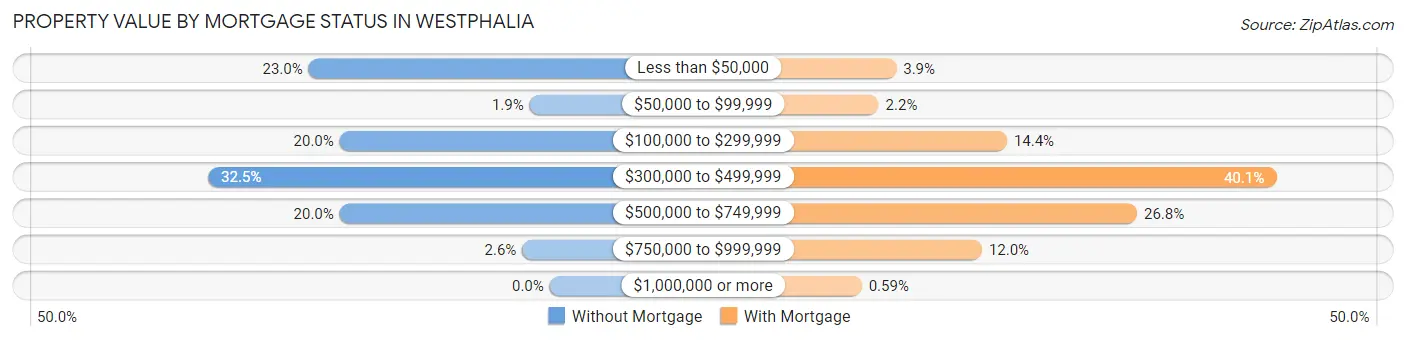
| Property Value | Without Mortgage | With Mortgage |
| Less than $50,000 | 132 (23.0%) | 132 (3.9%) |
| $50,000 to $99,999 | 11 (1.9%) | 75 (2.2%) |
| $100,000 to $299,999 | 115 (20.0%) | 491 (14.4%) |
| $300,000 to $499,999 | 187 (32.5%) | 1,364 (40.1%) |
| $500,000 to $749,999 | 115 (20.0%) | 913 (26.8%) |
| $750,000 to $999,999 | 15 (2.6%) | 410 (12.0%) |
| $1,000,000 or more | 0 (0.0%) | 20 (0.6%) |
| Total | 575 (100.0%) | 3,405 (100.0%) |
Household Income by Mortgage Status in Westphalia
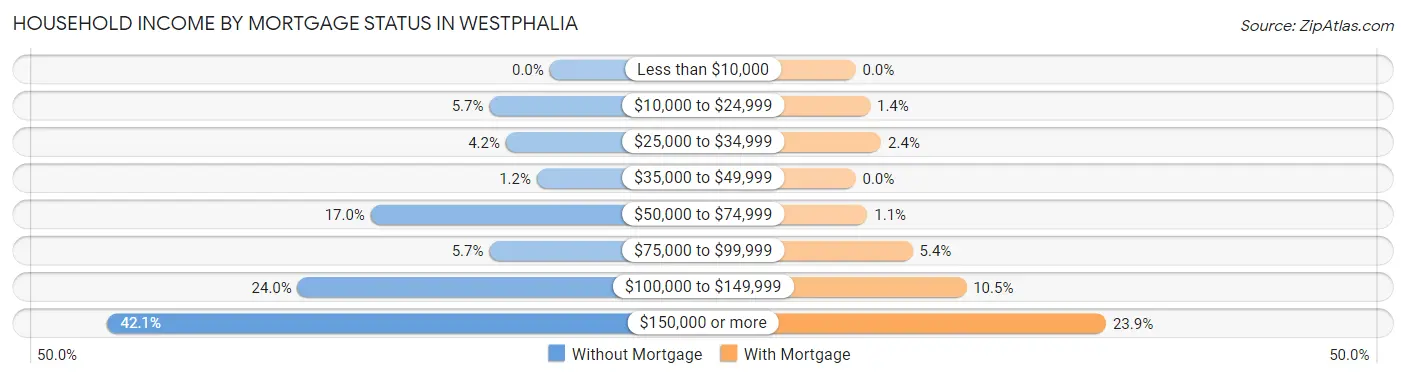
| Household Income | Without Mortgage | With Mortgage |
| Less than $10,000 | 0 (0.0%) | 0 (0.0%) |
| $10,000 to $24,999 | 33 (5.7%) | 47 (1.4%) |
| $25,000 to $34,999 | 24 (4.2%) | 83 (2.4%) |
| $35,000 to $49,999 | 7 (1.2%) | 0 (0.0%) |
| $50,000 to $74,999 | 98 (17.0%) | 38 (1.1%) |
| $75,000 to $99,999 | 33 (5.7%) | 185 (5.4%) |
| $100,000 to $149,999 | 138 (24.0%) | 359 (10.5%) |
| $150,000 or more | 242 (42.1%) | 812 (23.8%) |
| Total | 575 (100.0%) | 3,405 (100.0%) |
Property Value to Household Income Ratio in Westphalia
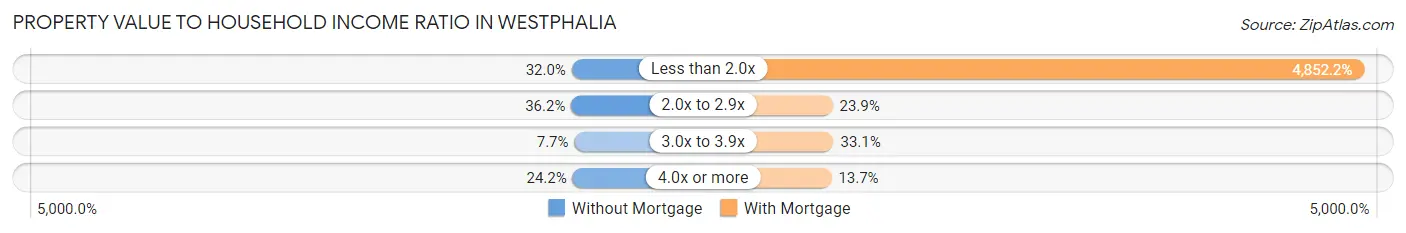
| Value-to-Income Ratio | Without Mortgage | With Mortgage |
| Less than 2.0x | 184 (32.0%) | 165,216 (4,852.2%) |
| 2.0x to 2.9x | 208 (36.2%) | 815 (23.9%) |
| 3.0x to 3.9x | 44 (7.6%) | 1,128 (33.1%) |
| 4.0x or more | 139 (24.2%) | 467 (13.7%) |
| Total | 575 (100.0%) | 3,405 (100.0%) |
Real Estate Taxes by Mortgage Status in Westphalia
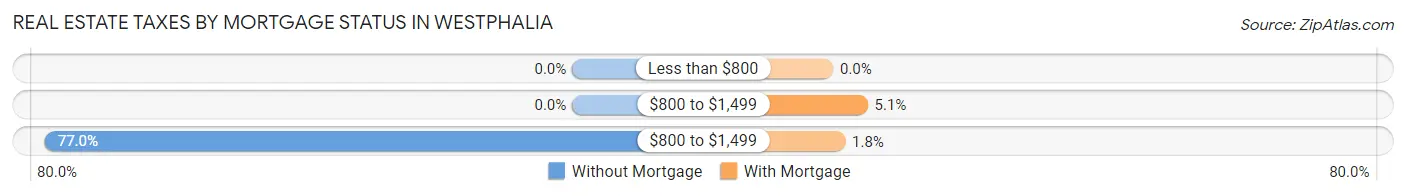
| Property Taxes | Without Mortgage | With Mortgage |
| Less than $800 | 0 (0.0%) | 0 (0.0%) |
| $800 to $1,499 | 0 (0.0%) | 172 (5.1%) |
| $800 to $1,499 | 443 (77.0%) | 60 (1.8%) |
| Total | 575 (100.0%) | 3,405 (100.0%) |
Health & Disability in Westphalia
Health Insurance Coverage by Age in Westphalia
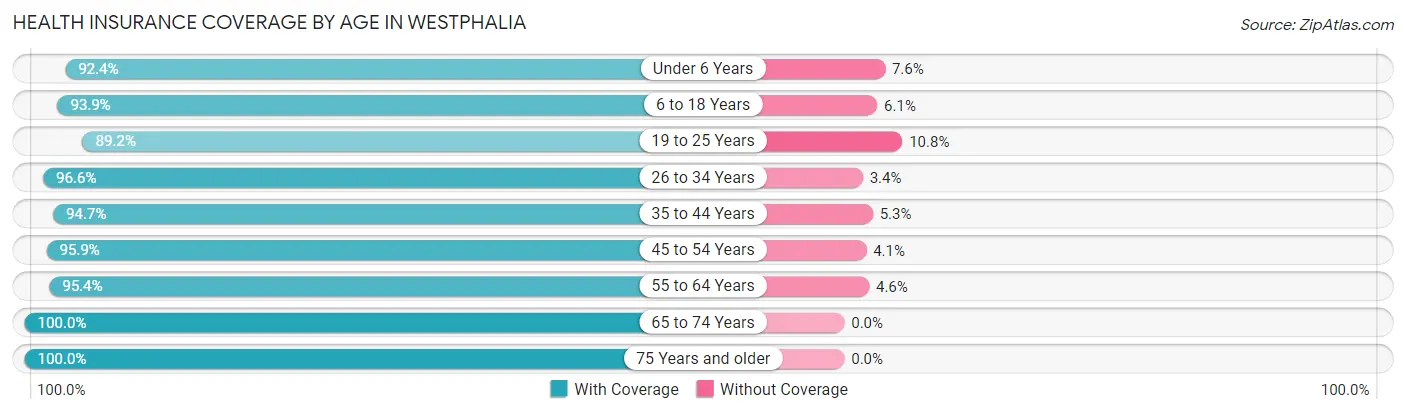
| Age Bracket | With Coverage | Without Coverage |
| Under 6 Years | 1,036 (92.4%) | 85 (7.6%) |
| 6 to 18 Years | 1,164 (93.9%) | 76 (6.1%) |
| 19 to 25 Years | 495 (89.2%) | 60 (10.8%) |
| 26 to 34 Years | 1,798 (96.6%) | 64 (3.4%) |
| 35 to 44 Years | 1,678 (94.7%) | 94 (5.3%) |
| 45 to 54 Years | 1,693 (95.9%) | 72 (4.1%) |
| 55 to 64 Years | 1,634 (95.4%) | 79 (4.6%) |
| 65 to 74 Years | 795 (100.0%) | 0 (0.0%) |
| 75 Years and older | 377 (100.0%) | 0 (0.0%) |
| Total | 10,670 (95.3%) | 530 (4.7%) |
Health Insurance Coverage by Citizenship Status in Westphalia
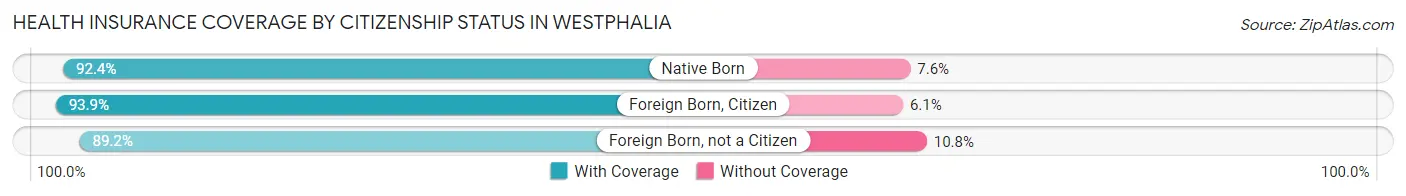
| Citizenship Status | With Coverage | Without Coverage |
| Native Born | 1,036 (92.4%) | 85 (7.6%) |
| Foreign Born, Citizen | 1,164 (93.9%) | 76 (6.1%) |
| Foreign Born, not a Citizen | 495 (89.2%) | 60 (10.8%) |
Health Insurance Coverage by Household Income in Westphalia
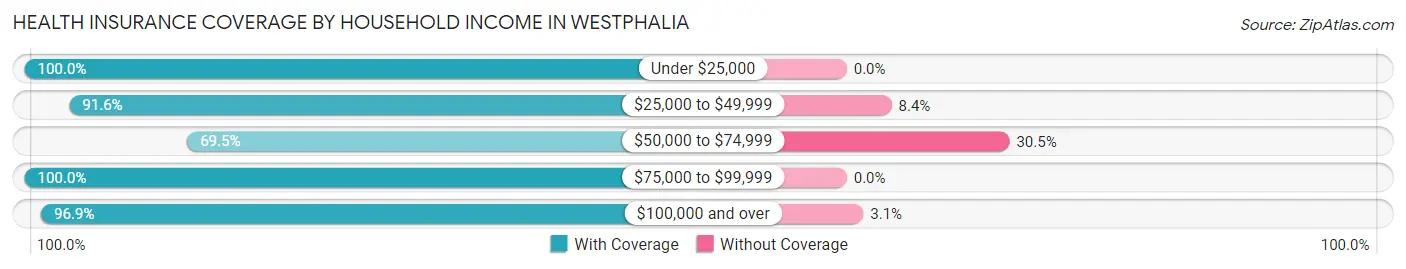
| Household Income | With Coverage | Without Coverage |
| Under $25,000 | 183 (100.0%) | 0 (0.0%) |
| $25,000 to $49,999 | 218 (91.6%) | 20 (8.4%) |
| $50,000 to $74,999 | 552 (69.5%) | 242 (30.5%) |
| $75,000 to $99,999 | 1,306 (100.0%) | 0 (0.0%) |
| $100,000 and over | 8,389 (96.9%) | 268 (3.1%) |
Public vs Private Health Insurance Coverage by Age in Westphalia
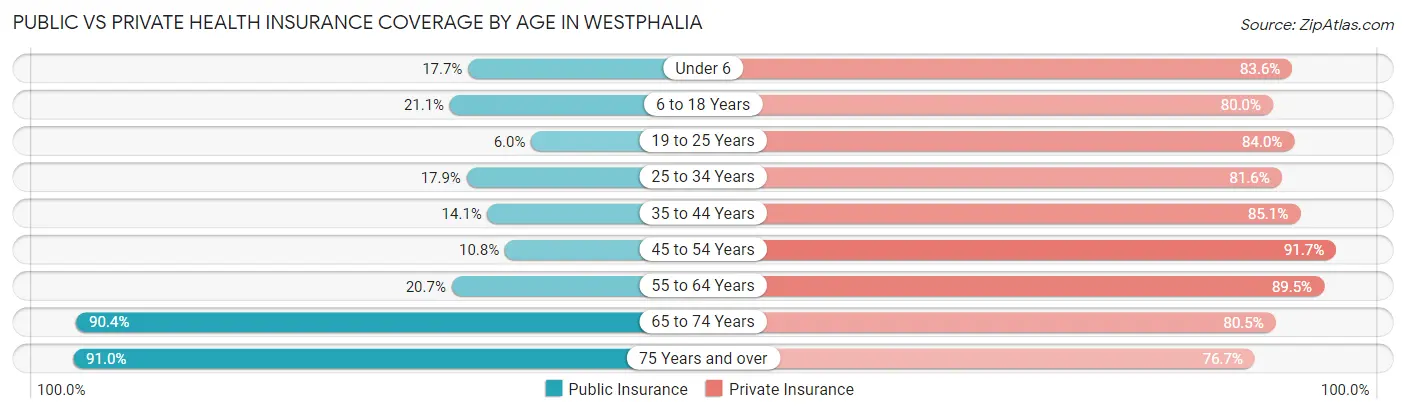
| Age Bracket | Public Insurance | Private Insurance |
| Under 6 | 198 (17.7%) | 937 (83.6%) |
| 6 to 18 Years | 261 (21.0%) | 992 (80.0%) |
| 19 to 25 Years | 33 (5.9%) | 466 (84.0%) |
| 25 to 34 Years | 334 (17.9%) | 1,520 (81.6%) |
| 35 to 44 Years | 249 (14.1%) | 1,507 (85.1%) |
| 45 to 54 Years | 191 (10.8%) | 1,619 (91.7%) |
| 55 to 64 Years | 355 (20.7%) | 1,533 (89.5%) |
| 65 to 74 Years | 719 (90.4%) | 640 (80.5%) |
| 75 Years and over | 343 (91.0%) | 289 (76.7%) |
| Total | 2,683 (24.0%) | 9,503 (84.9%) |
Disability Status by Sex by Age in Westphalia
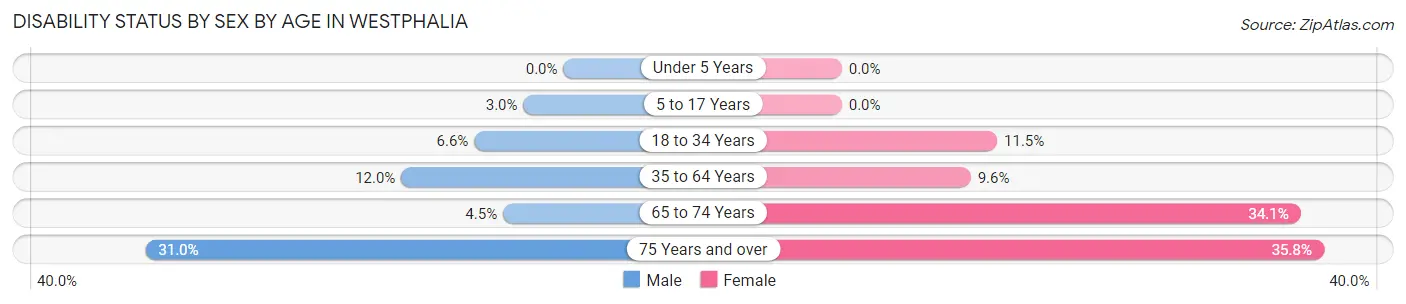
| Age Bracket | Male | Female |
| Under 5 Years | 0 (0.0%) | 0 (0.0%) |
| 5 to 17 Years | 19 (3.0%) | 0 (0.0%) |
| 18 to 34 Years | 80 (6.6%) | 146 (11.5%) |
| 35 to 64 Years | 300 (12.0%) | 264 (9.6%) |
| 65 to 74 Years | 13 (4.5%) | 172 (34.1%) |
| 75 Years and over | 45 (31.0%) | 83 (35.8%) |
Disability Class by Sex by Age in Westphalia
Disability Class: Hearing Difficulty
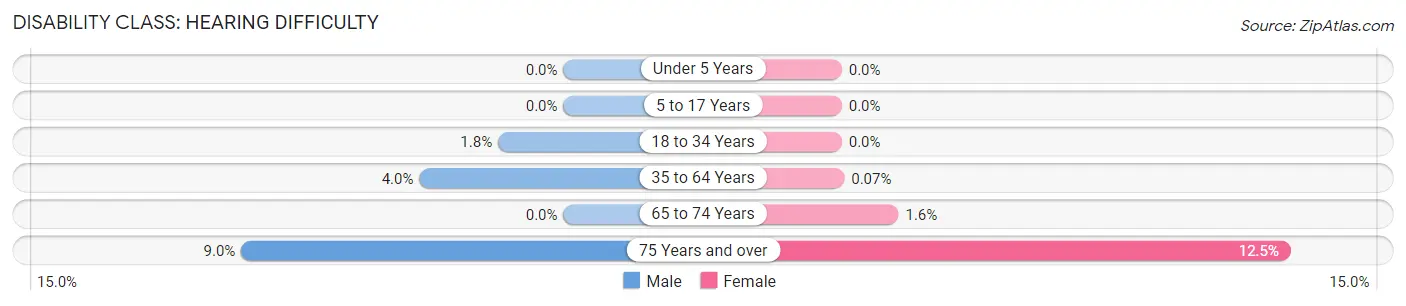
| Age Bracket | Male | Female |
| Under 5 Years | 0 (0.0%) | 0 (0.0%) |
| 5 to 17 Years | 0 (0.0%) | 0 (0.0%) |
| 18 to 34 Years | 22 (1.8%) | 0 (0.0%) |
| 35 to 64 Years | 100 (4.0%) | 2 (0.1%) |
| 65 to 74 Years | 0 (0.0%) | 8 (1.6%) |
| 75 Years and over | 13 (9.0%) | 29 (12.5%) |
Disability Class: Vision Difficulty
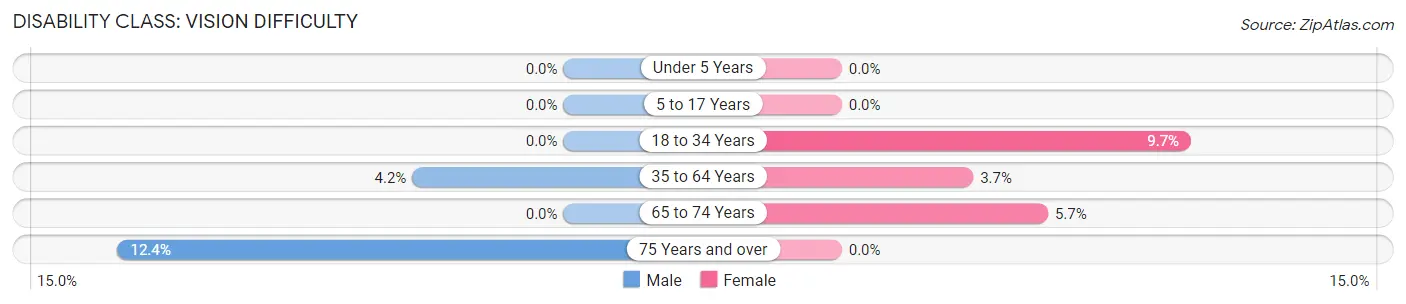
| Age Bracket | Male | Female |
| Under 5 Years | 0 (0.0%) | 0 (0.0%) |
| 5 to 17 Years | 0 (0.0%) | 0 (0.0%) |
| 18 to 34 Years | 0 (0.0%) | 123 (9.7%) |
| 35 to 64 Years | 105 (4.2%) | 101 (3.7%) |
| 65 to 74 Years | 0 (0.0%) | 29 (5.7%) |
| 75 Years and over | 18 (12.4%) | 0 (0.0%) |
Disability Class: Cognitive Difficulty
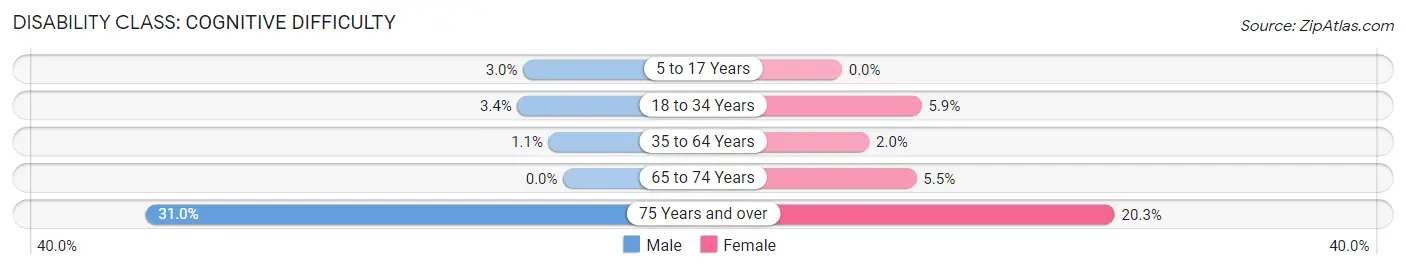
| Age Bracket | Male | Female |
| 5 to 17 Years | 19 (3.0%) | 0 (0.0%) |
| 18 to 34 Years | 41 (3.4%) | 75 (5.9%) |
| 35 to 64 Years | 27 (1.1%) | 56 (2.0%) |
| 65 to 74 Years | 0 (0.0%) | 28 (5.5%) |
| 75 Years and over | 45 (31.0%) | 47 (20.3%) |
Disability Class: Ambulatory Difficulty
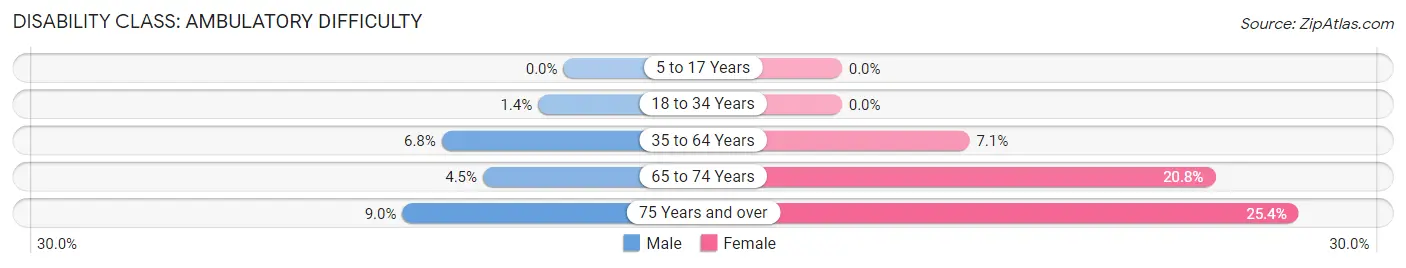
| Age Bracket | Male | Female |
| 5 to 17 Years | 0 (0.0%) | 0 (0.0%) |
| 18 to 34 Years | 17 (1.4%) | 0 (0.0%) |
| 35 to 64 Years | 169 (6.8%) | 196 (7.1%) |
| 65 to 74 Years | 13 (4.5%) | 105 (20.8%) |
| 75 Years and over | 13 (9.0%) | 59 (25.4%) |
Disability Class: Self-Care Difficulty
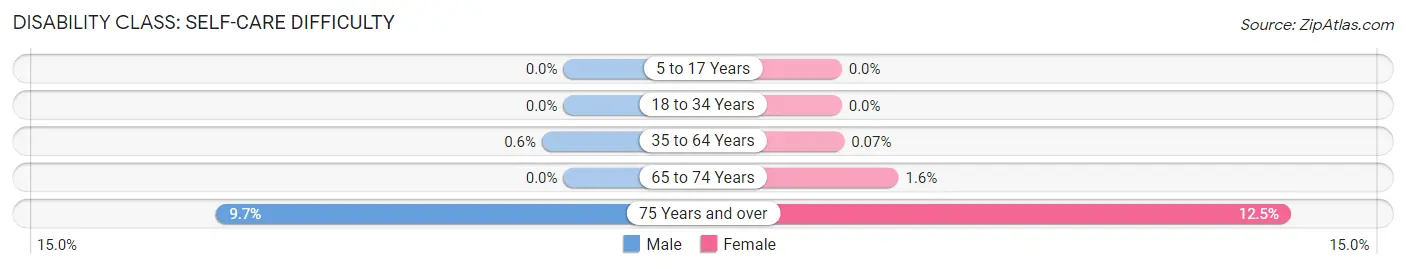
| Age Bracket | Male | Female |
| 5 to 17 Years | 0 (0.0%) | 0 (0.0%) |
| 18 to 34 Years | 0 (0.0%) | 0 (0.0%) |
| 35 to 64 Years | 15 (0.6%) | 2 (0.1%) |
| 65 to 74 Years | 0 (0.0%) | 8 (1.6%) |
| 75 Years and over | 14 (9.7%) | 29 (12.5%) |
Technology Access in Westphalia
Computing Device Access in Westphalia
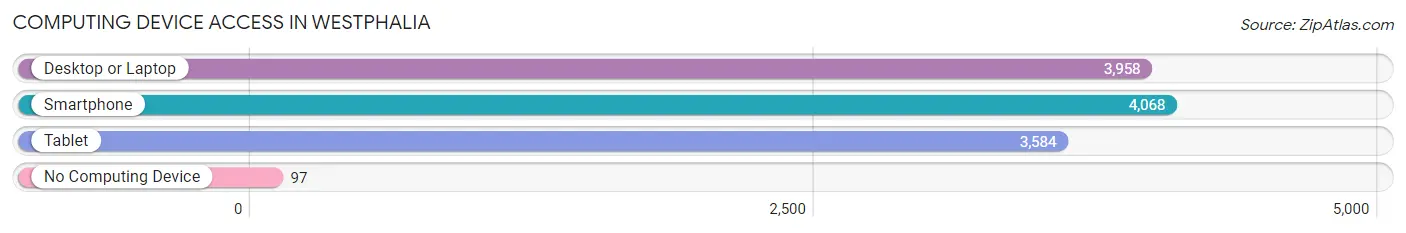
| Device Type | # Households | % Households |
| Desktop or Laptop | 3,958 | 90.7% |
| Smartphone | 4,068 | 93.3% |
| Tablet | 3,584 | 82.2% |
| No Computing Device | 97 | 2.2% |
| Total | 4,362 | 100.0% |
Internet Access in Westphalia
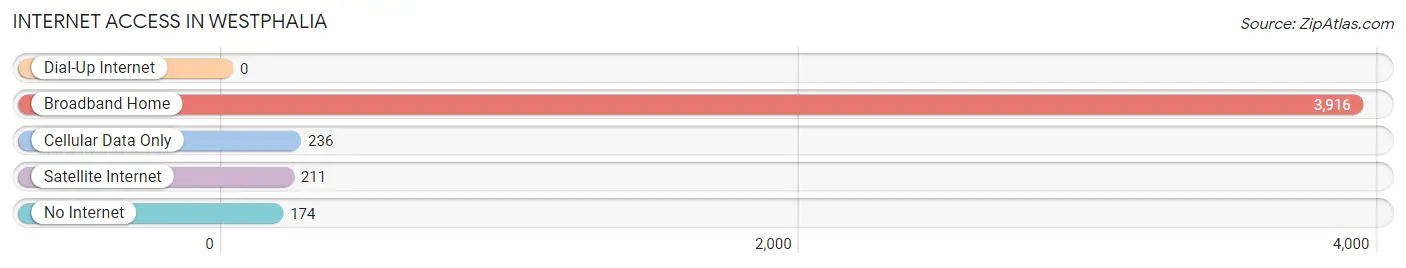
| Internet Type | # Households | % Households |
| Dial-Up Internet | 0 | 0.0% |
| Broadband Home | 3,916 | 89.8% |
| Cellular Data Only | 236 | 5.4% |
| Satellite Internet | 211 | 4.8% |
| No Internet | 174 | 4.0% |
| Total | 4,362 | 100.0% |
Westphalia Summary
Westphalia is a small unincorporated community located in Prince George’s County, Maryland. It is situated in the southeastern corner of the county, just south of the Washington, D.C. border. Westphalia is a rural community with a population of approximately 2,000 people.
History
Westphalia was first settled in the late 1700s by German immigrants who were attracted to the area by its fertile soil and abundant natural resources. The community was named after the German region of Westphalia, which is located in the western part of the country. The first settlers built a small church and a school, and the community quickly grew. By the mid-1800s, Westphalia had become a thriving agricultural community, with a population of over 500 people.
In the early 1900s, Westphalia began to experience a period of decline. The population decreased as people moved away in search of better economic opportunities. By the 1950s, the population had dropped to just over 200 people.
In the late 1960s, Westphalia experienced a resurgence as the Washington, D.C. metropolitan area began to expand. The population increased to over 1,000 people by the early 2000s.
Geography
Westphalia is located in the southeastern corner of Prince George’s County, Maryland. It is situated just south of the Washington, D.C. border. The community is bordered by the towns of Upper Marlboro and Clinton to the north, and by the towns of Brandywine and Aquasco to the south.
Westphalia is a rural community with a total area of 2.2 square miles. The terrain is mostly flat, with some rolling hills. The community is located in the Piedmont region of Maryland, which is characterized by rolling hills and fertile soil.
Economy
Westphalia is a primarily residential community, with a small commercial sector. The primary industries in the area are agriculture and retail. The community is home to several small businesses, including a grocery store, a hardware store, and a few restaurants.
The median household income in Westphalia is $68,000, which is slightly higher than the median income for Prince George’s County. The unemployment rate in the community is 4.2%, which is lower than the county average of 5.2%.
Demographics
Westphalia is a diverse community with a population of approximately 2,000 people. The racial makeup of the community is 57.3% White, 28.2% African American, 8.2% Hispanic or Latino, and 6.3% Asian.
The median age in Westphalia is 37.5 years, which is slightly lower than the median age for Prince George’s County. The median home value in the community is $310,000, which is higher than the median home value for the county.
Westphalia is a small, rural community with a rich history and a diverse population. The community is located in a convenient location, close to the Washington, D.C. metropolitan area. The economy of the community is primarily based on agriculture and retail, and the median household income is slightly higher than the county average. Westphalia is a great place to live, work, and raise a family.
Common Questions
What is Per Capita Income in Westphalia?
Per Capita income in Westphalia is $65,425.
What is the Median Family Income in Westphalia?
Median Family Income in Westphalia is $178,805.
What is the Median Household income in Westphalia?
Median Household Income in Westphalia is $150,603.
What is Income or Wage Gap in Westphalia?
Income or Wage Gap in Westphalia is 15.6%.
Women in Westphalia earn 84.4 cents for every dollar earned by a man.
What is Inequality or Gini Index in Westphalia?
Inequality or Gini Index in Westphalia is 0.31.
What is the Total Population of Westphalia?
Total Population of Westphalia is 11,260.
What is the Total Male Population of Westphalia?
Total Male Population of Westphalia is 5,365.
What is the Total Female Population of Westphalia?
Total Female Population of Westphalia is 5,895.
What is the Ratio of Males per 100 Females in Westphalia?
There are 91.01 Males per 100 Females in Westphalia.
What is the Ratio of Females per 100 Males in Westphalia?
There are 109.88 Females per 100 Males in Westphalia.
What is the Median Population Age in Westphalia?
Median Population Age in Westphalia is 40.4 Years.
What is the Average Family Size in Westphalia
Average Family Size in Westphalia is 3.3 People.
What is the Average Household Size in Westphalia
Average Household Size in Westphalia is 2.6 People.
How Large is the Labor Force in Westphalia?
There are 7,141 People in the Labor Forcein in Westphalia.
What is the Percentage of People in the Labor Force in Westphalia?
78.6% of People are in the Labor Force in Westphalia.
What is the Unemployment Rate in Westphalia?
Unemployment Rate in Westphalia is 7.0%.