North Beach, MD Map & Demographics
North Beach Map
North Beach Overview
$38,190
PER CAPITA INCOME
$86,771
AVG FAMILY INCOME
$78,442
AVG HOUSEHOLD INCOME
28.2%
WAGE / INCOME GAP [ % ]
71.8¢/ $1
WAGE / INCOME GAP [ $ ]
0.38
INEQUALITY / GINI INDEX
2,646
TOTAL POPULATION
1,196
MALE POPULATION
1,450
FEMALE POPULATION
82.48
MALES / 100 FEMALES
121.24
FEMALES / 100 MALES
32.2
MEDIAN AGE
3.5
AVG FAMILY SIZE
2.6
AVG HOUSEHOLD SIZE
1,345
LABOR FORCE [ PEOPLE ]
69.3%
PERCENT IN LABOR FORCE
16.9%
UNEMPLOYMENT RATE
North Beach Zip Codes
Income in North Beach
Income Overview in North Beach
Per Capita Income in North Beach is $38,190, while median incomes of families and households are $86,771 and $78,442 respectively.
| Characteristic | Number | Measure |
| Per Capita Income | 2,646 | $38,190 |
| Median Family Income | 610 | $86,771 |
| Mean Family Income | 610 | $116,332 |
| Median Household Income | 1,017 | $78,442 |
| Mean Household Income | 1,017 | $95,422 |
| Income Deficit | 610 | $0 |
| Wage / Income Gap (%) | 2,646 | 28.23% |
| Wage / Income Gap ($) | 2,646 | 71.77¢ per $1 |
| Gini / Inequality Index | 2,646 | 0.38 |
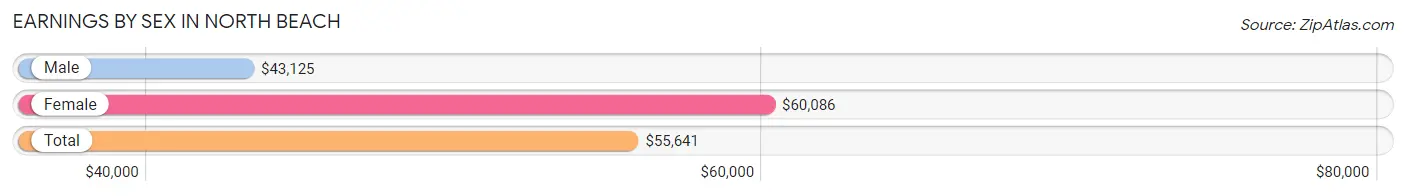
Earnings by Sex in North Beach
Average Earnings in North Beach are $55,641, $43,125 for men and $60,086 for women, a difference of 28.2%.
| Sex | Number | Average Earnings |
| Male | 660 (52.6%) | $43,125 |
| Female | 594 (47.4%) | $60,086 |
| Total | 1,254 (100.0%) | $55,641 |
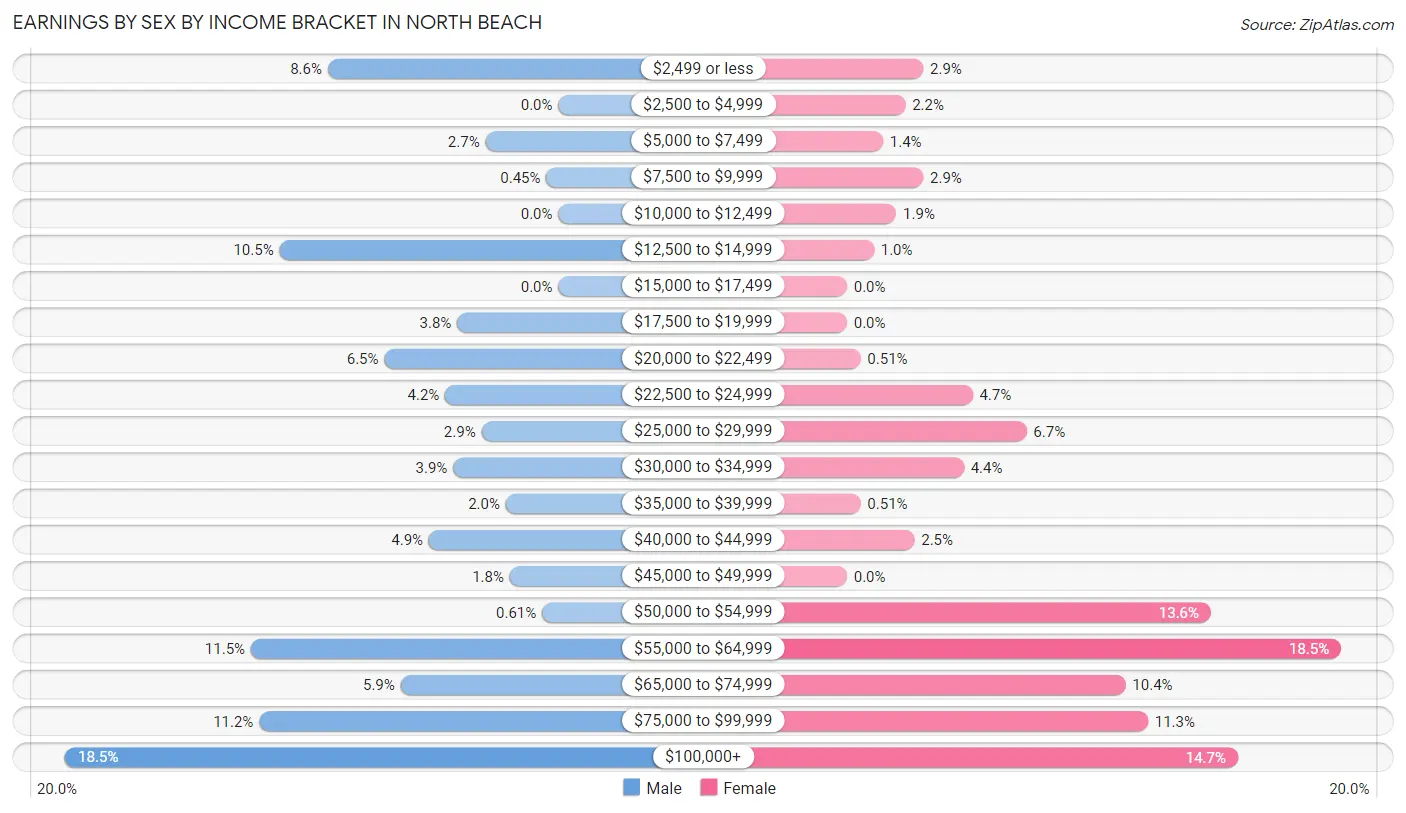
Earnings by Sex by Income Bracket in North Beach
The most common earnings brackets in North Beach are $100,000+ for men (122 | 18.5%) and $55,000 to $64,999 for women (110 | 18.5%).
| Income | Male | Female |
| $2,499 or less | 57 (8.6%) | 17 (2.9%) |
| $2,500 to $4,999 | 0 (0.0%) | 13 (2.2%) |
| $5,000 to $7,499 | 18 (2.7%) | 8 (1.3%) |
| $7,500 to $9,999 | 3 (0.4%) | 17 (2.9%) |
| $10,000 to $12,499 | 0 (0.0%) | 11 (1.8%) |
| $12,500 to $14,999 | 69 (10.4%) | 6 (1.0%) |
| $15,000 to $17,499 | 0 (0.0%) | 0 (0.0%) |
| $17,500 to $19,999 | 25 (3.8%) | 0 (0.0%) |
| $20,000 to $22,499 | 43 (6.5%) | 3 (0.5%) |
| $22,500 to $24,999 | 28 (4.2%) | 28 (4.7%) |
| $25,000 to $29,999 | 19 (2.9%) | 40 (6.7%) |
| $30,000 to $34,999 | 26 (3.9%) | 26 (4.4%) |
| $35,000 to $39,999 | 13 (2.0%) | 3 (0.5%) |
| $40,000 to $44,999 | 32 (4.9%) | 15 (2.5%) |
| $45,000 to $49,999 | 12 (1.8%) | 0 (0.0%) |
| $50,000 to $54,999 | 4 (0.6%) | 81 (13.6%) |
| $55,000 to $64,999 | 76 (11.5%) | 110 (18.5%) |
| $65,000 to $74,999 | 39 (5.9%) | 62 (10.4%) |
| $75,000 to $99,999 | 74 (11.2%) | 67 (11.3%) |
| $100,000+ | 122 (18.5%) | 87 (14.6%) |
| Total | 660 (100.0%) | 594 (100.0%) |
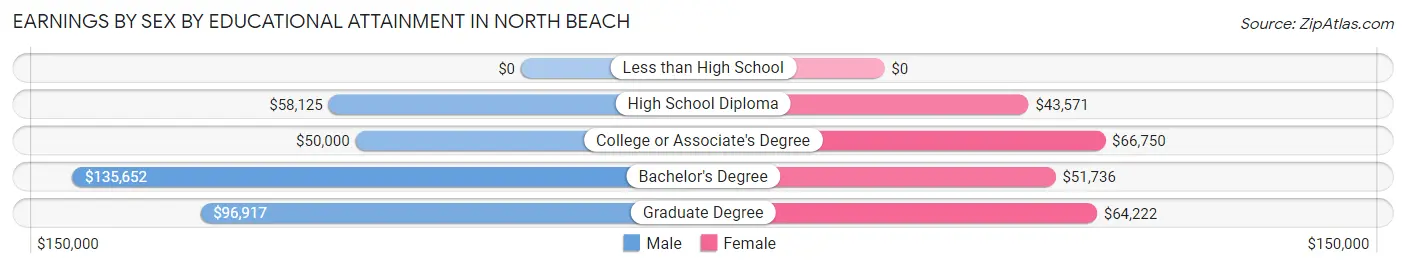
Earnings by Sex by Educational Attainment in North Beach
Average earnings in North Beach are $68,229 for men and $61,595 for women, a difference of 9.7%. Men with an educational attainment of bachelor's degree enjoy the highest average annual earnings of $135,652, while those with college or associate's degree education earn the least with $50,000. Women with an educational attainment of college or associate's degree earn the most with the average annual earnings of $66,750, while those with high school diploma education have the smallest earnings of $43,571.
| Educational Attainment | Male Income | Female Income |
| Less than High School | - | - |
| High School Diploma | $58,125 | $43,571 |
| College or Associate's Degree | $50,000 | $66,750 |
| Bachelor's Degree | $135,652 | $51,736 |
| Graduate Degree | $96,917 | $64,222 |
| Total | $68,229 | $61,595 |
Family Income in North Beach
Family Income Brackets in North Beach
According to the North Beach family income data, there are 167 families falling into the $75,000 to $99,999 income range, which is the most common income bracket and makes up 27.4% of all families. Conversely, the less than $10,000 income bracket is the least frequent group with only 3 families (0.5%) belonging to this category.
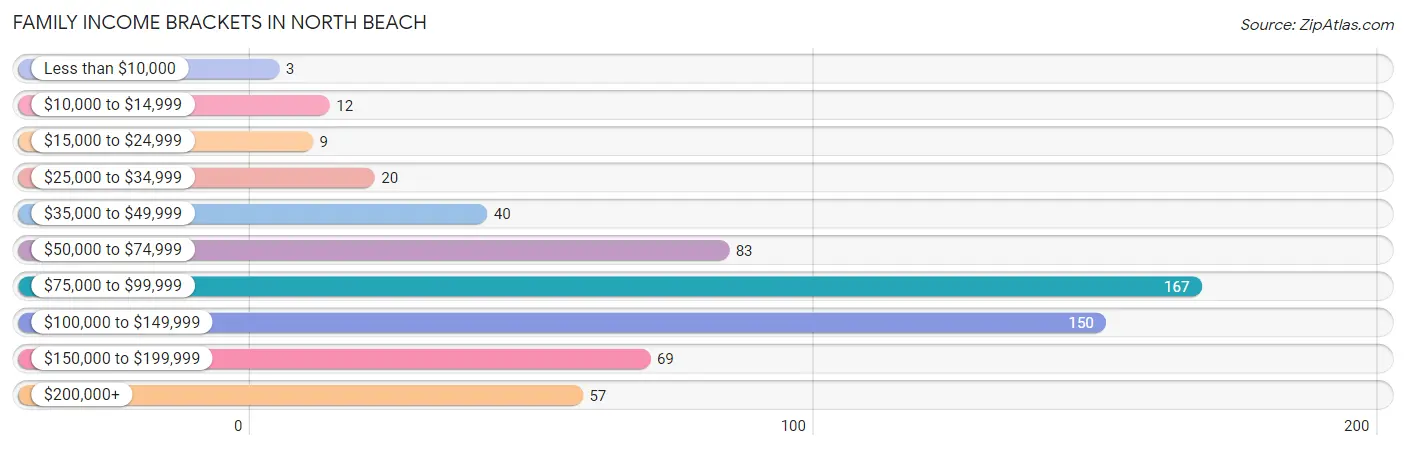
| Income Bracket | # Families | % Families |
| Less than $10,000 | 3 | 0.5% |
| $10,000 to $14,999 | 12 | 2.0% |
| $15,000 to $24,999 | 9 | 1.5% |
| $25,000 to $34,999 | 20 | 3.3% |
| $35,000 to $49,999 | 40 | 6.6% |
| $50,000 to $74,999 | 83 | 13.6% |
| $75,000 to $99,999 | 167 | 27.4% |
| $100,000 to $149,999 | 150 | 24.6% |
| $150,000 to $199,999 | 69 | 11.3% |
| $200,000+ | 57 | 9.3% |
Family Income by Famaliy Size in North Beach
4-person families (74 | 12.1%) account for the highest median family income in North Beach with $195,132 per family, while 4-person families (74 | 12.1%) have the highest median income of $48,783 per family member.
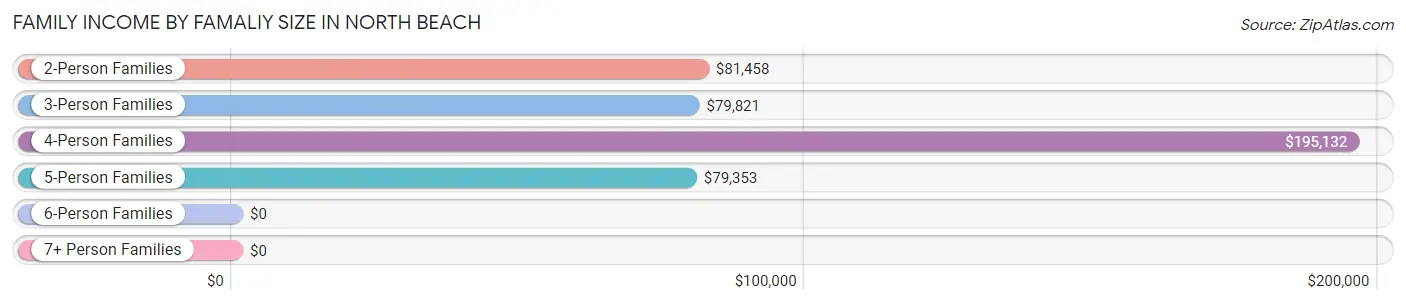
| Income Bracket | # Families | Median Income |
| 2-Person Families | 293 (48.0%) | $81,458 |
| 3-Person Families | 109 (17.9%) | $79,821 |
| 4-Person Families | 74 (12.1%) | $195,132 |
| 5-Person Families | 98 (16.1%) | $79,353 |
| 6-Person Families | 32 (5.2%) | $0 |
| 7+ Person Families | 4 (0.7%) | $0 |
| Total | 610 (100.0%) | $86,771 |
Family Income by Number of Earners in North Beach
The median family income in North Beach is $86,771, with families comprising 3+ earners (44) having the highest median family income of $116,500, while families with no earners (68) have the lowest median family income of $51,786, accounting for 7.2% and 11.2% of families, respectively.
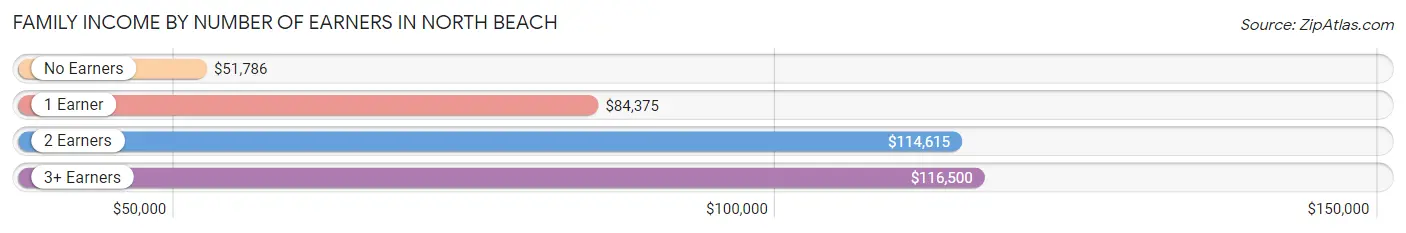
| Number of Earners | # Families | Median Income |
| No Earners | 68 (11.2%) | $51,786 |
| 1 Earner | 244 (40.0%) | $84,375 |
| 2 Earners | 254 (41.6%) | $114,615 |
| 3+ Earners | 44 (7.2%) | $116,500 |
| Total | 610 (100.0%) | $86,771 |
Household Income in North Beach
Household Income Brackets in North Beach
With 223 households falling in the category, the $100,000 to $149,999 income range is the most frequent in North Beach, accounting for 21.9% of all households. In contrast, only 25 households (2.5%) fall into the less than $10,000 income bracket, making it the least populous group.
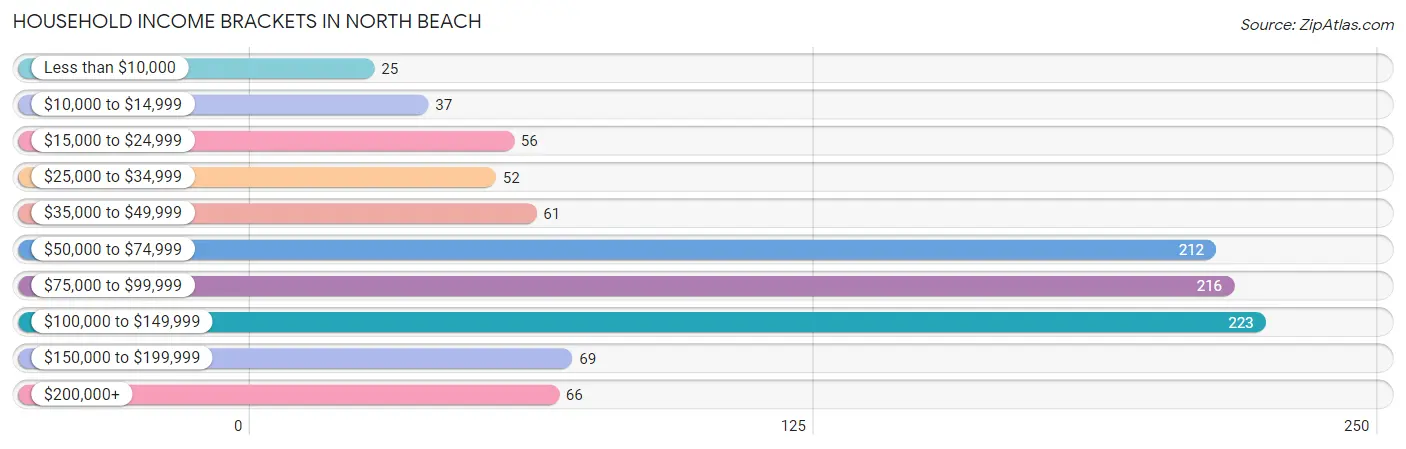
| Income Bracket | # Households | % Households |
| Less than $10,000 | 25 | 2.5% |
| $10,000 to $14,999 | 37 | 3.6% |
| $15,000 to $24,999 | 56 | 5.5% |
| $25,000 to $34,999 | 52 | 5.1% |
| $35,000 to $49,999 | 61 | 6.0% |
| $50,000 to $74,999 | 212 | 20.8% |
| $75,000 to $99,999 | 216 | 21.2% |
| $100,000 to $149,999 | 223 | 21.9% |
| $150,000 to $199,999 | 69 | 6.8% |
| $200,000+ | 66 | 6.5% |
Household Income by Householder Age in North Beach
The median household income in North Beach is $78,442, with the highest median household income of $87,135 found in the 25 to 44 years age bracket for the primary householder. A total of 263 households (25.9%) fall into this category. Meanwhile, the 15 to 24 years age bracket for the primary householder has the lowest median household income of $0, with 24 households (2.4%) in this group.
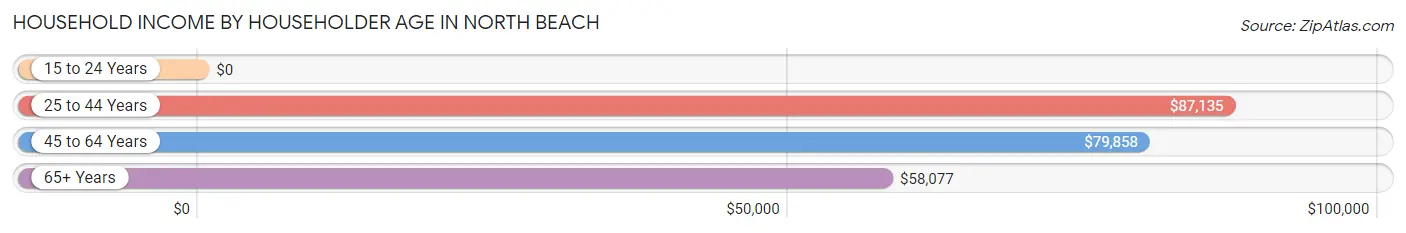
| Income Bracket | # Households | Median Income |
| 15 to 24 Years | 24 (2.4%) | $0 |
| 25 to 44 Years | 263 (25.9%) | $87,135 |
| 45 to 64 Years | 442 (43.5%) | $79,858 |
| 65+ Years | 288 (28.3%) | $58,077 |
| Total | 1,017 (100.0%) | $78,442 |
Poverty in North Beach
Income Below Poverty by Sex and Age in North Beach
With 3.3% poverty level for males and 4.9% for females among the residents of North Beach, 55 to 64 year old males and 15 year old females are the most vulnerable to poverty, with 12 males (11.4%) and 5 females (19.2%) in their respective age groups living below the poverty level.
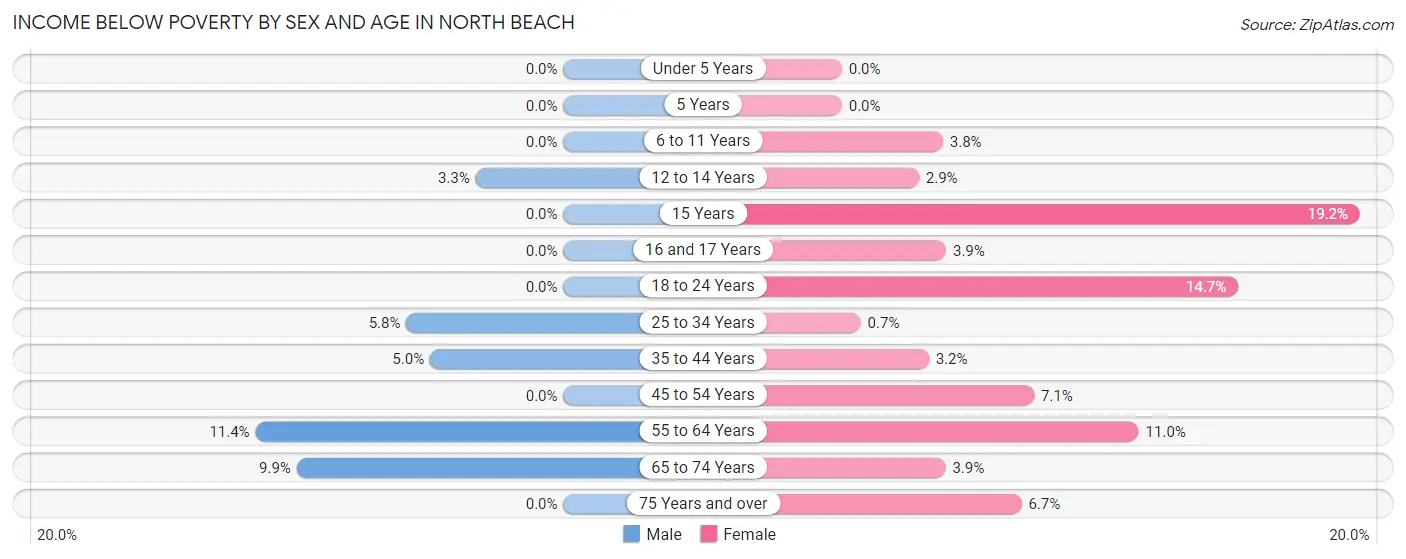
| Age Bracket | Male | Female |
| Under 5 Years | 0 (0.0%) | 0 (0.0%) |
| 5 Years | 0 (0.0%) | 0 (0.0%) |
| 6 to 11 Years | 0 (0.0%) | 3 (3.7%) |
| 12 to 14 Years | 6 (3.3%) | 3 (2.9%) |
| 15 Years | 0 (0.0%) | 5 (19.2%) |
| 16 and 17 Years | 0 (0.0%) | 6 (3.9%) |
| 18 to 24 Years | 0 (0.0%) | 5 (14.7%) |
| 25 to 34 Years | 7 (5.8%) | 1 (0.7%) |
| 35 to 44 Years | 5 (5.0%) | 5 (3.2%) |
| 45 to 54 Years | 0 (0.0%) | 17 (7.1%) |
| 55 to 64 Years | 12 (11.4%) | 14 (11.0%) |
| 65 to 74 Years | 10 (9.9%) | 7 (3.8%) |
| 75 Years and over | 0 (0.0%) | 5 (6.7%) |
| Total | 40 (3.3%) | 71 (4.9%) |
Income Above Poverty by Sex and Age in North Beach
According to the poverty statistics in North Beach, males aged under 5 years and females aged under 5 years are the age groups that are most secure financially, with 100.0% of males and 100.0% of females in these age groups living above the poverty line.
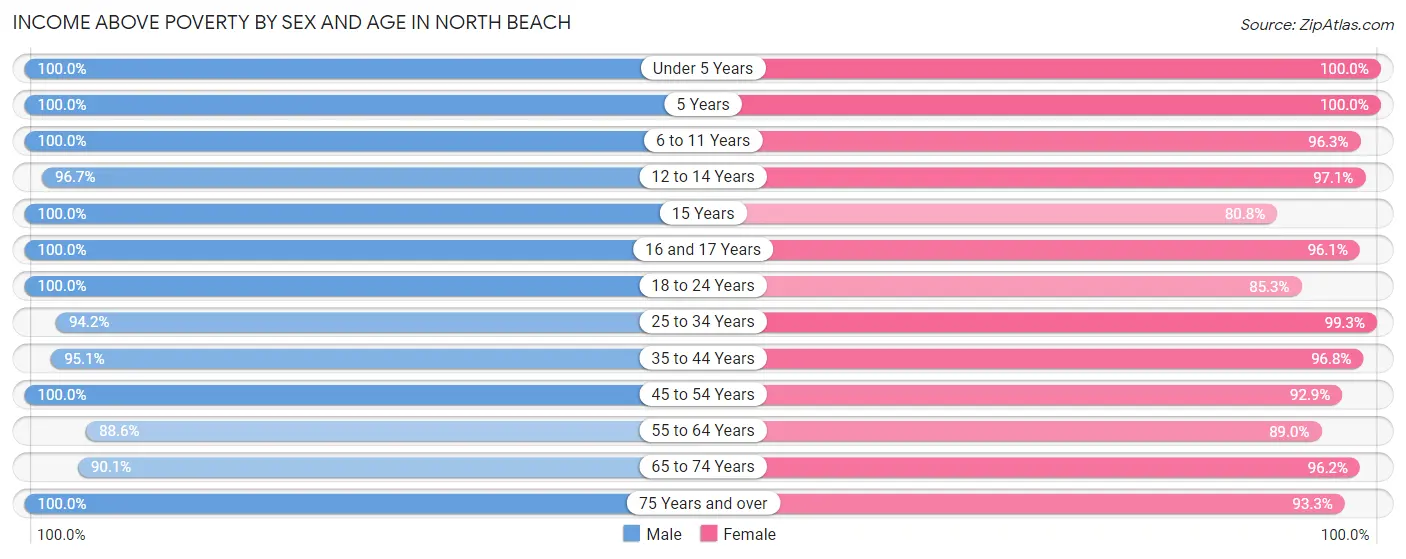
| Age Bracket | Male | Female |
| Under 5 Years | 53 (100.0%) | 32 (100.0%) |
| 5 Years | 11 (100.0%) | 98 (100.0%) |
| 6 to 11 Years | 103 (100.0%) | 77 (96.3%) |
| 12 to 14 Years | 178 (96.7%) | 102 (97.1%) |
| 15 Years | 13 (100.0%) | 21 (80.8%) |
| 16 and 17 Years | 108 (100.0%) | 149 (96.1%) |
| 18 to 24 Years | 146 (100.0%) | 29 (85.3%) |
| 25 to 34 Years | 113 (94.2%) | 142 (99.3%) |
| 35 to 44 Years | 96 (95.1%) | 150 (96.8%) |
| 45 to 54 Years | 105 (100.0%) | 221 (92.9%) |
| 55 to 64 Years | 93 (88.6%) | 113 (89.0%) |
| 65 to 74 Years | 91 (90.1%) | 175 (96.2%) |
| 75 Years and over | 46 (100.0%) | 70 (93.3%) |
| Total | 1,156 (96.7%) | 1,379 (95.1%) |
Income Below Poverty Among Married-Couple Families in North Beach
The poverty statistics for married-couple families in North Beach show that 3.7% or 11 of the total 296 families live below the poverty line. Families with 1 or 2 children have the highest poverty rate of 6.1%, comprising of 5 families. On the other hand, families with 3 or 4 children have the lowest poverty rate of 0.0%, which includes 0 families.
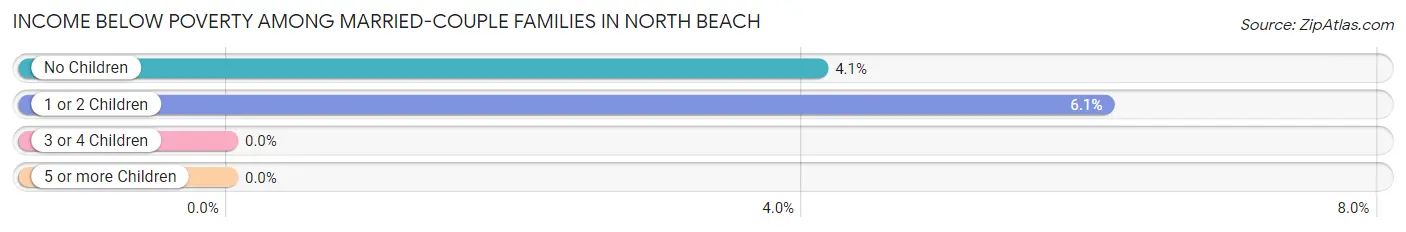
| Children | Above Poverty | Below Poverty |
| No Children | 140 (95.9%) | 6 (4.1%) |
| 1 or 2 Children | 77 (93.9%) | 5 (6.1%) |
| 3 or 4 Children | 64 (100.0%) | 0 (0.0%) |
| 5 or more Children | 4 (100.0%) | 0 (0.0%) |
| Total | 285 (96.3%) | 11 (3.7%) |
Income Below Poverty Among Single-Parent Households in North Beach
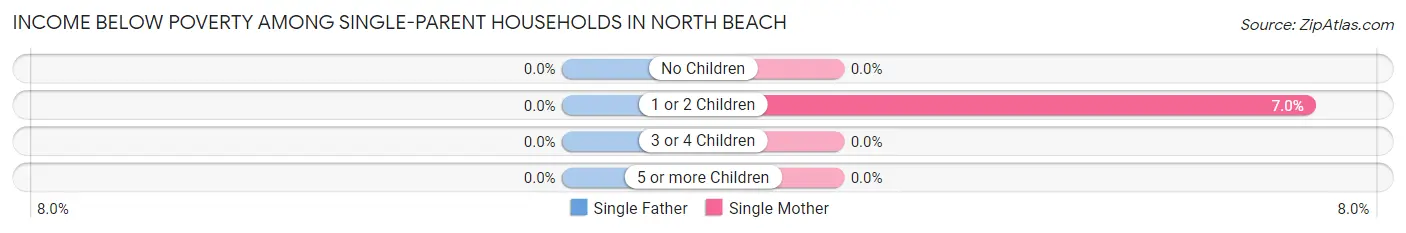
| Children | Single Father | Single Mother |
| No Children | 0 (0.0%) | 0 (0.0%) |
| 1 or 2 Children | 0 (0.0%) | 9 (7.0%) |
| 3 or 4 Children | 0 (0.0%) | 0 (0.0%) |
| 5 or more Children | 0 (0.0%) | 0 (0.0%) |
| Total | 0 (0.0%) | 9 (3.6%) |
Income Below Poverty Among Married-Couple vs Single-Parent Households in North Beach
The poverty data for North Beach shows that 11 of the married-couple family households (3.7%) and 9 of the single-parent households (2.9%) are living below the poverty level. Within the married-couple family households, those with 1 or 2 children have the highest poverty rate, with 5 households (6.1%) falling below the poverty line. Among the single-parent households, those with 1 or 2 children have the highest poverty rate, with 9 household (6.1%) living below poverty.
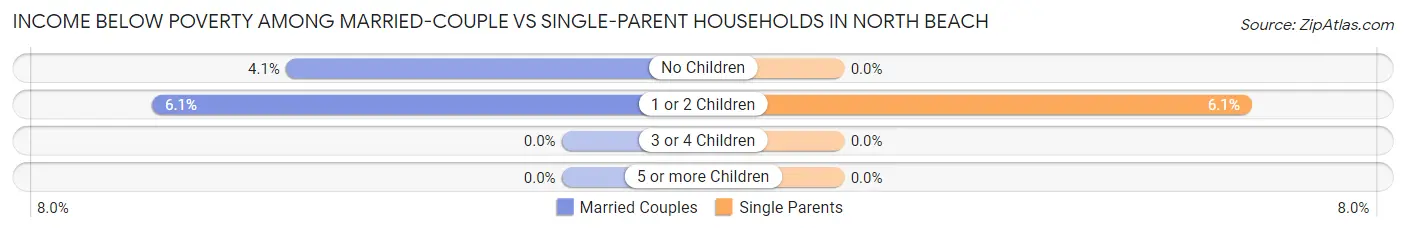
| Children | Married-Couple Families | Single-Parent Households |
| No Children | 6 (4.1%) | 0 (0.0%) |
| 1 or 2 Children | 5 (6.1%) | 9 (6.1%) |
| 3 or 4 Children | 0 (0.0%) | 0 (0.0%) |
| 5 or more Children | 0 (0.0%) | 0 (0.0%) |
| Total | 11 (3.7%) | 9 (2.9%) |
Race in North Beach
The most populous races in North Beach are White / Caucasian (1,617 | 61.1%), Black / African American (580 | 21.9%), and Asian (185 | 7.0%).
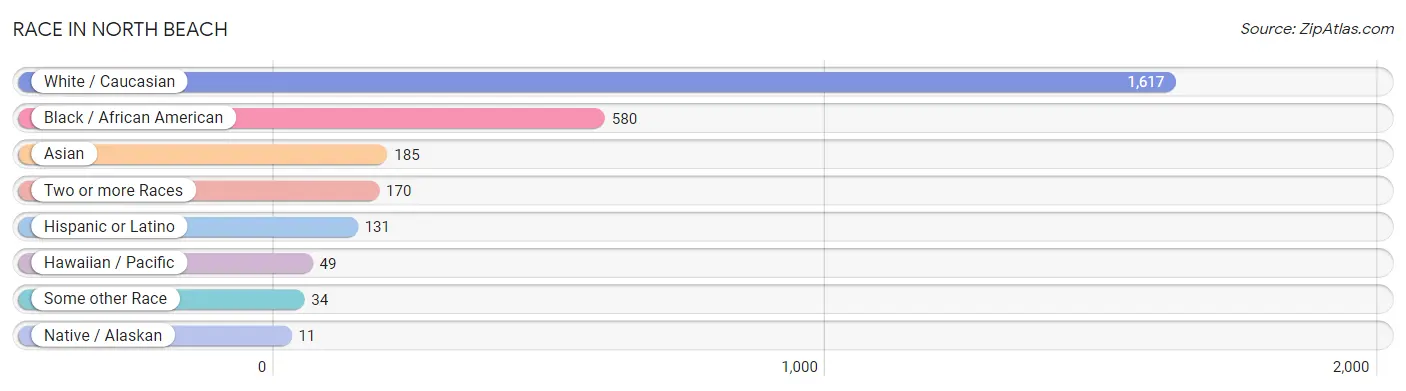
| Race | # Population | % Population |
| Asian | 185 | 7.0% |
| Black / African American | 580 | 21.9% |
| Hawaiian / Pacific | 49 | 1.8% |
| Hispanic or Latino | 131 | 5.0% |
| Native / Alaskan | 11 | 0.4% |
| White / Caucasian | 1,617 | 61.1% |
| Two or more Races | 170 | 6.4% |
| Some other Race | 34 | 1.3% |
| Total | 2,646 | 100.0% |
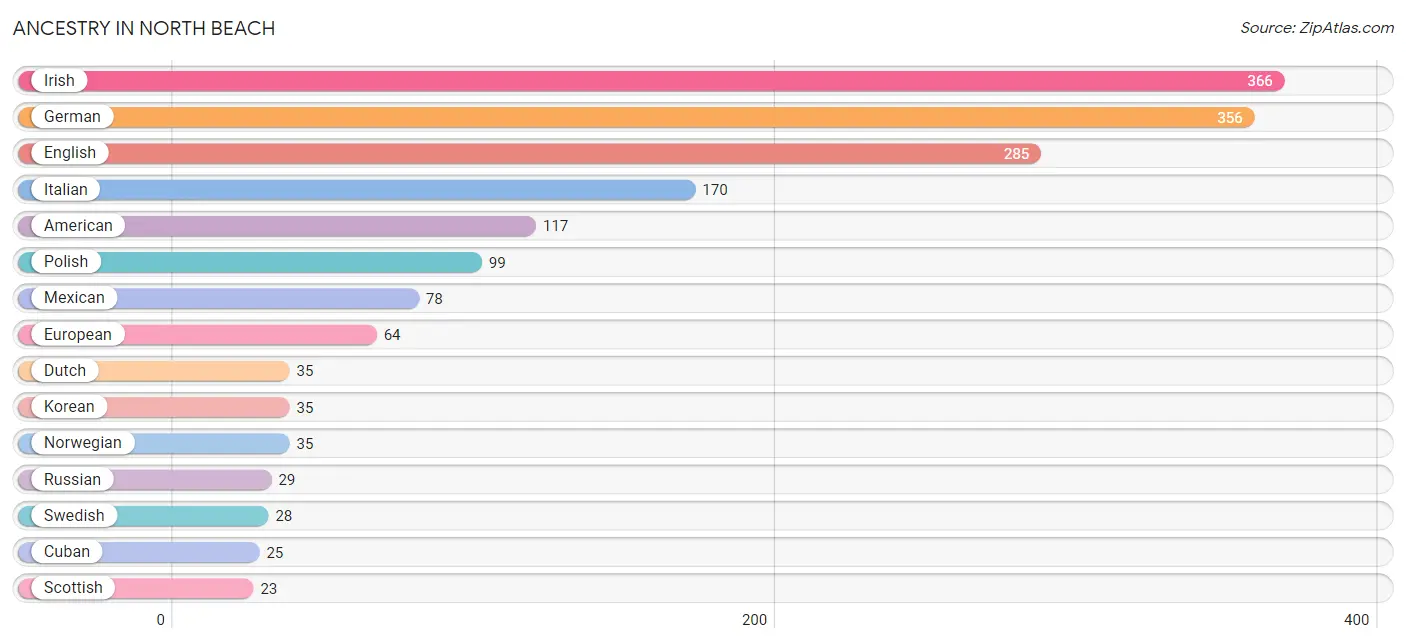
Ancestry in North Beach
The most populous ancestries reported in North Beach are Irish (366 | 13.8%), German (356 | 13.5%), English (285 | 10.8%), Italian (170 | 6.4%), and American (117 | 4.4%), together accounting for 48.9% of all North Beach residents.
| Ancestry | # Population | % Population |
| African | 11 | 0.4% |
| American | 117 | 4.4% |
| Apache | 6 | 0.2% |
| Belizean | 1 | 0.0% |
| Bhutanese | 22 | 0.8% |
| Blackfeet | 20 | 0.8% |
| British | 21 | 0.8% |
| Burmese | 17 | 0.6% |
| Cherokee | 17 | 0.6% |
| Chickasaw | 1 | 0.0% |
| Cuban | 25 | 0.9% |
| Czech | 5 | 0.2% |
| Danish | 5 | 0.2% |
| Dutch | 35 | 1.3% |
| English | 285 | 10.8% |
| European | 64 | 2.4% |
| French | 22 | 0.8% |
| German | 356 | 13.5% |
| Ghanaian | 5 | 0.2% |
| Greek | 4 | 0.2% |
| Hungarian | 6 | 0.2% |
| Irish | 366 | 13.8% |
| Italian | 170 | 6.4% |
| Korean | 35 | 1.3% |
| Latvian | 5 | 0.2% |
| Mexican | 78 | 2.9% |
| Northern European | 5 | 0.2% |
| Norwegian | 35 | 1.3% |
| Peruvian | 7 | 0.3% |
| Polish | 99 | 3.7% |
| Portuguese | 14 | 0.5% |
| Puerto Rican | 17 | 0.6% |
| Russian | 29 | 1.1% |
| Scandinavian | 11 | 0.4% |
| Scotch-Irish | 11 | 0.4% |
| Scottish | 23 | 0.9% |
| Slavic | 8 | 0.3% |
| South American | 7 | 0.3% |
| Spanish | 4 | 0.2% |
| Subsaharan African | 16 | 0.6% |
| Swedish | 28 | 1.1% |
| Thai | 5 | 0.2% |
| Vietnamese | 6 | 0.2% |
| Welsh | 13 | 0.5% | View All 44 Rows |
Immigrants in North Beach
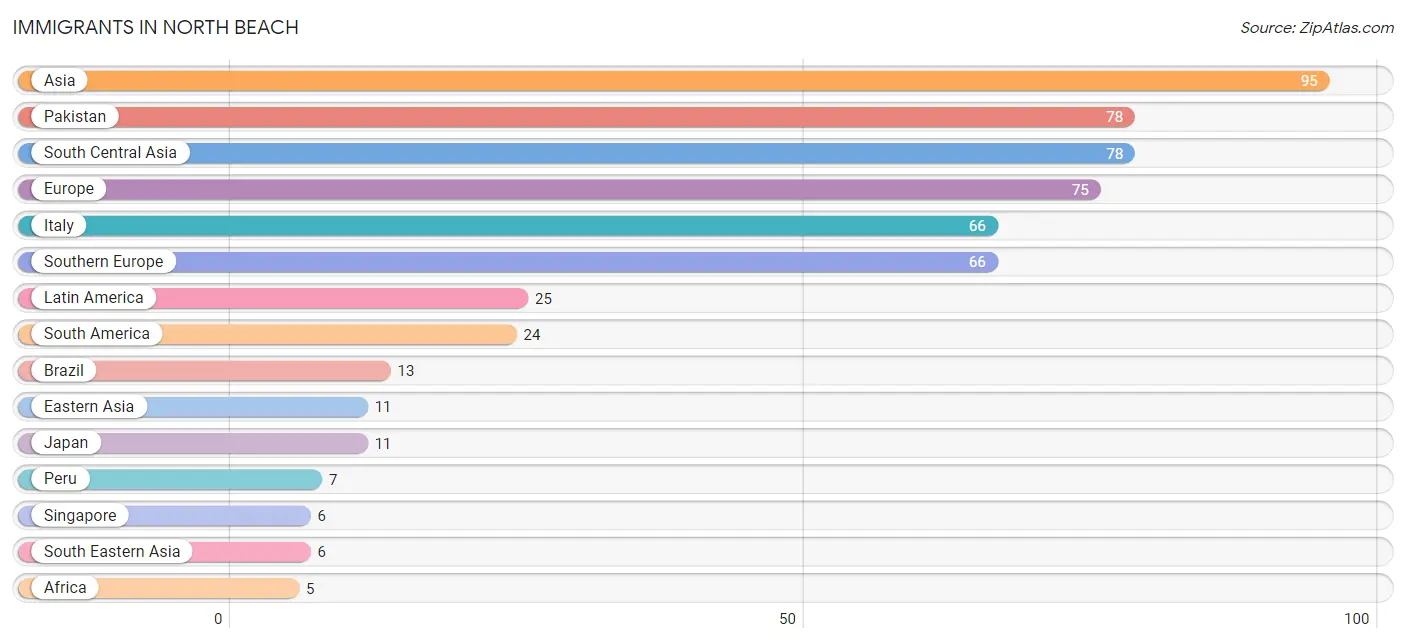
The most numerous immigrant groups reported in North Beach came from Asia (95 | 3.6%), Pakistan (78 | 2.9%), South Central Asia (78 | 2.9%), Europe (75 | 2.8%), and Italy (66 | 2.5%), together accounting for 14.8% of all North Beach residents.
| Immigration Origin | # Population | % Population |
| Africa | 5 | 0.2% |
| Asia | 95 | 3.6% |
| Belize | 1 | 0.0% |
| Brazil | 13 | 0.5% |
| Central America | 1 | 0.0% |
| Eastern Asia | 11 | 0.4% |
| Eastern Europe | 4 | 0.2% |
| Ecuador | 4 | 0.2% |
| Europe | 75 | 2.8% |
| Germany | 5 | 0.2% |
| Ghana | 5 | 0.2% |
| Italy | 66 | 2.5% |
| Japan | 11 | 0.4% |
| Latin America | 25 | 0.9% |
| Pakistan | 78 | 2.9% |
| Peru | 7 | 0.3% |
| Poland | 3 | 0.1% |
| Russia | 1 | 0.0% |
| Singapore | 6 | 0.2% |
| South America | 24 | 0.9% |
| South Central Asia | 78 | 2.9% |
| South Eastern Asia | 6 | 0.2% |
| Southern Europe | 66 | 2.5% |
| Western Africa | 5 | 0.2% |
| Western Europe | 5 | 0.2% | View All 25 Rows |
Sex and Age in North Beach
Sex and Age in North Beach
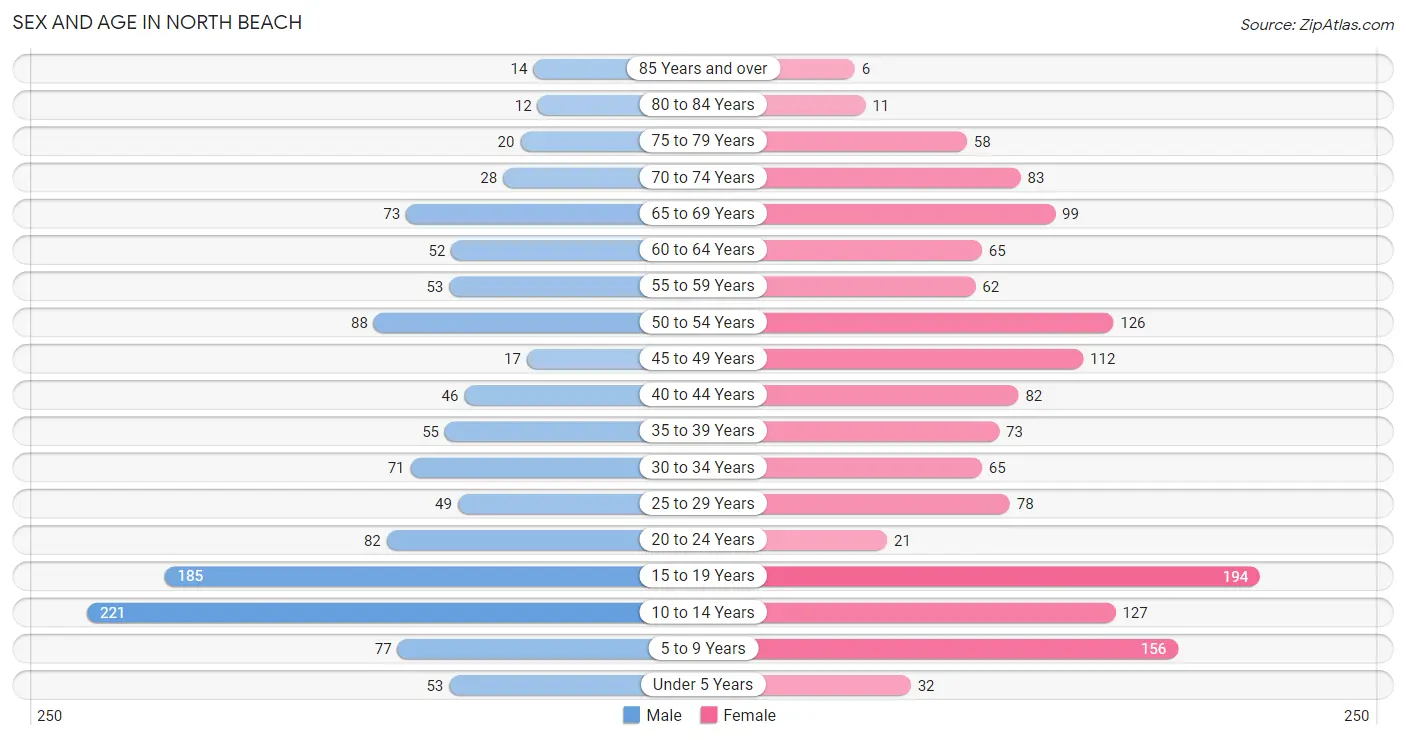
The most populous age groups in North Beach are 10 to 14 Years (221 | 18.5%) for men and 15 to 19 Years (194 | 13.4%) for women.
| Age Bracket | Male | Female |
| Under 5 Years | 53 (4.4%) | 32 (2.2%) |
| 5 to 9 Years | 77 (6.4%) | 156 (10.8%) |
| 10 to 14 Years | 221 (18.5%) | 127 (8.8%) |
| 15 to 19 Years | 185 (15.5%) | 194 (13.4%) |
| 20 to 24 Years | 82 (6.9%) | 21 (1.5%) |
| 25 to 29 Years | 49 (4.1%) | 78 (5.4%) |
| 30 to 34 Years | 71 (5.9%) | 65 (4.5%) |
| 35 to 39 Years | 55 (4.6%) | 73 (5.0%) |
| 40 to 44 Years | 46 (3.8%) | 82 (5.7%) |
| 45 to 49 Years | 17 (1.4%) | 112 (7.7%) |
| 50 to 54 Years | 88 (7.4%) | 126 (8.7%) |
| 55 to 59 Years | 53 (4.4%) | 62 (4.3%) |
| 60 to 64 Years | 52 (4.3%) | 65 (4.5%) |
| 65 to 69 Years | 73 (6.1%) | 99 (6.8%) |
| 70 to 74 Years | 28 (2.3%) | 83 (5.7%) |
| 75 to 79 Years | 20 (1.7%) | 58 (4.0%) |
| 80 to 84 Years | 12 (1.0%) | 11 (0.8%) |
| 85 Years and over | 14 (1.2%) | 6 (0.4%) |
| Total | 1,196 (100.0%) | 1,450 (100.0%) |
Families and Households in North Beach
Median Family Size in North Beach
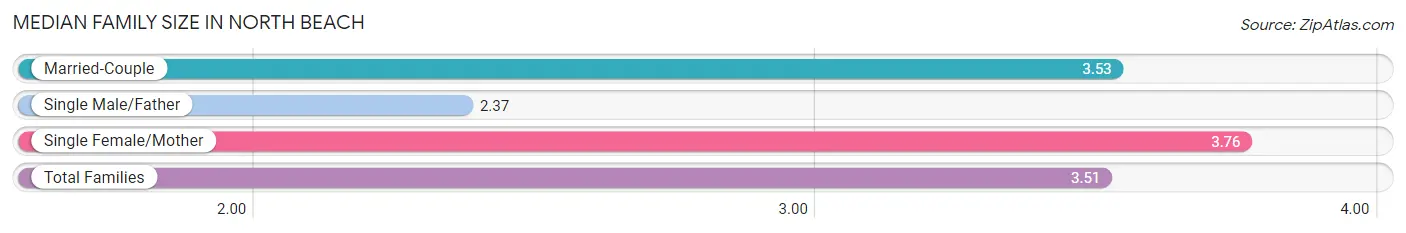
The median family size in North Beach is 3.51 persons per family, with single female/mother families (252 | 41.3%) accounting for the largest median family size of 3.76 persons per family. On the other hand, single male/father families (62 | 10.2%) represent the smallest median family size with 2.37 persons per family.
| Family Type | # Families | Family Size |
| Married-Couple | 296 (48.5%) | 3.53 |
| Single Male/Father | 62 (10.2%) | 2.37 |
| Single Female/Mother | 252 (41.3%) | 3.76 |
| Total Families | 610 (100.0%) | 3.51 |
Median Household Size in North Beach
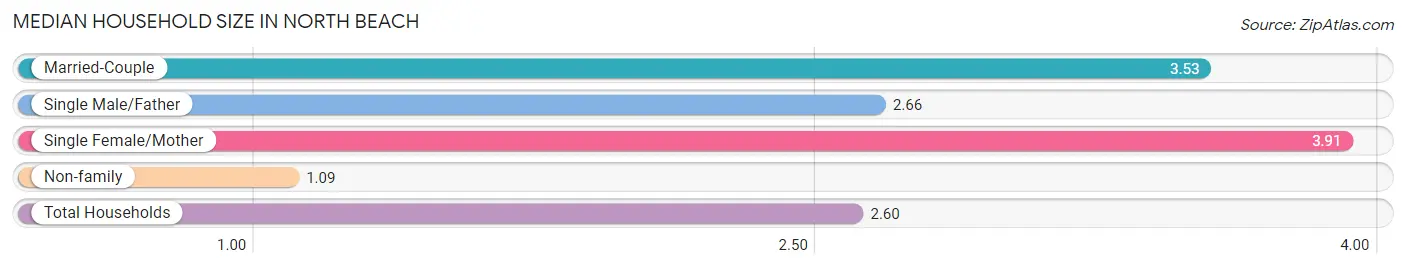
The median household size in North Beach is 2.60 persons per household, with single female/mother households (252 | 24.8%) accounting for the largest median household size of 3.91 persons per household. non-family households (407 | 40.0%) represent the smallest median household size with 1.09 persons per household.
| Household Type | # Households | Household Size |
| Married-Couple | 296 (29.1%) | 3.53 |
| Single Male/Father | 62 (6.1%) | 2.66 |
| Single Female/Mother | 252 (24.8%) | 3.91 |
| Non-family | 407 (40.0%) | 1.09 |
| Total Households | 1,017 (100.0%) | 2.60 |
Household Size by Marriage Status in North Beach
Out of a total of 1,017 households in North Beach, 610 (60.0%) are family households, while 407 (40.0%) are nonfamily households. The most numerous type of family households are 2-person households, comprising 279, and the most common type of nonfamily households are 1-person households, comprising 366.
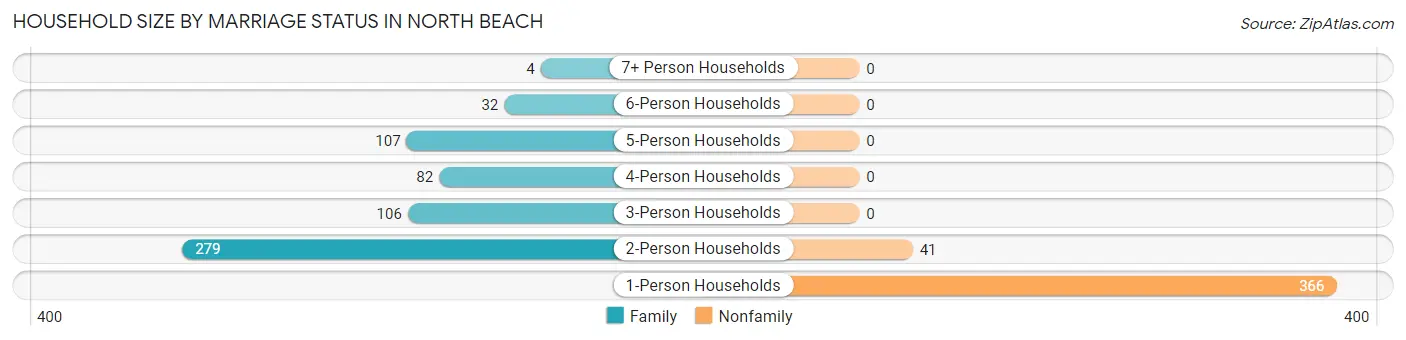
| Household Size | Family Households | Nonfamily Households |
| 1-Person Households | - | 366 (36.0%) |
| 2-Person Households | 279 (27.4%) | 41 (4.0%) |
| 3-Person Households | 106 (10.4%) | 0 (0.0%) |
| 4-Person Households | 82 (8.1%) | 0 (0.0%) |
| 5-Person Households | 107 (10.5%) | 0 (0.0%) |
| 6-Person Households | 32 (3.2%) | 0 (0.0%) |
| 7+ Person Households | 4 (0.4%) | 0 (0.0%) |
| Total | 610 (60.0%) | 407 (40.0%) |
Female Fertility in North Beach
Fertility by Age in North Beach
Average fertility rate in North Beach is 37.0 births per 1,000 women. Women in the age bracket of 20 to 34 years have the highest fertility rate with 146.0 births per 1,000 women. Women in the age bracket of 20 to 34 years acount for 100.0% of all women with births.
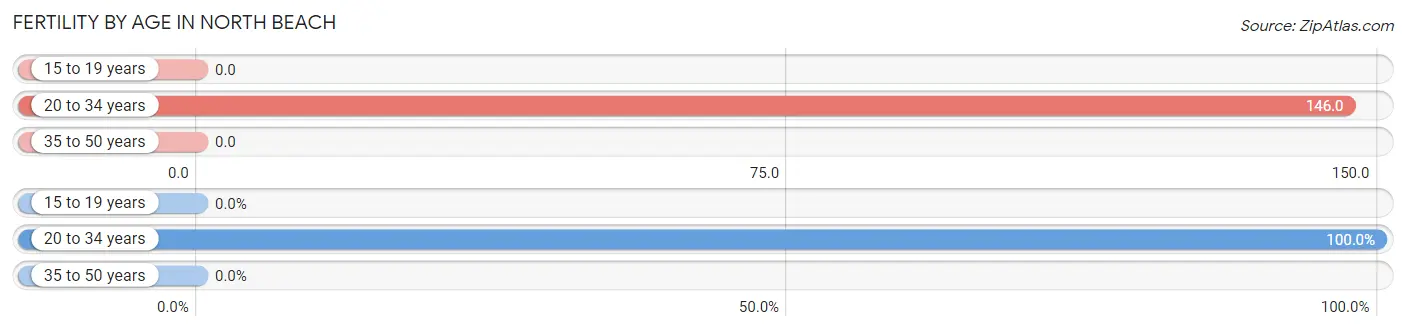
| Age Bracket | Women with Births | Births / 1,000 Women |
| 15 to 19 years | 0 (0.0%) | 0.0 |
| 20 to 34 years | 24 (100.0%) | 146.0 |
| 35 to 50 years | 0 (0.0%) | 0.0 |
| Total | 24 (100.0%) | 37.0 |
Fertility by Age by Marriage Status in North Beach
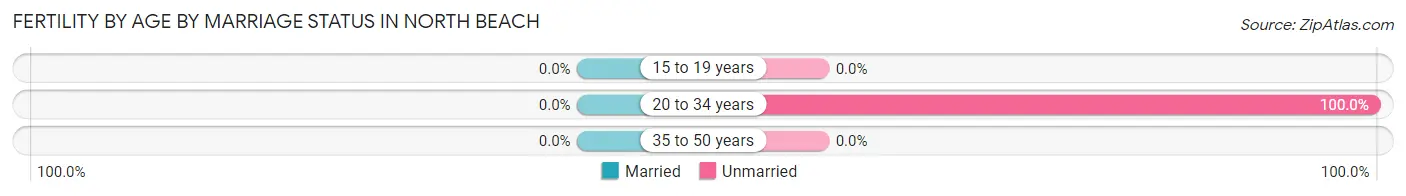
| Age Bracket | Married | Unmarried |
| 15 to 19 years | 0 (0.0%) | 0 (0.0%) |
| 20 to 34 years | 0 (0.0%) | 24 (100.0%) |
| 35 to 50 years | 0 (0.0%) | 0 (0.0%) |
| Total | 0 (0.0%) | 24 (100.0%) |
Fertility by Education in North Beach
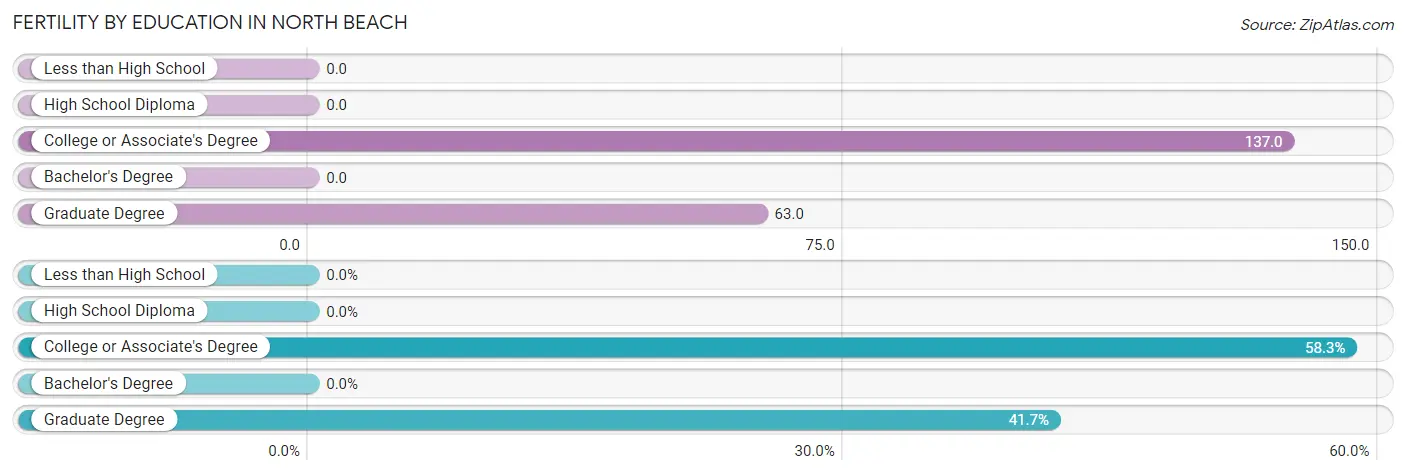
| Educational Attainment | Women with Births | Births / 1,000 Women |
| Less than High School | 0 (0.0%) | 0.0 |
| High School Diploma | 0 (0.0%) | 0.0 |
| College or Associate's Degree | 14 (58.3%) | 137.0 |
| Bachelor's Degree | 0 (0.0%) | 0.0 |
| Graduate Degree | 10 (41.7%) | 63.0 |
| Total | 24 (100.0%) | 37.0 |
Fertility by Education by Marriage Status in North Beach
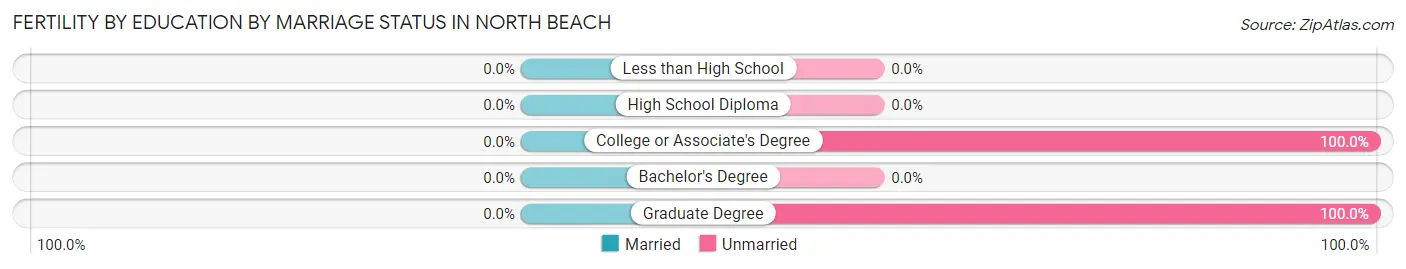
| Educational Attainment | Married | Unmarried |
| Less than High School | 0 (0.0%) | 0 (0.0%) |
| High School Diploma | 0 (0.0%) | 0 (0.0%) |
| College or Associate's Degree | 0 (0.0%) | 14 (100.0%) |
| Bachelor's Degree | 0 (0.0%) | 0 (0.0%) |
| Graduate Degree | 0 (0.0%) | 10 (100.0%) |
| Total | 0 (0.0%) | 24 (100.0%) |
Employment Characteristics in North Beach
Employment by Class of Employer in North Beach
Among the 1,020 employed individuals in North Beach, private company employees (657 | 64.4%), federal government employees (172 | 16.9%), and local government employees (121 | 11.9%) make up the most common classes of employment.
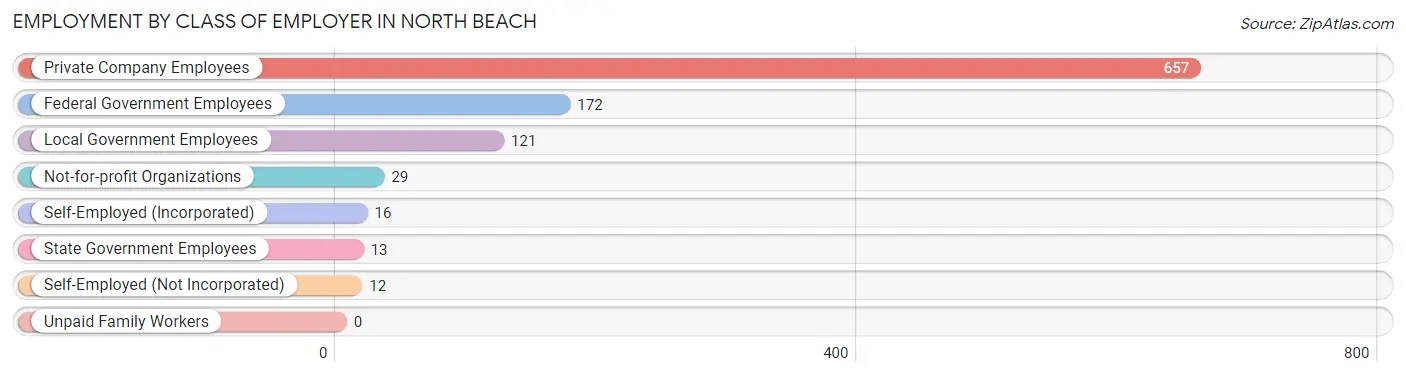
| Employer Class | # Employees | % Employees |
| Private Company Employees | 657 | 64.4% |
| Self-Employed (Incorporated) | 16 | 1.6% |
| Self-Employed (Not Incorporated) | 12 | 1.2% |
| Not-for-profit Organizations | 29 | 2.8% |
| Local Government Employees | 121 | 11.9% |
| State Government Employees | 13 | 1.3% |
| Federal Government Employees | 172 | 16.9% |
| Unpaid Family Workers | 0 | 0.0% |
| Total | 1,020 | 100.0% |
Employment Status by Age in North Beach
According to the labor force statistics for North Beach, out of the total population over 16 years of age (1,941), 69.3% or 1,345 individuals are in the labor force, with 16.9% or 227 of them unemployed. The age group with the highest labor force participation rate is 20 to 24 years, with 100.0% or 103 individuals in the labor force. Within the labor force, the 16 to 19 years age range has the highest percentage of unemployed individuals, with 58.1% or 157 of them being unemployed.
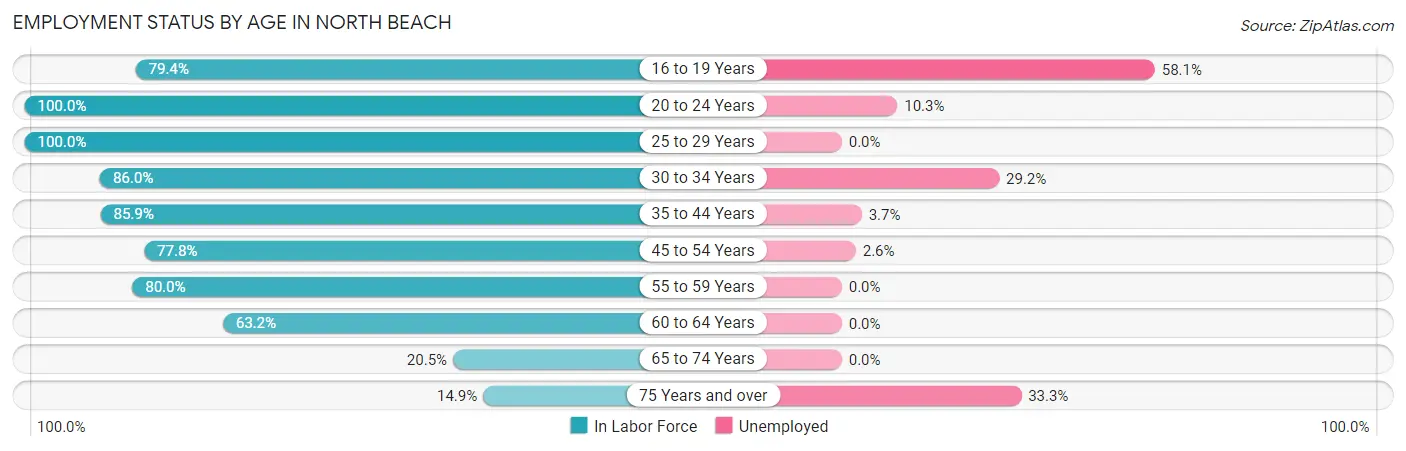
| Age Bracket | In Labor Force | Unemployed |
| 16 to 19 Years | 270 (79.4%) | 157 (58.1%) |
| 20 to 24 Years | 103 (100.0%) | 11 (10.3%) |
| 25 to 29 Years | 127 (100.0%) | 0 (0.0%) |
| 30 to 34 Years | 117 (86.0%) | 34 (29.2%) |
| 35 to 44 Years | 220 (85.9%) | 8 (3.7%) |
| 45 to 54 Years | 267 (77.8%) | 7 (2.6%) |
| 55 to 59 Years | 92 (80.0%) | 0 (0.0%) |
| 60 to 64 Years | 74 (63.2%) | 0 (0.0%) |
| 65 to 74 Years | 58 (20.5%) | 0 (0.0%) |
| 75 Years and over | 18 (14.9%) | 6 (33.3%) |
| Total | 1,345 (69.3%) | 227 (16.9%) |
Employment Status by Educational Attainment in North Beach
According to labor force statistics for North Beach, 82.0% of individuals (897) out of the total population between 25 and 64 years of age (1,094) are in the labor force, with 5.0% or 45 of them being unemployed. The group with the highest labor force participation rate are those with the educational attainment of bachelor's degree or higher, with 88.0% or 471 individuals in the labor force. Within the labor force, individuals with high school diploma education have the highest percentage of unemployment, with 22.4% or 38 of them being unemployed.
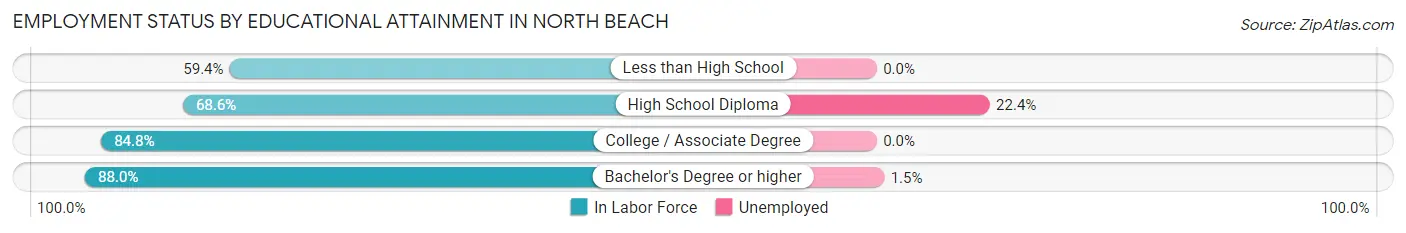
| Educational Attainment | In Labor Force | Unemployed |
| Less than High School | 19 (59.4%) | 0 (0.0%) |
| High School Diploma | 168 (68.6%) | 55 (22.4%) |
| College / Associate Degree | 239 (84.8%) | 0 (0.0%) |
| Bachelor's Degree or higher | 471 (88.0%) | 8 (1.5%) |
| Total | 897 (82.0%) | 55 (5.0%) |
Employment Occupations by Sex in North Beach
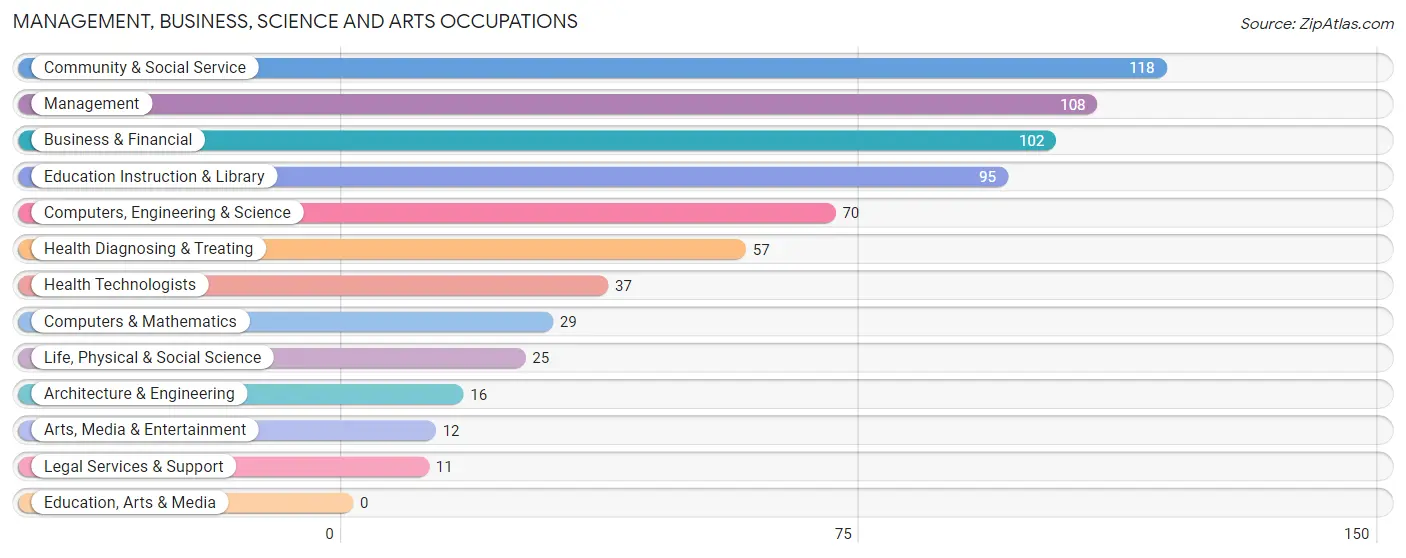
Management, Business, Science and Arts Occupations
The most common Management, Business, Science and Arts occupations in North Beach are Community & Social Service (118 | 11.3%), Management (108 | 10.3%), Business & Financial (102 | 9.7%), Education Instruction & Library (95 | 9.1%), and Computers, Engineering & Science (70 | 6.7%).
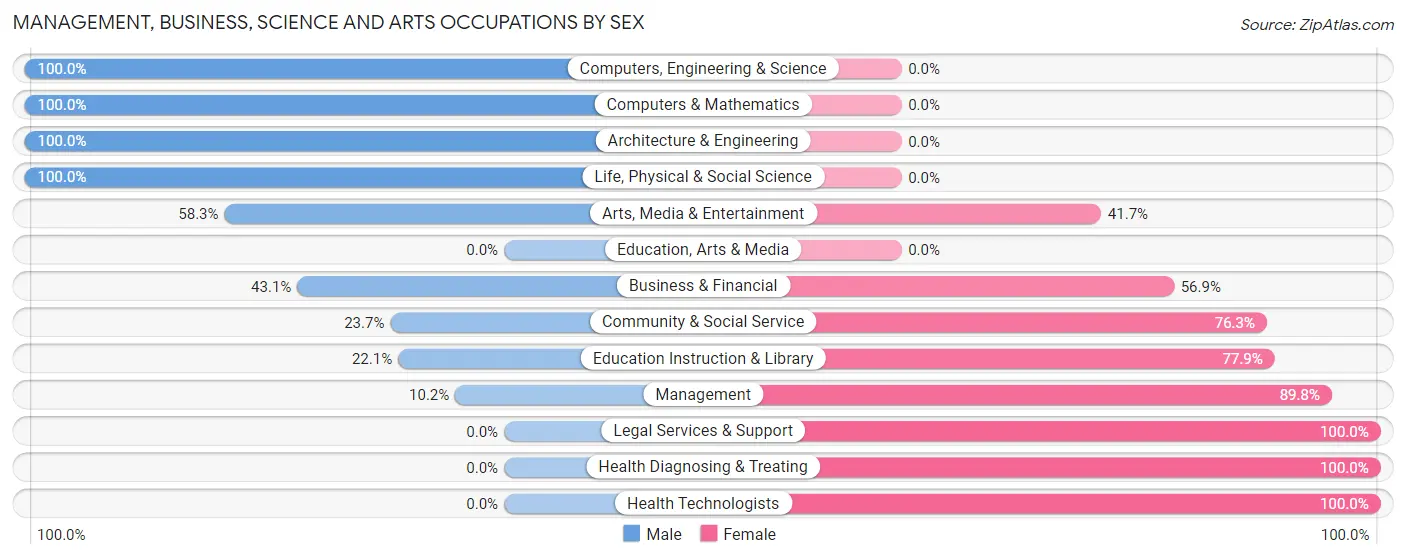
Management, Business, Science and Arts Occupations by Sex
Within the Management, Business, Science and Arts occupations in North Beach, the most male-oriented occupations are Computers, Engineering & Science (100.0%), Computers & Mathematics (100.0%), and Architecture & Engineering (100.0%), while the most female-oriented occupations are Legal Services & Support (100.0%), Health Diagnosing & Treating (100.0%), and Health Technologists (100.0%).
| Occupation | Male | Female |
| Management | 11 (10.2%) | 97 (89.8%) |
| Business & Financial | 44 (43.1%) | 58 (56.9%) |
| Computers, Engineering & Science | 70 (100.0%) | 0 (0.0%) |
| Computers & Mathematics | 29 (100.0%) | 0 (0.0%) |
| Architecture & Engineering | 16 (100.0%) | 0 (0.0%) |
| Life, Physical & Social Science | 25 (100.0%) | 0 (0.0%) |
| Community & Social Service | 28 (23.7%) | 90 (76.3%) |
| Education, Arts & Media | 0 (0.0%) | 0 (0.0%) |
| Legal Services & Support | 0 (0.0%) | 11 (100.0%) |
| Education Instruction & Library | 21 (22.1%) | 74 (77.9%) |
| Arts, Media & Entertainment | 7 (58.3%) | 5 (41.7%) |
| Health Diagnosing & Treating | 0 (0.0%) | 57 (100.0%) |
| Health Technologists | 0 (0.0%) | 37 (100.0%) |
| Total (Category) | 153 (33.6%) | 302 (66.4%) |
| Total (Overall) | 507 (48.3%) | 542 (51.7%) |
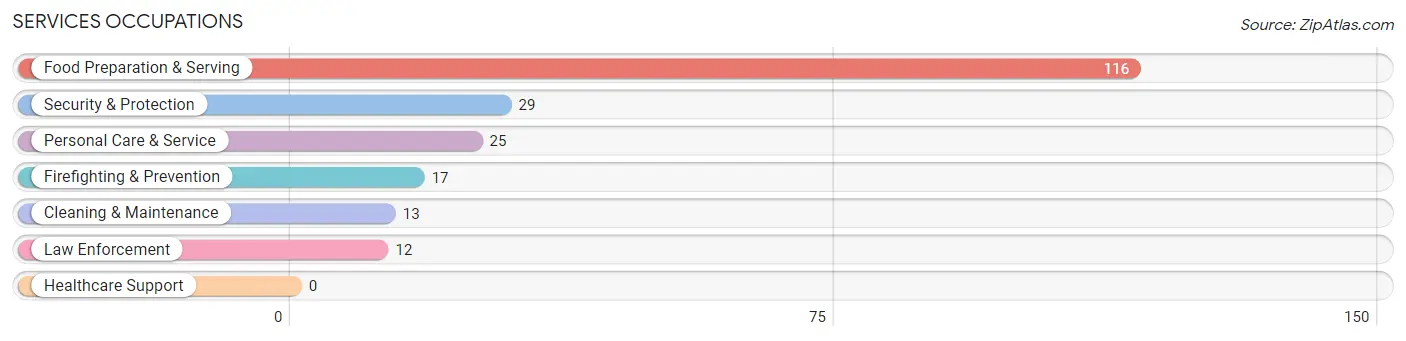
Services Occupations
The most common Services occupations in North Beach are Food Preparation & Serving (116 | 11.1%), Security & Protection (29 | 2.8%), Personal Care & Service (25 | 2.4%), Firefighting & Prevention (17 | 1.6%), and Cleaning & Maintenance (13 | 1.2%).
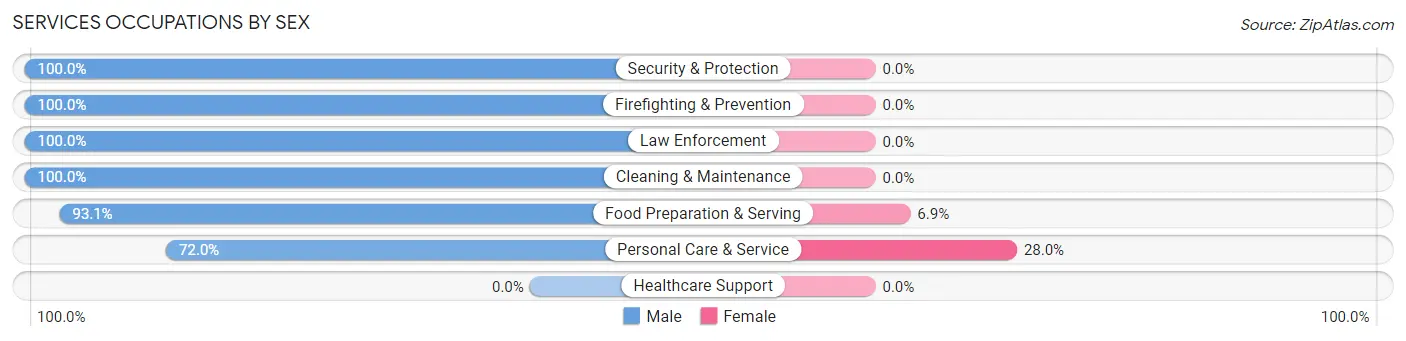
Services Occupations by Sex
Within the Services occupations in North Beach, the most male-oriented occupations are Security & Protection (100.0%), Firefighting & Prevention (100.0%), and Law Enforcement (100.0%), while the most female-oriented occupations are Personal Care & Service (28.0%), and Food Preparation & Serving (6.9%).
| Occupation | Male | Female |
| Healthcare Support | 0 (0.0%) | 0 (0.0%) |
| Security & Protection | 29 (100.0%) | 0 (0.0%) |
| Firefighting & Prevention | 17 (100.0%) | 0 (0.0%) |
| Law Enforcement | 12 (100.0%) | 0 (0.0%) |
| Food Preparation & Serving | 108 (93.1%) | 8 (6.9%) |
| Cleaning & Maintenance | 13 (100.0%) | 0 (0.0%) |
| Personal Care & Service | 18 (72.0%) | 7 (28.0%) |
| Total (Category) | 168 (91.8%) | 15 (8.2%) |
| Total (Overall) | 507 (48.3%) | 542 (51.7%) |
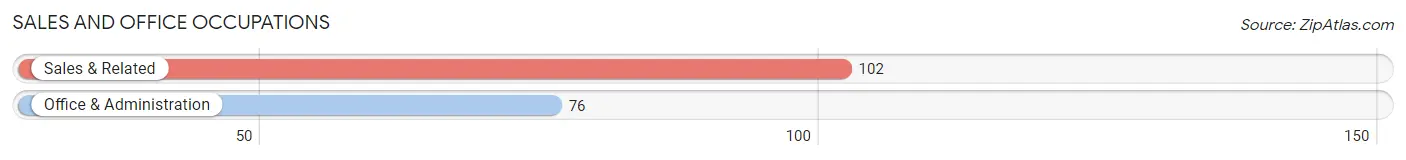
Sales and Office Occupations
The most common Sales and Office occupations in North Beach are Sales & Related (102 | 9.7%), and Office & Administration (76 | 7.2%).
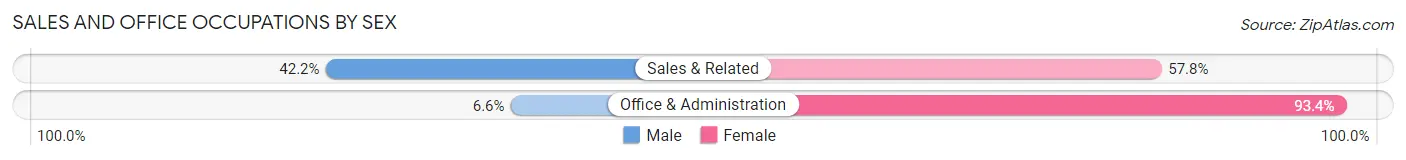
Sales and Office Occupations by Sex
| Occupation | Male | Female |
| Sales & Related | 43 (42.2%) | 59 (57.8%) |
| Office & Administration | 5 (6.6%) | 71 (93.4%) |
| Total (Category) | 48 (27.0%) | 130 (73.0%) |
| Total (Overall) | 507 (48.3%) | 542 (51.7%) |
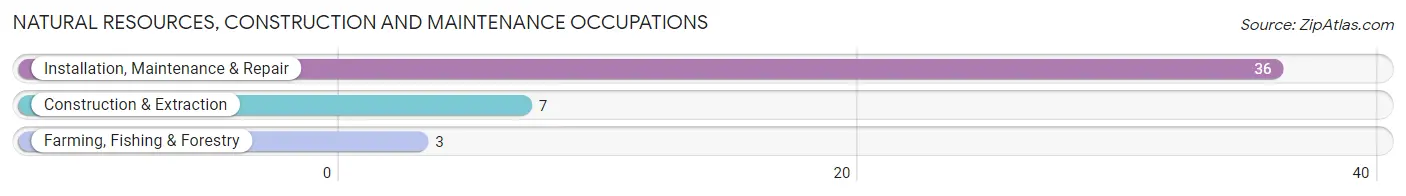
Natural Resources, Construction and Maintenance Occupations
The most common Natural Resources, Construction and Maintenance occupations in North Beach are Installation, Maintenance & Repair (36 | 3.4%), Construction & Extraction (7 | 0.7%), and Farming, Fishing & Forestry (3 | 0.3%).
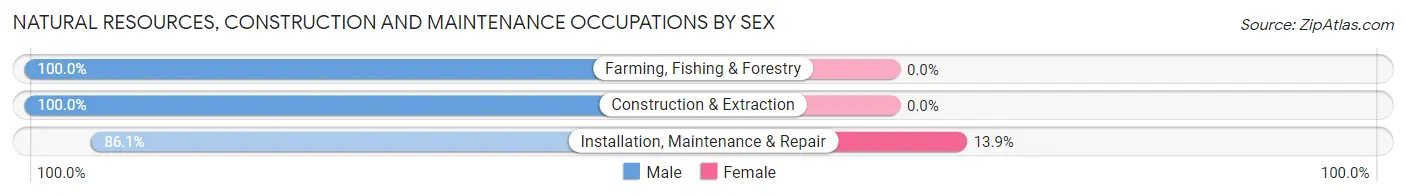
Natural Resources, Construction and Maintenance Occupations by Sex
| Occupation | Male | Female |
| Farming, Fishing & Forestry | 3 (100.0%) | 0 (0.0%) |
| Construction & Extraction | 7 (100.0%) | 0 (0.0%) |
| Installation, Maintenance & Repair | 31 (86.1%) | 5 (13.9%) |
| Total (Category) | 41 (89.1%) | 5 (10.9%) |
| Total (Overall) | 507 (48.3%) | 542 (51.7%) |
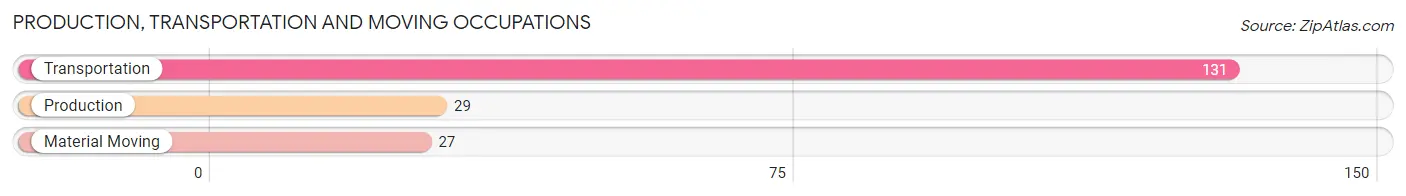
Production, Transportation and Moving Occupations
The most common Production, Transportation and Moving occupations in North Beach are Transportation (131 | 12.5%), Production (29 | 2.8%), and Material Moving (27 | 2.6%).
Production, Transportation and Moving Occupations by Sex
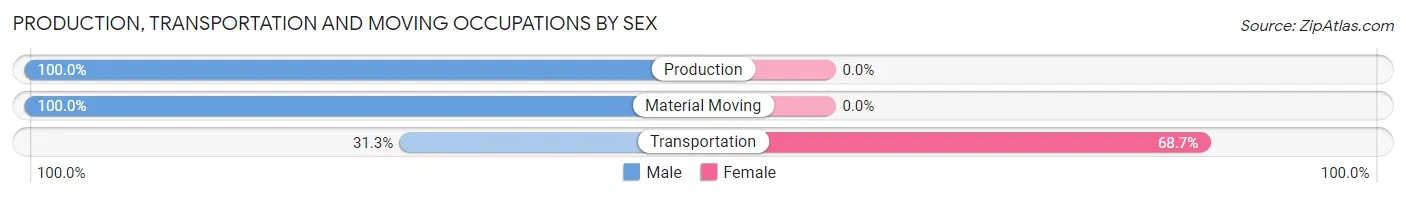
| Occupation | Male | Female |
| Production | 29 (100.0%) | 0 (0.0%) |
| Transportation | 41 (31.3%) | 90 (68.7%) |
| Material Moving | 27 (100.0%) | 0 (0.0%) |
| Total (Category) | 97 (51.9%) | 90 (48.1%) |
| Total (Overall) | 507 (48.3%) | 542 (51.7%) |
Employment Industries by Sex in North Beach
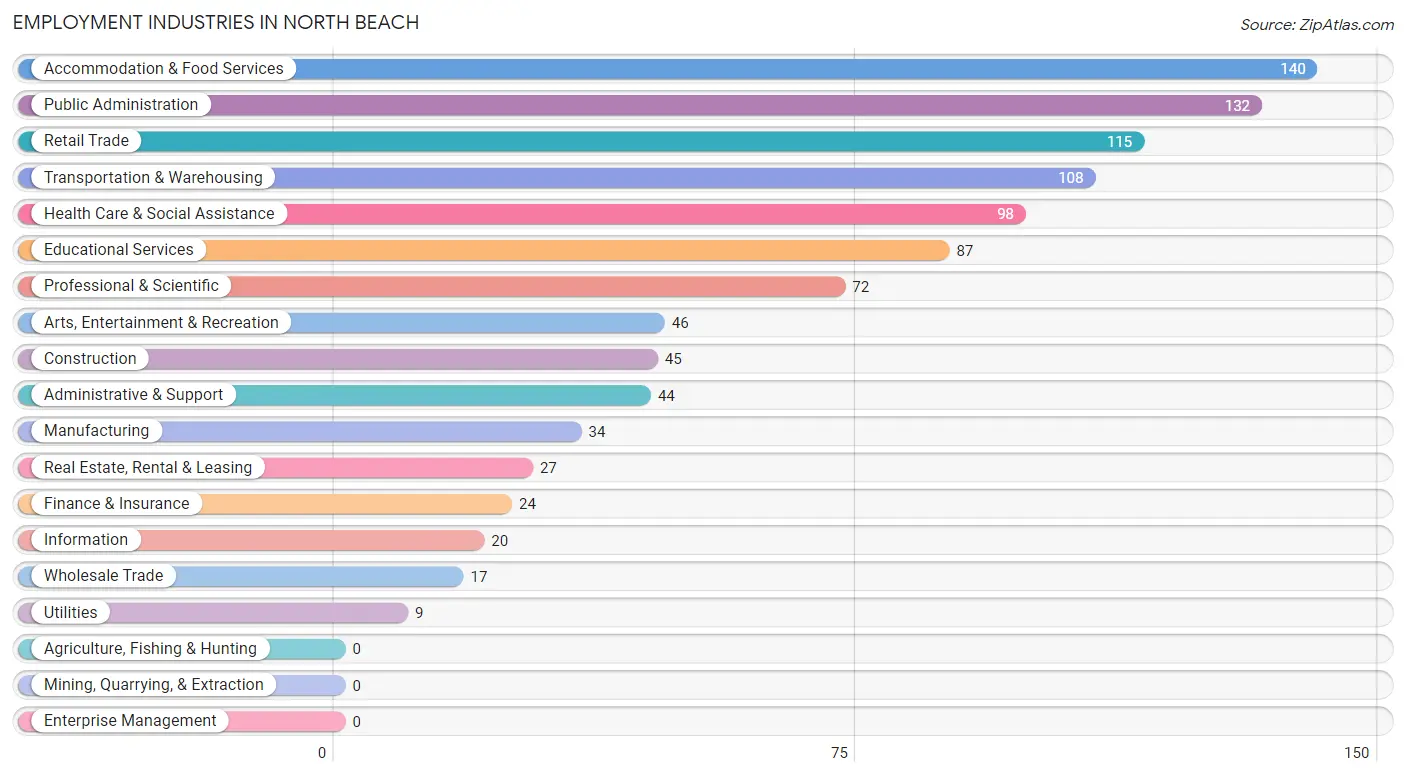
Employment Industries in North Beach
The major employment industries in North Beach include Accommodation & Food Services (140 | 13.4%), Public Administration (132 | 12.6%), Retail Trade (115 | 11.0%), Transportation & Warehousing (108 | 10.3%), and Health Care & Social Assistance (98 | 9.3%).
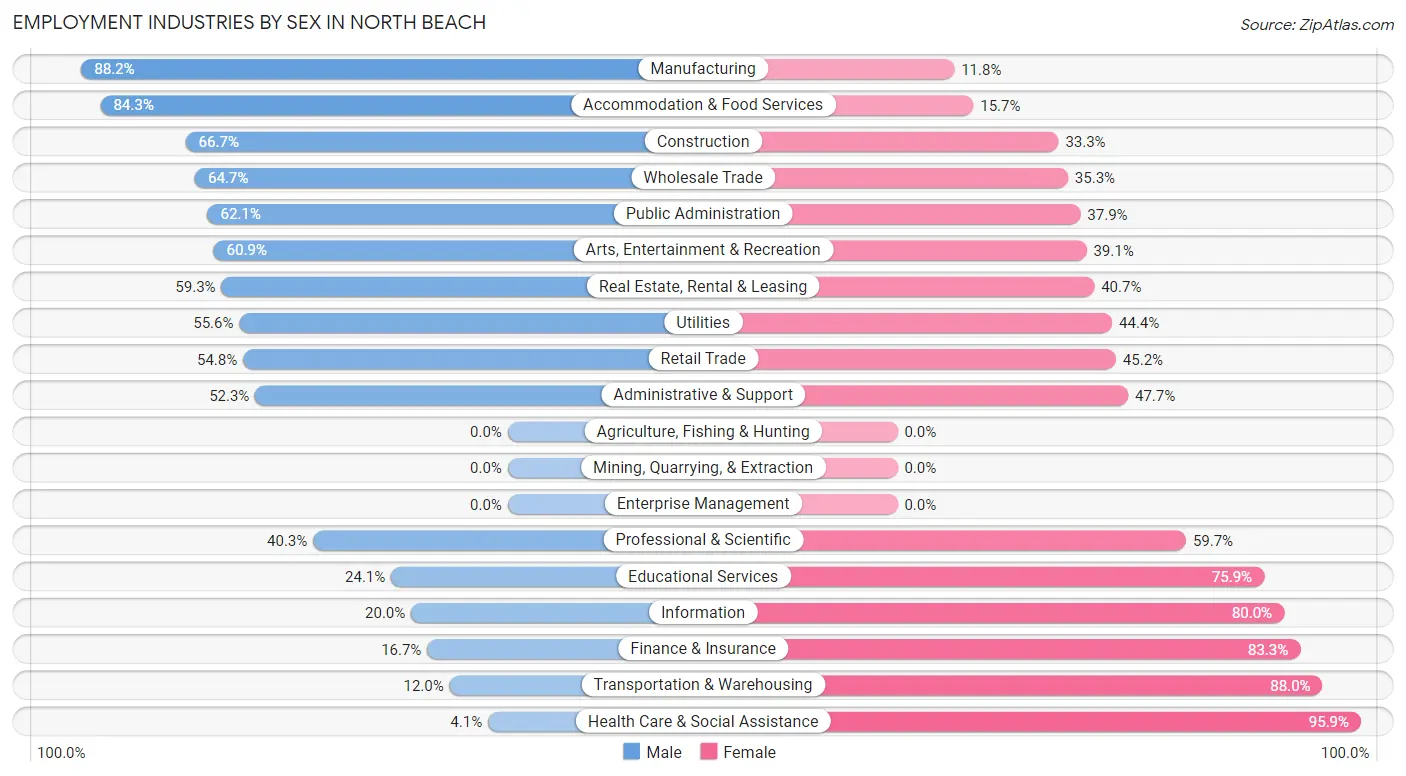
Employment Industries by Sex in North Beach
The North Beach industries that see more men than women are Manufacturing (88.2%), Accommodation & Food Services (84.3%), and Construction (66.7%), whereas the industries that tend to have a higher number of women are Health Care & Social Assistance (95.9%), Transportation & Warehousing (88.0%), and Finance & Insurance (83.3%).
| Industry | Male | Female |
| Agriculture, Fishing & Hunting | 0 (0.0%) | 0 (0.0%) |
| Mining, Quarrying, & Extraction | 0 (0.0%) | 0 (0.0%) |
| Construction | 30 (66.7%) | 15 (33.3%) |
| Manufacturing | 30 (88.2%) | 4 (11.8%) |
| Wholesale Trade | 11 (64.7%) | 6 (35.3%) |
| Retail Trade | 63 (54.8%) | 52 (45.2%) |
| Transportation & Warehousing | 13 (12.0%) | 95 (88.0%) |
| Utilities | 5 (55.6%) | 4 (44.4%) |
| Information | 4 (20.0%) | 16 (80.0%) |
| Finance & Insurance | 4 (16.7%) | 20 (83.3%) |
| Real Estate, Rental & Leasing | 16 (59.3%) | 11 (40.7%) |
| Professional & Scientific | 29 (40.3%) | 43 (59.7%) |
| Enterprise Management | 0 (0.0%) | 0 (0.0%) |
| Administrative & Support | 23 (52.3%) | 21 (47.7%) |
| Educational Services | 21 (24.1%) | 66 (75.9%) |
| Health Care & Social Assistance | 4 (4.1%) | 94 (95.9%) |
| Arts, Entertainment & Recreation | 28 (60.9%) | 18 (39.1%) |
| Accommodation & Food Services | 118 (84.3%) | 22 (15.7%) |
| Public Administration | 82 (62.1%) | 50 (37.9%) |
| Total | 507 (48.3%) | 542 (51.7%) |
Education in North Beach
School Enrollment in North Beach
The most common levels of schooling among the 1,195 students in North Beach are high school (386 | 32.3%), middle school (318 | 26.6%), and college / undergraduate (124 | 10.4%).

| School Level | # Students | % Students |
| Nursery / Preschool | 104 | 8.7% |
| Kindergarten | 29 | 2.4% |
| Elementary School | 120 | 10.0% |
| Middle School | 318 | 26.6% |
| High School | 386 | 32.3% |
| College / Undergraduate | 124 | 10.4% |
| Graduate / Professional | 114 | 9.5% |
| Total | 1,195 | 100.0% |
School Enrollment by Age by Funding Source in North Beach
Out of a total of 1,195 students who are enrolled in schools in North Beach, 98 (8.2%) attend a private institution, while the remaining 1,097 (91.8%) are enrolled in public schools. The age group of 25 to 34 year olds has the highest likelihood of being enrolled in private schools, with 22 (25.3% in the age bracket) enrolled. Conversely, the age group of 3 to 4 year olds has the lowest likelihood of being enrolled in a private school, with 15 (100.0% in the age bracket) attending a public institution.
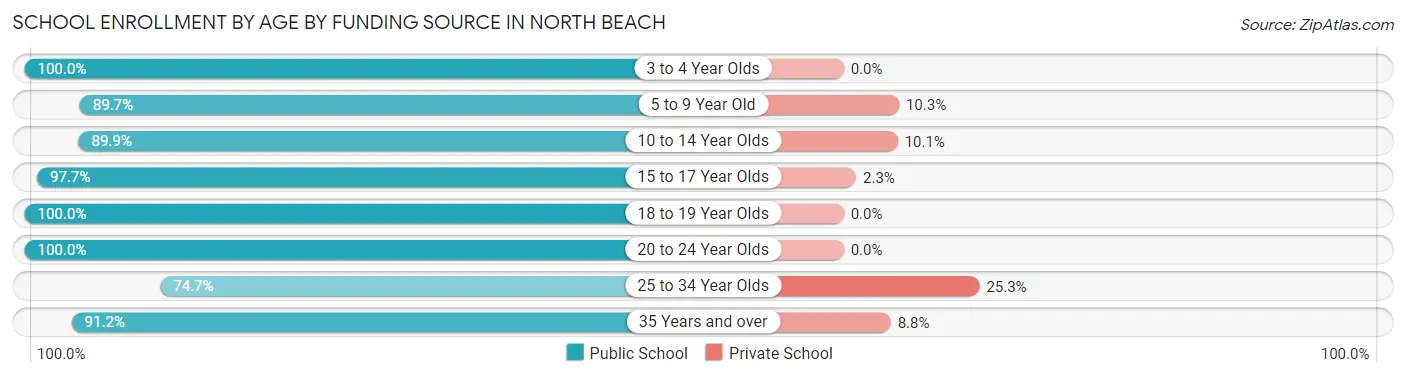
| Age Bracket | Public School | Private School |
| 3 to 4 Year Olds | 15 (100.0%) | 0 (0.0%) |
| 5 to 9 Year Old | 209 (89.7%) | 24 (10.3%) |
| 10 to 14 Year Olds | 313 (89.9%) | 35 (10.1%) |
| 15 to 17 Year Olds | 295 (97.7%) | 7 (2.3%) |
| 18 to 19 Year Olds | 64 (100.0%) | 0 (0.0%) |
| 20 to 24 Year Olds | 32 (100.0%) | 0 (0.0%) |
| 25 to 34 Year Olds | 65 (74.7%) | 22 (25.3%) |
| 35 Years and over | 104 (91.2%) | 10 (8.8%) |
| Total | 1,097 (91.8%) | 98 (8.2%) |
Educational Attainment by Field of Study in North Beach
Arts & humanities (108 | 16.3%), education (79 | 11.9%), social sciences (77 | 11.6%), liberal arts & history (74 | 11.2%), and business (70 | 10.6%) are the most common fields of study among 662 individuals in North Beach who have obtained a bachelor's degree or higher.
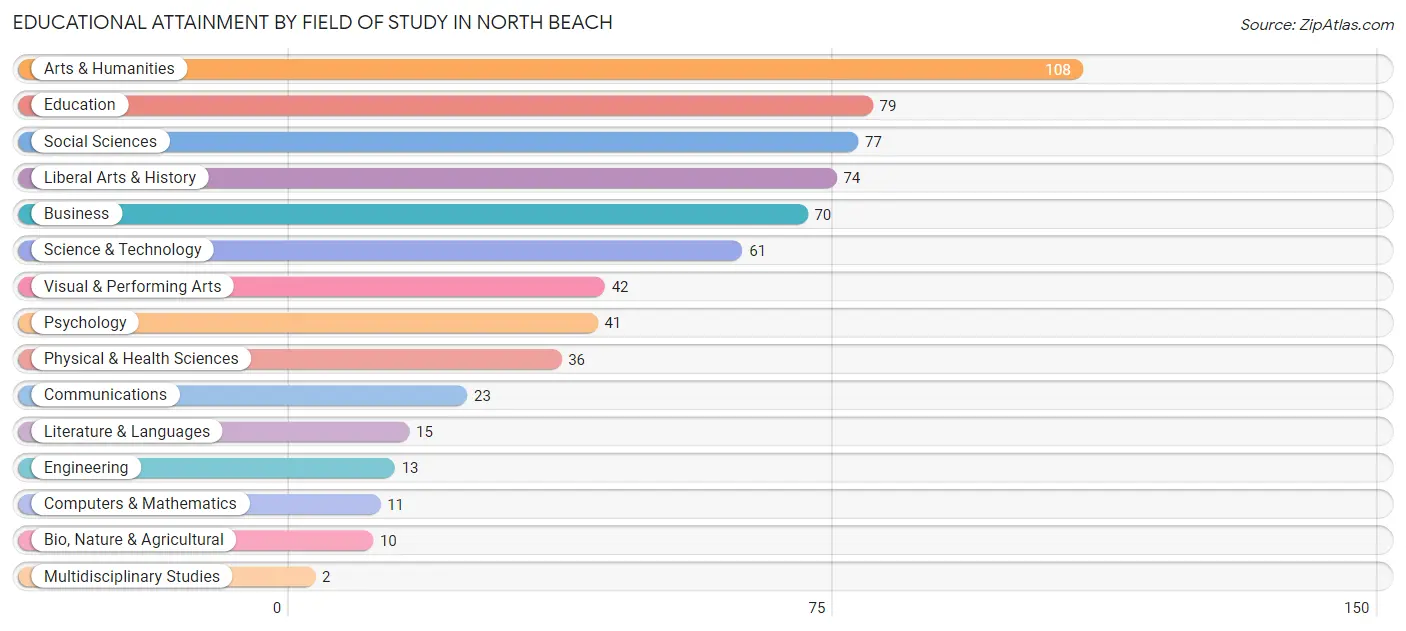
| Field of Study | # Graduates | % Graduates |
| Computers & Mathematics | 11 | 1.7% |
| Bio, Nature & Agricultural | 10 | 1.5% |
| Physical & Health Sciences | 36 | 5.4% |
| Psychology | 41 | 6.2% |
| Social Sciences | 77 | 11.6% |
| Engineering | 13 | 2.0% |
| Multidisciplinary Studies | 2 | 0.3% |
| Science & Technology | 61 | 9.2% |
| Business | 70 | 10.6% |
| Education | 79 | 11.9% |
| Literature & Languages | 15 | 2.3% |
| Liberal Arts & History | 74 | 11.2% |
| Visual & Performing Arts | 42 | 6.3% |
| Communications | 23 | 3.5% |
| Arts & Humanities | 108 | 16.3% |
| Total | 662 | 100.0% |
Transportation & Commute in North Beach
Vehicle Availability by Sex in North Beach
The most prevalent vehicle ownership categories in North Beach are males with 2 vehicles (300, accounting for 55.9%) and females with 2 vehicles (183, making up 62.2%).
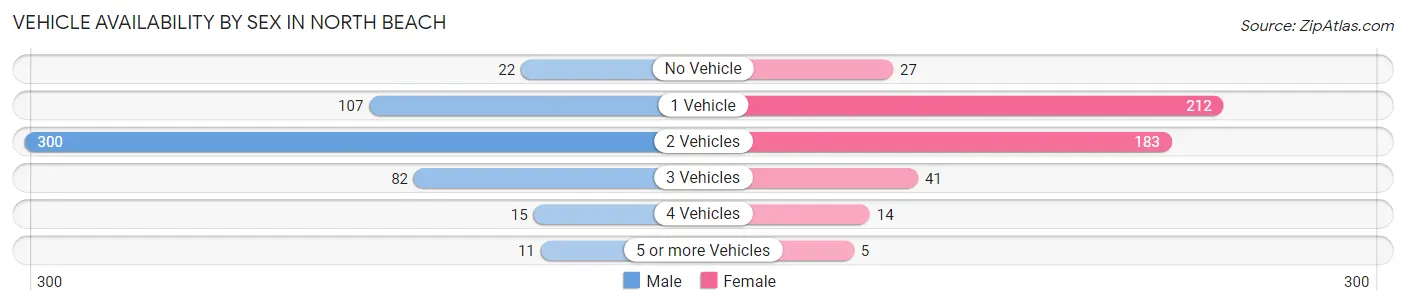
| Vehicles Available | Male | Female |
| No Vehicle | 22 (4.1%) | 27 (5.6%) |
| 1 Vehicle | 107 (19.9%) | 212 (44.0%) |
| 2 Vehicles | 300 (55.9%) | 183 (38.0%) |
| 3 Vehicles | 82 (15.3%) | 41 (8.5%) |
| 4 Vehicles | 15 (2.8%) | 14 (2.9%) |
| 5 or more Vehicles | 11 (2.1%) | 5 (1.0%) |
| Total | 537 (100.0%) | 482 (100.0%) |
Commute Time in North Beach
The most frequently occuring commute durations in North Beach are 45 to 59 minutes (186 commuters, 19.7%), 60 to 89 minutes (180 commuters, 19.0%), and 35 to 39 minutes (103 commuters, 10.9%).
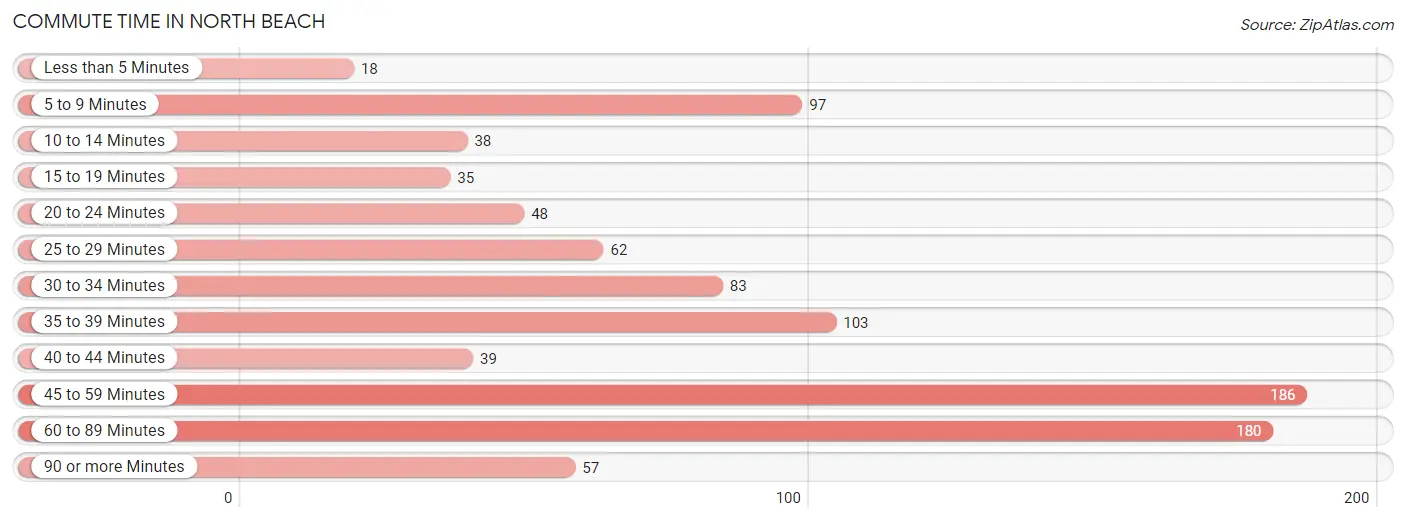
| Commute Time | # Commuters | % Commuters |
| Less than 5 Minutes | 18 | 1.9% |
| 5 to 9 Minutes | 97 | 10.2% |
| 10 to 14 Minutes | 38 | 4.0% |
| 15 to 19 Minutes | 35 | 3.7% |
| 20 to 24 Minutes | 48 | 5.1% |
| 25 to 29 Minutes | 62 | 6.6% |
| 30 to 34 Minutes | 83 | 8.8% |
| 35 to 39 Minutes | 103 | 10.9% |
| 40 to 44 Minutes | 39 | 4.1% |
| 45 to 59 Minutes | 186 | 19.7% |
| 60 to 89 Minutes | 180 | 19.0% |
| 90 or more Minutes | 57 | 6.0% |
Commute Time by Sex in North Beach
The most common commute times in North Beach are 60 to 89 minutes (133 commuters, 25.3%) for males and 45 to 59 minutes (73 commuters, 17.4%) for females.
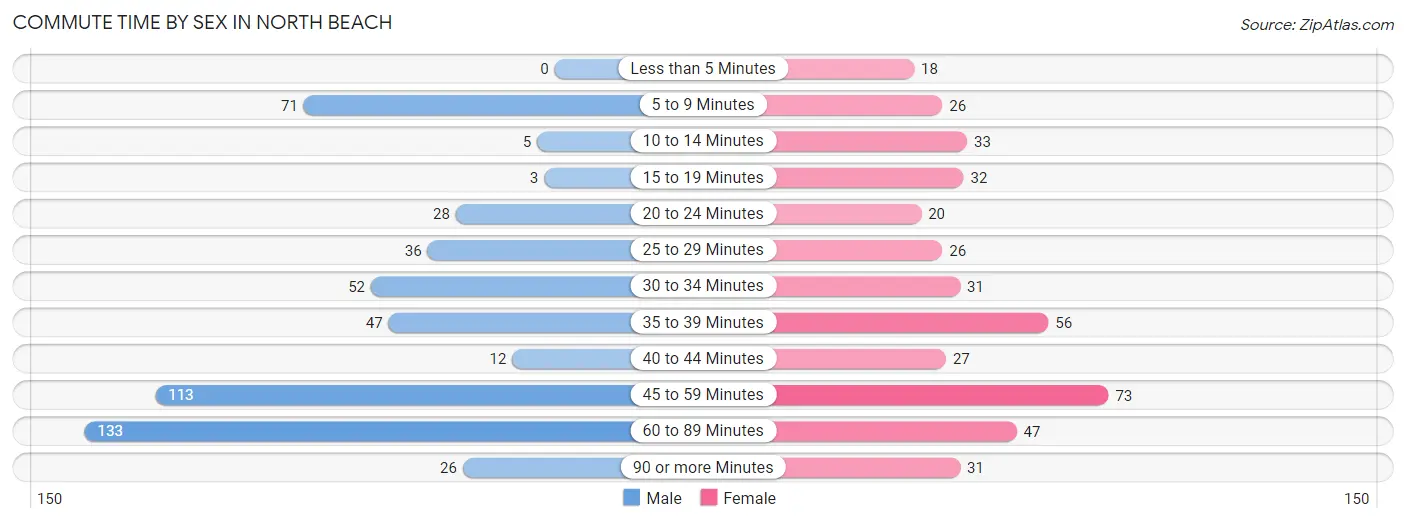
| Commute Time | Male | Female |
| Less than 5 Minutes | 0 (0.0%) | 18 (4.3%) |
| 5 to 9 Minutes | 71 (13.5%) | 26 (6.2%) |
| 10 to 14 Minutes | 5 (0.9%) | 33 (7.9%) |
| 15 to 19 Minutes | 3 (0.6%) | 32 (7.6%) |
| 20 to 24 Minutes | 28 (5.3%) | 20 (4.8%) |
| 25 to 29 Minutes | 36 (6.8%) | 26 (6.2%) |
| 30 to 34 Minutes | 52 (9.9%) | 31 (7.4%) |
| 35 to 39 Minutes | 47 (8.9%) | 56 (13.3%) |
| 40 to 44 Minutes | 12 (2.3%) | 27 (6.4%) |
| 45 to 59 Minutes | 113 (21.5%) | 73 (17.4%) |
| 60 to 89 Minutes | 133 (25.3%) | 47 (11.2%) |
| 90 or more Minutes | 26 (4.9%) | 31 (7.4%) |
Time of Departure to Work by Sex in North Beach
The most frequent times of departure to work in North Beach are 5:30 AM to 5:59 AM (91, 17.3%) for males and 7:00 AM to 7:29 AM (79, 18.8%) for females.
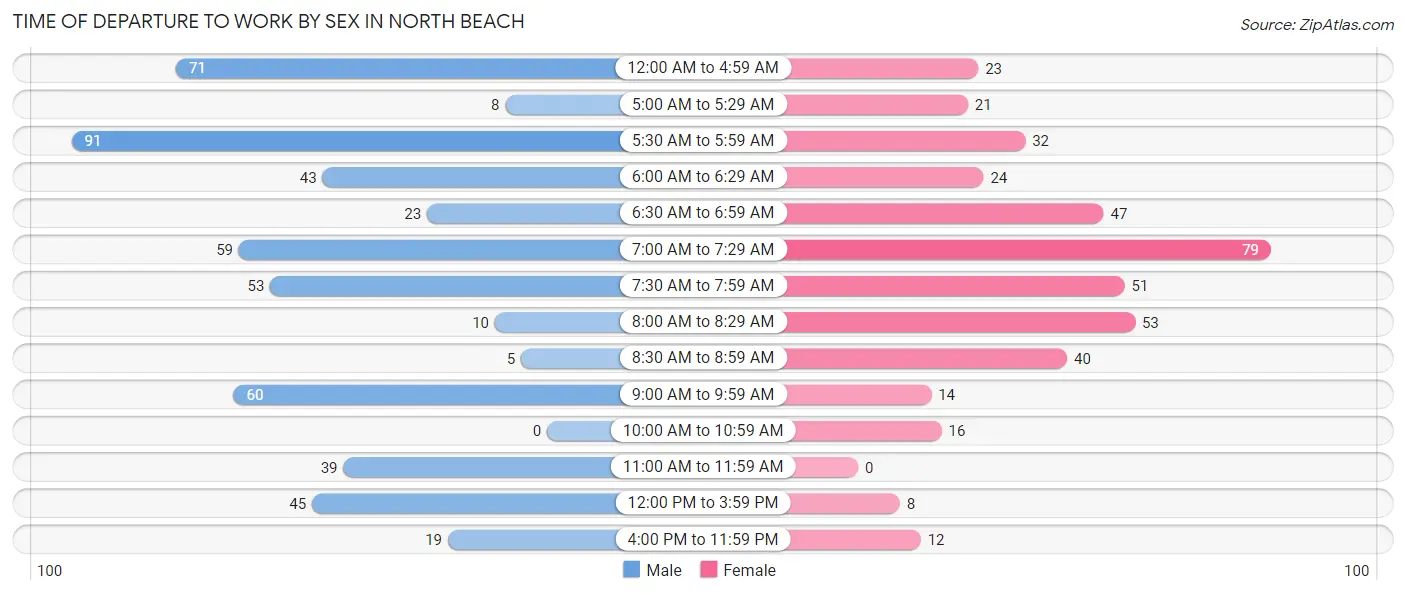
| Time of Departure | Male | Female |
| 12:00 AM to 4:59 AM | 71 (13.5%) | 23 (5.5%) |
| 5:00 AM to 5:29 AM | 8 (1.5%) | 21 (5.0%) |
| 5:30 AM to 5:59 AM | 91 (17.3%) | 32 (7.6%) |
| 6:00 AM to 6:29 AM | 43 (8.2%) | 24 (5.7%) |
| 6:30 AM to 6:59 AM | 23 (4.4%) | 47 (11.2%) |
| 7:00 AM to 7:29 AM | 59 (11.2%) | 79 (18.8%) |
| 7:30 AM to 7:59 AM | 53 (10.1%) | 51 (12.1%) |
| 8:00 AM to 8:29 AM | 10 (1.9%) | 53 (12.6%) |
| 8:30 AM to 8:59 AM | 5 (0.9%) | 40 (9.5%) |
| 9:00 AM to 9:59 AM | 60 (11.4%) | 14 (3.3%) |
| 10:00 AM to 10:59 AM | 0 (0.0%) | 16 (3.8%) |
| 11:00 AM to 11:59 AM | 39 (7.4%) | 0 (0.0%) |
| 12:00 PM to 3:59 PM | 45 (8.6%) | 8 (1.9%) |
| 4:00 PM to 11:59 PM | 19 (3.6%) | 12 (2.9%) |
| Total | 526 (100.0%) | 420 (100.0%) |
Housing Occupancy in North Beach
Occupancy by Ownership in North Beach
Of the total 1,017 dwellings in North Beach, owner-occupied units account for 547 (53.8%), while renter-occupied units make up 470 (46.2%).
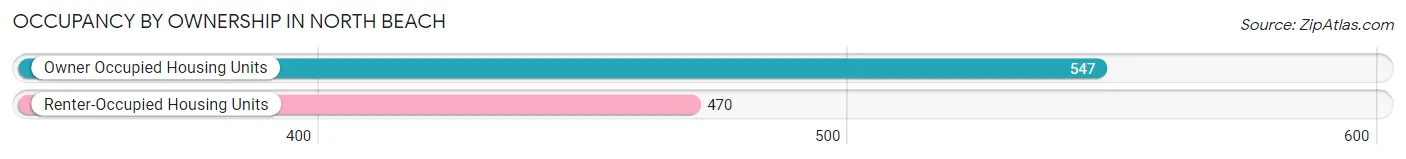
| Occupancy | # Housing Units | % Housing Units |
| Owner Occupied Housing Units | 547 | 53.8% |
| Renter-Occupied Housing Units | 470 | 46.2% |
| Total Occupied Housing Units | 1,017 | 100.0% |
Occupancy by Household Size in North Beach
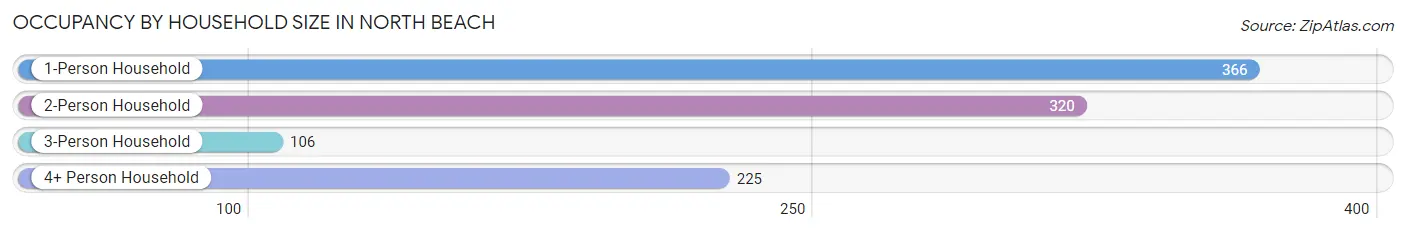
| Household Size | # Housing Units | % Housing Units |
| 1-Person Household | 366 | 36.0% |
| 2-Person Household | 320 | 31.5% |
| 3-Person Household | 106 | 10.4% |
| 4+ Person Household | 225 | 22.1% |
| Total Housing Units | 1,017 | 100.0% |
Occupancy by Ownership by Household Size in North Beach
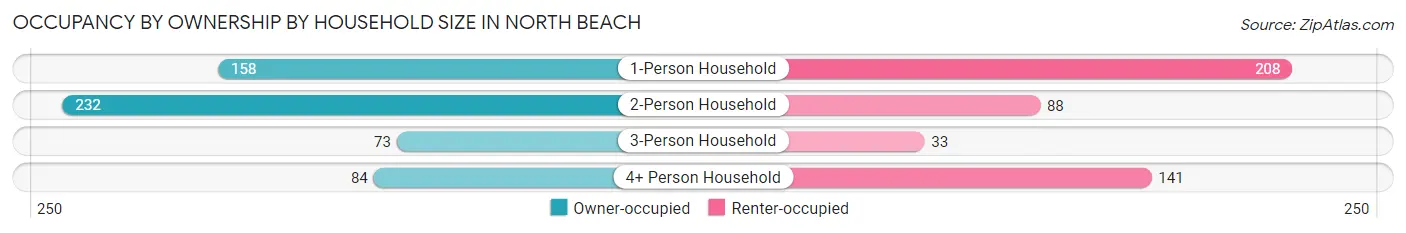
| Household Size | Owner-occupied | Renter-occupied |
| 1-Person Household | 158 (43.2%) | 208 (56.8%) |
| 2-Person Household | 232 (72.5%) | 88 (27.5%) |
| 3-Person Household | 73 (68.9%) | 33 (31.1%) |
| 4+ Person Household | 84 (37.3%) | 141 (62.7%) |
| Total Housing Units | 547 (53.8%) | 470 (46.2%) |
Occupancy by Educational Attainment in North Beach
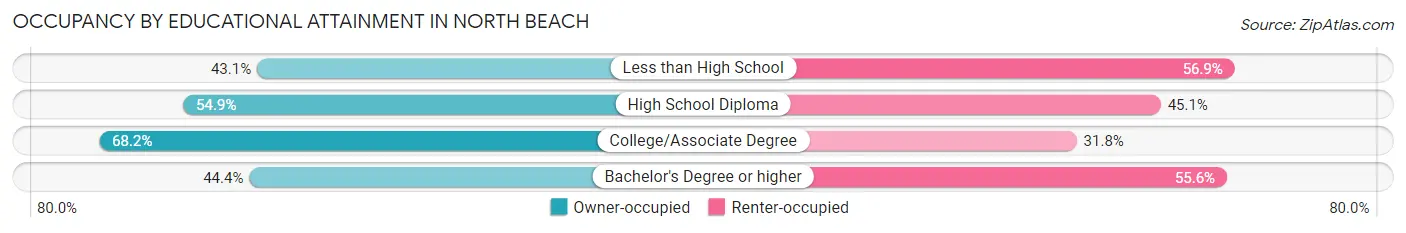
| Household Size | Owner-occupied | Renter-occupied |
| Less than High School | 22 (43.1%) | 29 (56.9%) |
| High School Diploma | 124 (54.9%) | 102 (45.1%) |
| College/Associate Degree | 208 (68.2%) | 97 (31.8%) |
| Bachelor's Degree or higher | 193 (44.4%) | 242 (55.6%) |
Occupancy by Age of Householder in North Beach
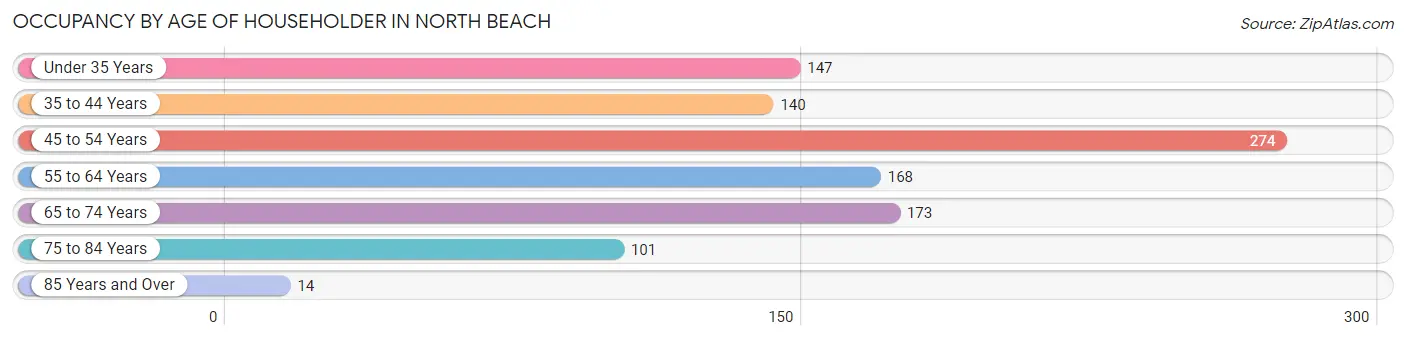
| Age Bracket | # Households | % Households |
| Under 35 Years | 147 | 14.4% |
| 35 to 44 Years | 140 | 13.8% |
| 45 to 54 Years | 274 | 26.9% |
| 55 to 64 Years | 168 | 16.5% |
| 65 to 74 Years | 173 | 17.0% |
| 75 to 84 Years | 101 | 9.9% |
| 85 Years and Over | 14 | 1.4% |
| Total | 1,017 | 100.0% |
Housing Finances in North Beach
Median Income by Occupancy in North Beach
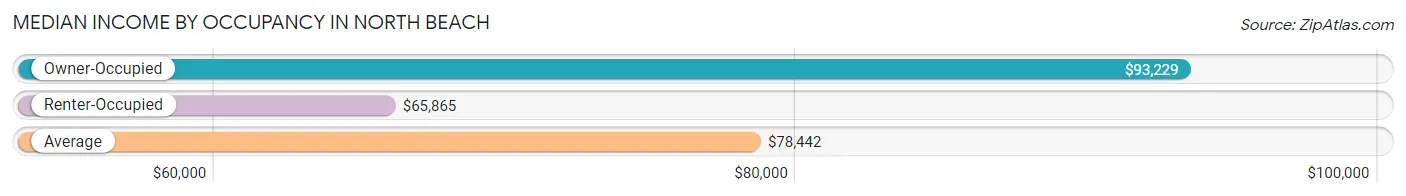
| Occupancy Type | # Households | Median Income |
| Owner-Occupied | 547 (53.8%) | $93,229 |
| Renter-Occupied | 470 (46.2%) | $65,865 |
| Average | 1,017 (100.0%) | $78,442 |
Occupancy by Householder Income Bracket in North Beach
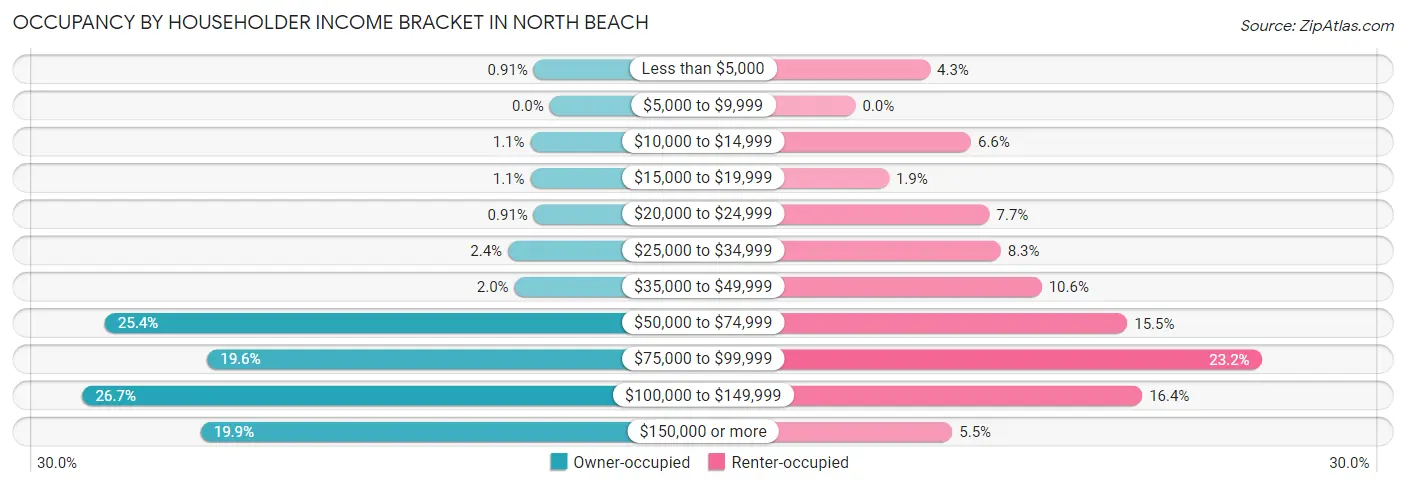
| Income Bracket | Owner-occupied | Renter-occupied |
| Less than $5,000 | 5 (0.9%) | 20 (4.3%) |
| $5,000 to $9,999 | 0 (0.0%) | 0 (0.0%) |
| $10,000 to $14,999 | 6 (1.1%) | 31 (6.6%) |
| $15,000 to $19,999 | 6 (1.1%) | 9 (1.9%) |
| $20,000 to $24,999 | 5 (0.9%) | 36 (7.7%) |
| $25,000 to $34,999 | 13 (2.4%) | 39 (8.3%) |
| $35,000 to $49,999 | 11 (2.0%) | 50 (10.6%) |
| $50,000 to $74,999 | 139 (25.4%) | 73 (15.5%) |
| $75,000 to $99,999 | 107 (19.6%) | 109 (23.2%) |
| $100,000 to $149,999 | 146 (26.7%) | 77 (16.4%) |
| $150,000 or more | 109 (19.9%) | 26 (5.5%) |
| Total | 547 (100.0%) | 470 (100.0%) |
Monthly Housing Cost Tiers in North Beach
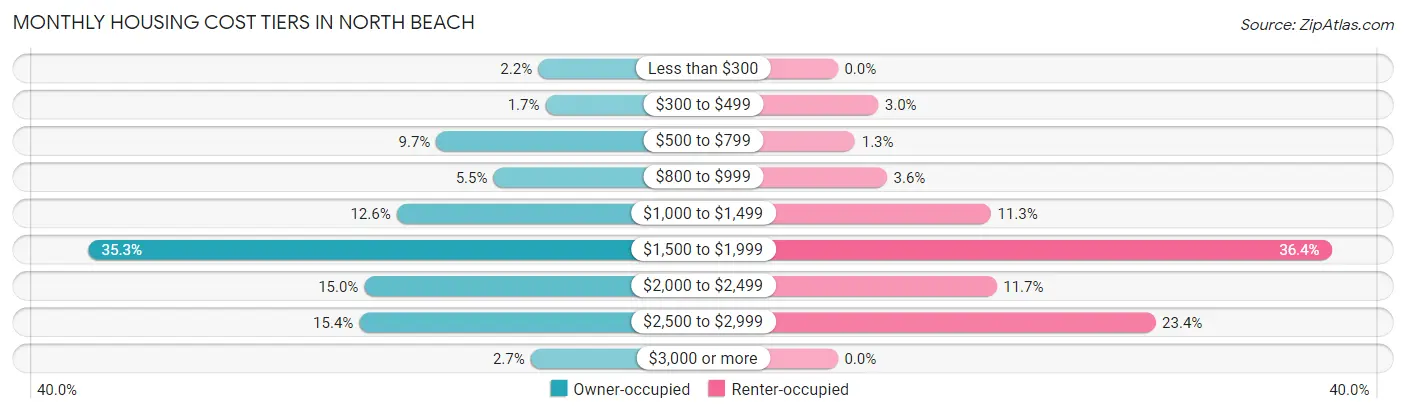
| Monthly Cost | Owner-occupied | Renter-occupied |
| Less than $300 | 12 (2.2%) | 0 (0.0%) |
| $300 to $499 | 9 (1.7%) | 14 (3.0%) |
| $500 to $799 | 53 (9.7%) | 6 (1.3%) |
| $800 to $999 | 30 (5.5%) | 17 (3.6%) |
| $1,000 to $1,499 | 69 (12.6%) | 53 (11.3%) |
| $1,500 to $1,999 | 193 (35.3%) | 171 (36.4%) |
| $2,000 to $2,499 | 82 (15.0%) | 55 (11.7%) |
| $2,500 to $2,999 | 84 (15.4%) | 110 (23.4%) |
| $3,000 or more | 15 (2.7%) | 0 (0.0%) |
| Total | 547 (100.0%) | 470 (100.0%) |
Physical Housing Characteristics in North Beach
Housing Structures in North Beach
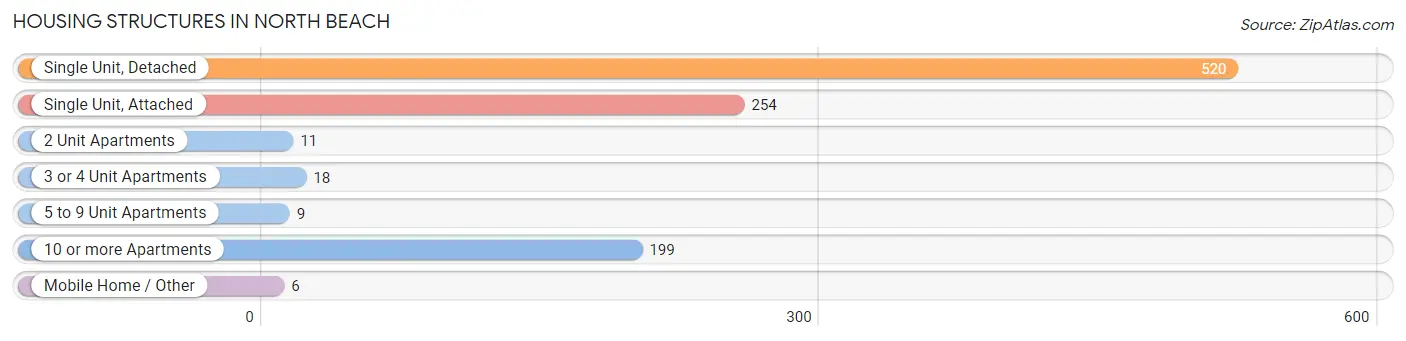
| Structure Type | # Housing Units | % Housing Units |
| Single Unit, Detached | 520 | 51.1% |
| Single Unit, Attached | 254 | 25.0% |
| 2 Unit Apartments | 11 | 1.1% |
| 3 or 4 Unit Apartments | 18 | 1.8% |
| 5 to 9 Unit Apartments | 9 | 0.9% |
| 10 or more Apartments | 199 | 19.6% |
| Mobile Home / Other | 6 | 0.6% |
| Total | 1,017 | 100.0% |
Housing Structures by Occupancy in North Beach
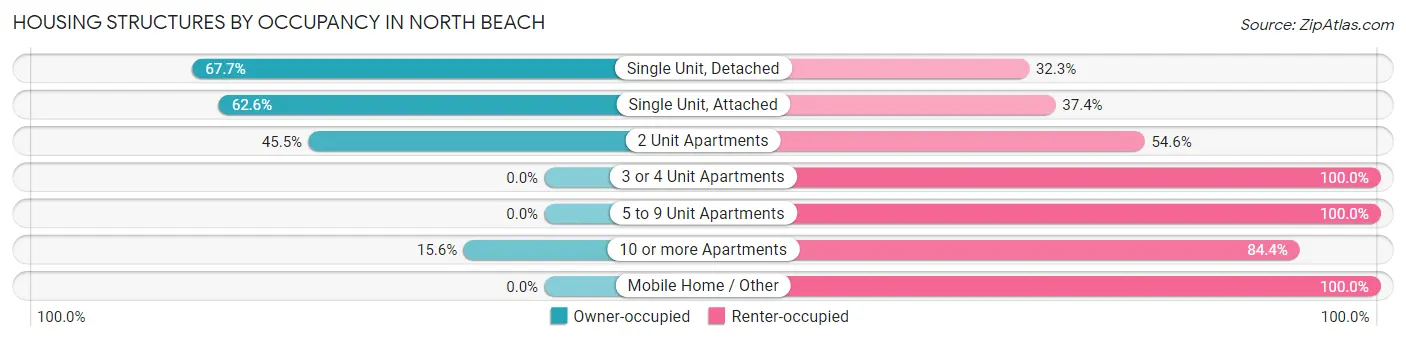
| Structure Type | Owner-occupied | Renter-occupied |
| Single Unit, Detached | 352 (67.7%) | 168 (32.3%) |
| Single Unit, Attached | 159 (62.6%) | 95 (37.4%) |
| 2 Unit Apartments | 5 (45.5%) | 6 (54.5%) |
| 3 or 4 Unit Apartments | 0 (0.0%) | 18 (100.0%) |
| 5 to 9 Unit Apartments | 0 (0.0%) | 9 (100.0%) |
| 10 or more Apartments | 31 (15.6%) | 168 (84.4%) |
| Mobile Home / Other | 0 (0.0%) | 6 (100.0%) |
| Total | 547 (53.8%) | 470 (46.2%) |
Housing Structures by Number of Rooms in North Beach
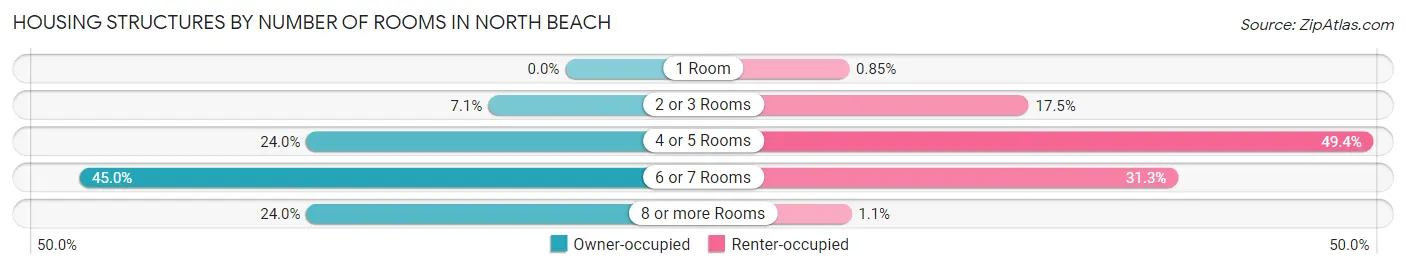
| Number of Rooms | Owner-occupied | Renter-occupied |
| 1 Room | 0 (0.0%) | 4 (0.9%) |
| 2 or 3 Rooms | 39 (7.1%) | 82 (17.4%) |
| 4 or 5 Rooms | 131 (23.9%) | 232 (49.4%) |
| 6 or 7 Rooms | 246 (45.0%) | 147 (31.3%) |
| 8 or more Rooms | 131 (23.9%) | 5 (1.1%) |
| Total | 547 (100.0%) | 470 (100.0%) |
Housing Structure by Heating Type in North Beach
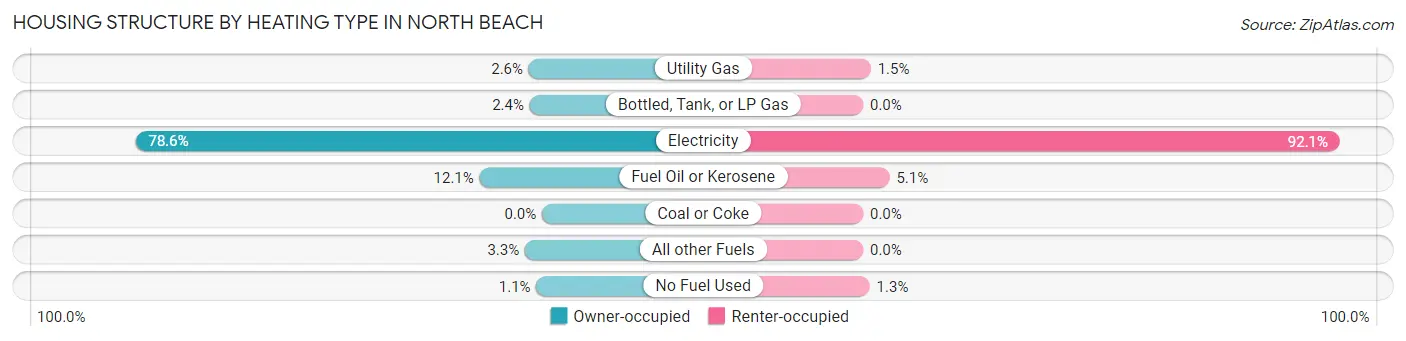
| Heating Type | Owner-occupied | Renter-occupied |
| Utility Gas | 14 (2.6%) | 7 (1.5%) |
| Bottled, Tank, or LP Gas | 13 (2.4%) | 0 (0.0%) |
| Electricity | 430 (78.6%) | 433 (92.1%) |
| Fuel Oil or Kerosene | 66 (12.1%) | 24 (5.1%) |
| Coal or Coke | 0 (0.0%) | 0 (0.0%) |
| All other Fuels | 18 (3.3%) | 0 (0.0%) |
| No Fuel Used | 6 (1.1%) | 6 (1.3%) |
| Total | 547 (100.0%) | 470 (100.0%) |
Household Vehicle Usage in North Beach
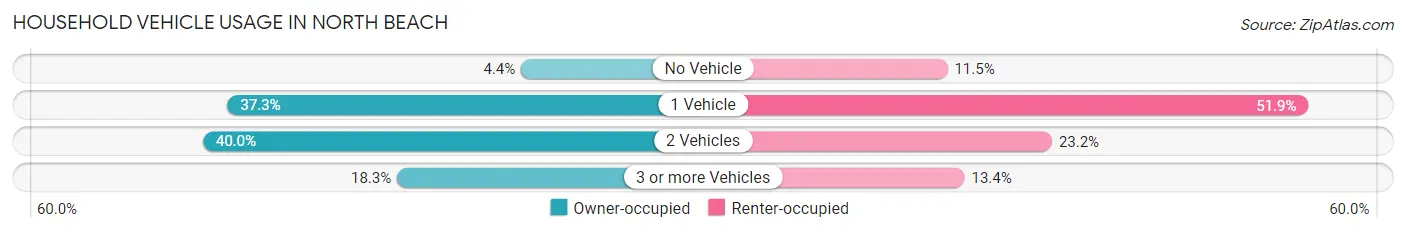
| Vehicles per Household | Owner-occupied | Renter-occupied |
| No Vehicle | 24 (4.4%) | 54 (11.5%) |
| 1 Vehicle | 204 (37.3%) | 244 (51.9%) |
| 2 Vehicles | 219 (40.0%) | 109 (23.2%) |
| 3 or more Vehicles | 100 (18.3%) | 63 (13.4%) |
| Total | 547 (100.0%) | 470 (100.0%) |
Real Estate & Mortgages in North Beach
Real Estate and Mortgage Overview in North Beach
| Characteristic | Without Mortgage | With Mortgage |
| Housing Units | 108 | 439 |
| Median Property Value | $242,100 | $328,100 |
| Median Household Income | $70,500 | $89 |
| Monthly Housing Costs | $758 | $15 |
| Real Estate Taxes | $4,476 | $6 |
Property Value by Mortgage Status in North Beach
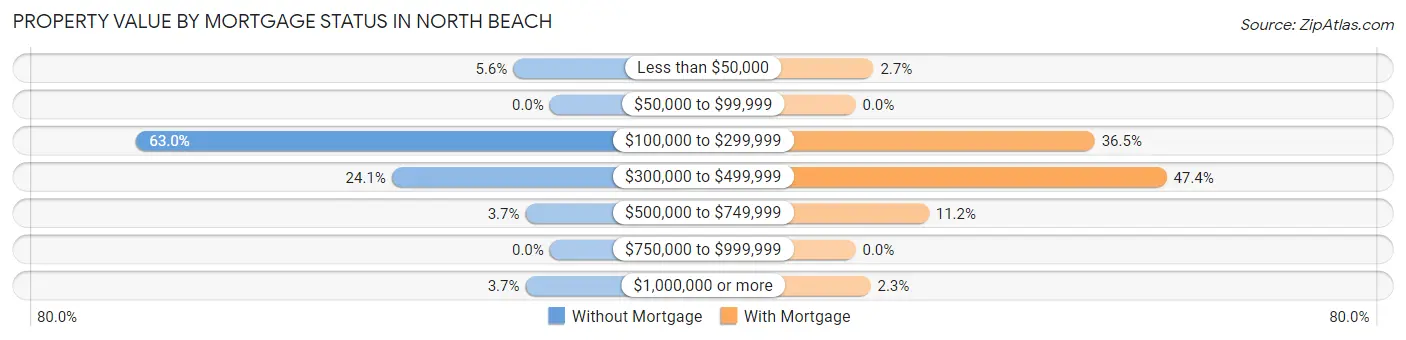
| Property Value | Without Mortgage | With Mortgage |
| Less than $50,000 | 6 (5.6%) | 12 (2.7%) |
| $50,000 to $99,999 | 0 (0.0%) | 0 (0.0%) |
| $100,000 to $299,999 | 68 (63.0%) | 160 (36.4%) |
| $300,000 to $499,999 | 26 (24.1%) | 208 (47.4%) |
| $500,000 to $749,999 | 4 (3.7%) | 49 (11.2%) |
| $750,000 to $999,999 | 0 (0.0%) | 0 (0.0%) |
| $1,000,000 or more | 4 (3.7%) | 10 (2.3%) |
| Total | 108 (100.0%) | 439 (100.0%) |
Household Income by Mortgage Status in North Beach
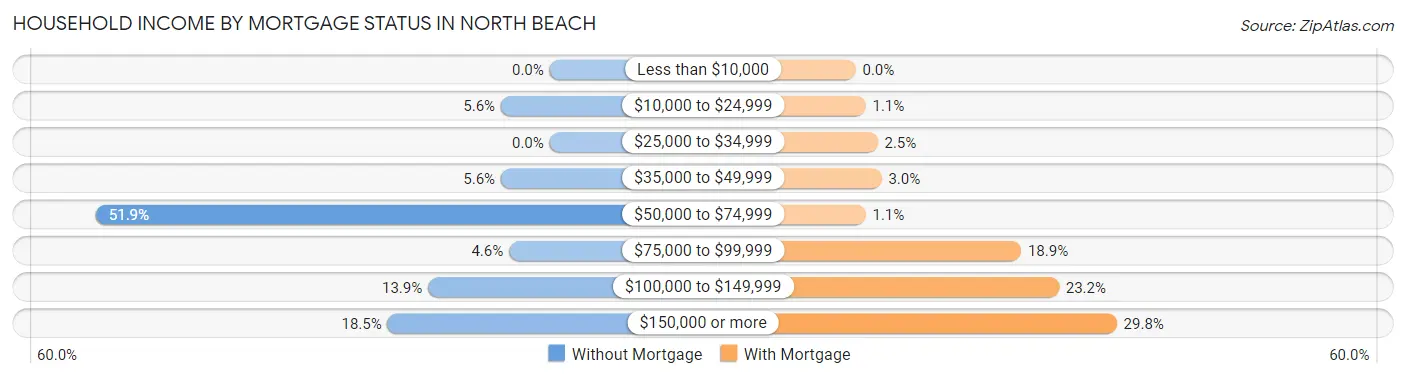
| Household Income | Without Mortgage | With Mortgage |
| Less than $10,000 | 0 (0.0%) | 0 (0.0%) |
| $10,000 to $24,999 | 6 (5.6%) | 5 (1.1%) |
| $25,000 to $34,999 | 0 (0.0%) | 11 (2.5%) |
| $35,000 to $49,999 | 6 (5.6%) | 13 (3.0%) |
| $50,000 to $74,999 | 56 (51.8%) | 5 (1.1%) |
| $75,000 to $99,999 | 5 (4.6%) | 83 (18.9%) |
| $100,000 to $149,999 | 15 (13.9%) | 102 (23.2%) |
| $150,000 or more | 20 (18.5%) | 131 (29.8%) |
| Total | 108 (100.0%) | 439 (100.0%) |
Property Value to Household Income Ratio in North Beach
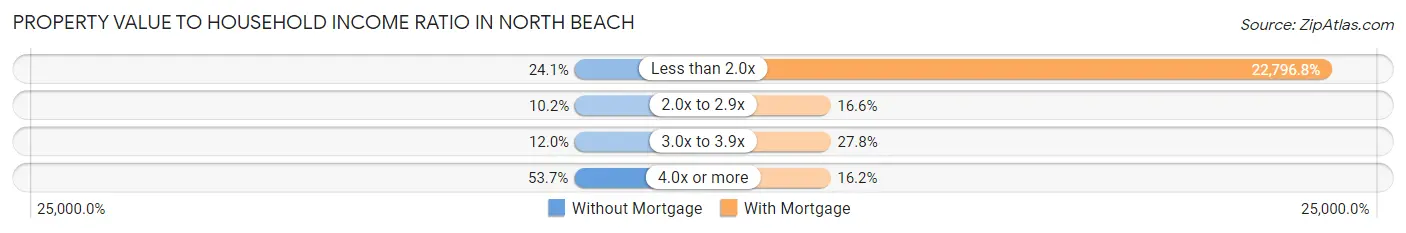
| Value-to-Income Ratio | Without Mortgage | With Mortgage |
| Less than 2.0x | 26 (24.1%) | 100,078 (22,796.8%) |
| 2.0x to 2.9x | 11 (10.2%) | 73 (16.6%) |
| 3.0x to 3.9x | 13 (12.0%) | 122 (27.8%) |
| 4.0x or more | 58 (53.7%) | 71 (16.2%) |
| Total | 108 (100.0%) | 439 (100.0%) |
Real Estate Taxes by Mortgage Status in North Beach
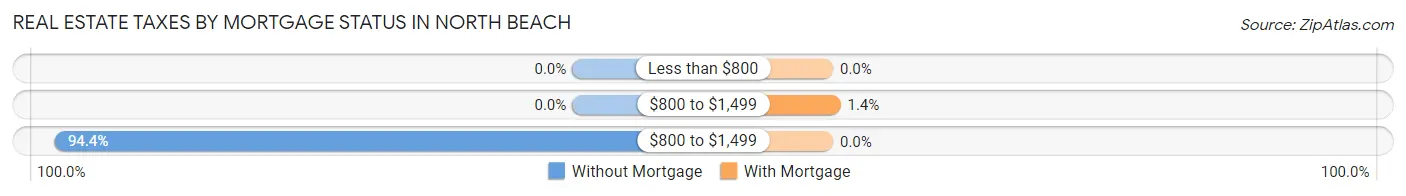
| Property Taxes | Without Mortgage | With Mortgage |
| Less than $800 | 0 (0.0%) | 0 (0.0%) |
| $800 to $1,499 | 0 (0.0%) | 6 (1.4%) |
| $800 to $1,499 | 102 (94.4%) | 0 (0.0%) |
| Total | 108 (100.0%) | 439 (100.0%) |
Health & Disability in North Beach
Health Insurance Coverage by Age in North Beach
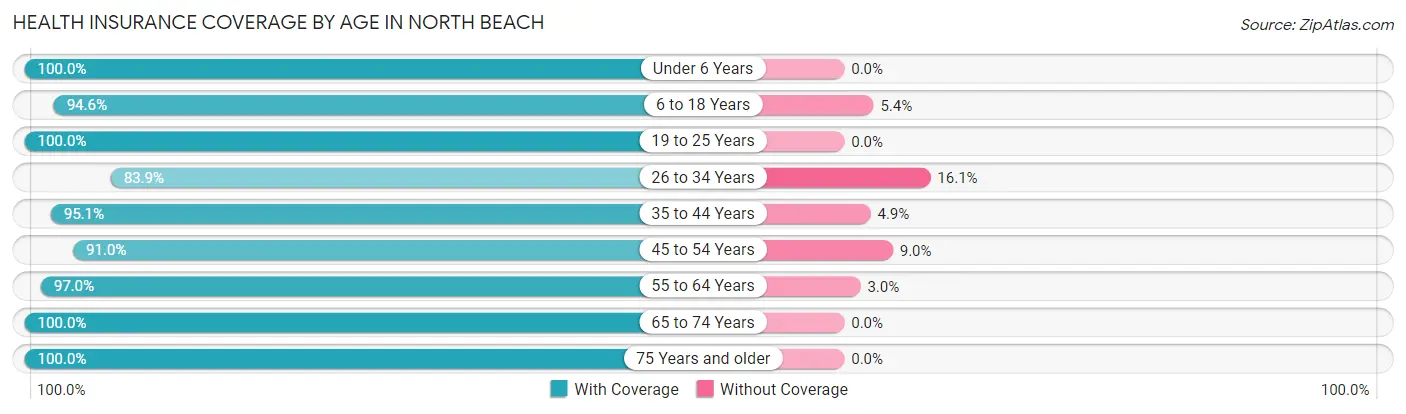
| Age Bracket | With Coverage | Without Coverage |
| Under 6 Years | 194 (100.0%) | 0 (0.0%) |
| 6 to 18 Years | 800 (94.6%) | 46 (5.4%) |
| 19 to 25 Years | 100 (100.0%) | 0 (0.0%) |
| 26 to 34 Years | 183 (83.9%) | 35 (16.1%) |
| 35 to 44 Years | 214 (95.1%) | 11 (4.9%) |
| 45 to 54 Years | 312 (91.0%) | 31 (9.0%) |
| 55 to 64 Years | 225 (97.0%) | 7 (3.0%) |
| 65 to 74 Years | 283 (100.0%) | 0 (0.0%) |
| 75 Years and older | 121 (100.0%) | 0 (0.0%) |
| Total | 2,432 (94.9%) | 130 (5.1%) |
Health Insurance Coverage by Citizenship Status in North Beach
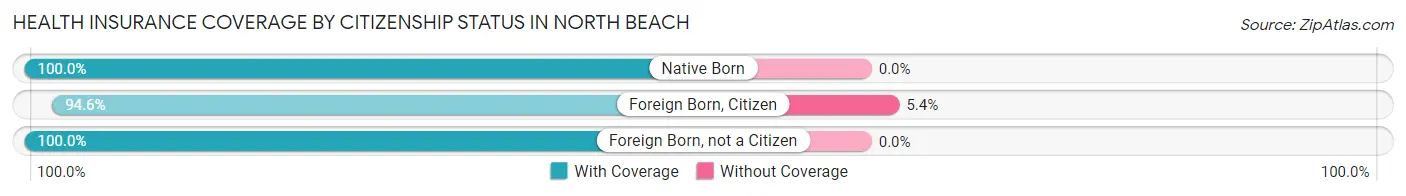
| Citizenship Status | With Coverage | Without Coverage |
| Native Born | 194 (100.0%) | 0 (0.0%) |
| Foreign Born, Citizen | 800 (94.6%) | 46 (5.4%) |
| Foreign Born, not a Citizen | 100 (100.0%) | 0 (0.0%) |
Health Insurance Coverage by Household Income in North Beach
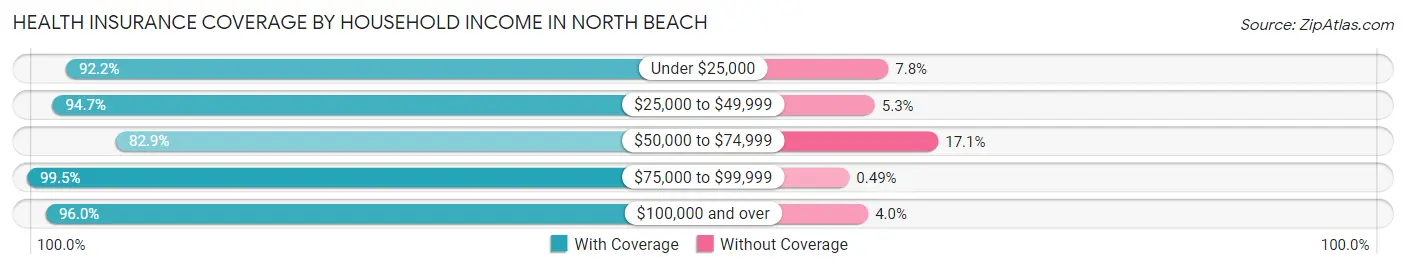
| Household Income | With Coverage | Without Coverage |
| Under $25,000 | 154 (92.2%) | 13 (7.8%) |
| $25,000 to $49,999 | 126 (94.7%) | 7 (5.3%) |
| $50,000 to $74,999 | 290 (82.9%) | 60 (17.1%) |
| $75,000 to $99,999 | 807 (99.5%) | 4 (0.5%) |
| $100,000 and over | 1,052 (96.0%) | 44 (4.0%) |
Public vs Private Health Insurance Coverage by Age in North Beach
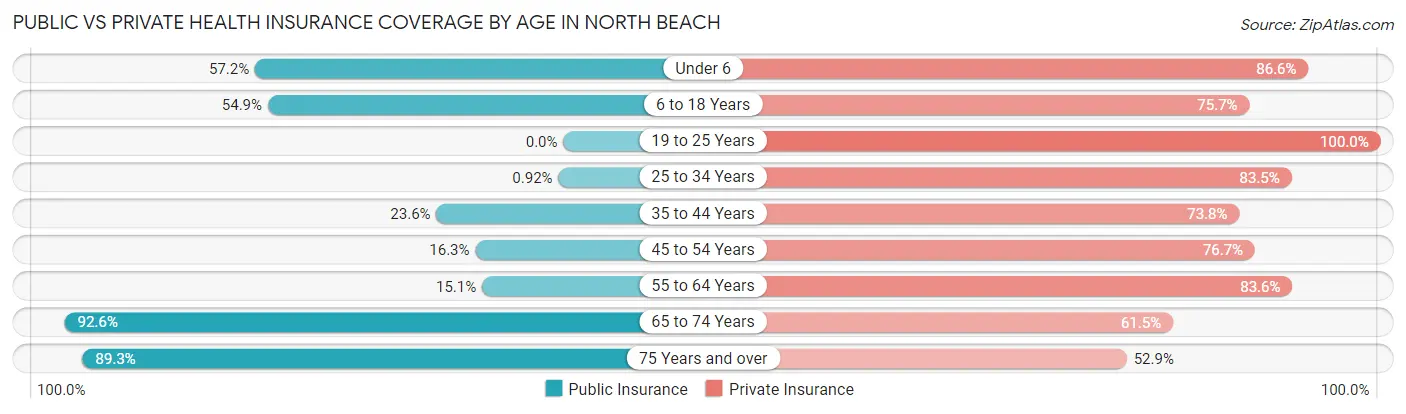
| Age Bracket | Public Insurance | Private Insurance |
| Under 6 | 111 (57.2%) | 168 (86.6%) |
| 6 to 18 Years | 464 (54.8%) | 640 (75.6%) |
| 19 to 25 Years | 0 (0.0%) | 100 (100.0%) |
| 25 to 34 Years | 2 (0.9%) | 182 (83.5%) |
| 35 to 44 Years | 53 (23.6%) | 166 (73.8%) |
| 45 to 54 Years | 56 (16.3%) | 263 (76.7%) |
| 55 to 64 Years | 35 (15.1%) | 194 (83.6%) |
| 65 to 74 Years | 262 (92.6%) | 174 (61.5%) |
| 75 Years and over | 108 (89.3%) | 64 (52.9%) |
| Total | 1,091 (42.6%) | 1,951 (76.1%) |
Disability Status by Sex by Age in North Beach
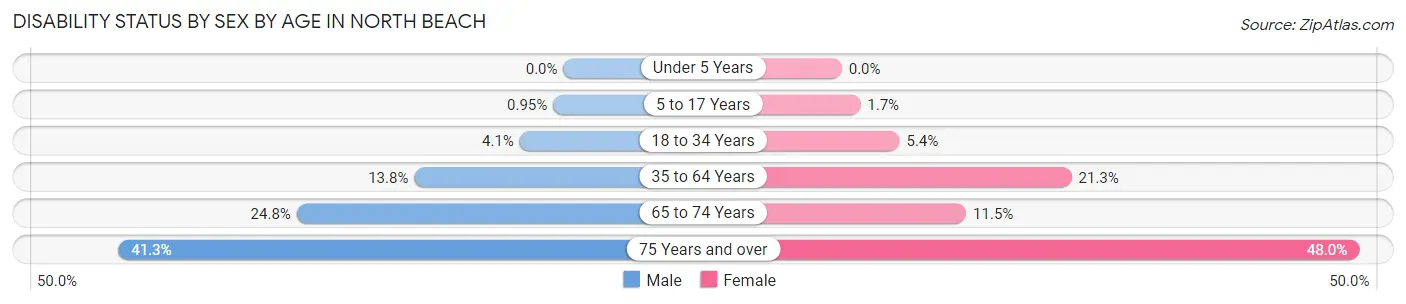
| Age Bracket | Male | Female |
| Under 5 Years | 0 (0.0%) | 0 (0.0%) |
| 5 to 17 Years | 4 (0.9%) | 8 (1.7%) |
| 18 to 34 Years | 9 (4.1%) | 9 (5.4%) |
| 35 to 64 Years | 40 (13.8%) | 109 (21.3%) |
| 65 to 74 Years | 25 (24.7%) | 21 (11.5%) |
| 75 Years and over | 19 (41.3%) | 36 (48.0%) |
Disability Class by Sex by Age in North Beach
Disability Class: Hearing Difficulty
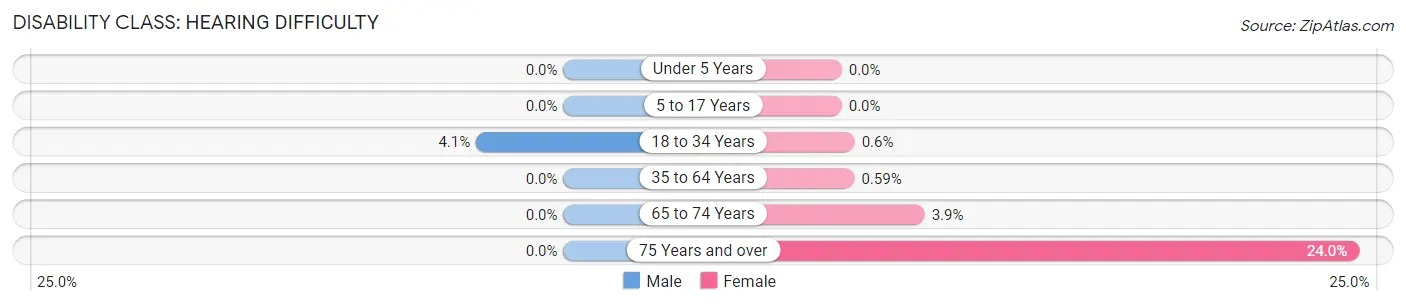
| Age Bracket | Male | Female |
| Under 5 Years | 0 (0.0%) | 0 (0.0%) |
| 5 to 17 Years | 0 (0.0%) | 0 (0.0%) |
| 18 to 34 Years | 9 (4.1%) | 1 (0.6%) |
| 35 to 64 Years | 0 (0.0%) | 3 (0.6%) |
| 65 to 74 Years | 0 (0.0%) | 7 (3.8%) |
| 75 Years and over | 0 (0.0%) | 18 (24.0%) |
Disability Class: Vision Difficulty
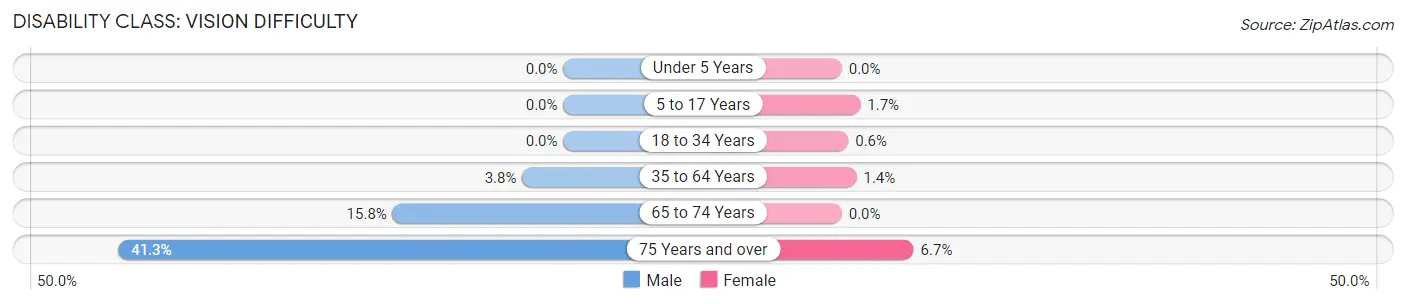
| Age Bracket | Male | Female |
| Under 5 Years | 0 (0.0%) | 0 (0.0%) |
| 5 to 17 Years | 0 (0.0%) | 8 (1.7%) |
| 18 to 34 Years | 0 (0.0%) | 1 (0.6%) |
| 35 to 64 Years | 11 (3.8%) | 7 (1.4%) |
| 65 to 74 Years | 16 (15.8%) | 0 (0.0%) |
| 75 Years and over | 19 (41.3%) | 5 (6.7%) |
Disability Class: Cognitive Difficulty
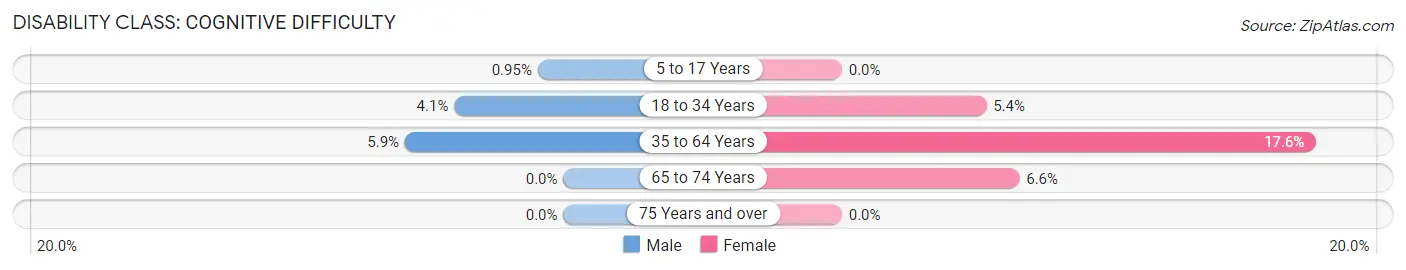
| Age Bracket | Male | Female |
| 5 to 17 Years | 4 (0.9%) | 0 (0.0%) |
| 18 to 34 Years | 9 (4.1%) | 9 (5.4%) |
| 35 to 64 Years | 17 (5.9%) | 90 (17.6%) |
| 65 to 74 Years | 0 (0.0%) | 12 (6.6%) |
| 75 Years and over | 0 (0.0%) | 0 (0.0%) |
Disability Class: Ambulatory Difficulty
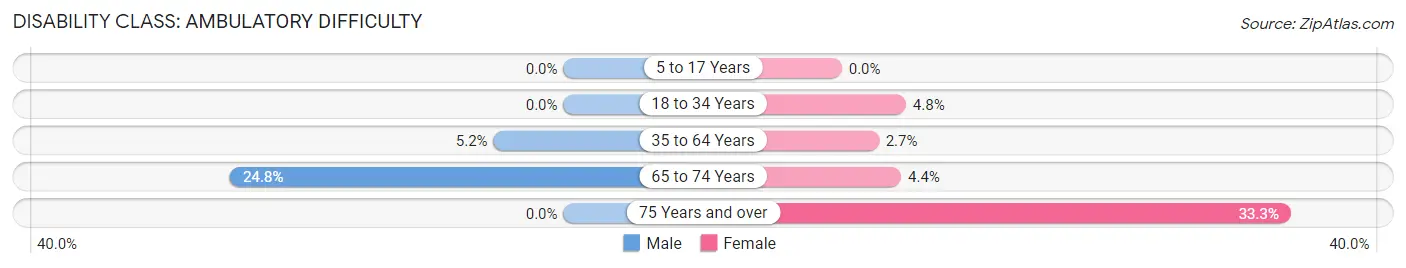
| Age Bracket | Male | Female |
| 5 to 17 Years | 0 (0.0%) | 0 (0.0%) |
| 18 to 34 Years | 0 (0.0%) | 8 (4.8%) |
| 35 to 64 Years | 15 (5.2%) | 14 (2.7%) |
| 65 to 74 Years | 25 (24.7%) | 8 (4.4%) |
| 75 Years and over | 0 (0.0%) | 25 (33.3%) |
Disability Class: Self-Care Difficulty
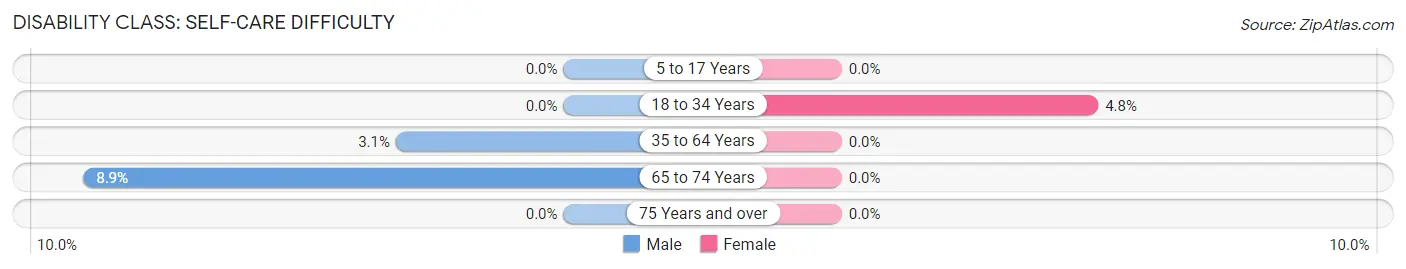
| Age Bracket | Male | Female |
| 5 to 17 Years | 0 (0.0%) | 0 (0.0%) |
| 18 to 34 Years | 0 (0.0%) | 8 (4.8%) |
| 35 to 64 Years | 9 (3.1%) | 0 (0.0%) |
| 65 to 74 Years | 9 (8.9%) | 0 (0.0%) |
| 75 Years and over | 0 (0.0%) | 0 (0.0%) |
Technology Access in North Beach
Computing Device Access in North Beach
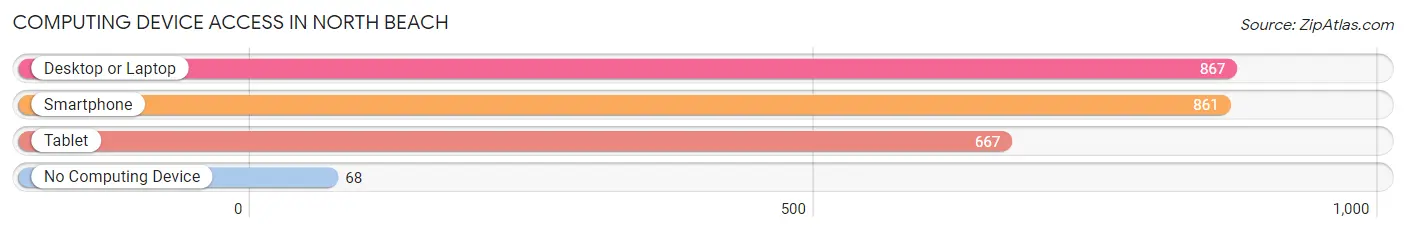
| Device Type | # Households | % Households |
| Desktop or Laptop | 867 | 85.3% |
| Smartphone | 861 | 84.7% |
| Tablet | 667 | 65.6% |
| No Computing Device | 68 | 6.7% |
| Total | 1,017 | 100.0% |
Internet Access in North Beach
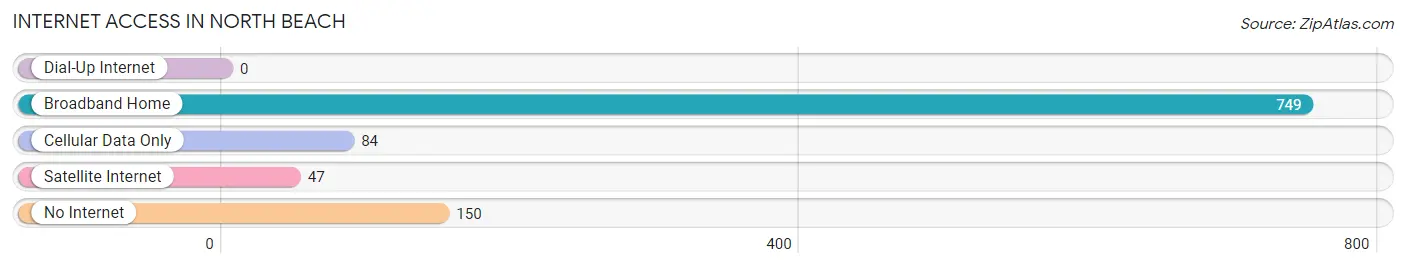
| Internet Type | # Households | % Households |
| Dial-Up Internet | 0 | 0.0% |
| Broadband Home | 749 | 73.7% |
| Cellular Data Only | 84 | 8.3% |
| Satellite Internet | 47 | 4.6% |
| No Internet | 150 | 14.7% |
| Total | 1,017 | 100.0% |
North Beach Summary
History
North Beach is a small town located in Calvert County, Maryland. It is situated on the Chesapeake Bay, just south of the Patuxent River. The town was founded in 1874 by the Chesapeake Beach Railway Company, which was established to provide transportation to the beach resorts in the area. The town was named after the nearby North Beach, which was a popular destination for vacationers in the late 19th century.
The town of North Beach has a rich history that dates back to the early days of the Chesapeake Bay. The area was first inhabited by Native Americans, who used the area for fishing and hunting. The first European settlers arrived in the area in the 1630s, and the town was officially established in 1874.
In the late 19th century, North Beach became a popular destination for vacationers. The town was home to several beach resorts, including the Chesapeake Beach Hotel, which was built in 1887. The hotel was a popular destination for wealthy vacationers, and it was the site of many social events.
In the early 20th century, North Beach became a popular destination for fishing and crabbing. The town was also home to several seafood processing plants, which provided employment for many of the town’s residents.
In the 1950s, the town began to decline as the popularity of beach resorts declined. The town’s economy shifted to focus on fishing and crabbing, and the seafood processing plants closed.
Geography
North Beach is located in Calvert County, Maryland, on the Chesapeake Bay. The town is situated on a peninsula, with the Patuxent River to the north and the Chesapeake Bay to the south. The town is bordered by the towns of Chesapeake Beach to the north and Owings to the south.
The town is located in a temperate climate, with mild winters and hot, humid summers. The average temperature in the summer is around 80 degrees Fahrenheit, and the average temperature in the winter is around 40 degrees Fahrenheit.
The town is located in a flat, coastal plain, with sandy beaches and marshlands. The town is surrounded by several bodies of water, including the Chesapeake Bay, the Patuxent River, and the Potomac River.
Economy
The economy of North Beach is largely based on fishing and crabbing. The town is home to several seafood processing plants, which provide employment for many of the town’s residents. The town is also home to several marinas, which provide services to recreational boaters.
The town is also home to several small businesses, including restaurants, shops, and other services. The town is also home to several bed and breakfasts, which provide lodging for visitors to the area.
Demographics
As of the 2010 census, the population of North Beach was 1,521. The town is predominantly white, with a small African American population. The median household income in the town is $50,000, and the median home value is $250,000.
The town is home to several churches, including the North Beach United Methodist Church, the North Beach Baptist Church, and the North Beach Presbyterian Church. The town is also home to several schools, including North Beach Elementary School, North Beach Middle School, and North Beach High School.
Common Questions
What is Per Capita Income in North Beach?
Per Capita income in North Beach is $38,190.
What is the Median Family Income in North Beach?
Median Family Income in North Beach is $86,771.
What is the Median Household income in North Beach?
Median Household Income in North Beach is $78,442.
What is Income or Wage Gap in North Beach?
Income or Wage Gap in North Beach is 28.2%.
Women in North Beach earn 71.8 cents for every dollar earned by a man.
What is Inequality or Gini Index in North Beach?
Inequality or Gini Index in North Beach is 0.38.
What is the Total Population of North Beach?
Total Population of North Beach is 2,646.
What is the Total Male Population of North Beach?
Total Male Population of North Beach is 1,196.
What is the Total Female Population of North Beach?
Total Female Population of North Beach is 1,450.
What is the Ratio of Males per 100 Females in North Beach?
There are 82.48 Males per 100 Females in North Beach.
What is the Ratio of Females per 100 Males in North Beach?
There are 121.24 Females per 100 Males in North Beach.
What is the Median Population Age in North Beach?
Median Population Age in North Beach is 32.2 Years.
What is the Average Family Size in North Beach
Average Family Size in North Beach is 3.5 People.
What is the Average Household Size in North Beach
Average Household Size in North Beach is 2.6 People.
How Large is the Labor Force in North Beach?
There are 1,345 People in the Labor Forcein in North Beach.
What is the Percentage of People in the Labor Force in North Beach?
69.3% of People are in the Labor Force in North Beach.
What is the Unemployment Rate in North Beach?
Unemployment Rate in North Beach is 16.9%.