Tilghmanton, MD Map & Demographics
Tilghmanton Map
Tilghmanton Overview
$32,827
PER CAPITA INCOME
$99,409
AVG FAMILY INCOME
$98,409
AVG HOUSEHOLD INCOME
63.9%
WAGE / INCOME GAP [ % ]
36.1¢/ $1
WAGE / INCOME GAP [ $ ]
0.41
INEQUALITY / GINI INDEX
463
TOTAL POPULATION
285
MALE POPULATION
178
FEMALE POPULATION
160.11
MALES / 100 FEMALES
62.46
FEMALES / 100 MALES
55.0
MEDIAN AGE
2.7
AVG FAMILY SIZE
2.3
AVG HOUSEHOLD SIZE
220
LABOR FORCE [ PEOPLE ]
47.5%
PERCENT IN LABOR FORCE
36.4%
UNEMPLOYMENT RATE
Income in Tilghmanton
Income Overview in Tilghmanton
Per Capita Income in Tilghmanton is $32,827, while median incomes of families and households are $99,409 and $98,409 respectively.
| Characteristic | Number | Measure |
| Per Capita Income | 463 | $32,827 |
| Median Family Income | 156 | $99,409 |
| Mean Family Income | 156 | $93,487 |
| Median Household Income | 200 | $98,409 |
| Mean Household Income | 200 | $72,920 |
| Income Deficit | 156 | $0 |
| Wage / Income Gap (%) | 463 | 63.95% |
| Wage / Income Gap ($) | 463 | 36.05¢ per $1 |
| Gini / Inequality Index | 463 | 0.41 |
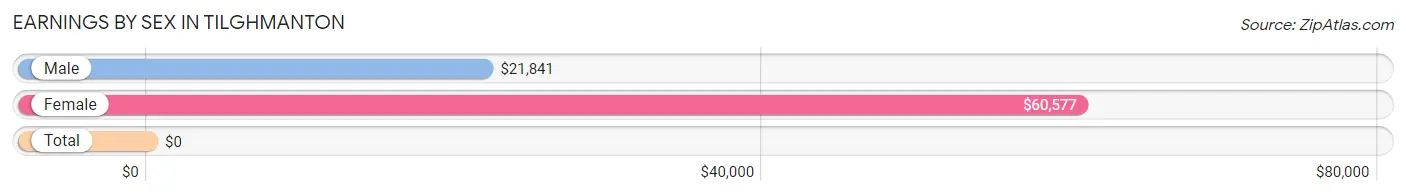
Earnings by Sex in Tilghmanton
| Sex | Number | Average Earnings |
| Male | 147 (67.1%) | $21,841 |
| Female | 72 (32.9%) | $60,577 |
| Total | 219 (100.0%) | $0 |
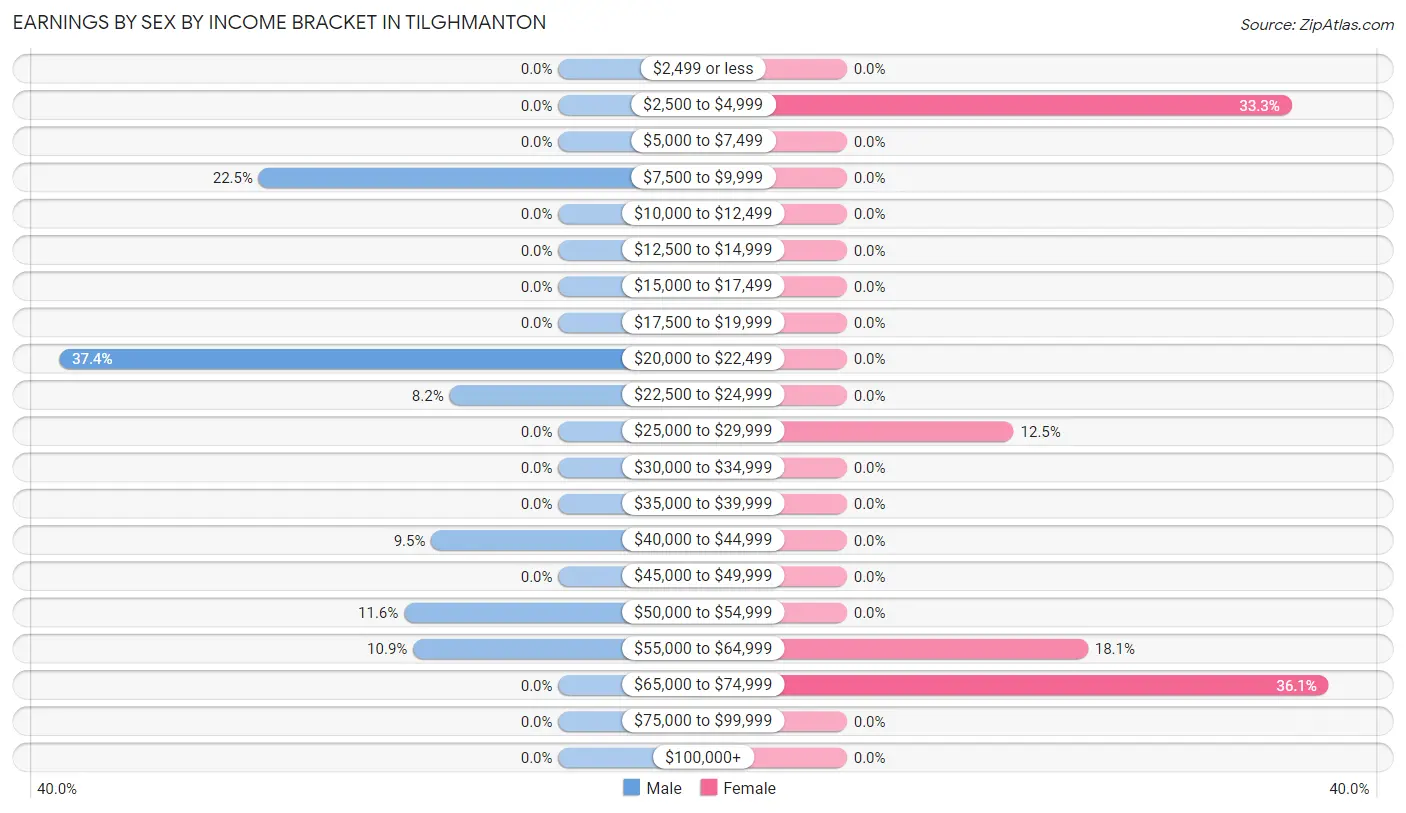
Earnings by Sex by Income Bracket in Tilghmanton
The most common earnings brackets in Tilghmanton are $20,000 to $22,499 for men (55 | 37.4%) and $65,000 to $74,999 for women (26 | 36.1%).
| Income | Male | Female |
| $2,499 or less | 0 (0.0%) | 0 (0.0%) |
| $2,500 to $4,999 | 0 (0.0%) | 24 (33.3%) |
| $5,000 to $7,499 | 0 (0.0%) | 0 (0.0%) |
| $7,500 to $9,999 | 33 (22.5%) | 0 (0.0%) |
| $10,000 to $12,499 | 0 (0.0%) | 0 (0.0%) |
| $12,500 to $14,999 | 0 (0.0%) | 0 (0.0%) |
| $15,000 to $17,499 | 0 (0.0%) | 0 (0.0%) |
| $17,500 to $19,999 | 0 (0.0%) | 0 (0.0%) |
| $20,000 to $22,499 | 55 (37.4%) | 0 (0.0%) |
| $22,500 to $24,999 | 12 (8.2%) | 0 (0.0%) |
| $25,000 to $29,999 | 0 (0.0%) | 9 (12.5%) |
| $30,000 to $34,999 | 0 (0.0%) | 0 (0.0%) |
| $35,000 to $39,999 | 0 (0.0%) | 0 (0.0%) |
| $40,000 to $44,999 | 14 (9.5%) | 0 (0.0%) |
| $45,000 to $49,999 | 0 (0.0%) | 0 (0.0%) |
| $50,000 to $54,999 | 17 (11.6%) | 0 (0.0%) |
| $55,000 to $64,999 | 16 (10.9%) | 13 (18.1%) |
| $65,000 to $74,999 | 0 (0.0%) | 26 (36.1%) |
| $75,000 to $99,999 | 0 (0.0%) | 0 (0.0%) |
| $100,000+ | 0 (0.0%) | 0 (0.0%) |
| Total | 147 (100.0%) | 72 (100.0%) |
Earnings by Sex by Educational Attainment in Tilghmanton
| Educational Attainment | Male Income | Female Income |
| Less than High School | - | - |
| High School Diploma | - | - |
| College or Associate's Degree | - | - |
| Bachelor's Degree | - | - |
| Graduate Degree | - | - |
| Total | $21,841 | $67,692 |
Family Income in Tilghmanton
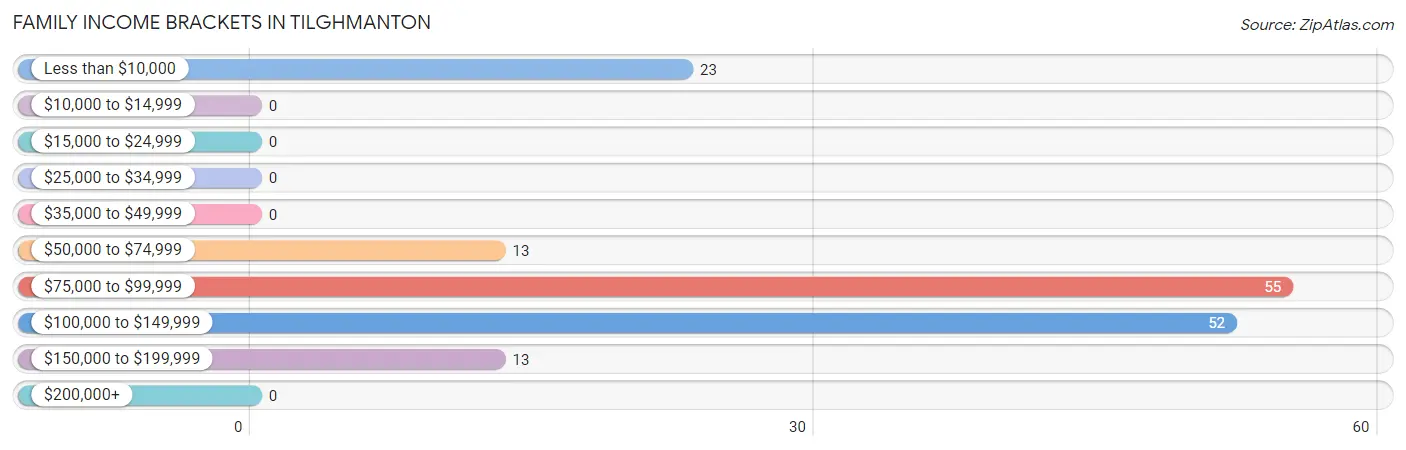
Family Income Brackets in Tilghmanton
According to the Tilghmanton family income data, there are 55 families falling into the $75,000 to $99,999 income range, which is the most common income bracket and makes up 35.3% of all families.
| Income Bracket | # Families | % Families |
| Less than $10,000 | 23 | 14.7% |
| $10,000 to $14,999 | 0 | 0.0% |
| $15,000 to $24,999 | 0 | 0.0% |
| $25,000 to $34,999 | 0 | 0.0% |
| $35,000 to $49,999 | 0 | 0.0% |
| $50,000 to $74,999 | 13 | 8.3% |
| $75,000 to $99,999 | 55 | 35.3% |
| $100,000 to $149,999 | 52 | 33.3% |
| $150,000 to $199,999 | 13 | 8.3% |
| $200,000+ | 0 | 0.0% |
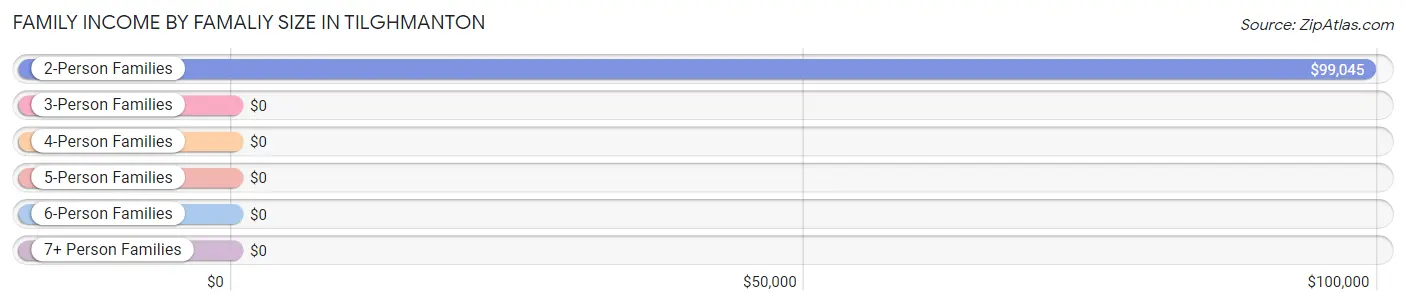
Family Income by Famaliy Size in Tilghmanton
2-person families (94 | 60.3%) account for the highest median family income in Tilghmanton with $99,045 per family, while 2-person families (94 | 60.3%) have the highest median income of $49,522 per family member.
| Income Bracket | # Families | Median Income |
| 2-Person Families | 94 (60.3%) | $99,045 |
| 3-Person Families | 36 (23.1%) | $0 |
| 4-Person Families | 26 (16.7%) | $0 |
| 5-Person Families | 0 (0.0%) | $0 |
| 6-Person Families | 0 (0.0%) | $0 |
| 7+ Person Families | 0 (0.0%) | $0 |
| Total | 156 (100.0%) | $99,409 |
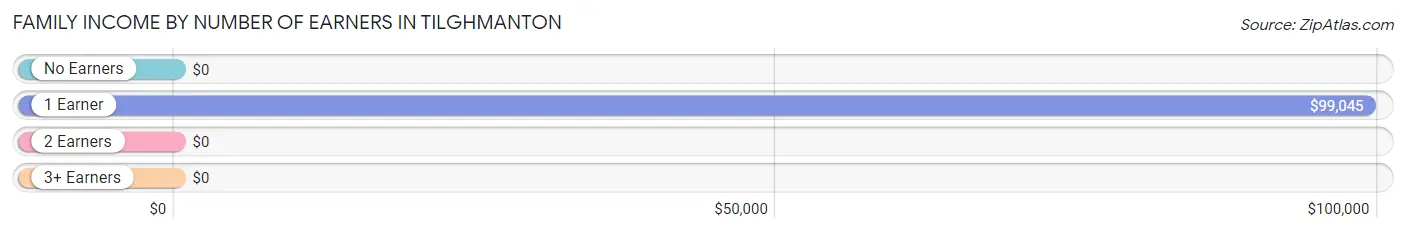
Family Income by Number of Earners in Tilghmanton
| Number of Earners | # Families | Median Income |
| No Earners | 23 (14.7%) | $0 |
| 1 Earner | 94 (60.3%) | $99,045 |
| 2 Earners | 0 (0.0%) | $0 |
| 3+ Earners | 39 (25.0%) | $0 |
| Total | 156 (100.0%) | $99,409 |
Household Income in Tilghmanton
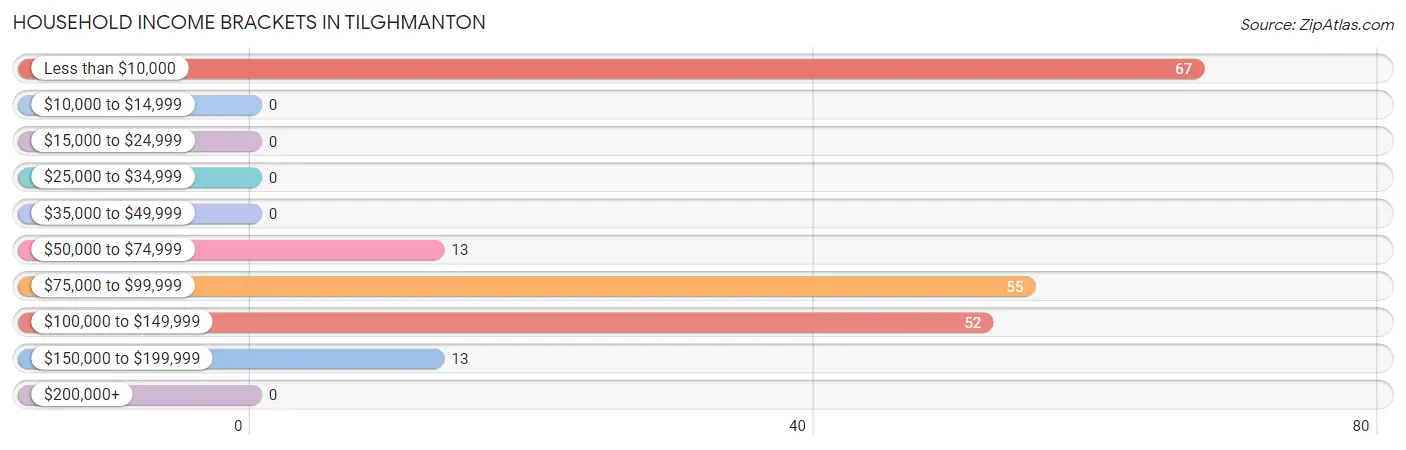
Household Income Brackets in Tilghmanton
With 67 households falling in the category, the less than $10,000 income range is the most frequent in Tilghmanton, accounting for 33.5% of all households.
| Income Bracket | # Households | % Households |
| Less than $10,000 | 67 | 33.5% |
| $10,000 to $14,999 | 0 | 0.0% |
| $15,000 to $24,999 | 0 | 0.0% |
| $25,000 to $34,999 | 0 | 0.0% |
| $35,000 to $49,999 | 0 | 0.0% |
| $50,000 to $74,999 | 13 | 6.5% |
| $75,000 to $99,999 | 55 | 27.5% |
| $100,000 to $149,999 | 52 | 26.0% |
| $150,000 to $199,999 | 13 | 6.5% |
| $200,000+ | 0 | 0.0% |
Household Income by Householder Age in Tilghmanton
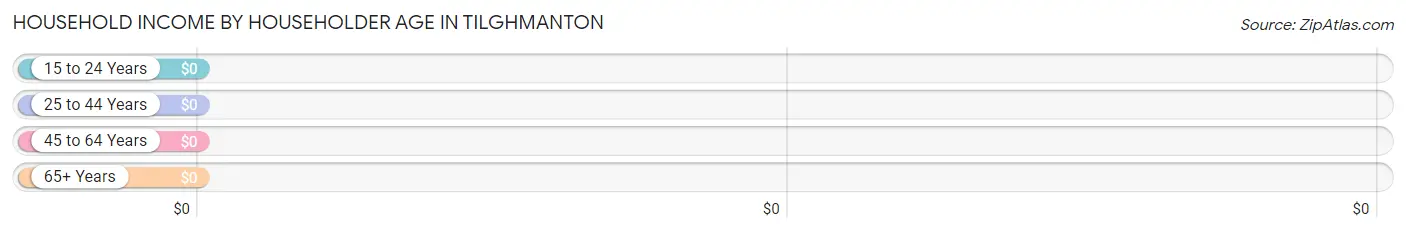
| Income Bracket | # Households | Median Income |
| 15 to 24 Years | 0 (0.0%) | $0 |
| 25 to 44 Years | 0 (0.0%) | $0 |
| 45 to 64 Years | 136 (68.0%) | $0 |
| 65+ Years | 64 (32.0%) | $0 |
| Total | 200 (100.0%) | $98,409 |
Poverty in Tilghmanton
Income Below Poverty by Sex and Age in Tilghmanton
With 33.7% poverty level for males and 12.9% for females among the residents of Tilghmanton, 18 to 24 year old males and 45 to 54 year old females are the most vulnerable to poverty, with 52 males (100.0%) and 23 females (37.1%) in their respective age groups living below the poverty level.
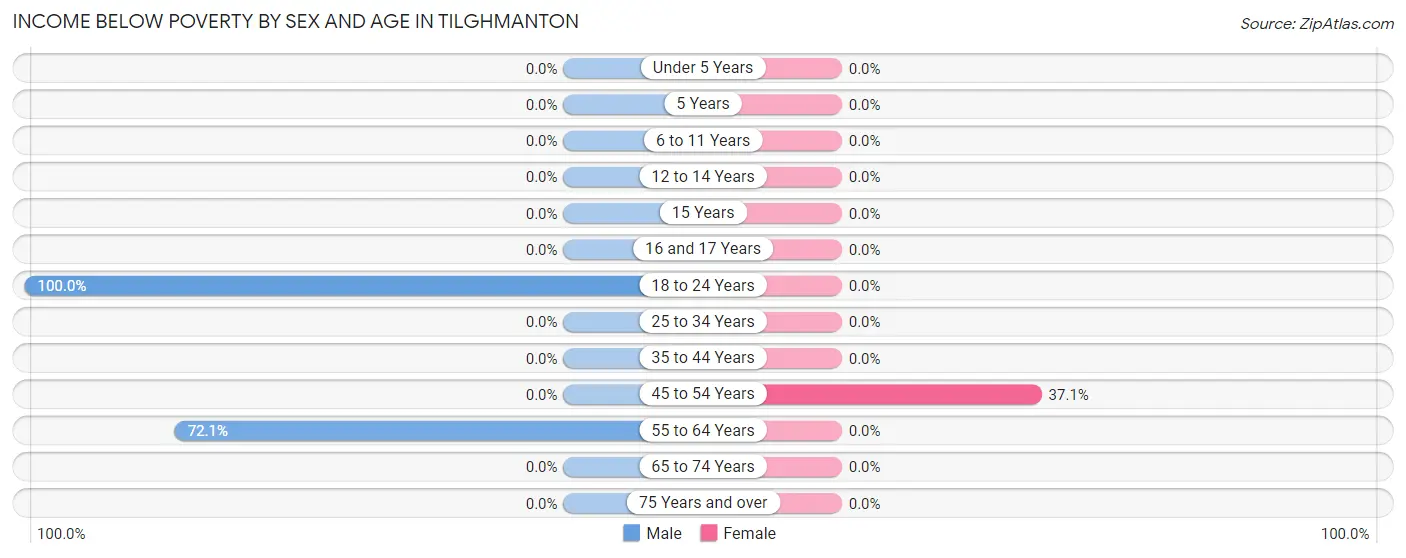
| Age Bracket | Male | Female |
| Under 5 Years | 0 (0.0%) | 0 (0.0%) |
| 5 Years | 0 (0.0%) | 0 (0.0%) |
| 6 to 11 Years | 0 (0.0%) | 0 (0.0%) |
| 12 to 14 Years | 0 (0.0%) | 0 (0.0%) |
| 15 Years | 0 (0.0%) | 0 (0.0%) |
| 16 and 17 Years | 0 (0.0%) | 0 (0.0%) |
| 18 to 24 Years | 52 (100.0%) | 0 (0.0%) |
| 25 to 34 Years | 0 (0.0%) | 0 (0.0%) |
| 35 to 44 Years | 0 (0.0%) | 0 (0.0%) |
| 45 to 54 Years | 0 (0.0%) | 23 (37.1%) |
| 55 to 64 Years | 44 (72.1%) | 0 (0.0%) |
| 65 to 74 Years | 0 (0.0%) | 0 (0.0%) |
| 75 Years and over | 0 (0.0%) | 0 (0.0%) |
| Total | 96 (33.7%) | 23 (12.9%) |
Income Above Poverty by Sex and Age in Tilghmanton
According to the poverty statistics in Tilghmanton, males aged 16 and 17 years and females aged 16 and 17 years are the age groups that are most secure financially, with 100.0% of males and 100.0% of females in these age groups living above the poverty line.
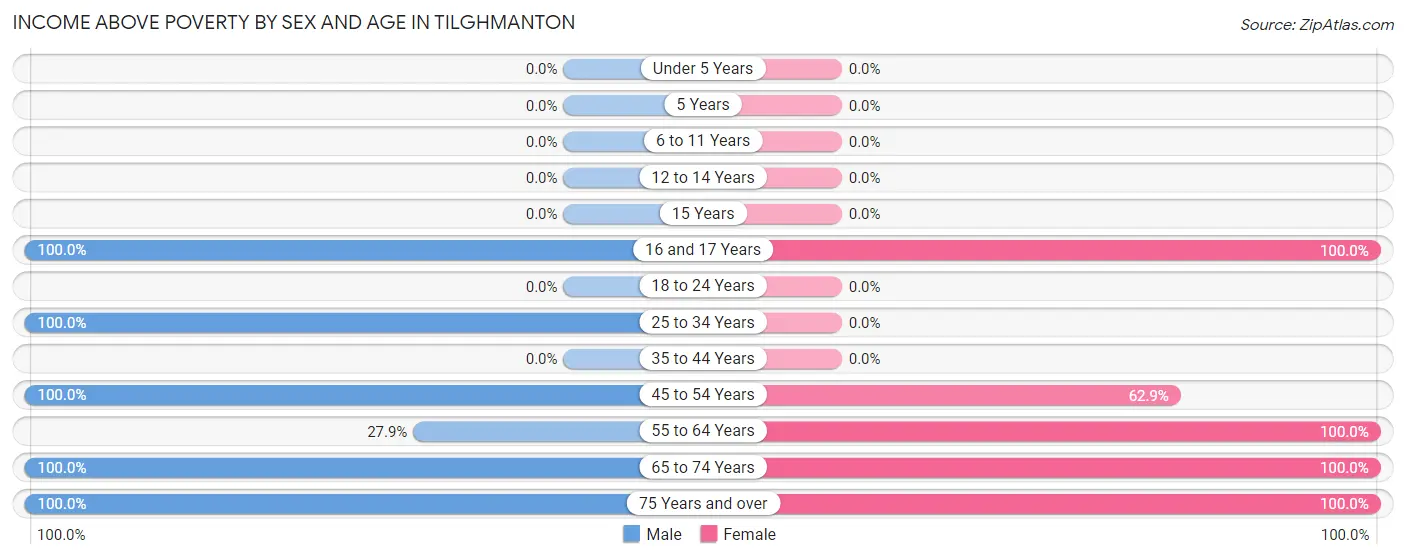
| Age Bracket | Male | Female |
| Under 5 Years | 0 (0.0%) | 0 (0.0%) |
| 5 Years | 0 (0.0%) | 0 (0.0%) |
| 6 to 11 Years | 0 (0.0%) | 0 (0.0%) |
| 12 to 14 Years | 0 (0.0%) | 0 (0.0%) |
| 15 Years | 0 (0.0%) | 0 (0.0%) |
| 16 and 17 Years | 33 (100.0%) | 24 (100.0%) |
| 18 to 24 Years | 0 (0.0%) | 0 (0.0%) |
| 25 to 34 Years | 12 (100.0%) | 0 (0.0%) |
| 35 to 44 Years | 0 (0.0%) | 0 (0.0%) |
| 45 to 54 Years | 49 (100.0%) | 39 (62.9%) |
| 55 to 64 Years | 17 (27.9%) | 64 (100.0%) |
| 65 to 74 Years | 69 (100.0%) | 19 (100.0%) |
| 75 Years and over | 9 (100.0%) | 9 (100.0%) |
| Total | 189 (66.3%) | 155 (87.1%) |
Income Below Poverty Among Married-Couple Families in Tilghmanton
The poverty statistics for married-couple families in Tilghmanton show that 14.7% or 23 of the total 156 families live below the poverty line. Families with no children have the highest poverty rate of 17.7%, comprising of 23 families. On the other hand, families with 1 or 2 children have the lowest poverty rate of 0.0%, which includes 0 families.
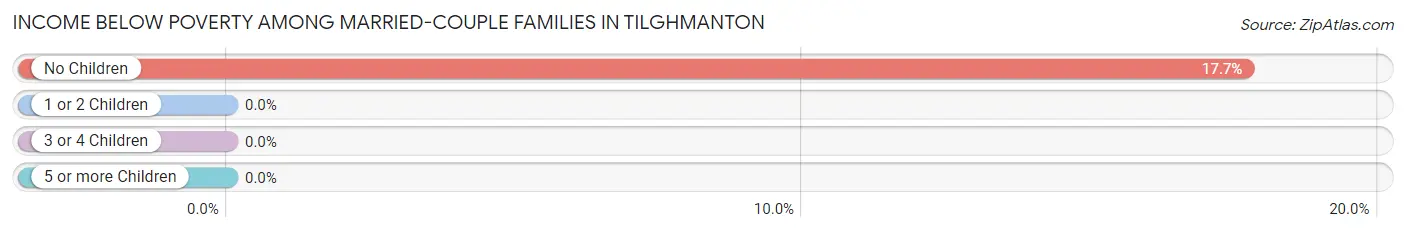
| Children | Above Poverty | Below Poverty |
| No Children | 107 (82.3%) | 23 (17.7%) |
| 1 or 2 Children | 26 (100.0%) | 0 (0.0%) |
| 3 or 4 Children | 0 (0.0%) | 0 (0.0%) |
| 5 or more Children | 0 (0.0%) | 0 (0.0%) |
| Total | 133 (85.3%) | 23 (14.7%) |
Income Below Poverty Among Single-Parent Households in Tilghmanton
| Children | Single Father | Single Mother |
| No Children | 0 (0.0%) | 0 (0.0%) |
| 1 or 2 Children | 0 (0.0%) | 0 (0.0%) |
| 3 or 4 Children | 0 (0.0%) | 0 (0.0%) |
| 5 or more Children | 0 (0.0%) | 0 (0.0%) |
| Total | 0 (0.0%) | 0 (0.0%) |
Income Below Poverty Among Married-Couple vs Single-Parent Households in Tilghmanton
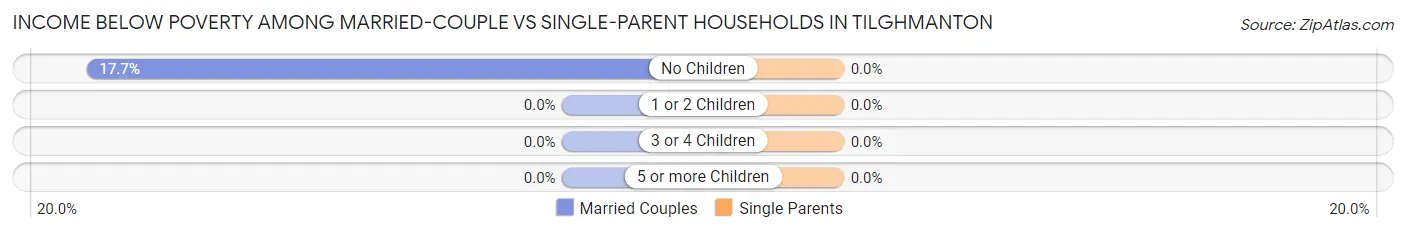
| Children | Married-Couple Families | Single-Parent Households |
| No Children | 23 (17.7%) | 0 (0.0%) |
| 1 or 2 Children | 0 (0.0%) | 0 (0.0%) |
| 3 or 4 Children | 0 (0.0%) | 0 (0.0%) |
| 5 or more Children | 0 (0.0%) | 0 (0.0%) |
| Total | 23 (14.7%) | 0 (0.0%) |
Race in Tilghmanton
The most populous races in Tilghmanton are , and White / Caucasian (463 | 100.0%).
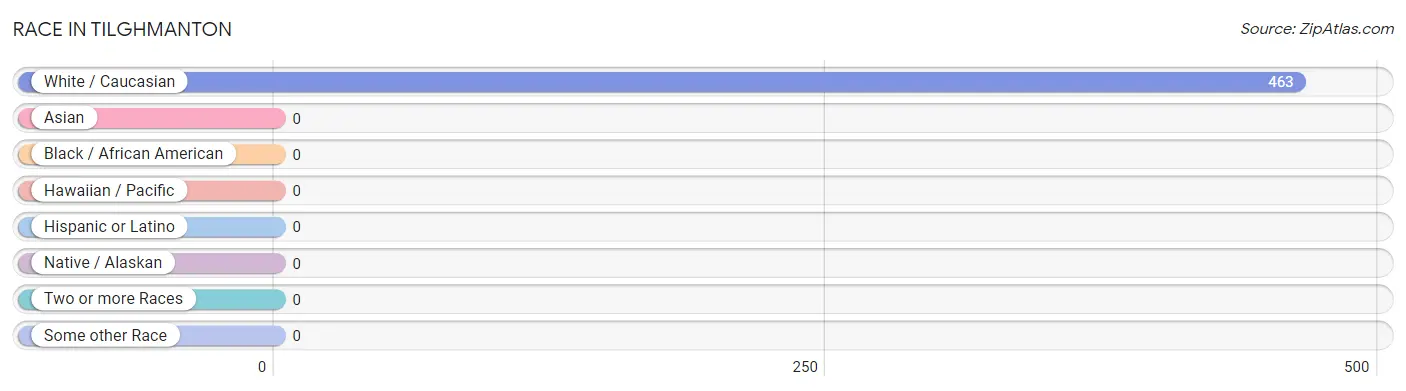
| Race | # Population | % Population |
| Asian | 0 | 0.0% |
| Black / African American | 0 | 0.0% |
| Hawaiian / Pacific | 0 | 0.0% |
| Hispanic or Latino | 0 | 0.0% |
| Native / Alaskan | 0 | 0.0% |
| White / Caucasian | 463 | 100.0% |
| Two or more Races | 0 | 0.0% |
| Some other Race | 0 | 0.0% |
| Total | 463 | 100.0% |
Ancestry in Tilghmanton
The most populous ancestries reported in Tilghmanton are Irish (59 | 12.7%), English (54 | 11.7%), German (37 | 8.0%), Italian (26 | 5.6%), and American (18 | 3.9%), together accounting for 41.9% of all Tilghmanton residents.
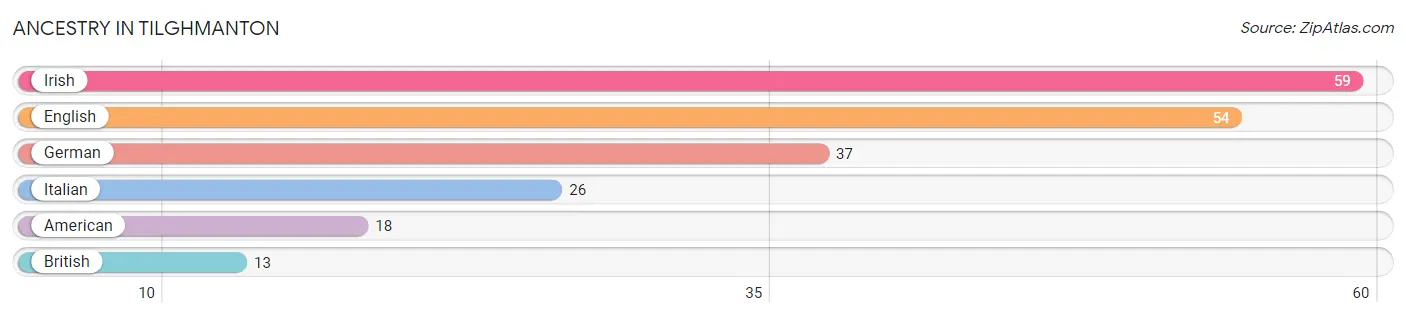
| Ancestry | # Population | % Population |
| American | 18 | 3.9% |
| British | 13 | 2.8% |
| English | 54 | 11.7% |
| German | 37 | 8.0% |
| Irish | 59 | 12.7% |
| Italian | 26 | 5.6% | View All 6 Rows |
Immigrants in Tilghmanton

| Immigration Origin | # Population | % Population | View All 0 Rows |
Sex and Age in Tilghmanton
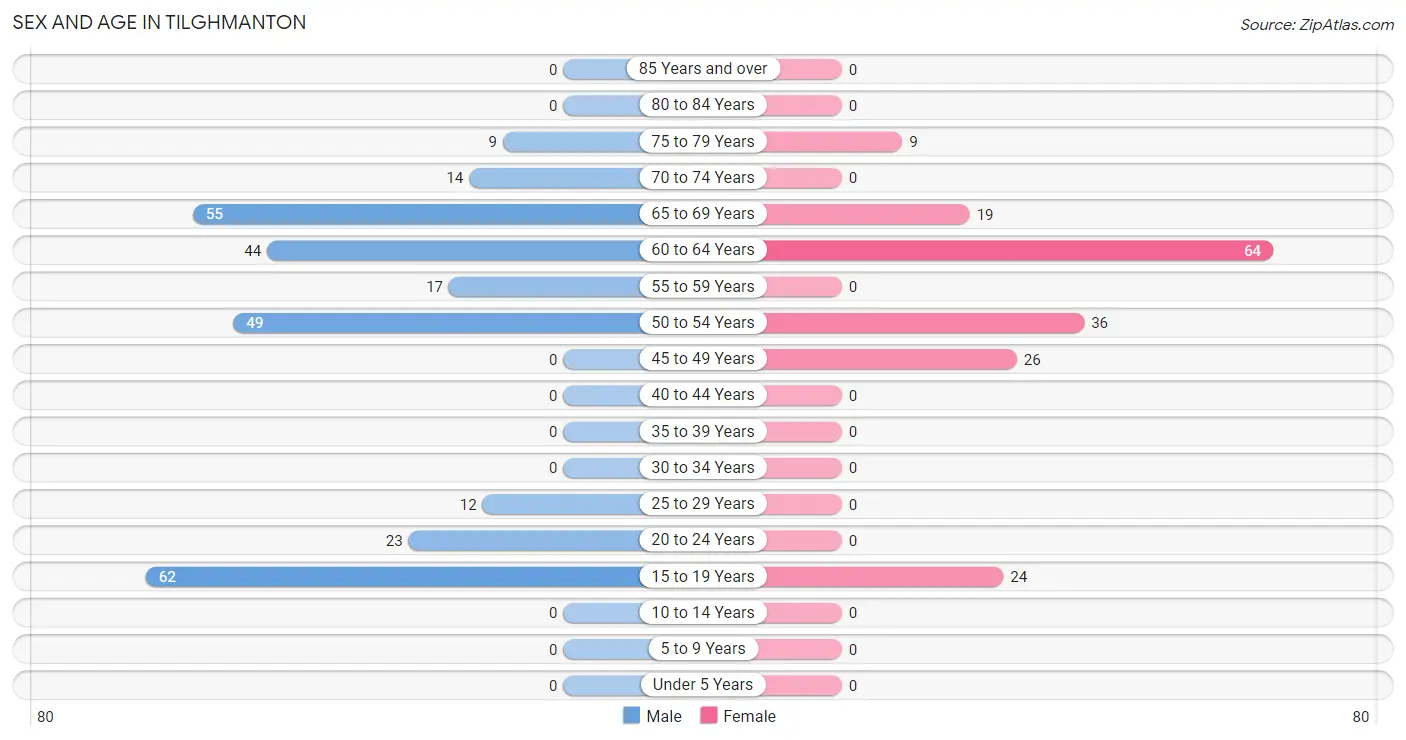
Sex and Age in Tilghmanton
The most populous age groups in Tilghmanton are 15 to 19 Years (62 | 21.7%) for men and 60 to 64 Years (64 | 36.0%) for women.
| Age Bracket | Male | Female |
| Under 5 Years | 0 (0.0%) | 0 (0.0%) |
| 5 to 9 Years | 0 (0.0%) | 0 (0.0%) |
| 10 to 14 Years | 0 (0.0%) | 0 (0.0%) |
| 15 to 19 Years | 62 (21.7%) | 24 (13.5%) |
| 20 to 24 Years | 23 (8.1%) | 0 (0.0%) |
| 25 to 29 Years | 12 (4.2%) | 0 (0.0%) |
| 30 to 34 Years | 0 (0.0%) | 0 (0.0%) |
| 35 to 39 Years | 0 (0.0%) | 0 (0.0%) |
| 40 to 44 Years | 0 (0.0%) | 0 (0.0%) |
| 45 to 49 Years | 0 (0.0%) | 26 (14.6%) |
| 50 to 54 Years | 49 (17.2%) | 36 (20.2%) |
| 55 to 59 Years | 17 (6.0%) | 0 (0.0%) |
| 60 to 64 Years | 44 (15.4%) | 64 (36.0%) |
| 65 to 69 Years | 55 (19.3%) | 19 (10.7%) |
| 70 to 74 Years | 14 (4.9%) | 0 (0.0%) |
| 75 to 79 Years | 9 (3.2%) | 9 (5.1%) |
| 80 to 84 Years | 0 (0.0%) | 0 (0.0%) |
| 85 Years and over | 0 (0.0%) | 0 (0.0%) |
| Total | 285 (100.0%) | 178 (100.0%) |
Families and Households in Tilghmanton
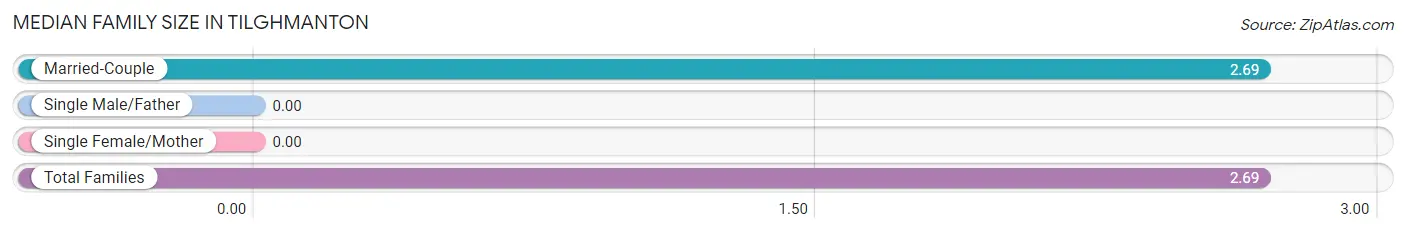
Median Family Size in Tilghmanton
| Family Type | # Families | Family Size |
| Married-Couple | 156 (100.0%) | 2.69 |
| Single Male/Father | 0 (0.0%) | - |
| Single Female/Mother | 0 (0.0%) | - |
| Total Families | 156 (100.0%) | 2.69 |
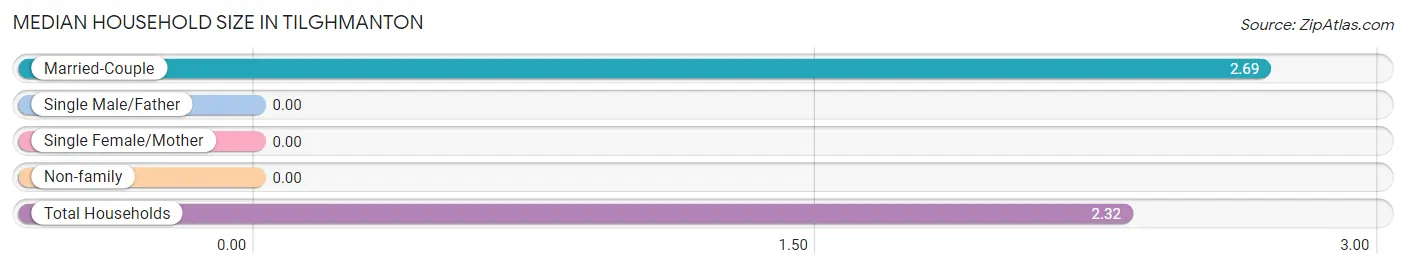
Median Household Size in Tilghmanton
| Household Type | # Households | Household Size |
| Married-Couple | 156 (78.0%) | 2.69 |
| Single Male/Father | 0 (0.0%) | - |
| Single Female/Mother | 0 (0.0%) | - |
| Non-family | 44 (22.0%) | - |
| Total Households | 200 (100.0%) | 2.32 |
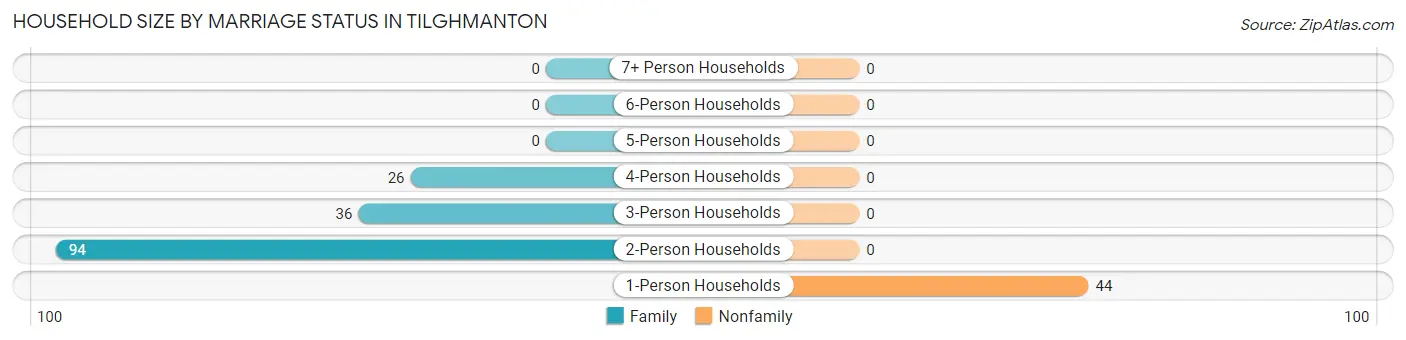
Household Size by Marriage Status in Tilghmanton
Out of a total of 200 households in Tilghmanton, 156 (78.0%) are family households, while 44 (22.0%) are nonfamily households. The most numerous type of family households are 2-person households, comprising 94, and the most common type of nonfamily households are 1-person households, comprising 44.
| Household Size | Family Households | Nonfamily Households |
| 1-Person Households | - | 44 (22.0%) |
| 2-Person Households | 94 (47.0%) | 0 (0.0%) |
| 3-Person Households | 36 (18.0%) | 0 (0.0%) |
| 4-Person Households | 26 (13.0%) | 0 (0.0%) |
| 5-Person Households | 0 (0.0%) | 0 (0.0%) |
| 6-Person Households | 0 (0.0%) | 0 (0.0%) |
| 7+ Person Households | 0 (0.0%) | 0 (0.0%) |
| Total | 156 (78.0%) | 44 (22.0%) |
Female Fertility in Tilghmanton
Fertility by Age in Tilghmanton
| Age Bracket | Women with Births | Births / 1,000 Women |
| 15 to 19 years | 0 (0.0%) | 0.0 |
| 20 to 34 years | 0 (0.0%) | 0.0 |
| 35 to 50 years | 0 (0.0%) | 0.0 |
| Total | 0 (0.0%) | 0.0 |
Fertility by Age by Marriage Status in Tilghmanton
| Age Bracket | Married | Unmarried |
| 15 to 19 years | 0 (0.0%) | 0 (0.0%) |
| 20 to 34 years | 0 (0.0%) | 0 (0.0%) |
| 35 to 50 years | 0 (0.0%) | 0 (0.0%) |
| Total | 0 (0.0%) | 0 (0.0%) |
Fertility by Education in Tilghmanton
| Educational Attainment | Women with Births | Births / 1,000 Women |
| Less than High School | 0 (0.0%) | 0.0 |
| High School Diploma | 0 (0.0%) | 0.0 |
| College or Associate's Degree | 0 (0.0%) | 0.0 |
| Bachelor's Degree | 0 (0.0%) | 0.0 |
| Graduate Degree | 0 (0.0%) | 0.0 |
| Total | 0 (0.0%) | 0.0 |
Fertility by Education by Marriage Status in Tilghmanton
| Educational Attainment | Married | Unmarried |
| Less than High School | 0 (0.0%) | 0 (0.0%) |
| High School Diploma | 0 (0.0%) | 0 (0.0%) |
| College or Associate's Degree | 0 (0.0%) | 0 (0.0%) |
| Bachelor's Degree | 0 (0.0%) | 0 (0.0%) |
| Graduate Degree | 0 (0.0%) | 0 (0.0%) |
| Total | 0 (0.0%) | 0 (0.0%) |
Employment Characteristics in Tilghmanton
Employment by Class of Employer in Tilghmanton
Among the 140 employed individuals in Tilghmanton, private company employees (131 | 93.6%), and not-for-profit organizations (9 | 6.4%) make up the most common classes of employment.
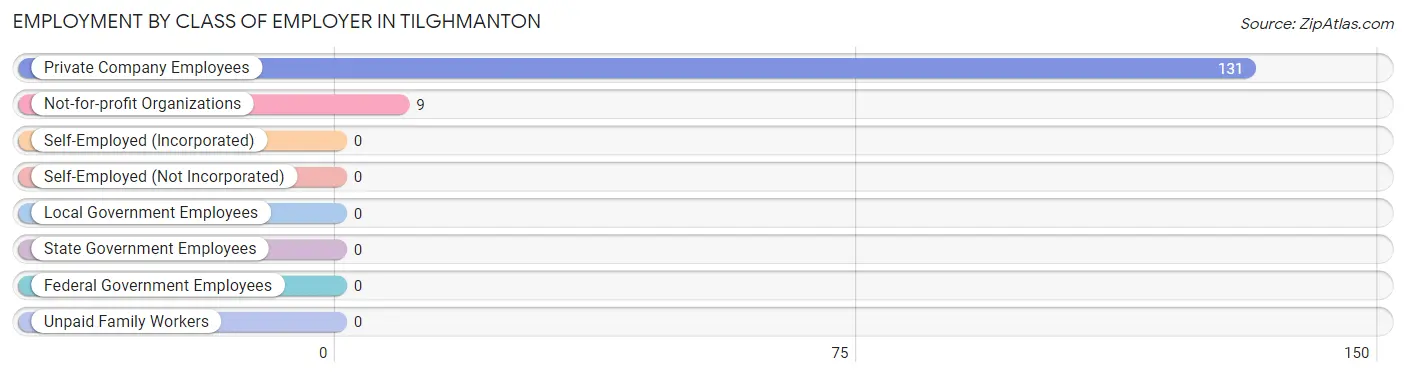
| Employer Class | # Employees | % Employees |
| Private Company Employees | 131 | 93.6% |
| Self-Employed (Incorporated) | 0 | 0.0% |
| Self-Employed (Not Incorporated) | 0 | 0.0% |
| Not-for-profit Organizations | 9 | 6.4% |
| Local Government Employees | 0 | 0.0% |
| State Government Employees | 0 | 0.0% |
| Federal Government Employees | 0 | 0.0% |
| Unpaid Family Workers | 0 | 0.0% |
| Total | 140 | 100.0% |
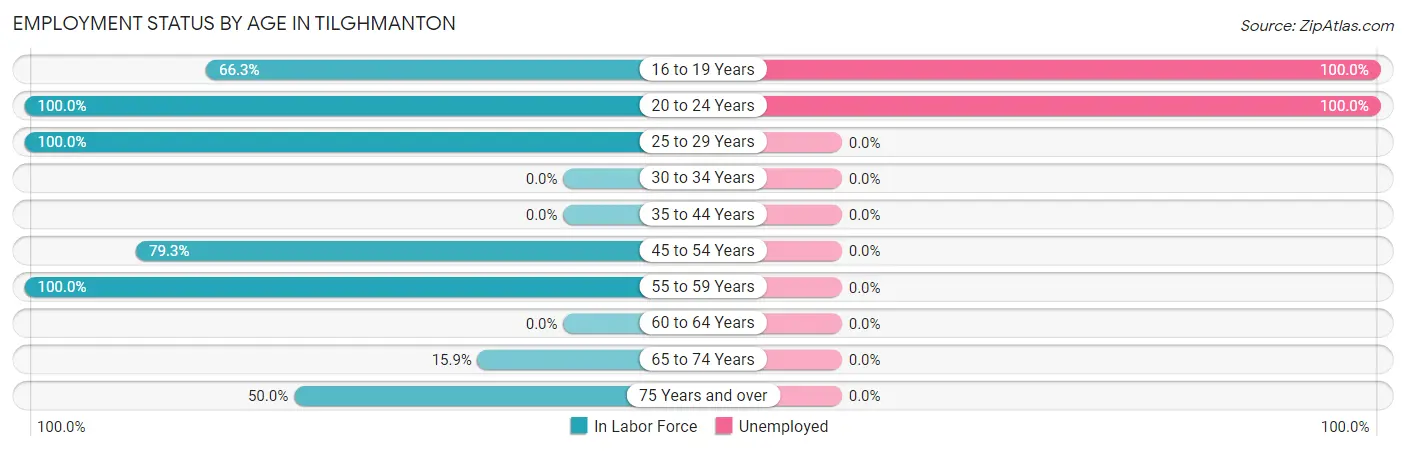
Employment Status by Age in Tilghmanton
According to the labor force statistics for Tilghmanton, out of the total population over 16 years of age (463), 47.5% or 220 individuals are in the labor force, with 36.4% or 80 of them unemployed. The age group with the highest labor force participation rate is 20 to 24 years, with 100.0% or 23 individuals in the labor force. Within the labor force, the 16 to 19 years age range has the highest percentage of unemployed individuals, with 100.0% or 57 of them being unemployed.
| Age Bracket | In Labor Force | Unemployed |
| 16 to 19 Years | 57 (66.3%) | 57 (100.0%) |
| 20 to 24 Years | 23 (100.0%) | 23 (100.0%) |
| 25 to 29 Years | 12 (100.0%) | 0 (0.0%) |
| 30 to 34 Years | 0 (0.0%) | 0 (0.0%) |
| 35 to 44 Years | 0 (0.0%) | 0 (0.0%) |
| 45 to 54 Years | 88 (79.3%) | 0 (0.0%) |
| 55 to 59 Years | 17 (100.0%) | 0 (0.0%) |
| 60 to 64 Years | 0 (0.0%) | 0 (0.0%) |
| 65 to 74 Years | 14 (15.9%) | 0 (0.0%) |
| 75 Years and over | 9 (50.0%) | 0 (0.0%) |
| Total | 220 (47.5%) | 80 (36.4%) |
Employment Status by Educational Attainment in Tilghmanton
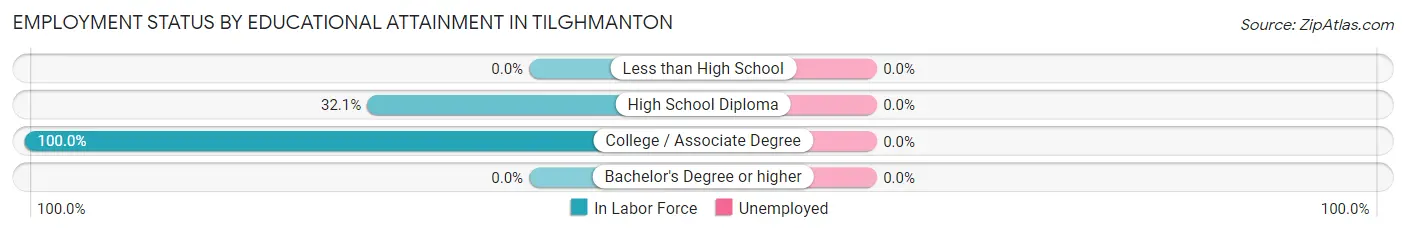
| Educational Attainment | In Labor Force | Unemployed |
| Less than High School | 0 (0.0%) | 0 (0.0%) |
| High School Diploma | 62 (32.1%) | 0 (0.0%) |
| College / Associate Degree | 55 (100.0%) | 0 (0.0%) |
| Bachelor's Degree or higher | 0 (0.0%) | 0 (0.0%) |
| Total | 117 (47.2%) | 0 (0.0%) |
Employment Occupations by Sex in Tilghmanton
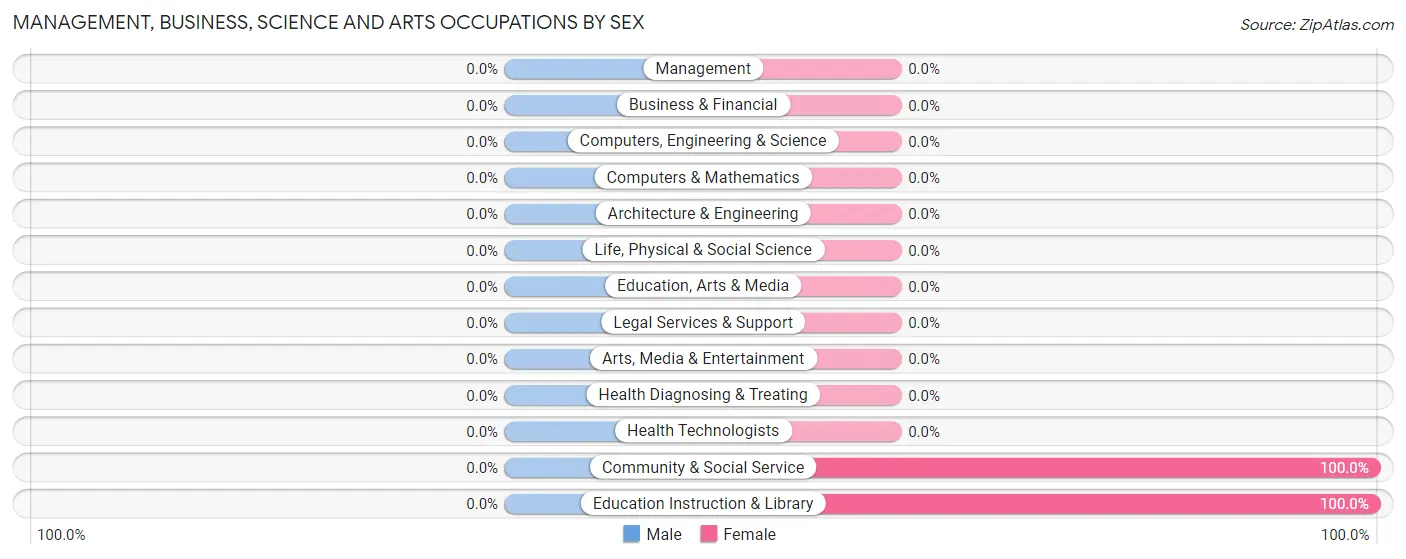
Management, Business, Science and Arts Occupations
The most common Management, Business, Science and Arts occupations in Tilghmanton are Community & Social Service (9 | 6.4%), and Education Instruction & Library (9 | 6.4%).
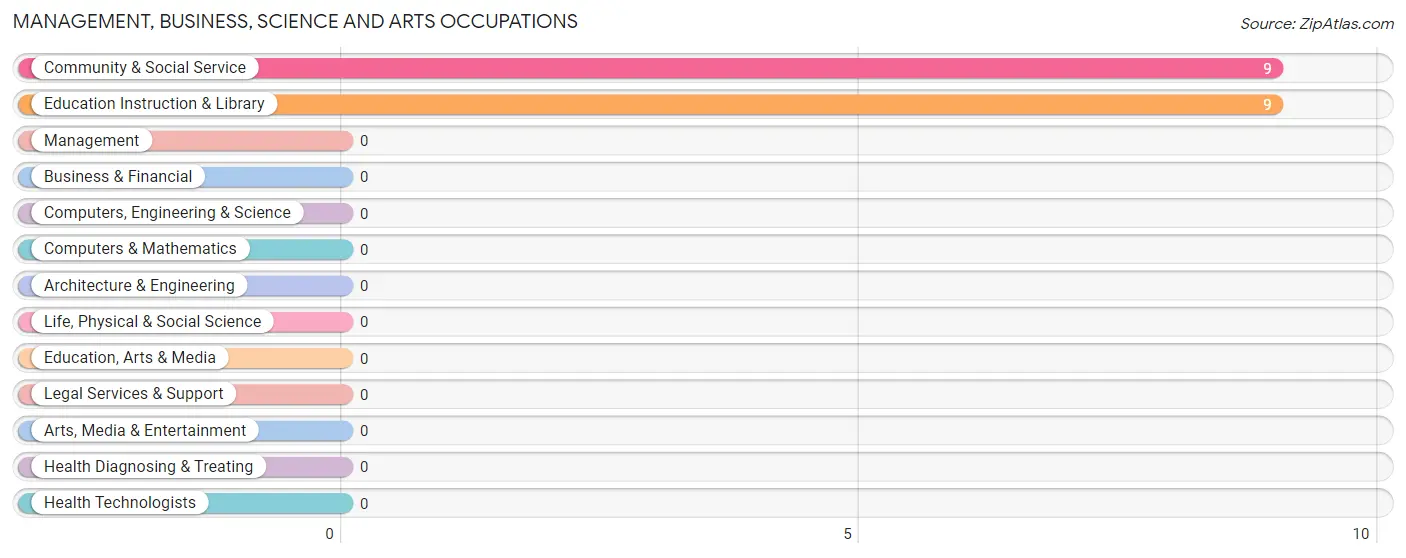
Management, Business, Science and Arts Occupations by Sex
| Occupation | Male | Female |
| Management | 0 (0.0%) | 0 (0.0%) |
| Business & Financial | 0 (0.0%) | 0 (0.0%) |
| Computers, Engineering & Science | 0 (0.0%) | 0 (0.0%) |
| Computers & Mathematics | 0 (0.0%) | 0 (0.0%) |
| Architecture & Engineering | 0 (0.0%) | 0 (0.0%) |
| Life, Physical & Social Science | 0 (0.0%) | 0 (0.0%) |
| Community & Social Service | 0 (0.0%) | 9 (100.0%) |
| Education, Arts & Media | 0 (0.0%) | 0 (0.0%) |
| Legal Services & Support | 0 (0.0%) | 0 (0.0%) |
| Education Instruction & Library | 0 (0.0%) | 9 (100.0%) |
| Arts, Media & Entertainment | 0 (0.0%) | 0 (0.0%) |
| Health Diagnosing & Treating | 0 (0.0%) | 0 (0.0%) |
| Health Technologists | 0 (0.0%) | 0 (0.0%) |
| Total (Category) | 0 (0.0%) | 9 (100.0%) |
| Total (Overall) | 92 (65.7%) | 48 (34.3%) |
Services Occupations
Services Occupations by Sex
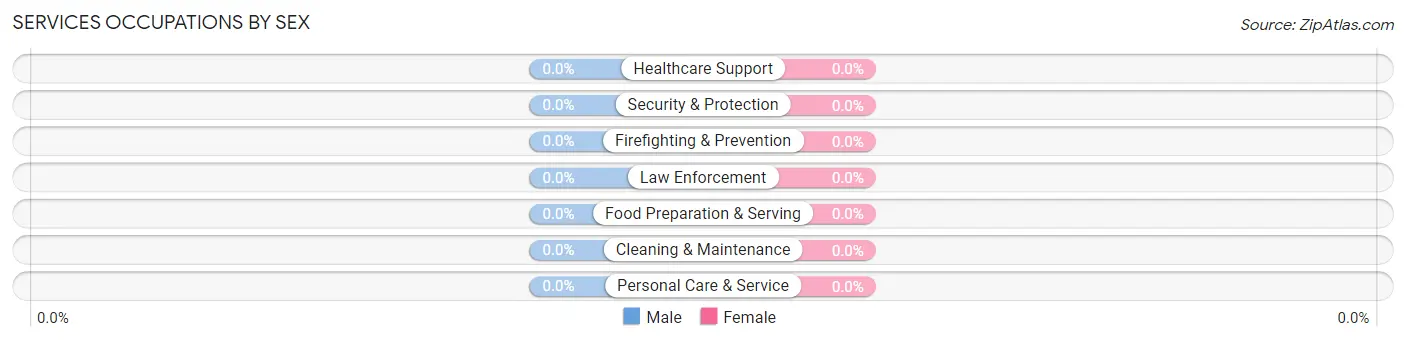
| Occupation | Male | Female |
| Healthcare Support | 0 (0.0%) | 0 (0.0%) |
| Security & Protection | 0 (0.0%) | 0 (0.0%) |
| Firefighting & Prevention | 0 (0.0%) | 0 (0.0%) |
| Law Enforcement | 0 (0.0%) | 0 (0.0%) |
| Food Preparation & Serving | 0 (0.0%) | 0 (0.0%) |
| Cleaning & Maintenance | 0 (0.0%) | 0 (0.0%) |
| Personal Care & Service | 0 (0.0%) | 0 (0.0%) |
| Total (Category) | 0 (0.0%) | 0 (0.0%) |
| Total (Overall) | 92 (65.7%) | 48 (34.3%) |
Sales and Office Occupations
The most common Sales and Office occupations in Tilghmanton are , and Office & Administration (29 | 20.7%).
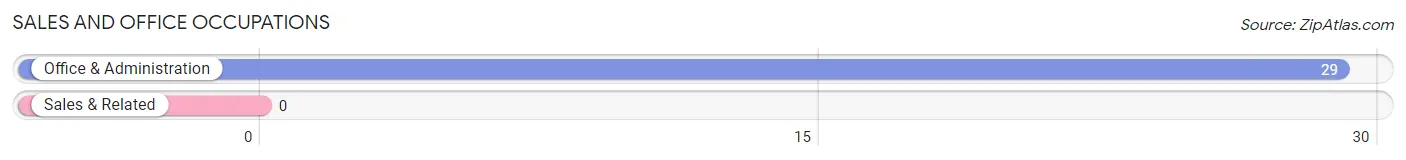
Sales and Office Occupations by Sex
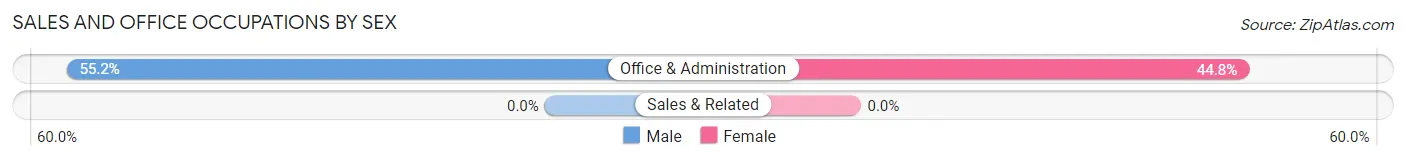
| Occupation | Male | Female |
| Sales & Related | 0 (0.0%) | 0 (0.0%) |
| Office & Administration | 16 (55.2%) | 13 (44.8%) |
| Total (Category) | 16 (55.2%) | 13 (44.8%) |
| Total (Overall) | 92 (65.7%) | 48 (34.3%) |
Natural Resources, Construction and Maintenance Occupations
The most common Natural Resources, Construction and Maintenance occupations in Tilghmanton are , and Construction & Extraction (12 | 8.6%).
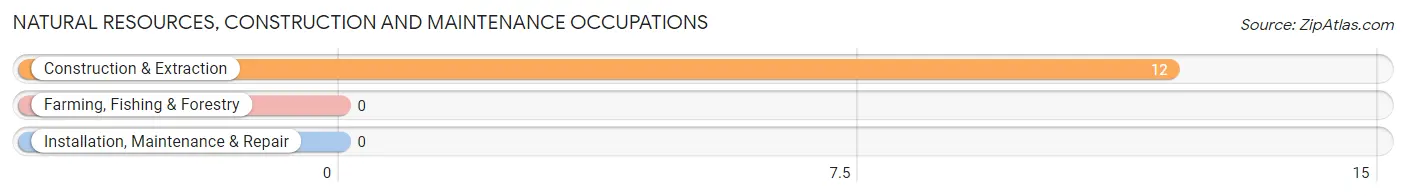
Natural Resources, Construction and Maintenance Occupations by Sex
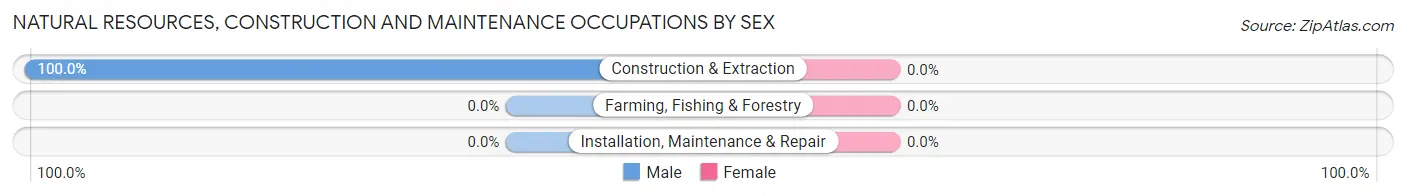
| Occupation | Male | Female |
| Farming, Fishing & Forestry | 0 (0.0%) | 0 (0.0%) |
| Construction & Extraction | 12 (100.0%) | 0 (0.0%) |
| Installation, Maintenance & Repair | 0 (0.0%) | 0 (0.0%) |
| Total (Category) | 12 (100.0%) | 0 (0.0%) |
| Total (Overall) | 92 (65.7%) | 48 (34.3%) |
Production, Transportation and Moving Occupations
The most common Production, Transportation and Moving occupations in Tilghmanton are Transportation (47 | 33.6%), Production (26 | 18.6%), and Material Moving (17 | 12.1%).
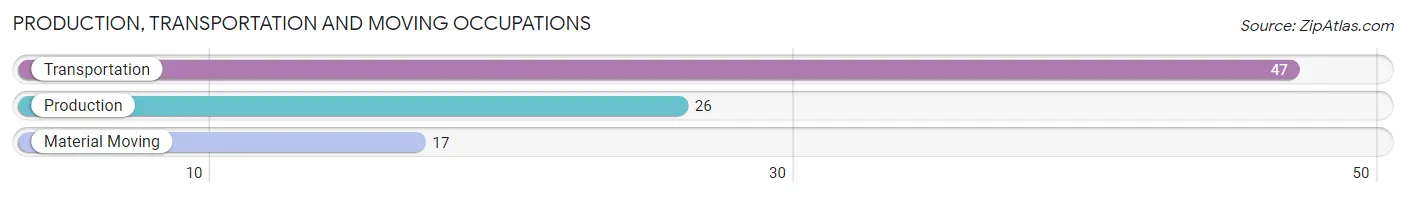
Production, Transportation and Moving Occupations by Sex
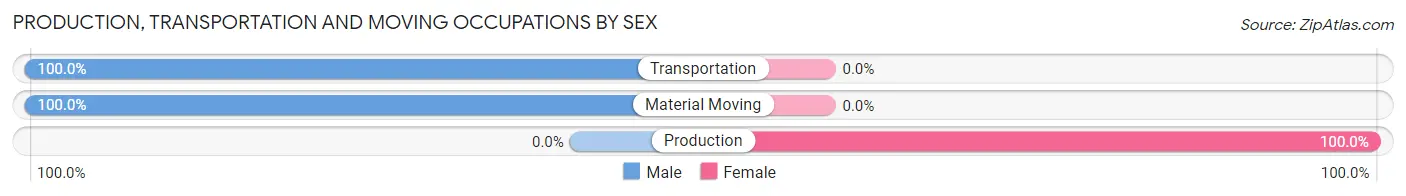
| Occupation | Male | Female |
| Production | 0 (0.0%) | 26 (100.0%) |
| Transportation | 47 (100.0%) | 0 (0.0%) |
| Material Moving | 17 (100.0%) | 0 (0.0%) |
| Total (Category) | 64 (71.1%) | 26 (28.9%) |
| Total (Overall) | 92 (65.7%) | 48 (34.3%) |
Employment Industries by Sex in Tilghmanton
Employment Industries in Tilghmanton
The major employment industries in Tilghmanton include Retail Trade (49 | 35.0%), Educational Services (35 | 25.0%), Manufacturing (17 | 12.1%), Wholesale Trade (14 | 10.0%), and Finance & Insurance (13 | 9.3%).
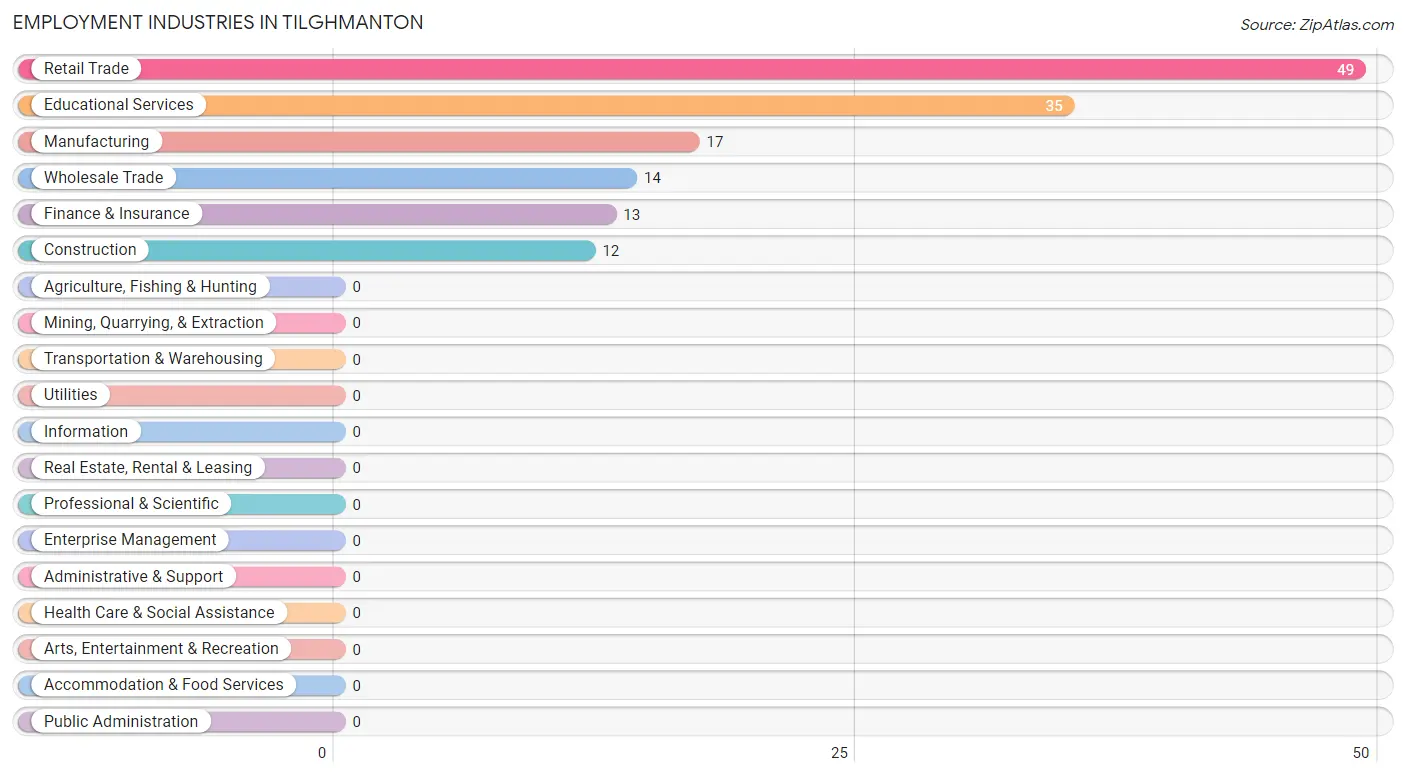
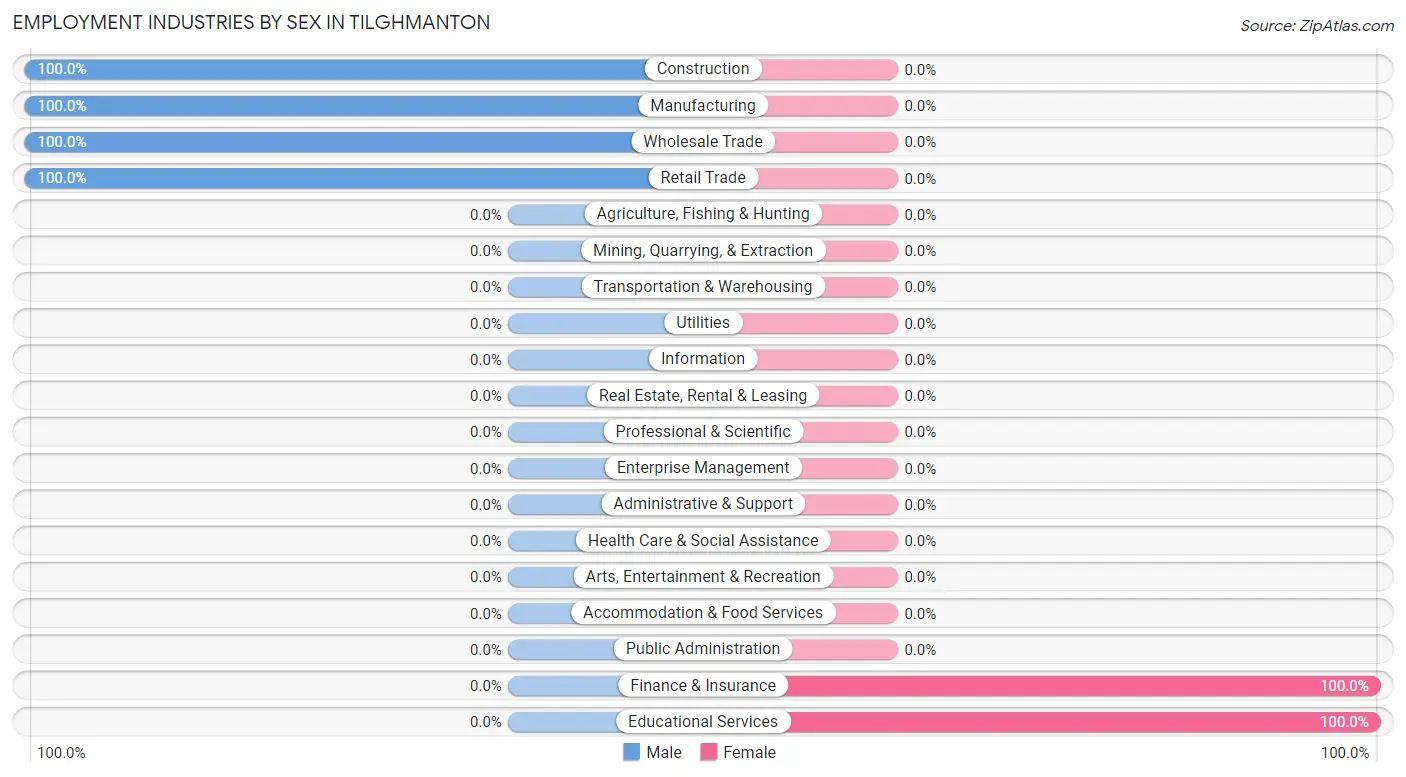
Employment Industries by Sex in Tilghmanton
The Tilghmanton industries that see more men than women are Construction (100.0%), Manufacturing (100.0%), and Wholesale Trade (100.0%), whereas the industries that tend to have a higher number of women are Finance & Insurance (100.0%), and Educational Services (100.0%).
| Industry | Male | Female |
| Agriculture, Fishing & Hunting | 0 (0.0%) | 0 (0.0%) |
| Mining, Quarrying, & Extraction | 0 (0.0%) | 0 (0.0%) |
| Construction | 12 (100.0%) | 0 (0.0%) |
| Manufacturing | 17 (100.0%) | 0 (0.0%) |
| Wholesale Trade | 14 (100.0%) | 0 (0.0%) |
| Retail Trade | 49 (100.0%) | 0 (0.0%) |
| Transportation & Warehousing | 0 (0.0%) | 0 (0.0%) |
| Utilities | 0 (0.0%) | 0 (0.0%) |
| Information | 0 (0.0%) | 0 (0.0%) |
| Finance & Insurance | 0 (0.0%) | 13 (100.0%) |
| Real Estate, Rental & Leasing | 0 (0.0%) | 0 (0.0%) |
| Professional & Scientific | 0 (0.0%) | 0 (0.0%) |
| Enterprise Management | 0 (0.0%) | 0 (0.0%) |
| Administrative & Support | 0 (0.0%) | 0 (0.0%) |
| Educational Services | 0 (0.0%) | 35 (100.0%) |
| Health Care & Social Assistance | 0 (0.0%) | 0 (0.0%) |
| Arts, Entertainment & Recreation | 0 (0.0%) | 0 (0.0%) |
| Accommodation & Food Services | 0 (0.0%) | 0 (0.0%) |
| Public Administration | 0 (0.0%) | 0 (0.0%) |
| Total | 92 (65.7%) | 48 (34.3%) |
Education in Tilghmanton
School Enrollment in Tilghmanton
The most common levels of schooling among the 69 students in Tilghmanton are high school (57 | 82.6%), and college / undergraduate (12 | 17.4%).
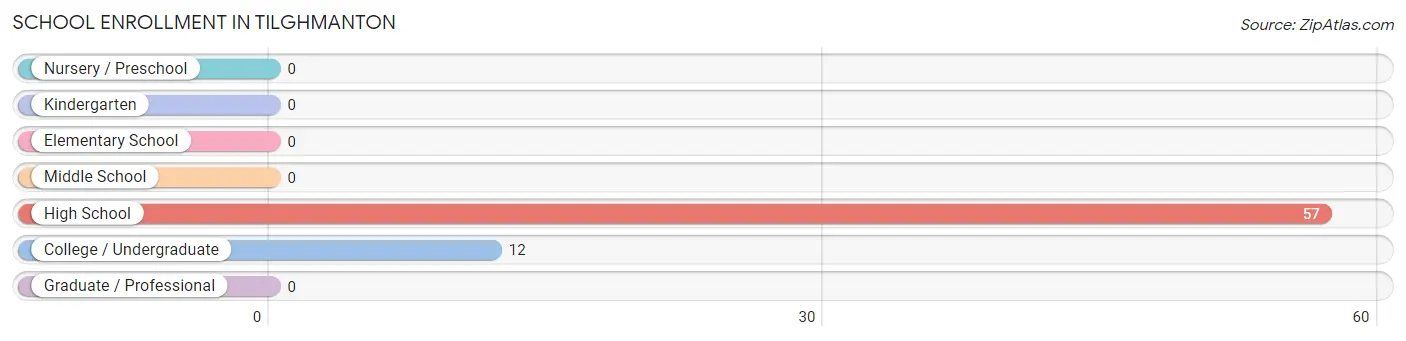
| School Level | # Students | % Students |
| Nursery / Preschool | 0 | 0.0% |
| Kindergarten | 0 | 0.0% |
| Elementary School | 0 | 0.0% |
| Middle School | 0 | 0.0% |
| High School | 57 | 82.6% |
| College / Undergraduate | 12 | 17.4% |
| Graduate / Professional | 0 | 0.0% |
| Total | 69 | 100.0% |
School Enrollment by Age by Funding Source in Tilghmanton
Out of a total of 69 students who are enrolled in schools in Tilghmanton, 12 (17.4%) attend a private institution, while the remaining 57 (82.6%) are enrolled in public schools. The age group of 25 to 34 year olds has the highest likelihood of being enrolled in private schools, with 12 (100.0% in the age bracket) enrolled. Conversely, the age group of 15 to 17 year olds has the lowest likelihood of being enrolled in a private school, with 57 (100.0% in the age bracket) attending a public institution.
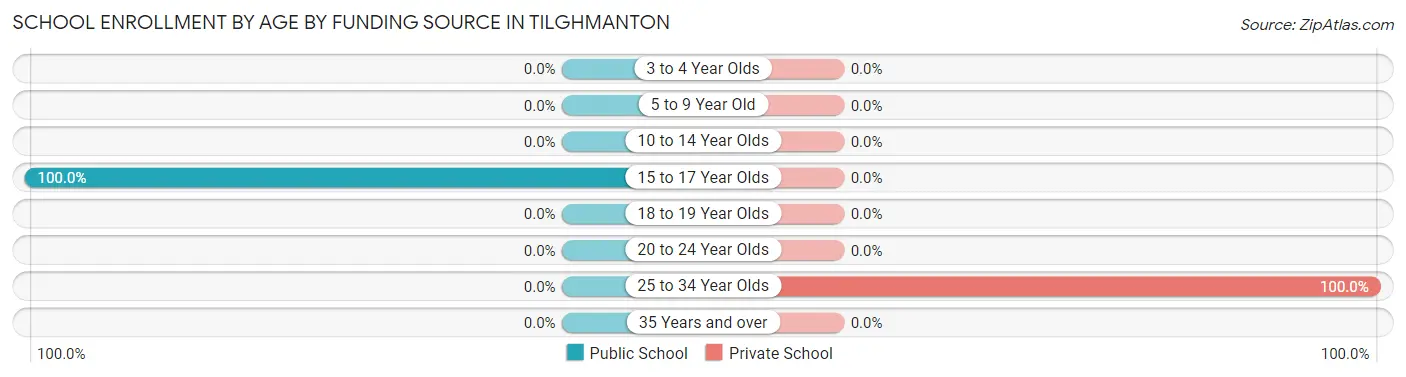
| Age Bracket | Public School | Private School |
| 3 to 4 Year Olds | 0 (0.0%) | 0 (0.0%) |
| 5 to 9 Year Old | 0 (0.0%) | 0 (0.0%) |
| 10 to 14 Year Olds | 0 (0.0%) | 0 (0.0%) |
| 15 to 17 Year Olds | 57 (100.0%) | 0 (0.0%) |
| 18 to 19 Year Olds | 0 (0.0%) | 0 (0.0%) |
| 20 to 24 Year Olds | 0 (0.0%) | 0 (0.0%) |
| 25 to 34 Year Olds | 0 (0.0%) | 12 (100.0%) |
| 35 Years and over | 0 (0.0%) | 0 (0.0%) |
| Total | 57 (82.6%) | 12 (17.4%) |
Educational Attainment by Field of Study in Tilghmanton
Computers & mathematics (9 | 50.0%), and bio, nature & agricultural (9 | 50.0%) are the most common fields of study among 18 individuals in Tilghmanton who have obtained a bachelor's degree or higher.
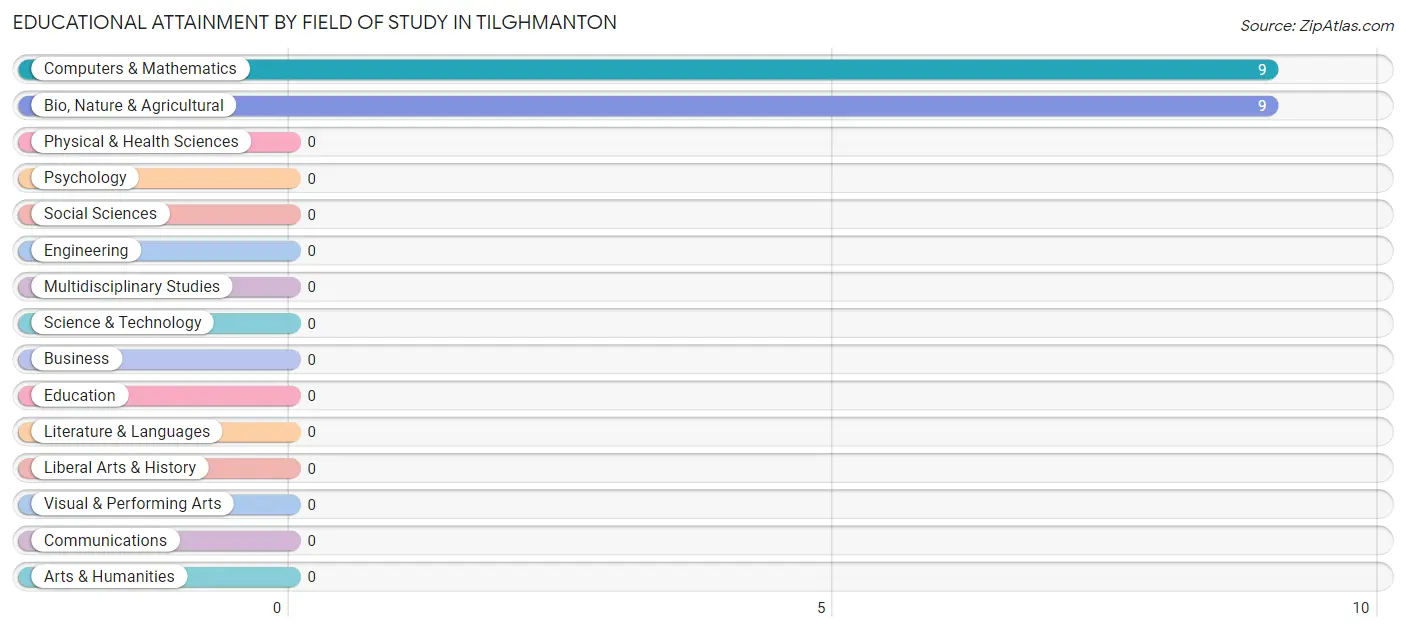
| Field of Study | # Graduates | % Graduates |
| Computers & Mathematics | 9 | 50.0% |
| Bio, Nature & Agricultural | 9 | 50.0% |
| Physical & Health Sciences | 0 | 0.0% |
| Psychology | 0 | 0.0% |
| Social Sciences | 0 | 0.0% |
| Engineering | 0 | 0.0% |
| Multidisciplinary Studies | 0 | 0.0% |
| Science & Technology | 0 | 0.0% |
| Business | 0 | 0.0% |
| Education | 0 | 0.0% |
| Literature & Languages | 0 | 0.0% |
| Liberal Arts & History | 0 | 0.0% |
| Visual & Performing Arts | 0 | 0.0% |
| Communications | 0 | 0.0% |
| Arts & Humanities | 0 | 0.0% |
| Total | 18 | 100.0% |
Transportation & Commute in Tilghmanton
Vehicle Availability by Sex in Tilghmanton
The most prevalent vehicle ownership categories in Tilghmanton are males with 2 vehicles (50, accounting for 54.3%) and females with 2 vehicles (26, making up 104.2%).
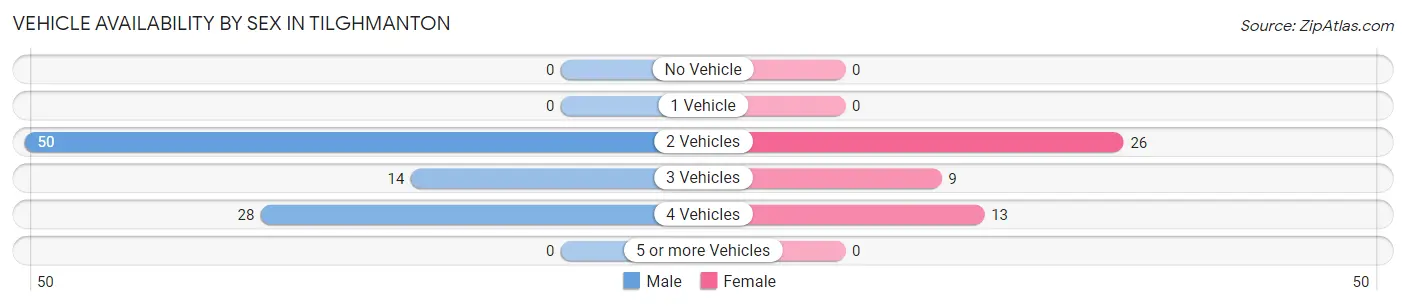
| Vehicles Available | Male | Female |
| No Vehicle | 0 (0.0%) | 0 (0.0%) |
| 1 Vehicle | 0 (0.0%) | 0 (0.0%) |
| 2 Vehicles | 50 (54.3%) | 26 (54.2%) |
| 3 Vehicles | 14 (15.2%) | 9 (18.8%) |
| 4 Vehicles | 28 (30.4%) | 13 (27.1%) |
| 5 or more Vehicles | 0 (0.0%) | 0 (0.0%) |
| Total | 92 (100.0%) | 48 (100.0%) |
Commute Time in Tilghmanton
The most frequently occuring commute durations in Tilghmanton are 40 to 44 minutes (71 commuters, 50.7%), 30 to 34 minutes (31 commuters, 22.1%), and 20 to 24 minutes (22 commuters, 15.7%).
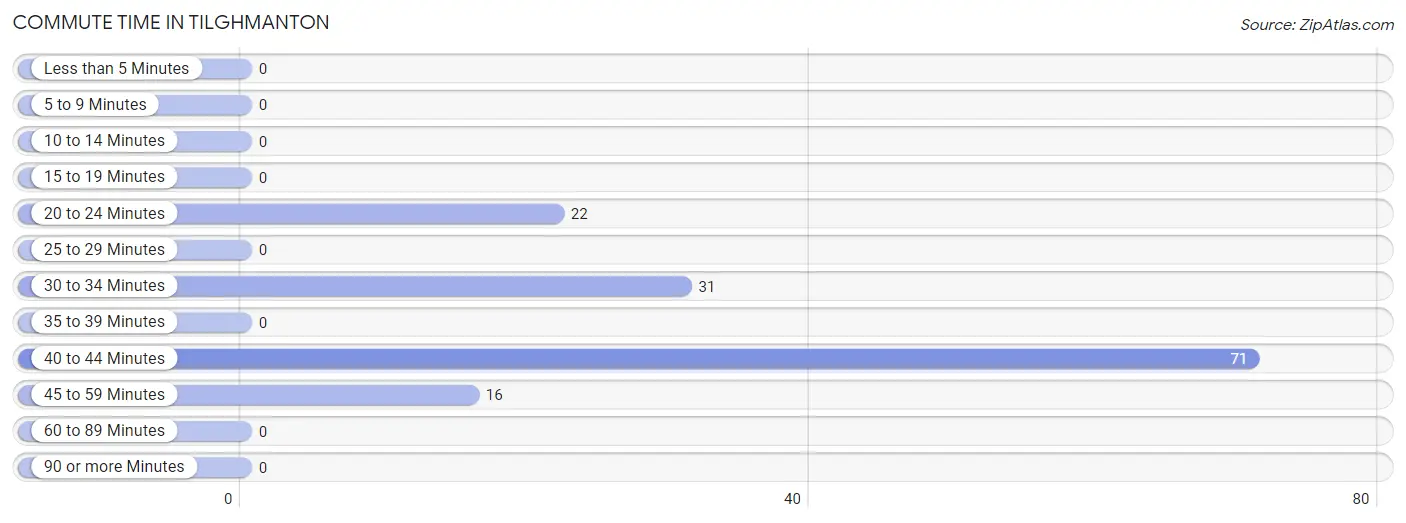
| Commute Time | # Commuters | % Commuters |
| Less than 5 Minutes | 0 | 0.0% |
| 5 to 9 Minutes | 0 | 0.0% |
| 10 to 14 Minutes | 0 | 0.0% |
| 15 to 19 Minutes | 0 | 0.0% |
| 20 to 24 Minutes | 22 | 15.7% |
| 25 to 29 Minutes | 0 | 0.0% |
| 30 to 34 Minutes | 31 | 22.1% |
| 35 to 39 Minutes | 0 | 0.0% |
| 40 to 44 Minutes | 71 | 50.7% |
| 45 to 59 Minutes | 16 | 11.4% |
| 60 to 89 Minutes | 0 | 0.0% |
| 90 or more Minutes | 0 | 0.0% |
Commute Time by Sex in Tilghmanton
The most common commute times in Tilghmanton are 40 to 44 minutes (45 commuters, 48.9%) for males and 40 to 44 minutes (26 commuters, 54.2%) for females.
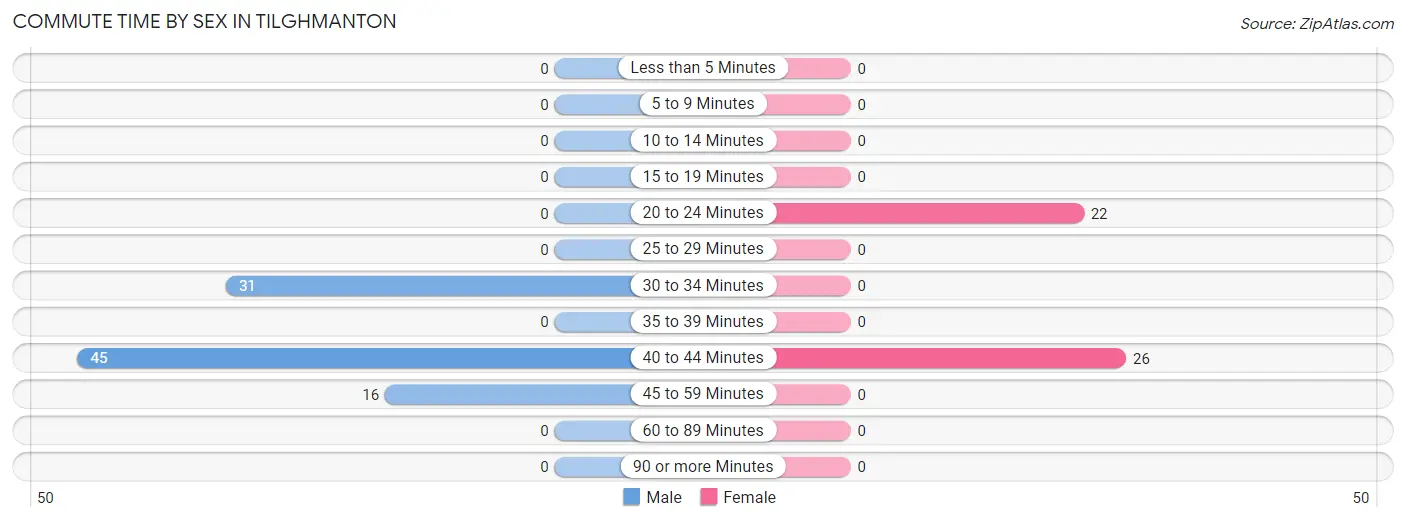
| Commute Time | Male | Female |
| Less than 5 Minutes | 0 (0.0%) | 0 (0.0%) |
| 5 to 9 Minutes | 0 (0.0%) | 0 (0.0%) |
| 10 to 14 Minutes | 0 (0.0%) | 0 (0.0%) |
| 15 to 19 Minutes | 0 (0.0%) | 0 (0.0%) |
| 20 to 24 Minutes | 0 (0.0%) | 22 (45.8%) |
| 25 to 29 Minutes | 0 (0.0%) | 0 (0.0%) |
| 30 to 34 Minutes | 31 (33.7%) | 0 (0.0%) |
| 35 to 39 Minutes | 0 (0.0%) | 0 (0.0%) |
| 40 to 44 Minutes | 45 (48.9%) | 26 (54.2%) |
| 45 to 59 Minutes | 16 (17.4%) | 0 (0.0%) |
| 60 to 89 Minutes | 0 (0.0%) | 0 (0.0%) |
| 90 or more Minutes | 0 (0.0%) | 0 (0.0%) |
Time of Departure to Work by Sex in Tilghmanton
The most frequent times of departure to work in Tilghmanton are 5:00 AM to 5:29 AM (33, 35.9%) for males and 7:30 AM to 7:59 AM (26, 54.2%) for females.
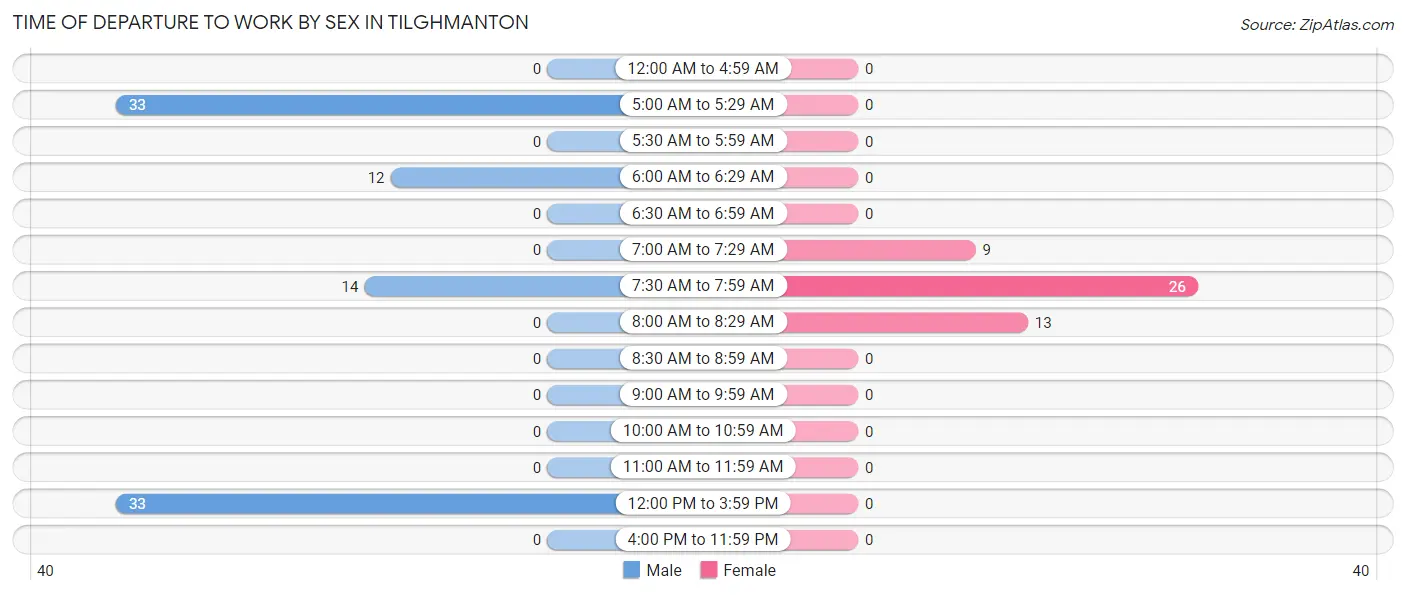
| Time of Departure | Male | Female |
| 12:00 AM to 4:59 AM | 0 (0.0%) | 0 (0.0%) |
| 5:00 AM to 5:29 AM | 33 (35.9%) | 0 (0.0%) |
| 5:30 AM to 5:59 AM | 0 (0.0%) | 0 (0.0%) |
| 6:00 AM to 6:29 AM | 12 (13.0%) | 0 (0.0%) |
| 6:30 AM to 6:59 AM | 0 (0.0%) | 0 (0.0%) |
| 7:00 AM to 7:29 AM | 0 (0.0%) | 9 (18.8%) |
| 7:30 AM to 7:59 AM | 14 (15.2%) | 26 (54.2%) |
| 8:00 AM to 8:29 AM | 0 (0.0%) | 13 (27.1%) |
| 8:30 AM to 8:59 AM | 0 (0.0%) | 0 (0.0%) |
| 9:00 AM to 9:59 AM | 0 (0.0%) | 0 (0.0%) |
| 10:00 AM to 10:59 AM | 0 (0.0%) | 0 (0.0%) |
| 11:00 AM to 11:59 AM | 0 (0.0%) | 0 (0.0%) |
| 12:00 PM to 3:59 PM | 33 (35.9%) | 0 (0.0%) |
| 4:00 PM to 11:59 PM | 0 (0.0%) | 0 (0.0%) |
| Total | 92 (100.0%) | 48 (100.0%) |
Housing Occupancy in Tilghmanton
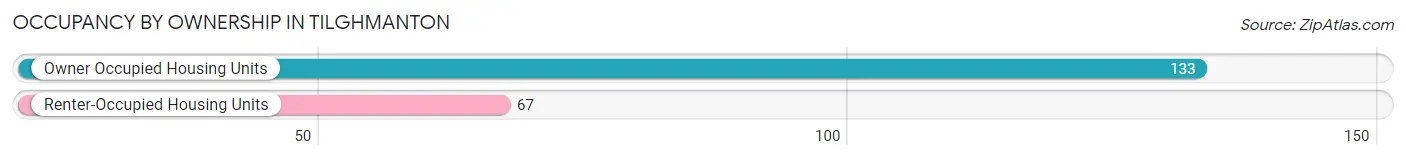
Occupancy by Ownership in Tilghmanton
Of the total 200 dwellings in Tilghmanton, owner-occupied units account for 133 (66.5%), while renter-occupied units make up 67 (33.5%).
| Occupancy | # Housing Units | % Housing Units |
| Owner Occupied Housing Units | 133 | 66.5% |
| Renter-Occupied Housing Units | 67 | 33.5% |
| Total Occupied Housing Units | 200 | 100.0% |
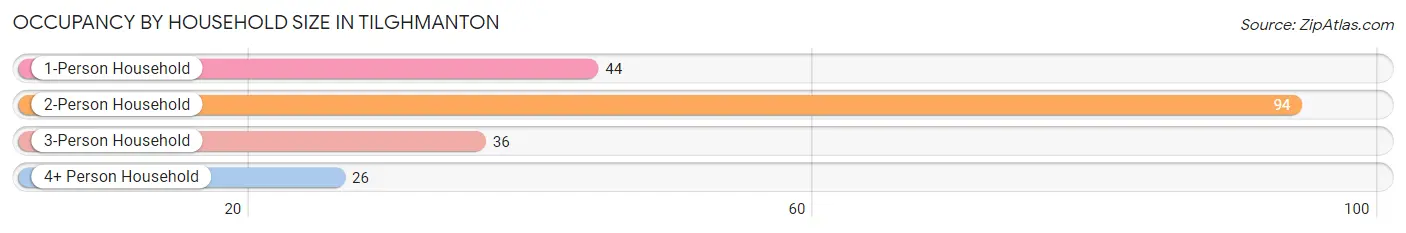
Occupancy by Household Size in Tilghmanton
| Household Size | # Housing Units | % Housing Units |
| 1-Person Household | 44 | 22.0% |
| 2-Person Household | 94 | 47.0% |
| 3-Person Household | 36 | 18.0% |
| 4+ Person Household | 26 | 13.0% |
| Total Housing Units | 200 | 100.0% |
Occupancy by Ownership by Household Size in Tilghmanton
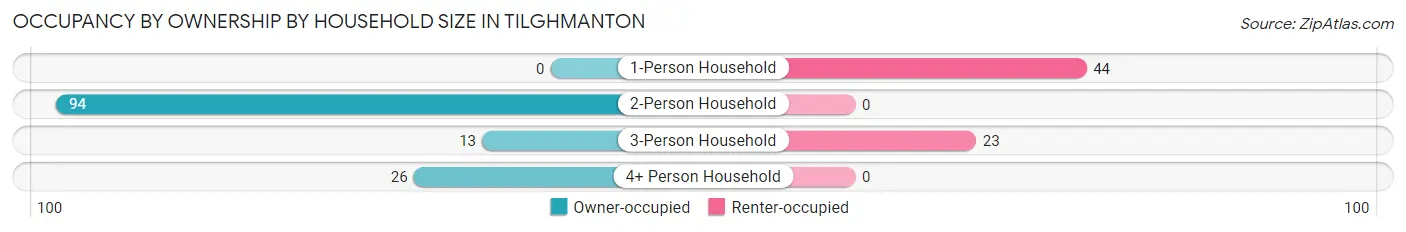
| Household Size | Owner-occupied | Renter-occupied |
| 1-Person Household | 0 (0.0%) | 44 (100.0%) |
| 2-Person Household | 94 (100.0%) | 0 (0.0%) |
| 3-Person Household | 13 (36.1%) | 23 (63.9%) |
| 4+ Person Household | 26 (100.0%) | 0 (0.0%) |
| Total Housing Units | 133 (66.5%) | 67 (33.5%) |
Occupancy by Educational Attainment in Tilghmanton
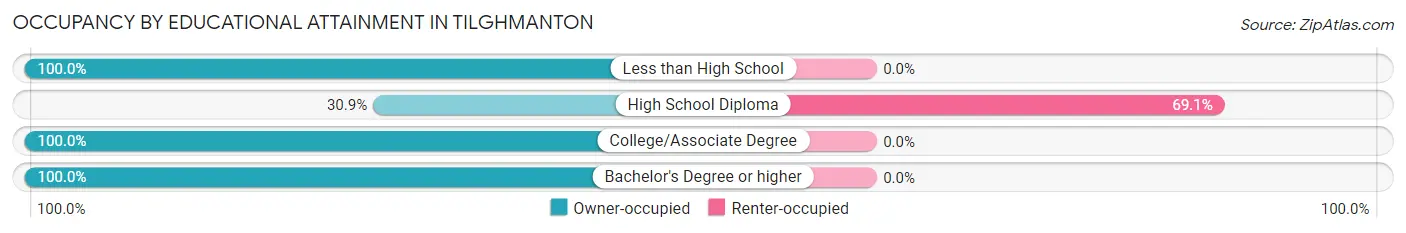
| Household Size | Owner-occupied | Renter-occupied |
| Less than High School | 55 (100.0%) | 0 (0.0%) |
| High School Diploma | 30 (30.9%) | 67 (69.1%) |
| College/Associate Degree | 39 (100.0%) | 0 (0.0%) |
| Bachelor's Degree or higher | 9 (100.0%) | 0 (0.0%) |
Occupancy by Age of Householder in Tilghmanton
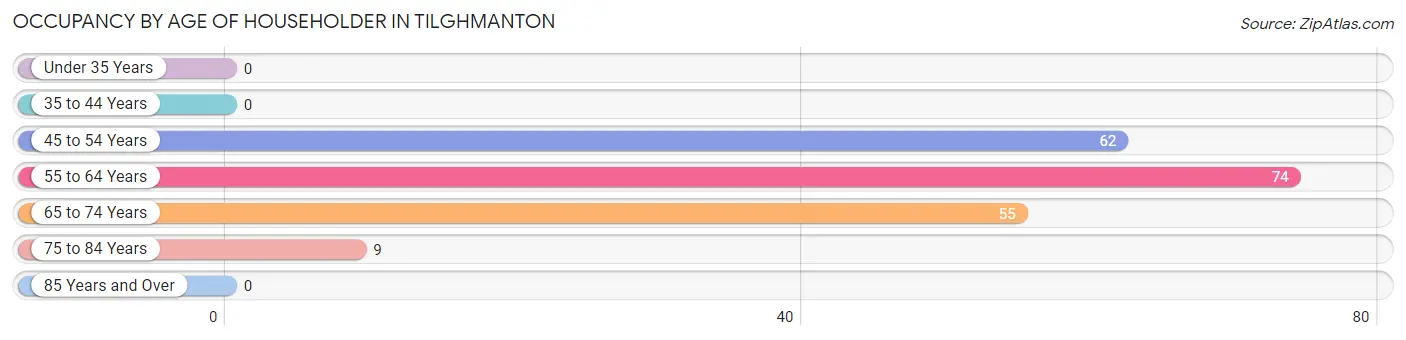
| Age Bracket | # Households | % Households |
| Under 35 Years | 0 | 0.0% |
| 35 to 44 Years | 0 | 0.0% |
| 45 to 54 Years | 62 | 31.0% |
| 55 to 64 Years | 74 | 37.0% |
| 65 to 74 Years | 55 | 27.5% |
| 75 to 84 Years | 9 | 4.5% |
| 85 Years and Over | 0 | 0.0% |
| Total | 200 | 100.0% |
Housing Finances in Tilghmanton
Median Income by Occupancy in Tilghmanton
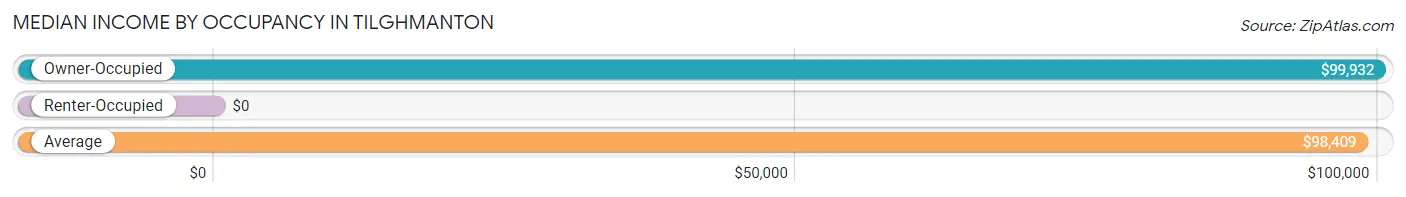
| Occupancy Type | # Households | Median Income |
| Owner-Occupied | 133 (66.5%) | $99,932 |
| Renter-Occupied | 67 (33.5%) | $0 |
| Average | 200 (100.0%) | $98,409 |
Occupancy by Householder Income Bracket in Tilghmanton
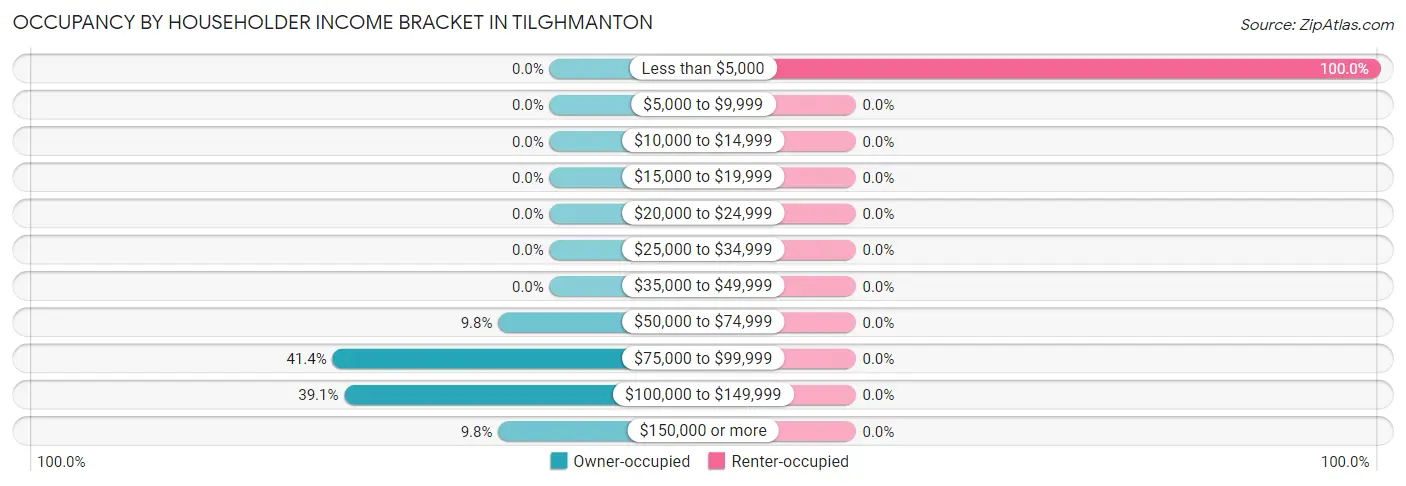
| Income Bracket | Owner-occupied | Renter-occupied |
| Less than $5,000 | 0 (0.0%) | 67 (100.0%) |
| $5,000 to $9,999 | 0 (0.0%) | 0 (0.0%) |
| $10,000 to $14,999 | 0 (0.0%) | 0 (0.0%) |
| $15,000 to $19,999 | 0 (0.0%) | 0 (0.0%) |
| $20,000 to $24,999 | 0 (0.0%) | 0 (0.0%) |
| $25,000 to $34,999 | 0 (0.0%) | 0 (0.0%) |
| $35,000 to $49,999 | 0 (0.0%) | 0 (0.0%) |
| $50,000 to $74,999 | 13 (9.8%) | 0 (0.0%) |
| $75,000 to $99,999 | 55 (41.3%) | 0 (0.0%) |
| $100,000 to $149,999 | 52 (39.1%) | 0 (0.0%) |
| $150,000 or more | 13 (9.8%) | 0 (0.0%) |
| Total | 133 (100.0%) | 67 (100.0%) |
Monthly Housing Cost Tiers in Tilghmanton
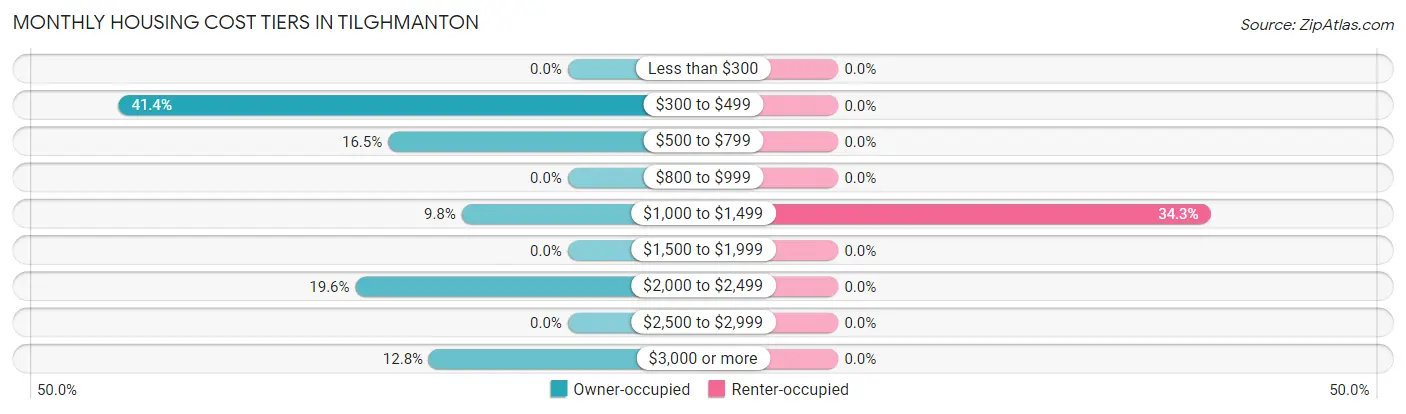
| Monthly Cost | Owner-occupied | Renter-occupied |
| Less than $300 | 0 (0.0%) | 0 (0.0%) |
| $300 to $499 | 55 (41.3%) | 0 (0.0%) |
| $500 to $799 | 22 (16.5%) | 0 (0.0%) |
| $800 to $999 | 0 (0.0%) | 0 (0.0%) |
| $1,000 to $1,499 | 13 (9.8%) | 23 (34.3%) |
| $1,500 to $1,999 | 0 (0.0%) | 0 (0.0%) |
| $2,000 to $2,499 | 26 (19.6%) | 0 (0.0%) |
| $2,500 to $2,999 | 0 (0.0%) | 0 (0.0%) |
| $3,000 or more | 17 (12.8%) | 0 (0.0%) |
| Total | 133 (100.0%) | 67 (100.0%) |
Physical Housing Characteristics in Tilghmanton
Housing Structures in Tilghmanton
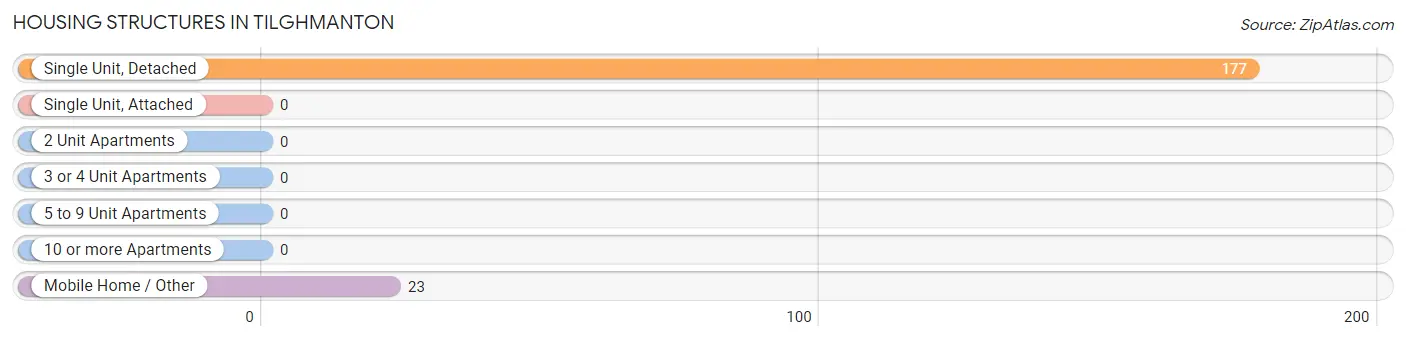
| Structure Type | # Housing Units | % Housing Units |
| Single Unit, Detached | 177 | 88.5% |
| Single Unit, Attached | 0 | 0.0% |
| 2 Unit Apartments | 0 | 0.0% |
| 3 or 4 Unit Apartments | 0 | 0.0% |
| 5 to 9 Unit Apartments | 0 | 0.0% |
| 10 or more Apartments | 0 | 0.0% |
| Mobile Home / Other | 23 | 11.5% |
| Total | 200 | 100.0% |
Housing Structures by Occupancy in Tilghmanton
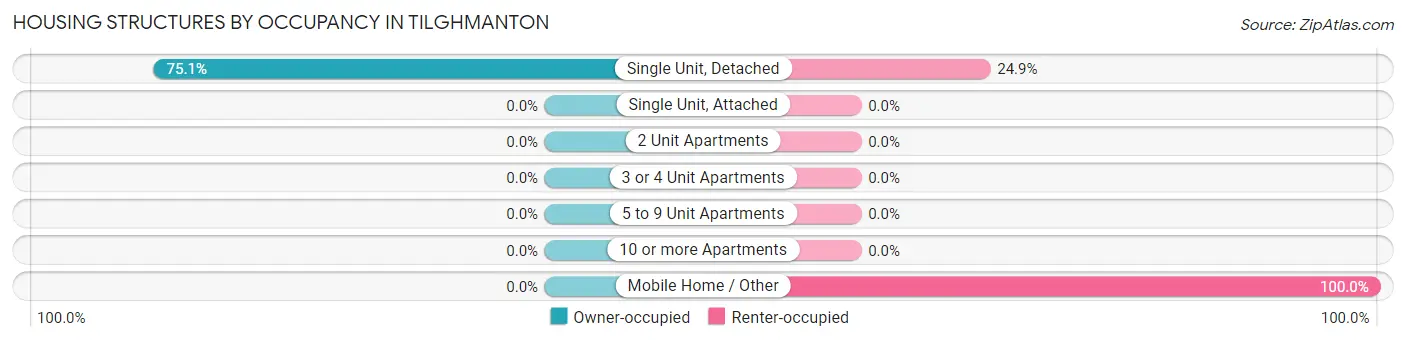
| Structure Type | Owner-occupied | Renter-occupied |
| Single Unit, Detached | 133 (75.1%) | 44 (24.9%) |
| Single Unit, Attached | 0 (0.0%) | 0 (0.0%) |
| 2 Unit Apartments | 0 (0.0%) | 0 (0.0%) |
| 3 or 4 Unit Apartments | 0 (0.0%) | 0 (0.0%) |
| 5 to 9 Unit Apartments | 0 (0.0%) | 0 (0.0%) |
| 10 or more Apartments | 0 (0.0%) | 0 (0.0%) |
| Mobile Home / Other | 0 (0.0%) | 23 (100.0%) |
| Total | 133 (66.5%) | 67 (33.5%) |
Housing Structures by Number of Rooms in Tilghmanton
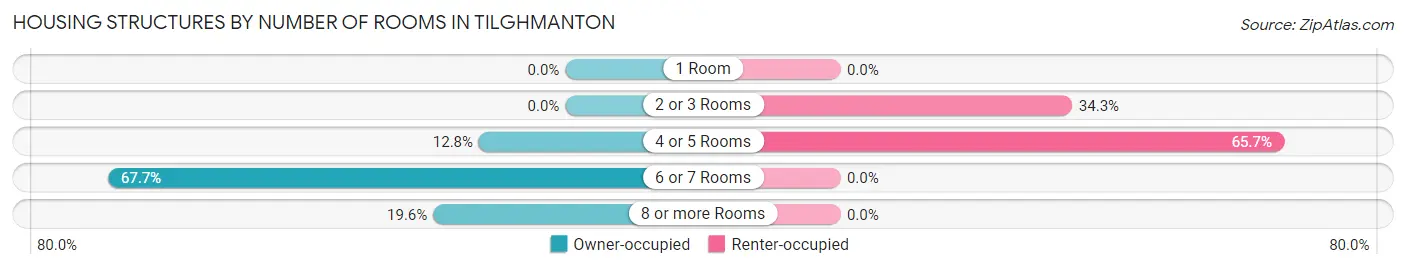
| Number of Rooms | Owner-occupied | Renter-occupied |
| 1 Room | 0 (0.0%) | 0 (0.0%) |
| 2 or 3 Rooms | 0 (0.0%) | 23 (34.3%) |
| 4 or 5 Rooms | 17 (12.8%) | 44 (65.7%) |
| 6 or 7 Rooms | 90 (67.7%) | 0 (0.0%) |
| 8 or more Rooms | 26 (19.6%) | 0 (0.0%) |
| Total | 133 (100.0%) | 67 (100.0%) |
Housing Structure by Heating Type in Tilghmanton
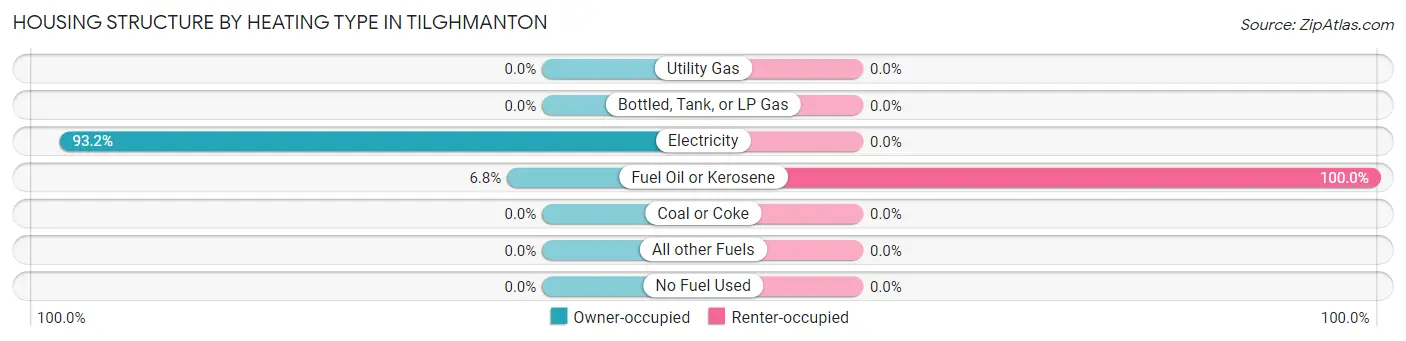
| Heating Type | Owner-occupied | Renter-occupied |
| Utility Gas | 0 (0.0%) | 0 (0.0%) |
| Bottled, Tank, or LP Gas | 0 (0.0%) | 0 (0.0%) |
| Electricity | 124 (93.2%) | 0 (0.0%) |
| Fuel Oil or Kerosene | 9 (6.8%) | 67 (100.0%) |
| Coal or Coke | 0 (0.0%) | 0 (0.0%) |
| All other Fuels | 0 (0.0%) | 0 (0.0%) |
| No Fuel Used | 0 (0.0%) | 0 (0.0%) |
| Total | 133 (100.0%) | 67 (100.0%) |
Household Vehicle Usage in Tilghmanton
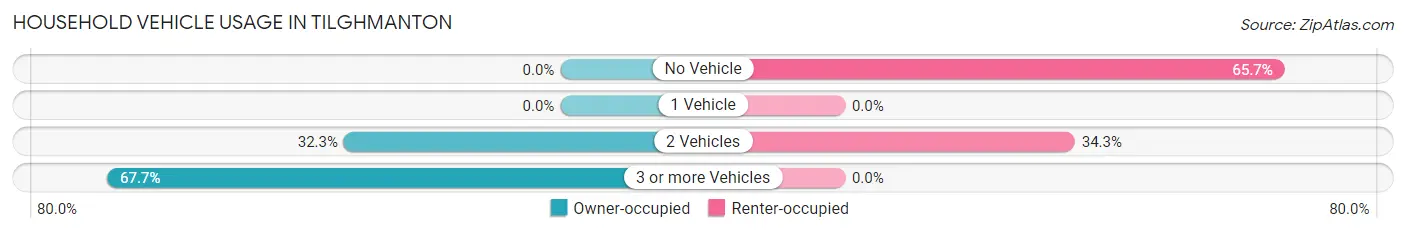
| Vehicles per Household | Owner-occupied | Renter-occupied |
| No Vehicle | 0 (0.0%) | 44 (65.7%) |
| 1 Vehicle | 0 (0.0%) | 0 (0.0%) |
| 2 Vehicles | 43 (32.3%) | 23 (34.3%) |
| 3 or more Vehicles | 90 (67.7%) | 0 (0.0%) |
| Total | 133 (100.0%) | 67 (100.0%) |
Real Estate & Mortgages in Tilghmanton
Real Estate and Mortgage Overview in Tilghmanton
| Characteristic | Without Mortgage | With Mortgage |
| Housing Units | 77 | 56 |
| Median Property Value | $189,200 | $228,800 |
| Median Household Income | $98,659 | $13 |
| Monthly Housing Costs | $470 | $17 |
| Real Estate Taxes | $1,783 | $0 |
Property Value by Mortgage Status in Tilghmanton
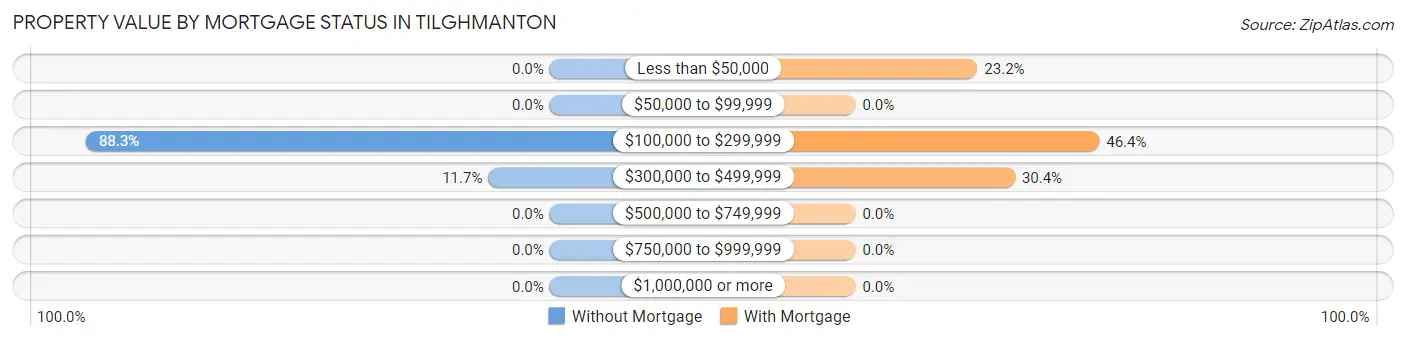
| Property Value | Without Mortgage | With Mortgage |
| Less than $50,000 | 0 (0.0%) | 13 (23.2%) |
| $50,000 to $99,999 | 0 (0.0%) | 0 (0.0%) |
| $100,000 to $299,999 | 68 (88.3%) | 26 (46.4%) |
| $300,000 to $499,999 | 9 (11.7%) | 17 (30.4%) |
| $500,000 to $749,999 | 0 (0.0%) | 0 (0.0%) |
| $750,000 to $999,999 | 0 (0.0%) | 0 (0.0%) |
| $1,000,000 or more | 0 (0.0%) | 0 (0.0%) |
| Total | 77 (100.0%) | 56 (100.0%) |
Household Income by Mortgage Status in Tilghmanton
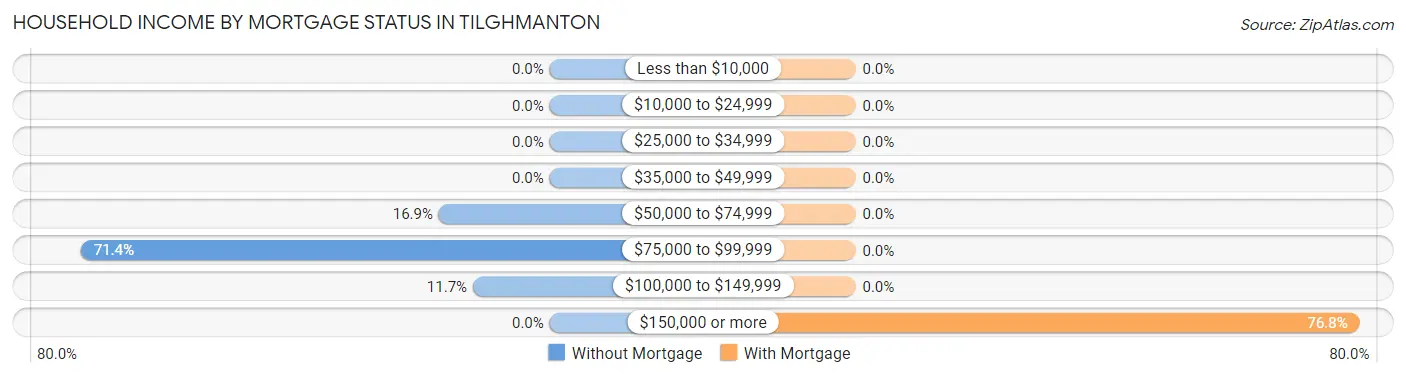
| Household Income | Without Mortgage | With Mortgage |
| Less than $10,000 | 0 (0.0%) | 0 (0.0%) |
| $10,000 to $24,999 | 0 (0.0%) | 0 (0.0%) |
| $25,000 to $34,999 | 0 (0.0%) | 0 (0.0%) |
| $35,000 to $49,999 | 0 (0.0%) | 0 (0.0%) |
| $50,000 to $74,999 | 13 (16.9%) | 0 (0.0%) |
| $75,000 to $99,999 | 55 (71.4%) | 0 (0.0%) |
| $100,000 to $149,999 | 9 (11.7%) | 0 (0.0%) |
| $150,000 or more | 0 (0.0%) | 43 (76.8%) |
| Total | 77 (100.0%) | 56 (100.0%) |
Property Value to Household Income Ratio in Tilghmanton
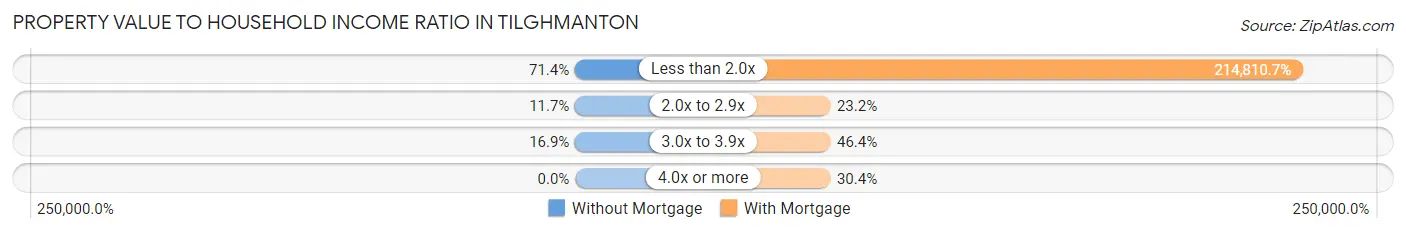
| Value-to-Income Ratio | Without Mortgage | With Mortgage |
| Less than 2.0x | 55 (71.4%) | 120,294 (214,810.7%) |
| 2.0x to 2.9x | 9 (11.7%) | 13 (23.2%) |
| 3.0x to 3.9x | 13 (16.9%) | 26 (46.4%) |
| 4.0x or more | 0 (0.0%) | 17 (30.4%) |
| Total | 77 (100.0%) | 56 (100.0%) |
Real Estate Taxes by Mortgage Status in Tilghmanton
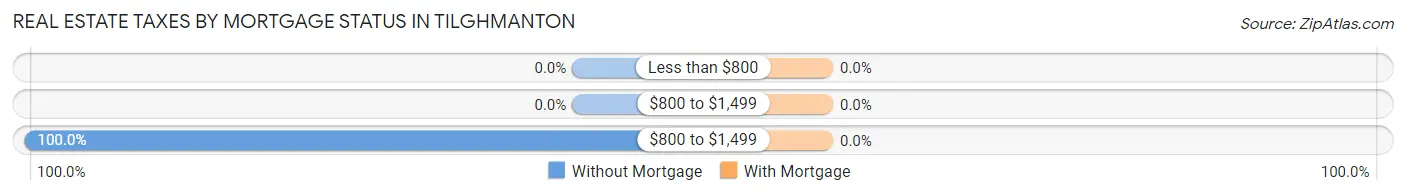
| Property Taxes | Without Mortgage | With Mortgage |
| Less than $800 | 0 (0.0%) | 0 (0.0%) |
| $800 to $1,499 | 0 (0.0%) | 0 (0.0%) |
| $800 to $1,499 | 77 (100.0%) | 0 (0.0%) |
| Total | 77 (100.0%) | 56 (100.0%) |
Health & Disability in Tilghmanton
Health Insurance Coverage by Age in Tilghmanton
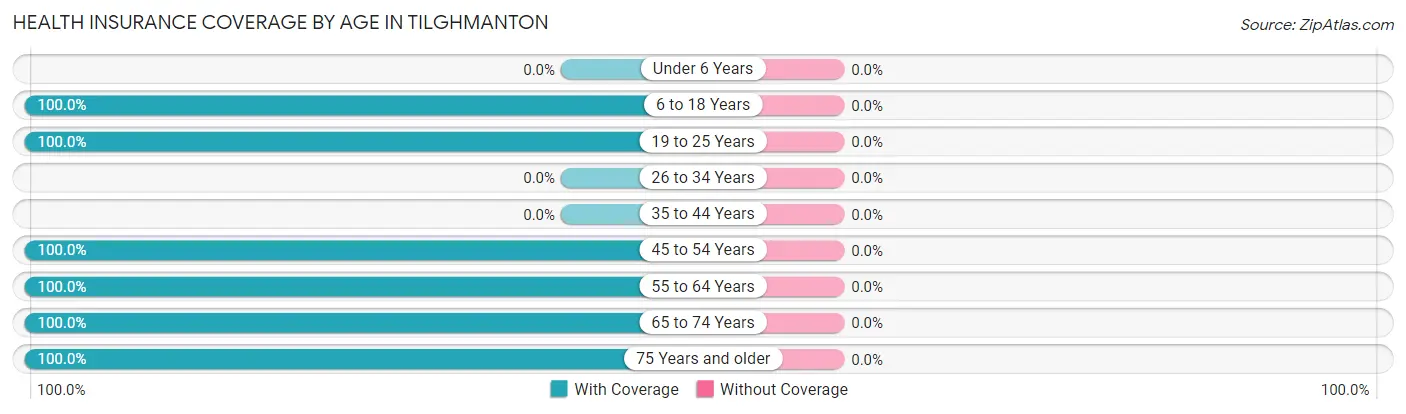
| Age Bracket | With Coverage | Without Coverage |
| Under 6 Years | 0 (0.0%) | 0 (0.0%) |
| 6 to 18 Years | 86 (100.0%) | 0 (0.0%) |
| 19 to 25 Years | 35 (100.0%) | 0 (0.0%) |
| 26 to 34 Years | 0 (0.0%) | 0 (0.0%) |
| 35 to 44 Years | 0 (0.0%) | 0 (0.0%) |
| 45 to 54 Years | 111 (100.0%) | 0 (0.0%) |
| 55 to 64 Years | 125 (100.0%) | 0 (0.0%) |
| 65 to 74 Years | 88 (100.0%) | 0 (0.0%) |
| 75 Years and older | 18 (100.0%) | 0 (0.0%) |
| Total | 463 (100.0%) | 0 (0.0%) |
Health Insurance Coverage by Citizenship Status in Tilghmanton
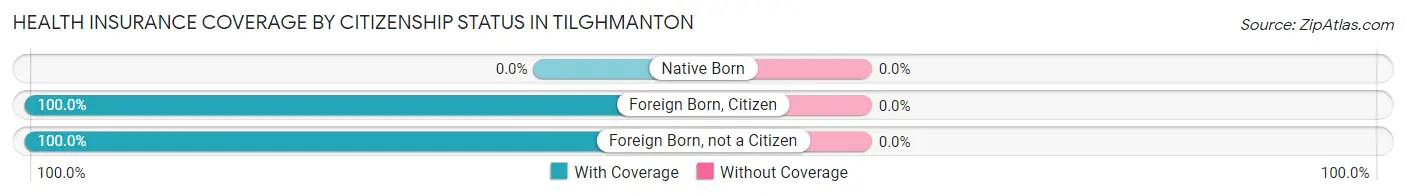
| Citizenship Status | With Coverage | Without Coverage |
| Native Born | 0 (0.0%) | 0 (0.0%) |
| Foreign Born, Citizen | 86 (100.0%) | 0 (0.0%) |
| Foreign Born, not a Citizen | 35 (100.0%) | 0 (0.0%) |
Health Insurance Coverage by Household Income in Tilghmanton
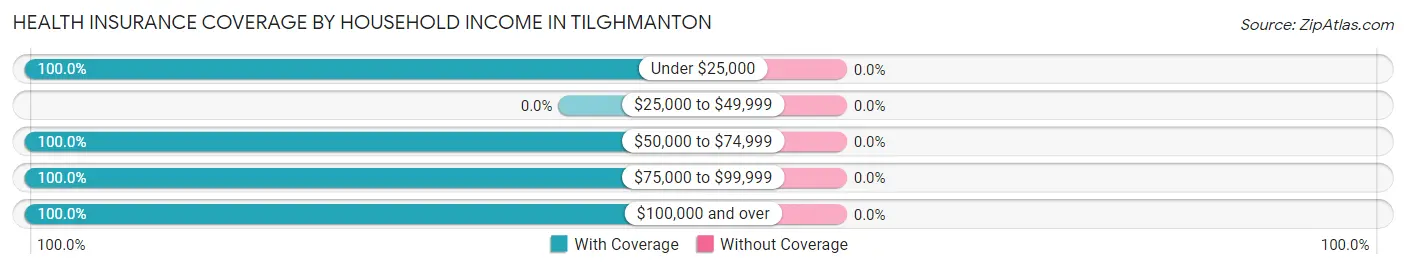
| Household Income | With Coverage | Without Coverage |
| Under $25,000 | 119 (100.0%) | 0 (0.0%) |
| $25,000 to $49,999 | 0 (0.0%) | 0 (0.0%) |
| $50,000 to $74,999 | 27 (100.0%) | 0 (0.0%) |
| $75,000 to $99,999 | 106 (100.0%) | 0 (0.0%) |
| $100,000 and over | 211 (100.0%) | 0 (0.0%) |
Public vs Private Health Insurance Coverage by Age in Tilghmanton
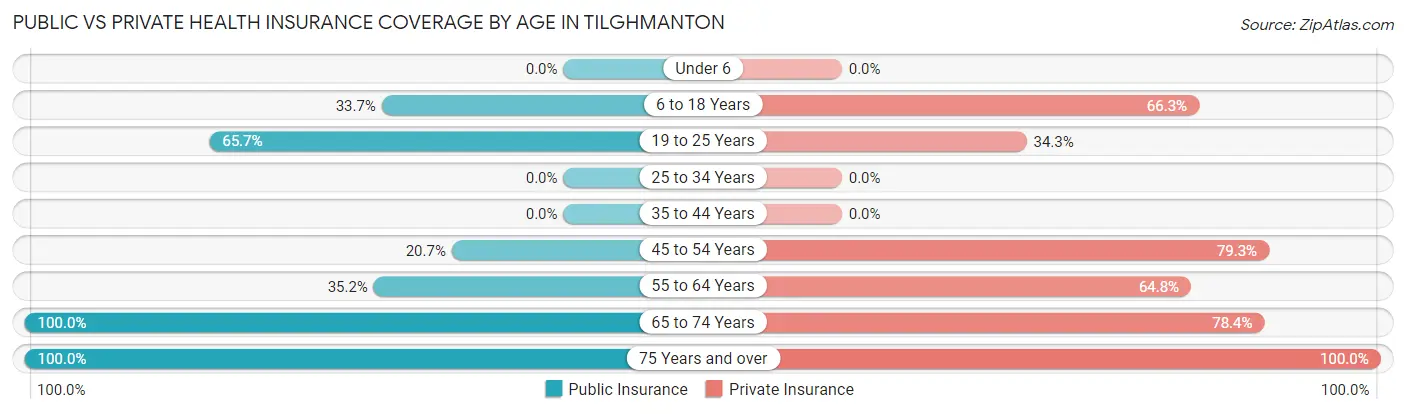
| Age Bracket | Public Insurance | Private Insurance |
| Under 6 | 0 (0.0%) | 0 (0.0%) |
| 6 to 18 Years | 29 (33.7%) | 57 (66.3%) |
| 19 to 25 Years | 23 (65.7%) | 12 (34.3%) |
| 25 to 34 Years | 0 (0.0%) | 0 (0.0%) |
| 35 to 44 Years | 0 (0.0%) | 0 (0.0%) |
| 45 to 54 Years | 23 (20.7%) | 88 (79.3%) |
| 55 to 64 Years | 44 (35.2%) | 81 (64.8%) |
| 65 to 74 Years | 88 (100.0%) | 69 (78.4%) |
| 75 Years and over | 18 (100.0%) | 18 (100.0%) |
| Total | 225 (48.6%) | 325 (70.2%) |
Disability Status by Sex by Age in Tilghmanton
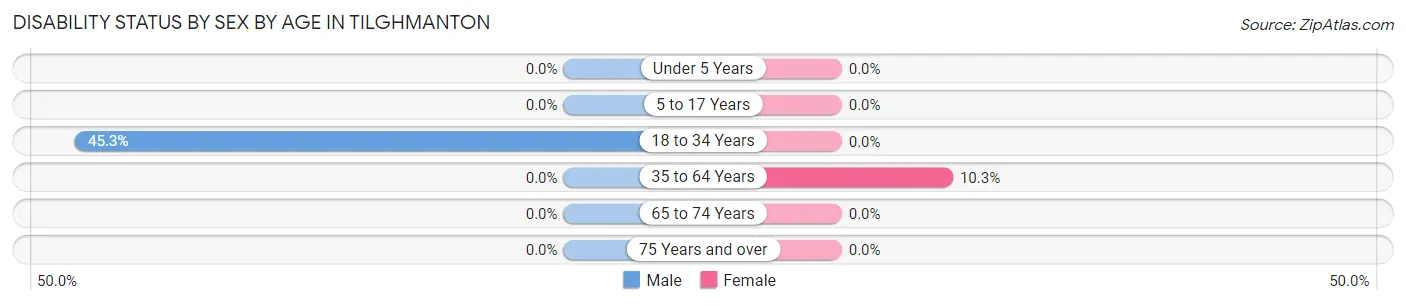
| Age Bracket | Male | Female |
| Under 5 Years | 0 (0.0%) | 0 (0.0%) |
| 5 to 17 Years | 0 (0.0%) | 0 (0.0%) |
| 18 to 34 Years | 29 (45.3%) | 0 (0.0%) |
| 35 to 64 Years | 0 (0.0%) | 13 (10.3%) |
| 65 to 74 Years | 0 (0.0%) | 0 (0.0%) |
| 75 Years and over | 0 (0.0%) | 0 (0.0%) |
Disability Class by Sex by Age in Tilghmanton
Disability Class: Hearing Difficulty
| Age Bracket | Male | Female |
| Under 5 Years | 0 (0.0%) | 0 (0.0%) |
| 5 to 17 Years | 0 (0.0%) | 0 (0.0%) |
| 18 to 34 Years | 0 (0.0%) | 0 (0.0%) |
| 35 to 64 Years | 0 (0.0%) | 0 (0.0%) |
| 65 to 74 Years | 0 (0.0%) | 0 (0.0%) |
| 75 Years and over | 0 (0.0%) | 0 (0.0%) |
Disability Class: Vision Difficulty
| Age Bracket | Male | Female |
| Under 5 Years | 0 (0.0%) | 0 (0.0%) |
| 5 to 17 Years | 0 (0.0%) | 0 (0.0%) |
| 18 to 34 Years | 0 (0.0%) | 0 (0.0%) |
| 35 to 64 Years | 0 (0.0%) | 0 (0.0%) |
| 65 to 74 Years | 0 (0.0%) | 0 (0.0%) |
| 75 Years and over | 0 (0.0%) | 0 (0.0%) |
Disability Class: Cognitive Difficulty
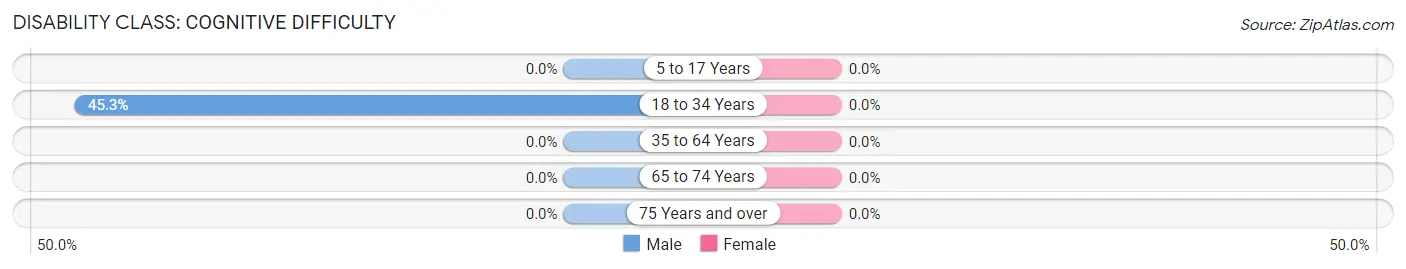
| Age Bracket | Male | Female |
| 5 to 17 Years | 0 (0.0%) | 0 (0.0%) |
| 18 to 34 Years | 29 (45.3%) | 0 (0.0%) |
| 35 to 64 Years | 0 (0.0%) | 0 (0.0%) |
| 65 to 74 Years | 0 (0.0%) | 0 (0.0%) |
| 75 Years and over | 0 (0.0%) | 0 (0.0%) |
Disability Class: Ambulatory Difficulty
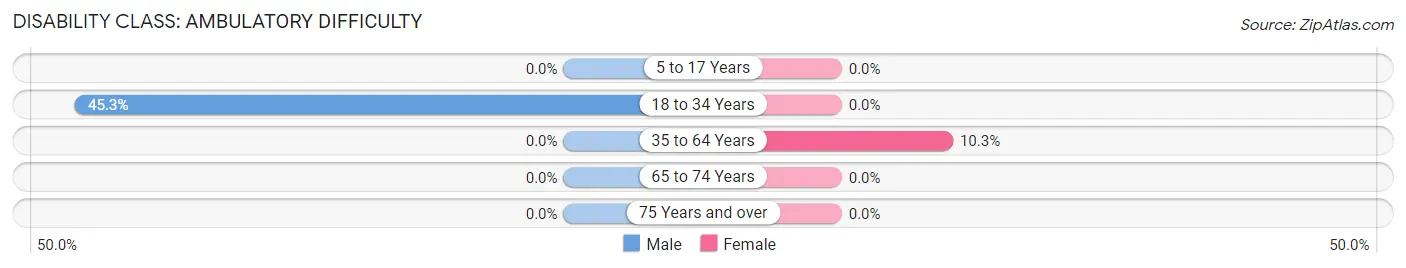
| Age Bracket | Male | Female |
| 5 to 17 Years | 0 (0.0%) | 0 (0.0%) |
| 18 to 34 Years | 29 (45.3%) | 0 (0.0%) |
| 35 to 64 Years | 0 (0.0%) | 13 (10.3%) |
| 65 to 74 Years | 0 (0.0%) | 0 (0.0%) |
| 75 Years and over | 0 (0.0%) | 0 (0.0%) |
Disability Class: Self-Care Difficulty
| Age Bracket | Male | Female |
| 5 to 17 Years | 0 (0.0%) | 0 (0.0%) |
| 18 to 34 Years | 0 (0.0%) | 0 (0.0%) |
| 35 to 64 Years | 0 (0.0%) | 0 (0.0%) |
| 65 to 74 Years | 0 (0.0%) | 0 (0.0%) |
| 75 Years and over | 0 (0.0%) | 0 (0.0%) |
Technology Access in Tilghmanton
Computing Device Access in Tilghmanton
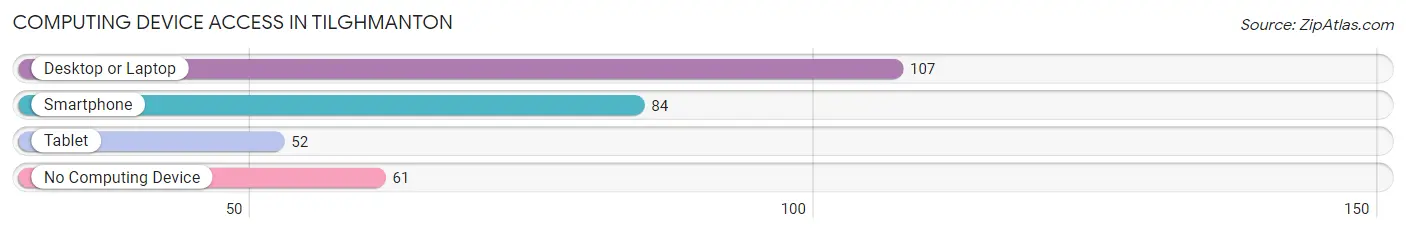
| Device Type | # Households | % Households |
| Desktop or Laptop | 107 | 53.5% |
| Smartphone | 84 | 42.0% |
| Tablet | 52 | 26.0% |
| No Computing Device | 61 | 30.5% |
| Total | 200 | 100.0% |
Internet Access in Tilghmanton
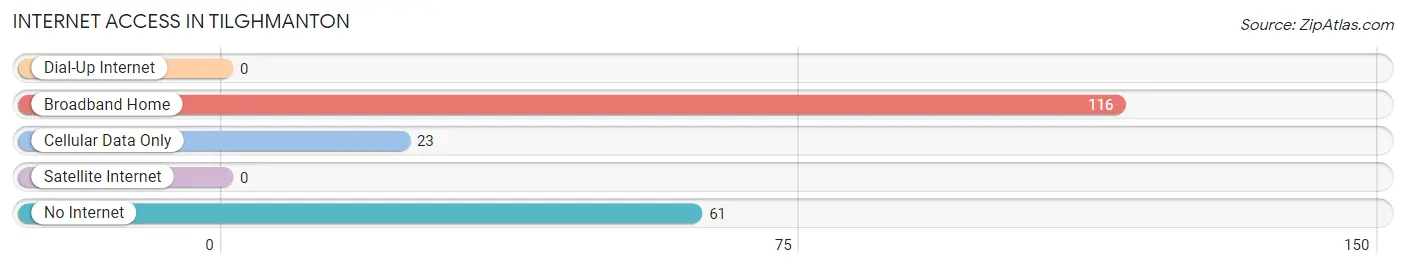
| Internet Type | # Households | % Households |
| Dial-Up Internet | 0 | 0.0% |
| Broadband Home | 116 | 58.0% |
| Cellular Data Only | 23 | 11.5% |
| Satellite Internet | 0 | 0.0% |
| No Internet | 61 | 30.5% |
| Total | 200 | 100.0% |
Tilghmanton Summary
Tilghmanton is a small unincorporated community located in Washington County, Maryland. It is situated in the northern part of the county, near the Pennsylvania border. The community is located along the Potomac River, and is home to a variety of businesses, including a marina, a golf course, and a few restaurants.
History
Tilghmanton was first settled in the late 1700s by a group of German immigrants. The community was originally known as “Tilghman’s Town”, named after the Tilghman family who owned much of the land in the area. The community was officially incorporated in 1820, and the name was changed to Tilghmanton.
In the late 1800s, Tilghmanton was a thriving agricultural community, with many farms and orchards. The community was also home to a number of businesses, including a grist mill, a saw mill, and a general store.
In the early 1900s, Tilghmanton began to decline as the agricultural industry shifted away from the area. The community was further impacted by the Great Depression, and many of the businesses in the area closed.
Geography
Tilghmanton is located in northern Washington County, Maryland, near the Pennsylvania border. The community is situated along the Potomac River, and is surrounded by rolling hills and farmland. The climate in the area is temperate, with hot summers and cold winters.
Economy
Tilghmanton is a small, rural community with a limited economy. The primary industries in the area are agriculture and tourism. The community is home to a number of businesses, including a marina, a golf course, and a few restaurants.
Demographics
As of the 2010 census, the population of Tilghmanton was 1,093. The racial makeup of the community was 97.3% White, 0.9% African American, 0.3% Native American, 0.2% Asian, and 1.3% from other races. The median household income in the area was $45,000, and the median age was 44.5 years.
Common Questions
What is Per Capita Income in Tilghmanton?
Per Capita income in Tilghmanton is $32,827.
What is the Median Family Income in Tilghmanton?
Median Family Income in Tilghmanton is $99,409.
What is the Median Household income in Tilghmanton?
Median Household Income in Tilghmanton is $98,409.
What is Income or Wage Gap in Tilghmanton?
Income or Wage Gap in Tilghmanton is 63.9%.
Women in Tilghmanton earn 36.1 cents for every dollar earned by a man.
What is Inequality or Gini Index in Tilghmanton?
Inequality or Gini Index in Tilghmanton is 0.41.
What is the Total Population of Tilghmanton?
Total Population of Tilghmanton is 463.
What is the Total Male Population of Tilghmanton?
Total Male Population of Tilghmanton is 285.
What is the Total Female Population of Tilghmanton?
Total Female Population of Tilghmanton is 178.
What is the Ratio of Males per 100 Females in Tilghmanton?
There are 160.11 Males per 100 Females in Tilghmanton.
What is the Ratio of Females per 100 Males in Tilghmanton?
There are 62.46 Females per 100 Males in Tilghmanton.
What is the Median Population Age in Tilghmanton?
Median Population Age in Tilghmanton is 55.0 Years.
What is the Average Family Size in Tilghmanton
Average Family Size in Tilghmanton is 2.7 People.
What is the Average Household Size in Tilghmanton
Average Household Size in Tilghmanton is 2.3 People.
How Large is the Labor Force in Tilghmanton?
There are 220 People in the Labor Forcein in Tilghmanton.
What is the Percentage of People in the Labor Force in Tilghmanton?
47.5% of People are in the Labor Force in Tilghmanton.
What is the Unemployment Rate in Tilghmanton?
Unemployment Rate in Tilghmanton is 36.4%.