South Laurel, MD Map & Demographics
South Laurel Map
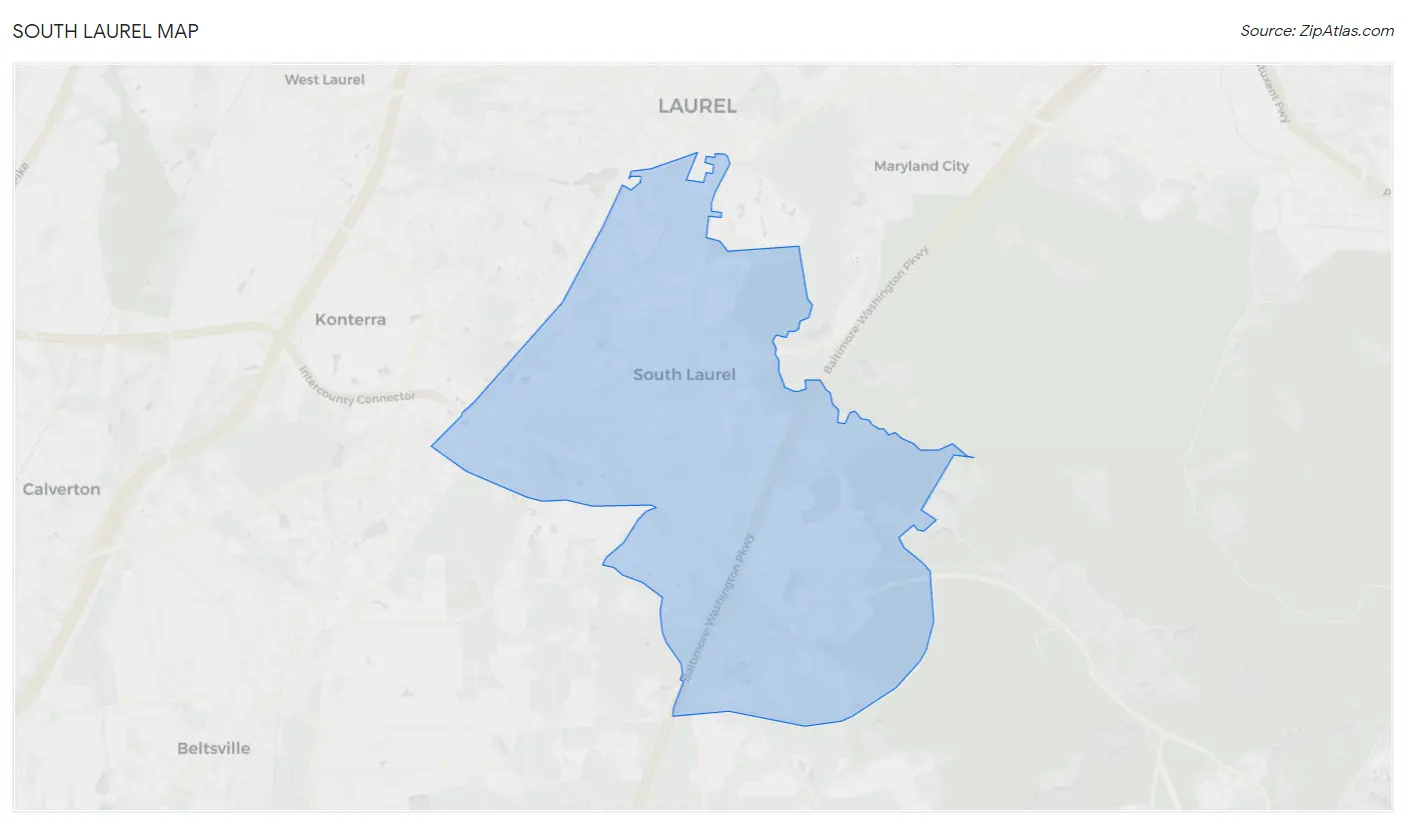
South Laurel Overview
$41,622
PER CAPITA INCOME
$97,888
AVG FAMILY INCOME
$82,933
AVG HOUSEHOLD INCOME
20.7%
WAGE / INCOME GAP [ % ]
79.3¢/ $1
WAGE / INCOME GAP [ $ ]
$10,899
FAMILY INCOME DEFICIT
0.42
INEQUALITY / GINI INDEX
28,427
TOTAL POPULATION
13,368
MALE POPULATION
15,059
FEMALE POPULATION
88.77
MALES / 100 FEMALES
112.65
FEMALES / 100 MALES
35.6
MEDIAN AGE
3.2
AVG FAMILY SIZE
2.6
AVG HOUSEHOLD SIZE
16,643
LABOR FORCE [ PEOPLE ]
75.4%
PERCENT IN LABOR FORCE
5.3%
UNEMPLOYMENT RATE
Income in South Laurel
Income Overview in South Laurel
Per Capita Income in South Laurel is $41,622, while median incomes of families and households are $97,888 and $82,933 respectively.
| Characteristic | Number | Measure |
| Per Capita Income | 28,427 | $41,622 |
| Median Family Income | 6,718 | $97,888 |
| Mean Family Income | 6,718 | $118,326 |
| Median Household Income | 10,823 | $82,933 |
| Mean Household Income | 10,823 | $106,993 |
| Income Deficit | 6,718 | $10,899 |
| Wage / Income Gap (%) | 28,427 | 20.72% |
| Wage / Income Gap ($) | 28,427 | 79.28¢ per $1 |
| Gini / Inequality Index | 28,427 | 0.42 |
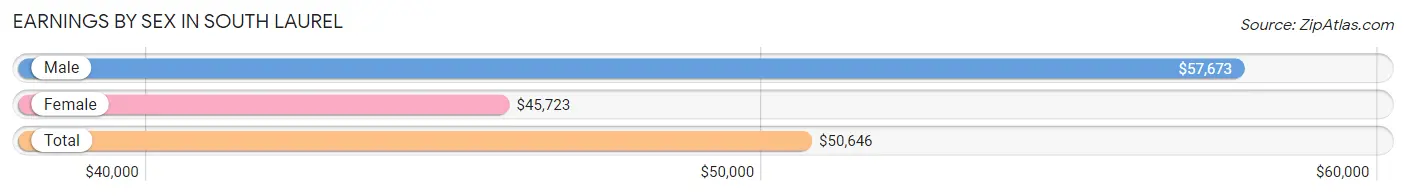
Earnings by Sex in South Laurel
Average Earnings in South Laurel are $50,646, $57,673 for men and $45,723 for women, a difference of 20.7%.
| Sex | Number | Average Earnings |
| Male | 7,759 (46.2%) | $57,673 |
| Female | 9,029 (53.8%) | $45,723 |
| Total | 16,788 (100.0%) | $50,646 |
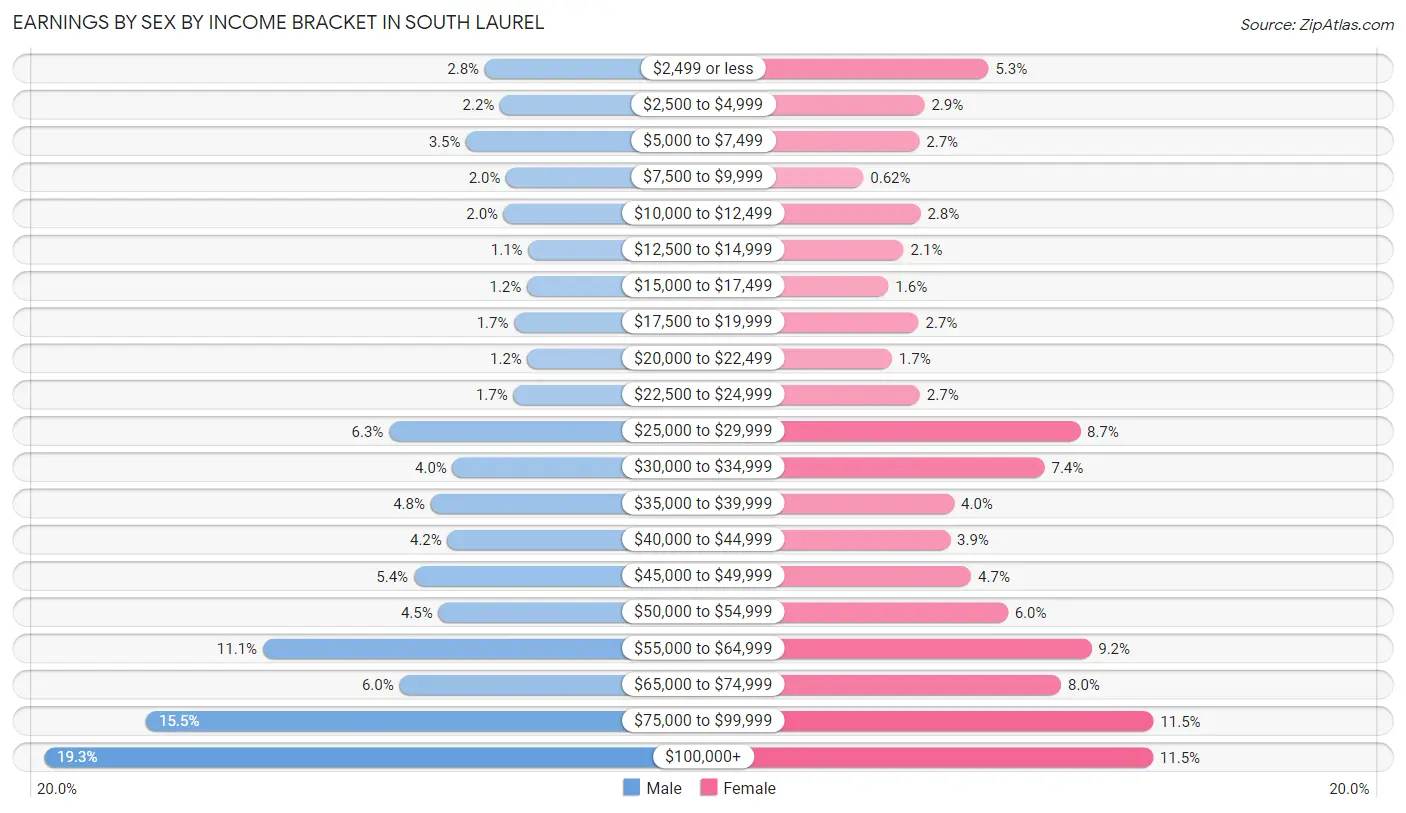
Earnings by Sex by Income Bracket in South Laurel
The most common earnings brackets in South Laurel are $100,000+ for men (1,495 | 19.3%) and $75,000 to $99,999 for women (1,037 | 11.5%).
| Income | Male | Female |
| $2,499 or less | 213 (2.8%) | 479 (5.3%) |
| $2,500 to $4,999 | 169 (2.2%) | 263 (2.9%) |
| $5,000 to $7,499 | 268 (3.5%) | 246 (2.7%) |
| $7,500 to $9,999 | 151 (1.9%) | 56 (0.6%) |
| $10,000 to $12,499 | 158 (2.0%) | 249 (2.8%) |
| $12,500 to $14,999 | 87 (1.1%) | 192 (2.1%) |
| $15,000 to $17,499 | 91 (1.2%) | 141 (1.6%) |
| $17,500 to $19,999 | 128 (1.7%) | 243 (2.7%) |
| $20,000 to $22,499 | 89 (1.1%) | 153 (1.7%) |
| $22,500 to $24,999 | 130 (1.7%) | 247 (2.7%) |
| $25,000 to $29,999 | 492 (6.3%) | 789 (8.7%) |
| $30,000 to $34,999 | 307 (4.0%) | 669 (7.4%) |
| $35,000 to $39,999 | 371 (4.8%) | 363 (4.0%) |
| $40,000 to $44,999 | 322 (4.2%) | 349 (3.9%) |
| $45,000 to $49,999 | 420 (5.4%) | 421 (4.7%) |
| $50,000 to $54,999 | 348 (4.5%) | 544 (6.0%) |
| $55,000 to $64,999 | 859 (11.1%) | 827 (9.2%) |
| $65,000 to $74,999 | 462 (5.9%) | 725 (8.0%) |
| $75,000 to $99,999 | 1,199 (15.4%) | 1,037 (11.5%) |
| $100,000+ | 1,495 (19.3%) | 1,036 (11.5%) |
| Total | 7,759 (100.0%) | 9,029 (100.0%) |
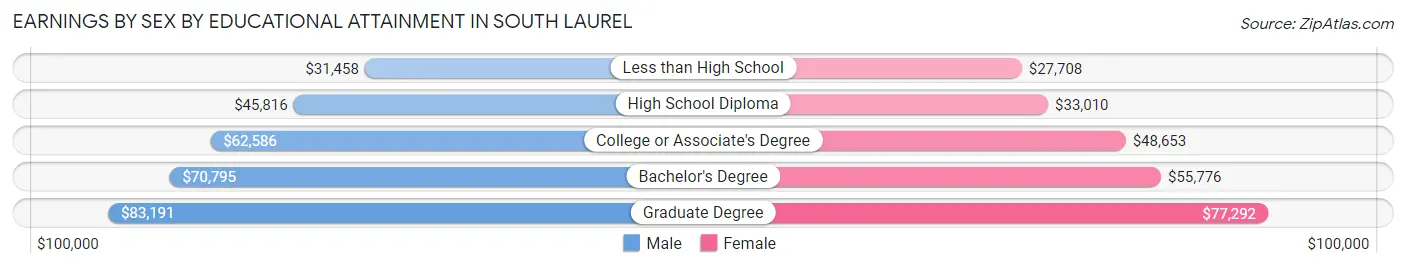
Earnings by Sex by Educational Attainment in South Laurel
Average earnings in South Laurel are $60,099 for men and $51,203 for women, a difference of 14.8%. Men with an educational attainment of graduate degree enjoy the highest average annual earnings of $83,191, while those with less than high school education earn the least with $31,458. Women with an educational attainment of graduate degree earn the most with the average annual earnings of $77,292, while those with less than high school education have the smallest earnings of $27,708.
| Educational Attainment | Male Income | Female Income |
| Less than High School | $31,458 | $27,708 |
| High School Diploma | $45,816 | $33,010 |
| College or Associate's Degree | $62,586 | $48,653 |
| Bachelor's Degree | $70,795 | $55,776 |
| Graduate Degree | $83,191 | $77,292 |
| Total | $60,099 | $51,203 |
Family Income in South Laurel
Family Income Brackets in South Laurel
According to the South Laurel family income data, there are 1,458 families falling into the $100,000 to $149,999 income range, which is the most common income bracket and makes up 21.7% of all families. Conversely, the $10,000 to $14,999 income bracket is the least frequent group with only 134 families (2.0%) belonging to this category.
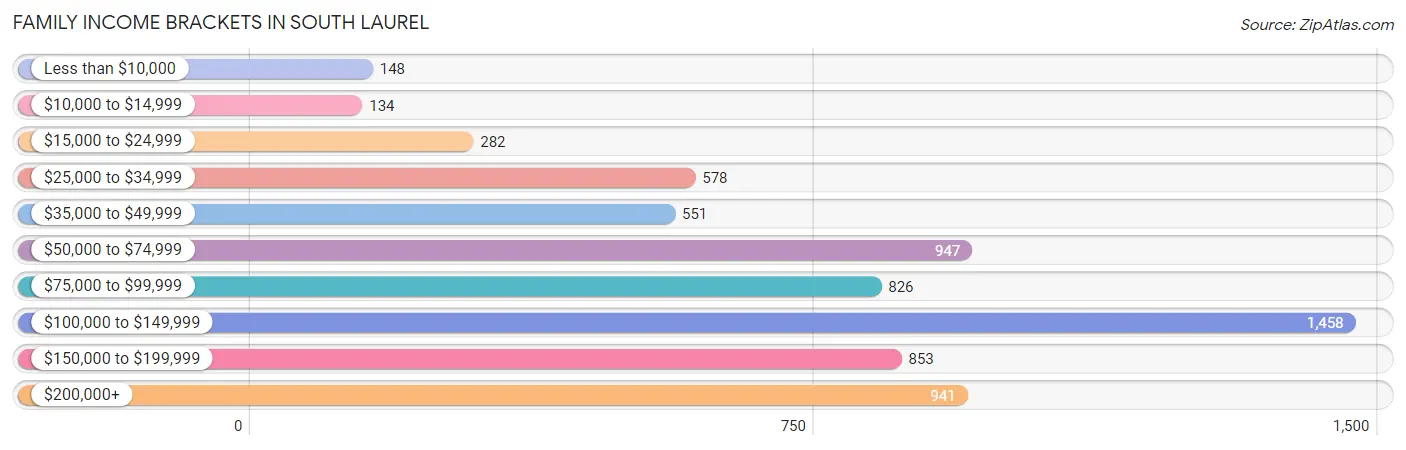
| Income Bracket | # Families | % Families |
| Less than $10,000 | 148 | 2.2% |
| $10,000 to $14,999 | 134 | 2.0% |
| $15,000 to $24,999 | 282 | 4.2% |
| $25,000 to $34,999 | 578 | 8.6% |
| $35,000 to $49,999 | 551 | 8.2% |
| $50,000 to $74,999 | 947 | 14.1% |
| $75,000 to $99,999 | 826 | 12.3% |
| $100,000 to $149,999 | 1,458 | 21.7% |
| $150,000 to $199,999 | 853 | 12.7% |
| $200,000+ | 941 | 14.0% |
Family Income by Famaliy Size in South Laurel
4-person families (1,050 | 15.6%) account for the highest median family income in South Laurel with $149,110 per family, while 2-person families (3,208 | 47.7%) have the highest median income of $38,017 per family member.
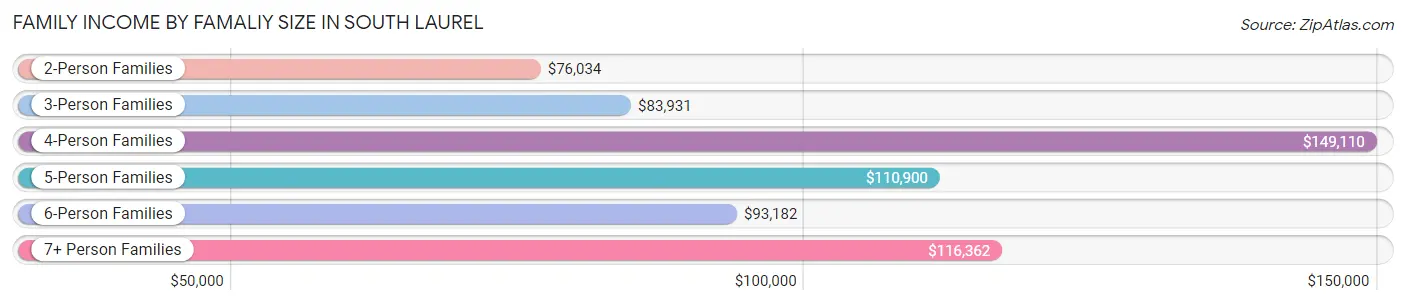
| Income Bracket | # Families | Median Income |
| 2-Person Families | 3,208 (47.7%) | $76,034 |
| 3-Person Families | 1,357 (20.2%) | $83,931 |
| 4-Person Families | 1,050 (15.6%) | $149,110 |
| 5-Person Families | 626 (9.3%) | $110,900 |
| 6-Person Families | 340 (5.1%) | $93,182 |
| 7+ Person Families | 137 (2.0%) | $116,362 |
| Total | 6,718 (100.0%) | $97,888 |
Family Income by Number of Earners in South Laurel
The median family income in South Laurel is $97,888, with families comprising 3+ earners (943) having the highest median family income of $139,583, while families with 1 earner (2,401) have the lowest median family income of $46,518, accounting for 14.0% and 35.7% of families, respectively.
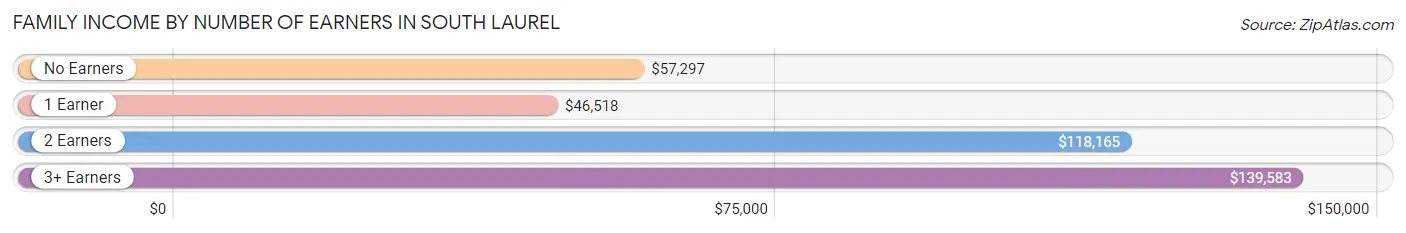
| Number of Earners | # Families | Median Income |
| No Earners | 495 (7.4%) | $57,297 |
| 1 Earner | 2,401 (35.7%) | $46,518 |
| 2 Earners | 2,879 (42.9%) | $118,165 |
| 3+ Earners | 943 (14.0%) | $139,583 |
| Total | 6,718 (100.0%) | $97,888 |
Household Income in South Laurel
Household Income Brackets in South Laurel
With 2,251 households falling in the category, the $100,000 to $149,999 income range is the most frequent in South Laurel, accounting for 20.8% of all households. In contrast, only 249 households (2.3%) fall into the $10,000 to $14,999 income bracket, making it the least populous group.
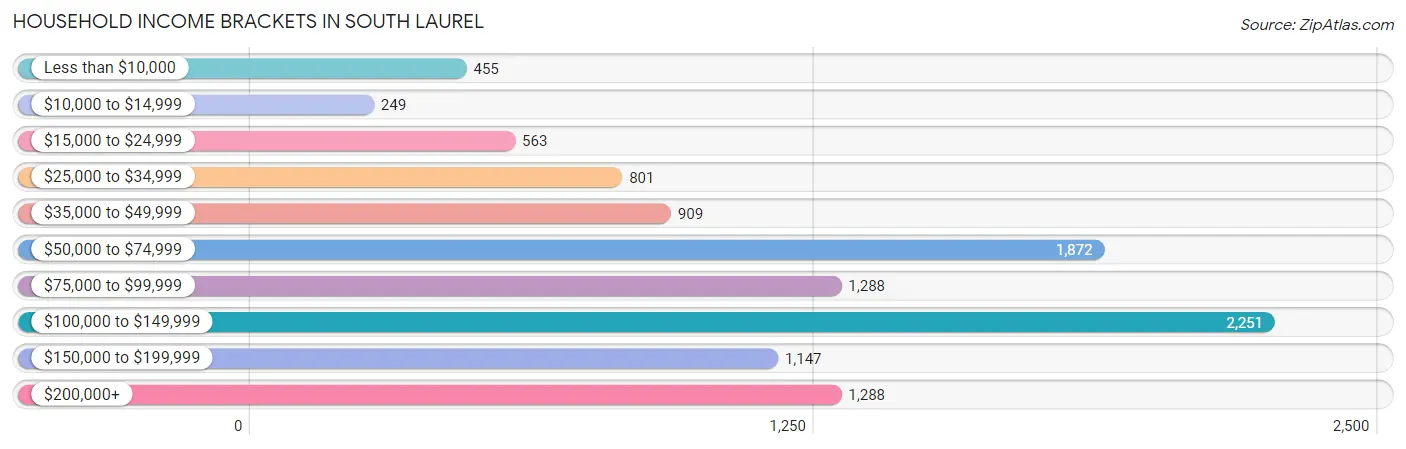
| Income Bracket | # Households | % Households |
| Less than $10,000 | 455 | 4.2% |
| $10,000 to $14,999 | 249 | 2.3% |
| $15,000 to $24,999 | 563 | 5.2% |
| $25,000 to $34,999 | 801 | 7.4% |
| $35,000 to $49,999 | 909 | 8.4% |
| $50,000 to $74,999 | 1,872 | 17.3% |
| $75,000 to $99,999 | 1,288 | 11.9% |
| $100,000 to $149,999 | 2,251 | 20.8% |
| $150,000 to $199,999 | 1,147 | 10.6% |
| $200,000+ | 1,288 | 11.9% |
Household Income by Householder Age in South Laurel
The median household income in South Laurel is $82,933, with the highest median household income of $104,391 found in the 45 to 64 years age bracket for the primary householder. A total of 4,228 households (39.1%) fall into this category. Meanwhile, the 15 to 24 years age bracket for the primary householder has the lowest median household income of $44,792, with 389 households (3.6%) in this group.
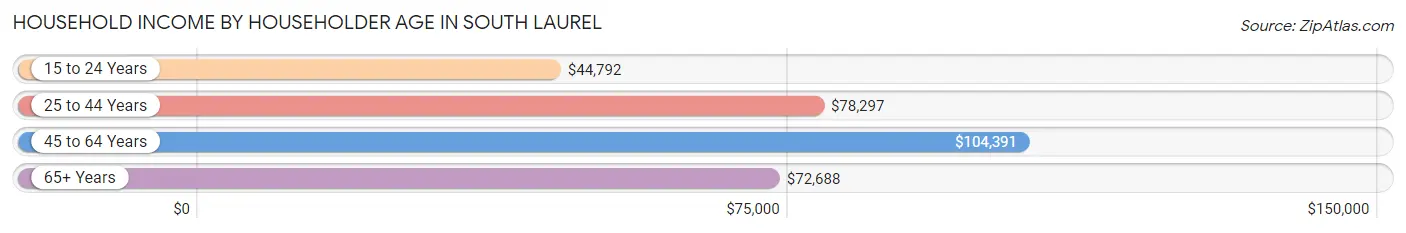
| Income Bracket | # Households | Median Income |
| 15 to 24 Years | 389 (3.6%) | $44,792 |
| 25 to 44 Years | 4,544 (42.0%) | $78,297 |
| 45 to 64 Years | 4,228 (39.1%) | $104,391 |
| 65+ Years | 1,662 (15.4%) | $72,688 |
| Total | 10,823 (100.0%) | $82,933 |
Poverty in South Laurel
Income Below Poverty by Sex and Age in South Laurel
With 10.3% poverty level for males and 10.9% for females among the residents of South Laurel, 16 and 17 year old males and 15 year old females are the most vulnerable to poverty, with 193 males (48.9%) and 162 females (55.7%) in their respective age groups living below the poverty level.
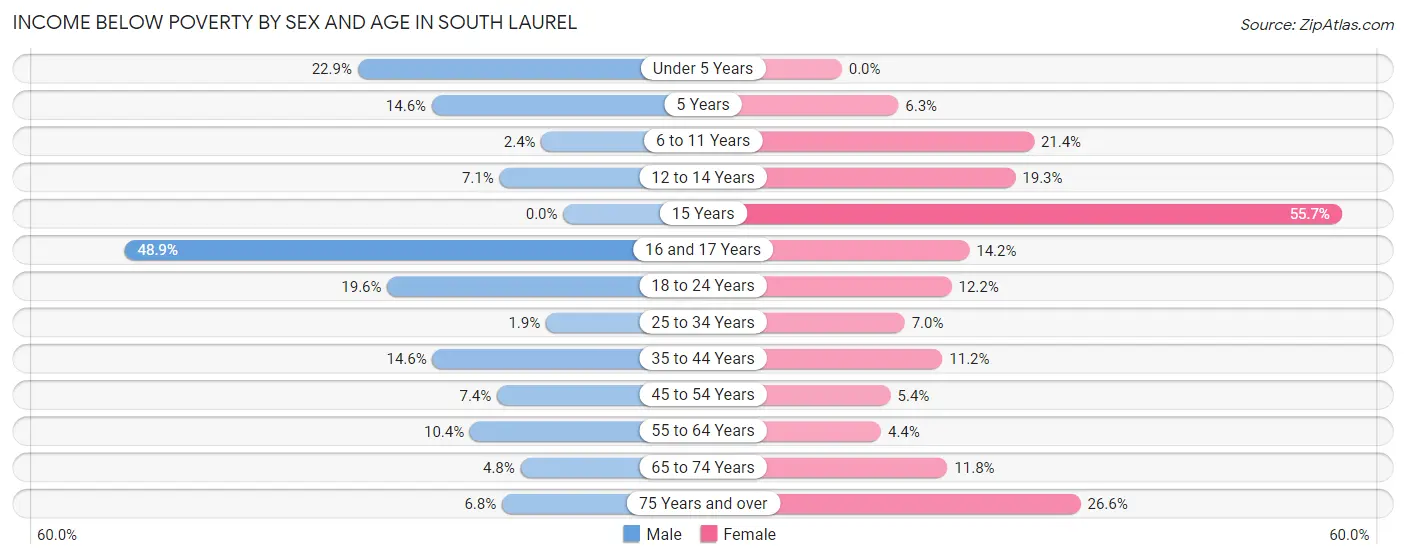
| Age Bracket | Male | Female |
| Under 5 Years | 166 (22.9%) | 0 (0.0%) |
| 5 Years | 41 (14.6%) | 15 (6.3%) |
| 6 to 11 Years | 33 (2.4%) | 180 (21.4%) |
| 12 to 14 Years | 33 (7.1%) | 127 (19.3%) |
| 15 Years | 0 (0.0%) | 162 (55.7%) |
| 16 and 17 Years | 193 (48.9%) | 24 (14.2%) |
| 18 to 24 Years | 184 (19.6%) | 143 (12.2%) |
| 25 to 34 Years | 39 (1.9%) | 197 (7.0%) |
| 35 to 44 Years | 279 (14.6%) | 243 (11.2%) |
| 45 to 54 Years | 164 (7.4%) | 95 (5.4%) |
| 55 to 64 Years | 141 (10.4%) | 80 (4.4%) |
| 65 to 74 Years | 39 (4.8%) | 106 (11.8%) |
| 75 Years and over | 28 (6.8%) | 242 (26.6%) |
| Total | 1,340 (10.3%) | 1,614 (10.9%) |
Income Above Poverty by Sex and Age in South Laurel
According to the poverty statistics in South Laurel, males aged 15 years and females aged under 5 years are the age groups that are most secure financially, with 100.0% of males and 100.0% of females in these age groups living above the poverty line.
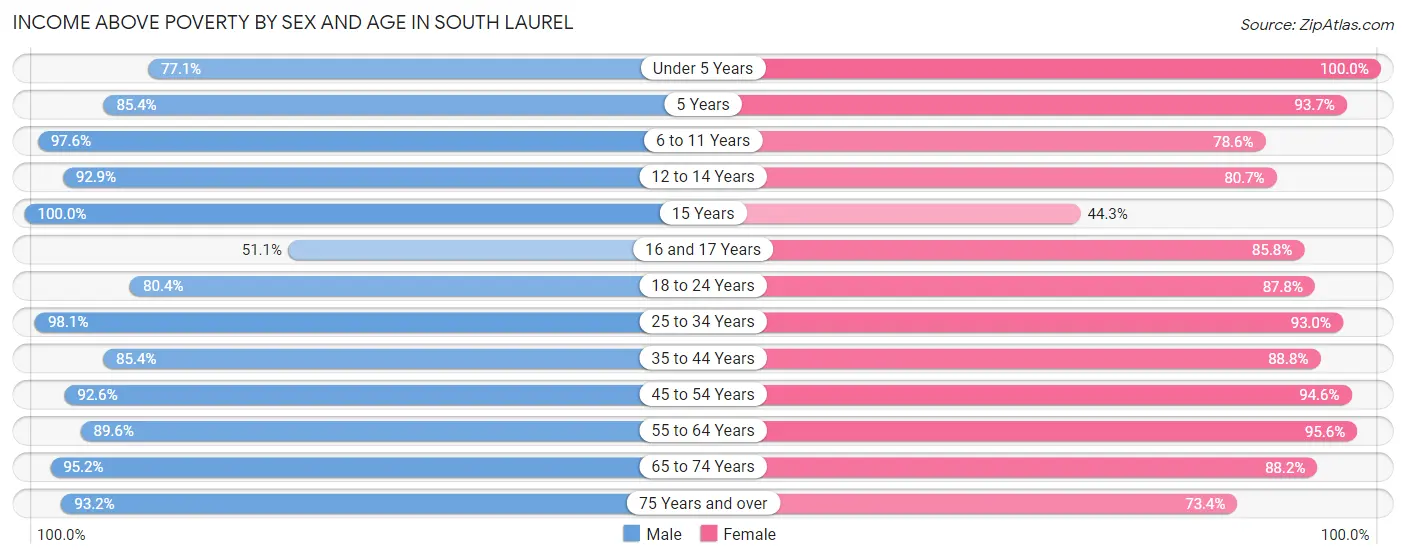
| Age Bracket | Male | Female |
| Under 5 Years | 559 (77.1%) | 1,122 (100.0%) |
| 5 Years | 239 (85.4%) | 223 (93.7%) |
| 6 to 11 Years | 1,317 (97.6%) | 661 (78.6%) |
| 12 to 14 Years | 431 (92.9%) | 530 (80.7%) |
| 15 Years | 93 (100.0%) | 129 (44.3%) |
| 16 and 17 Years | 202 (51.1%) | 145 (85.8%) |
| 18 to 24 Years | 755 (80.4%) | 1,027 (87.8%) |
| 25 to 34 Years | 1,979 (98.1%) | 2,612 (93.0%) |
| 35 to 44 Years | 1,636 (85.4%) | 1,926 (88.8%) |
| 45 to 54 Years | 2,057 (92.6%) | 1,651 (94.6%) |
| 55 to 64 Years | 1,216 (89.6%) | 1,749 (95.6%) |
| 65 to 74 Years | 781 (95.2%) | 795 (88.2%) |
| 75 Years and over | 382 (93.2%) | 668 (73.4%) |
| Total | 11,647 (89.7%) | 13,238 (89.1%) |
Income Below Poverty Among Married-Couple Families in South Laurel
The poverty statistics for married-couple families in South Laurel show that 3.5% or 135 of the total 3,883 families live below the poverty line. Families with 3 or 4 children have the highest poverty rate of 5.6%, comprising of 21 families. On the other hand, families with 1 or 2 children have the lowest poverty rate of 0.0%, which includes 0 families.
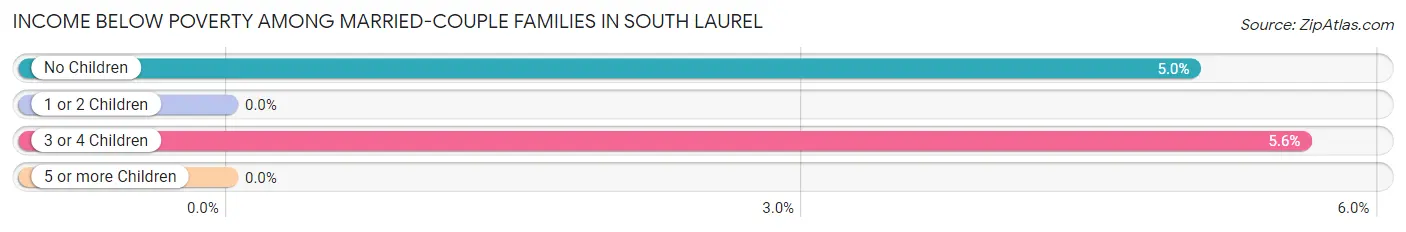
| Children | Above Poverty | Below Poverty |
| No Children | 2,151 (95.0%) | 114 (5.0%) |
| 1 or 2 Children | 1,235 (100.0%) | 0 (0.0%) |
| 3 or 4 Children | 353 (94.4%) | 21 (5.6%) |
| 5 or more Children | 9 (100.0%) | 0 (0.0%) |
| Total | 3,748 (96.5%) | 135 (3.5%) |
Income Below Poverty Among Single-Parent Households in South Laurel
According to the poverty data in South Laurel, 14.6% or 78 single-father households and 11.1% or 256 single-mother households are living below the poverty line. Among single-father households, those with 3 or 4 children have the highest poverty rate, with 29 households (100.0%) experiencing poverty. Likewise, among single-mother households, those with 3 or 4 children have the highest poverty rate, with 93 households (27.4%) falling below the poverty line.
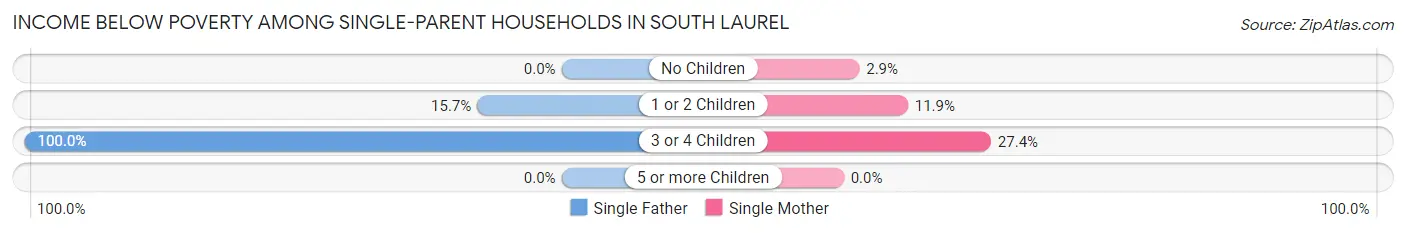
| Children | Single Father | Single Mother |
| No Children | 0 (0.0%) | 23 (2.9%) |
| 1 or 2 Children | 49 (15.7%) | 140 (11.9%) |
| 3 or 4 Children | 29 (100.0%) | 93 (27.4%) |
| 5 or more Children | 0 (0.0%) | 0 (0.0%) |
| Total | 78 (14.6%) | 256 (11.1%) |
Income Below Poverty Among Married-Couple vs Single-Parent Households in South Laurel
The poverty data for South Laurel shows that 135 of the married-couple family households (3.5%) and 334 of the single-parent households (11.8%) are living below the poverty level. Within the married-couple family households, those with 3 or 4 children have the highest poverty rate, with 21 households (5.6%) falling below the poverty line. Among the single-parent households, those with 3 or 4 children have the highest poverty rate, with 122 household (33.2%) living below poverty.
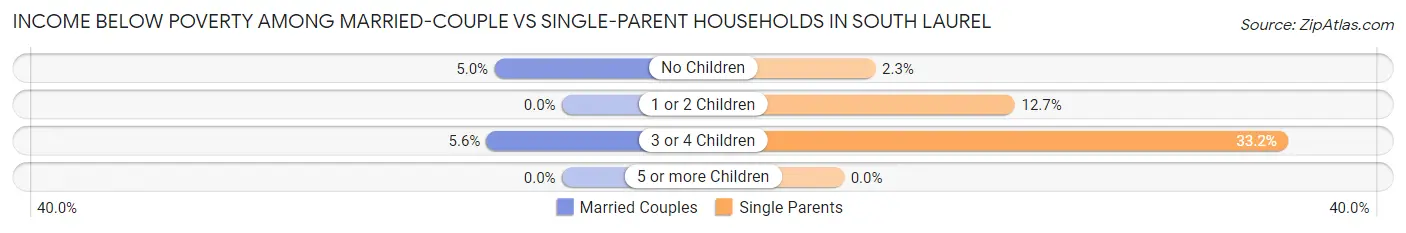
| Children | Married-Couple Families | Single-Parent Households |
| No Children | 114 (5.0%) | 23 (2.3%) |
| 1 or 2 Children | 0 (0.0%) | 189 (12.7%) |
| 3 or 4 Children | 21 (5.6%) | 122 (33.2%) |
| 5 or more Children | 0 (0.0%) | 0 (0.0%) |
| Total | 135 (3.5%) | 334 (11.8%) |
Race in South Laurel
The most populous races in South Laurel are Black / African American (18,038 | 63.4%), White / Caucasian (4,316 | 15.2%), and Hispanic or Latino (4,192 | 14.7%).
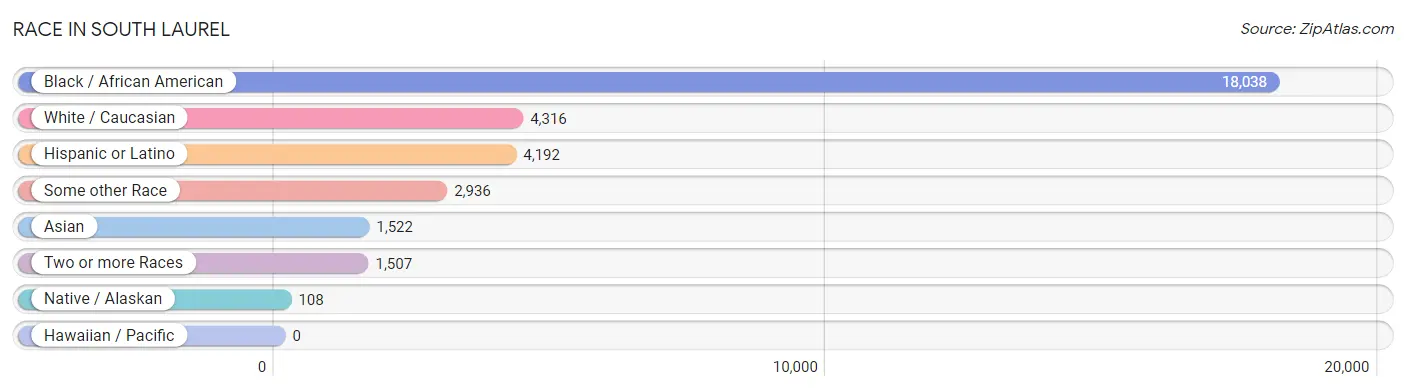
| Race | # Population | % Population |
| Asian | 1,522 | 5.3% |
| Black / African American | 18,038 | 63.4% |
| Hawaiian / Pacific | 0 | 0.0% |
| Hispanic or Latino | 4,192 | 14.7% |
| Native / Alaskan | 108 | 0.4% |
| White / Caucasian | 4,316 | 15.2% |
| Two or more Races | 1,507 | 5.3% |
| Some other Race | 2,936 | 10.3% |
| Total | 28,427 | 100.0% |
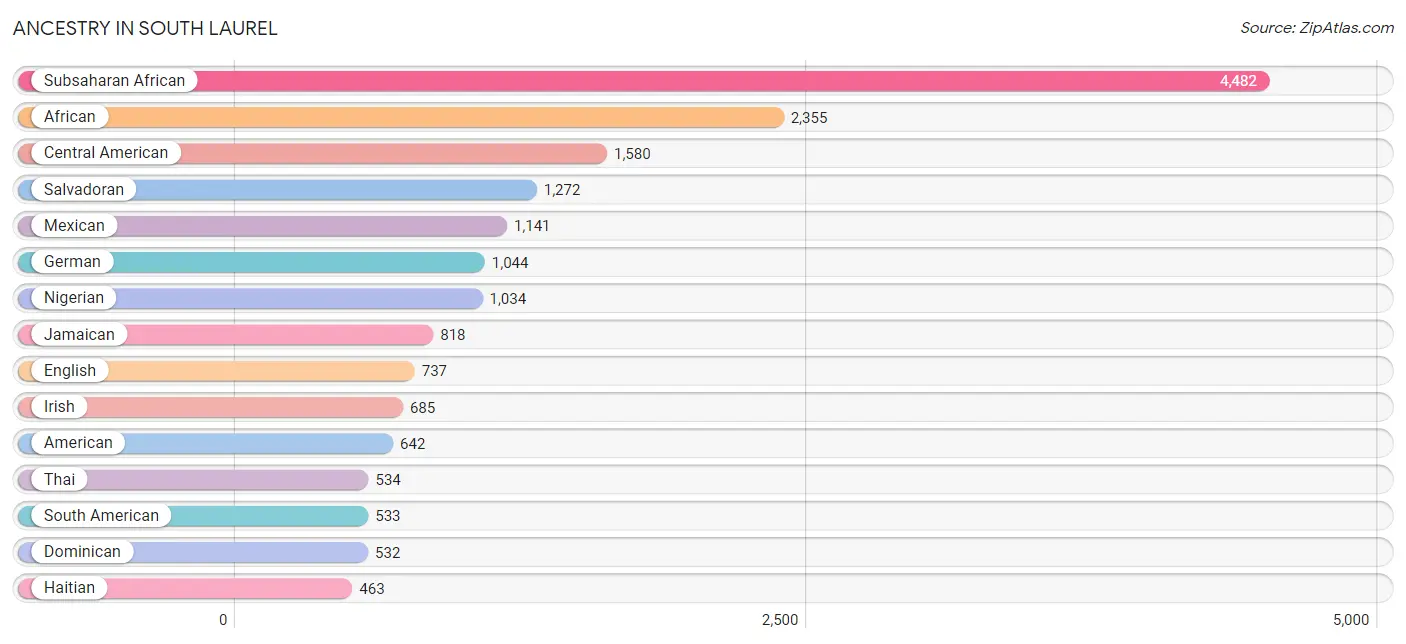
Ancestry in South Laurel
The most populous ancestries reported in South Laurel are Subsaharan African (4,482 | 15.8%), African (2,355 | 8.3%), Central American (1,580 | 5.6%), Salvadoran (1,272 | 4.5%), and Mexican (1,141 | 4.0%), together accounting for 38.1% of all South Laurel residents.
| Ancestry | # Population | % Population |
| African | 2,355 | 8.3% |
| American | 642 | 2.3% |
| Arab | 100 | 0.4% |
| Argentinean | 31 | 0.1% |
| Austrian | 23 | 0.1% |
| Belgian | 12 | 0.0% |
| Belizean | 12 | 0.0% |
| Bhutanese | 36 | 0.1% |
| Blackfeet | 9 | 0.0% |
| Brazilian | 44 | 0.2% |
| British | 83 | 0.3% |
| British West Indian | 32 | 0.1% |
| Burmese | 96 | 0.3% |
| Cape Verdean | 58 | 0.2% |
| Central American | 1,580 | 5.6% |
| Central American Indian | 115 | 0.4% |
| Cherokee | 45 | 0.2% |
| Chilean | 128 | 0.4% |
| Colombian | 251 | 0.9% |
| Cree | 20 | 0.1% |
| Cuban | 32 | 0.1% |
| Czech | 74 | 0.3% |
| Danish | 11 | 0.0% |
| Dominican | 532 | 1.9% |
| Dutch | 88 | 0.3% |
| Eastern European | 10 | 0.0% |
| Egyptian | 18 | 0.1% |
| English | 737 | 2.6% |
| Ethiopian | 265 | 0.9% |
| European | 141 | 0.5% |
| Filipino | 87 | 0.3% |
| Finnish | 37 | 0.1% |
| French | 157 | 0.5% |
| French Canadian | 6 | 0.0% |
| German | 1,044 | 3.7% |
| Ghanaian | 235 | 0.8% |
| Greek | 11 | 0.0% |
| Guamanian / Chamorro | 46 | 0.2% |
| Guatemalan | 196 | 0.7% |
| Guyanese | 202 | 0.7% |
| Haitian | 463 | 1.6% |
| Honduran | 68 | 0.2% |
| Hungarian | 128 | 0.4% |
| Indian (Asian) | 370 | 1.3% |
| Indonesian | 37 | 0.1% |
| Iranian | 25 | 0.1% |
| Irish | 685 | 2.4% |
| Italian | 387 | 1.4% |
| Jamaican | 818 | 2.9% |
| Kenyan | 7 | 0.0% |
| Korean | 246 | 0.9% |
| Liberian | 65 | 0.2% |
| Lithuanian | 12 | 0.0% |
| Malaysian | 2 | 0.0% |
| Mexican | 1,141 | 4.0% |
| Nigerian | 1,034 | 3.6% |
| Norwegian | 36 | 0.1% |
| Panamanian | 42 | 0.2% |
| Paraguayan | 16 | 0.1% |
| Peruvian | 78 | 0.3% |
| Polish | 117 | 0.4% |
| Portuguese | 144 | 0.5% |
| Puerto Rican | 287 | 1.0% |
| Romanian | 25 | 0.1% |
| Russian | 169 | 0.6% |
| Salvadoran | 1,272 | 4.5% |
| Scotch-Irish | 63 | 0.2% |
| Scottish | 110 | 0.4% |
| Sierra Leonean | 56 | 0.2% |
| South American | 533 | 1.9% |
| Spaniard | 5 | 0.0% |
| Spanish | 4 | 0.0% |
| Sri Lankan | 86 | 0.3% |
| Subsaharan African | 4,482 | 15.8% |
| Sudanese | 5 | 0.0% |
| Swedish | 34 | 0.1% |
| Thai | 534 | 1.9% |
| Trinidadian and Tobagonian | 245 | 0.9% |
| U.S. Virgin Islander | 45 | 0.2% |
| Ugandan | 71 | 0.3% |
| Venezuelan | 29 | 0.1% |
| Welsh | 48 | 0.2% |
| West Indian | 325 | 1.1% |
| Zimbabwean | 23 | 0.1% | View All 84 Rows |
Immigrants in South Laurel
The most numerous immigrant groups reported in South Laurel came from Africa (3,663 | 12.9%), Latin America (3,590 | 12.6%), Western Africa (1,937 | 6.8%), Central America (1,603 | 5.6%), and Caribbean (1,437 | 5.1%), together accounting for 43.0% of all South Laurel residents.
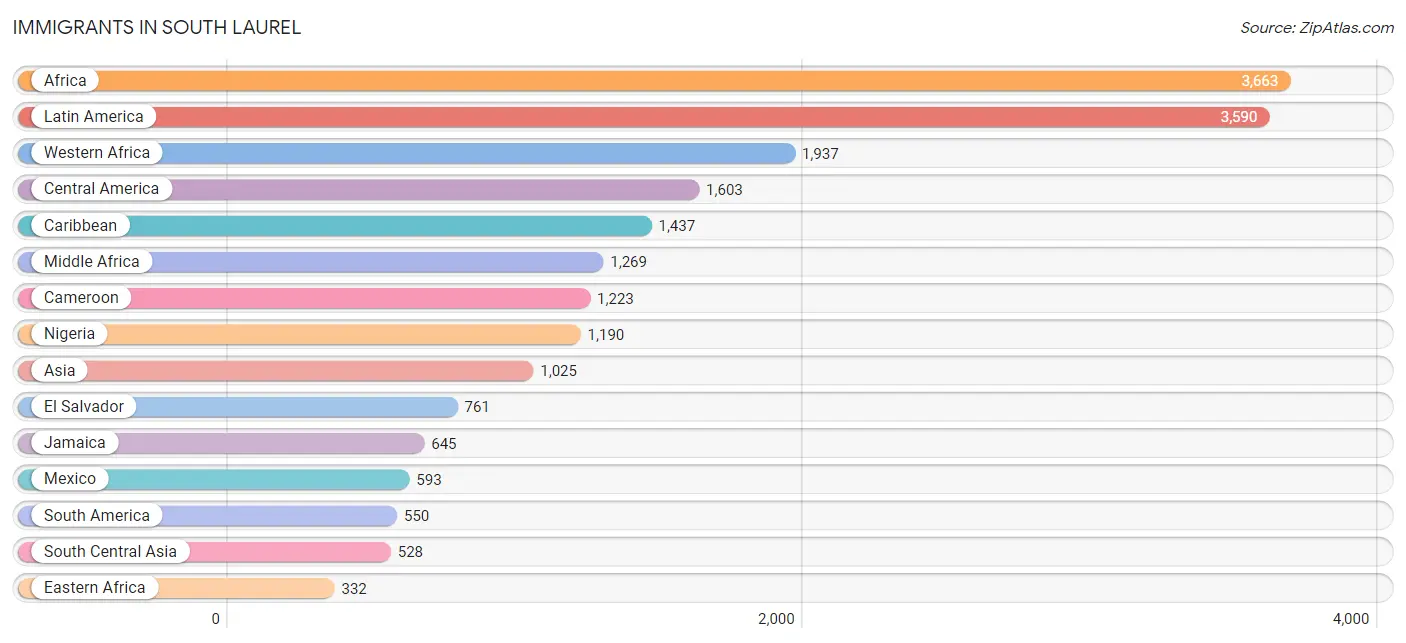
| Immigration Origin | # Population | % Population |
| Africa | 3,663 | 12.9% |
| Argentina | 14 | 0.1% |
| Asia | 1,025 | 3.6% |
| Bangladesh | 18 | 0.1% |
| Bolivia | 32 | 0.1% |
| Brazil | 101 | 0.4% |
| Cameroon | 1,223 | 4.3% |
| Canada | 4 | 0.0% |
| Caribbean | 1,437 | 5.1% |
| Central America | 1,603 | 5.6% |
| China | 115 | 0.4% |
| Colombia | 251 | 0.9% |
| Congo | 46 | 0.2% |
| Cuba | 19 | 0.1% |
| Dominican Republic | 267 | 0.9% |
| Eastern Africa | 332 | 1.2% |
| Eastern Asia | 188 | 0.7% |
| Eastern Europe | 43 | 0.2% |
| Egypt | 6 | 0.0% |
| El Salvador | 761 | 2.7% |
| England | 29 | 0.1% |
| Eritrea | 10 | 0.0% |
| Ethiopia | 196 | 0.7% |
| Europe | 150 | 0.5% |
| France | 13 | 0.1% |
| Germany | 17 | 0.1% |
| Ghana | 312 | 1.1% |
| Greece | 11 | 0.0% |
| Grenada | 36 | 0.1% |
| Guatemala | 156 | 0.5% |
| Guyana | 61 | 0.2% |
| Haiti | 146 | 0.5% |
| Honduras | 69 | 0.2% |
| Hong Kong | 11 | 0.0% |
| India | 321 | 1.1% |
| Iran | 25 | 0.1% |
| Ireland | 8 | 0.0% |
| Italy | 13 | 0.1% |
| Jamaica | 645 | 2.3% |
| Japan | 3 | 0.0% |
| Jordan | 51 | 0.2% |
| Kenya | 7 | 0.0% |
| Korea | 70 | 0.3% |
| Kuwait | 35 | 0.1% |
| Latin America | 3,590 | 12.6% |
| Liberia | 51 | 0.2% |
| Malaysia | 19 | 0.1% |
| Mexico | 593 | 2.1% |
| Middle Africa | 1,269 | 4.5% |
| Nepal | 68 | 0.2% |
| Netherlands | 10 | 0.0% |
| Nigeria | 1,190 | 4.2% |
| Northern Africa | 6 | 0.0% |
| Northern Europe | 43 | 0.2% |
| Pakistan | 96 | 0.3% |
| Panama | 24 | 0.1% |
| Peru | 56 | 0.2% |
| Philippines | 180 | 0.6% |
| Poland | 18 | 0.1% |
| Romania | 25 | 0.1% |
| Senegal | 20 | 0.1% |
| Sierra Leone | 243 | 0.9% |
| South Africa | 10 | 0.0% |
| South America | 550 | 1.9% |
| South Central Asia | 528 | 1.9% |
| South Eastern Asia | 223 | 0.8% |
| Southern Europe | 24 | 0.1% |
| Taiwan | 55 | 0.2% |
| Trinidad and Tobago | 320 | 1.1% |
| Uganda | 73 | 0.3% |
| Venezuela | 19 | 0.1% |
| Vietnam | 24 | 0.1% |
| Western Africa | 1,937 | 6.8% |
| Western Asia | 86 | 0.3% |
| Western Europe | 40 | 0.1% |
| Zimbabwe | 23 | 0.1% | View All 76 Rows |
Sex and Age in South Laurel
Sex and Age in South Laurel
The most populous age groups in South Laurel are 5 to 9 Years (1,378 | 10.3%) for men and 25 to 29 Years (1,459 | 9.7%) for women.
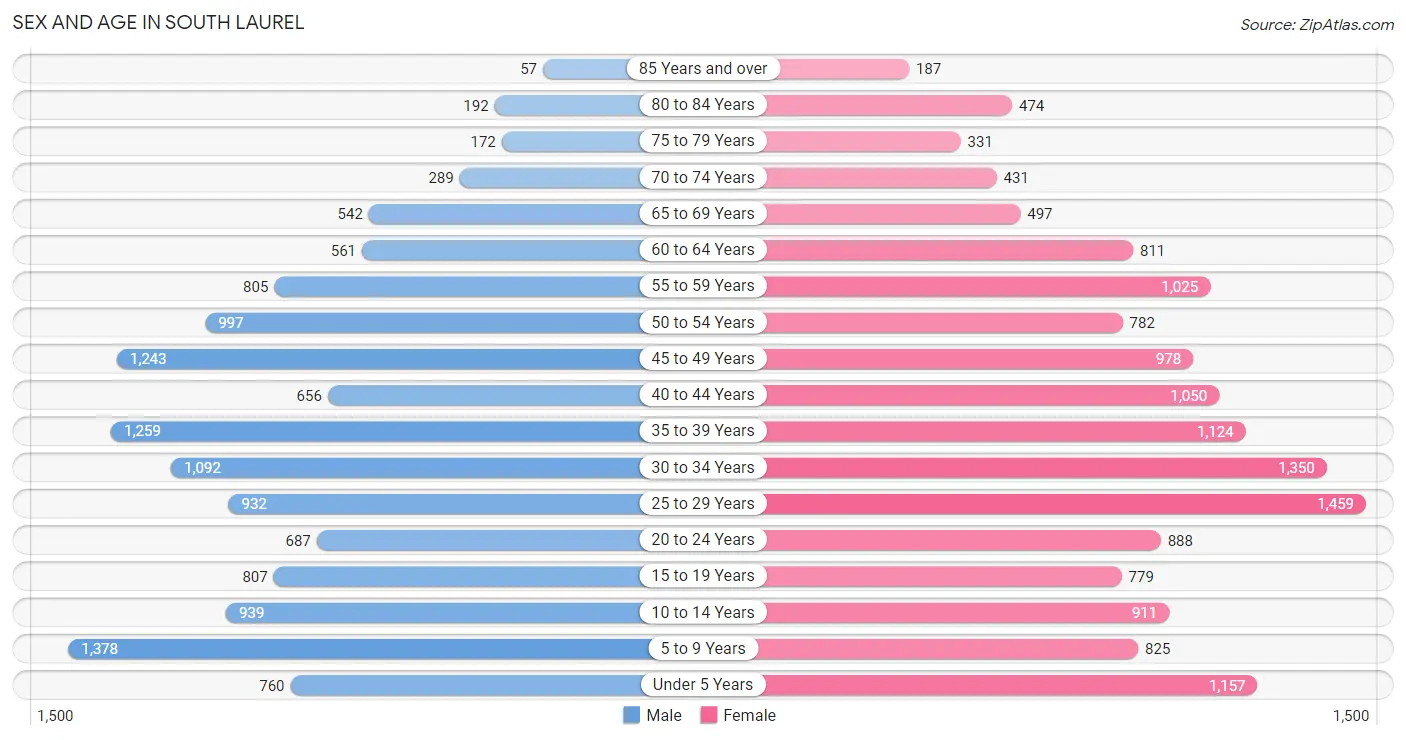
| Age Bracket | Male | Female |
| Under 5 Years | 760 (5.7%) | 1,157 (7.7%) |
| 5 to 9 Years | 1,378 (10.3%) | 825 (5.5%) |
| 10 to 14 Years | 939 (7.0%) | 911 (6.0%) |
| 15 to 19 Years | 807 (6.0%) | 779 (5.2%) |
| 20 to 24 Years | 687 (5.1%) | 888 (5.9%) |
| 25 to 29 Years | 932 (7.0%) | 1,459 (9.7%) |
| 30 to 34 Years | 1,092 (8.2%) | 1,350 (9.0%) |
| 35 to 39 Years | 1,259 (9.4%) | 1,124 (7.5%) |
| 40 to 44 Years | 656 (4.9%) | 1,050 (7.0%) |
| 45 to 49 Years | 1,243 (9.3%) | 978 (6.5%) |
| 50 to 54 Years | 997 (7.5%) | 782 (5.2%) |
| 55 to 59 Years | 805 (6.0%) | 1,025 (6.8%) |
| 60 to 64 Years | 561 (4.2%) | 811 (5.4%) |
| 65 to 69 Years | 542 (4.1%) | 497 (3.3%) |
| 70 to 74 Years | 289 (2.2%) | 431 (2.9%) |
| 75 to 79 Years | 172 (1.3%) | 331 (2.2%) |
| 80 to 84 Years | 192 (1.4%) | 474 (3.2%) |
| 85 Years and over | 57 (0.4%) | 187 (1.2%) |
| Total | 13,368 (100.0%) | 15,059 (100.0%) |
Families and Households in South Laurel
Median Family Size in South Laurel
The median family size in South Laurel is 3.21 persons per family, with married-couple families (3,883 | 57.8%) accounting for the largest median family size of 3.27 persons per family. On the other hand, single male/father families (533 | 7.9%) represent the smallest median family size with 2.84 persons per family.
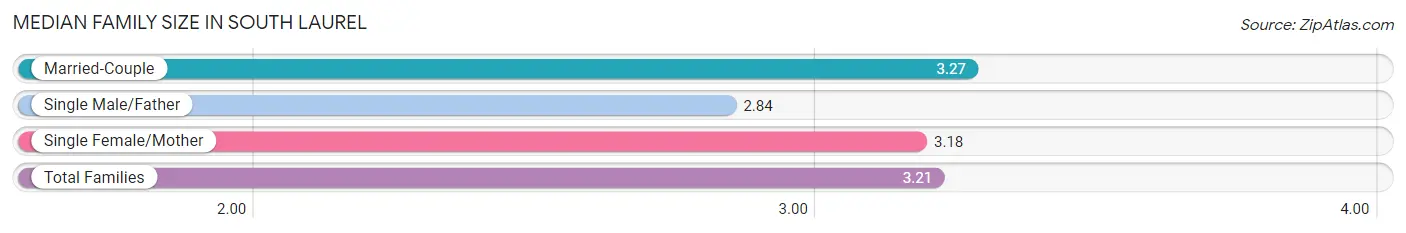
| Family Type | # Families | Family Size |
| Married-Couple | 3,883 (57.8%) | 3.27 |
| Single Male/Father | 533 (7.9%) | 2.84 |
| Single Female/Mother | 2,302 (34.3%) | 3.18 |
| Total Families | 6,718 (100.0%) | 3.21 |
Median Household Size in South Laurel
The median household size in South Laurel is 2.59 persons per household, with single female/mother households (2,302 | 21.3%) accounting for the largest median household size of 3.44 persons per household. non-family households (4,105 | 37.9%) represent the smallest median household size with 1.36 persons per household.
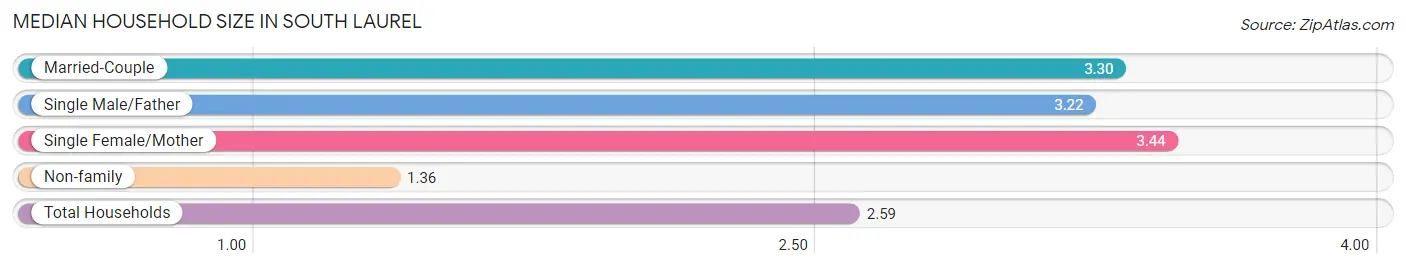
| Household Type | # Households | Household Size |
| Married-Couple | 3,883 (35.9%) | 3.30 |
| Single Male/Father | 533 (4.9%) | 3.22 |
| Single Female/Mother | 2,302 (21.3%) | 3.44 |
| Non-family | 4,105 (37.9%) | 1.36 |
| Total Households | 10,823 (100.0%) | 2.59 |
Household Size by Marriage Status in South Laurel
Out of a total of 10,823 households in South Laurel, 6,718 (62.1%) are family households, while 4,105 (37.9%) are nonfamily households. The most numerous type of family households are 2-person households, comprising 2,748, and the most common type of nonfamily households are 1-person households, comprising 3,398.
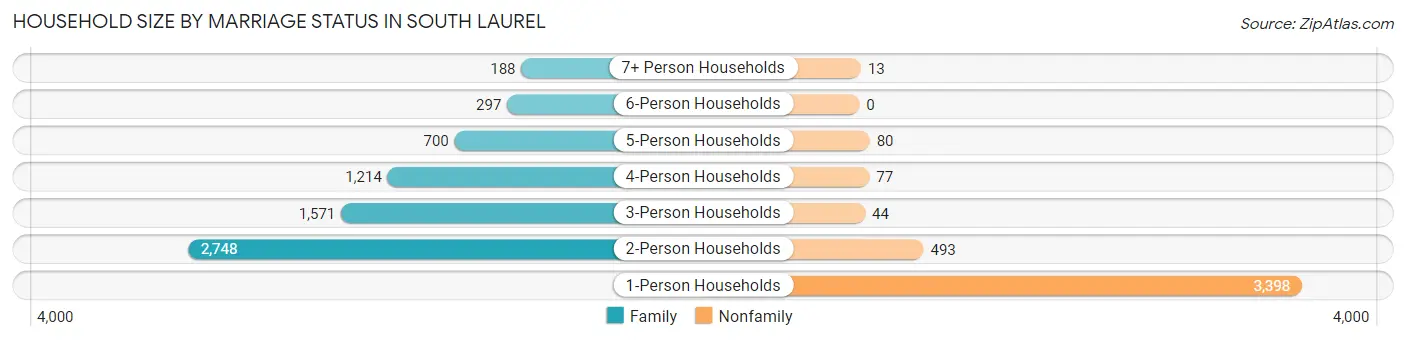
| Household Size | Family Households | Nonfamily Households |
| 1-Person Households | - | 3,398 (31.4%) |
| 2-Person Households | 2,748 (25.4%) | 493 (4.6%) |
| 3-Person Households | 1,571 (14.5%) | 44 (0.4%) |
| 4-Person Households | 1,214 (11.2%) | 77 (0.7%) |
| 5-Person Households | 700 (6.5%) | 80 (0.7%) |
| 6-Person Households | 297 (2.7%) | 0 (0.0%) |
| 7+ Person Households | 188 (1.7%) | 13 (0.1%) |
| Total | 6,718 (62.1%) | 4,105 (37.9%) |
Female Fertility in South Laurel
Fertility by Age in South Laurel
Average fertility rate in South Laurel is 47.0 births per 1,000 women. Women in the age bracket of 20 to 34 years have the highest fertility rate with 64.0 births per 1,000 women. Women in the age bracket of 20 to 34 years acount for 63.6% of all women with births.
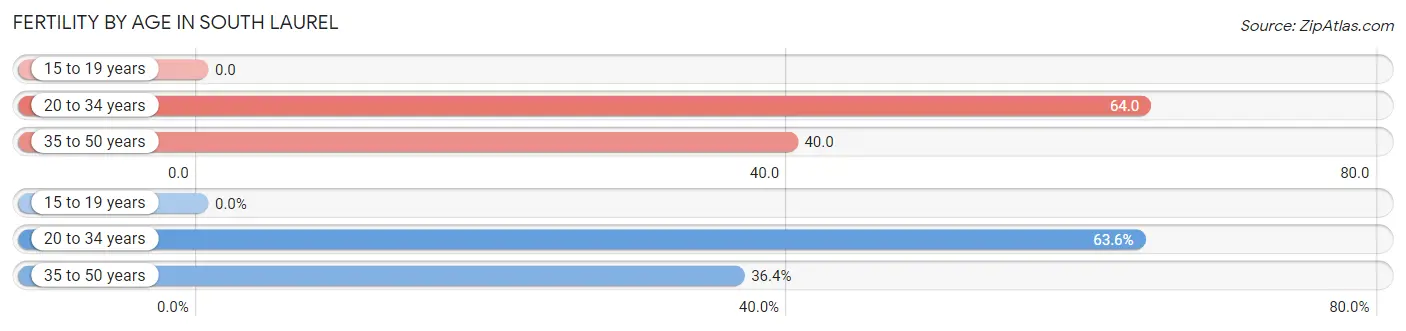
| Age Bracket | Women with Births | Births / 1,000 Women |
| 15 to 19 years | 0 (0.0%) | 0.0 |
| 20 to 34 years | 236 (63.6%) | 64.0 |
| 35 to 50 years | 135 (36.4%) | 40.0 |
| Total | 371 (100.0%) | 47.0 |
Fertility by Age by Marriage Status in South Laurel
62.0% of women with births (371) in South Laurel are married. The highest percentage of unmarried women with births falls into 20 to 34 years age bracket with 42.4% of them unmarried at the time of birth, while the lowest percentage of unmarried women with births belong to 35 to 50 years age bracket with 30.4% of them unmarried.
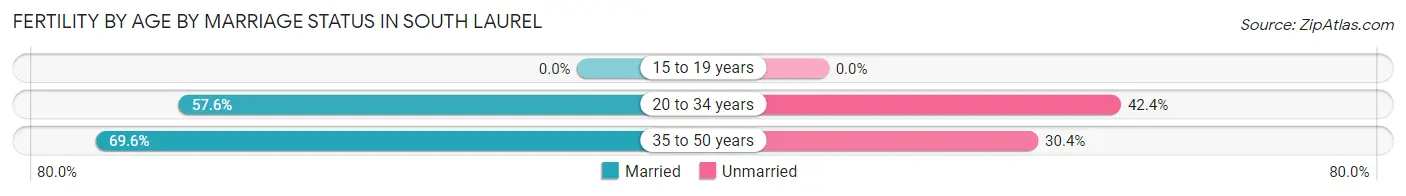
| Age Bracket | Married | Unmarried |
| 15 to 19 years | 0 (0.0%) | 0 (0.0%) |
| 20 to 34 years | 136 (57.6%) | 100 (42.4%) |
| 35 to 50 years | 94 (69.6%) | 41 (30.4%) |
| Total | 230 (62.0%) | 141 (38.0%) |
Fertility by Education in South Laurel
Average fertility rate in South Laurel is 47.0 births per 1,000 women. Women with the education attainment of less than high school have the highest fertility rate of 64.0 births per 1,000 women, while women with the education attainment of high school diploma have the lowest fertility at 24.0 births per 1,000 women. Women with the education attainment of college or associate's degree represent 30.5% of all women with births.
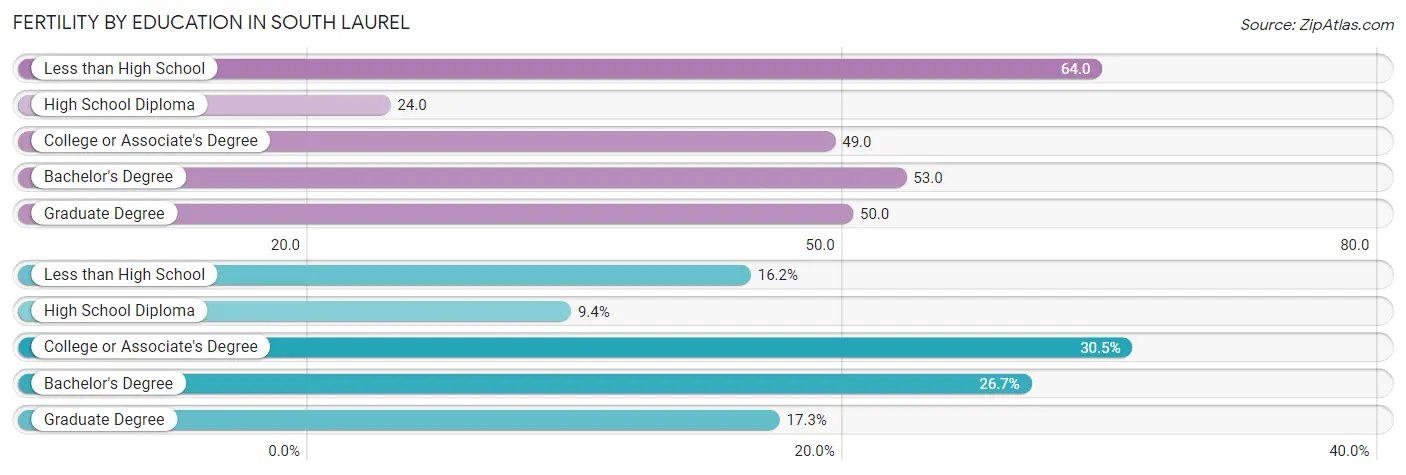
| Educational Attainment | Women with Births | Births / 1,000 Women |
| Less than High School | 60 (16.2%) | 64.0 |
| High School Diploma | 35 (9.4%) | 24.0 |
| College or Associate's Degree | 113 (30.5%) | 49.0 |
| Bachelor's Degree | 99 (26.7%) | 53.0 |
| Graduate Degree | 64 (17.2%) | 50.0 |
| Total | 371 (100.0%) | 47.0 |
Fertility by Education by Marriage Status in South Laurel
38.0% of women with births in South Laurel are unmarried. Women with the educational attainment of graduate degree are most likely to be married with 100.0% of them married at childbirth, while women with the educational attainment of high school diploma are least likely to be married with 91.4% of them unmarried at childbirth.
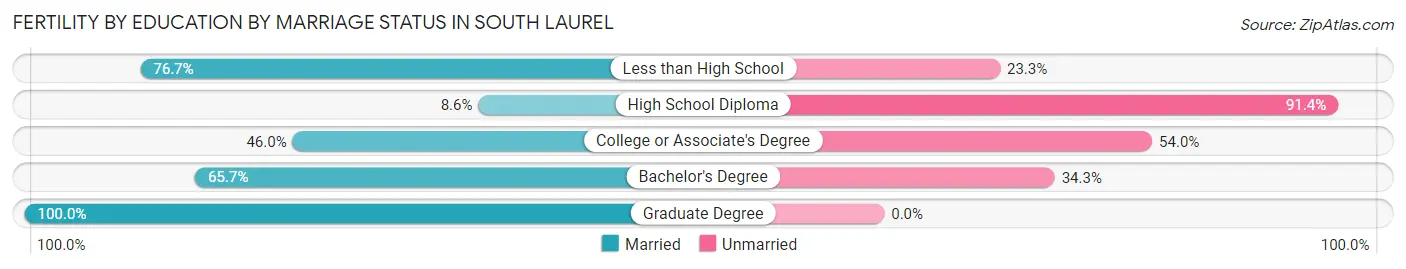
| Educational Attainment | Married | Unmarried |
| Less than High School | 46 (76.7%) | 14 (23.3%) |
| High School Diploma | 3 (8.6%) | 32 (91.4%) |
| College or Associate's Degree | 52 (46.0%) | 61 (54.0%) |
| Bachelor's Degree | 65 (65.7%) | 34 (34.3%) |
| Graduate Degree | 64 (100.0%) | 0 (0.0%) |
| Total | 230 (62.0%) | 141 (38.0%) |
Employment Characteristics in South Laurel
Employment by Class of Employer in South Laurel
Among the 15,381 employed individuals in South Laurel, private company employees (9,260 | 60.2%), federal government employees (1,773 | 11.5%), and not-for-profit organizations (1,481 | 9.6%) make up the most common classes of employment.
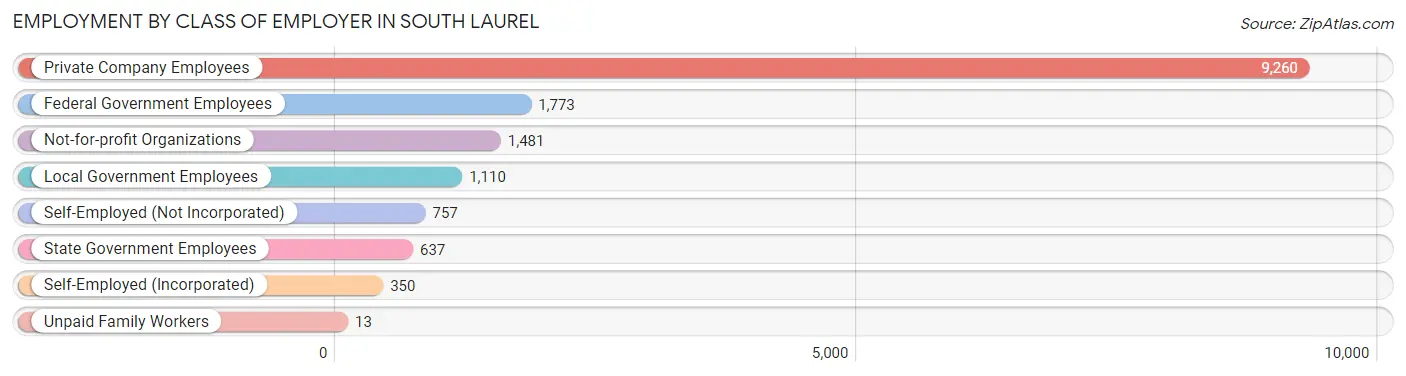
| Employer Class | # Employees | % Employees |
| Private Company Employees | 9,260 | 60.2% |
| Self-Employed (Incorporated) | 350 | 2.3% |
| Self-Employed (Not Incorporated) | 757 | 4.9% |
| Not-for-profit Organizations | 1,481 | 9.6% |
| Local Government Employees | 1,110 | 7.2% |
| State Government Employees | 637 | 4.1% |
| Federal Government Employees | 1,773 | 11.5% |
| Unpaid Family Workers | 13 | 0.1% |
| Total | 15,381 | 100.0% |
Employment Status by Age in South Laurel
According to the labor force statistics for South Laurel, out of the total population over 16 years of age (22,073), 75.4% or 16,643 individuals are in the labor force, with 5.3% or 882 of them unemployed. The age group with the highest labor force participation rate is 25 to 29 years, with 93.9% or 2,245 individuals in the labor force. Within the labor force, the 20 to 24 years age range has the highest percentage of unemployed individuals, with 18.2% or 216 of them being unemployed.
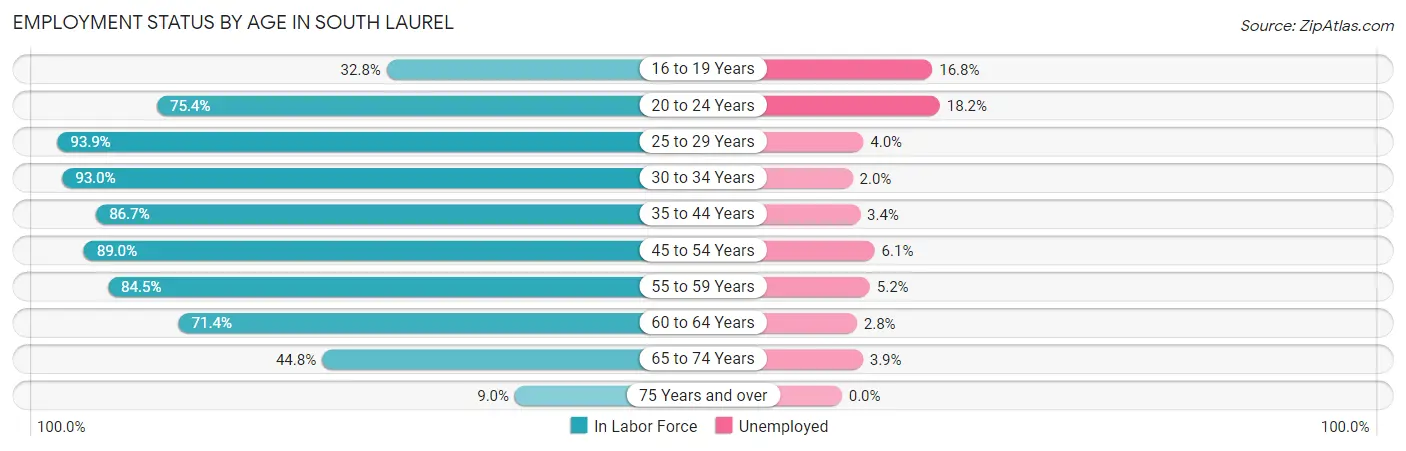
| Age Bracket | In Labor Force | Unemployed |
| 16 to 19 Years | 394 (32.8%) | 66 (16.8%) |
| 20 to 24 Years | 1,188 (75.4%) | 216 (18.2%) |
| 25 to 29 Years | 2,245 (93.9%) | 90 (4.0%) |
| 30 to 34 Years | 2,271 (93.0%) | 45 (2.0%) |
| 35 to 44 Years | 3,545 (86.7%) | 121 (3.4%) |
| 45 to 54 Years | 3,560 (89.0%) | 217 (6.1%) |
| 55 to 59 Years | 1,546 (84.5%) | 80 (5.2%) |
| 60 to 64 Years | 980 (71.4%) | 27 (2.8%) |
| 65 to 74 Years | 788 (44.8%) | 31 (3.9%) |
| 75 Years and over | 127 (9.0%) | 0 (0.0%) |
| Total | 16,643 (75.4%) | 882 (5.3%) |
Employment Status by Educational Attainment in South Laurel
According to labor force statistics for South Laurel, 87.7% of individuals (14,141) out of the total population between 25 and 64 years of age (16,124) are in the labor force, with 4.1% or 580 of them being unemployed. The group with the highest labor force participation rate are those with the educational attainment of bachelor's degree or higher, with 93.9% or 6,467 individuals in the labor force. Within the labor force, individuals with less than high school education have the highest percentage of unemployment, with 11.4% or 89 of them being unemployed.
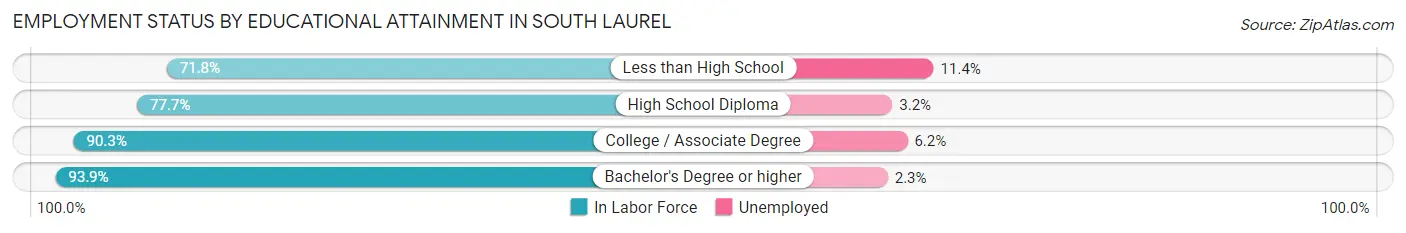
| Educational Attainment | In Labor Force | Unemployed |
| Less than High School | 784 (71.8%) | 124 (11.4%) |
| High School Diploma | 2,876 (77.7%) | 118 (3.2%) |
| College / Associate Degree | 4,013 (90.3%) | 276 (6.2%) |
| Bachelor's Degree or higher | 6,467 (93.9%) | 158 (2.3%) |
| Total | 14,141 (87.7%) | 661 (4.1%) |
Employment Occupations by Sex in South Laurel
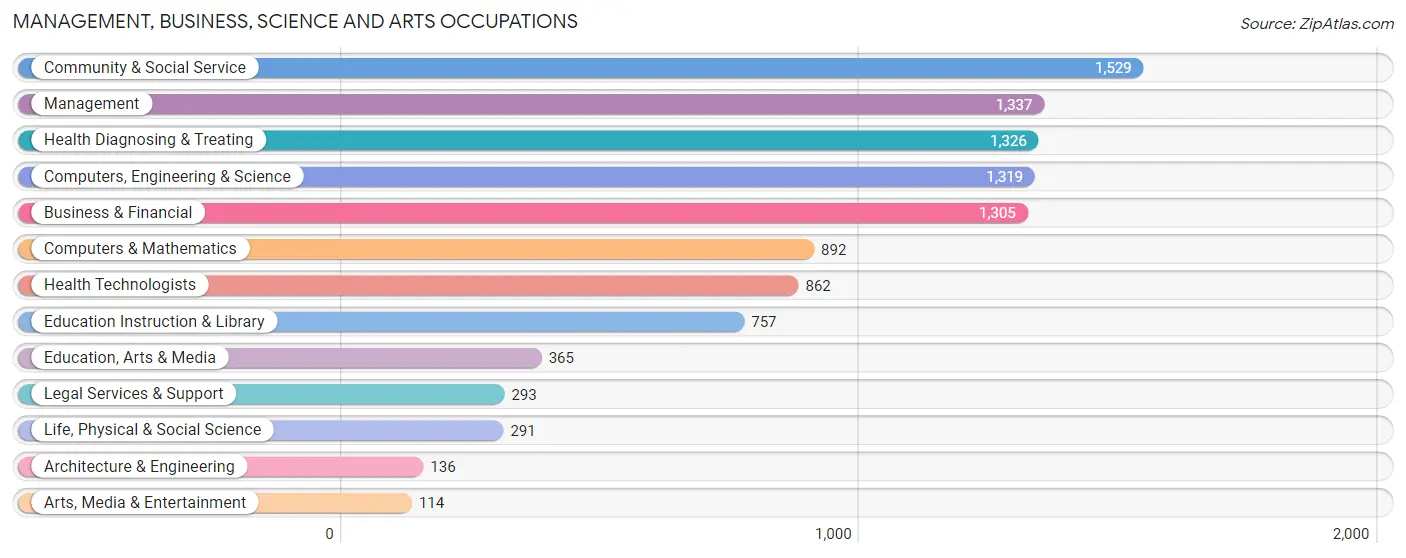
Management, Business, Science and Arts Occupations
The most common Management, Business, Science and Arts occupations in South Laurel are Community & Social Service (1,529 | 9.8%), Management (1,337 | 8.6%), Health Diagnosing & Treating (1,326 | 8.5%), Computers, Engineering & Science (1,319 | 8.5%), and Business & Financial (1,305 | 8.4%).
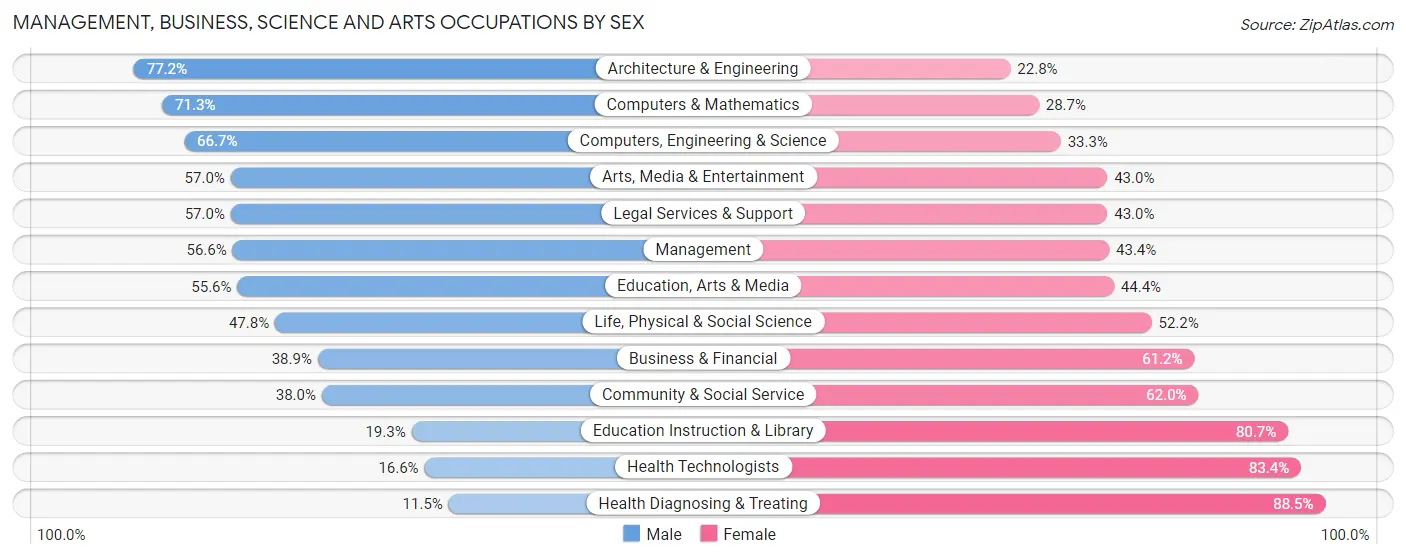
Management, Business, Science and Arts Occupations by Sex
Within the Management, Business, Science and Arts occupations in South Laurel, the most male-oriented occupations are Architecture & Engineering (77.2%), Computers & Mathematics (71.3%), and Computers, Engineering & Science (66.7%), while the most female-oriented occupations are Health Diagnosing & Treating (88.5%), Health Technologists (83.4%), and Education Instruction & Library (80.7%).
| Occupation | Male | Female |
| Management | 757 (56.6%) | 580 (43.4%) |
| Business & Financial | 507 (38.9%) | 798 (61.2%) |
| Computers, Engineering & Science | 880 (66.7%) | 439 (33.3%) |
| Computers & Mathematics | 636 (71.3%) | 256 (28.7%) |
| Architecture & Engineering | 105 (77.2%) | 31 (22.8%) |
| Life, Physical & Social Science | 139 (47.8%) | 152 (52.2%) |
| Community & Social Service | 581 (38.0%) | 948 (62.0%) |
| Education, Arts & Media | 203 (55.6%) | 162 (44.4%) |
| Legal Services & Support | 167 (57.0%) | 126 (43.0%) |
| Education Instruction & Library | 146 (19.3%) | 611 (80.7%) |
| Arts, Media & Entertainment | 65 (57.0%) | 49 (43.0%) |
| Health Diagnosing & Treating | 153 (11.5%) | 1,173 (88.5%) |
| Health Technologists | 143 (16.6%) | 719 (83.4%) |
| Total (Category) | 2,878 (42.2%) | 3,938 (57.8%) |
| Total (Overall) | 7,276 (46.7%) | 8,294 (53.3%) |
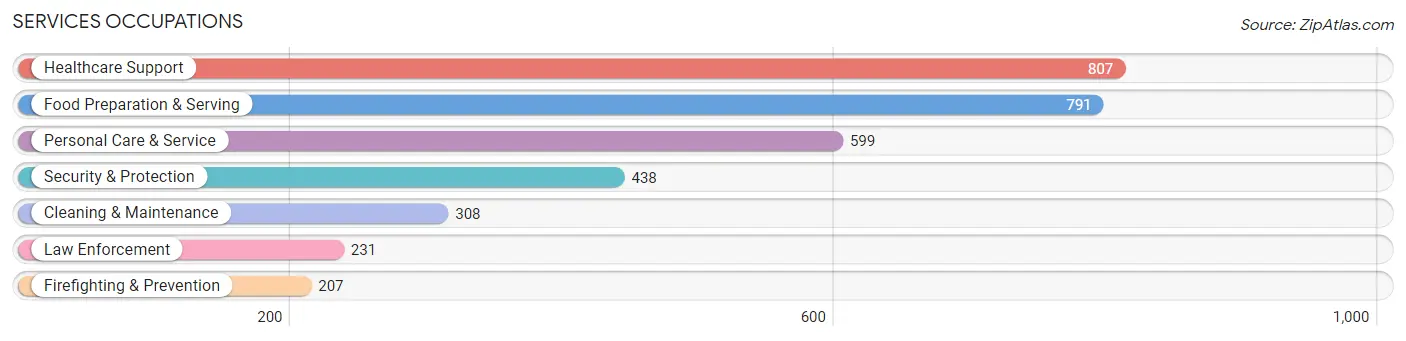
Services Occupations
The most common Services occupations in South Laurel are Healthcare Support (807 | 5.2%), Food Preparation & Serving (791 | 5.1%), Personal Care & Service (599 | 3.8%), Security & Protection (438 | 2.8%), and Cleaning & Maintenance (308 | 2.0%).
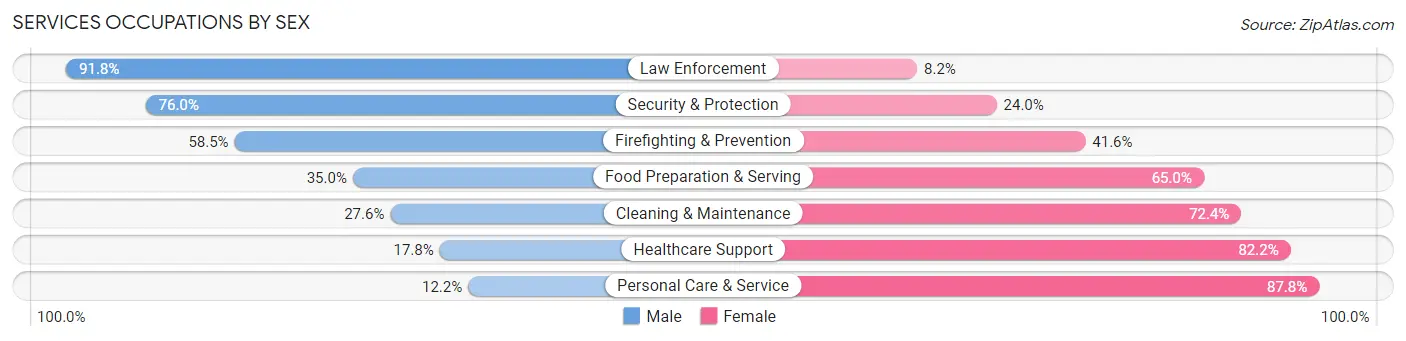
Services Occupations by Sex
Within the Services occupations in South Laurel, the most male-oriented occupations are Law Enforcement (91.8%), Security & Protection (76.0%), and Firefighting & Prevention (58.5%), while the most female-oriented occupations are Personal Care & Service (87.8%), Healthcare Support (82.2%), and Cleaning & Maintenance (72.4%).
| Occupation | Male | Female |
| Healthcare Support | 144 (17.8%) | 663 (82.2%) |
| Security & Protection | 333 (76.0%) | 105 (24.0%) |
| Firefighting & Prevention | 121 (58.5%) | 86 (41.5%) |
| Law Enforcement | 212 (91.8%) | 19 (8.2%) |
| Food Preparation & Serving | 277 (35.0%) | 514 (65.0%) |
| Cleaning & Maintenance | 85 (27.6%) | 223 (72.4%) |
| Personal Care & Service | 73 (12.2%) | 526 (87.8%) |
| Total (Category) | 912 (31.0%) | 2,031 (69.0%) |
| Total (Overall) | 7,276 (46.7%) | 8,294 (53.3%) |
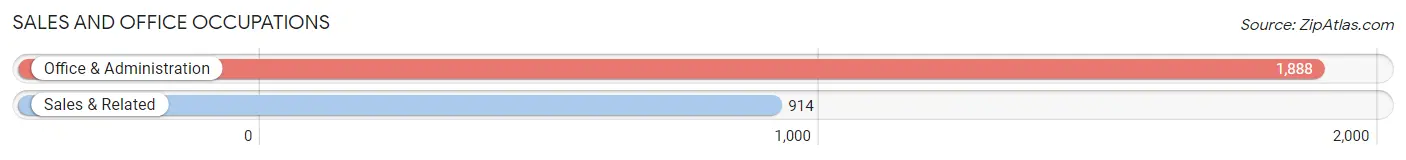
Sales and Office Occupations
The most common Sales and Office occupations in South Laurel are Office & Administration (1,888 | 12.1%), and Sales & Related (914 | 5.9%).
Sales and Office Occupations by Sex
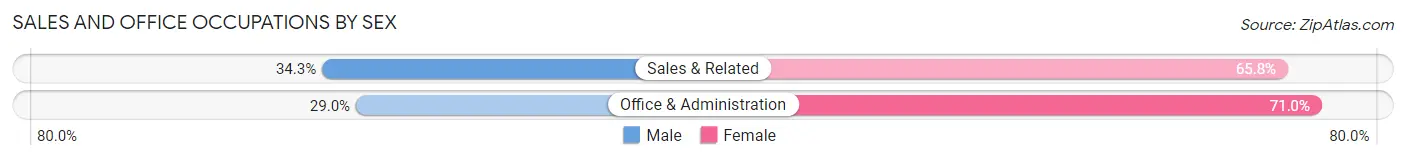
| Occupation | Male | Female |
| Sales & Related | 313 (34.3%) | 601 (65.7%) |
| Office & Administration | 548 (29.0%) | 1,340 (71.0%) |
| Total (Category) | 861 (30.7%) | 1,941 (69.3%) |
| Total (Overall) | 7,276 (46.7%) | 8,294 (53.3%) |
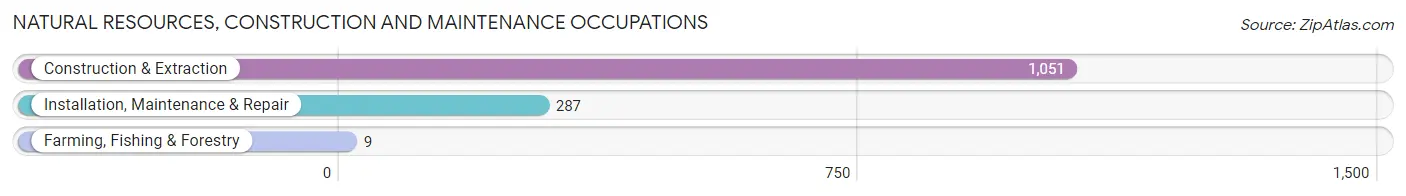
Natural Resources, Construction and Maintenance Occupations
The most common Natural Resources, Construction and Maintenance occupations in South Laurel are Construction & Extraction (1,051 | 6.8%), Installation, Maintenance & Repair (287 | 1.8%), and Farming, Fishing & Forestry (9 | 0.1%).
Natural Resources, Construction and Maintenance Occupations by Sex
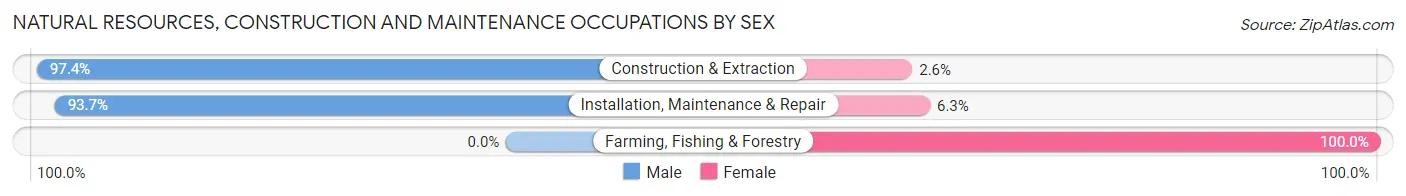
| Occupation | Male | Female |
| Farming, Fishing & Forestry | 0 (0.0%) | 9 (100.0%) |
| Construction & Extraction | 1,024 (97.4%) | 27 (2.6%) |
| Installation, Maintenance & Repair | 269 (93.7%) | 18 (6.3%) |
| Total (Category) | 1,293 (96.0%) | 54 (4.0%) |
| Total (Overall) | 7,276 (46.7%) | 8,294 (53.3%) |
Production, Transportation and Moving Occupations
The most common Production, Transportation and Moving occupations in South Laurel are Transportation (664 | 4.3%), Production (570 | 3.7%), and Material Moving (428 | 2.8%).
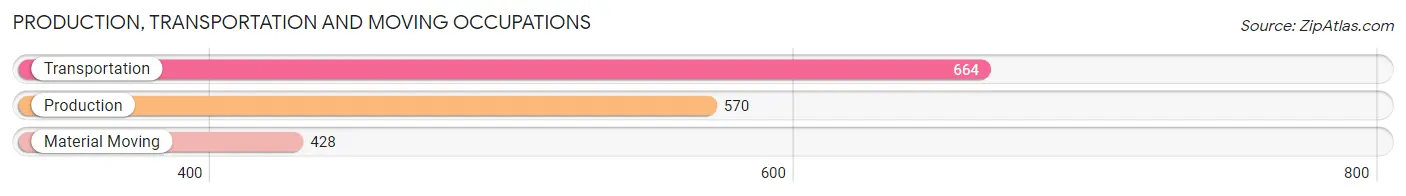
Production, Transportation and Moving Occupations by Sex
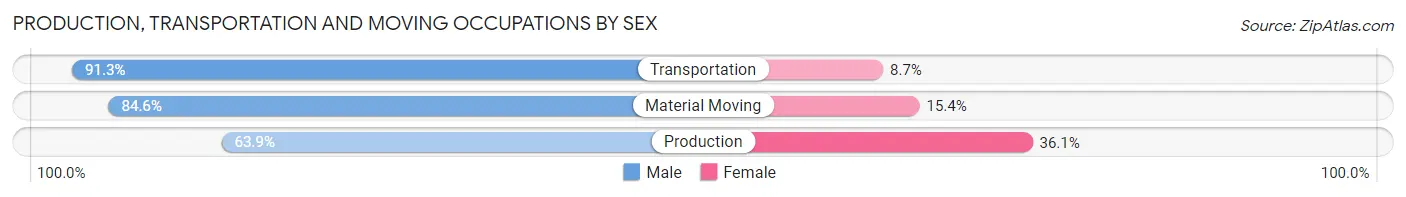
| Occupation | Male | Female |
| Production | 364 (63.9%) | 206 (36.1%) |
| Transportation | 606 (91.3%) | 58 (8.7%) |
| Material Moving | 362 (84.6%) | 66 (15.4%) |
| Total (Category) | 1,332 (80.1%) | 330 (19.9%) |
| Total (Overall) | 7,276 (46.7%) | 8,294 (53.3%) |
Employment Industries by Sex in South Laurel
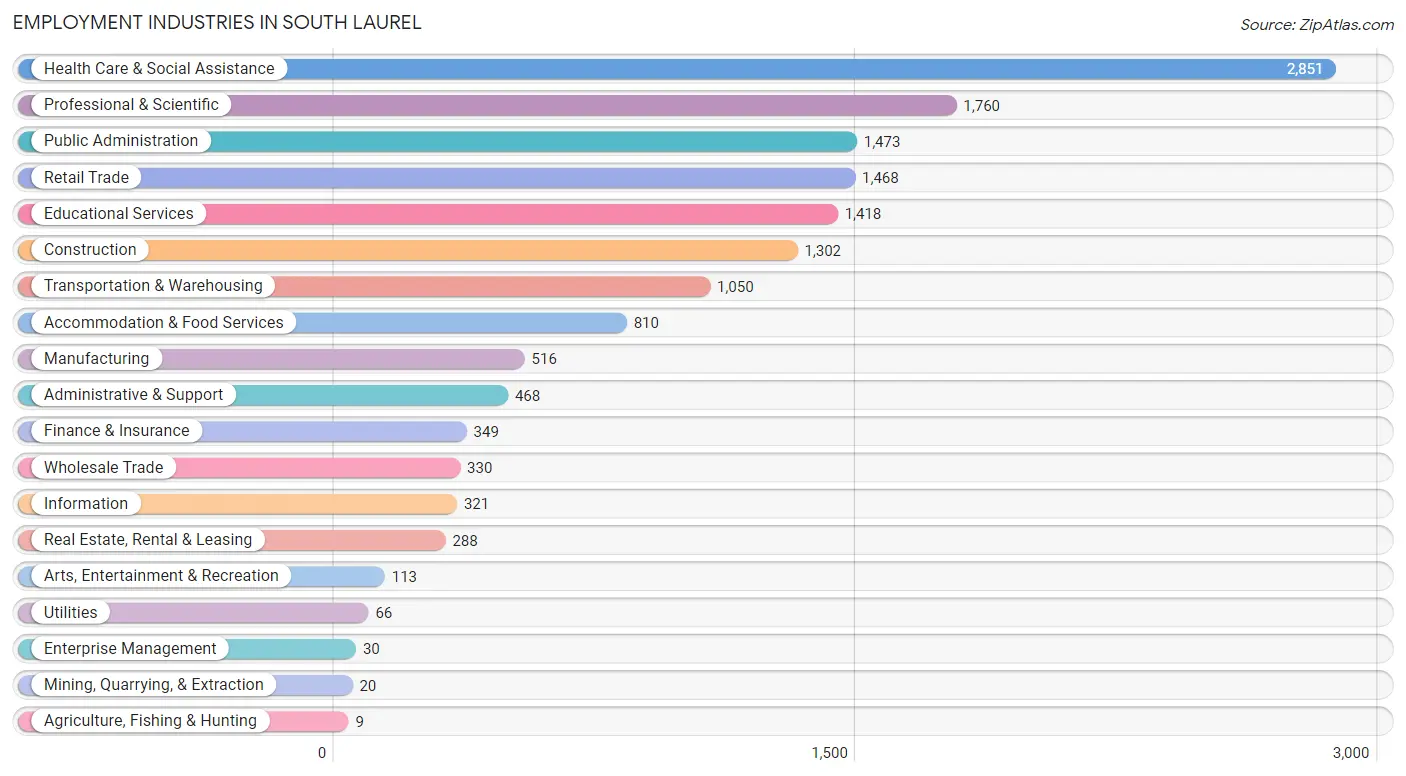
Employment Industries in South Laurel
The major employment industries in South Laurel include Health Care & Social Assistance (2,851 | 18.3%), Professional & Scientific (1,760 | 11.3%), Public Administration (1,473 | 9.5%), Retail Trade (1,468 | 9.4%), and Educational Services (1,418 | 9.1%).
Employment Industries by Sex in South Laurel
The South Laurel industries that see more men than women are Mining, Quarrying, & Extraction (100.0%), Utilities (100.0%), and Construction (86.1%), whereas the industries that tend to have a higher number of women are Agriculture, Fishing & Hunting (100.0%), Enterprise Management (100.0%), and Health Care & Social Assistance (82.0%).
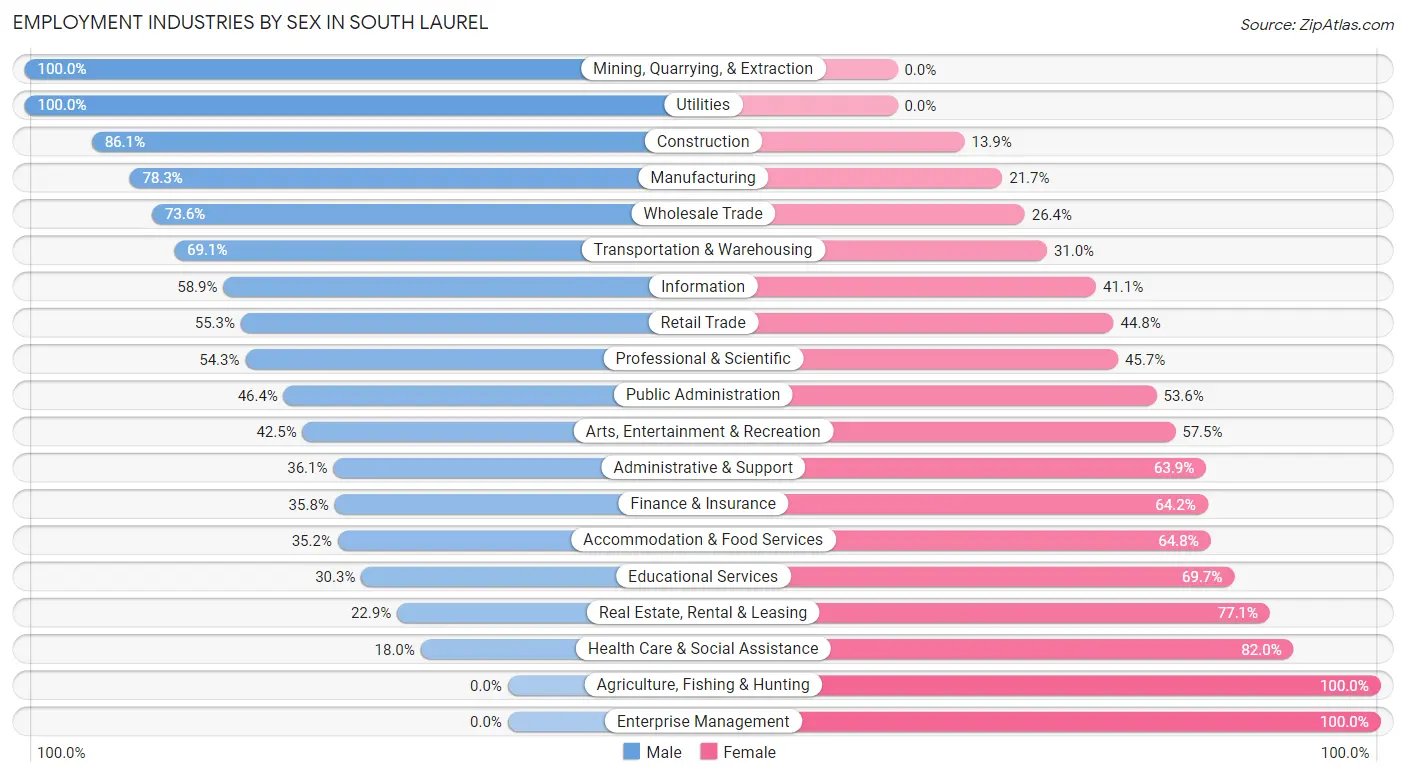
| Industry | Male | Female |
| Agriculture, Fishing & Hunting | 0 (0.0%) | 9 (100.0%) |
| Mining, Quarrying, & Extraction | 20 (100.0%) | 0 (0.0%) |
| Construction | 1,121 (86.1%) | 181 (13.9%) |
| Manufacturing | 404 (78.3%) | 112 (21.7%) |
| Wholesale Trade | 243 (73.6%) | 87 (26.4%) |
| Retail Trade | 811 (55.2%) | 657 (44.8%) |
| Transportation & Warehousing | 725 (69.1%) | 325 (30.9%) |
| Utilities | 66 (100.0%) | 0 (0.0%) |
| Information | 189 (58.9%) | 132 (41.1%) |
| Finance & Insurance | 125 (35.8%) | 224 (64.2%) |
| Real Estate, Rental & Leasing | 66 (22.9%) | 222 (77.1%) |
| Professional & Scientific | 956 (54.3%) | 804 (45.7%) |
| Enterprise Management | 0 (0.0%) | 30 (100.0%) |
| Administrative & Support | 169 (36.1%) | 299 (63.9%) |
| Educational Services | 430 (30.3%) | 988 (69.7%) |
| Health Care & Social Assistance | 514 (18.0%) | 2,337 (82.0%) |
| Arts, Entertainment & Recreation | 48 (42.5%) | 65 (57.5%) |
| Accommodation & Food Services | 285 (35.2%) | 525 (64.8%) |
| Public Administration | 683 (46.4%) | 790 (53.6%) |
| Total | 7,276 (46.7%) | 8,294 (53.3%) |
Education in South Laurel
School Enrollment in South Laurel
The most common levels of schooling among the 8,806 students in South Laurel are college / undergraduate (2,188 | 24.8%), elementary school (1,528 | 17.3%), and middle school (1,527 | 17.3%).
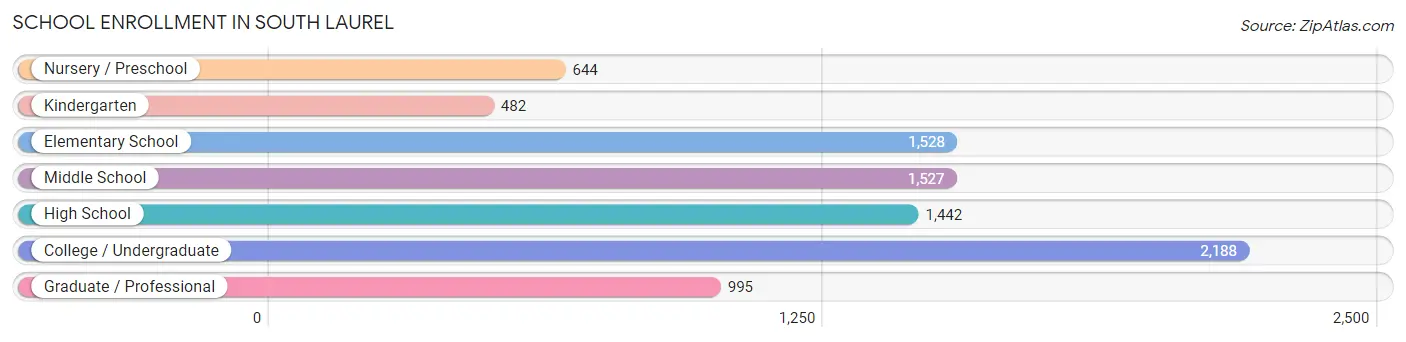
| School Level | # Students | % Students |
| Nursery / Preschool | 644 | 7.3% |
| Kindergarten | 482 | 5.5% |
| Elementary School | 1,528 | 17.3% |
| Middle School | 1,527 | 17.3% |
| High School | 1,442 | 16.4% |
| College / Undergraduate | 2,188 | 24.8% |
| Graduate / Professional | 995 | 11.3% |
| Total | 8,806 | 100.0% |
School Enrollment by Age by Funding Source in South Laurel
Out of a total of 8,806 students who are enrolled in schools in South Laurel, 2,078 (23.6%) attend a private institution, while the remaining 6,728 (76.4%) are enrolled in public schools. The age group of 35 years and over has the highest likelihood of being enrolled in private schools, with 712 (53.8% in the age bracket) enrolled. Conversely, the age group of 15 to 17 year olds has the lowest likelihood of being enrolled in a private school, with 797 (87.7% in the age bracket) attending a public institution.
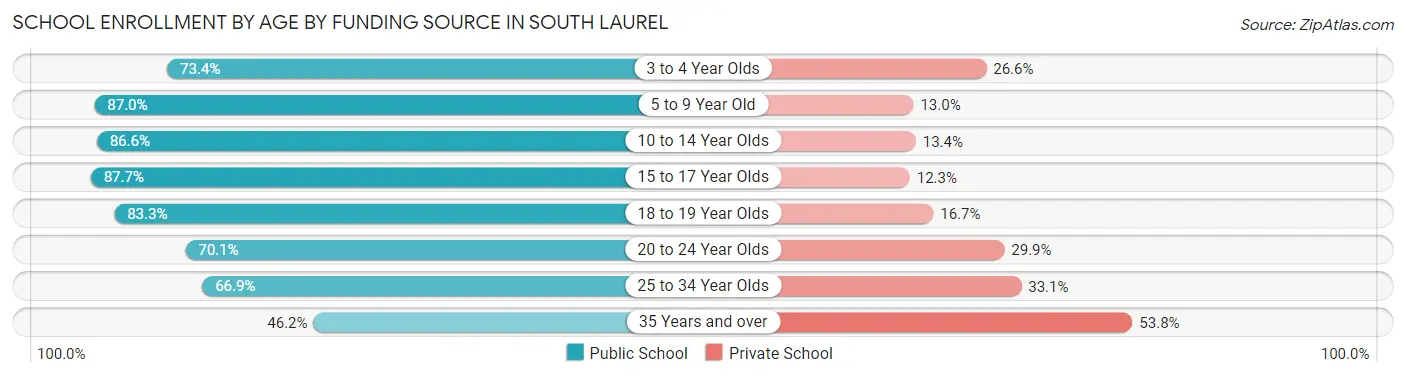
| Age Bracket | Public School | Private School |
| 3 to 4 Year Olds | 329 (73.4%) | 119 (26.6%) |
| 5 to 9 Year Old | 1,807 (87.0%) | 270 (13.0%) |
| 10 to 14 Year Olds | 1,571 (86.6%) | 244 (13.4%) |
| 15 to 17 Year Olds | 797 (87.7%) | 112 (12.3%) |
| 18 to 19 Year Olds | 479 (83.3%) | 96 (16.7%) |
| 20 to 24 Year Olds | 590 (70.1%) | 252 (29.9%) |
| 25 to 34 Year Olds | 546 (66.9%) | 270 (33.1%) |
| 35 Years and over | 612 (46.2%) | 712 (53.8%) |
| Total | 6,728 (76.4%) | 2,078 (23.6%) |
Educational Attainment by Field of Study in South Laurel
Business (1,479 | 16.5%), social sciences (996 | 11.1%), science & technology (912 | 10.2%), computers & mathematics (836 | 9.3%), and psychology (680 | 7.6%) are the most common fields of study among 8,964 individuals in South Laurel who have obtained a bachelor's degree or higher.
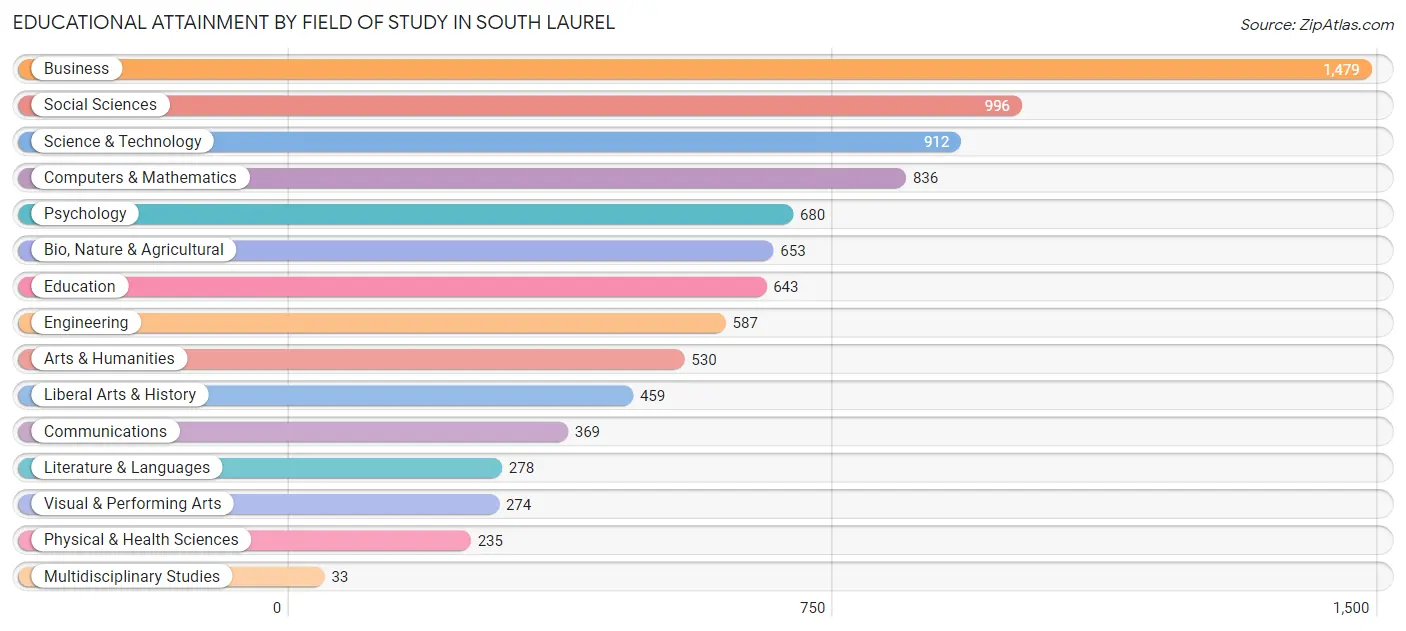
| Field of Study | # Graduates | % Graduates |
| Computers & Mathematics | 836 | 9.3% |
| Bio, Nature & Agricultural | 653 | 7.3% |
| Physical & Health Sciences | 235 | 2.6% |
| Psychology | 680 | 7.6% |
| Social Sciences | 996 | 11.1% |
| Engineering | 587 | 6.6% |
| Multidisciplinary Studies | 33 | 0.4% |
| Science & Technology | 912 | 10.2% |
| Business | 1,479 | 16.5% |
| Education | 643 | 7.2% |
| Literature & Languages | 278 | 3.1% |
| Liberal Arts & History | 459 | 5.1% |
| Visual & Performing Arts | 274 | 3.1% |
| Communications | 369 | 4.1% |
| Arts & Humanities | 530 | 5.9% |
| Total | 8,964 | 100.0% |
Transportation & Commute in South Laurel
Vehicle Availability by Sex in South Laurel
The most prevalent vehicle ownership categories in South Laurel are males with 2 vehicles (3,145, accounting for 42.8%) and females with 2 vehicles (2,854, making up 39.3%).
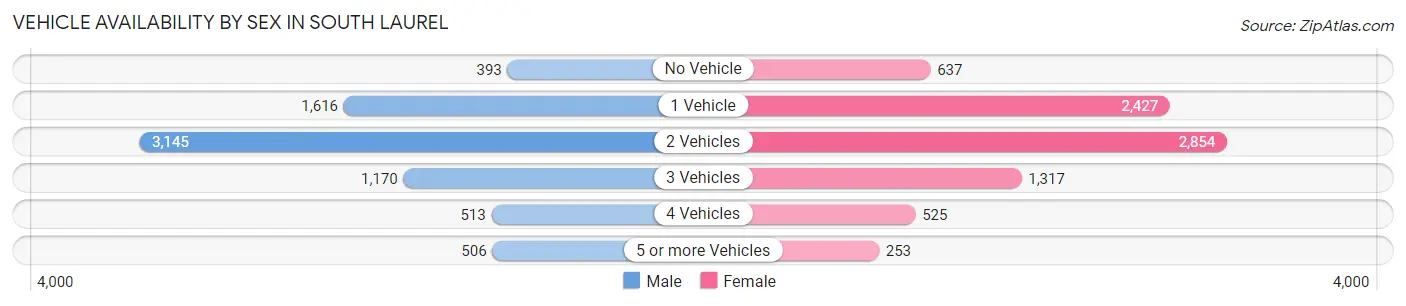
| Vehicles Available | Male | Female |
| No Vehicle | 393 (5.3%) | 637 (8.0%) |
| 1 Vehicle | 1,616 (22.0%) | 2,427 (30.3%) |
| 2 Vehicles | 3,145 (42.8%) | 2,854 (35.6%) |
| 3 Vehicles | 1,170 (15.9%) | 1,317 (16.4%) |
| 4 Vehicles | 513 (7.0%) | 525 (6.6%) |
| 5 or more Vehicles | 506 (6.9%) | 253 (3.2%) |
| Total | 7,343 (100.0%) | 8,013 (100.0%) |
Commute Time in South Laurel
The most frequently occuring commute durations in South Laurel are 20 to 24 minutes (2,283 commuters, 16.8%), 30 to 34 minutes (2,141 commuters, 15.8%), and 45 to 59 minutes (2,007 commuters, 14.8%).
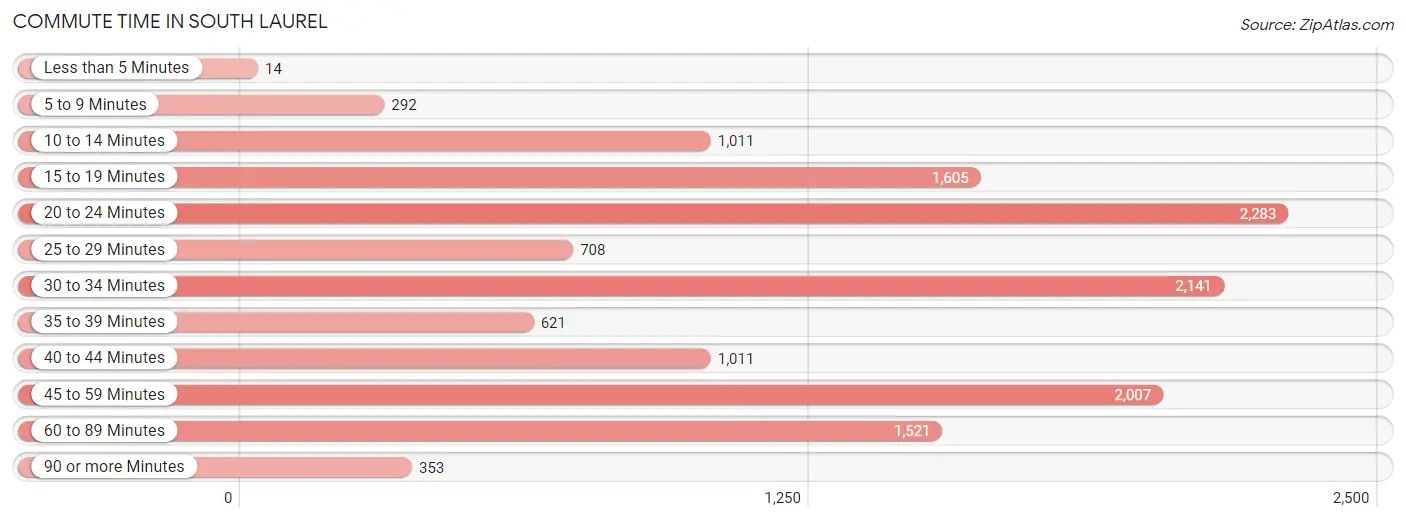
| Commute Time | # Commuters | % Commuters |
| Less than 5 Minutes | 14 | 0.1% |
| 5 to 9 Minutes | 292 | 2.1% |
| 10 to 14 Minutes | 1,011 | 7.4% |
| 15 to 19 Minutes | 1,605 | 11.8% |
| 20 to 24 Minutes | 2,283 | 16.8% |
| 25 to 29 Minutes | 708 | 5.2% |
| 30 to 34 Minutes | 2,141 | 15.8% |
| 35 to 39 Minutes | 621 | 4.6% |
| 40 to 44 Minutes | 1,011 | 7.4% |
| 45 to 59 Minutes | 2,007 | 14.8% |
| 60 to 89 Minutes | 1,521 | 11.2% |
| 90 or more Minutes | 353 | 2.6% |
Commute Time by Sex in South Laurel
The most common commute times in South Laurel are 20 to 24 minutes (1,139 commuters, 17.4%) for males and 30 to 34 minutes (1,201 commuters, 17.1%) for females.
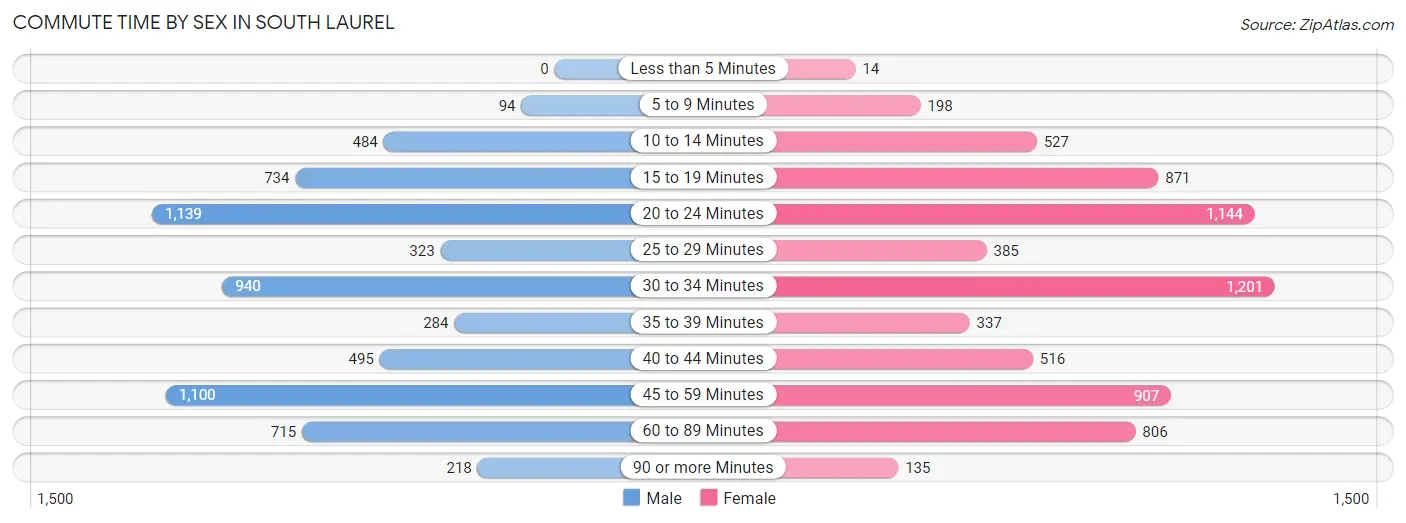
| Commute Time | Male | Female |
| Less than 5 Minutes | 0 (0.0%) | 14 (0.2%) |
| 5 to 9 Minutes | 94 (1.4%) | 198 (2.8%) |
| 10 to 14 Minutes | 484 (7.4%) | 527 (7.5%) |
| 15 to 19 Minutes | 734 (11.3%) | 871 (12.4%) |
| 20 to 24 Minutes | 1,139 (17.4%) | 1,144 (16.3%) |
| 25 to 29 Minutes | 323 (5.0%) | 385 (5.5%) |
| 30 to 34 Minutes | 940 (14.4%) | 1,201 (17.1%) |
| 35 to 39 Minutes | 284 (4.3%) | 337 (4.8%) |
| 40 to 44 Minutes | 495 (7.6%) | 516 (7.3%) |
| 45 to 59 Minutes | 1,100 (16.9%) | 907 (12.9%) |
| 60 to 89 Minutes | 715 (11.0%) | 806 (11.5%) |
| 90 or more Minutes | 218 (3.3%) | 135 (1.9%) |
Time of Departure to Work by Sex in South Laurel
The most frequent times of departure to work in South Laurel are 7:00 AM to 7:29 AM (979, 15.0%) for males and 7:00 AM to 7:29 AM (1,035, 14.7%) for females.
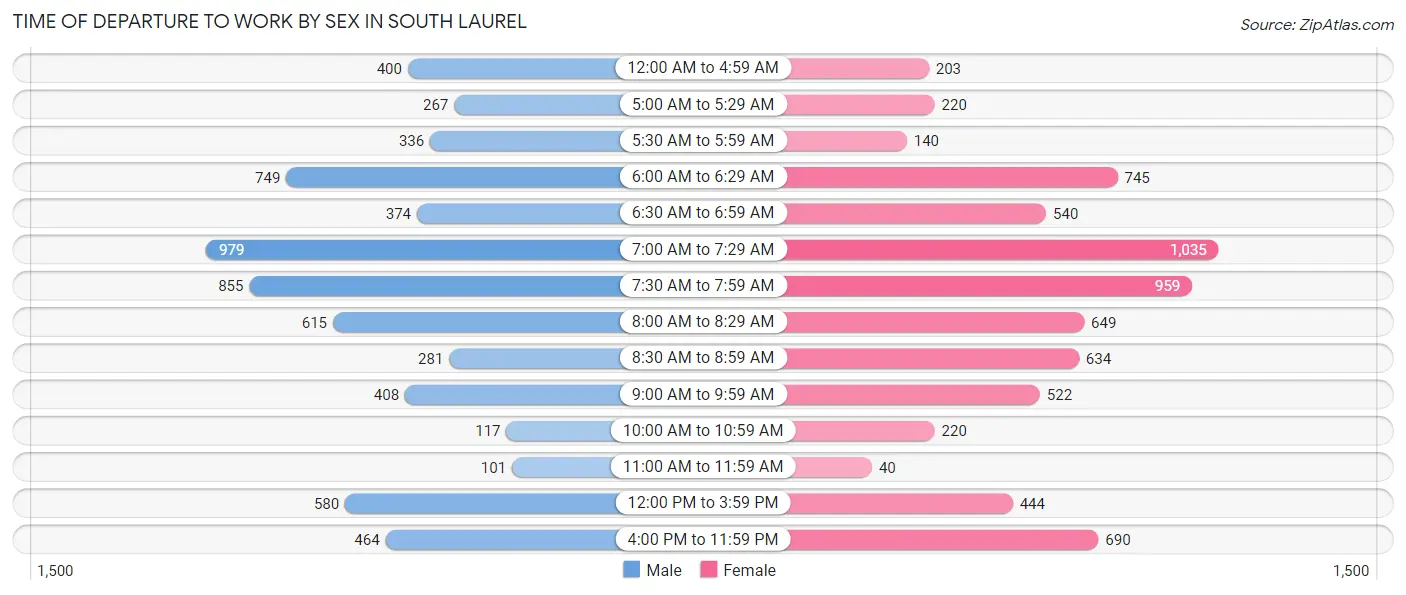
| Time of Departure | Male | Female |
| 12:00 AM to 4:59 AM | 400 (6.1%) | 203 (2.9%) |
| 5:00 AM to 5:29 AM | 267 (4.1%) | 220 (3.1%) |
| 5:30 AM to 5:59 AM | 336 (5.1%) | 140 (2.0%) |
| 6:00 AM to 6:29 AM | 749 (11.5%) | 745 (10.6%) |
| 6:30 AM to 6:59 AM | 374 (5.7%) | 540 (7.7%) |
| 7:00 AM to 7:29 AM | 979 (15.0%) | 1,035 (14.7%) |
| 7:30 AM to 7:59 AM | 855 (13.1%) | 959 (13.6%) |
| 8:00 AM to 8:29 AM | 615 (9.4%) | 649 (9.2%) |
| 8:30 AM to 8:59 AM | 281 (4.3%) | 634 (9.0%) |
| 9:00 AM to 9:59 AM | 408 (6.2%) | 522 (7.4%) |
| 10:00 AM to 10:59 AM | 117 (1.8%) | 220 (3.1%) |
| 11:00 AM to 11:59 AM | 101 (1.5%) | 40 (0.6%) |
| 12:00 PM to 3:59 PM | 580 (8.9%) | 444 (6.3%) |
| 4:00 PM to 11:59 PM | 464 (7.1%) | 690 (9.8%) |
| Total | 6,526 (100.0%) | 7,041 (100.0%) |
Housing Occupancy in South Laurel
Occupancy by Ownership in South Laurel
Of the total 10,823 dwellings in South Laurel, owner-occupied units account for 4,343 (40.1%), while renter-occupied units make up 6,480 (59.9%).
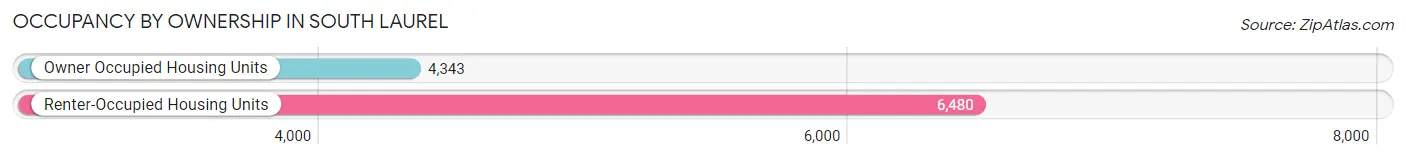
| Occupancy | # Housing Units | % Housing Units |
| Owner Occupied Housing Units | 4,343 | 40.1% |
| Renter-Occupied Housing Units | 6,480 | 59.9% |
| Total Occupied Housing Units | 10,823 | 100.0% |
Occupancy by Household Size in South Laurel
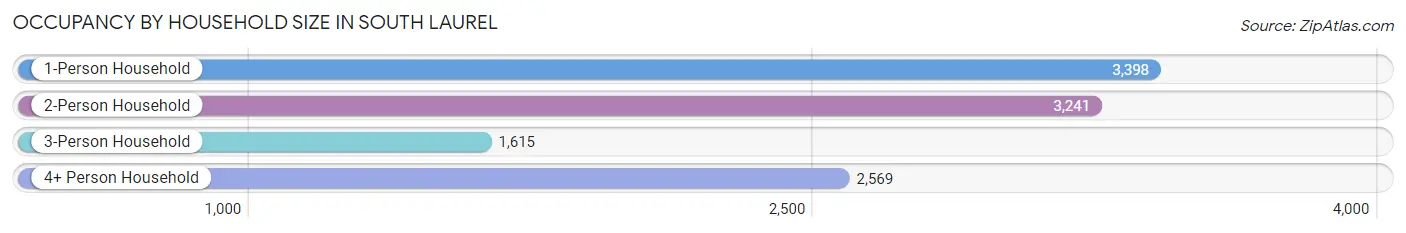
| Household Size | # Housing Units | % Housing Units |
| 1-Person Household | 3,398 | 31.4% |
| 2-Person Household | 3,241 | 29.9% |
| 3-Person Household | 1,615 | 14.9% |
| 4+ Person Household | 2,569 | 23.7% |
| Total Housing Units | 10,823 | 100.0% |
Occupancy by Ownership by Household Size in South Laurel
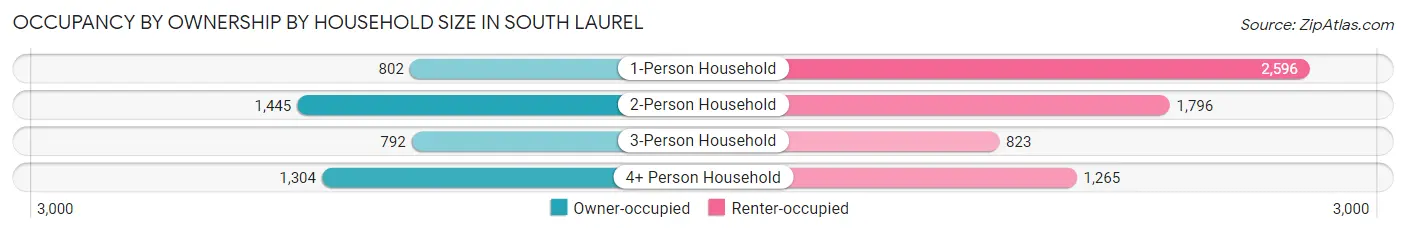
| Household Size | Owner-occupied | Renter-occupied |
| 1-Person Household | 802 (23.6%) | 2,596 (76.4%) |
| 2-Person Household | 1,445 (44.6%) | 1,796 (55.4%) |
| 3-Person Household | 792 (49.0%) | 823 (51.0%) |
| 4+ Person Household | 1,304 (50.8%) | 1,265 (49.2%) |
| Total Housing Units | 4,343 (40.1%) | 6,480 (59.9%) |
Occupancy by Educational Attainment in South Laurel
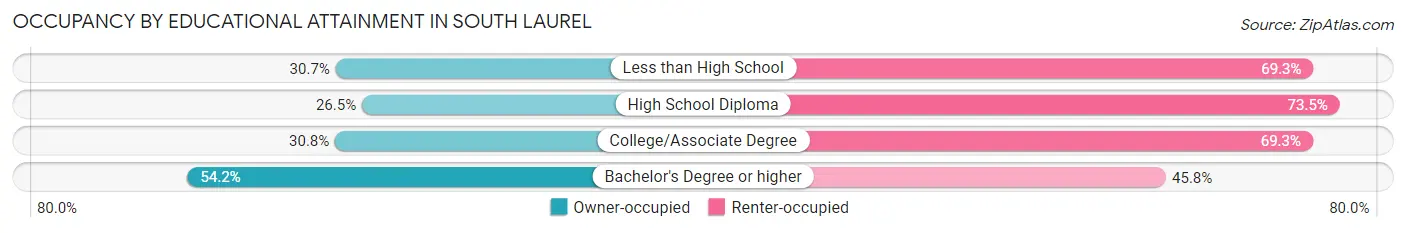
| Household Size | Owner-occupied | Renter-occupied |
| Less than High School | 226 (30.7%) | 511 (69.3%) |
| High School Diploma | 612 (26.5%) | 1,698 (73.5%) |
| College/Associate Degree | 929 (30.7%) | 2,092 (69.3%) |
| Bachelor's Degree or higher | 2,576 (54.2%) | 2,179 (45.8%) |
Occupancy by Age of Householder in South Laurel
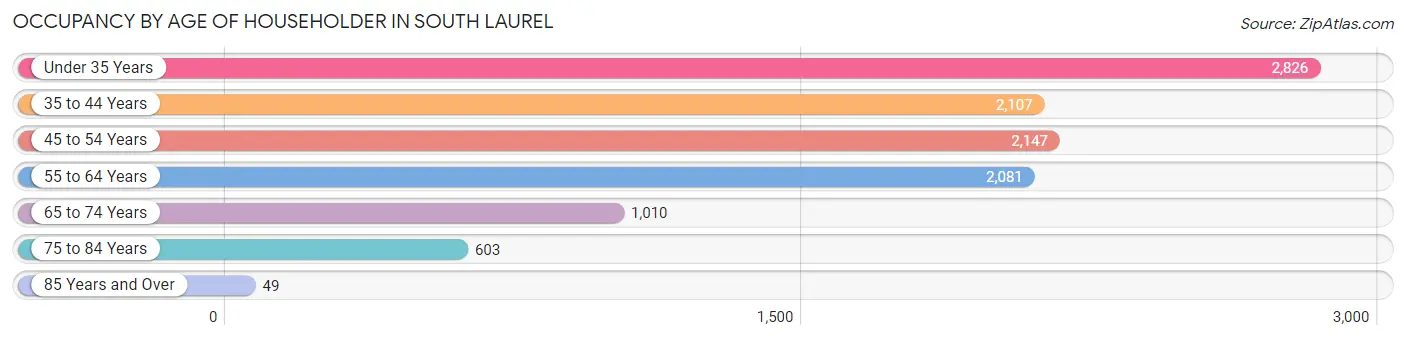
| Age Bracket | # Households | % Households |
| Under 35 Years | 2,826 | 26.1% |
| 35 to 44 Years | 2,107 | 19.5% |
| 45 to 54 Years | 2,147 | 19.8% |
| 55 to 64 Years | 2,081 | 19.2% |
| 65 to 74 Years | 1,010 | 9.3% |
| 75 to 84 Years | 603 | 5.6% |
| 85 Years and Over | 49 | 0.4% |
| Total | 10,823 | 100.0% |
Housing Finances in South Laurel
Median Income by Occupancy in South Laurel
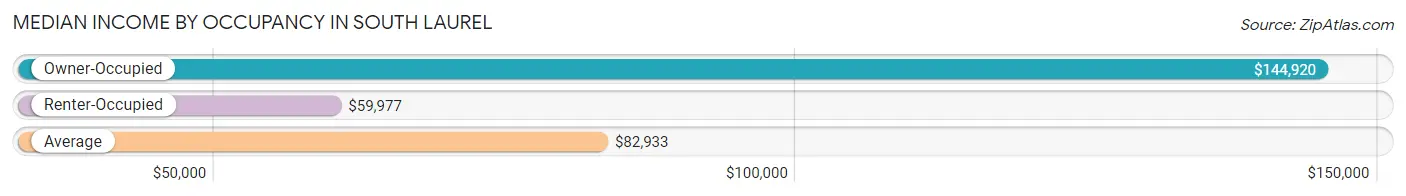
| Occupancy Type | # Households | Median Income |
| Owner-Occupied | 4,343 (40.1%) | $144,920 |
| Renter-Occupied | 6,480 (59.9%) | $59,977 |
| Average | 10,823 (100.0%) | $82,933 |
Occupancy by Householder Income Bracket in South Laurel
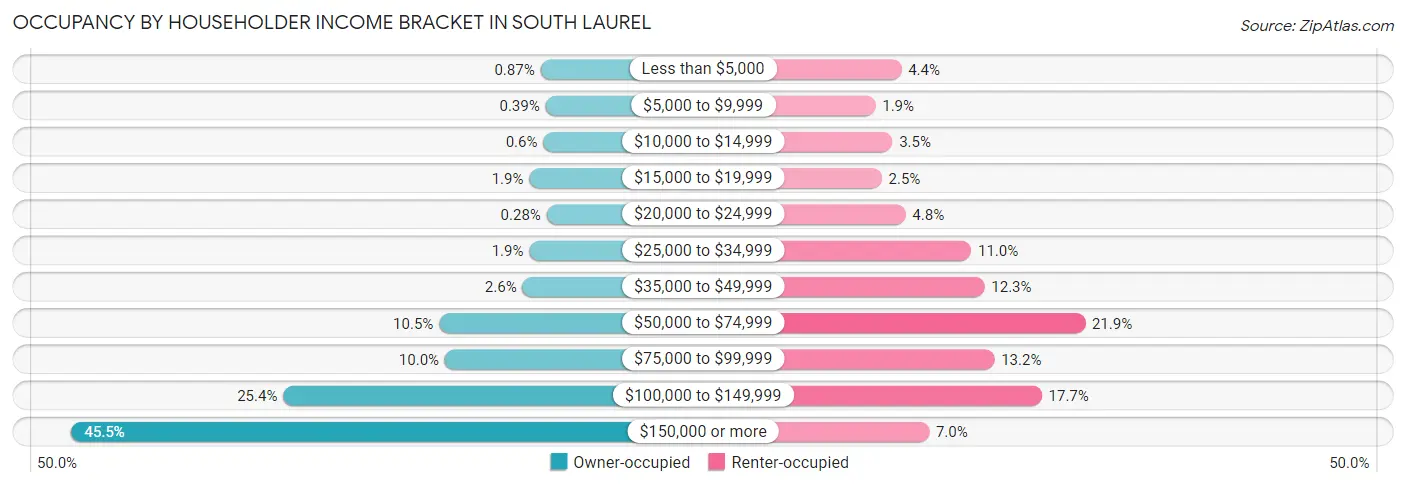
| Income Bracket | Owner-occupied | Renter-occupied |
| Less than $5,000 | 38 (0.9%) | 282 (4.3%) |
| $5,000 to $9,999 | 17 (0.4%) | 122 (1.9%) |
| $10,000 to $14,999 | 26 (0.6%) | 226 (3.5%) |
| $15,000 to $19,999 | 84 (1.9%) | 161 (2.5%) |
| $20,000 to $24,999 | 12 (0.3%) | 308 (4.8%) |
| $25,000 to $34,999 | 84 (1.9%) | 713 (11.0%) |
| $35,000 to $49,999 | 112 (2.6%) | 795 (12.3%) |
| $50,000 to $74,999 | 457 (10.5%) | 1,416 (21.8%) |
| $75,000 to $99,999 | 433 (10.0%) | 856 (13.2%) |
| $100,000 to $149,999 | 1,102 (25.4%) | 1,148 (17.7%) |
| $150,000 or more | 1,978 (45.5%) | 453 (7.0%) |
| Total | 4,343 (100.0%) | 6,480 (100.0%) |
Monthly Housing Cost Tiers in South Laurel
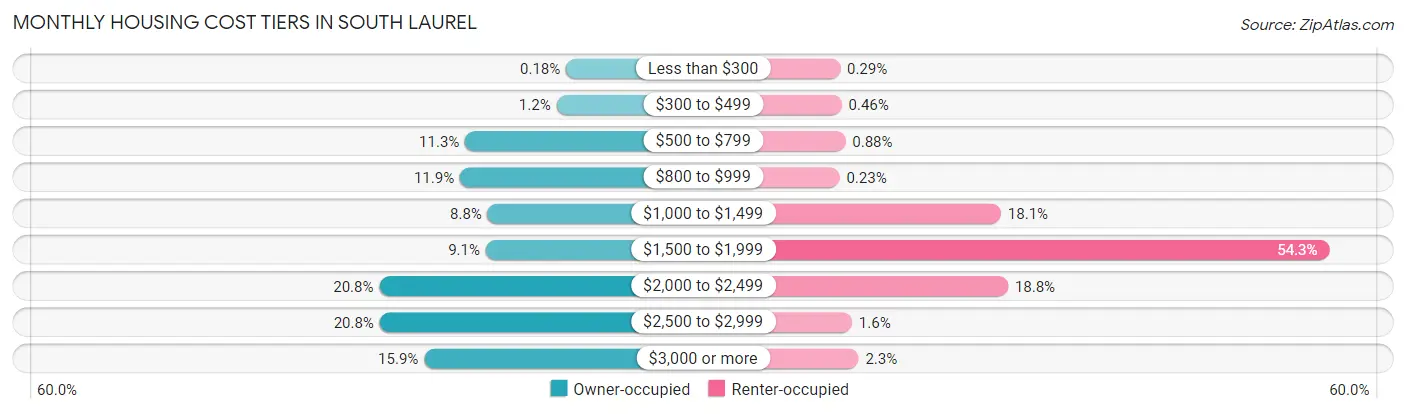
| Monthly Cost | Owner-occupied | Renter-occupied |
| Less than $300 | 8 (0.2%) | 19 (0.3%) |
| $300 to $499 | 54 (1.2%) | 30 (0.5%) |
| $500 to $799 | 492 (11.3%) | 57 (0.9%) |
| $800 to $999 | 517 (11.9%) | 15 (0.2%) |
| $1,000 to $1,499 | 384 (8.8%) | 1,170 (18.1%) |
| $1,500 to $1,999 | 393 (9.0%) | 3,521 (54.3%) |
| $2,000 to $2,499 | 904 (20.8%) | 1,221 (18.8%) |
| $2,500 to $2,999 | 902 (20.8%) | 104 (1.6%) |
| $3,000 or more | 689 (15.9%) | 151 (2.3%) |
| Total | 4,343 (100.0%) | 6,480 (100.0%) |
Physical Housing Characteristics in South Laurel
Housing Structures in South Laurel
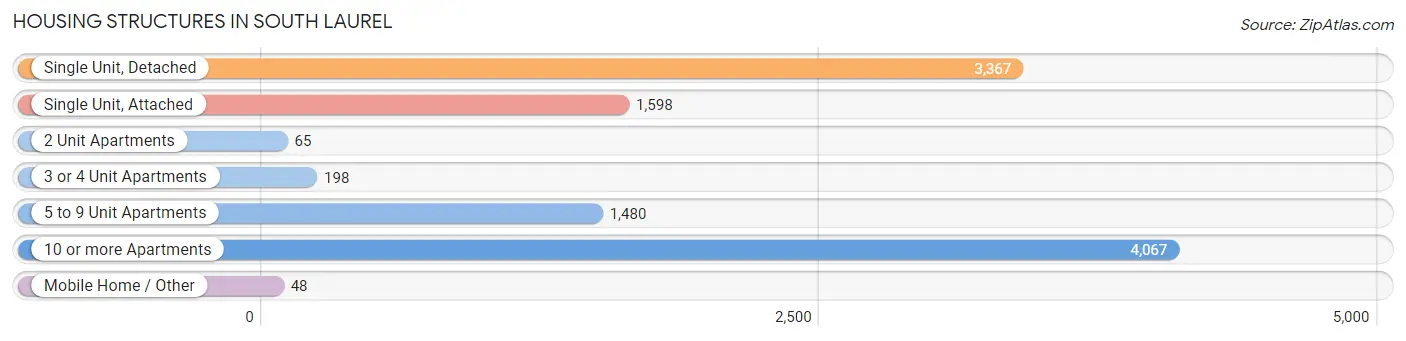
| Structure Type | # Housing Units | % Housing Units |
| Single Unit, Detached | 3,367 | 31.1% |
| Single Unit, Attached | 1,598 | 14.8% |
| 2 Unit Apartments | 65 | 0.6% |
| 3 or 4 Unit Apartments | 198 | 1.8% |
| 5 to 9 Unit Apartments | 1,480 | 13.7% |
| 10 or more Apartments | 4,067 | 37.6% |
| Mobile Home / Other | 48 | 0.4% |
| Total | 10,823 | 100.0% |
Housing Structures by Occupancy in South Laurel
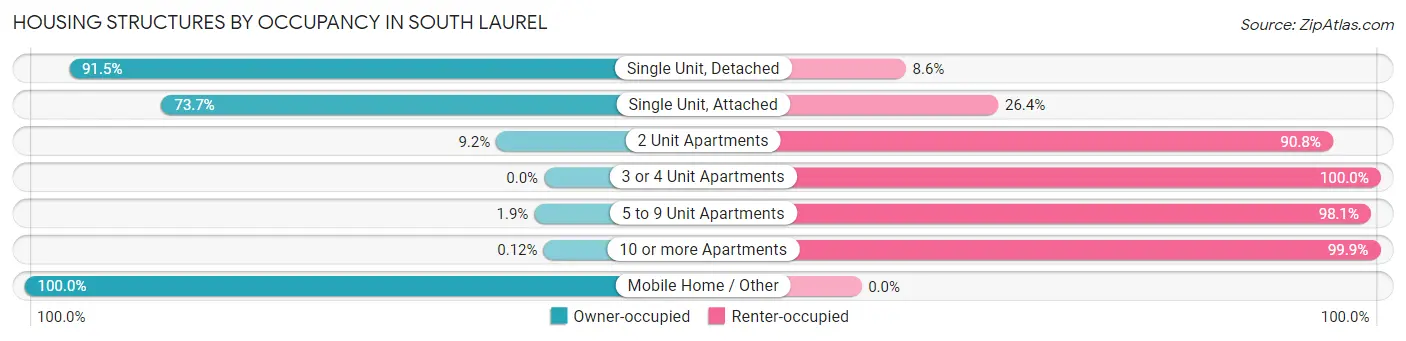
| Structure Type | Owner-occupied | Renter-occupied |
| Single Unit, Detached | 3,079 (91.4%) | 288 (8.6%) |
| Single Unit, Attached | 1,177 (73.7%) | 421 (26.4%) |
| 2 Unit Apartments | 6 (9.2%) | 59 (90.8%) |
| 3 or 4 Unit Apartments | 0 (0.0%) | 198 (100.0%) |
| 5 to 9 Unit Apartments | 28 (1.9%) | 1,452 (98.1%) |
| 10 or more Apartments | 5 (0.1%) | 4,062 (99.9%) |
| Mobile Home / Other | 48 (100.0%) | 0 (0.0%) |
| Total | 4,343 (40.1%) | 6,480 (59.9%) |
Housing Structures by Number of Rooms in South Laurel
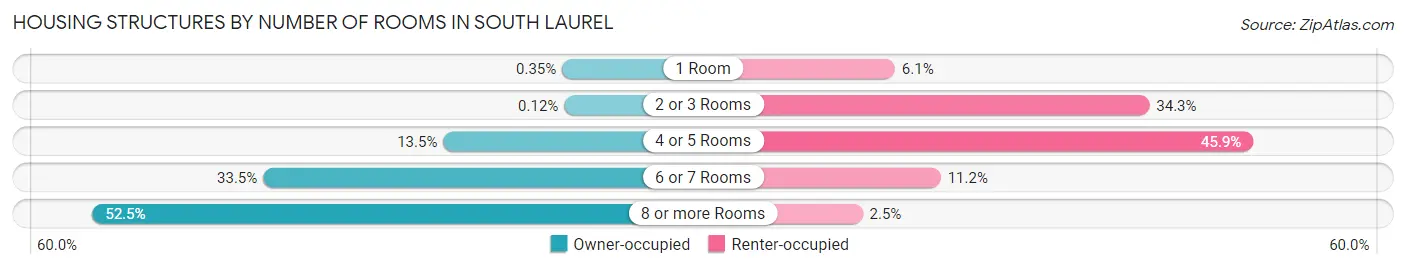
| Number of Rooms | Owner-occupied | Renter-occupied |
| 1 Room | 15 (0.4%) | 395 (6.1%) |
| 2 or 3 Rooms | 5 (0.1%) | 2,225 (34.3%) |
| 4 or 5 Rooms | 588 (13.5%) | 2,972 (45.9%) |
| 6 or 7 Rooms | 1,456 (33.5%) | 725 (11.2%) |
| 8 or more Rooms | 2,279 (52.5%) | 163 (2.5%) |
| Total | 4,343 (100.0%) | 6,480 (100.0%) |
Housing Structure by Heating Type in South Laurel
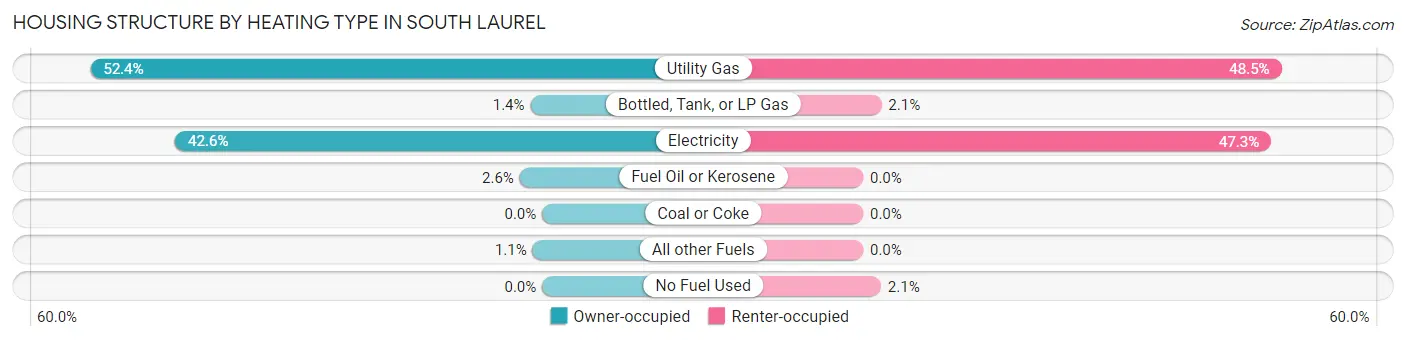
| Heating Type | Owner-occupied | Renter-occupied |
| Utility Gas | 2,275 (52.4%) | 3,143 (48.5%) |
| Bottled, Tank, or LP Gas | 59 (1.4%) | 138 (2.1%) |
| Electricity | 1,848 (42.5%) | 3,065 (47.3%) |
| Fuel Oil or Kerosene | 113 (2.6%) | 0 (0.0%) |
| Coal or Coke | 0 (0.0%) | 0 (0.0%) |
| All other Fuels | 48 (1.1%) | 0 (0.0%) |
| No Fuel Used | 0 (0.0%) | 134 (2.1%) |
| Total | 4,343 (100.0%) | 6,480 (100.0%) |
Household Vehicle Usage in South Laurel
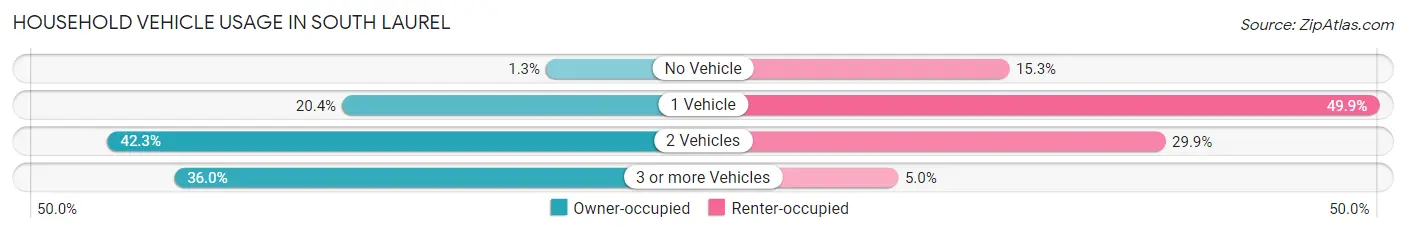
| Vehicles per Household | Owner-occupied | Renter-occupied |
| No Vehicle | 58 (1.3%) | 992 (15.3%) |
| 1 Vehicle | 885 (20.4%) | 3,230 (49.8%) |
| 2 Vehicles | 1,835 (42.2%) | 1,937 (29.9%) |
| 3 or more Vehicles | 1,565 (36.0%) | 321 (5.0%) |
| Total | 4,343 (100.0%) | 6,480 (100.0%) |
Real Estate & Mortgages in South Laurel
Real Estate and Mortgage Overview in South Laurel
| Characteristic | Without Mortgage | With Mortgage |
| Housing Units | 1,160 | 3,183 |
| Median Property Value | $427,200 | $432,200 |
| Median Household Income | $110,833 | $1,570 |
| Monthly Housing Costs | $819 | $689 |
| Real Estate Taxes | $4,770 | $73 |
Property Value by Mortgage Status in South Laurel
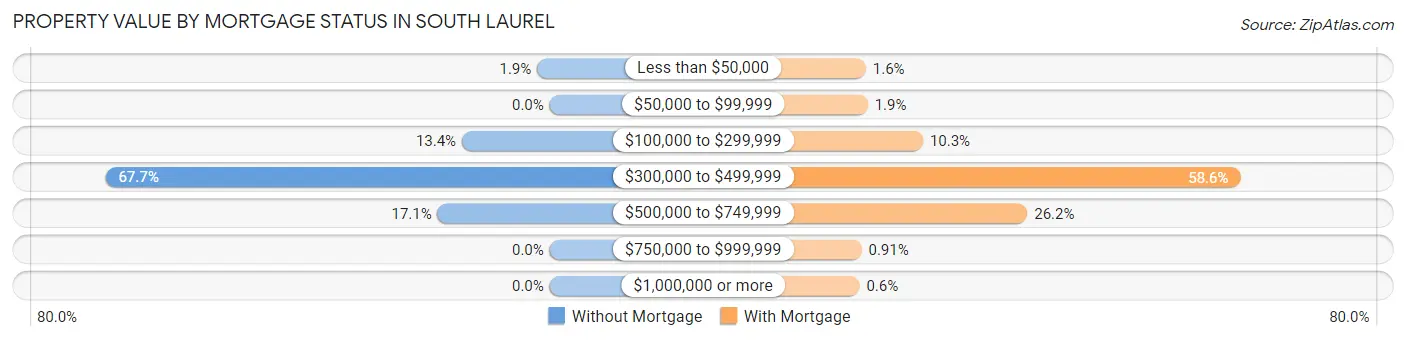
| Property Value | Without Mortgage | With Mortgage |
| Less than $50,000 | 22 (1.9%) | 50 (1.6%) |
| $50,000 to $99,999 | 0 (0.0%) | 59 (1.8%) |
| $100,000 to $299,999 | 155 (13.4%) | 327 (10.3%) |
| $300,000 to $499,999 | 785 (67.7%) | 1,866 (58.6%) |
| $500,000 to $749,999 | 198 (17.1%) | 833 (26.2%) |
| $750,000 to $999,999 | 0 (0.0%) | 29 (0.9%) |
| $1,000,000 or more | 0 (0.0%) | 19 (0.6%) |
| Total | 1,160 (100.0%) | 3,183 (100.0%) |
Household Income by Mortgage Status in South Laurel
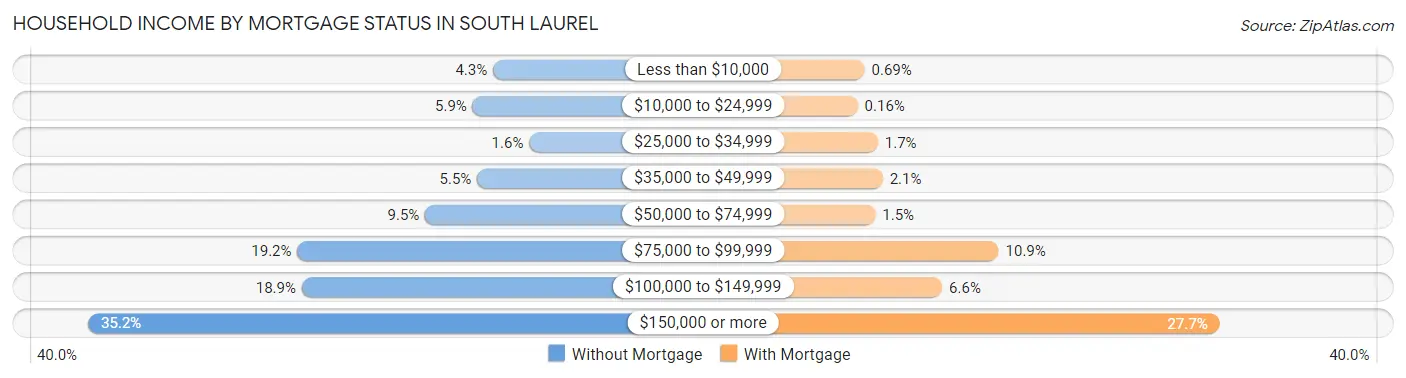
| Household Income | Without Mortgage | With Mortgage |
| Less than $10,000 | 50 (4.3%) | 22 (0.7%) |
| $10,000 to $24,999 | 68 (5.9%) | 5 (0.2%) |
| $25,000 to $34,999 | 18 (1.5%) | 54 (1.7%) |
| $35,000 to $49,999 | 64 (5.5%) | 66 (2.1%) |
| $50,000 to $74,999 | 110 (9.5%) | 48 (1.5%) |
| $75,000 to $99,999 | 223 (19.2%) | 347 (10.9%) |
| $100,000 to $149,999 | 219 (18.9%) | 210 (6.6%) |
| $150,000 or more | 408 (35.2%) | 883 (27.7%) |
| Total | 1,160 (100.0%) | 3,183 (100.0%) |
Property Value to Household Income Ratio in South Laurel
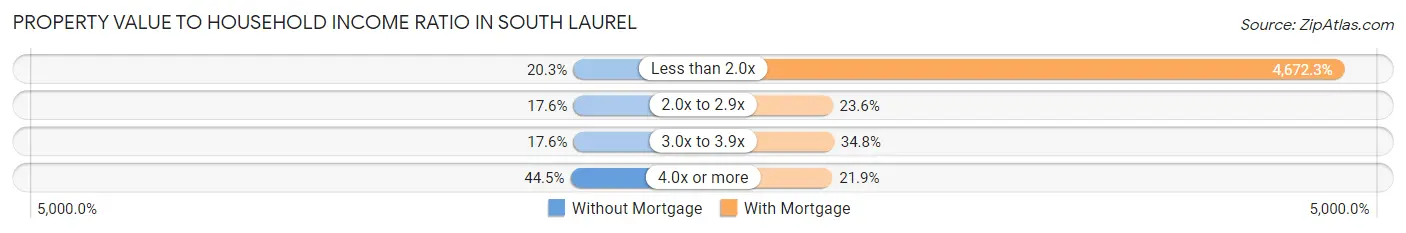
| Value-to-Income Ratio | Without Mortgage | With Mortgage |
| Less than 2.0x | 236 (20.3%) | 148,720 (4,672.3%) |
| 2.0x to 2.9x | 204 (17.6%) | 750 (23.6%) |
| 3.0x to 3.9x | 204 (17.6%) | 1,109 (34.8%) |
| 4.0x or more | 516 (44.5%) | 696 (21.9%) |
| Total | 1,160 (100.0%) | 3,183 (100.0%) |
Real Estate Taxes by Mortgage Status in South Laurel
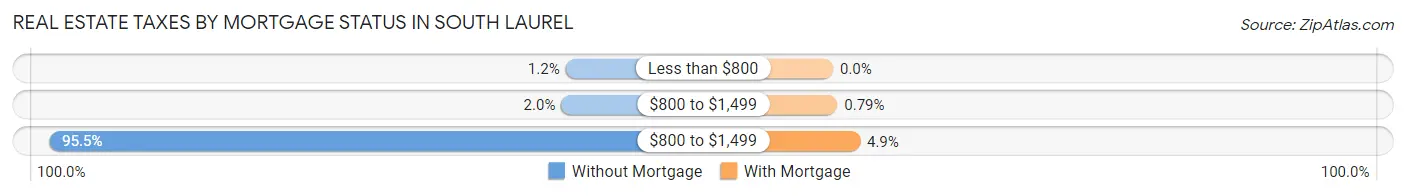
| Property Taxes | Without Mortgage | With Mortgage |
| Less than $800 | 14 (1.2%) | 0 (0.0%) |
| $800 to $1,499 | 23 (2.0%) | 25 (0.8%) |
| $800 to $1,499 | 1,108 (95.5%) | 157 (4.9%) |
| Total | 1,160 (100.0%) | 3,183 (100.0%) |
Health & Disability in South Laurel
Health Insurance Coverage by Age in South Laurel
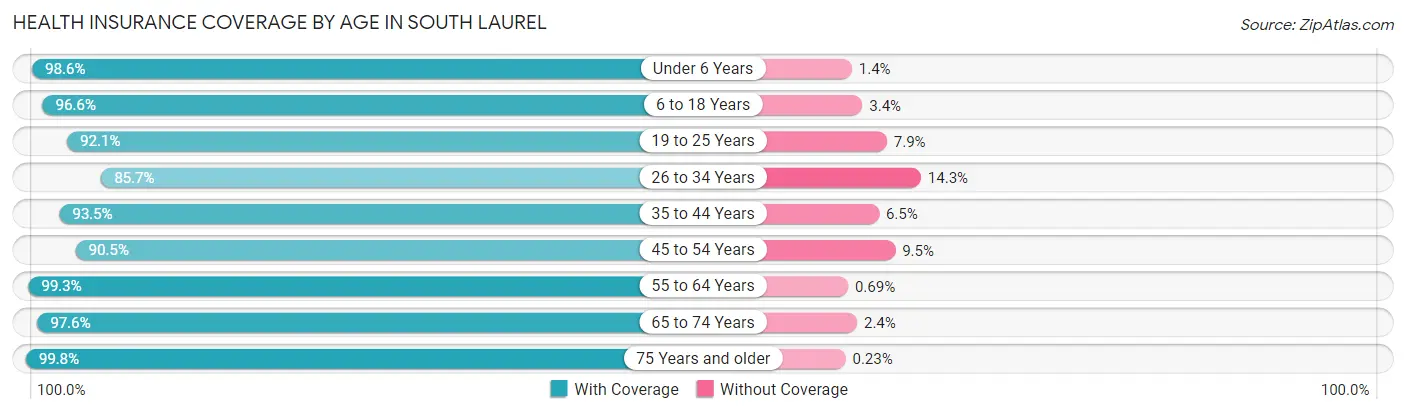
| Age Bracket | With Coverage | Without Coverage |
| Under 6 Years | 2,517 (98.6%) | 36 (1.4%) |
| 6 to 18 Years | 4,665 (96.6%) | 162 (3.4%) |
| 19 to 25 Years | 1,880 (92.1%) | 162 (7.9%) |
| 26 to 34 Years | 3,744 (85.7%) | 624 (14.3%) |
| 35 to 44 Years | 3,803 (93.5%) | 263 (6.5%) |
| 45 to 54 Years | 3,590 (90.5%) | 377 (9.5%) |
| 55 to 64 Years | 3,164 (99.3%) | 22 (0.7%) |
| 65 to 74 Years | 1,680 (97.6%) | 41 (2.4%) |
| 75 Years and older | 1,317 (99.8%) | 3 (0.2%) |
| Total | 26,360 (94.0%) | 1,690 (6.0%) |
Health Insurance Coverage by Citizenship Status in South Laurel
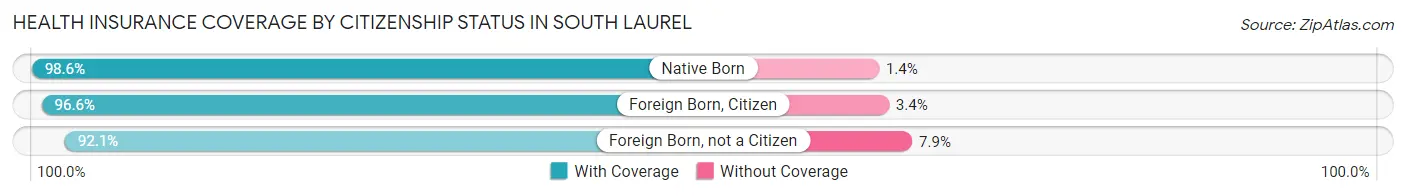
| Citizenship Status | With Coverage | Without Coverage |
| Native Born | 2,517 (98.6%) | 36 (1.4%) |
| Foreign Born, Citizen | 4,665 (96.6%) | 162 (3.4%) |
| Foreign Born, not a Citizen | 1,880 (92.1%) | 162 (7.9%) |
Health Insurance Coverage by Household Income in South Laurel
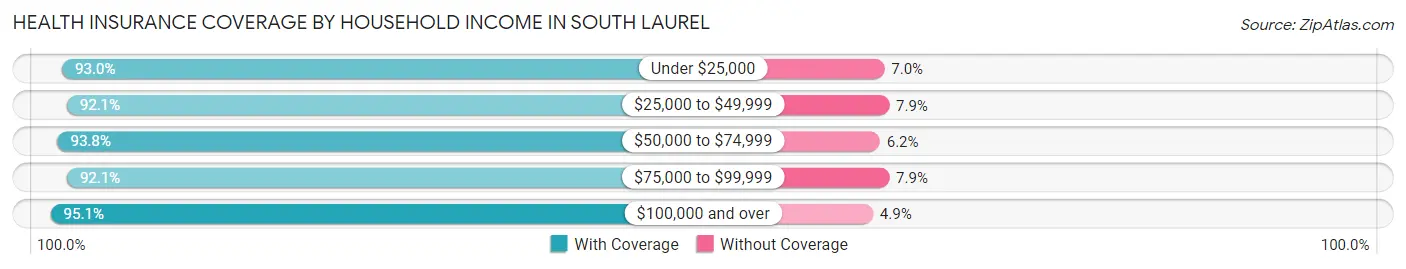
| Household Income | With Coverage | Without Coverage |
| Under $25,000 | 1,957 (93.0%) | 148 (7.0%) |
| $25,000 to $49,999 | 3,754 (92.1%) | 323 (7.9%) |
| $50,000 to $74,999 | 3,644 (93.8%) | 240 (6.2%) |
| $75,000 to $99,999 | 3,085 (92.1%) | 266 (7.9%) |
| $100,000 and over | 13,718 (95.1%) | 706 (4.9%) |
Public vs Private Health Insurance Coverage by Age in South Laurel
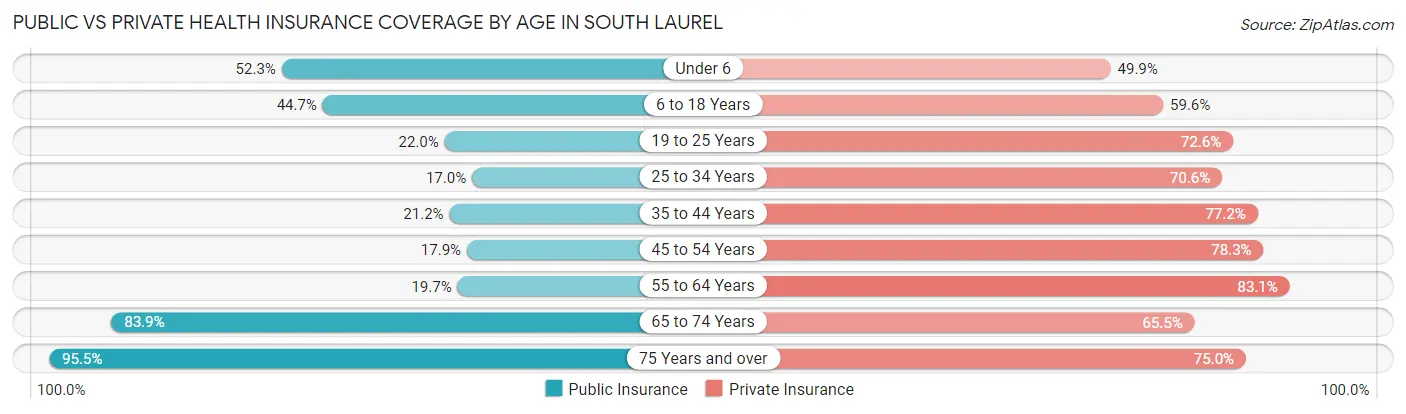
| Age Bracket | Public Insurance | Private Insurance |
| Under 6 | 1,335 (52.3%) | 1,274 (49.9%) |
| 6 to 18 Years | 2,156 (44.7%) | 2,879 (59.6%) |
| 19 to 25 Years | 450 (22.0%) | 1,483 (72.6%) |
| 25 to 34 Years | 741 (17.0%) | 3,083 (70.6%) |
| 35 to 44 Years | 860 (21.1%) | 3,138 (77.2%) |
| 45 to 54 Years | 710 (17.9%) | 3,104 (78.2%) |
| 55 to 64 Years | 626 (19.7%) | 2,648 (83.1%) |
| 65 to 74 Years | 1,444 (83.9%) | 1,127 (65.5%) |
| 75 Years and over | 1,260 (95.5%) | 990 (75.0%) |
| Total | 9,582 (34.2%) | 19,726 (70.3%) |
Disability Status by Sex by Age in South Laurel
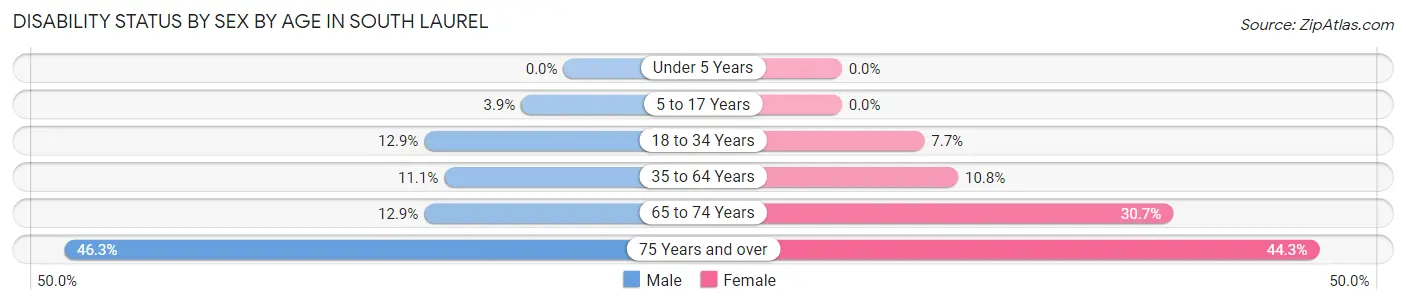
| Age Bracket | Male | Female |
| Under 5 Years | 0 (0.0%) | 0 (0.0%) |
| 5 to 17 Years | 110 (3.9%) | 0 (0.0%) |
| 18 to 34 Years | 372 (12.9%) | 306 (7.7%) |
| 35 to 64 Years | 606 (11.1%) | 620 (10.8%) |
| 65 to 74 Years | 106 (12.9%) | 277 (30.7%) |
| 75 Years and over | 190 (46.3%) | 403 (44.3%) |
Disability Class by Sex by Age in South Laurel
Disability Class: Hearing Difficulty
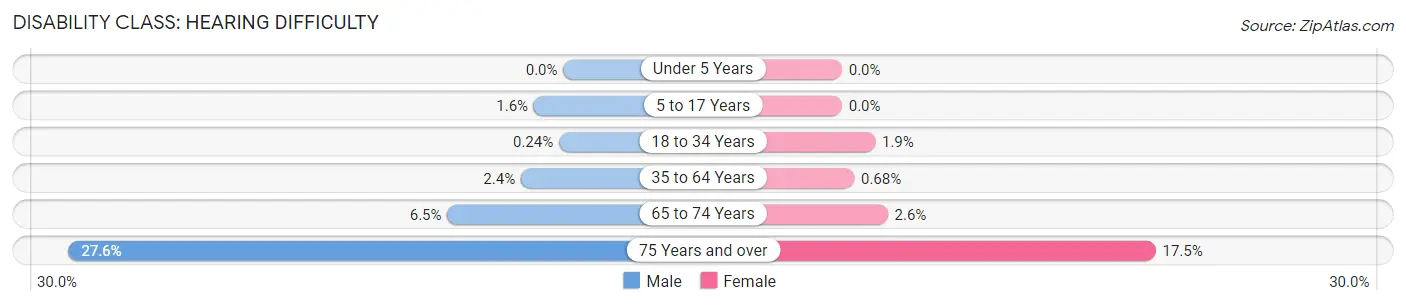
| Age Bracket | Male | Female |
| Under 5 Years | 0 (0.0%) | 0 (0.0%) |
| 5 to 17 Years | 46 (1.6%) | 0 (0.0%) |
| 18 to 34 Years | 7 (0.2%) | 74 (1.8%) |
| 35 to 64 Years | 129 (2.4%) | 39 (0.7%) |
| 65 to 74 Years | 53 (6.5%) | 23 (2.5%) |
| 75 Years and over | 113 (27.6%) | 159 (17.5%) |
Disability Class: Vision Difficulty
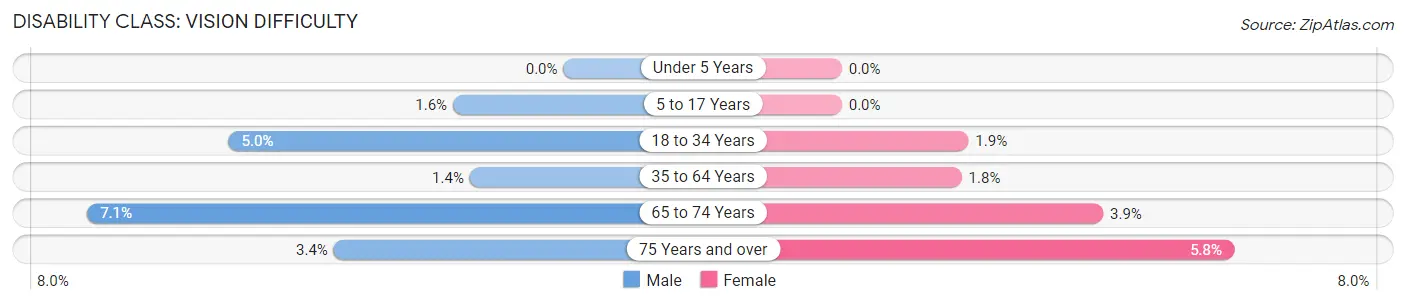
| Age Bracket | Male | Female |
| Under 5 Years | 0 (0.0%) | 0 (0.0%) |
| 5 to 17 Years | 46 (1.6%) | 0 (0.0%) |
| 18 to 34 Years | 143 (5.0%) | 75 (1.9%) |
| 35 to 64 Years | 76 (1.4%) | 102 (1.8%) |
| 65 to 74 Years | 58 (7.1%) | 35 (3.9%) |
| 75 Years and over | 14 (3.4%) | 53 (5.8%) |
Disability Class: Cognitive Difficulty
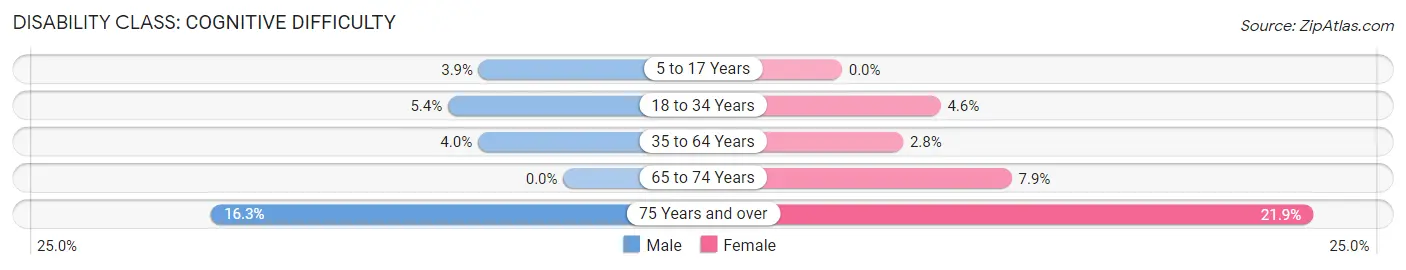
| Age Bracket | Male | Female |
| 5 to 17 Years | 110 (3.9%) | 0 (0.0%) |
| 18 to 34 Years | 154 (5.3%) | 183 (4.6%) |
| 35 to 64 Years | 217 (4.0%) | 163 (2.8%) |
| 65 to 74 Years | 0 (0.0%) | 71 (7.9%) |
| 75 Years and over | 67 (16.3%) | 199 (21.9%) |
Disability Class: Ambulatory Difficulty
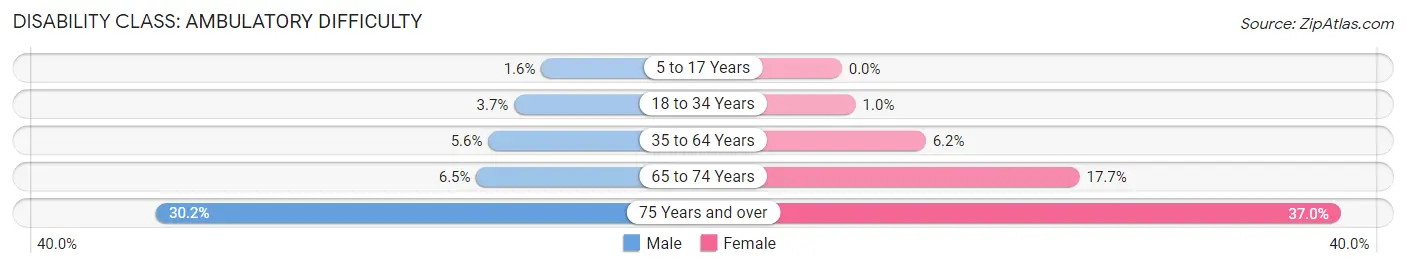
| Age Bracket | Male | Female |
| 5 to 17 Years | 46 (1.6%) | 0 (0.0%) |
| 18 to 34 Years | 105 (3.6%) | 41 (1.0%) |
| 35 to 64 Years | 305 (5.6%) | 358 (6.2%) |
| 65 to 74 Years | 53 (6.5%) | 159 (17.6%) |
| 75 Years and over | 124 (30.2%) | 337 (37.0%) |
Disability Class: Self-Care Difficulty
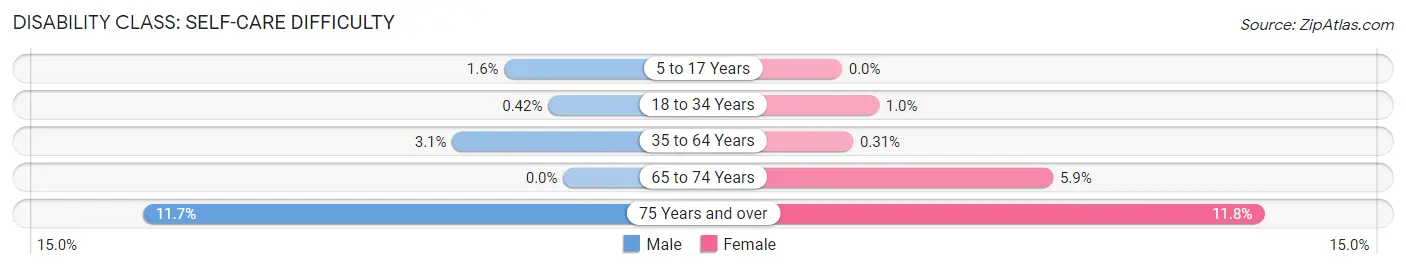
| Age Bracket | Male | Female |
| 5 to 17 Years | 46 (1.6%) | 0 (0.0%) |
| 18 to 34 Years | 12 (0.4%) | 41 (1.0%) |
| 35 to 64 Years | 169 (3.1%) | 18 (0.3%) |
| 65 to 74 Years | 0 (0.0%) | 53 (5.9%) |
| 75 Years and over | 48 (11.7%) | 107 (11.8%) |
Technology Access in South Laurel
Computing Device Access in South Laurel
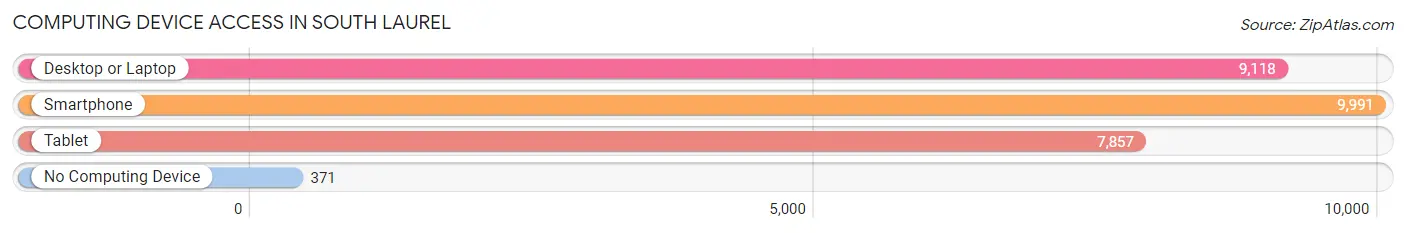
| Device Type | # Households | % Households |
| Desktop or Laptop | 9,118 | 84.3% |
| Smartphone | 9,991 | 92.3% |
| Tablet | 7,857 | 72.6% |
| No Computing Device | 371 | 3.4% |
| Total | 10,823 | 100.0% |
Internet Access in South Laurel
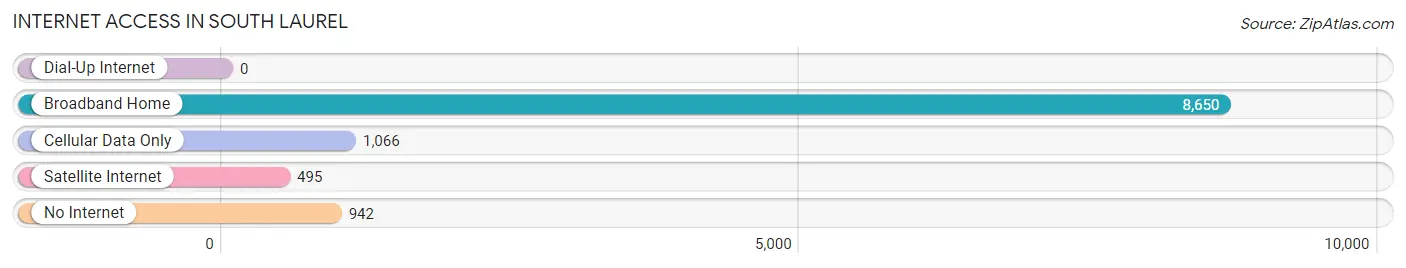
| Internet Type | # Households | % Households |
| Dial-Up Internet | 0 | 0.0% |
| Broadband Home | 8,650 | 79.9% |
| Cellular Data Only | 1,066 | 9.9% |
| Satellite Internet | 495 | 4.6% |
| No Internet | 942 | 8.7% |
| Total | 10,823 | 100.0% |
South Laurel Summary
History
South Laurel, Maryland is a census-designated place located in Prince George’s County, Maryland. It is located approximately 15 miles southeast of Washington, D.C. and is part of the Washington Metropolitan Area. South Laurel was first settled in the late 1700s by farmers and was known as “Laurel Grove”. The area was primarily rural until the 1950s when the population began to grow rapidly due to the construction of the Washington Metro and the development of the Washington-Baltimore Parkway.
The area was officially incorporated as the Town of South Laurel in 1961. The town was named after the nearby Laurel Grove Plantation, which was owned by the prominent Bowie family. The town was primarily a bedroom community for Washington, D.C. and Baltimore until the 1970s when the population began to diversify. The town was annexed by Prince George’s County in 1977 and is now considered a census-designated place.
Geography
South Laurel is located in Prince George’s County, Maryland. It is located approximately 15 miles southeast of Washington, D.C. and is part of the Washington Metropolitan Area. The area is bordered by the Patuxent River to the east, the Washington-Baltimore Parkway to the north, and the towns of Beltsville and Laurel to the west and south, respectively.
The area is primarily composed of suburban neighborhoods and is home to several parks, including the South Laurel Park and the Patuxent River Park. The area is also home to the South Laurel Recreation Center, which offers a variety of recreational activities for residents.
Economy
South Laurel is primarily a residential area, but it is also home to several businesses. The area is home to several retail stores, restaurants, and other businesses. The area is also home to several corporate offices, including the headquarters of the National Security Agency and the headquarters of the United States Cyber Command.
The area is also home to several government agencies, including the National Institutes of Health, the National Institute of Standards and Technology, and the National Oceanic and Atmospheric Administration.
Demographics
As of the 2010 census, South Laurel had a population of 24,845. The population is primarily African American (63.3%) and White (30.2%). The median household income is $76,845 and the median age is 38.7 years. The area is also home to a large Hispanic population (7.3%).
Conclusion
South Laurel, Maryland is a census-designated place located in Prince George’s County, Maryland. It is located approximately 15 miles southeast of Washington, D.C. and is part of the Washington Metropolitan Area. South Laurel was first settled in the late 1700s by farmers and was known as “Laurel Grove”. The area was primarily rural until the 1950s when the population began to grow rapidly due to the construction of the Washington Metro and the development of the Washington-Baltimore Parkway. The area is primarily composed of suburban neighborhoods and is home to several parks, retail stores, restaurants, and other businesses. As of the 2010 census, South Laurel had a population of 24,845. The population is primarily African American (63.3%) and White (30.2%). The median household income is $76,845 and the median age is 38.7 years. The area is also home to a large Hispanic population (7.3%).
Common Questions
What is Per Capita Income in South Laurel?
Per Capita income in South Laurel is $41,622.
What is the Median Family Income in South Laurel?
Median Family Income in South Laurel is $97,888.
What is the Median Household income in South Laurel?
Median Household Income in South Laurel is $82,933.
What is Income or Wage Gap in South Laurel?
Income or Wage Gap in South Laurel is 20.7%.
Women in South Laurel earn 79.3 cents for every dollar earned by a man.
What is Family Income Deficit in South Laurel?
Family Income Deficit in South Laurel is $10,899.
Families that are below poverty line in South Laurel earn $10,899 less on average than the poverty threshold level.
What is Inequality or Gini Index in South Laurel?
Inequality or Gini Index in South Laurel is 0.42.
What is the Total Population of South Laurel?
Total Population of South Laurel is 28,427.
What is the Total Male Population of South Laurel?
Total Male Population of South Laurel is 13,368.
What is the Total Female Population of South Laurel?
Total Female Population of South Laurel is 15,059.
What is the Ratio of Males per 100 Females in South Laurel?
There are 88.77 Males per 100 Females in South Laurel.
What is the Ratio of Females per 100 Males in South Laurel?
There are 112.65 Females per 100 Males in South Laurel.
What is the Median Population Age in South Laurel?
Median Population Age in South Laurel is 35.6 Years.
What is the Average Family Size in South Laurel
Average Family Size in South Laurel is 3.2 People.
What is the Average Household Size in South Laurel
Average Household Size in South Laurel is 2.6 People.
How Large is the Labor Force in South Laurel?
There are 16,643 People in the Labor Forcein in South Laurel.
What is the Percentage of People in the Labor Force in South Laurel?
75.4% of People are in the Labor Force in South Laurel.
What is the Unemployment Rate in South Laurel?
Unemployment Rate in South Laurel is 5.3%.