Pomfret, MD Map & Demographics
Pomfret Map
Pomfret Overview
$54,178
PER CAPITA INCOME
$146,406
AVG HOUSEHOLD INCOME
44.3%
WAGE / INCOME GAP [ % ]
55.7¢/ $1
WAGE / INCOME GAP [ $ ]
0.25
INEQUALITY / GINI INDEX
762
TOTAL POPULATION
352
MALE POPULATION
410
FEMALE POPULATION
85.85
MALES / 100 FEMALES
116.48
FEMALES / 100 MALES
52.5
MEDIAN AGE
3.4
AVG FAMILY SIZE
3.3
AVG HOUSEHOLD SIZE
386
LABOR FORCE [ PEOPLE ]
58.8%
PERCENT IN LABOR FORCE
9.3%
UNEMPLOYMENT RATE
Pomfret Zip Codes
Pomfret Area Codes
Income in Pomfret
Income Overview in Pomfret
| Characteristic | Number | Measure |
| Per Capita Income | 762 | $54,178 |
| Median Family Income | 222 | $0 |
| Mean Family Income | 222 | $176,071 |
| Median Household Income | 228 | $146,406 |
| Mean Household Income | 228 | $172,835 |
| Income Deficit | 222 | $0 |
| Wage / Income Gap (%) | 762 | 44.35% |
| Wage / Income Gap ($) | 762 | 55.65¢ per $1 |
| Gini / Inequality Index | 762 | 0.25 |
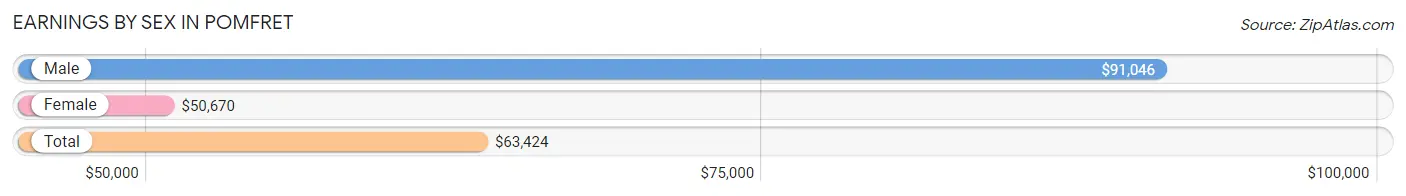
Earnings by Sex in Pomfret
Average Earnings in Pomfret are $63,424, $91,046 for men and $50,670 for women, a difference of 44.4%.
| Sex | Number | Average Earnings |
| Male | 177 (45.9%) | $91,046 |
| Female | 209 (54.1%) | $50,670 |
| Total | 386 (100.0%) | $63,424 |
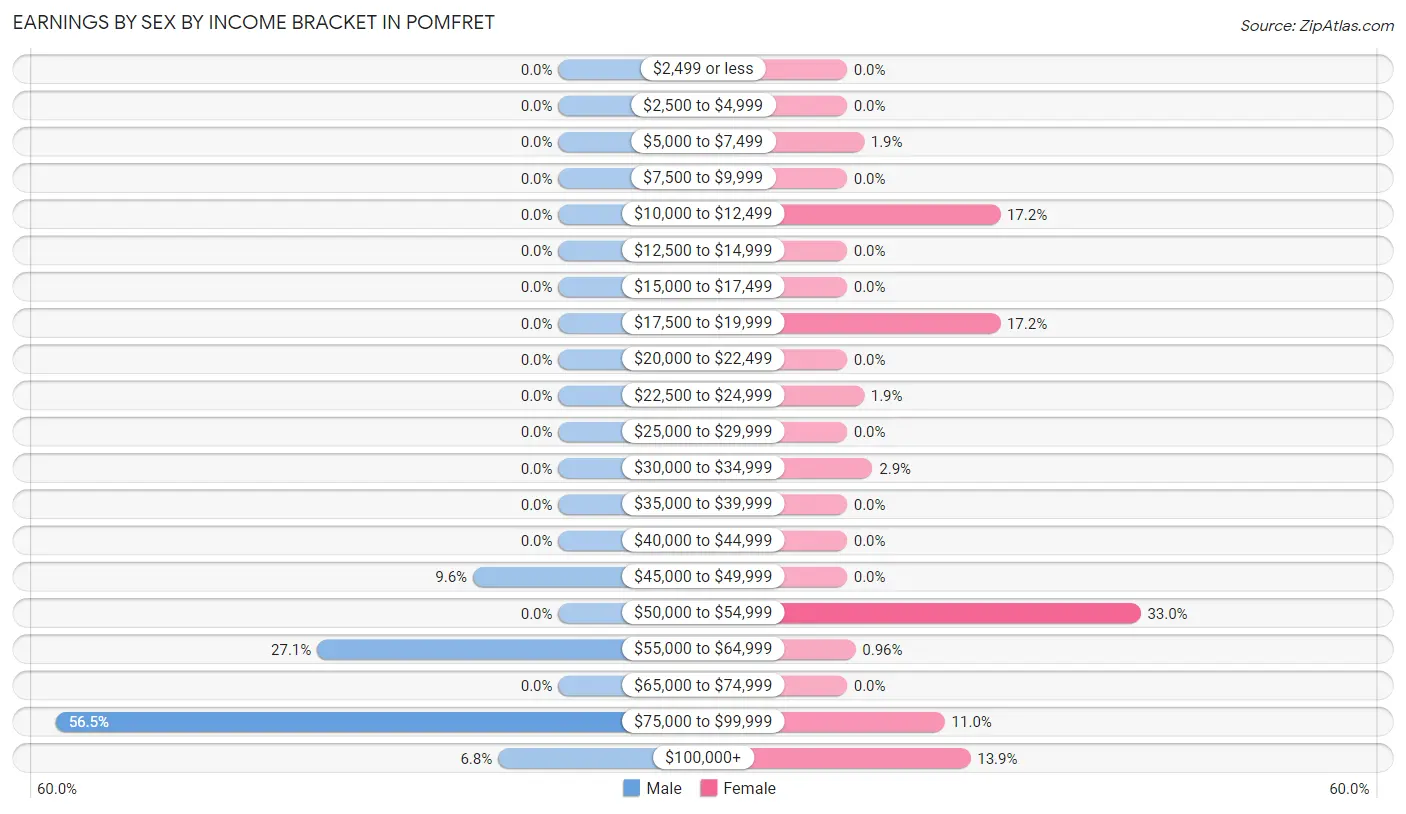
Earnings by Sex by Income Bracket in Pomfret
The most common earnings brackets in Pomfret are $75,000 to $99,999 for men (100 | 56.5%) and $50,000 to $54,999 for women (69 | 33.0%).
| Income | Male | Female |
| $2,499 or less | 0 (0.0%) | 0 (0.0%) |
| $2,500 to $4,999 | 0 (0.0%) | 0 (0.0%) |
| $5,000 to $7,499 | 0 (0.0%) | 4 (1.9%) |
| $7,500 to $9,999 | 0 (0.0%) | 0 (0.0%) |
| $10,000 to $12,499 | 0 (0.0%) | 36 (17.2%) |
| $12,500 to $14,999 | 0 (0.0%) | 0 (0.0%) |
| $15,000 to $17,499 | 0 (0.0%) | 0 (0.0%) |
| $17,500 to $19,999 | 0 (0.0%) | 36 (17.2%) |
| $20,000 to $22,499 | 0 (0.0%) | 0 (0.0%) |
| $22,500 to $24,999 | 0 (0.0%) | 4 (1.9%) |
| $25,000 to $29,999 | 0 (0.0%) | 0 (0.0%) |
| $30,000 to $34,999 | 0 (0.0%) | 6 (2.9%) |
| $35,000 to $39,999 | 0 (0.0%) | 0 (0.0%) |
| $40,000 to $44,999 | 0 (0.0%) | 0 (0.0%) |
| $45,000 to $49,999 | 17 (9.6%) | 0 (0.0%) |
| $50,000 to $54,999 | 0 (0.0%) | 69 (33.0%) |
| $55,000 to $64,999 | 48 (27.1%) | 2 (1.0%) |
| $65,000 to $74,999 | 0 (0.0%) | 0 (0.0%) |
| $75,000 to $99,999 | 100 (56.5%) | 23 (11.0%) |
| $100,000+ | 12 (6.8%) | 29 (13.9%) |
| Total | 177 (100.0%) | 209 (100.0%) |
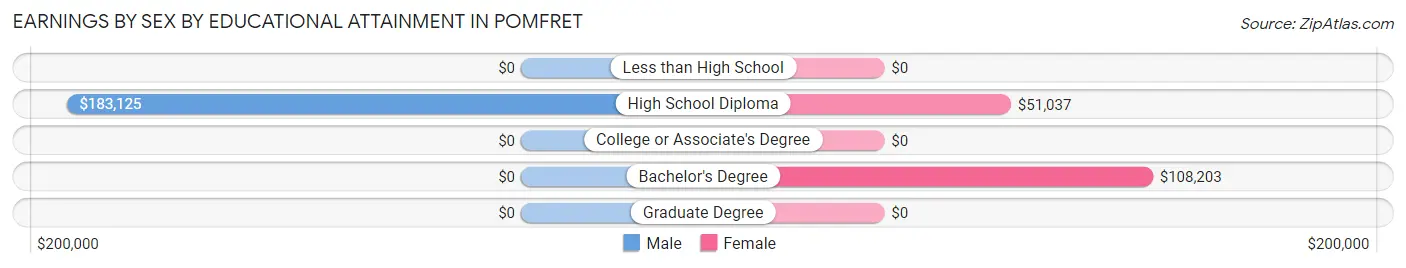
Earnings by Sex by Educational Attainment in Pomfret
| Educational Attainment | Male Income | Female Income |
| Less than High School | - | - |
| High School Diploma | $183,125 | $51,037 |
| College or Associate's Degree | - | - |
| Bachelor's Degree | - | - |
| Graduate Degree | - | - |
| Total | $91,046 | $0 |
Family Income in Pomfret
Family Income Brackets in Pomfret
According to the Pomfret family income data, there are 115 families falling into the $100,000 to $149,999 income range, which is the most common income bracket and makes up 51.8% of all families.
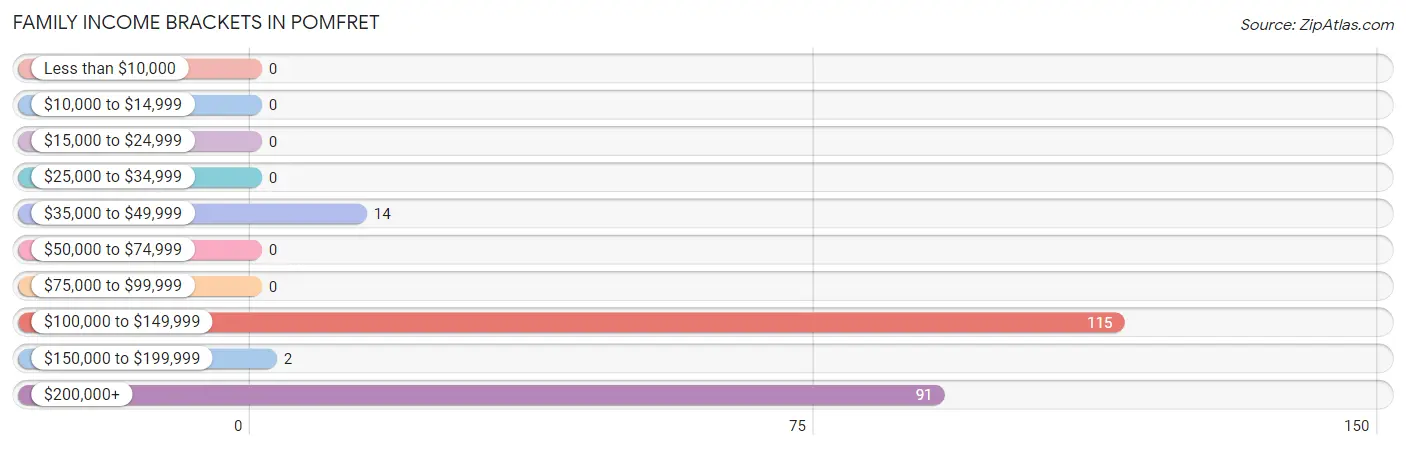
| Income Bracket | # Families | % Families |
| Less than $10,000 | 0 | 0.0% |
| $10,000 to $14,999 | 0 | 0.0% |
| $15,000 to $24,999 | 0 | 0.0% |
| $25,000 to $34,999 | 0 | 0.0% |
| $35,000 to $49,999 | 14 | 6.3% |
| $50,000 to $74,999 | 0 | 0.0% |
| $75,000 to $99,999 | 0 | 0.0% |
| $100,000 to $149,999 | 115 | 51.8% |
| $150,000 to $199,999 | 2 | 0.9% |
| $200,000+ | 91 | 41.0% |
Family Income by Famaliy Size in Pomfret
3-person families (21 | 9.5%) account for the highest median family income in Pomfret with $250,001 per family, while 3-person families (21 | 9.5%) have the highest median income of $83,334 per family member.
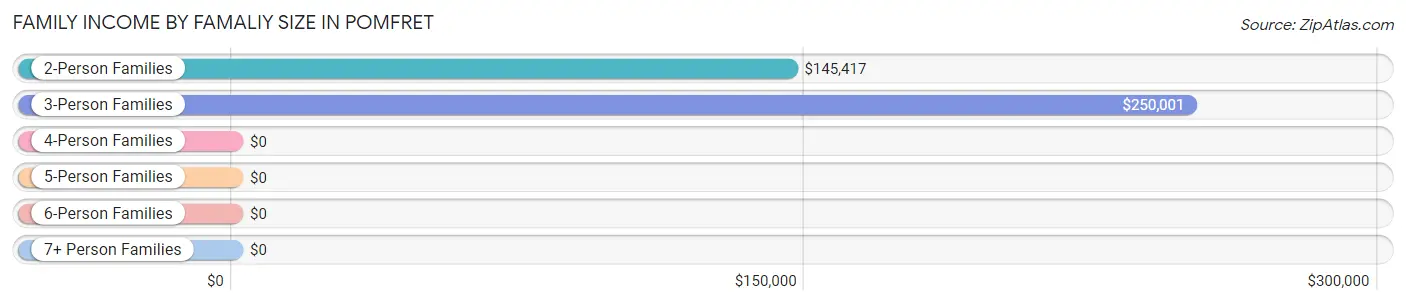
| Income Bracket | # Families | Median Income |
| 2-Person Families | 142 (64.0%) | $145,417 |
| 3-Person Families | 21 (9.5%) | $250,001 |
| 4-Person Families | 0 (0.0%) | $0 |
| 5-Person Families | 44 (19.8%) | $0 |
| 6-Person Families | 15 (6.8%) | $0 |
| 7+ Person Families | 0 (0.0%) | $0 |
| Total | 222 (100.0%) | $0 |
Family Income by Number of Earners in Pomfret
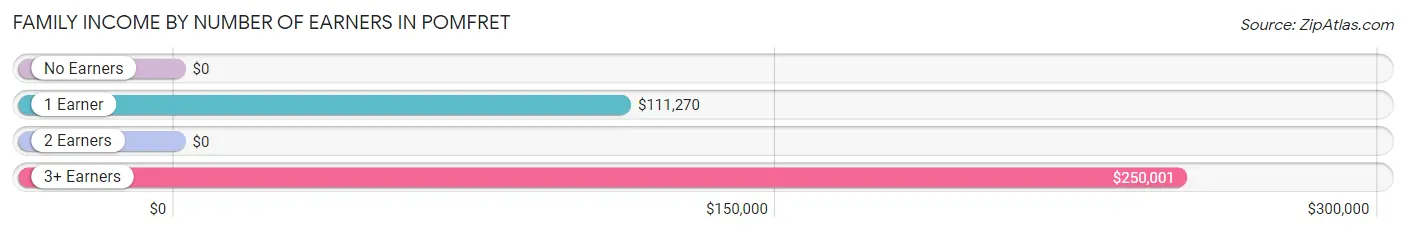
| Number of Earners | # Families | Median Income |
| No Earners | 18 (8.1%) | $0 |
| 1 Earner | 92 (41.4%) | $111,270 |
| 2 Earners | 75 (33.8%) | $0 |
| 3+ Earners | 37 (16.7%) | $250,001 |
| Total | 222 (100.0%) | $0 |
Household Income in Pomfret
Household Income Brackets in Pomfret
With 115 households falling in the category, the $100,000 to $149,999 income range is the most frequent in Pomfret, accounting for 50.4% of all households.
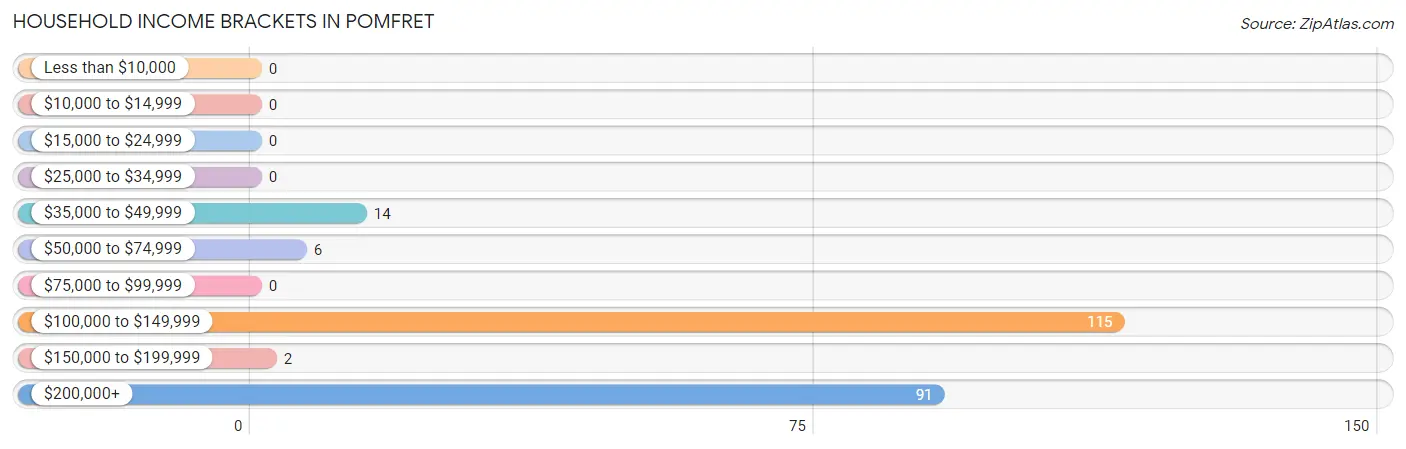
| Income Bracket | # Households | % Households |
| Less than $10,000 | 0 | 0.0% |
| $10,000 to $14,999 | 0 | 0.0% |
| $15,000 to $24,999 | 0 | 0.0% |
| $25,000 to $34,999 | 0 | 0.0% |
| $35,000 to $49,999 | 14 | 6.1% |
| $50,000 to $74,999 | 6 | 2.6% |
| $75,000 to $99,999 | 0 | 0.0% |
| $100,000 to $149,999 | 115 | 50.4% |
| $150,000 to $199,999 | 2 | 0.9% |
| $200,000+ | 91 | 39.9% |
Household Income by Householder Age in Pomfret
The median household income in Pomfret is $146,406, with the highest median household income of $146,068 found in the 45 to 64 years age bracket for the primary householder. A total of 81 households (35.5%) fall into this category.
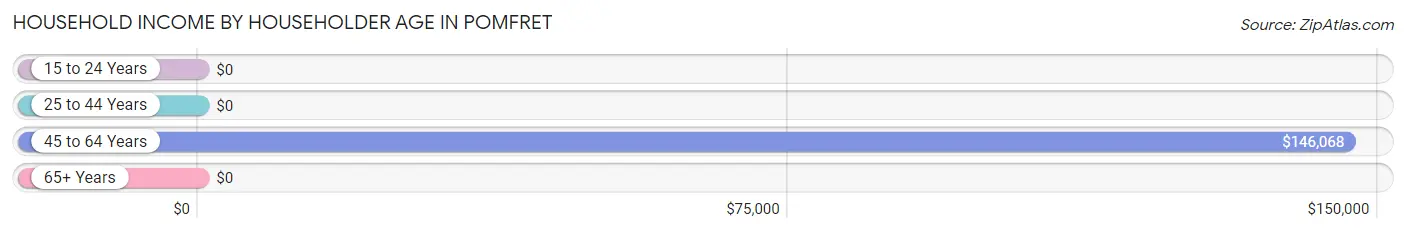
| Income Bracket | # Households | Median Income |
| 15 to 24 Years | 0 (0.0%) | $0 |
| 25 to 44 Years | 4 (1.8%) | $0 |
| 45 to 64 Years | 81 (35.5%) | $146,068 |
| 65+ Years | 143 (62.7%) | $0 |
| Total | 228 (100.0%) | $146,406 |
Poverty in Pomfret
Income Below Poverty by Sex and Age in Pomfret
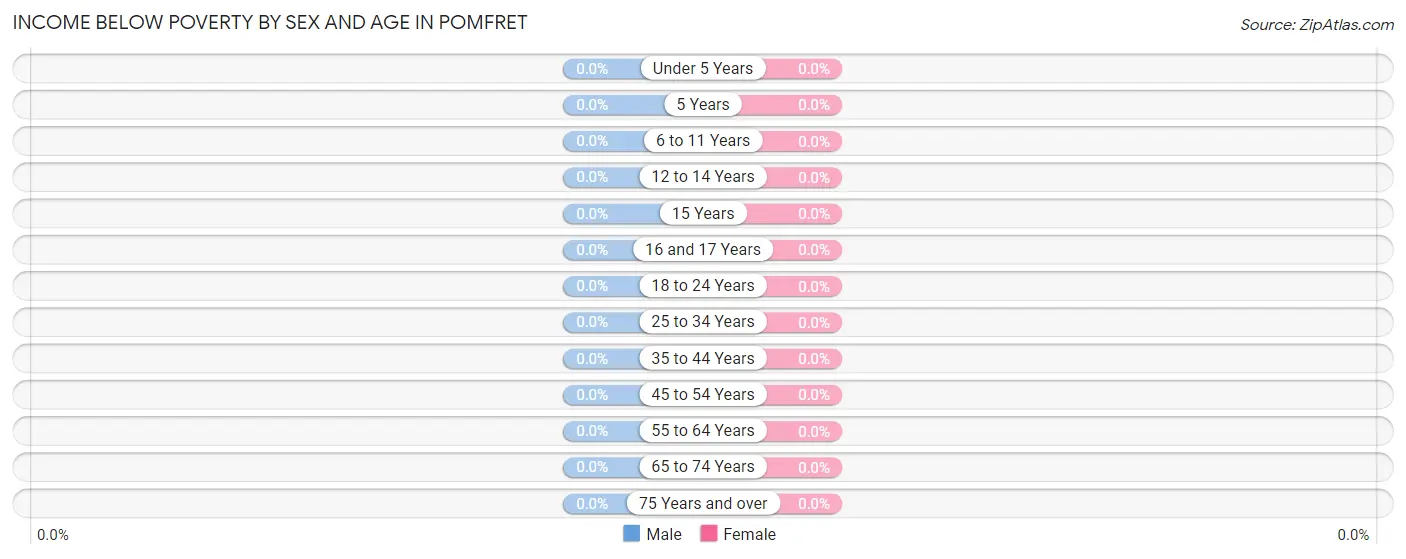
| Age Bracket | Male | Female |
| Under 5 Years | 0 (0.0%) | 0 (0.0%) |
| 5 Years | 0 (0.0%) | 0 (0.0%) |
| 6 to 11 Years | 0 (0.0%) | 0 (0.0%) |
| 12 to 14 Years | 0 (0.0%) | 0 (0.0%) |
| 15 Years | 0 (0.0%) | 0 (0.0%) |
| 16 and 17 Years | 0 (0.0%) | 0 (0.0%) |
| 18 to 24 Years | 0 (0.0%) | 0 (0.0%) |
| 25 to 34 Years | 0 (0.0%) | 0 (0.0%) |
| 35 to 44 Years | 0 (0.0%) | 0 (0.0%) |
| 45 to 54 Years | 0 (0.0%) | 0 (0.0%) |
| 55 to 64 Years | 0 (0.0%) | 0 (0.0%) |
| 65 to 74 Years | 0 (0.0%) | 0 (0.0%) |
| 75 Years and over | 0 (0.0%) | 0 (0.0%) |
| Total | 0 (0.0%) | 0 (0.0%) |
Income Above Poverty by Sex and Age in Pomfret
According to the poverty statistics in Pomfret, males aged 5 years and females aged 6 to 11 years are the age groups that are most secure financially, with 100.0% of males and 100.0% of females in these age groups living above the poverty line.
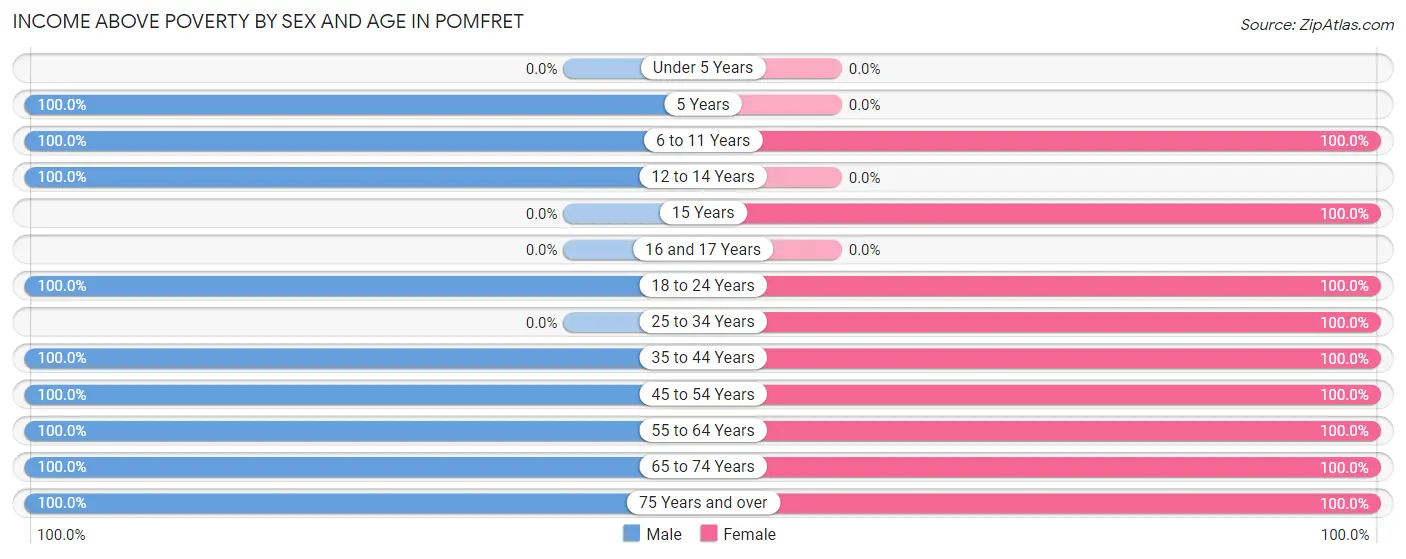
| Age Bracket | Male | Female |
| Under 5 Years | 0 (0.0%) | 0 (0.0%) |
| 5 Years | 15 (100.0%) | 0 (0.0%) |
| 6 to 11 Years | 2 (100.0%) | 41 (100.0%) |
| 12 to 14 Years | 24 (100.0%) | 0 (0.0%) |
| 15 Years | 0 (0.0%) | 23 (100.0%) |
| 16 and 17 Years | 0 (0.0%) | 0 (0.0%) |
| 18 to 24 Years | 54 (100.0%) | 94 (100.0%) |
| 25 to 34 Years | 0 (0.0%) | 8 (100.0%) |
| 35 to 44 Years | 5 (100.0%) | 40 (100.0%) |
| 45 to 54 Years | 78 (100.0%) | 20 (100.0%) |
| 55 to 64 Years | 95 (100.0%) | 56 (100.0%) |
| 65 to 74 Years | 35 (100.0%) | 33 (100.0%) |
| 75 Years and over | 44 (100.0%) | 95 (100.0%) |
| Total | 352 (100.0%) | 410 (100.0%) |
Income Below Poverty Among Married-Couple Families in Pomfret
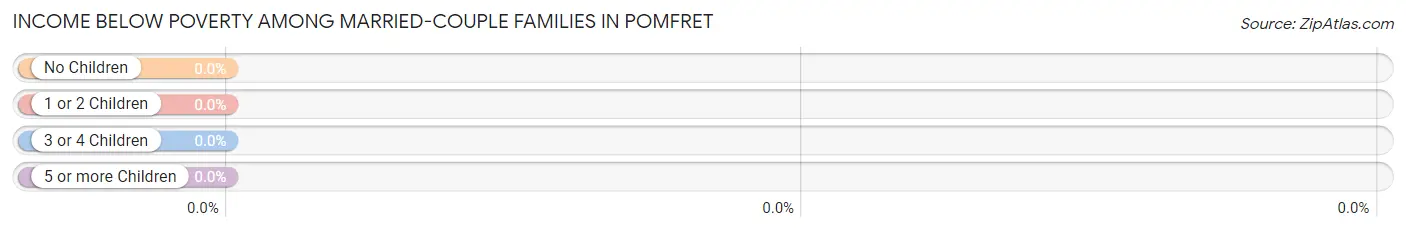
| Children | Above Poverty | Below Poverty |
| No Children | 115 (100.0%) | 0 (0.0%) |
| 1 or 2 Children | 15 (100.0%) | 0 (0.0%) |
| 3 or 4 Children | 12 (100.0%) | 0 (0.0%) |
| 5 or more Children | 0 (0.0%) | 0 (0.0%) |
| Total | 142 (100.0%) | 0 (0.0%) |
Income Below Poverty Among Single-Parent Households in Pomfret
| Children | Single Father | Single Mother |
| No Children | 0 (0.0%) | 0 (0.0%) |
| 1 or 2 Children | 0 (0.0%) | 0 (0.0%) |
| 3 or 4 Children | 0 (0.0%) | 0 (0.0%) |
| 5 or more Children | 0 (0.0%) | 0 (0.0%) |
| Total | 0 (0.0%) | 0 (0.0%) |
Income Below Poverty Among Married-Couple vs Single-Parent Households in Pomfret
| Children | Married-Couple Families | Single-Parent Households |
| No Children | 0 (0.0%) | 0 (0.0%) |
| 1 or 2 Children | 0 (0.0%) | 0 (0.0%) |
| 3 or 4 Children | 0 (0.0%) | 0 (0.0%) |
| 5 or more Children | 0 (0.0%) | 0 (0.0%) |
| Total | 0 (0.0%) | 0 (0.0%) |
Race in Pomfret
The most populous races in Pomfret are Black / African American (288 | 37.8%), Two or more Races (231 | 30.3%), and Some other Race (119 | 15.6%).
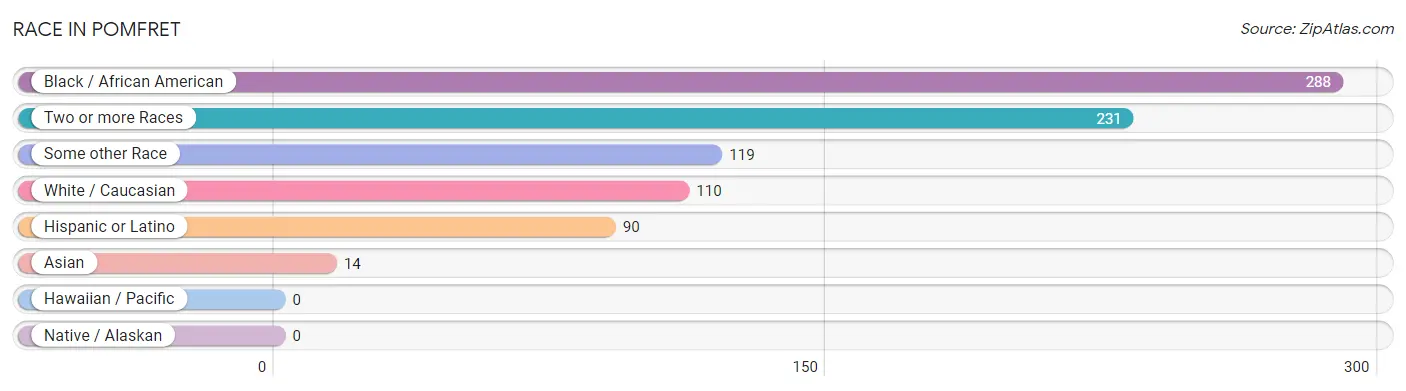
| Race | # Population | % Population |
| Asian | 14 | 1.8% |
| Black / African American | 288 | 37.8% |
| Hawaiian / Pacific | 0 | 0.0% |
| Hispanic or Latino | 90 | 11.8% |
| Native / Alaskan | 0 | 0.0% |
| White / Caucasian | 110 | 14.4% |
| Two or more Races | 231 | 30.3% |
| Some other Race | 119 | 15.6% |
| Total | 762 | 100.0% |
Ancestry in Pomfret
The most populous ancestries reported in Pomfret are Irish (147 | 19.3%), Danish (117 | 15.3%), Central American (90 | 11.8%), Scottish (84 | 11.0%), and Guatemalan (76 | 10.0%), together accounting for 67.4% of all Pomfret residents.
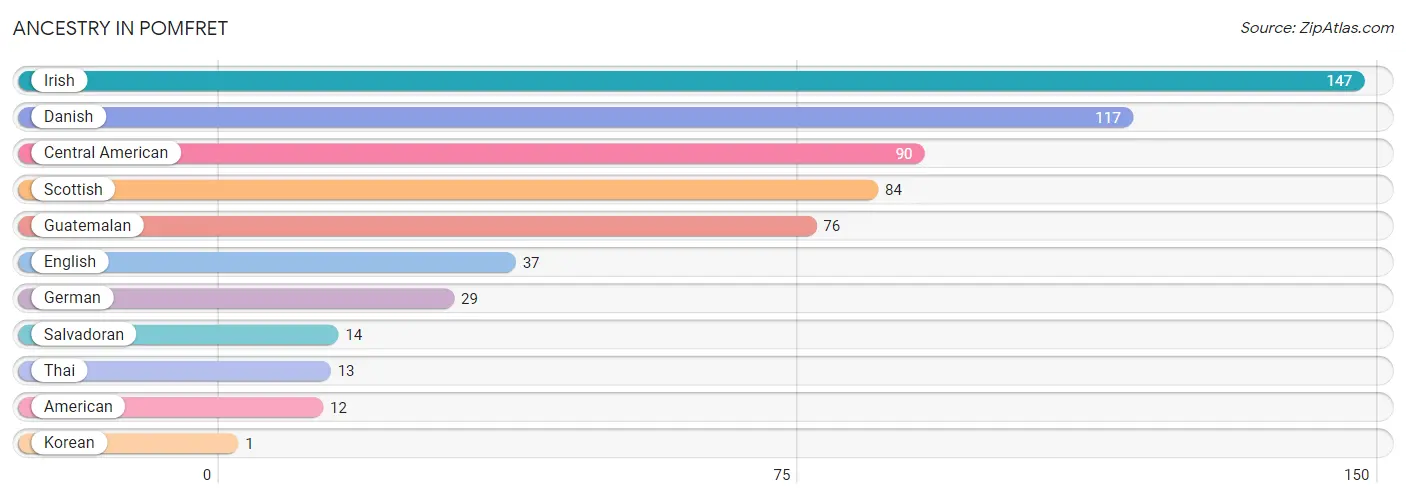
| Ancestry | # Population | % Population |
| American | 12 | 1.6% |
| Central American | 90 | 11.8% |
| Danish | 117 | 15.3% |
| English | 37 | 4.9% |
| German | 29 | 3.8% |
| Guatemalan | 76 | 10.0% |
| Irish | 147 | 19.3% |
| Korean | 1 | 0.1% |
| Salvadoran | 14 | 1.8% |
| Scottish | 84 | 11.0% |
| Thai | 13 | 1.7% | View All 11 Rows |
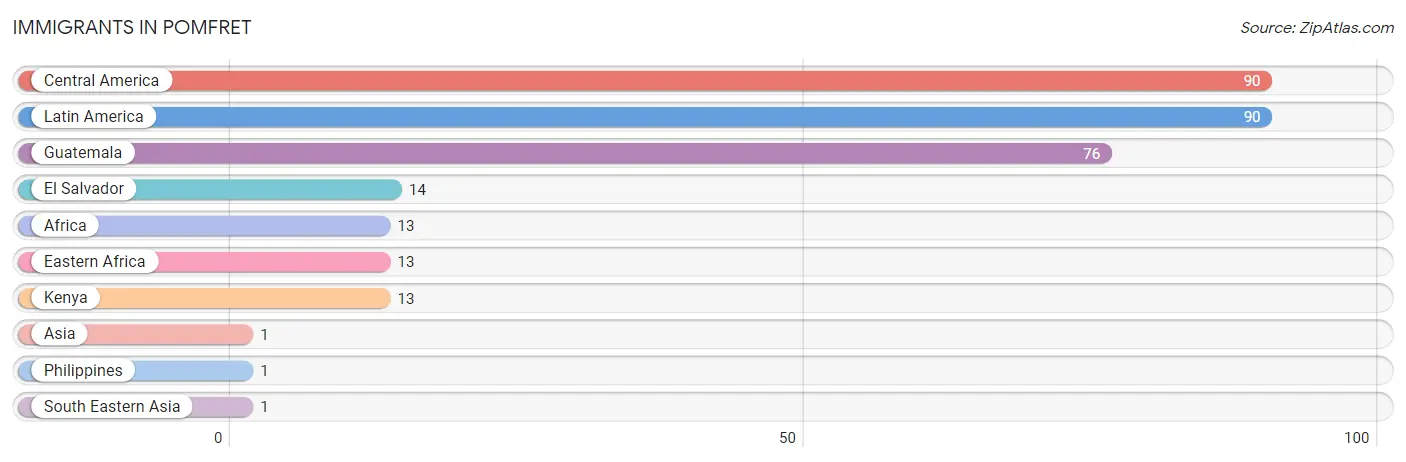
Immigrants in Pomfret
The most numerous immigrant groups reported in Pomfret came from Central America (90 | 11.8%), Latin America (90 | 11.8%), Guatemala (76 | 10.0%), El Salvador (14 | 1.8%), and Africa (13 | 1.7%), together accounting for 37.1% of all Pomfret residents.
| Immigration Origin | # Population | % Population |
| Africa | 13 | 1.7% |
| Asia | 1 | 0.1% |
| Central America | 90 | 11.8% |
| Eastern Africa | 13 | 1.7% |
| El Salvador | 14 | 1.8% |
| Guatemala | 76 | 10.0% |
| Kenya | 13 | 1.7% |
| Latin America | 90 | 11.8% |
| Philippines | 1 | 0.1% |
| South Eastern Asia | 1 | 0.1% | View All 10 Rows |
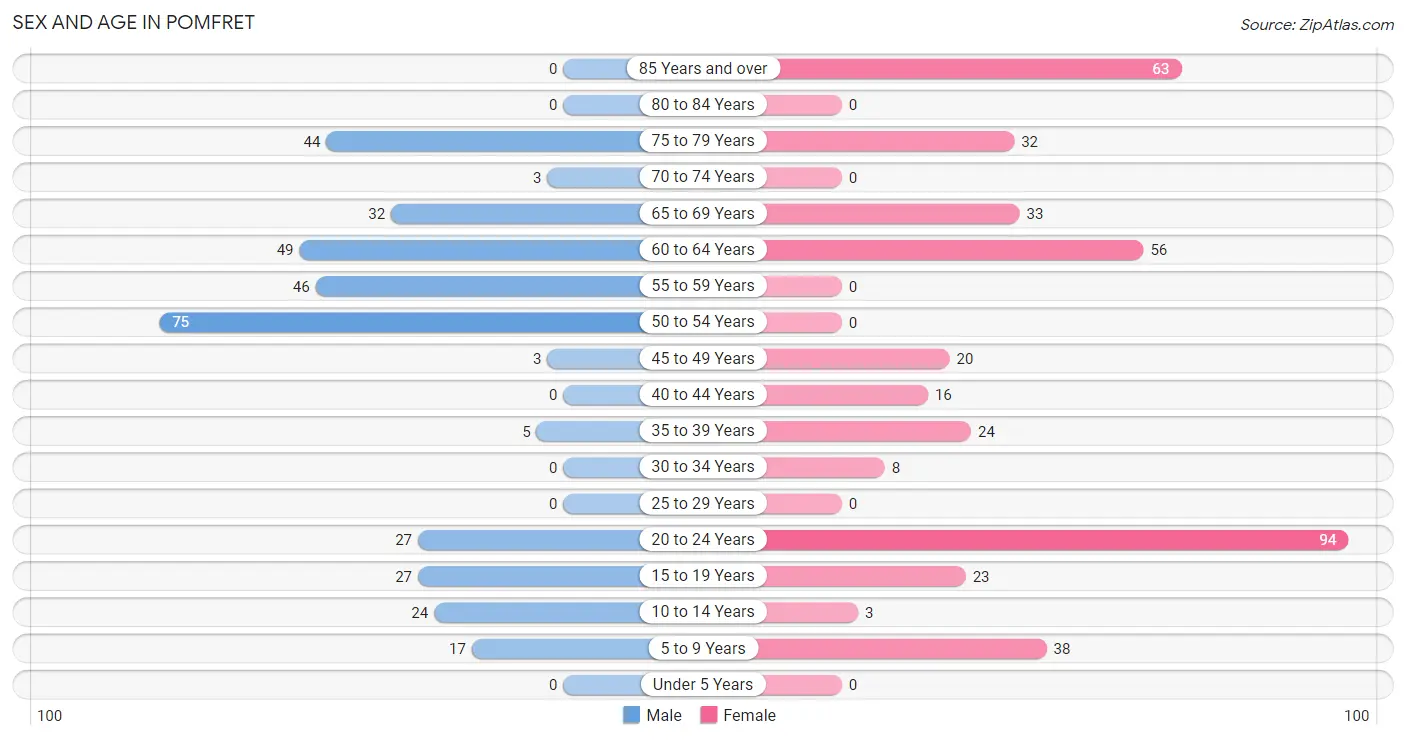
Sex and Age in Pomfret
Sex and Age in Pomfret
The most populous age groups in Pomfret are 50 to 54 Years (75 | 21.3%) for men and 20 to 24 Years (94 | 22.9%) for women.
| Age Bracket | Male | Female |
| Under 5 Years | 0 (0.0%) | 0 (0.0%) |
| 5 to 9 Years | 17 (4.8%) | 38 (9.3%) |
| 10 to 14 Years | 24 (6.8%) | 3 (0.7%) |
| 15 to 19 Years | 27 (7.7%) | 23 (5.6%) |
| 20 to 24 Years | 27 (7.7%) | 94 (22.9%) |
| 25 to 29 Years | 0 (0.0%) | 0 (0.0%) |
| 30 to 34 Years | 0 (0.0%) | 8 (1.9%) |
| 35 to 39 Years | 5 (1.4%) | 24 (5.9%) |
| 40 to 44 Years | 0 (0.0%) | 16 (3.9%) |
| 45 to 49 Years | 3 (0.9%) | 20 (4.9%) |
| 50 to 54 Years | 75 (21.3%) | 0 (0.0%) |
| 55 to 59 Years | 46 (13.1%) | 0 (0.0%) |
| 60 to 64 Years | 49 (13.9%) | 56 (13.7%) |
| 65 to 69 Years | 32 (9.1%) | 33 (8.1%) |
| 70 to 74 Years | 3 (0.9%) | 0 (0.0%) |
| 75 to 79 Years | 44 (12.5%) | 32 (7.8%) |
| 80 to 84 Years | 0 (0.0%) | 0 (0.0%) |
| 85 Years and over | 0 (0.0%) | 63 (15.4%) |
| Total | 352 (100.0%) | 410 (100.0%) |
Families and Households in Pomfret
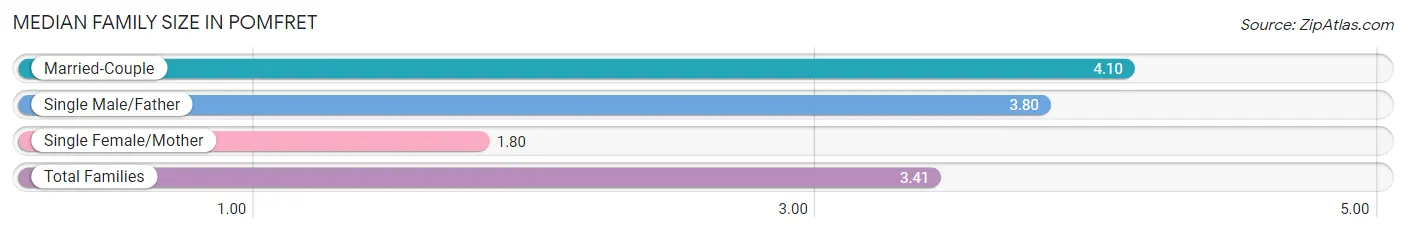
Median Family Size in Pomfret
The median family size in Pomfret is 3.41 persons per family, with married-couple families (142 | 64.0%) accounting for the largest median family size of 4.1 persons per family. On the other hand, single female/mother families (65 | 29.3%) represent the smallest median family size with 1.80 persons per family.
| Family Type | # Families | Family Size |
| Married-Couple | 142 (64.0%) | 4.10 |
| Single Male/Father | 15 (6.8%) | 3.80 |
| Single Female/Mother | 65 (29.3%) | 1.80 |
| Total Families | 222 (100.0%) | 3.41 |
Median Household Size in Pomfret
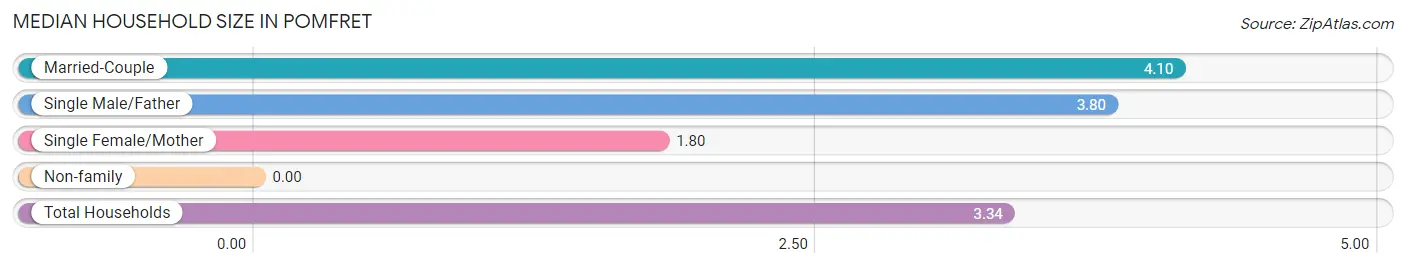
| Household Type | # Households | Household Size |
| Married-Couple | 142 (62.3%) | 4.10 |
| Single Male/Father | 15 (6.6%) | 3.80 |
| Single Female/Mother | 65 (28.5%) | 1.80 |
| Non-family | 6 (2.6%) | - |
| Total Households | 228 (100.0%) | 3.34 |
Household Size by Marriage Status in Pomfret
Out of a total of 228 households in Pomfret, 222 (97.4%) are family households, while 6 (2.6%) are nonfamily households. The most numerous type of family households are 2-person households, comprising 142, and the most common type of nonfamily households are 1-person households, comprising 6.
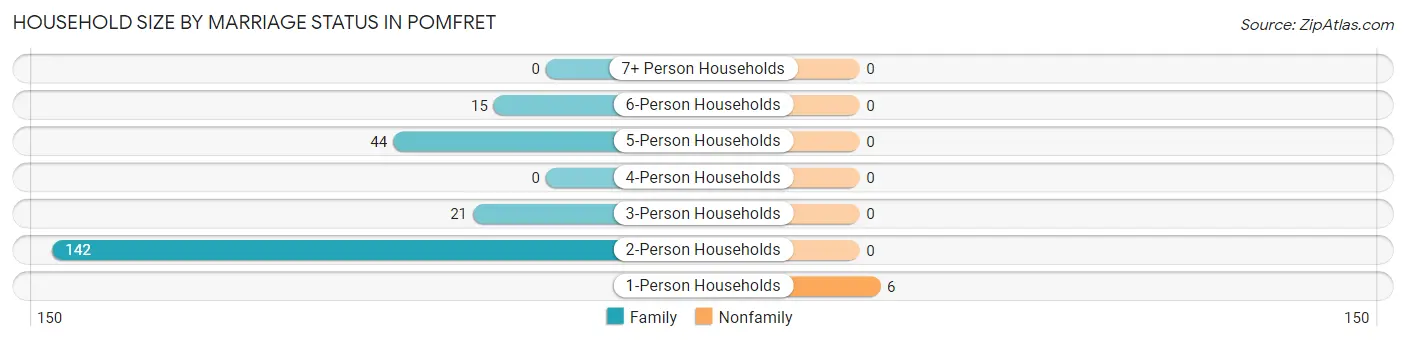
| Household Size | Family Households | Nonfamily Households |
| 1-Person Households | - | 6 (2.6%) |
| 2-Person Households | 142 (62.3%) | 0 (0.0%) |
| 3-Person Households | 21 (9.2%) | 0 (0.0%) |
| 4-Person Households | 0 (0.0%) | 0 (0.0%) |
| 5-Person Households | 44 (19.3%) | 0 (0.0%) |
| 6-Person Households | 15 (6.6%) | 0 (0.0%) |
| 7+ Person Households | 0 (0.0%) | 0 (0.0%) |
| Total | 222 (97.4%) | 6 (2.6%) |
Female Fertility in Pomfret
Fertility by Age in Pomfret
| Age Bracket | Women with Births | Births / 1,000 Women |
| 15 to 19 years | 0 (0.0%) | 0.0 |
| 20 to 34 years | 0 (0.0%) | 0.0 |
| 35 to 50 years | 0 (0.0%) | 0.0 |
| Total | 0 (0.0%) | 0.0 |
Fertility by Age by Marriage Status in Pomfret
| Age Bracket | Married | Unmarried |
| 15 to 19 years | 0 (0.0%) | 0 (0.0%) |
| 20 to 34 years | 0 (0.0%) | 0 (0.0%) |
| 35 to 50 years | 0 (0.0%) | 0 (0.0%) |
| Total | 0 (0.0%) | 0 (0.0%) |
Fertility by Education in Pomfret
| Educational Attainment | Women with Births | Births / 1,000 Women |
| Less than High School | 0 (0.0%) | 0.0 |
| High School Diploma | 0 (0.0%) | 0.0 |
| College or Associate's Degree | 0 (0.0%) | 0.0 |
| Bachelor's Degree | 0 (0.0%) | 0.0 |
| Graduate Degree | 0 (0.0%) | 0.0 |
| Total | 0 (0.0%) | 0.0 |
Fertility by Education by Marriage Status in Pomfret
| Educational Attainment | Married | Unmarried |
| Less than High School | 0 (0.0%) | 0 (0.0%) |
| High School Diploma | 0 (0.0%) | 0 (0.0%) |
| College or Associate's Degree | 0 (0.0%) | 0 (0.0%) |
| Bachelor's Degree | 0 (0.0%) | 0 (0.0%) |
| Graduate Degree | 0 (0.0%) | 0 (0.0%) |
| Total | 0 (0.0%) | 0 (0.0%) |
Employment Characteristics in Pomfret
Employment by Class of Employer in Pomfret
Among the 350 employed individuals in Pomfret, private company employees (221 | 63.1%), local government employees (73 | 20.9%), and not-for-profit organizations (47 | 13.4%) make up the most common classes of employment.
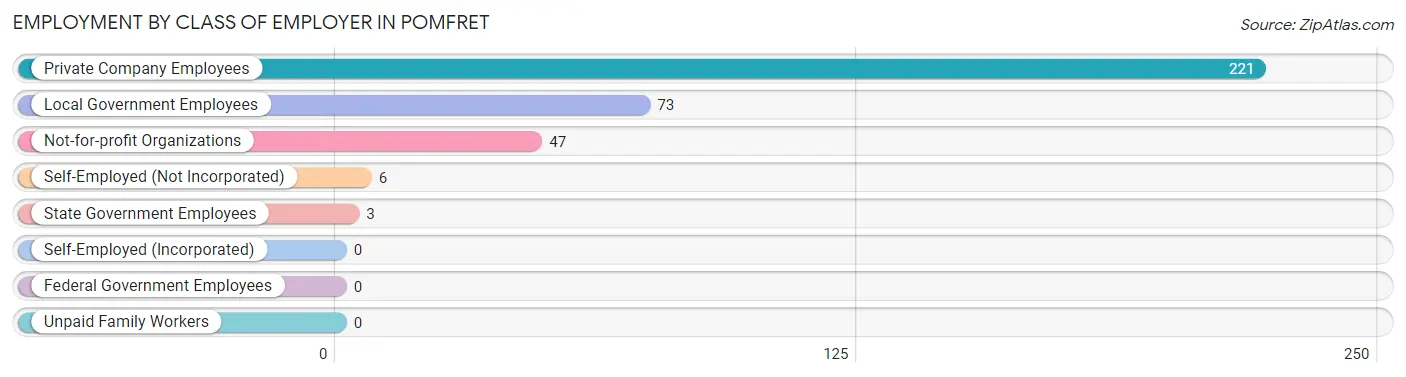
| Employer Class | # Employees | % Employees |
| Private Company Employees | 221 | 63.1% |
| Self-Employed (Incorporated) | 0 | 0.0% |
| Self-Employed (Not Incorporated) | 6 | 1.7% |
| Not-for-profit Organizations | 47 | 13.4% |
| Local Government Employees | 73 | 20.9% |
| State Government Employees | 3 | 0.9% |
| Federal Government Employees | 0 | 0.0% |
| Unpaid Family Workers | 0 | 0.0% |
| Total | 350 | 100.0% |
Employment Status by Age in Pomfret
According to the labor force statistics for Pomfret, out of the total population over 16 years of age (657), 58.8% or 386 individuals are in the labor force, with 9.3% or 36 of them unemployed. The age group with the highest labor force participation rate is 30 to 34 years, with 100.0% or 8 individuals in the labor force. Within the labor force, the 20 to 24 years age range has the highest percentage of unemployed individuals, with 38.3% or 36 of them being unemployed.
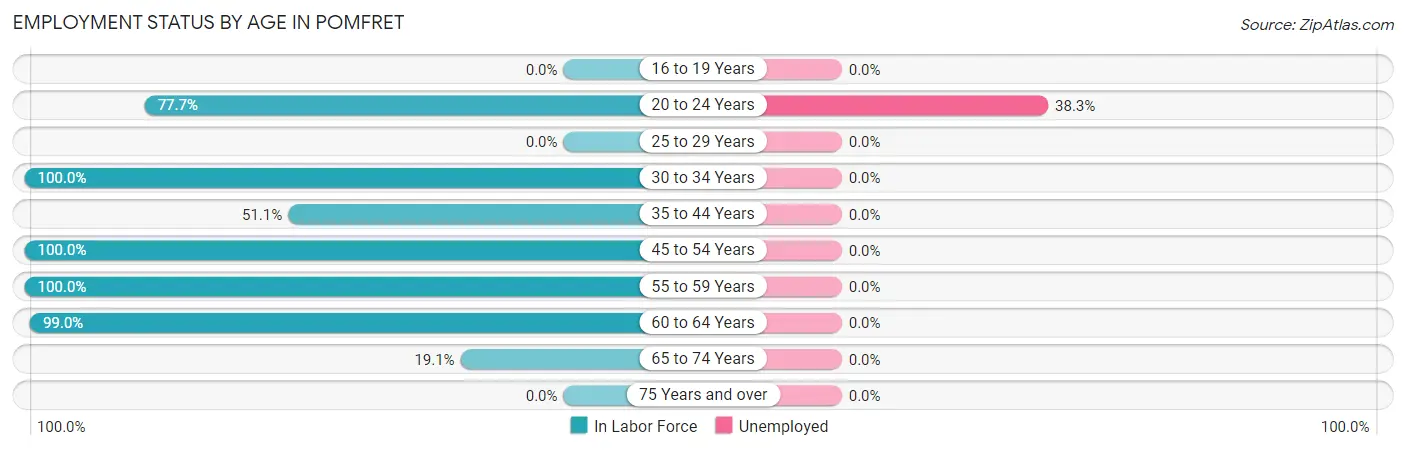
| Age Bracket | In Labor Force | Unemployed |
| 16 to 19 Years | 0 (0.0%) | 0 (0.0%) |
| 20 to 24 Years | 94 (77.7%) | 36 (38.3%) |
| 25 to 29 Years | 0 (0.0%) | 0 (0.0%) |
| 30 to 34 Years | 8 (100.0%) | 0 (0.0%) |
| 35 to 44 Years | 23 (51.1%) | 0 (0.0%) |
| 45 to 54 Years | 98 (100.0%) | 0 (0.0%) |
| 55 to 59 Years | 46 (100.0%) | 0 (0.0%) |
| 60 to 64 Years | 104 (99.0%) | 0 (0.0%) |
| 65 to 74 Years | 13 (19.1%) | 0 (0.0%) |
| 75 Years and over | 0 (0.0%) | 0 (0.0%) |
| Total | 386 (58.8%) | 36 (9.3%) |
Employment Status by Educational Attainment in Pomfret
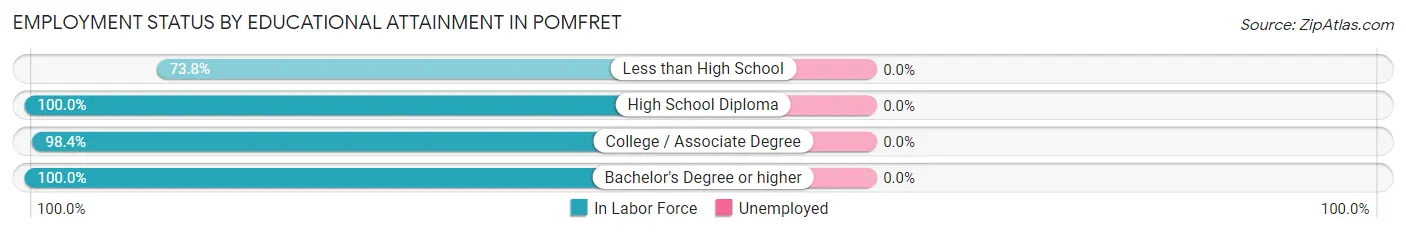
| Educational Attainment | In Labor Force | Unemployed |
| Less than High School | 62 (73.8%) | 0 (0.0%) |
| High School Diploma | 73 (100.0%) | 0 (0.0%) |
| College / Associate Degree | 62 (98.4%) | 0 (0.0%) |
| Bachelor's Degree or higher | 82 (100.0%) | 0 (0.0%) |
| Total | 279 (92.4%) | 0 (0.0%) |
Employment Occupations by Sex in Pomfret
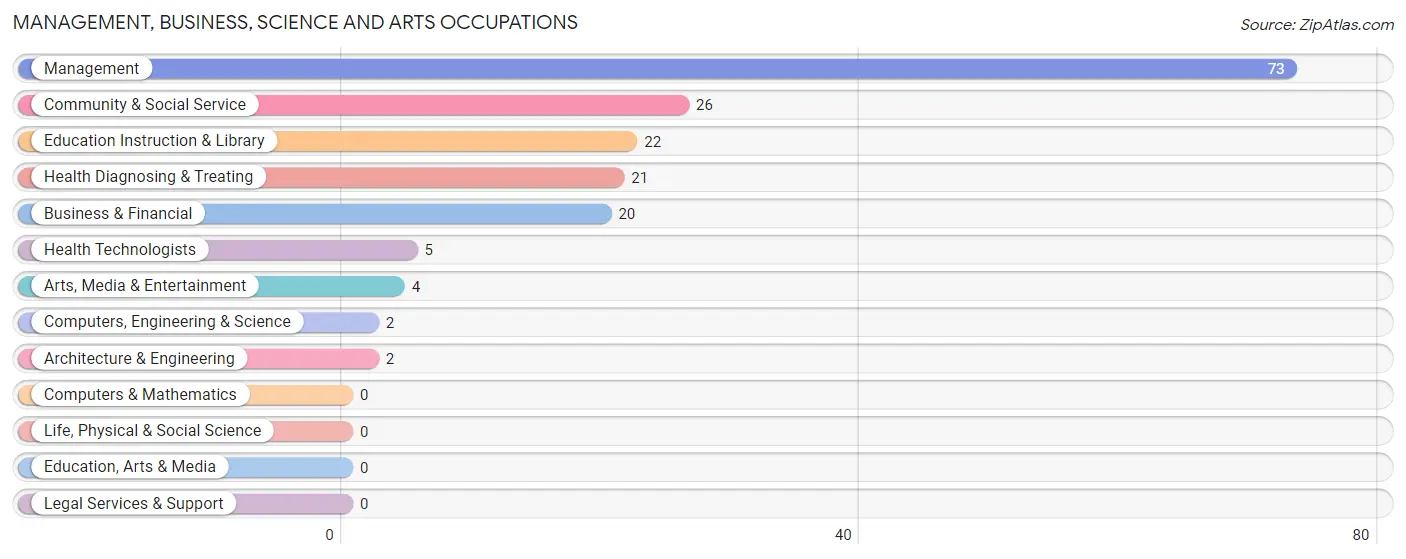
Management, Business, Science and Arts Occupations
The most common Management, Business, Science and Arts occupations in Pomfret are Management (73 | 20.9%), Community & Social Service (26 | 7.4%), Education Instruction & Library (22 | 6.3%), Health Diagnosing & Treating (21 | 6.0%), and Business & Financial (20 | 5.7%).
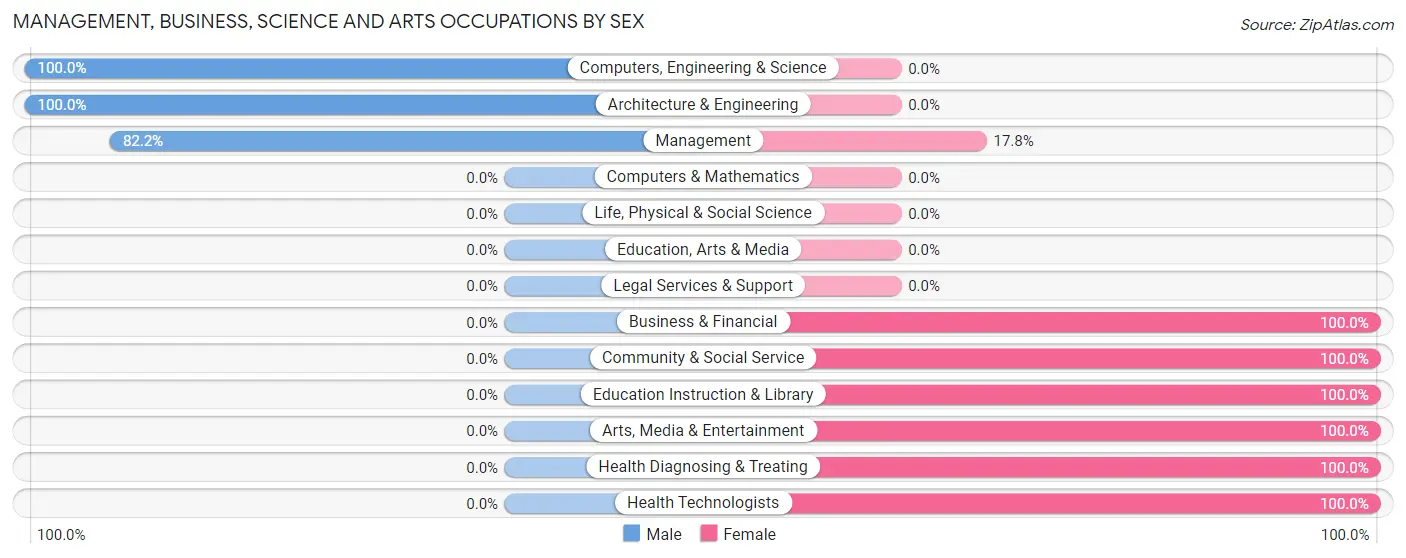
Management, Business, Science and Arts Occupations by Sex
Within the Management, Business, Science and Arts occupations in Pomfret, the most male-oriented occupations are Computers, Engineering & Science (100.0%), Architecture & Engineering (100.0%), and Management (82.2%), while the most female-oriented occupations are Business & Financial (100.0%), Community & Social Service (100.0%), and Education Instruction & Library (100.0%).
| Occupation | Male | Female |
| Management | 60 (82.2%) | 13 (17.8%) |
| Business & Financial | 0 (0.0%) | 20 (100.0%) |
| Computers, Engineering & Science | 2 (100.0%) | 0 (0.0%) |
| Computers & Mathematics | 0 (0.0%) | 0 (0.0%) |
| Architecture & Engineering | 2 (100.0%) | 0 (0.0%) |
| Life, Physical & Social Science | 0 (0.0%) | 0 (0.0%) |
| Community & Social Service | 0 (0.0%) | 26 (100.0%) |
| Education, Arts & Media | 0 (0.0%) | 0 (0.0%) |
| Legal Services & Support | 0 (0.0%) | 0 (0.0%) |
| Education Instruction & Library | 0 (0.0%) | 22 (100.0%) |
| Arts, Media & Entertainment | 0 (0.0%) | 4 (100.0%) |
| Health Diagnosing & Treating | 0 (0.0%) | 21 (100.0%) |
| Health Technologists | 0 (0.0%) | 5 (100.0%) |
| Total (Category) | 62 (43.7%) | 80 (56.3%) |
| Total (Overall) | 177 (50.6%) | 173 (49.4%) |
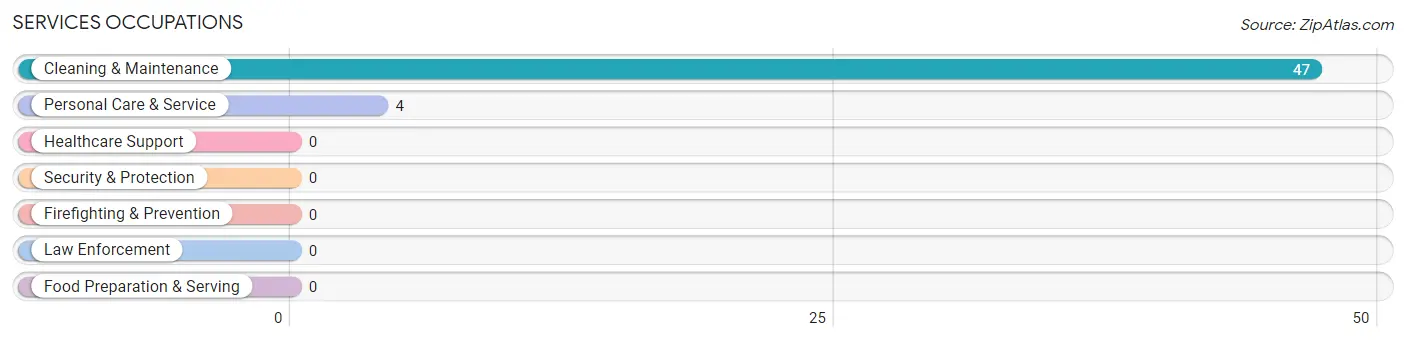
Services Occupations
The most common Services occupations in Pomfret are Cleaning & Maintenance (47 | 13.4%), and Personal Care & Service (4 | 1.1%).
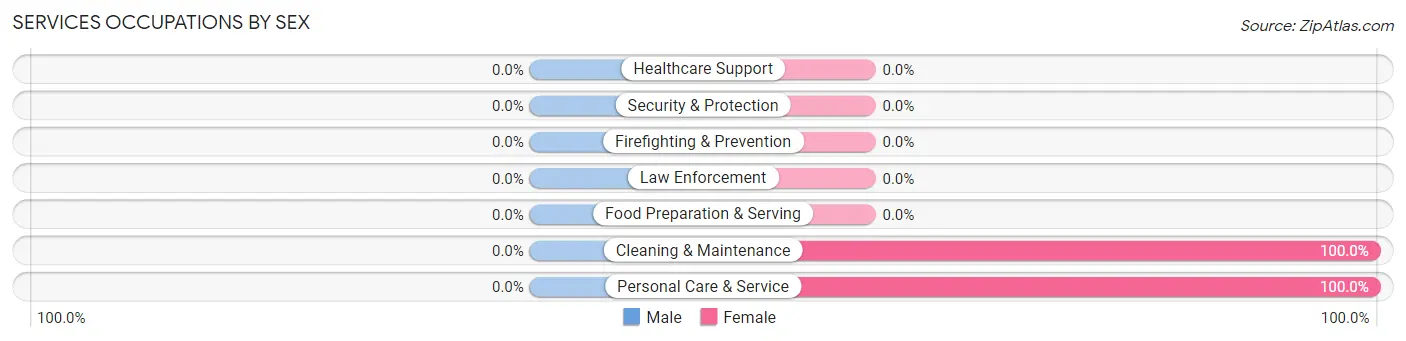
Services Occupations by Sex
| Occupation | Male | Female |
| Healthcare Support | 0 (0.0%) | 0 (0.0%) |
| Security & Protection | 0 (0.0%) | 0 (0.0%) |
| Firefighting & Prevention | 0 (0.0%) | 0 (0.0%) |
| Law Enforcement | 0 (0.0%) | 0 (0.0%) |
| Food Preparation & Serving | 0 (0.0%) | 0 (0.0%) |
| Cleaning & Maintenance | 0 (0.0%) | 47 (100.0%) |
| Personal Care & Service | 0 (0.0%) | 4 (100.0%) |
| Total (Category) | 0 (0.0%) | 51 (100.0%) |
| Total (Overall) | 177 (50.6%) | 173 (49.4%) |
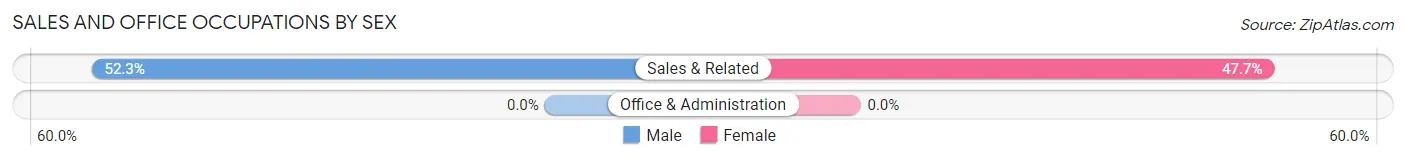
Sales and Office Occupations
The most common Sales and Office occupations in Pomfret are , and Sales & Related (88 | 25.1%).

Sales and Office Occupations by Sex
| Occupation | Male | Female |
| Sales & Related | 46 (52.3%) | 42 (47.7%) |
| Office & Administration | 0 (0.0%) | 0 (0.0%) |
| Total (Category) | 46 (52.3%) | 42 (47.7%) |
| Total (Overall) | 177 (50.6%) | 173 (49.4%) |
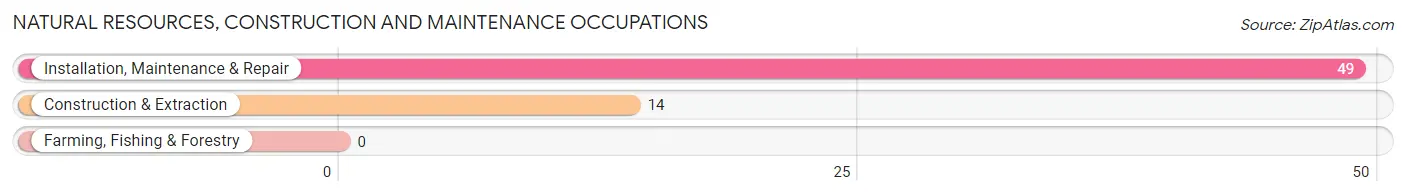
Natural Resources, Construction and Maintenance Occupations
The most common Natural Resources, Construction and Maintenance occupations in Pomfret are Installation, Maintenance & Repair (49 | 14.0%), and Construction & Extraction (14 | 4.0%).
Natural Resources, Construction and Maintenance Occupations by Sex
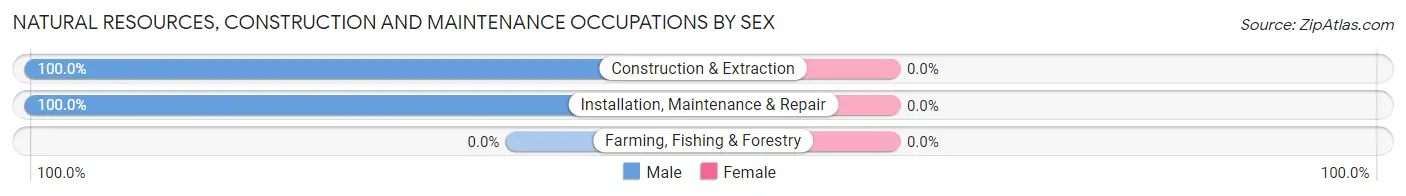
| Occupation | Male | Female |
| Farming, Fishing & Forestry | 0 (0.0%) | 0 (0.0%) |
| Construction & Extraction | 14 (100.0%) | 0 (0.0%) |
| Installation, Maintenance & Repair | 49 (100.0%) | 0 (0.0%) |
| Total (Category) | 63 (100.0%) | 0 (0.0%) |
| Total (Overall) | 177 (50.6%) | 173 (49.4%) |
Production, Transportation and Moving Occupations
The most common Production, Transportation and Moving occupations in Pomfret are Production (3 | 0.9%), and Transportation (3 | 0.9%).
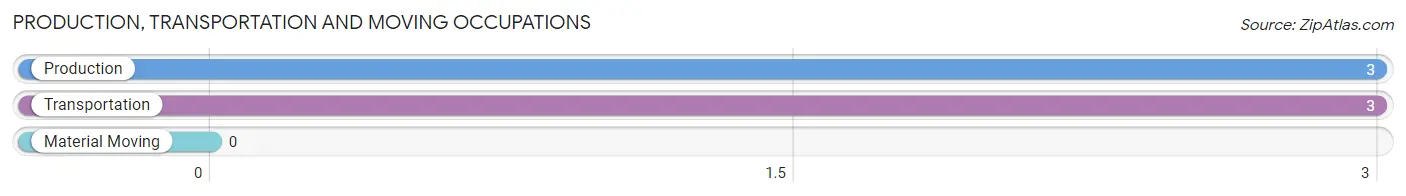
Production, Transportation and Moving Occupations by Sex
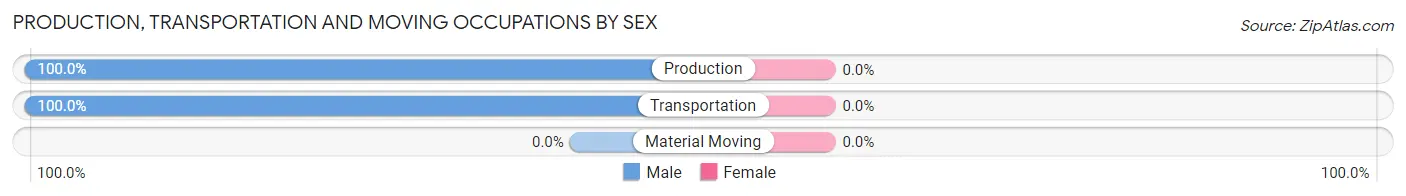
| Occupation | Male | Female |
| Production | 3 (100.0%) | 0 (0.0%) |
| Transportation | 3 (100.0%) | 0 (0.0%) |
| Material Moving | 0 (0.0%) | 0 (0.0%) |
| Total (Category) | 6 (100.0%) | 0 (0.0%) |
| Total (Overall) | 177 (50.6%) | 173 (49.4%) |
Employment Industries by Sex in Pomfret
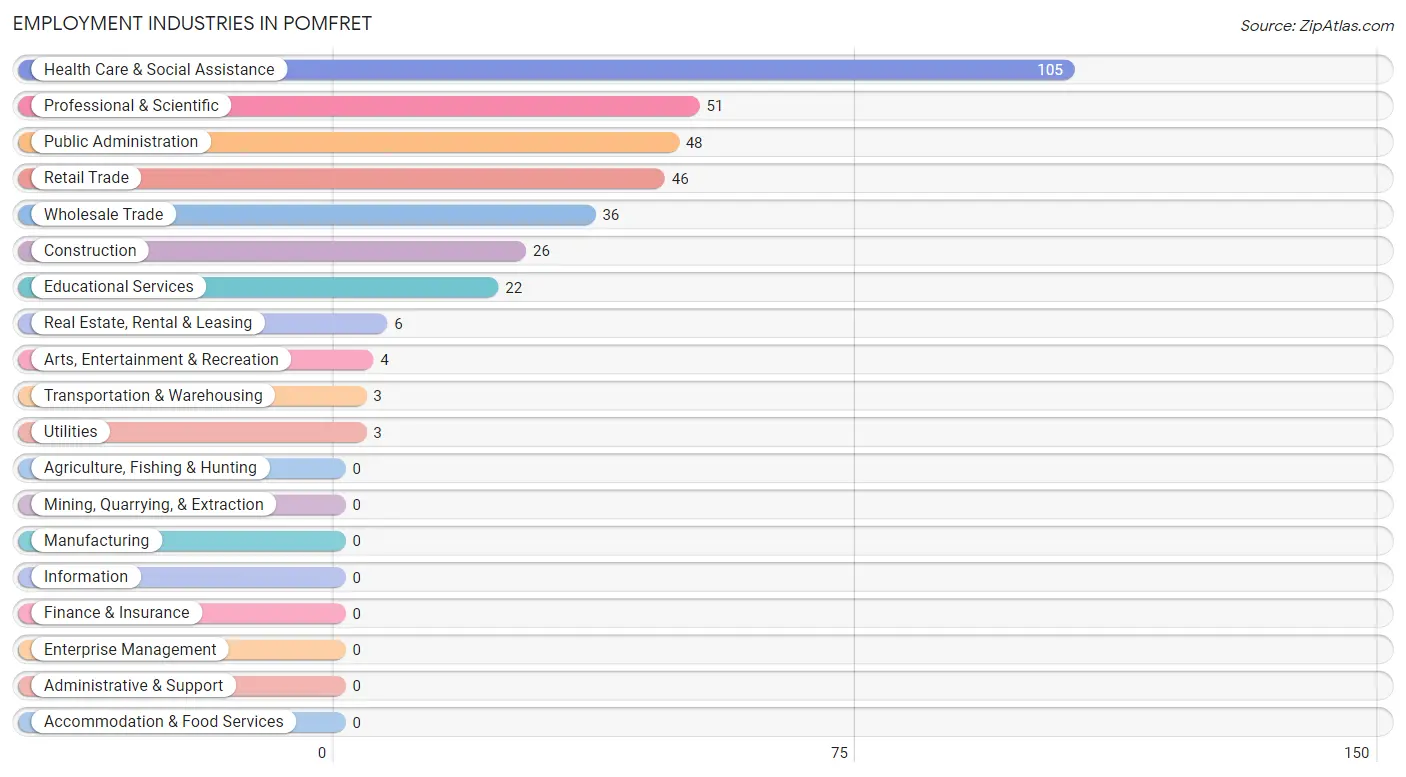
Employment Industries in Pomfret
The major employment industries in Pomfret include Health Care & Social Assistance (105 | 30.0%), Professional & Scientific (51 | 14.6%), Public Administration (48 | 13.7%), Retail Trade (46 | 13.1%), and Wholesale Trade (36 | 10.3%).
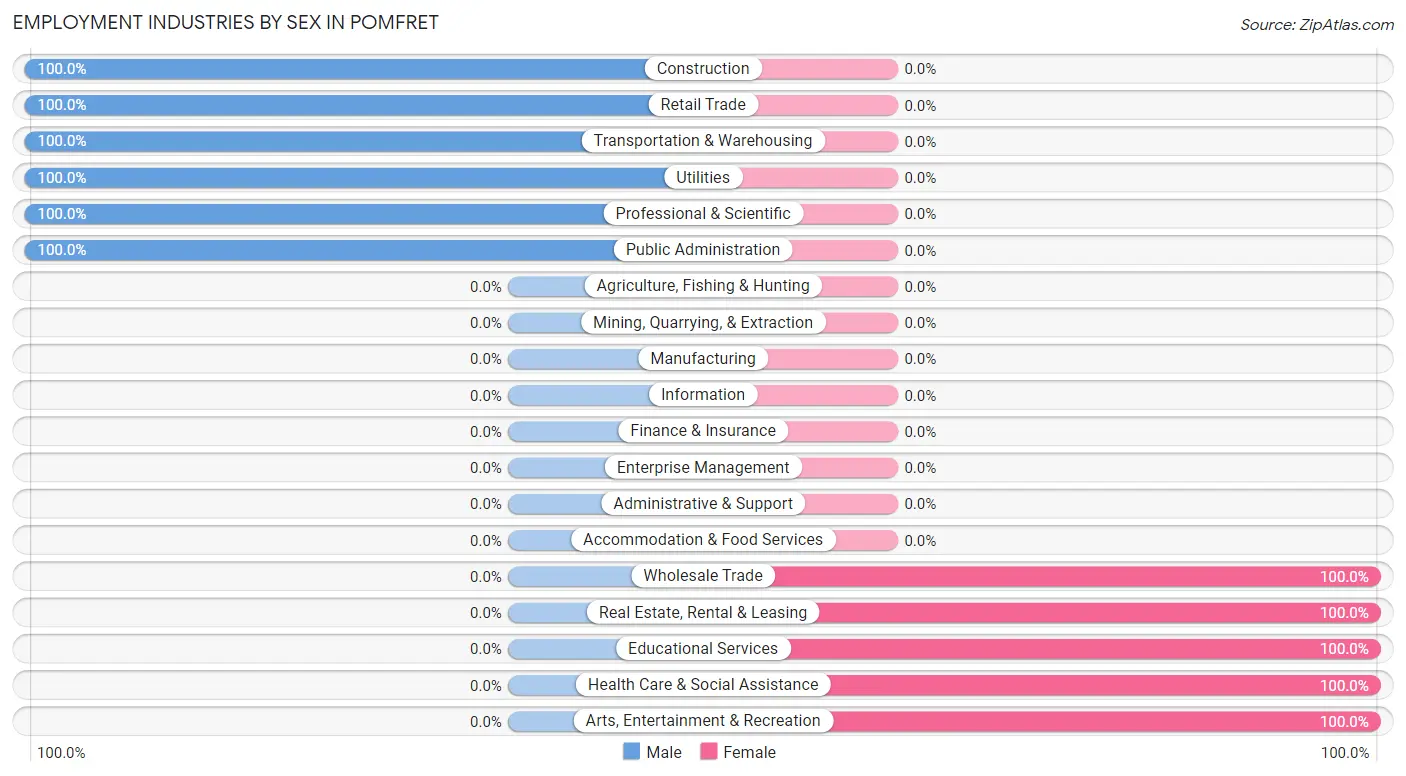
Employment Industries by Sex in Pomfret
The Pomfret industries that see more men than women are Construction (100.0%), Retail Trade (100.0%), and Transportation & Warehousing (100.0%), whereas the industries that tend to have a higher number of women are Wholesale Trade (100.0%), Real Estate, Rental & Leasing (100.0%), and Educational Services (100.0%).
| Industry | Male | Female |
| Agriculture, Fishing & Hunting | 0 (0.0%) | 0 (0.0%) |
| Mining, Quarrying, & Extraction | 0 (0.0%) | 0 (0.0%) |
| Construction | 26 (100.0%) | 0 (0.0%) |
| Manufacturing | 0 (0.0%) | 0 (0.0%) |
| Wholesale Trade | 0 (0.0%) | 36 (100.0%) |
| Retail Trade | 46 (100.0%) | 0 (0.0%) |
| Transportation & Warehousing | 3 (100.0%) | 0 (0.0%) |
| Utilities | 3 (100.0%) | 0 (0.0%) |
| Information | 0 (0.0%) | 0 (0.0%) |
| Finance & Insurance | 0 (0.0%) | 0 (0.0%) |
| Real Estate, Rental & Leasing | 0 (0.0%) | 6 (100.0%) |
| Professional & Scientific | 51 (100.0%) | 0 (0.0%) |
| Enterprise Management | 0 (0.0%) | 0 (0.0%) |
| Administrative & Support | 0 (0.0%) | 0 (0.0%) |
| Educational Services | 0 (0.0%) | 22 (100.0%) |
| Health Care & Social Assistance | 0 (0.0%) | 105 (100.0%) |
| Arts, Entertainment & Recreation | 0 (0.0%) | 4 (100.0%) |
| Accommodation & Food Services | 0 (0.0%) | 0 (0.0%) |
| Public Administration | 48 (100.0%) | 0 (0.0%) |
| Total | 177 (50.6%) | 173 (49.4%) |
Education in Pomfret
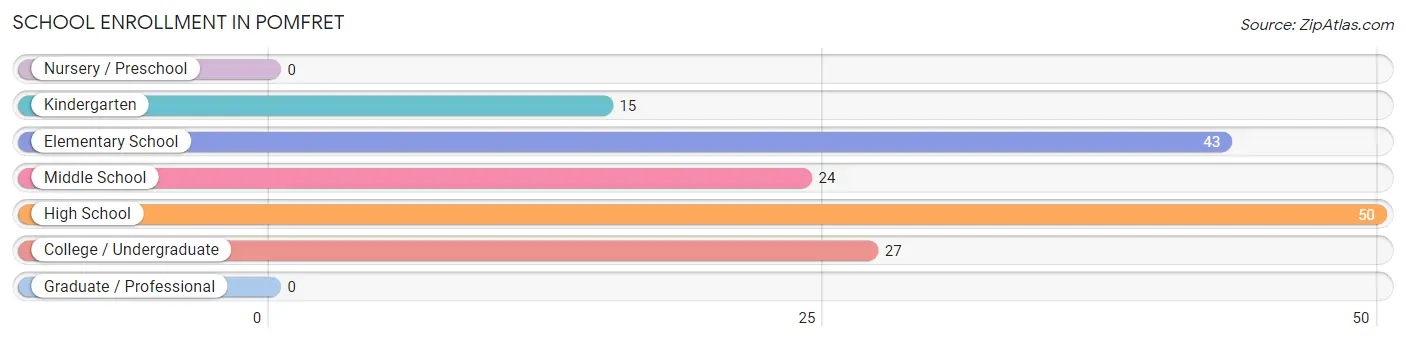
School Enrollment in Pomfret
The most common levels of schooling among the 159 students in Pomfret are high school (50 | 31.5%), elementary school (43 | 27.0%), and college / undergraduate (27 | 17.0%).
| School Level | # Students | % Students |
| Nursery / Preschool | 0 | 0.0% |
| Kindergarten | 15 | 9.4% |
| Elementary School | 43 | 27.0% |
| Middle School | 24 | 15.1% |
| High School | 50 | 31.5% |
| College / Undergraduate | 27 | 17.0% |
| Graduate / Professional | 0 | 0.0% |
| Total | 159 | 100.0% |
School Enrollment by Age by Funding Source in Pomfret
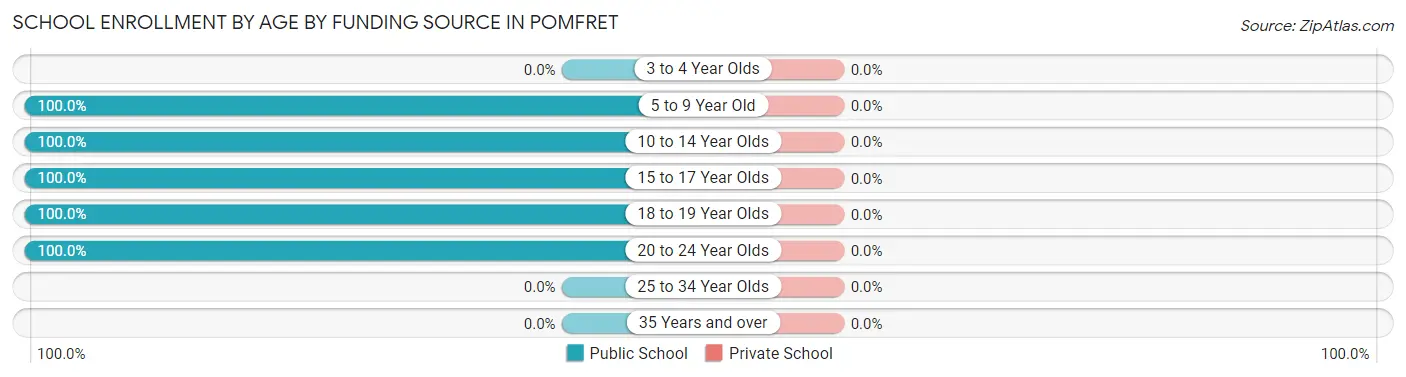
| Age Bracket | Public School | Private School |
| 3 to 4 Year Olds | 0 (0.0%) | 0 (0.0%) |
| 5 to 9 Year Old | 55 (100.0%) | 0 (0.0%) |
| 10 to 14 Year Olds | 27 (100.0%) | 0 (0.0%) |
| 15 to 17 Year Olds | 23 (100.0%) | 0 (0.0%) |
| 18 to 19 Year Olds | 27 (100.0%) | 0 (0.0%) |
| 20 to 24 Year Olds | 27 (100.0%) | 0 (0.0%) |
| 25 to 34 Year Olds | 0 (0.0%) | 0 (0.0%) |
| 35 Years and over | 0 (0.0%) | 0 (0.0%) |
| Total | 159 (100.0%) | 0 (0.0%) |
Educational Attainment by Field of Study in Pomfret
Liberal arts & history (92 | 31.2%), education (63 | 21.4%), business (52 | 17.6%), visual & performing arts (46 | 15.6%), and science & technology (29 | 9.8%) are the most common fields of study among 295 individuals in Pomfret who have obtained a bachelor's degree or higher.
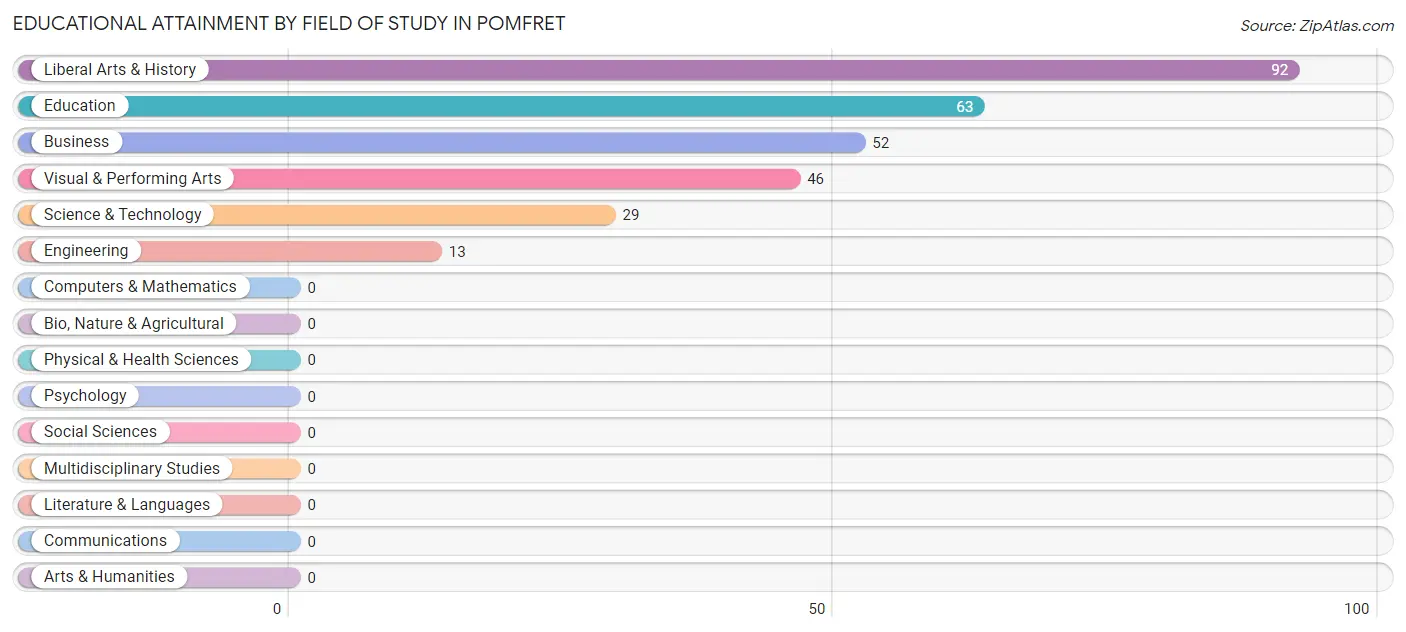
| Field of Study | # Graduates | % Graduates |
| Computers & Mathematics | 0 | 0.0% |
| Bio, Nature & Agricultural | 0 | 0.0% |
| Physical & Health Sciences | 0 | 0.0% |
| Psychology | 0 | 0.0% |
| Social Sciences | 0 | 0.0% |
| Engineering | 13 | 4.4% |
| Multidisciplinary Studies | 0 | 0.0% |
| Science & Technology | 29 | 9.8% |
| Business | 52 | 17.6% |
| Education | 63 | 21.4% |
| Literature & Languages | 0 | 0.0% |
| Liberal Arts & History | 92 | 31.2% |
| Visual & Performing Arts | 46 | 15.6% |
| Communications | 0 | 0.0% |
| Arts & Humanities | 0 | 0.0% |
| Total | 295 | 100.0% |
Transportation & Commute in Pomfret
Vehicle Availability by Sex in Pomfret
The most prevalent vehicle ownership categories in Pomfret are males with 5 or more vehicles (100, accounting for 56.5%) and females with 5 or more vehicles (83, making up 57.8%).
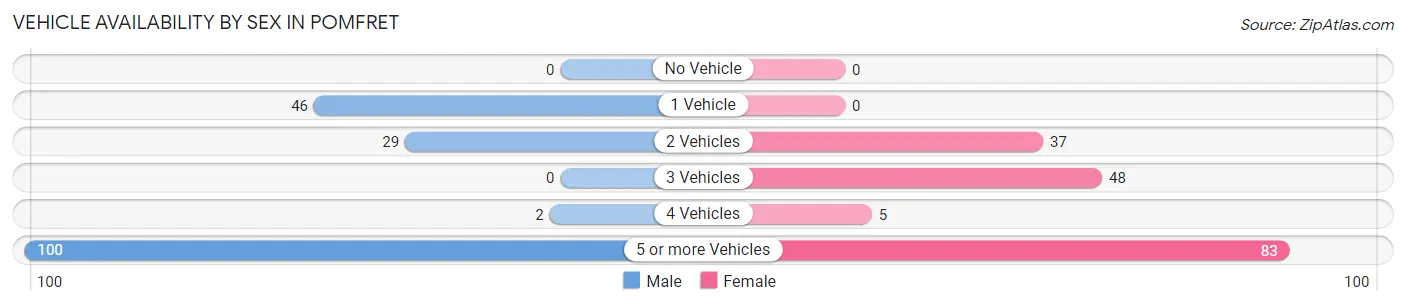
| Vehicles Available | Male | Female |
| No Vehicle | 0 (0.0%) | 0 (0.0%) |
| 1 Vehicle | 46 (26.0%) | 0 (0.0%) |
| 2 Vehicles | 29 (16.4%) | 37 (21.4%) |
| 3 Vehicles | 0 (0.0%) | 48 (27.8%) |
| 4 Vehicles | 2 (1.1%) | 5 (2.9%) |
| 5 or more Vehicles | 100 (56.5%) | 83 (48.0%) |
| Total | 177 (100.0%) | 173 (100.0%) |
Commute Time in Pomfret
The most frequently occuring commute durations in Pomfret are 15 to 19 minutes (155 commuters, 44.3%), 45 to 59 minutes (98 commuters, 28.0%), and 25 to 29 minutes (36 commuters, 10.3%).
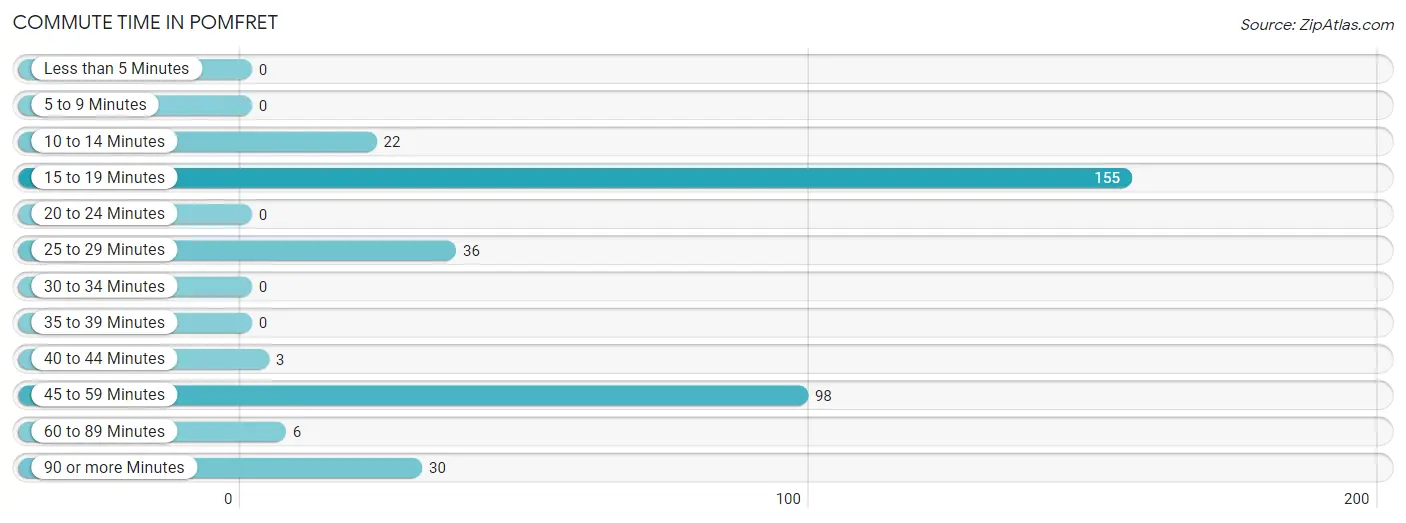
| Commute Time | # Commuters | % Commuters |
| Less than 5 Minutes | 0 | 0.0% |
| 5 to 9 Minutes | 0 | 0.0% |
| 10 to 14 Minutes | 22 | 6.3% |
| 15 to 19 Minutes | 155 | 44.3% |
| 20 to 24 Minutes | 0 | 0.0% |
| 25 to 29 Minutes | 36 | 10.3% |
| 30 to 34 Minutes | 0 | 0.0% |
| 35 to 39 Minutes | 0 | 0.0% |
| 40 to 44 Minutes | 3 | 0.9% |
| 45 to 59 Minutes | 98 | 28.0% |
| 60 to 89 Minutes | 6 | 1.7% |
| 90 or more Minutes | 30 | 8.6% |
Commute Time by Sex in Pomfret
The most common commute times in Pomfret are 45 to 59 minutes (95 commuters, 53.7%) for males and 15 to 19 minutes (105 commuters, 60.7%) for females.
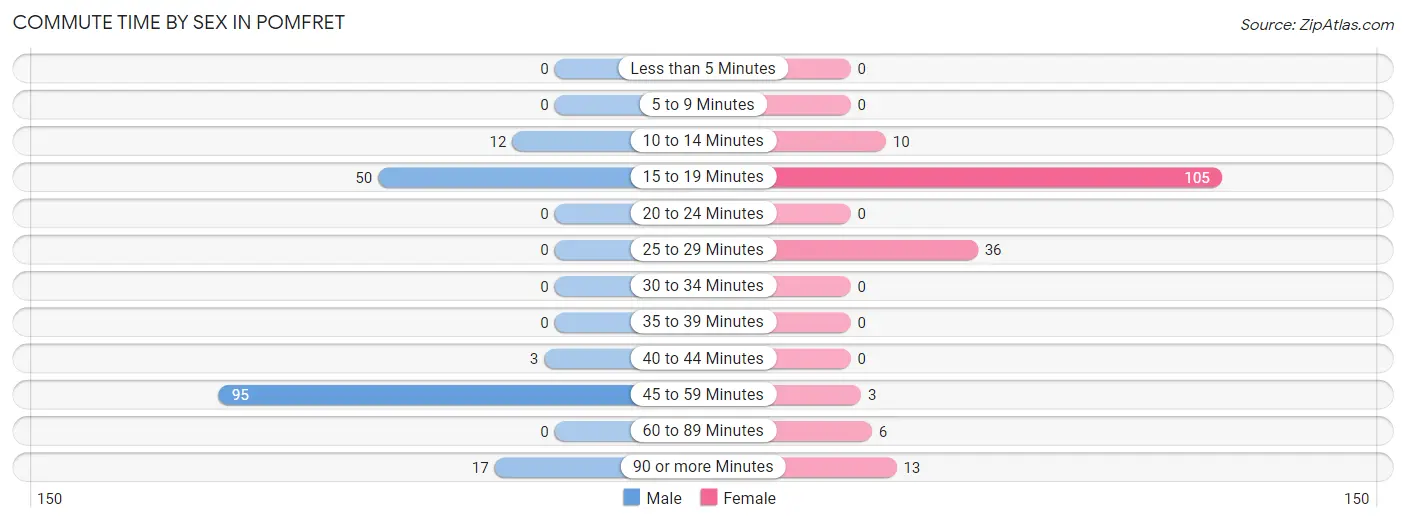
| Commute Time | Male | Female |
| Less than 5 Minutes | 0 (0.0%) | 0 (0.0%) |
| 5 to 9 Minutes | 0 (0.0%) | 0 (0.0%) |
| 10 to 14 Minutes | 12 (6.8%) | 10 (5.8%) |
| 15 to 19 Minutes | 50 (28.2%) | 105 (60.7%) |
| 20 to 24 Minutes | 0 (0.0%) | 0 (0.0%) |
| 25 to 29 Minutes | 0 (0.0%) | 36 (20.8%) |
| 30 to 34 Minutes | 0 (0.0%) | 0 (0.0%) |
| 35 to 39 Minutes | 0 (0.0%) | 0 (0.0%) |
| 40 to 44 Minutes | 3 (1.7%) | 0 (0.0%) |
| 45 to 59 Minutes | 95 (53.7%) | 3 (1.7%) |
| 60 to 89 Minutes | 0 (0.0%) | 6 (3.5%) |
| 90 or more Minutes | 17 (9.6%) | 13 (7.5%) |
Time of Departure to Work by Sex in Pomfret
The most frequent times of departure to work in Pomfret are 5:00 AM to 5:29 AM (52, 29.4%) for males and 8:00 AM to 8:29 AM (53, 30.6%) for females.
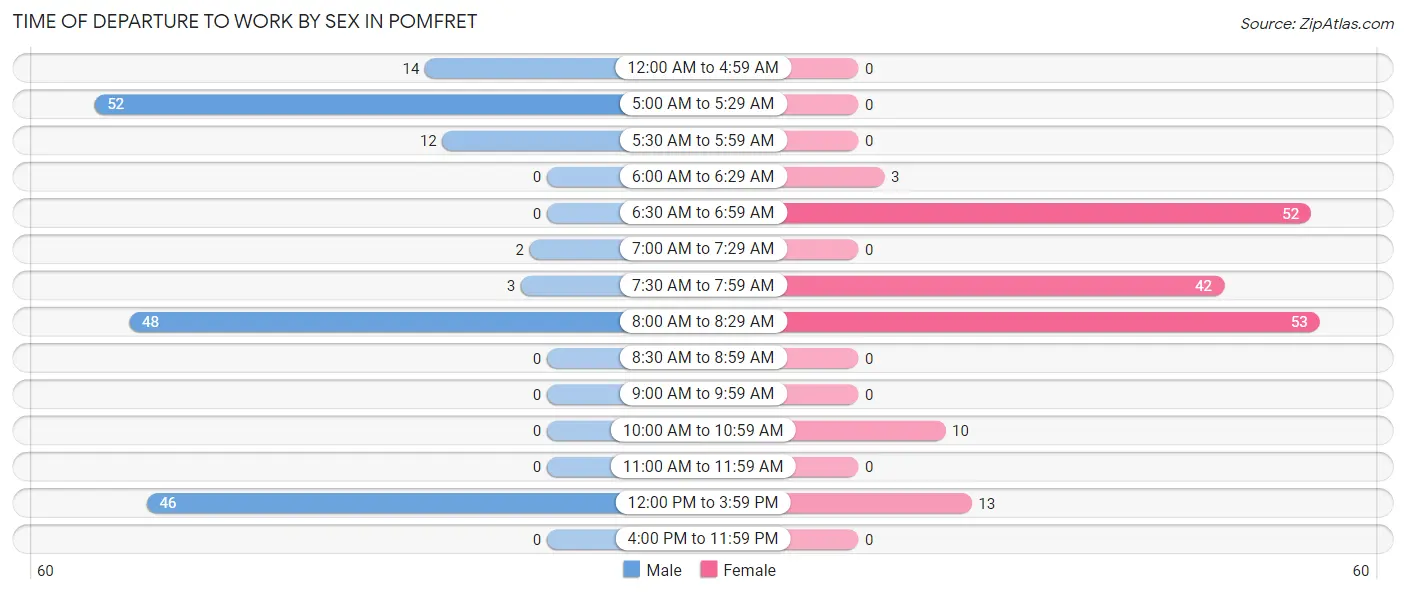
| Time of Departure | Male | Female |
| 12:00 AM to 4:59 AM | 14 (7.9%) | 0 (0.0%) |
| 5:00 AM to 5:29 AM | 52 (29.4%) | 0 (0.0%) |
| 5:30 AM to 5:59 AM | 12 (6.8%) | 0 (0.0%) |
| 6:00 AM to 6:29 AM | 0 (0.0%) | 3 (1.7%) |
| 6:30 AM to 6:59 AM | 0 (0.0%) | 52 (30.1%) |
| 7:00 AM to 7:29 AM | 2 (1.1%) | 0 (0.0%) |
| 7:30 AM to 7:59 AM | 3 (1.7%) | 42 (24.3%) |
| 8:00 AM to 8:29 AM | 48 (27.1%) | 53 (30.6%) |
| 8:30 AM to 8:59 AM | 0 (0.0%) | 0 (0.0%) |
| 9:00 AM to 9:59 AM | 0 (0.0%) | 0 (0.0%) |
| 10:00 AM to 10:59 AM | 0 (0.0%) | 10 (5.8%) |
| 11:00 AM to 11:59 AM | 0 (0.0%) | 0 (0.0%) |
| 12:00 PM to 3:59 PM | 46 (26.0%) | 13 (7.5%) |
| 4:00 PM to 11:59 PM | 0 (0.0%) | 0 (0.0%) |
| Total | 177 (100.0%) | 173 (100.0%) |
Housing Occupancy in Pomfret
Occupancy by Ownership in Pomfret
Of the total 228 dwellings in Pomfret, owner-occupied units account for 210 (92.1%), while renter-occupied units make up 18 (7.9%).
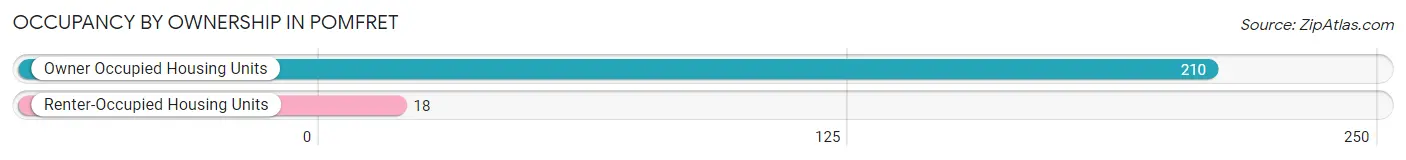
| Occupancy | # Housing Units | % Housing Units |
| Owner Occupied Housing Units | 210 | 92.1% |
| Renter-Occupied Housing Units | 18 | 7.9% |
| Total Occupied Housing Units | 228 | 100.0% |
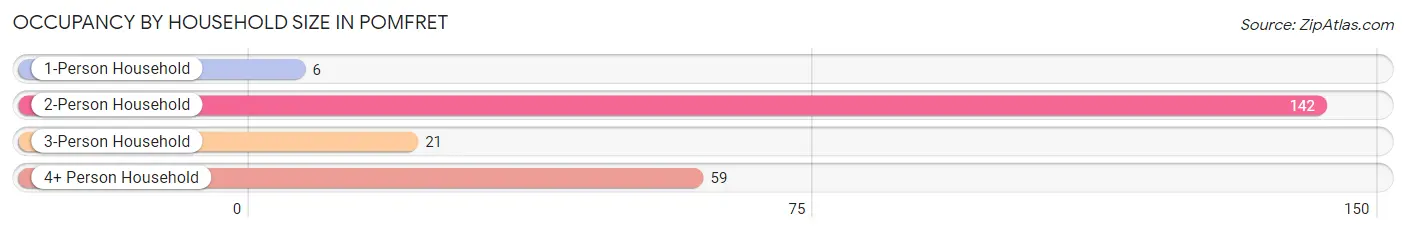
Occupancy by Household Size in Pomfret
| Household Size | # Housing Units | % Housing Units |
| 1-Person Household | 6 | 2.6% |
| 2-Person Household | 142 | 62.3% |
| 3-Person Household | 21 | 9.2% |
| 4+ Person Household | 59 | 25.9% |
| Total Housing Units | 228 | 100.0% |
Occupancy by Ownership by Household Size in Pomfret
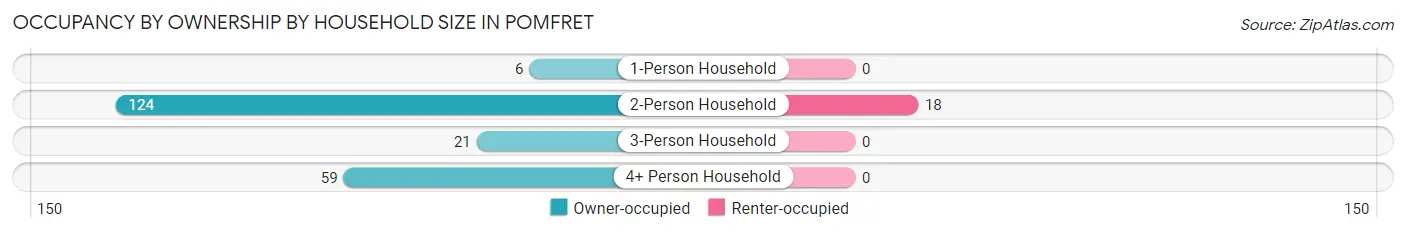
| Household Size | Owner-occupied | Renter-occupied |
| 1-Person Household | 6 (100.0%) | 0 (0.0%) |
| 2-Person Household | 124 (87.3%) | 18 (12.7%) |
| 3-Person Household | 21 (100.0%) | 0 (0.0%) |
| 4+ Person Household | 59 (100.0%) | 0 (0.0%) |
| Total Housing Units | 210 (92.1%) | 18 (7.9%) |
Occupancy by Educational Attainment in Pomfret
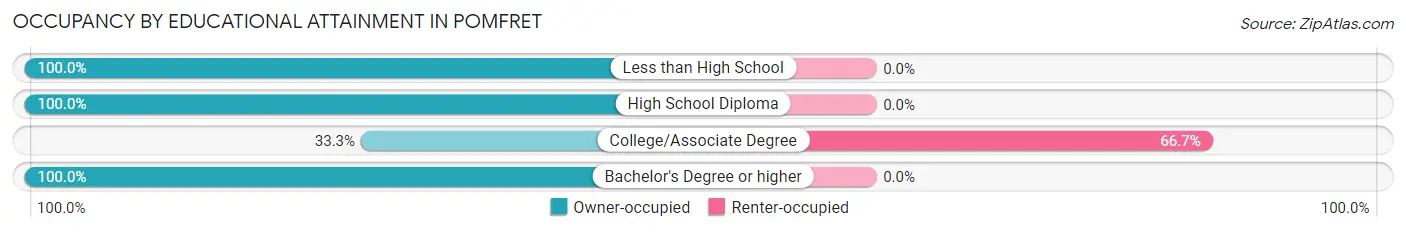
| Household Size | Owner-occupied | Renter-occupied |
| Less than High School | 62 (100.0%) | 0 (0.0%) |
| High School Diploma | 31 (100.0%) | 0 (0.0%) |
| College/Associate Degree | 9 (33.3%) | 18 (66.7%) |
| Bachelor's Degree or higher | 108 (100.0%) | 0 (0.0%) |
Occupancy by Age of Householder in Pomfret
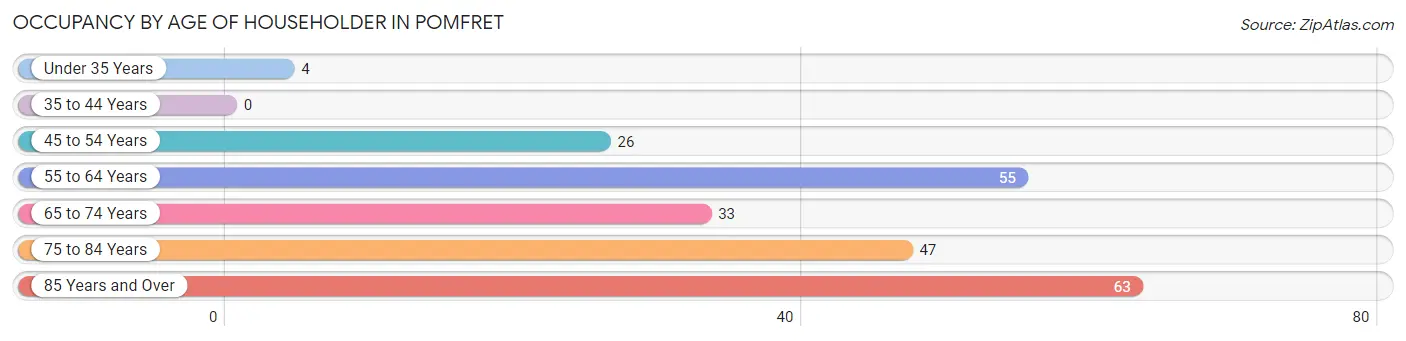
| Age Bracket | # Households | % Households |
| Under 35 Years | 4 | 1.8% |
| 35 to 44 Years | 0 | 0.0% |
| 45 to 54 Years | 26 | 11.4% |
| 55 to 64 Years | 55 | 24.1% |
| 65 to 74 Years | 33 | 14.5% |
| 75 to 84 Years | 47 | 20.6% |
| 85 Years and Over | 63 | 27.6% |
| Total | 228 | 100.0% |
Housing Finances in Pomfret
Median Income by Occupancy in Pomfret
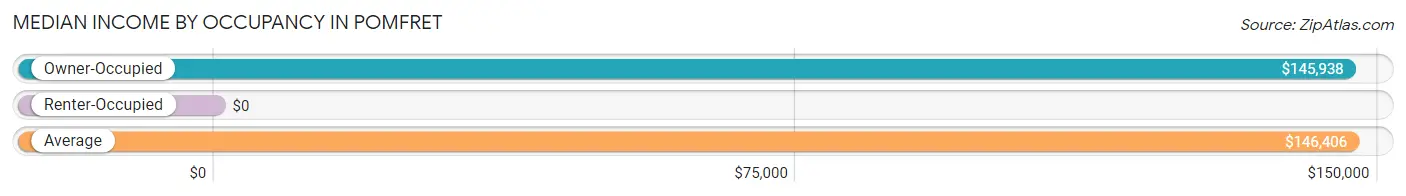
| Occupancy Type | # Households | Median Income |
| Owner-Occupied | 210 (92.1%) | $145,938 |
| Renter-Occupied | 18 (7.9%) | $0 |
| Average | 228 (100.0%) | $146,406 |
Occupancy by Householder Income Bracket in Pomfret
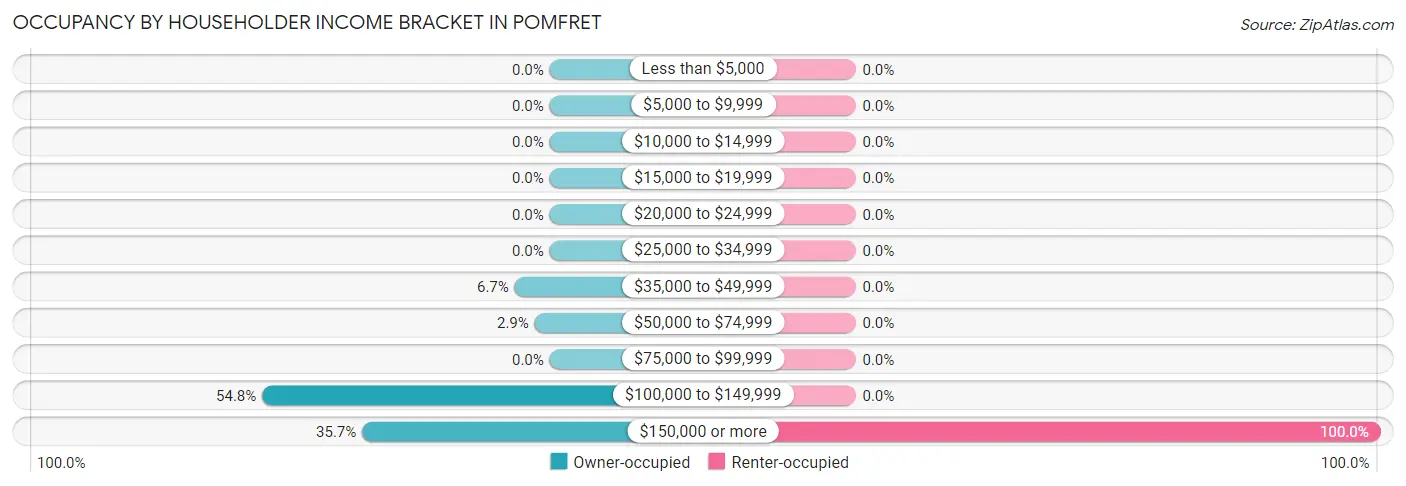
| Income Bracket | Owner-occupied | Renter-occupied |
| Less than $5,000 | 0 (0.0%) | 0 (0.0%) |
| $5,000 to $9,999 | 0 (0.0%) | 0 (0.0%) |
| $10,000 to $14,999 | 0 (0.0%) | 0 (0.0%) |
| $15,000 to $19,999 | 0 (0.0%) | 0 (0.0%) |
| $20,000 to $24,999 | 0 (0.0%) | 0 (0.0%) |
| $25,000 to $34,999 | 0 (0.0%) | 0 (0.0%) |
| $35,000 to $49,999 | 14 (6.7%) | 0 (0.0%) |
| $50,000 to $74,999 | 6 (2.9%) | 0 (0.0%) |
| $75,000 to $99,999 | 0 (0.0%) | 0 (0.0%) |
| $100,000 to $149,999 | 115 (54.8%) | 0 (0.0%) |
| $150,000 or more | 75 (35.7%) | 18 (100.0%) |
| Total | 210 (100.0%) | 18 (100.0%) |
Monthly Housing Cost Tiers in Pomfret
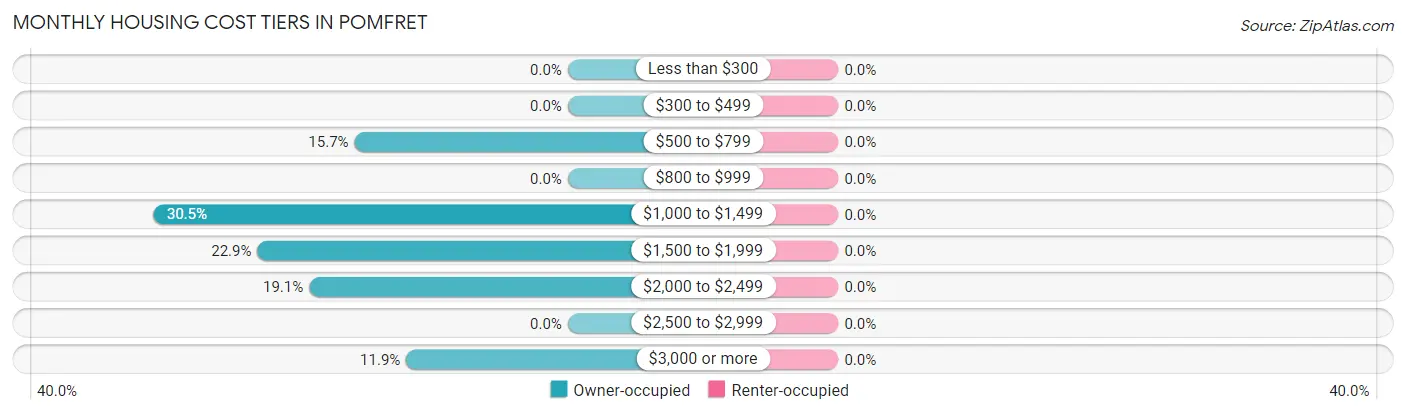
| Monthly Cost | Owner-occupied | Renter-occupied |
| Less than $300 | 0 (0.0%) | 0 (0.0%) |
| $300 to $499 | 0 (0.0%) | 0 (0.0%) |
| $500 to $799 | 33 (15.7%) | 0 (0.0%) |
| $800 to $999 | 0 (0.0%) | 0 (0.0%) |
| $1,000 to $1,499 | 64 (30.5%) | 0 (0.0%) |
| $1,500 to $1,999 | 48 (22.9%) | 0 (0.0%) |
| $2,000 to $2,499 | 40 (19.1%) | 0 (0.0%) |
| $2,500 to $2,999 | 0 (0.0%) | 0 (0.0%) |
| $3,000 or more | 25 (11.9%) | 0 (0.0%) |
| Total | 210 (100.0%) | 18 (100.0%) |
Physical Housing Characteristics in Pomfret
Housing Structures in Pomfret
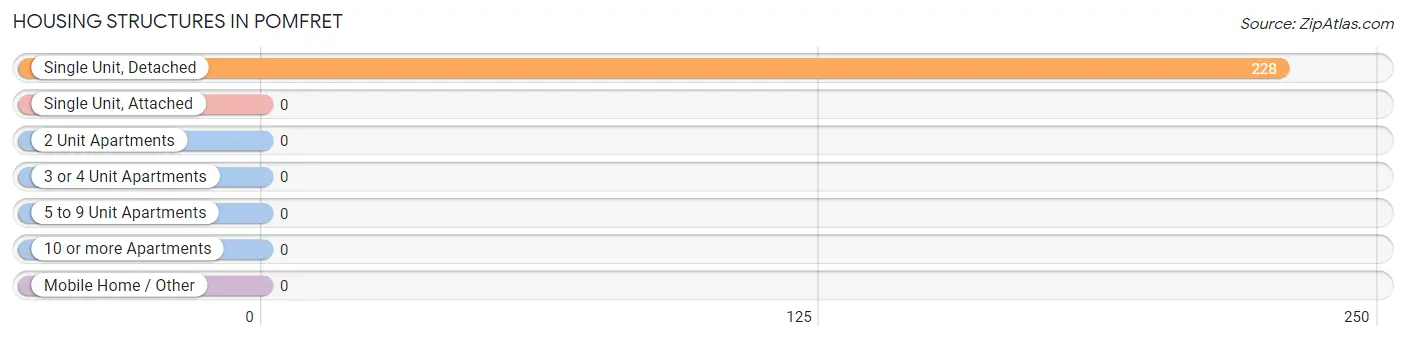
| Structure Type | # Housing Units | % Housing Units |
| Single Unit, Detached | 228 | 100.0% |
| Single Unit, Attached | 0 | 0.0% |
| 2 Unit Apartments | 0 | 0.0% |
| 3 or 4 Unit Apartments | 0 | 0.0% |
| 5 to 9 Unit Apartments | 0 | 0.0% |
| 10 or more Apartments | 0 | 0.0% |
| Mobile Home / Other | 0 | 0.0% |
| Total | 228 | 100.0% |
Housing Structures by Occupancy in Pomfret
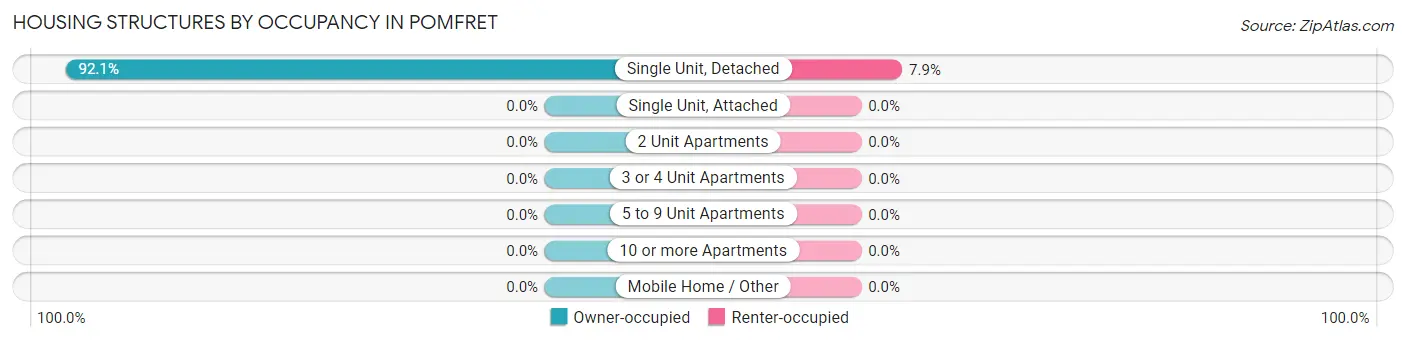
| Structure Type | Owner-occupied | Renter-occupied |
| Single Unit, Detached | 210 (92.1%) | 18 (7.9%) |
| Single Unit, Attached | 0 (0.0%) | 0 (0.0%) |
| 2 Unit Apartments | 0 (0.0%) | 0 (0.0%) |
| 3 or 4 Unit Apartments | 0 (0.0%) | 0 (0.0%) |
| 5 to 9 Unit Apartments | 0 (0.0%) | 0 (0.0%) |
| 10 or more Apartments | 0 (0.0%) | 0 (0.0%) |
| Mobile Home / Other | 0 (0.0%) | 0 (0.0%) |
| Total | 210 (92.1%) | 18 (7.9%) |
Housing Structures by Number of Rooms in Pomfret
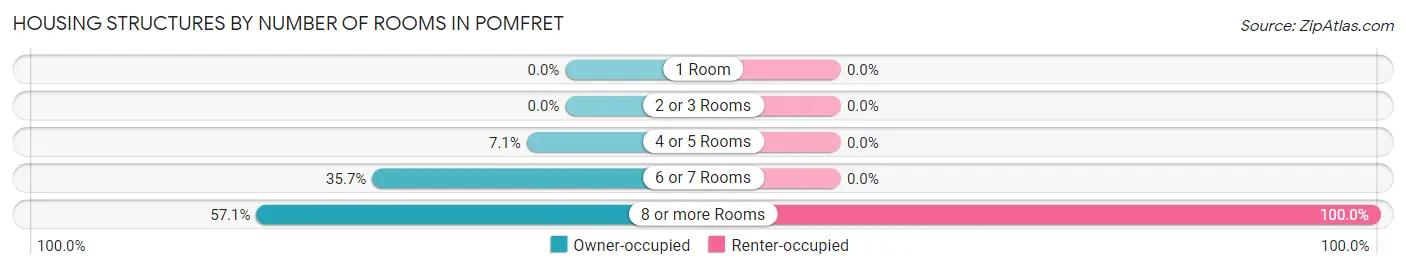
| Number of Rooms | Owner-occupied | Renter-occupied |
| 1 Room | 0 (0.0%) | 0 (0.0%) |
| 2 or 3 Rooms | 0 (0.0%) | 0 (0.0%) |
| 4 or 5 Rooms | 15 (7.1%) | 0 (0.0%) |
| 6 or 7 Rooms | 75 (35.7%) | 0 (0.0%) |
| 8 or more Rooms | 120 (57.1%) | 18 (100.0%) |
| Total | 210 (100.0%) | 18 (100.0%) |
Housing Structure by Heating Type in Pomfret
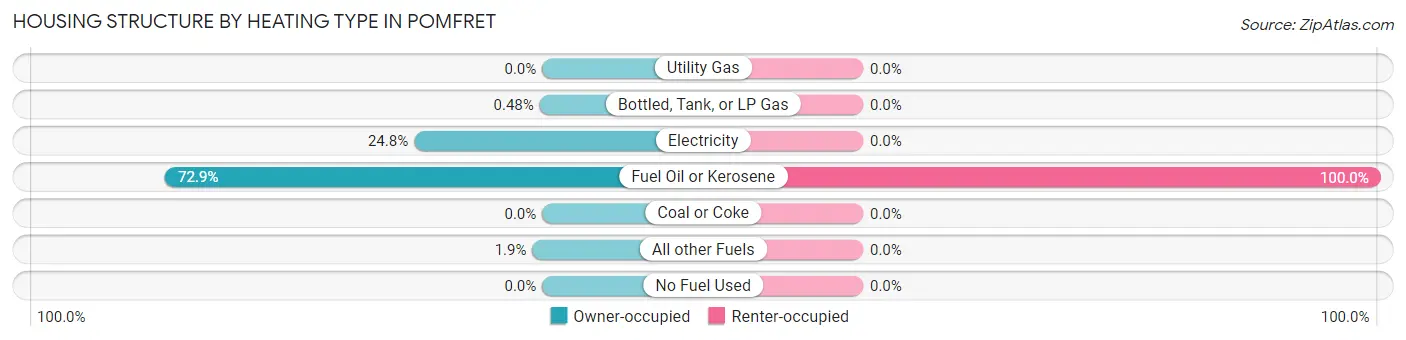
| Heating Type | Owner-occupied | Renter-occupied |
| Utility Gas | 0 (0.0%) | 0 (0.0%) |
| Bottled, Tank, or LP Gas | 1 (0.5%) | 0 (0.0%) |
| Electricity | 52 (24.8%) | 0 (0.0%) |
| Fuel Oil or Kerosene | 153 (72.9%) | 18 (100.0%) |
| Coal or Coke | 0 (0.0%) | 0 (0.0%) |
| All other Fuels | 4 (1.9%) | 0 (0.0%) |
| No Fuel Used | 0 (0.0%) | 0 (0.0%) |
| Total | 210 (100.0%) | 18 (100.0%) |
Household Vehicle Usage in Pomfret
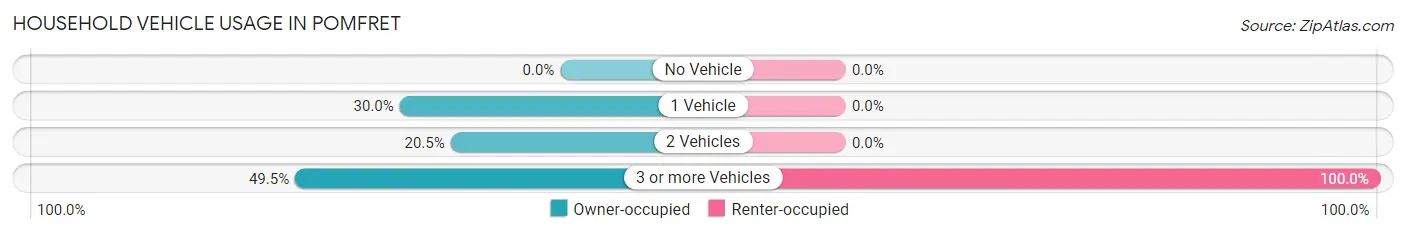
| Vehicles per Household | Owner-occupied | Renter-occupied |
| No Vehicle | 0 (0.0%) | 0 (0.0%) |
| 1 Vehicle | 63 (30.0%) | 0 (0.0%) |
| 2 Vehicles | 43 (20.5%) | 0 (0.0%) |
| 3 or more Vehicles | 104 (49.5%) | 18 (100.0%) |
| Total | 210 (100.0%) | 18 (100.0%) |
Real Estate & Mortgages in Pomfret
Real Estate and Mortgage Overview in Pomfret
| Characteristic | Without Mortgage | With Mortgage |
| Housing Units | 5 | 205 |
| Median Property Value | - | - |
| Median Household Income | - | - |
| Monthly Housing Costs | - | - |
| Real Estate Taxes | - | - |
Property Value by Mortgage Status in Pomfret
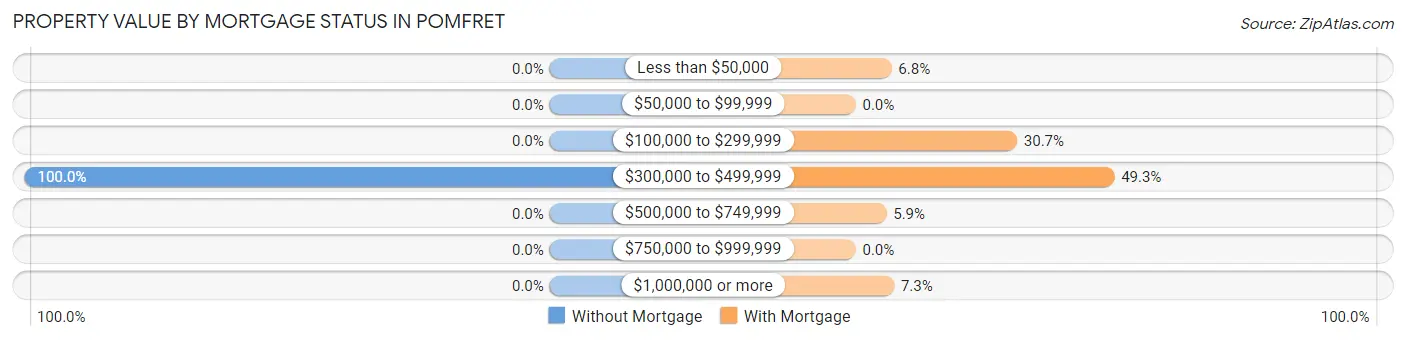
| Property Value | Without Mortgage | With Mortgage |
| Less than $50,000 | 0 (0.0%) | 14 (6.8%) |
| $50,000 to $99,999 | 0 (0.0%) | 0 (0.0%) |
| $100,000 to $299,999 | 0 (0.0%) | 63 (30.7%) |
| $300,000 to $499,999 | 5 (100.0%) | 101 (49.3%) |
| $500,000 to $749,999 | 0 (0.0%) | 12 (5.9%) |
| $750,000 to $999,999 | 0 (0.0%) | 0 (0.0%) |
| $1,000,000 or more | 0 (0.0%) | 15 (7.3%) |
| Total | 5 (100.0%) | 205 (100.0%) |
Household Income by Mortgage Status in Pomfret
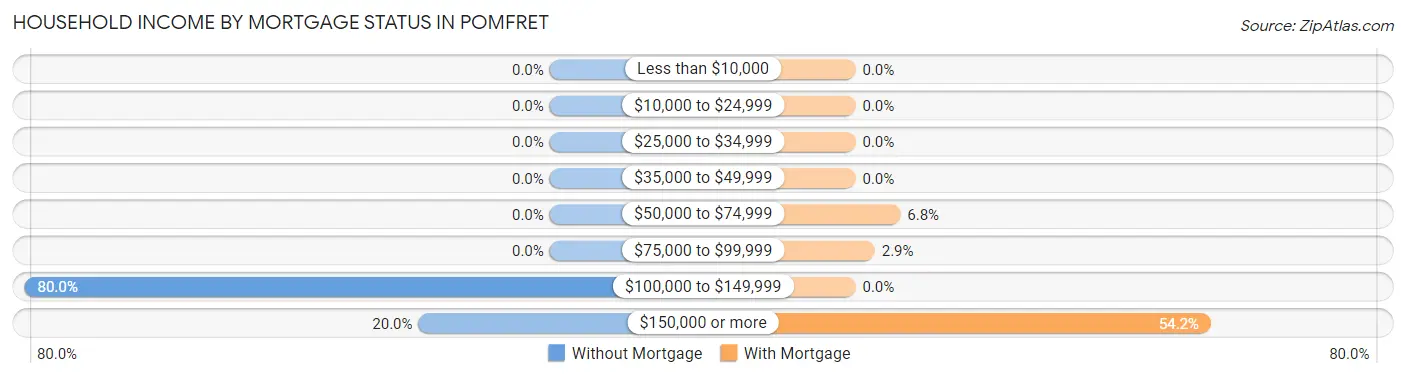
| Household Income | Without Mortgage | With Mortgage |
| Less than $10,000 | 0 (0.0%) | 0 (0.0%) |
| $10,000 to $24,999 | 0 (0.0%) | 0 (0.0%) |
| $25,000 to $34,999 | 0 (0.0%) | 0 (0.0%) |
| $35,000 to $49,999 | 0 (0.0%) | 0 (0.0%) |
| $50,000 to $74,999 | 0 (0.0%) | 14 (6.8%) |
| $75,000 to $99,999 | 0 (0.0%) | 6 (2.9%) |
| $100,000 to $149,999 | 4 (80.0%) | 0 (0.0%) |
| $150,000 or more | 1 (20.0%) | 111 (54.1%) |
| Total | 5 (100.0%) | 205 (100.0%) |
Property Value to Household Income Ratio in Pomfret
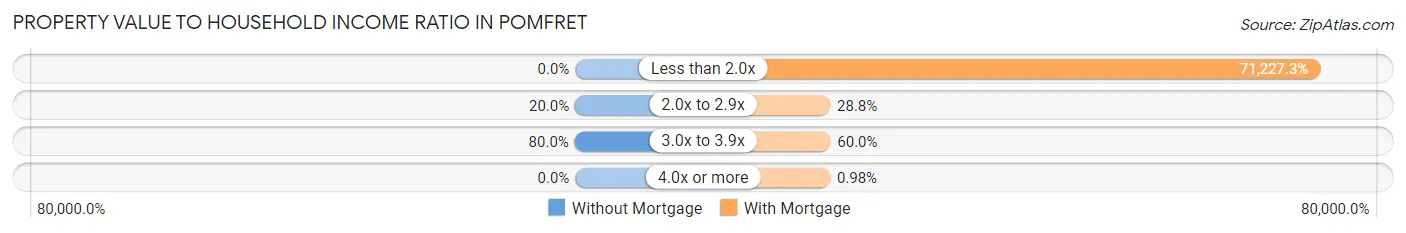
| Value-to-Income Ratio | Without Mortgage | With Mortgage |
| Less than 2.0x | 0 (0.0%) | 146,016 (71,227.3%) |
| 2.0x to 2.9x | 1 (20.0%) | 59 (28.8%) |
| 3.0x to 3.9x | 4 (80.0%) | 123 (60.0%) |
| 4.0x or more | 0 (0.0%) | 2 (1.0%) |
| Total | 5 (100.0%) | 205 (100.0%) |
Real Estate Taxes by Mortgage Status in Pomfret
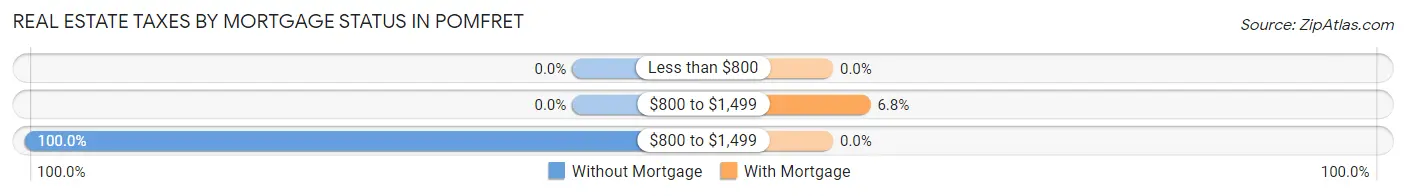
| Property Taxes | Without Mortgage | With Mortgage |
| Less than $800 | 0 (0.0%) | 0 (0.0%) |
| $800 to $1,499 | 0 (0.0%) | 14 (6.8%) |
| $800 to $1,499 | 5 (100.0%) | 0 (0.0%) |
| Total | 5 (100.0%) | 205 (100.0%) |
Health & Disability in Pomfret
Health Insurance Coverage by Age in Pomfret
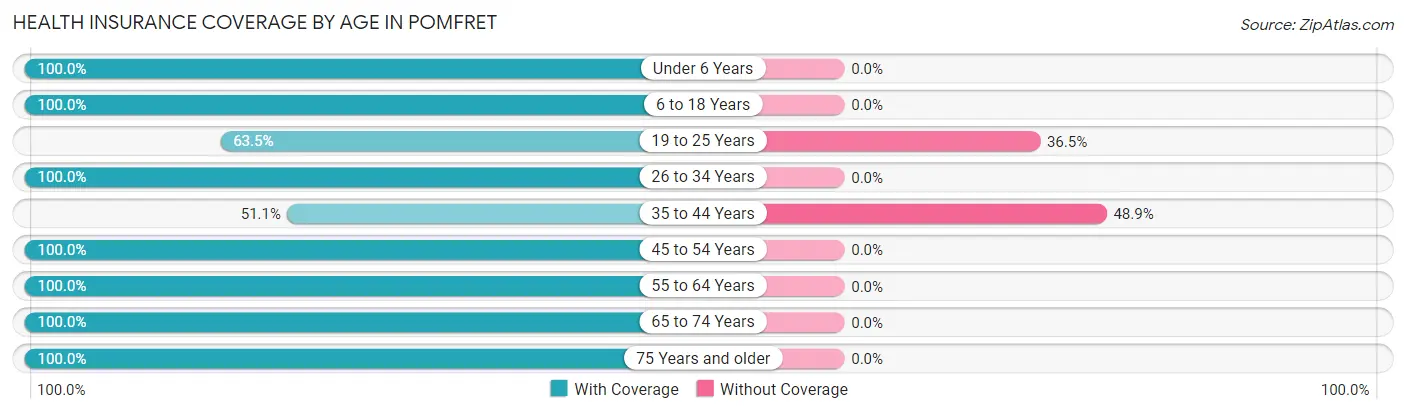
| Age Bracket | With Coverage | Without Coverage |
| Under 6 Years | 15 (100.0%) | 0 (0.0%) |
| 6 to 18 Years | 90 (100.0%) | 0 (0.0%) |
| 19 to 25 Years | 94 (63.5%) | 54 (36.5%) |
| 26 to 34 Years | 8 (100.0%) | 0 (0.0%) |
| 35 to 44 Years | 23 (51.1%) | 22 (48.9%) |
| 45 to 54 Years | 98 (100.0%) | 0 (0.0%) |
| 55 to 64 Years | 151 (100.0%) | 0 (0.0%) |
| 65 to 74 Years | 68 (100.0%) | 0 (0.0%) |
| 75 Years and older | 139 (100.0%) | 0 (0.0%) |
| Total | 686 (90.0%) | 76 (10.0%) |
Health Insurance Coverage by Citizenship Status in Pomfret

| Citizenship Status | With Coverage | Without Coverage |
| Native Born | 15 (100.0%) | 0 (0.0%) |
| Foreign Born, Citizen | 90 (100.0%) | 0 (0.0%) |
| Foreign Born, not a Citizen | 94 (63.5%) | 54 (36.5%) |
Health Insurance Coverage by Household Income in Pomfret

| Household Income | With Coverage | Without Coverage |
| Under $25,000 | 0 (0.0%) | 0 (0.0%) |
| $25,000 to $49,999 | 43 (36.1%) | 76 (63.9%) |
| $50,000 to $74,999 | 6 (100.0%) | 0 (0.0%) |
| $75,000 to $99,999 | 0 (0.0%) | 0 (0.0%) |
| $100,000 and over | 637 (100.0%) | 0 (0.0%) |
Public vs Private Health Insurance Coverage by Age in Pomfret
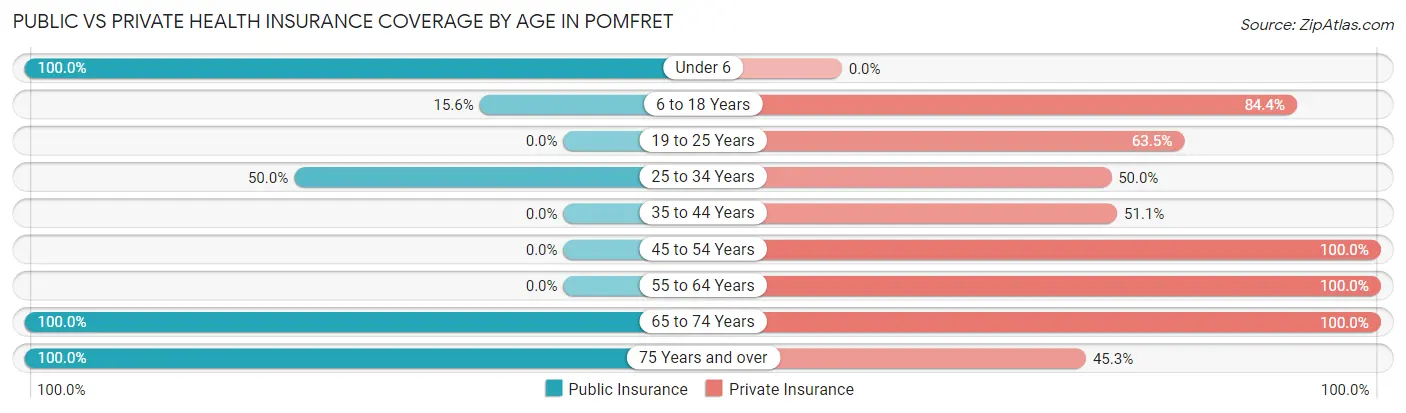
| Age Bracket | Public Insurance | Private Insurance |
| Under 6 | 15 (100.0%) | 0 (0.0%) |
| 6 to 18 Years | 14 (15.6%) | 76 (84.4%) |
| 19 to 25 Years | 0 (0.0%) | 94 (63.5%) |
| 25 to 34 Years | 4 (50.0%) | 4 (50.0%) |
| 35 to 44 Years | 0 (0.0%) | 23 (51.1%) |
| 45 to 54 Years | 0 (0.0%) | 98 (100.0%) |
| 55 to 64 Years | 0 (0.0%) | 151 (100.0%) |
| 65 to 74 Years | 68 (100.0%) | 68 (100.0%) |
| 75 Years and over | 139 (100.0%) | 63 (45.3%) |
| Total | 240 (31.5%) | 577 (75.7%) |
Disability Status by Sex by Age in Pomfret
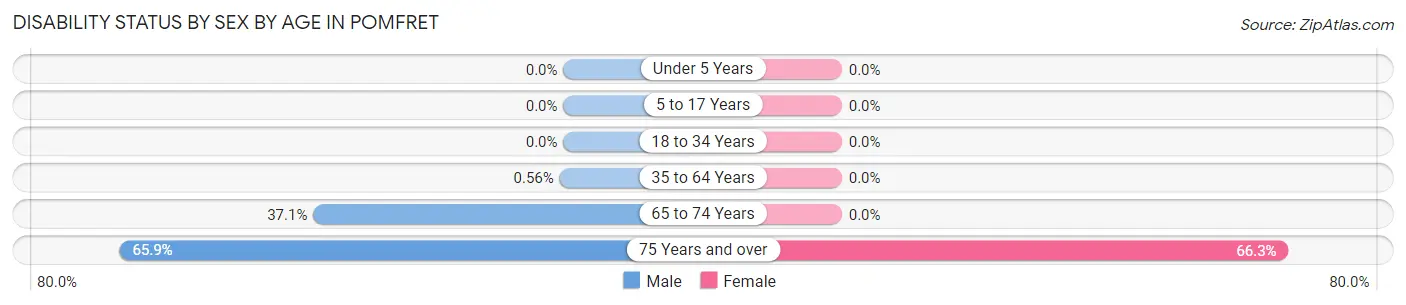
| Age Bracket | Male | Female |
| Under 5 Years | 0 (0.0%) | 0 (0.0%) |
| 5 to 17 Years | 0 (0.0%) | 0 (0.0%) |
| 18 to 34 Years | 0 (0.0%) | 0 (0.0%) |
| 35 to 64 Years | 1 (0.6%) | 0 (0.0%) |
| 65 to 74 Years | 13 (37.1%) | 0 (0.0%) |
| 75 Years and over | 29 (65.9%) | 63 (66.3%) |
Disability Class by Sex by Age in Pomfret
Disability Class: Hearing Difficulty
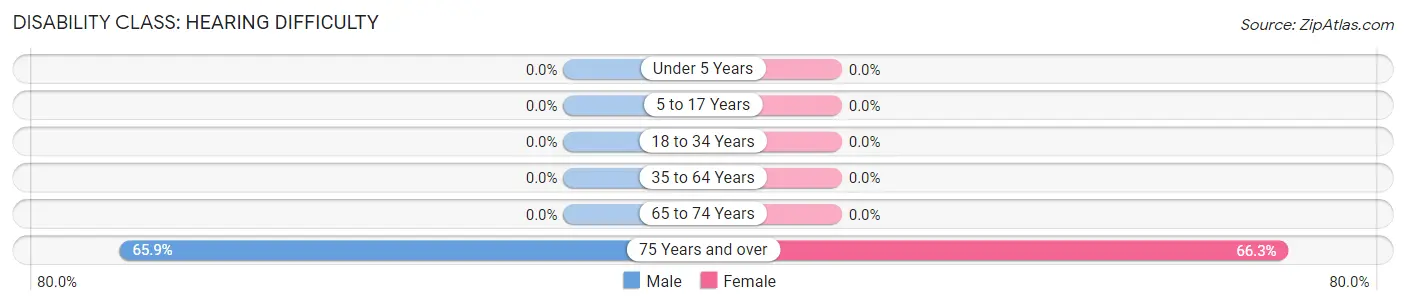
| Age Bracket | Male | Female |
| Under 5 Years | 0 (0.0%) | 0 (0.0%) |
| 5 to 17 Years | 0 (0.0%) | 0 (0.0%) |
| 18 to 34 Years | 0 (0.0%) | 0 (0.0%) |
| 35 to 64 Years | 0 (0.0%) | 0 (0.0%) |
| 65 to 74 Years | 0 (0.0%) | 0 (0.0%) |
| 75 Years and over | 29 (65.9%) | 63 (66.3%) |
Disability Class: Vision Difficulty
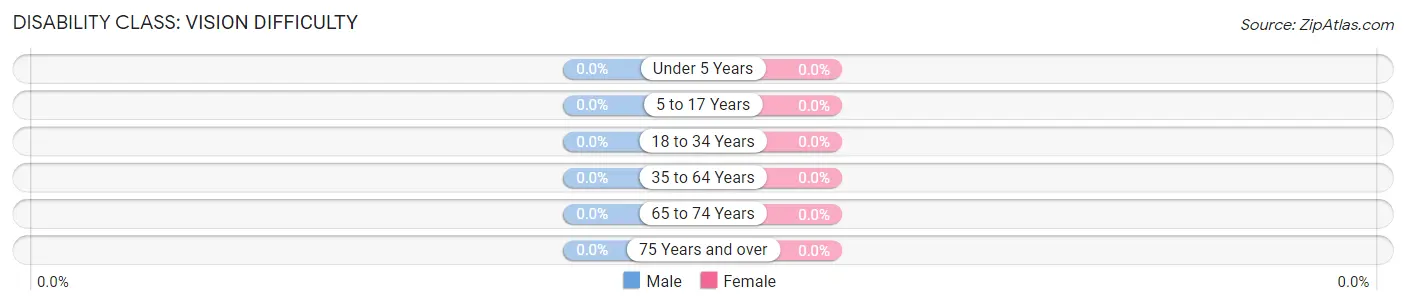
| Age Bracket | Male | Female |
| Under 5 Years | 0 (0.0%) | 0 (0.0%) |
| 5 to 17 Years | 0 (0.0%) | 0 (0.0%) |
| 18 to 34 Years | 0 (0.0%) | 0 (0.0%) |
| 35 to 64 Years | 0 (0.0%) | 0 (0.0%) |
| 65 to 74 Years | 0 (0.0%) | 0 (0.0%) |
| 75 Years and over | 0 (0.0%) | 0 (0.0%) |
Disability Class: Cognitive Difficulty
| Age Bracket | Male | Female |
| 5 to 17 Years | 0 (0.0%) | 0 (0.0%) |
| 18 to 34 Years | 0 (0.0%) | 0 (0.0%) |
| 35 to 64 Years | 0 (0.0%) | 0 (0.0%) |
| 65 to 74 Years | 0 (0.0%) | 0 (0.0%) |
| 75 Years and over | 0 (0.0%) | 0 (0.0%) |
Disability Class: Ambulatory Difficulty
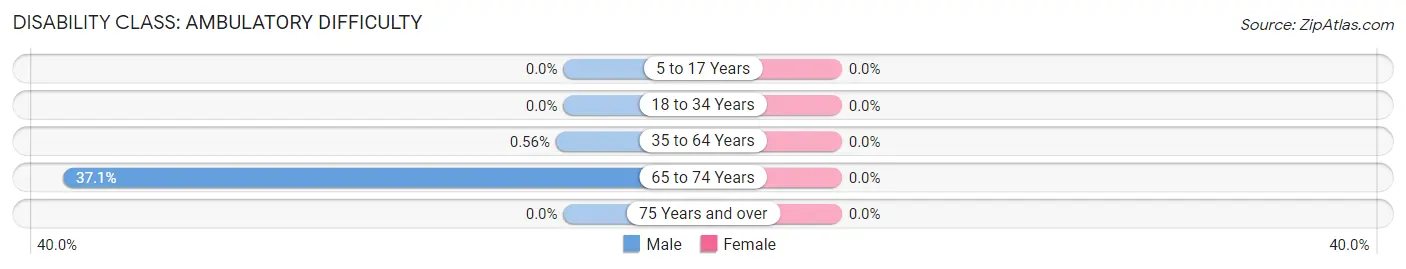
| Age Bracket | Male | Female |
| 5 to 17 Years | 0 (0.0%) | 0 (0.0%) |
| 18 to 34 Years | 0 (0.0%) | 0 (0.0%) |
| 35 to 64 Years | 1 (0.6%) | 0 (0.0%) |
| 65 to 74 Years | 13 (37.1%) | 0 (0.0%) |
| 75 Years and over | 0 (0.0%) | 0 (0.0%) |
Disability Class: Self-Care Difficulty
| Age Bracket | Male | Female |
| 5 to 17 Years | 0 (0.0%) | 0 (0.0%) |
| 18 to 34 Years | 0 (0.0%) | 0 (0.0%) |
| 35 to 64 Years | 0 (0.0%) | 0 (0.0%) |
| 65 to 74 Years | 0 (0.0%) | 0 (0.0%) |
| 75 Years and over | 0 (0.0%) | 0 (0.0%) |
Technology Access in Pomfret
Computing Device Access in Pomfret
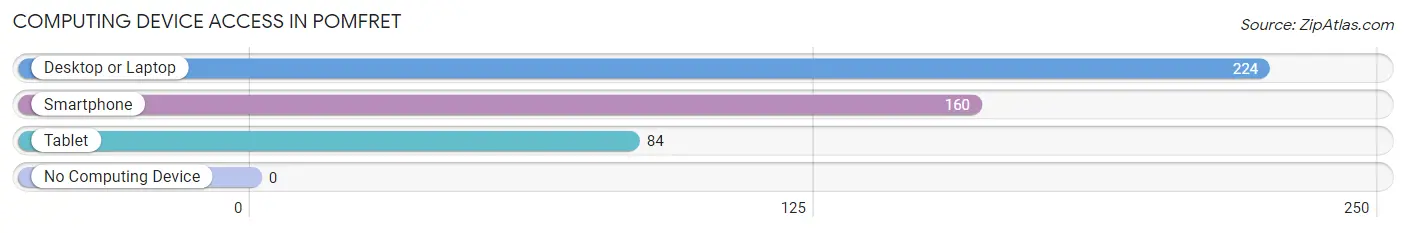
| Device Type | # Households | % Households |
| Desktop or Laptop | 224 | 98.3% |
| Smartphone | 160 | 70.2% |
| Tablet | 84 | 36.8% |
| No Computing Device | 0 | 0.0% |
| Total | 228 | 100.0% |
Internet Access in Pomfret
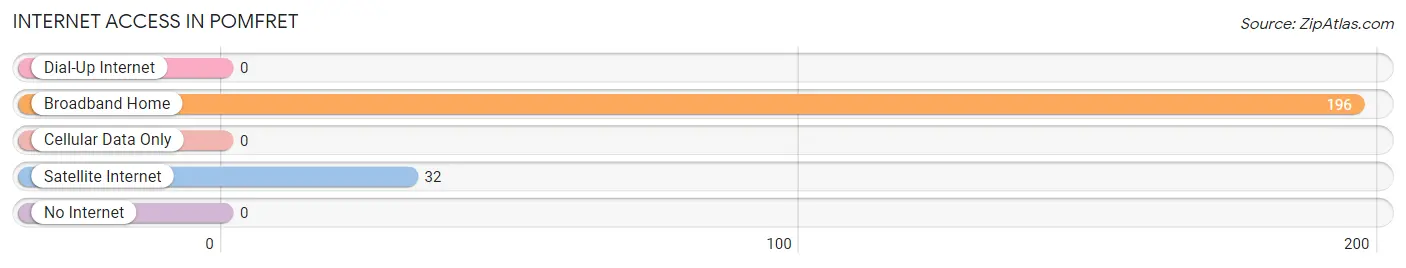
| Internet Type | # Households | % Households |
| Dial-Up Internet | 0 | 0.0% |
| Broadband Home | 196 | 86.0% |
| Cellular Data Only | 0 | 0.0% |
| Satellite Internet | 32 | 14.0% |
| No Internet | 0 | 0.0% |
| Total | 228 | 100.0% |
Pomfret Summary
Pomfret is a small town located in Charles County, Maryland, United States. It is situated on the Potomac River, about 25 miles south of Washington, D.C. The town was founded in 1706 and is one of the oldest towns in Maryland. The population of Pomfret was 2,945 at the 2000 census.
History
Pomfret was founded in 1706 by a group of English settlers led by Thomas Addison. The town was named after the English town of Pomfret, which is located in the county of Norfolk. The settlers were attracted to the area by its fertile soil and abundant natural resources. The town was originally part of Charles County, but in 1748 it was annexed to Prince George's County. In 1878, Pomfret was re-annexed to Charles County.
The town was an important port during the colonial period, and it was a major center for the tobacco trade. During the American Revolution, Pomfret was a major supply center for the Continental Army. After the war, the town continued to be an important port and trading center.
Geography
Pomfret is located at 38°35'45" North, 77°2'45" West (38.595833, -77.045556). The town is situated on the Potomac River, about 25 miles south of Washington, D.C. The town has a total area of 1.2 square miles, all of which is land.
Economy
Pomfret's economy is largely based on agriculture and tourism. The town is home to several farms, which produce a variety of crops, including corn, soybeans, wheat, and hay. The town also has several wineries and vineyards, which produce a variety of wines.
Tourism is an important part of the local economy. The town is home to several historic sites, including the Addison House, the Pomfret Manor House, and the Pomfret Historic District. The town also has several parks and recreational areas, including the Pomfret Nature Center and the Pomfret Wildlife Management Area.
Demographics
As of the 2000 census, there were 2,945 people, 1,093 households, and 790 families residing in the town. The population density was 2,457.2 people per square mile (948.3/km2). There were 1,164 housing units at an average density of 972.2 per square mile (374.7/km2). The racial makeup of the town was 79.2% White, 15.2% African American, 0.3% Native American, 0.7% Asian, 0.1% Pacific Islander, 2.2% from other races, and 2.3% from two or more races. Hispanic or Latino of any race were 4.2% of the population.
There were 1,093 households, out of which 33.2% had children under the age of 18 living with them, 54.2% were married couples living together, 12.2% had a female householder with no husband present, and 28.7% were non-families. 22.7% of all households were made up of individuals, and 8.2% had someone living alone who was 65 years of age or older. The average household size was 2.68 and the average family size was 3.14.
In the town, the population was spread out, with 25.7% under the age of 18, 7.2% from 18 to 24, 30.2% from 25 to 44, 24.2% from 45 to 64, and 12.7% who were 65 years of age or older. The median age was 37 years. For every 100 females, there were 97.2 males. For every 100 females age 18 and over, there were 94.2 males.
The median income for a household in the town was $50,938, and the median income for a family was $58,750. Males had a median income of $41,250 versus $30,000 for females. The per capita income for the town was $21,945. About 4.2% of families and 6.2% of the population were below the poverty line, including 8.2% of those under age 18 and 5.2% of those age 65 or over.
Common Questions
What is Per Capita Income in Pomfret?
Per Capita income in Pomfret is $54,178.
What is the Median Household income in Pomfret?
Median Household Income in Pomfret is $146,406.
What is Income or Wage Gap in Pomfret?
Income or Wage Gap in Pomfret is 44.3%.
Women in Pomfret earn 55.7 cents for every dollar earned by a man.
What is Inequality or Gini Index in Pomfret?
Inequality or Gini Index in Pomfret is 0.25.
What is the Total Population of Pomfret?
Total Population of Pomfret is 762.
What is the Total Male Population of Pomfret?
Total Male Population of Pomfret is 352.
What is the Total Female Population of Pomfret?
Total Female Population of Pomfret is 410.
What is the Ratio of Males per 100 Females in Pomfret?
There are 85.85 Males per 100 Females in Pomfret.
What is the Ratio of Females per 100 Males in Pomfret?
There are 116.48 Females per 100 Males in Pomfret.
What is the Median Population Age in Pomfret?
Median Population Age in Pomfret is 52.5 Years.
What is the Average Family Size in Pomfret
Average Family Size in Pomfret is 3.4 People.
What is the Average Household Size in Pomfret
Average Household Size in Pomfret is 3.3 People.
How Large is the Labor Force in Pomfret?
There are 386 People in the Labor Forcein in Pomfret.
What is the Percentage of People in the Labor Force in Pomfret?
58.8% of People are in the Labor Force in Pomfret.
What is the Unemployment Rate in Pomfret?
Unemployment Rate in Pomfret is 9.3%.