San Mar, MD Map & Demographics
San Mar Map
San Mar Overview
$30,346
PER CAPITA INCOME
$130,054
AVG FAMILY INCOME
$85,583
AVG HOUSEHOLD INCOME
0.26
INEQUALITY / GINI INDEX
353
TOTAL POPULATION
179
MALE POPULATION
174
FEMALE POPULATION
102.87
MALES / 100 FEMALES
97.21
FEMALES / 100 MALES
71.4
MEDIAN AGE
2.9
AVG FAMILY SIZE
2.0
AVG HOUSEHOLD SIZE
124
LABOR FORCE [ PEOPLE ]
35.6%
PERCENT IN LABOR FORCE
23.4%
UNEMPLOYMENT RATE
Income in San Mar
Income Overview in San Mar
Per Capita Income in San Mar is $30,346, while median incomes of families and households are $130,054 and $85,583 respectively.
| Characteristic | Number | Measure |
| Per Capita Income | 353 | $30,346 |
| Median Family Income | 45 | $130,054 |
| Mean Family Income | 45 | $117,707 |
| Median Household Income | 113 | $85,583 |
| Mean Household Income | 113 | $78,691 |
| Income Deficit | 45 | $0 |
| Wage / Income Gap (%) | 353 | 0.00% |
| Wage / Income Gap ($) | 353 | 100.00¢ per $1 |
| Gini / Inequality Index | 353 | 0.26 |
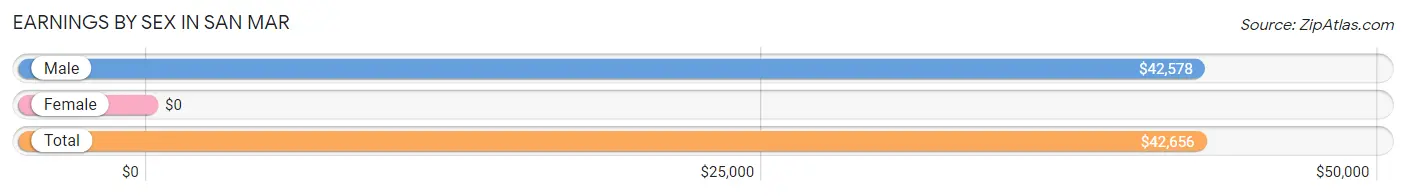
Earnings by Sex in San Mar
| Sex | Number | Average Earnings |
| Male | 87 (72.5%) | $42,578 |
| Female | 33 (27.5%) | $0 |
| Total | 120 (100.0%) | $42,656 |
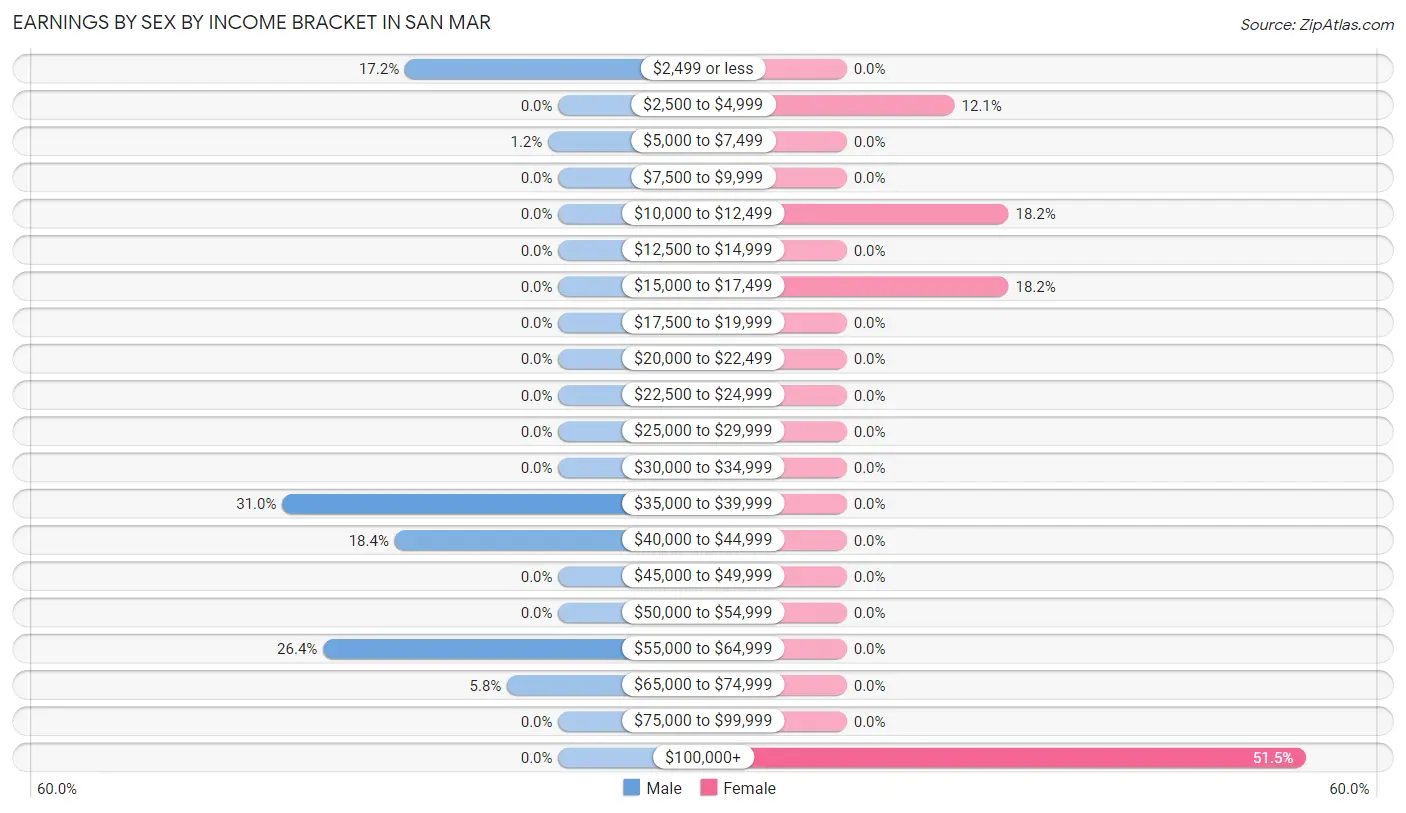
Earnings by Sex by Income Bracket in San Mar
The most common earnings brackets in San Mar are $35,000 to $39,999 for men (27 | 31.0%) and $100,000+ for women (17 | 51.5%).
| Income | Male | Female |
| $2,499 or less | 15 (17.2%) | 0 (0.0%) |
| $2,500 to $4,999 | 0 (0.0%) | 4 (12.1%) |
| $5,000 to $7,499 | 1 (1.1%) | 0 (0.0%) |
| $7,500 to $9,999 | 0 (0.0%) | 0 (0.0%) |
| $10,000 to $12,499 | 0 (0.0%) | 6 (18.2%) |
| $12,500 to $14,999 | 0 (0.0%) | 0 (0.0%) |
| $15,000 to $17,499 | 0 (0.0%) | 6 (18.2%) |
| $17,500 to $19,999 | 0 (0.0%) | 0 (0.0%) |
| $20,000 to $22,499 | 0 (0.0%) | 0 (0.0%) |
| $22,500 to $24,999 | 0 (0.0%) | 0 (0.0%) |
| $25,000 to $29,999 | 0 (0.0%) | 0 (0.0%) |
| $30,000 to $34,999 | 0 (0.0%) | 0 (0.0%) |
| $35,000 to $39,999 | 27 (31.0%) | 0 (0.0%) |
| $40,000 to $44,999 | 16 (18.4%) | 0 (0.0%) |
| $45,000 to $49,999 | 0 (0.0%) | 0 (0.0%) |
| $50,000 to $54,999 | 0 (0.0%) | 0 (0.0%) |
| $55,000 to $64,999 | 23 (26.4%) | 0 (0.0%) |
| $65,000 to $74,999 | 5 (5.8%) | 0 (0.0%) |
| $75,000 to $99,999 | 0 (0.0%) | 0 (0.0%) |
| $100,000+ | 0 (0.0%) | 17 (51.5%) |
| Total | 87 (100.0%) | 33 (100.0%) |
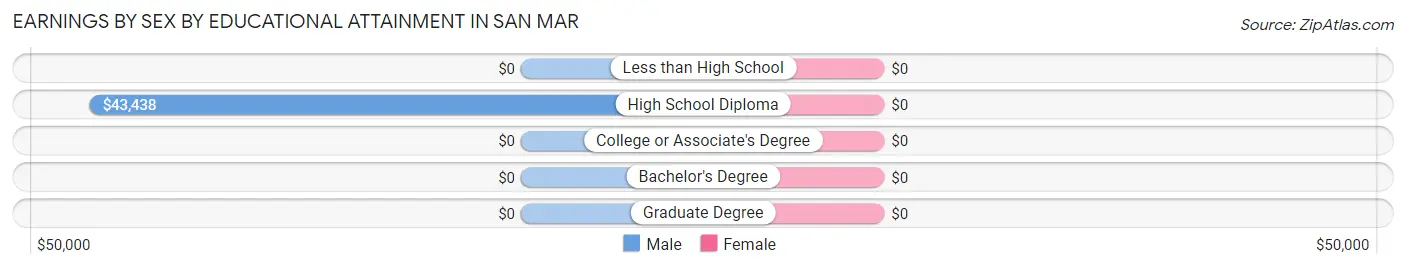
Earnings by Sex by Educational Attainment in San Mar
| Educational Attainment | Male Income | Female Income |
| Less than High School | - | - |
| High School Diploma | $43,438 | $0 |
| College or Associate's Degree | - | - |
| Bachelor's Degree | - | - |
| Graduate Degree | - | - |
| Total | $43,828 | $0 |
Family Income in San Mar
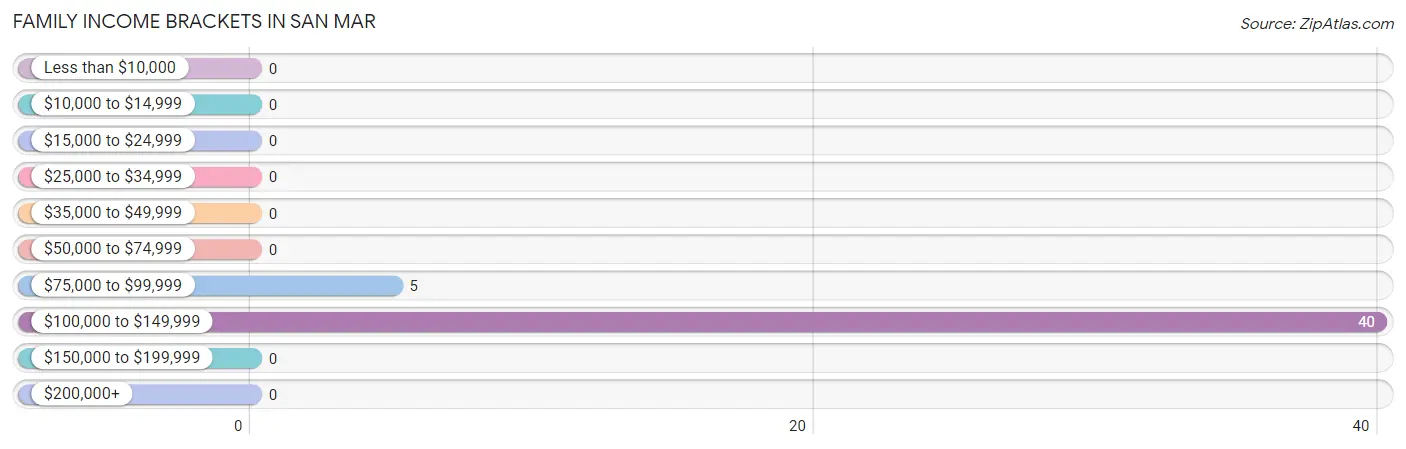
Family Income Brackets in San Mar
According to the San Mar family income data, there are 40 families falling into the $100,000 to $149,999 income range, which is the most common income bracket and makes up 88.9% of all families.
| Income Bracket | # Families | % Families |
| Less than $10,000 | 0 | 0.0% |
| $10,000 to $14,999 | 0 | 0.0% |
| $15,000 to $24,999 | 0 | 0.0% |
| $25,000 to $34,999 | 0 | 0.0% |
| $35,000 to $49,999 | 0 | 0.0% |
| $50,000 to $74,999 | 0 | 0.0% |
| $75,000 to $99,999 | 5 | 11.1% |
| $100,000 to $149,999 | 40 | 88.9% |
| $150,000 to $199,999 | 0 | 0.0% |
| $200,000+ | 0 | 0.0% |
Family Income by Famaliy Size in San Mar
| Income Bracket | # Families | Median Income |
| 2-Person Families | 17 (37.8%) | $0 |
| 3-Person Families | 23 (51.1%) | $0 |
| 4-Person Families | 5 (11.1%) | $0 |
| 5-Person Families | 0 (0.0%) | $0 |
| 6-Person Families | 0 (0.0%) | $0 |
| 7+ Person Families | 0 (0.0%) | $0 |
| Total | 45 (100.0%) | $130,054 |
Family Income by Number of Earners in San Mar
| Number of Earners | # Families | Median Income |
| No Earners | 0 (0.0%) | $0 |
| 1 Earner | 17 (37.8%) | $0 |
| 2 Earners | 23 (51.1%) | $0 |
| 3+ Earners | 5 (11.1%) | $0 |
| Total | 45 (100.0%) | $130,054 |
Household Income in San Mar
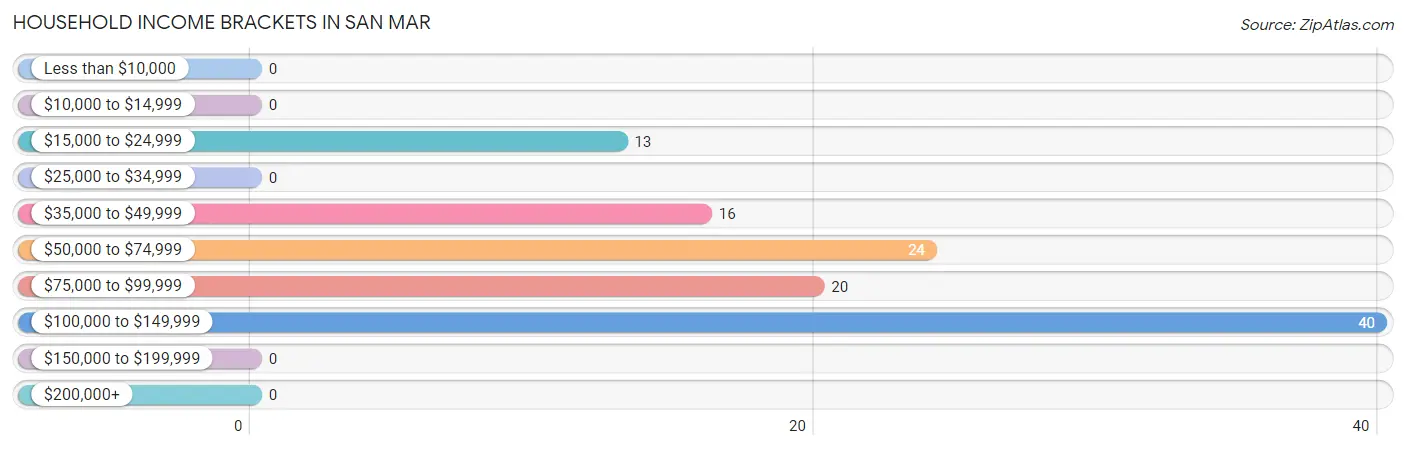
Household Income Brackets in San Mar
With 40 households falling in the category, the $100,000 to $149,999 income range is the most frequent in San Mar, accounting for 35.4% of all households.
| Income Bracket | # Households | % Households |
| Less than $10,000 | 0 | 0.0% |
| $10,000 to $14,999 | 0 | 0.0% |
| $15,000 to $24,999 | 13 | 11.5% |
| $25,000 to $34,999 | 0 | 0.0% |
| $35,000 to $49,999 | 16 | 14.2% |
| $50,000 to $74,999 | 24 | 21.2% |
| $75,000 to $99,999 | 20 | 17.7% |
| $100,000 to $149,999 | 40 | 35.4% |
| $150,000 to $199,999 | 0 | 0.0% |
| $200,000+ | 0 | 0.0% |
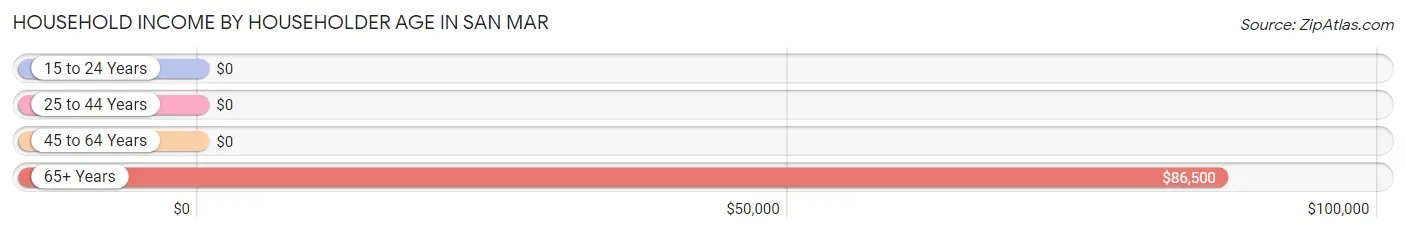
Household Income by Householder Age in San Mar
The median household income in San Mar is $85,583, with the highest median household income of $86,500 found in the 65+ years age bracket for the primary householder. A total of 92 households (81.4%) fall into this category.
| Income Bracket | # Households | Median Income |
| 15 to 24 Years | 0 (0.0%) | $0 |
| 25 to 44 Years | 0 (0.0%) | $0 |
| 45 to 64 Years | 21 (18.6%) | $0 |
| 65+ Years | 92 (81.4%) | $86,500 |
| Total | 113 (100.0%) | $85,583 |
Poverty in San Mar
Income Below Poverty by Sex and Age in San Mar
With 6.2% poverty level for males and 36.0% for females among the residents of San Mar, 18 to 24 year old males and 35 to 44 year old females are the most vulnerable to poverty, with 9 males (56.2%) and 4 females (100.0%) in their respective age groups living below the poverty level.
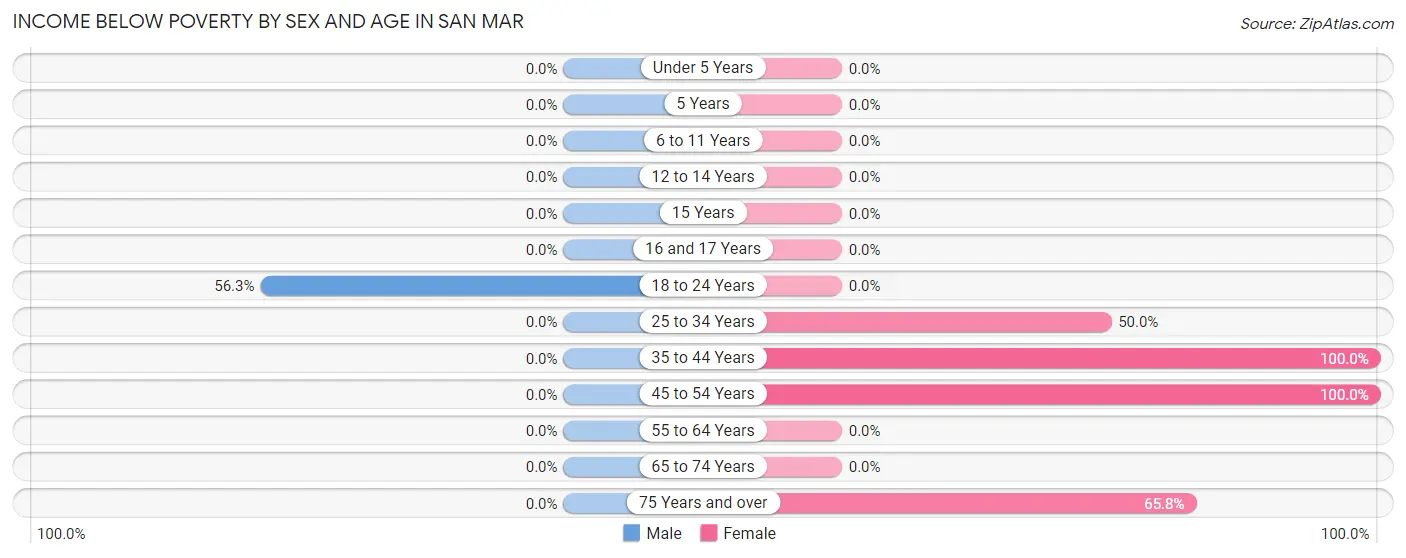
| Age Bracket | Male | Female |
| Under 5 Years | 0 (0.0%) | 0 (0.0%) |
| 5 Years | 0 (0.0%) | 0 (0.0%) |
| 6 to 11 Years | 0 (0.0%) | 0 (0.0%) |
| 12 to 14 Years | 0 (0.0%) | 0 (0.0%) |
| 15 Years | 0 (0.0%) | 0 (0.0%) |
| 16 and 17 Years | 0 (0.0%) | 0 (0.0%) |
| 18 to 24 Years | 9 (56.2%) | 0 (0.0%) |
| 25 to 34 Years | 0 (0.0%) | 6 (50.0%) |
| 35 to 44 Years | 0 (0.0%) | 4 (100.0%) |
| 45 to 54 Years | 0 (0.0%) | 1 (100.0%) |
| 55 to 64 Years | 0 (0.0%) | 0 (0.0%) |
| 65 to 74 Years | 0 (0.0%) | 0 (0.0%) |
| 75 Years and over | 0 (0.0%) | 25 (65.8%) |
| Total | 9 (6.2%) | 36 (36.0%) |
Income Above Poverty by Sex and Age in San Mar
According to the poverty statistics in San Mar, males aged 25 to 34 years and females aged 55 to 64 years are the age groups that are most secure financially, with 100.0% of males and 100.0% of females in these age groups living above the poverty line.
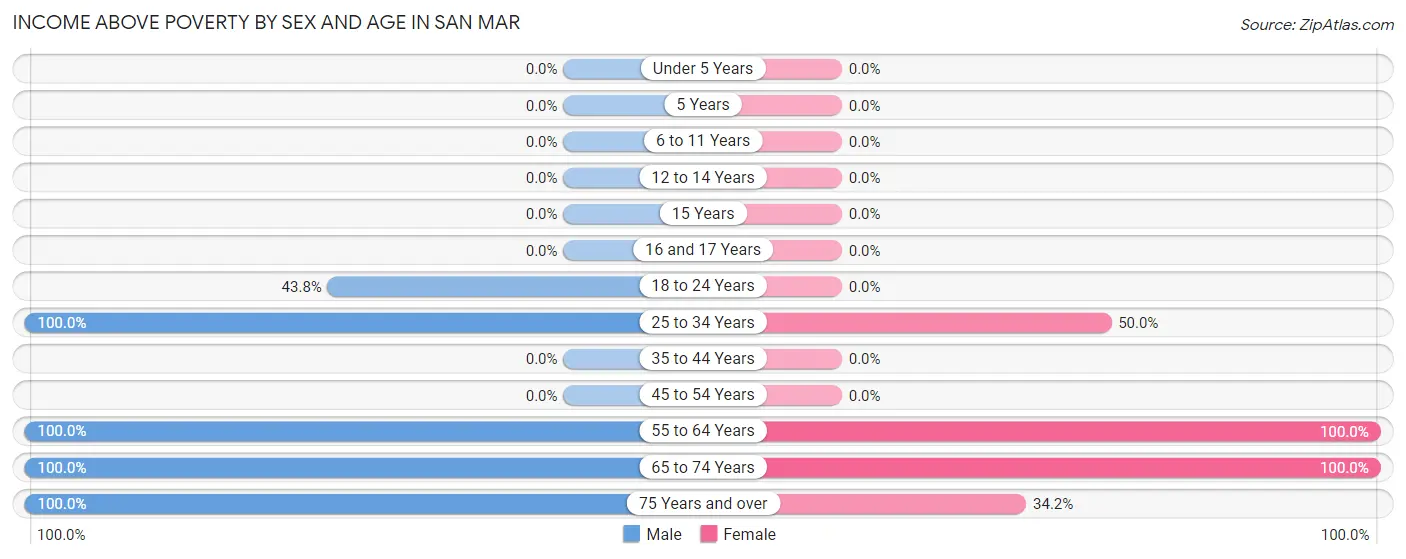
| Age Bracket | Male | Female |
| Under 5 Years | 0 (0.0%) | 0 (0.0%) |
| 5 Years | 0 (0.0%) | 0 (0.0%) |
| 6 to 11 Years | 0 (0.0%) | 0 (0.0%) |
| 12 to 14 Years | 0 (0.0%) | 0 (0.0%) |
| 15 Years | 0 (0.0%) | 0 (0.0%) |
| 16 and 17 Years | 0 (0.0%) | 0 (0.0%) |
| 18 to 24 Years | 7 (43.8%) | 0 (0.0%) |
| 25 to 34 Years | 27 (100.0%) | 6 (50.0%) |
| 35 to 44 Years | 0 (0.0%) | 0 (0.0%) |
| 45 to 54 Years | 0 (0.0%) | 0 (0.0%) |
| 55 to 64 Years | 39 (100.0%) | 6 (100.0%) |
| 65 to 74 Years | 23 (100.0%) | 39 (100.0%) |
| 75 Years and over | 39 (100.0%) | 13 (34.2%) |
| Total | 135 (93.8%) | 64 (64.0%) |
Income Below Poverty Among Married-Couple Families in San Mar
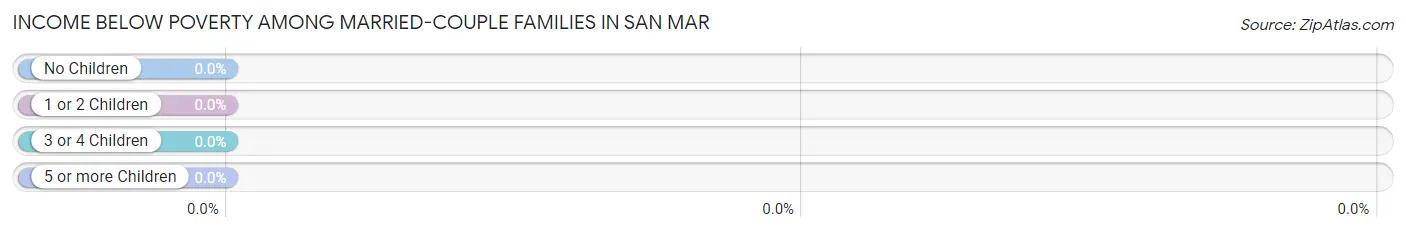
| Children | Above Poverty | Below Poverty |
| No Children | 45 (100.0%) | 0 (0.0%) |
| 1 or 2 Children | 0 (0.0%) | 0 (0.0%) |
| 3 or 4 Children | 0 (0.0%) | 0 (0.0%) |
| 5 or more Children | 0 (0.0%) | 0 (0.0%) |
| Total | 45 (100.0%) | 0 (0.0%) |
Income Below Poverty Among Single-Parent Households in San Mar
| Children | Single Father | Single Mother |
| No Children | 0 (0.0%) | 0 (0.0%) |
| 1 or 2 Children | 0 (0.0%) | 0 (0.0%) |
| 3 or 4 Children | 0 (0.0%) | 0 (0.0%) |
| 5 or more Children | 0 (0.0%) | 0 (0.0%) |
| Total | 0 (0.0%) | 0 (0.0%) |
Income Below Poverty Among Married-Couple vs Single-Parent Households in San Mar
| Children | Married-Couple Families | Single-Parent Households |
| No Children | 0 (0.0%) | 0 (0.0%) |
| 1 or 2 Children | 0 (0.0%) | 0 (0.0%) |
| 3 or 4 Children | 0 (0.0%) | 0 (0.0%) |
| 5 or more Children | 0 (0.0%) | 0 (0.0%) |
| Total | 0 (0.0%) | 0 (0.0%) |
Race in San Mar
The most populous races in San Mar are White / Caucasian (328 | 92.9%), Black / African American (21 | 5.9%), and Hispanic or Latino (9 | 2.5%).
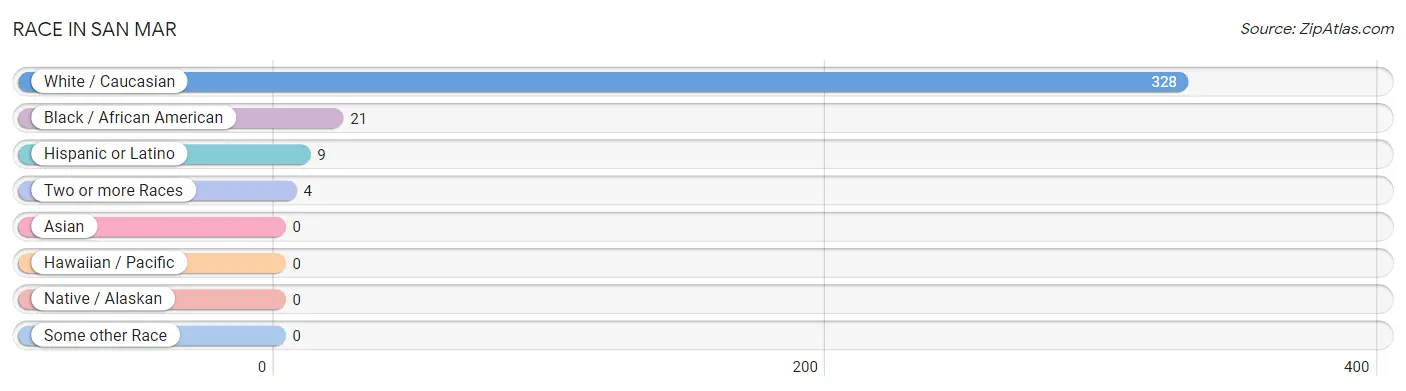
| Race | # Population | % Population |
| Asian | 0 | 0.0% |
| Black / African American | 21 | 5.9% |
| Hawaiian / Pacific | 0 | 0.0% |
| Hispanic or Latino | 9 | 2.5% |
| Native / Alaskan | 0 | 0.0% |
| White / Caucasian | 328 | 92.9% |
| Two or more Races | 4 | 1.1% |
| Some other Race | 0 | 0.0% |
| Total | 353 | 100.0% |
Ancestry in San Mar
The most populous ancestries reported in San Mar are German (109 | 30.9%), Irish (58 | 16.4%), Northern European (25 | 7.1%), English (20 | 5.7%), and Scottish (18 | 5.1%), together accounting for 65.2% of all San Mar residents.
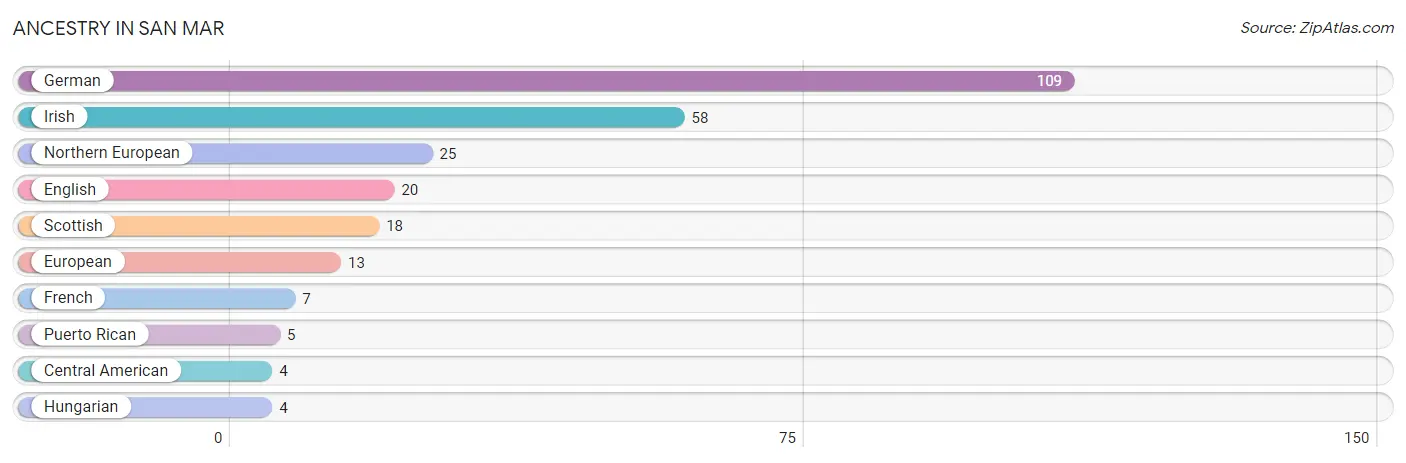
| Ancestry | # Population | % Population |
| Central American | 4 | 1.1% |
| English | 20 | 5.7% |
| European | 13 | 3.7% |
| French | 7 | 2.0% |
| German | 109 | 30.9% |
| Hungarian | 4 | 1.1% |
| Irish | 58 | 16.4% |
| Northern European | 25 | 7.1% |
| Puerto Rican | 5 | 1.4% |
| Scottish | 18 | 5.1% | View All 10 Rows |
Immigrants in San Mar

| Immigration Origin | # Population | % Population | View All 0 Rows |
Sex and Age in San Mar
Sex and Age in San Mar
The most populous age groups in San Mar are 60 to 64 Years (34 | 19.0%) for men and 85 Years and over (53 | 30.5%) for women.
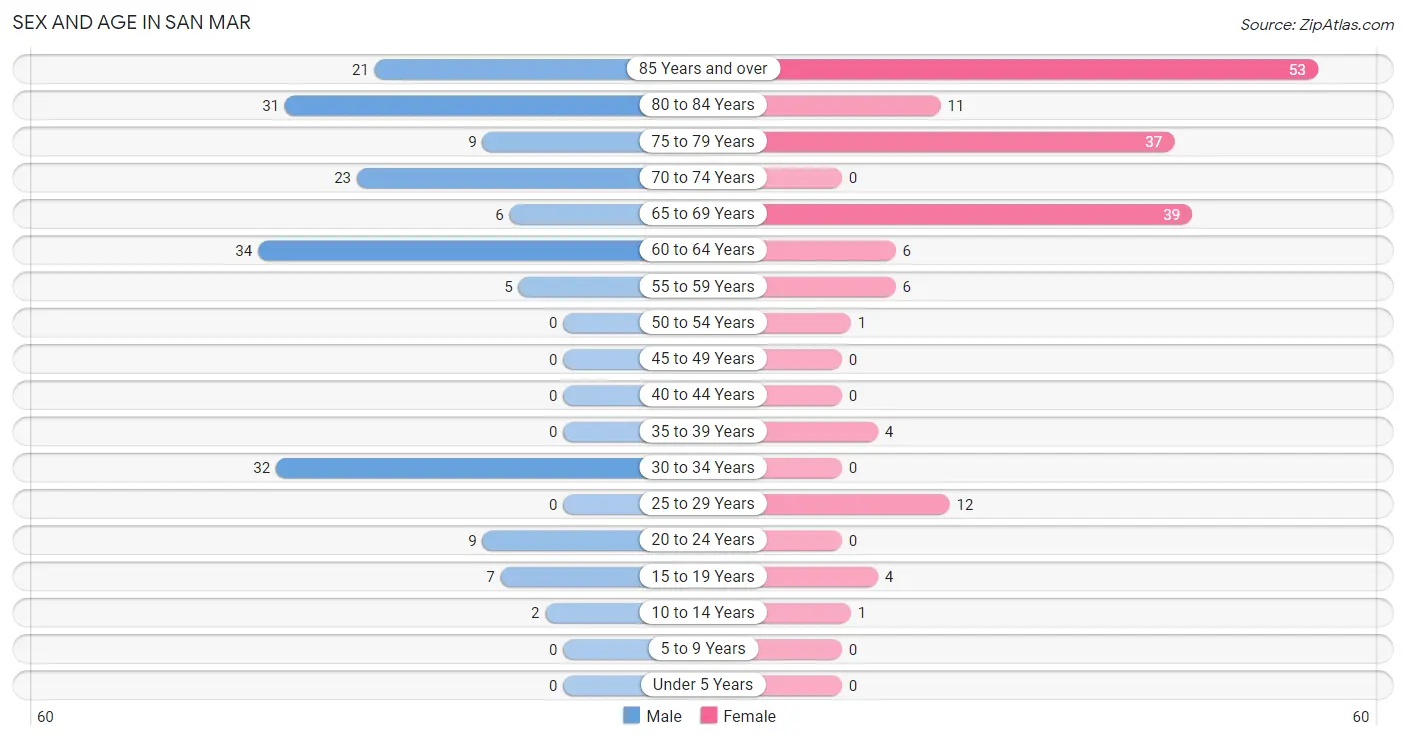
| Age Bracket | Male | Female |
| Under 5 Years | 0 (0.0%) | 0 (0.0%) |
| 5 to 9 Years | 0 (0.0%) | 0 (0.0%) |
| 10 to 14 Years | 2 (1.1%) | 1 (0.6%) |
| 15 to 19 Years | 7 (3.9%) | 4 (2.3%) |
| 20 to 24 Years | 9 (5.0%) | 0 (0.0%) |
| 25 to 29 Years | 0 (0.0%) | 12 (6.9%) |
| 30 to 34 Years | 32 (17.9%) | 0 (0.0%) |
| 35 to 39 Years | 0 (0.0%) | 4 (2.3%) |
| 40 to 44 Years | 0 (0.0%) | 0 (0.0%) |
| 45 to 49 Years | 0 (0.0%) | 0 (0.0%) |
| 50 to 54 Years | 0 (0.0%) | 1 (0.6%) |
| 55 to 59 Years | 5 (2.8%) | 6 (3.5%) |
| 60 to 64 Years | 34 (19.0%) | 6 (3.5%) |
| 65 to 69 Years | 6 (3.4%) | 39 (22.4%) |
| 70 to 74 Years | 23 (12.9%) | 0 (0.0%) |
| 75 to 79 Years | 9 (5.0%) | 37 (21.3%) |
| 80 to 84 Years | 31 (17.3%) | 11 (6.3%) |
| 85 Years and over | 21 (11.7%) | 53 (30.5%) |
| Total | 179 (100.0%) | 174 (100.0%) |
Families and Households in San Mar
Median Family Size in San Mar
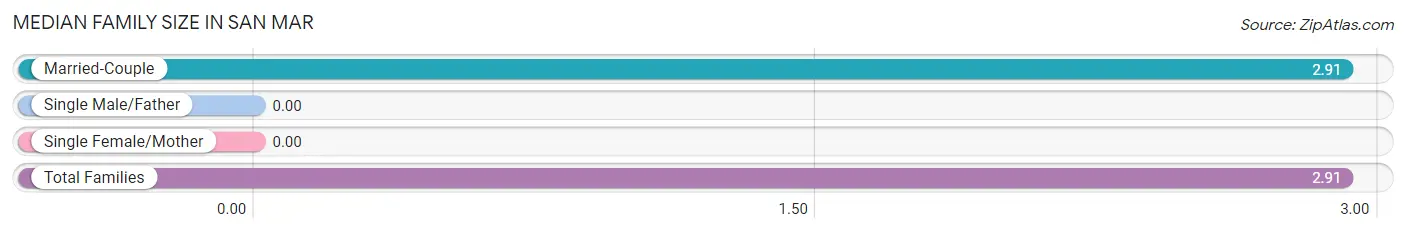
| Family Type | # Families | Family Size |
| Married-Couple | 45 (100.0%) | 2.91 |
| Single Male/Father | 0 (0.0%) | - |
| Single Female/Mother | 0 (0.0%) | - |
| Total Families | 45 (100.0%) | 2.91 |
Median Household Size in San Mar
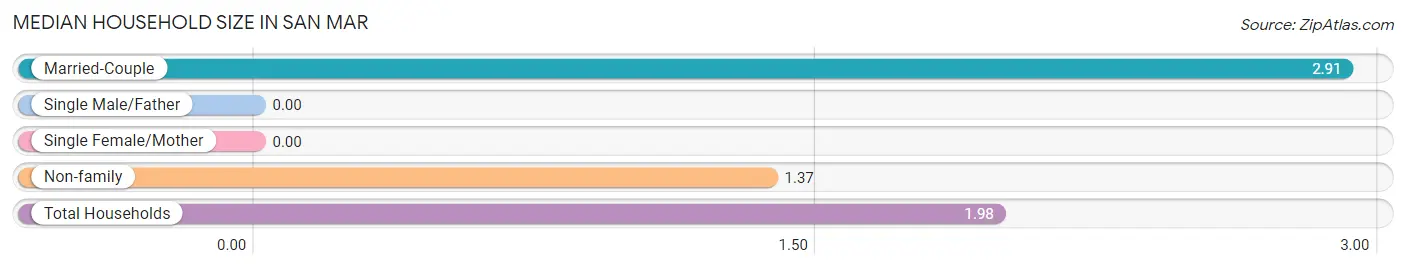
| Household Type | # Households | Household Size |
| Married-Couple | 45 (39.8%) | 2.91 |
| Single Male/Father | 0 (0.0%) | - |
| Single Female/Mother | 0 (0.0%) | - |
| Non-family | 68 (60.2%) | 1.37 |
| Total Households | 113 (100.0%) | 1.98 |
Household Size by Marriage Status in San Mar
Out of a total of 113 households in San Mar, 45 (39.8%) are family households, while 68 (60.2%) are nonfamily households. The most numerous type of family households are 3-person households, comprising 23, and the most common type of nonfamily households are 1-person households, comprising 44.
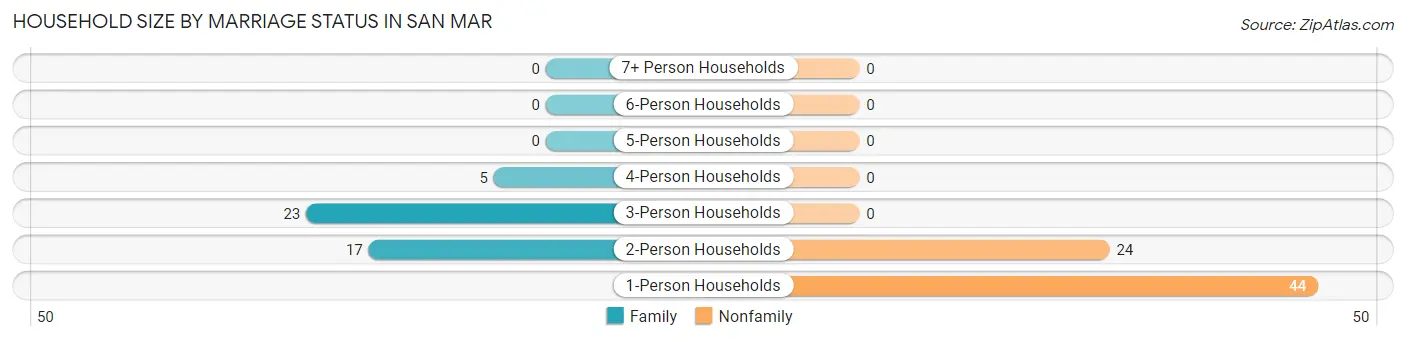
| Household Size | Family Households | Nonfamily Households |
| 1-Person Households | - | 44 (38.9%) |
| 2-Person Households | 17 (15.0%) | 24 (21.2%) |
| 3-Person Households | 23 (20.3%) | 0 (0.0%) |
| 4-Person Households | 5 (4.4%) | 0 (0.0%) |
| 5-Person Households | 0 (0.0%) | 0 (0.0%) |
| 6-Person Households | 0 (0.0%) | 0 (0.0%) |
| 7+ Person Households | 0 (0.0%) | 0 (0.0%) |
| Total | 45 (39.8%) | 68 (60.2%) |
Female Fertility in San Mar
Fertility by Age in San Mar
| Age Bracket | Women with Births | Births / 1,000 Women |
| 15 to 19 years | 0 (0.0%) | 0.0 |
| 20 to 34 years | 0 (0.0%) | 0.0 |
| 35 to 50 years | 0 (0.0%) | 0.0 |
| Total | 0 (0.0%) | 0.0 |
Fertility by Age by Marriage Status in San Mar
| Age Bracket | Married | Unmarried |
| 15 to 19 years | 0 (0.0%) | 0 (0.0%) |
| 20 to 34 years | 0 (0.0%) | 0 (0.0%) |
| 35 to 50 years | 0 (0.0%) | 0 (0.0%) |
| Total | 0 (0.0%) | 0 (0.0%) |
Fertility by Education in San Mar
| Educational Attainment | Women with Births | Births / 1,000 Women |
| Less than High School | 0 (0.0%) | 0.0 |
| High School Diploma | 0 (0.0%) | 0.0 |
| College or Associate's Degree | 0 (0.0%) | 0.0 |
| Bachelor's Degree | 0 (0.0%) | 0.0 |
| Graduate Degree | 0 (0.0%) | 0.0 |
| Total | 0 (0.0%) | 0.0 |
Fertility by Education by Marriage Status in San Mar
| Educational Attainment | Married | Unmarried |
| Less than High School | 0 (0.0%) | 0 (0.0%) |
| High School Diploma | 0 (0.0%) | 0 (0.0%) |
| College or Associate's Degree | 0 (0.0%) | 0 (0.0%) |
| Bachelor's Degree | 0 (0.0%) | 0 (0.0%) |
| Graduate Degree | 0 (0.0%) | 0 (0.0%) |
| Total | 0 (0.0%) | 0 (0.0%) |
Employment Characteristics in San Mar
Employment by Class of Employer in San Mar
Among the 95 employed individuals in San Mar, private company employees (94 | 99.0%), and local government employees (1 | 1.1%) make up the most common classes of employment.
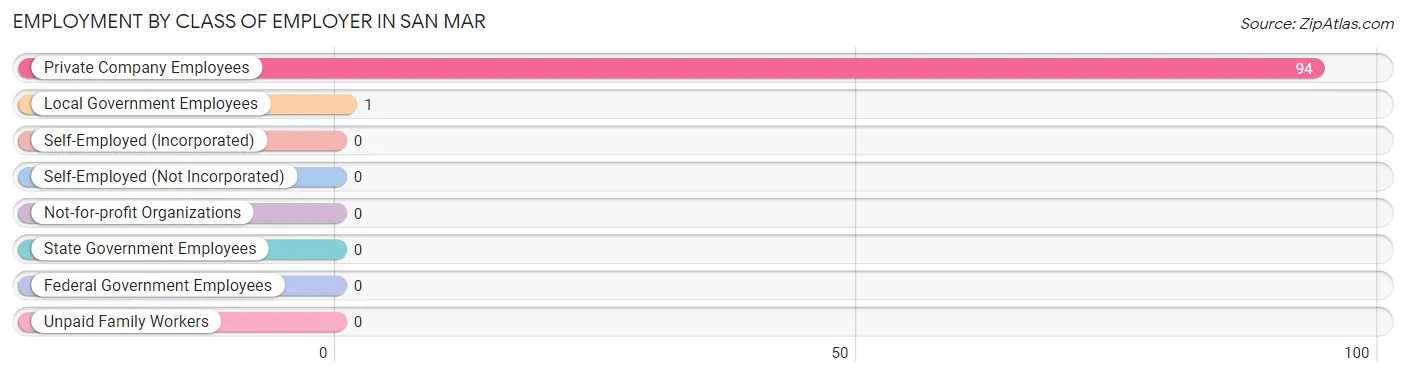
| Employer Class | # Employees | % Employees |
| Private Company Employees | 94 | 99.0% |
| Self-Employed (Incorporated) | 0 | 0.0% |
| Self-Employed (Not Incorporated) | 0 | 0.0% |
| Not-for-profit Organizations | 0 | 0.0% |
| Local Government Employees | 1 | 1.1% |
| State Government Employees | 0 | 0.0% |
| Federal Government Employees | 0 | 0.0% |
| Unpaid Family Workers | 0 | 0.0% |
| Total | 95 | 100.0% |
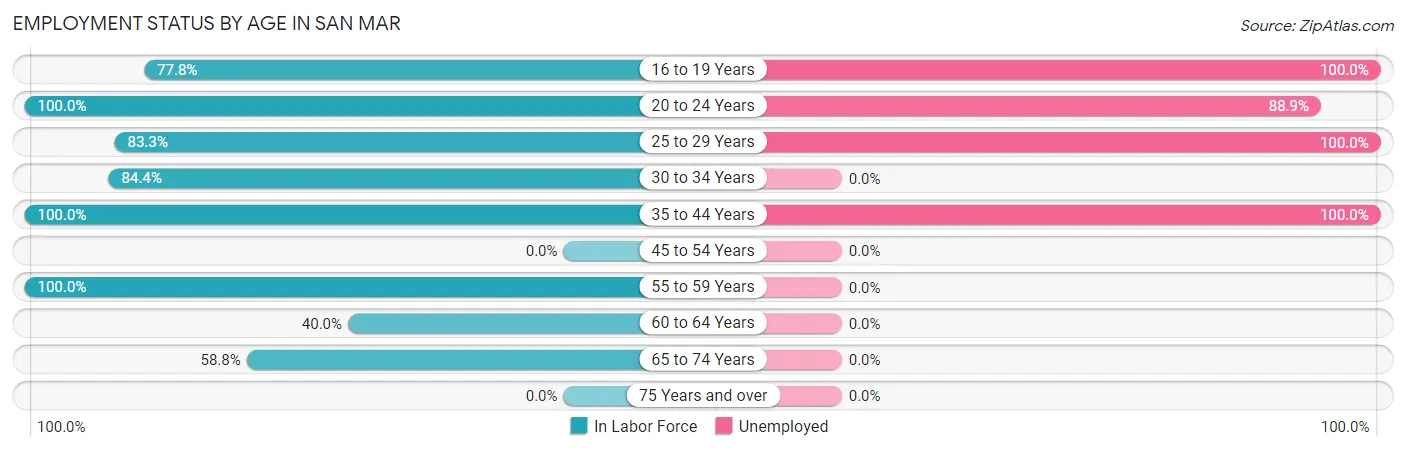
Employment Status by Age in San Mar
According to the labor force statistics for San Mar, out of the total population over 16 years of age (348), 35.6% or 124 individuals are in the labor force, with 23.4% or 29 of them unemployed. The age group with the highest labor force participation rate is 20 to 24 years, with 100.0% or 9 individuals in the labor force. Within the labor force, the 16 to 19 years age range has the highest percentage of unemployed individuals, with 100.0% or 7 of them being unemployed.
| Age Bracket | In Labor Force | Unemployed |
| 16 to 19 Years | 7 (77.8%) | 7 (100.0%) |
| 20 to 24 Years | 9 (100.0%) | 8 (88.9%) |
| 25 to 29 Years | 10 (83.3%) | 10 (100.0%) |
| 30 to 34 Years | 27 (84.4%) | 0 (0.0%) |
| 35 to 44 Years | 4 (100.0%) | 4 (100.0%) |
| 45 to 54 Years | 0 (0.0%) | 0 (0.0%) |
| 55 to 59 Years | 11 (100.0%) | 0 (0.0%) |
| 60 to 64 Years | 16 (40.0%) | 0 (0.0%) |
| 65 to 74 Years | 40 (58.8%) | 0 (0.0%) |
| 75 Years and over | 0 (0.0%) | 0 (0.0%) |
| Total | 124 (35.6%) | 29 (23.4%) |
Employment Status by Educational Attainment in San Mar
According to labor force statistics for San Mar, 68.0% of individuals (68) out of the total population between 25 and 64 years of age (100) are in the labor force, with 20.6% or 14 of them being unemployed. The group with the highest labor force participation rate are those with the educational attainment of bachelor's degree or higher, with 100.0% or 6 individuals in the labor force. Within the labor force, individuals with bachelor's degree or higher education have the highest percentage of unemployment, with 100.0% or 6 of them being unemployed.
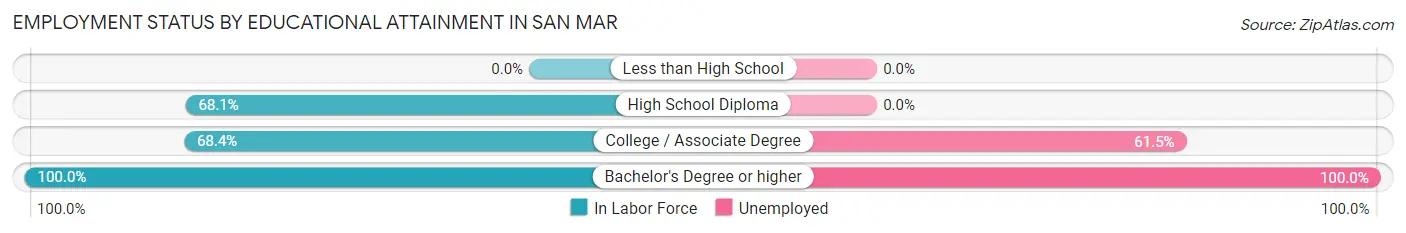
| Educational Attainment | In Labor Force | Unemployed |
| Less than High School | 0 (0.0%) | 0 (0.0%) |
| High School Diploma | 49 (68.1%) | 0 (0.0%) |
| College / Associate Degree | 13 (68.4%) | 12 (61.5%) |
| Bachelor's Degree or higher | 6 (100.0%) | 6 (100.0%) |
| Total | 68 (68.0%) | 21 (20.6%) |
Employment Occupations by Sex in San Mar
Management, Business, Science and Arts Occupations
The most common Management, Business, Science and Arts occupations in San Mar are , and Management (40 | 42.1%).
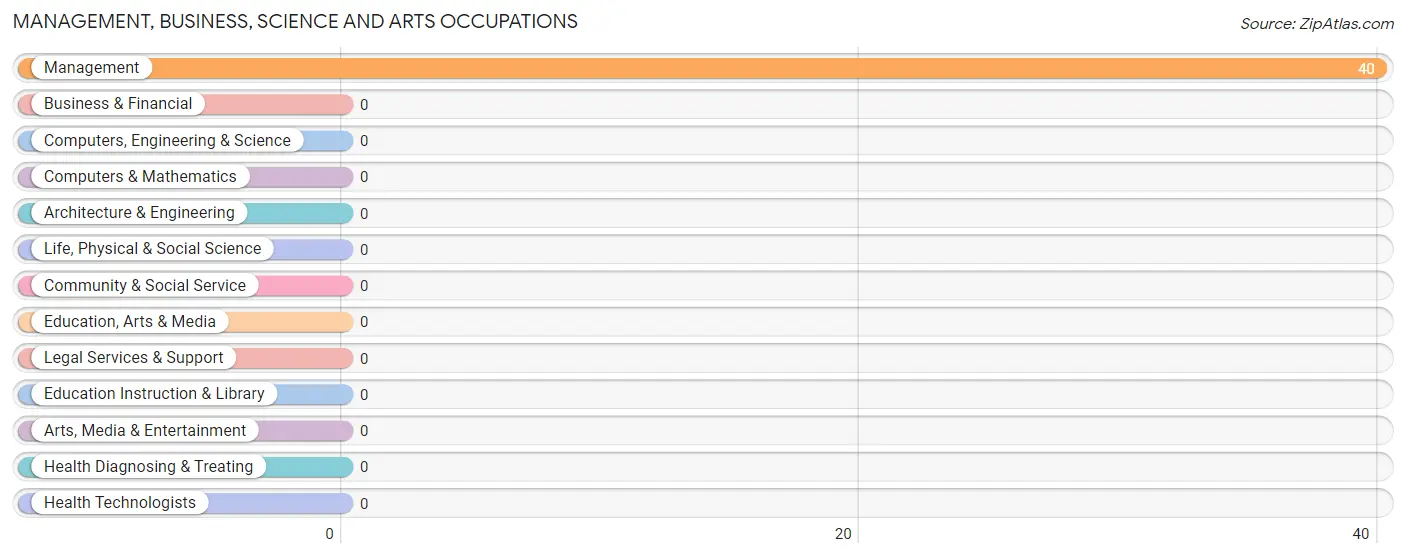
Management, Business, Science and Arts Occupations by Sex
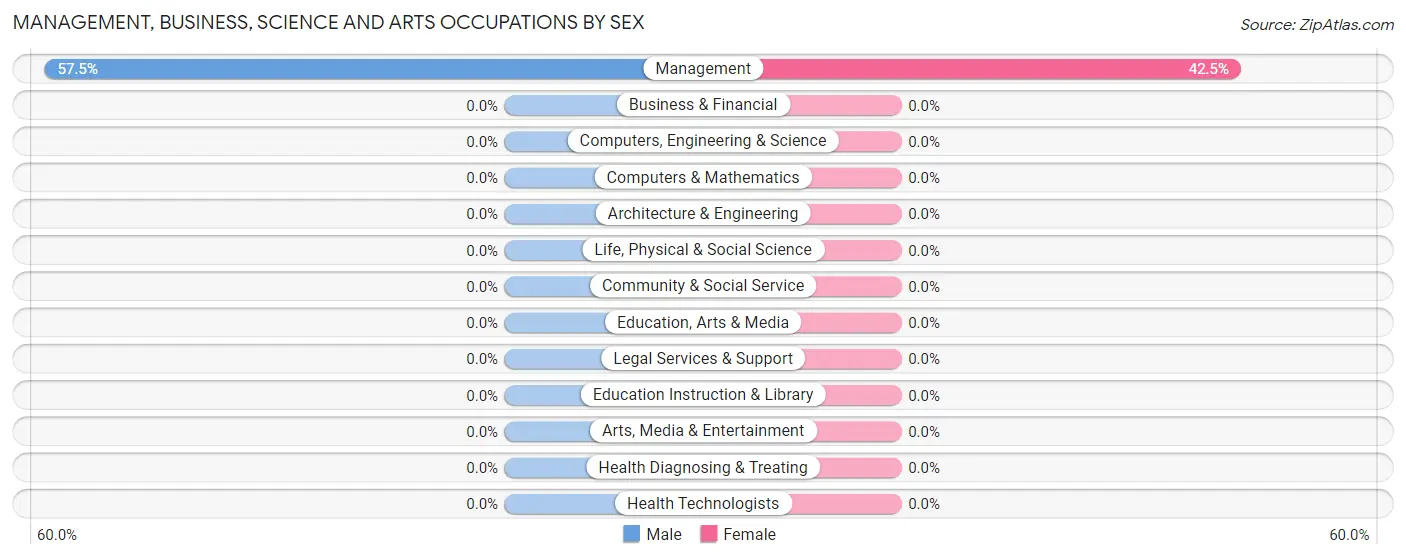
| Occupation | Male | Female |
| Management | 23 (57.5%) | 17 (42.5%) |
| Business & Financial | 0 (0.0%) | 0 (0.0%) |
| Computers, Engineering & Science | 0 (0.0%) | 0 (0.0%) |
| Computers & Mathematics | 0 (0.0%) | 0 (0.0%) |
| Architecture & Engineering | 0 (0.0%) | 0 (0.0%) |
| Life, Physical & Social Science | 0 (0.0%) | 0 (0.0%) |
| Community & Social Service | 0 (0.0%) | 0 (0.0%) |
| Education, Arts & Media | 0 (0.0%) | 0 (0.0%) |
| Legal Services & Support | 0 (0.0%) | 0 (0.0%) |
| Education Instruction & Library | 0 (0.0%) | 0 (0.0%) |
| Arts, Media & Entertainment | 0 (0.0%) | 0 (0.0%) |
| Health Diagnosing & Treating | 0 (0.0%) | 0 (0.0%) |
| Health Technologists | 0 (0.0%) | 0 (0.0%) |
| Total (Category) | 23 (57.5%) | 17 (42.5%) |
| Total (Overall) | 72 (75.8%) | 23 (24.2%) |
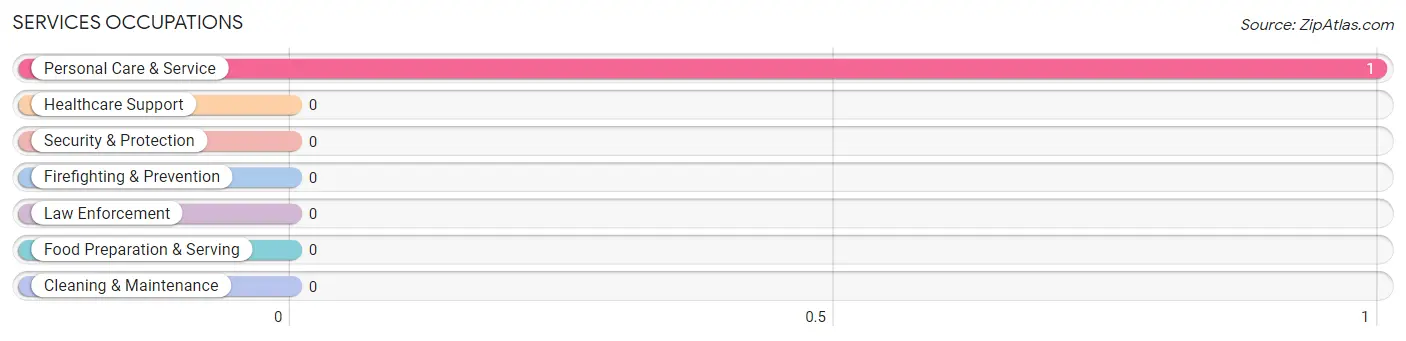
Services Occupations
The most common Services occupations in San Mar are , and Personal Care & Service (1 | 1.1%).
Services Occupations by Sex
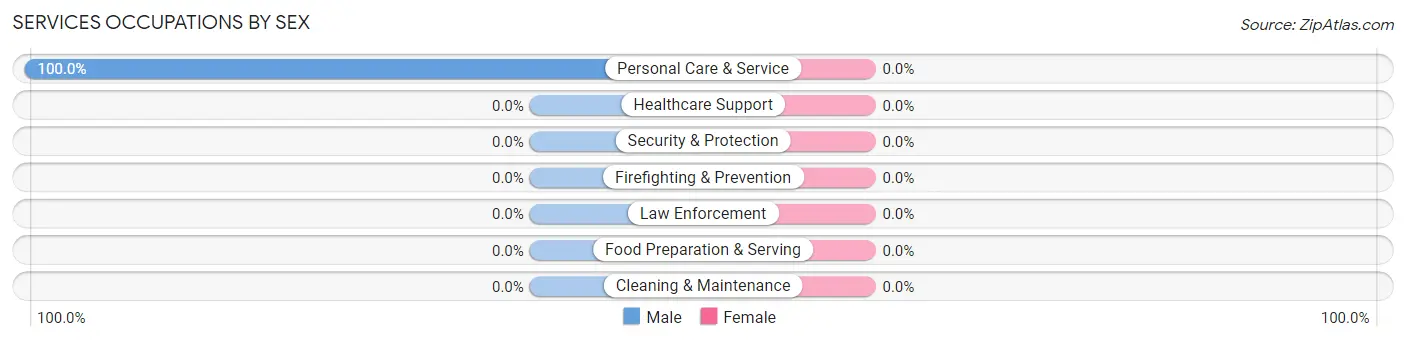
| Occupation | Male | Female |
| Healthcare Support | 0 (0.0%) | 0 (0.0%) |
| Security & Protection | 0 (0.0%) | 0 (0.0%) |
| Firefighting & Prevention | 0 (0.0%) | 0 (0.0%) |
| Law Enforcement | 0 (0.0%) | 0 (0.0%) |
| Food Preparation & Serving | 0 (0.0%) | 0 (0.0%) |
| Cleaning & Maintenance | 0 (0.0%) | 0 (0.0%) |
| Personal Care & Service | 1 (100.0%) | 0 (0.0%) |
| Total (Category) | 1 (100.0%) | 0 (0.0%) |
| Total (Overall) | 72 (75.8%) | 23 (24.2%) |
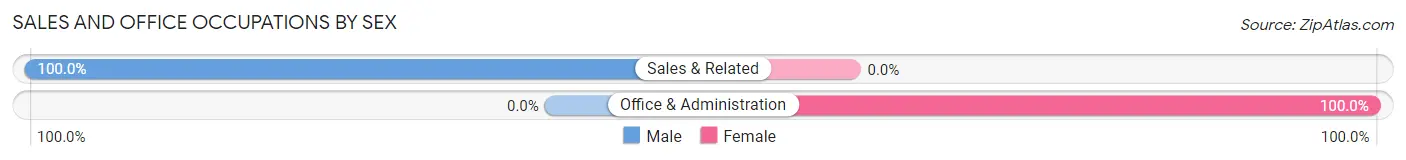
Sales and Office Occupations
The most common Sales and Office occupations in San Mar are Office & Administration (6 | 6.3%), and Sales & Related (5 | 5.3%).
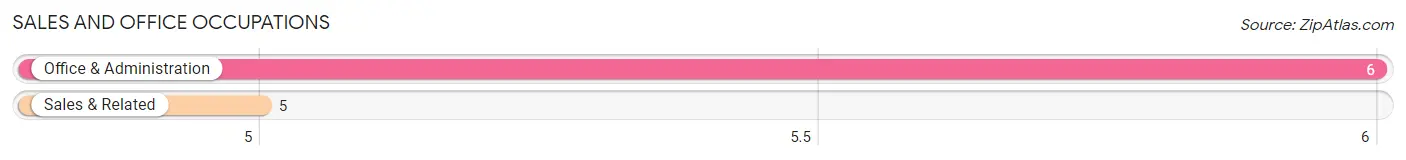
Sales and Office Occupations by Sex
| Occupation | Male | Female |
| Sales & Related | 5 (100.0%) | 0 (0.0%) |
| Office & Administration | 0 (0.0%) | 6 (100.0%) |
| Total (Category) | 5 (45.5%) | 6 (54.5%) |
| Total (Overall) | 72 (75.8%) | 23 (24.2%) |
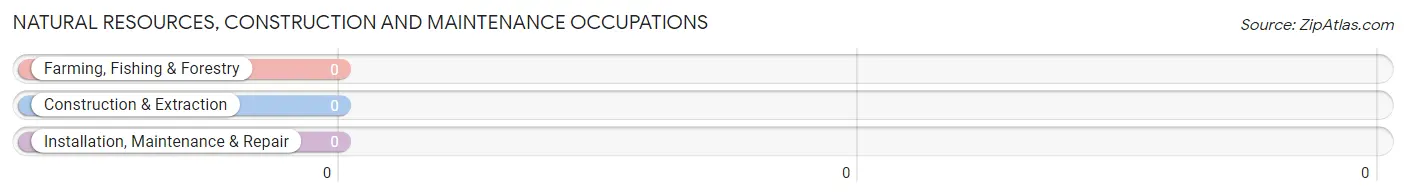
Natural Resources, Construction and Maintenance Occupations
Natural Resources, Construction and Maintenance Occupations by Sex
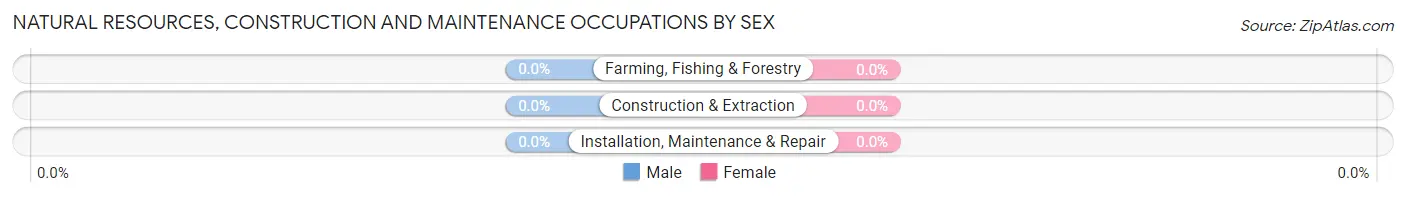
| Occupation | Male | Female |
| Farming, Fishing & Forestry | 0 (0.0%) | 0 (0.0%) |
| Construction & Extraction | 0 (0.0%) | 0 (0.0%) |
| Installation, Maintenance & Repair | 0 (0.0%) | 0 (0.0%) |
| Total (Category) | 0 (0.0%) | 0 (0.0%) |
| Total (Overall) | 72 (75.8%) | 23 (24.2%) |
Production, Transportation and Moving Occupations
The most common Production, Transportation and Moving occupations in San Mar are Production (27 | 28.4%), and Material Moving (16 | 16.8%).
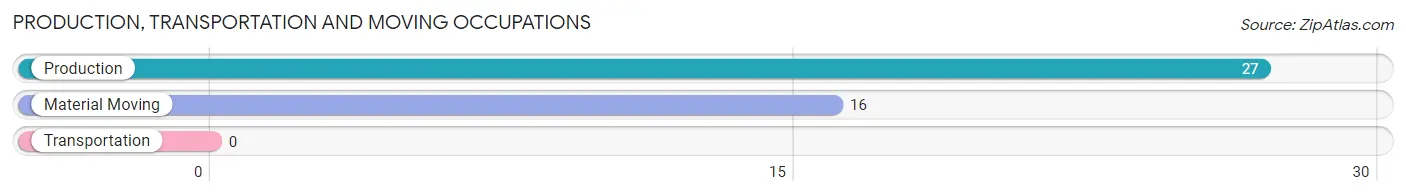
Production, Transportation and Moving Occupations by Sex
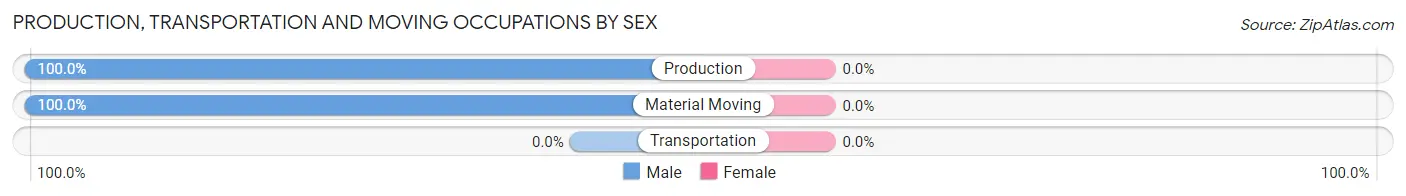
| Occupation | Male | Female |
| Production | 27 (100.0%) | 0 (0.0%) |
| Transportation | 0 (0.0%) | 0 (0.0%) |
| Material Moving | 16 (100.0%) | 0 (0.0%) |
| Total (Category) | 43 (100.0%) | 0 (0.0%) |
| Total (Overall) | 72 (75.8%) | 23 (24.2%) |
Employment Industries by Sex in San Mar
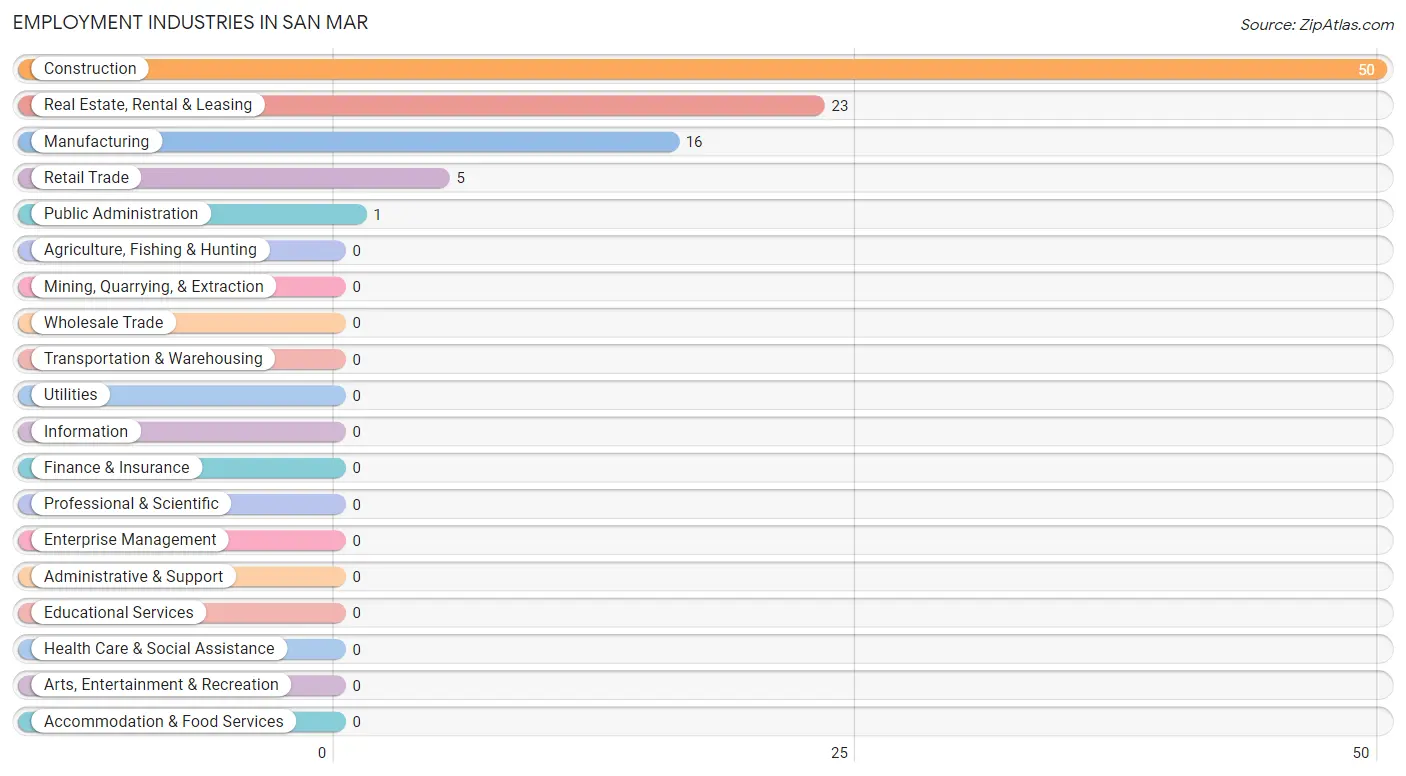
Employment Industries in San Mar
The major employment industries in San Mar include Construction (50 | 52.6%), Real Estate, Rental & Leasing (23 | 24.2%), Manufacturing (16 | 16.8%), Retail Trade (5 | 5.3%), and Public Administration (1 | 1.1%).
Employment Industries by Sex in San Mar
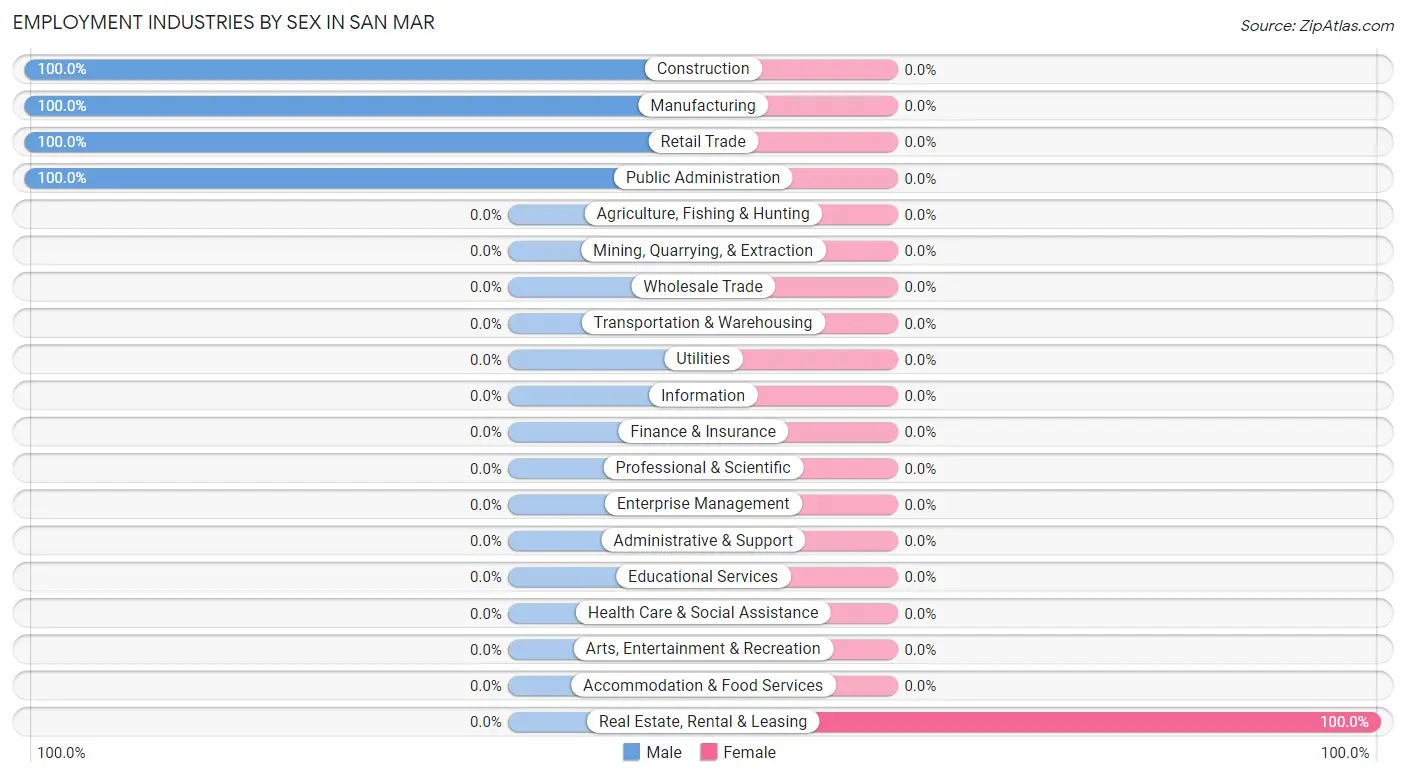
| Industry | Male | Female |
| Agriculture, Fishing & Hunting | 0 (0.0%) | 0 (0.0%) |
| Mining, Quarrying, & Extraction | 0 (0.0%) | 0 (0.0%) |
| Construction | 50 (100.0%) | 0 (0.0%) |
| Manufacturing | 16 (100.0%) | 0 (0.0%) |
| Wholesale Trade | 0 (0.0%) | 0 (0.0%) |
| Retail Trade | 5 (100.0%) | 0 (0.0%) |
| Transportation & Warehousing | 0 (0.0%) | 0 (0.0%) |
| Utilities | 0 (0.0%) | 0 (0.0%) |
| Information | 0 (0.0%) | 0 (0.0%) |
| Finance & Insurance | 0 (0.0%) | 0 (0.0%) |
| Real Estate, Rental & Leasing | 0 (0.0%) | 23 (100.0%) |
| Professional & Scientific | 0 (0.0%) | 0 (0.0%) |
| Enterprise Management | 0 (0.0%) | 0 (0.0%) |
| Administrative & Support | 0 (0.0%) | 0 (0.0%) |
| Educational Services | 0 (0.0%) | 0 (0.0%) |
| Health Care & Social Assistance | 0 (0.0%) | 0 (0.0%) |
| Arts, Entertainment & Recreation | 0 (0.0%) | 0 (0.0%) |
| Accommodation & Food Services | 0 (0.0%) | 0 (0.0%) |
| Public Administration | 1 (100.0%) | 0 (0.0%) |
| Total | 72 (75.8%) | 23 (24.2%) |
Education in San Mar
School Enrollment in San Mar
The most common levels of schooling among the 14 students in San Mar are college / undergraduate (7 | 50.0%), high school (4 | 28.6%), and middle school (3 | 21.4%).
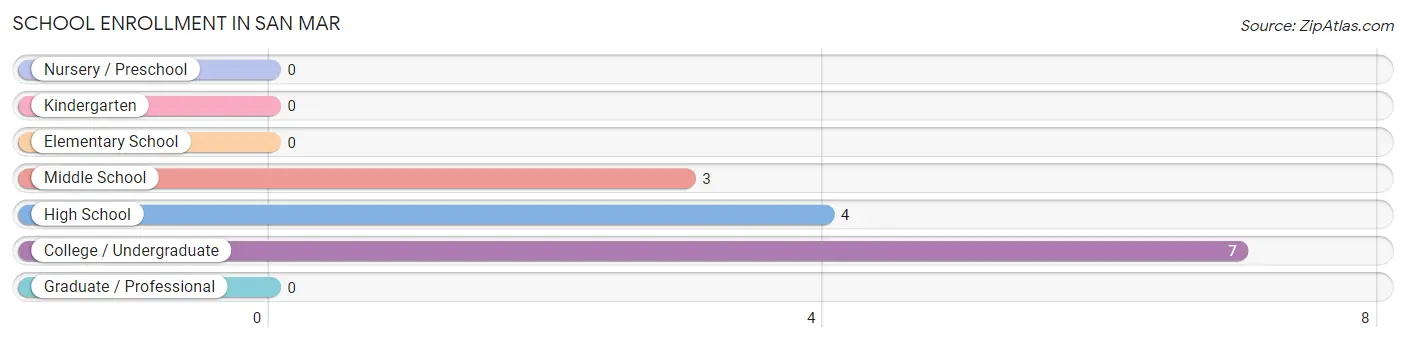
| School Level | # Students | % Students |
| Nursery / Preschool | 0 | 0.0% |
| Kindergarten | 0 | 0.0% |
| Elementary School | 0 | 0.0% |
| Middle School | 3 | 21.4% |
| High School | 4 | 28.6% |
| College / Undergraduate | 7 | 50.0% |
| Graduate / Professional | 0 | 0.0% |
| Total | 14 | 100.0% |
School Enrollment by Age by Funding Source in San Mar
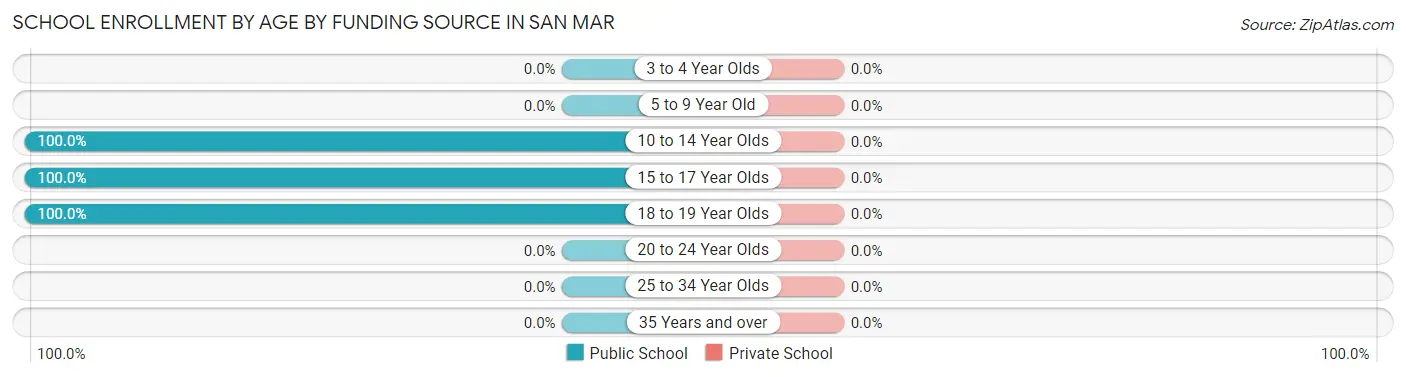
| Age Bracket | Public School | Private School |
| 3 to 4 Year Olds | 0 (0.0%) | 0 (0.0%) |
| 5 to 9 Year Old | 0 (0.0%) | 0 (0.0%) |
| 10 to 14 Year Olds | 3 (100.0%) | 0 (0.0%) |
| 15 to 17 Year Olds | 4 (100.0%) | 0 (0.0%) |
| 18 to 19 Year Olds | 7 (100.0%) | 0 (0.0%) |
| 20 to 24 Year Olds | 0 (0.0%) | 0 (0.0%) |
| 25 to 34 Year Olds | 0 (0.0%) | 0 (0.0%) |
| 35 Years and over | 0 (0.0%) | 0 (0.0%) |
| Total | 14 (100.0%) | 0 (0.0%) |
Educational Attainment by Field of Study in San Mar
Social sciences (13 | 68.4%), and computers & mathematics (6 | 31.6%) are the most common fields of study among 19 individuals in San Mar who have obtained a bachelor's degree or higher.
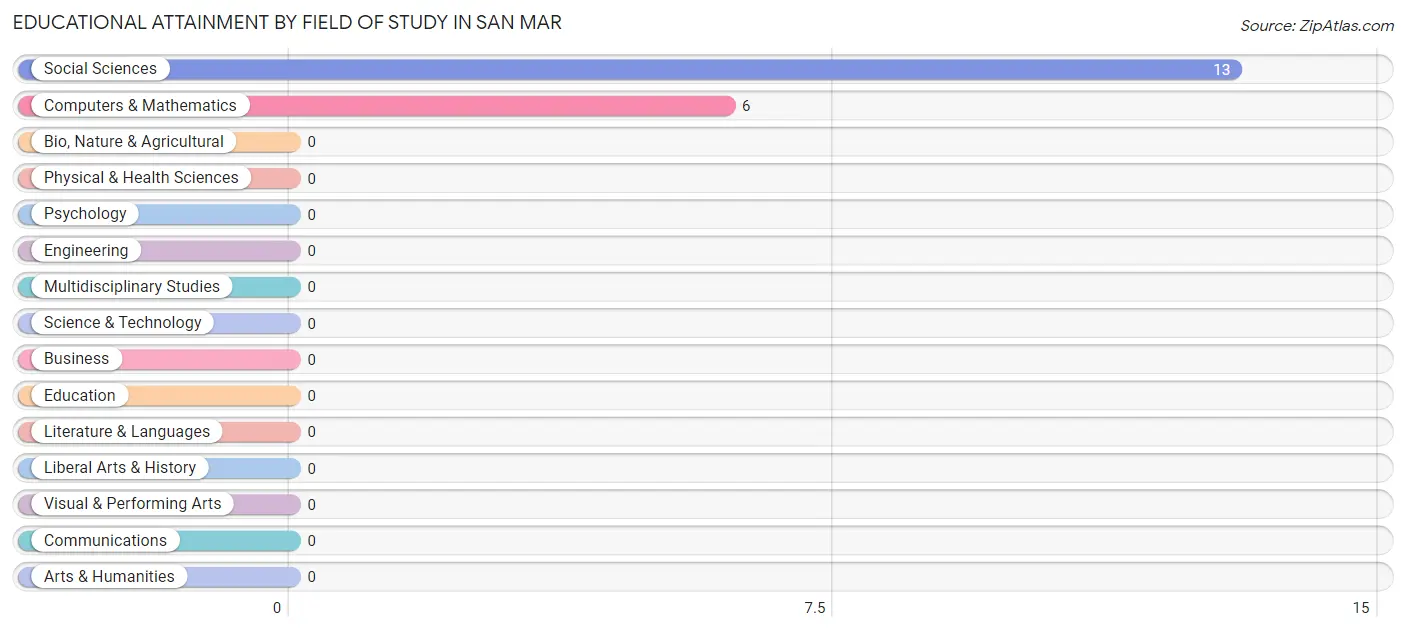
| Field of Study | # Graduates | % Graduates |
| Computers & Mathematics | 6 | 31.6% |
| Bio, Nature & Agricultural | 0 | 0.0% |
| Physical & Health Sciences | 0 | 0.0% |
| Psychology | 0 | 0.0% |
| Social Sciences | 13 | 68.4% |
| Engineering | 0 | 0.0% |
| Multidisciplinary Studies | 0 | 0.0% |
| Science & Technology | 0 | 0.0% |
| Business | 0 | 0.0% |
| Education | 0 | 0.0% |
| Literature & Languages | 0 | 0.0% |
| Liberal Arts & History | 0 | 0.0% |
| Visual & Performing Arts | 0 | 0.0% |
| Communications | 0 | 0.0% |
| Arts & Humanities | 0 | 0.0% |
| Total | 19 | 100.0% |
Transportation & Commute in San Mar
Vehicle Availability by Sex in San Mar
The most prevalent vehicle ownership categories in San Mar are males with 3 vehicles (50, accounting for 70.4%) and females with 3 vehicles (17, making up 217.4%).
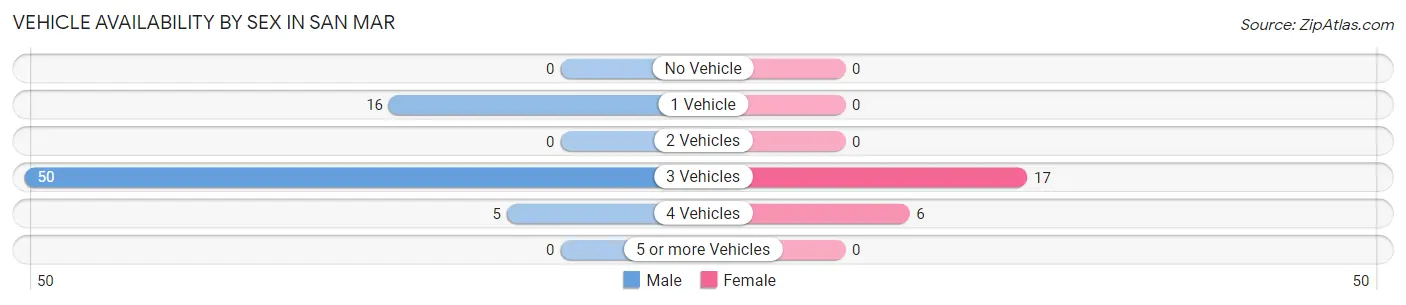
| Vehicles Available | Male | Female |
| No Vehicle | 0 (0.0%) | 0 (0.0%) |
| 1 Vehicle | 16 (22.5%) | 0 (0.0%) |
| 2 Vehicles | 0 (0.0%) | 0 (0.0%) |
| 3 Vehicles | 50 (70.4%) | 17 (73.9%) |
| 4 Vehicles | 5 (7.0%) | 6 (26.1%) |
| 5 or more Vehicles | 0 (0.0%) | 0 (0.0%) |
| Total | 71 (100.0%) | 23 (100.0%) |
Commute Time in San Mar
The most frequently occuring commute durations in San Mar are 30 to 34 minutes (66 commuters, 69.5%), 15 to 19 minutes (23 commuters, 24.2%), and 25 to 29 minutes (5 commuters, 5.3%).
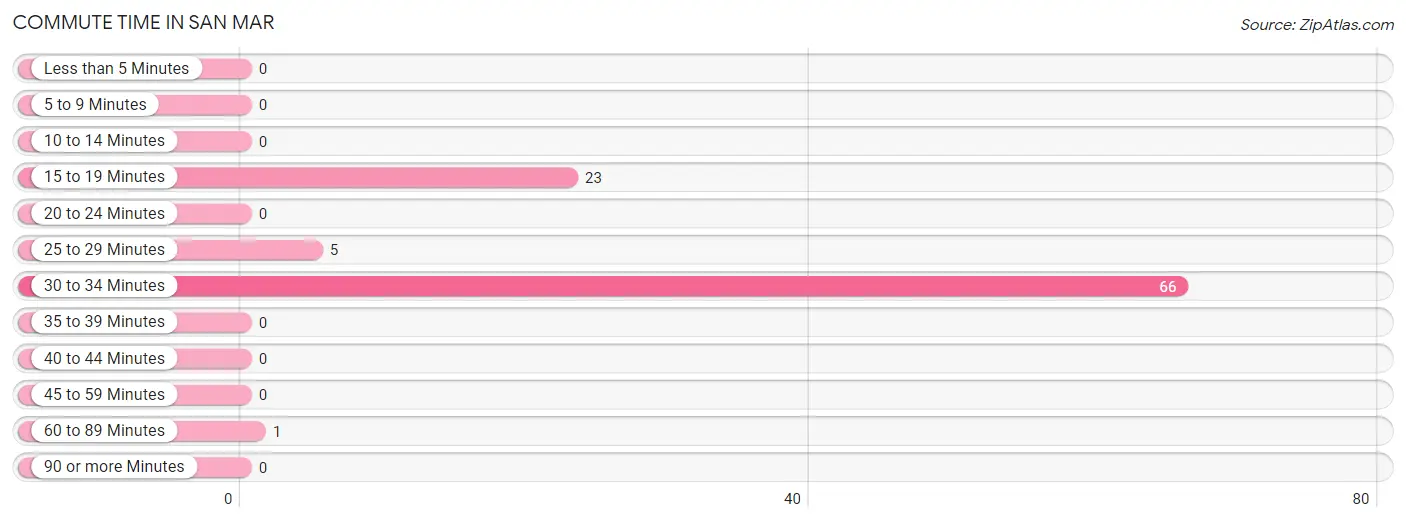
| Commute Time | # Commuters | % Commuters |
| Less than 5 Minutes | 0 | 0.0% |
| 5 to 9 Minutes | 0 | 0.0% |
| 10 to 14 Minutes | 0 | 0.0% |
| 15 to 19 Minutes | 23 | 24.2% |
| 20 to 24 Minutes | 0 | 0.0% |
| 25 to 29 Minutes | 5 | 5.3% |
| 30 to 34 Minutes | 66 | 69.5% |
| 35 to 39 Minutes | 0 | 0.0% |
| 40 to 44 Minutes | 0 | 0.0% |
| 45 to 59 Minutes | 0 | 0.0% |
| 60 to 89 Minutes | 1 | 1.1% |
| 90 or more Minutes | 0 | 0.0% |
Commute Time by Sex in San Mar
The most common commute times in San Mar are 30 to 34 minutes (66 commuters, 91.7%) for males and 15 to 19 minutes (23 commuters, 100.0%) for females.
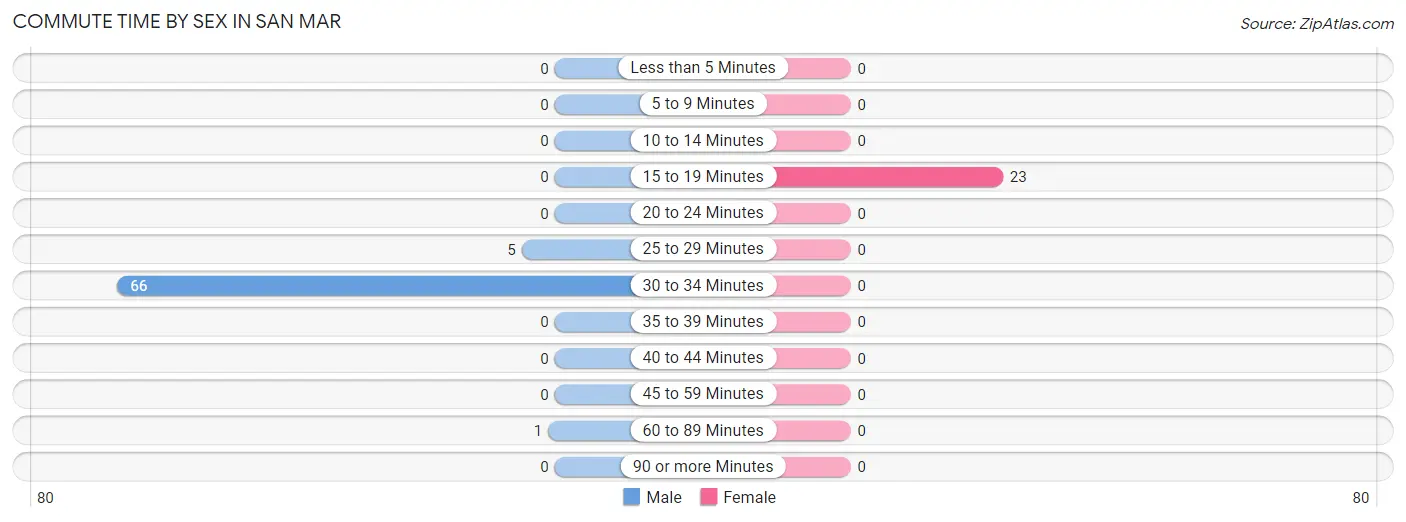
| Commute Time | Male | Female |
| Less than 5 Minutes | 0 (0.0%) | 0 (0.0%) |
| 5 to 9 Minutes | 0 (0.0%) | 0 (0.0%) |
| 10 to 14 Minutes | 0 (0.0%) | 0 (0.0%) |
| 15 to 19 Minutes | 0 (0.0%) | 23 (100.0%) |
| 20 to 24 Minutes | 0 (0.0%) | 0 (0.0%) |
| 25 to 29 Minutes | 5 (6.9%) | 0 (0.0%) |
| 30 to 34 Minutes | 66 (91.7%) | 0 (0.0%) |
| 35 to 39 Minutes | 0 (0.0%) | 0 (0.0%) |
| 40 to 44 Minutes | 0 (0.0%) | 0 (0.0%) |
| 45 to 59 Minutes | 0 (0.0%) | 0 (0.0%) |
| 60 to 89 Minutes | 1 (1.4%) | 0 (0.0%) |
| 90 or more Minutes | 0 (0.0%) | 0 (0.0%) |
Time of Departure to Work by Sex in San Mar
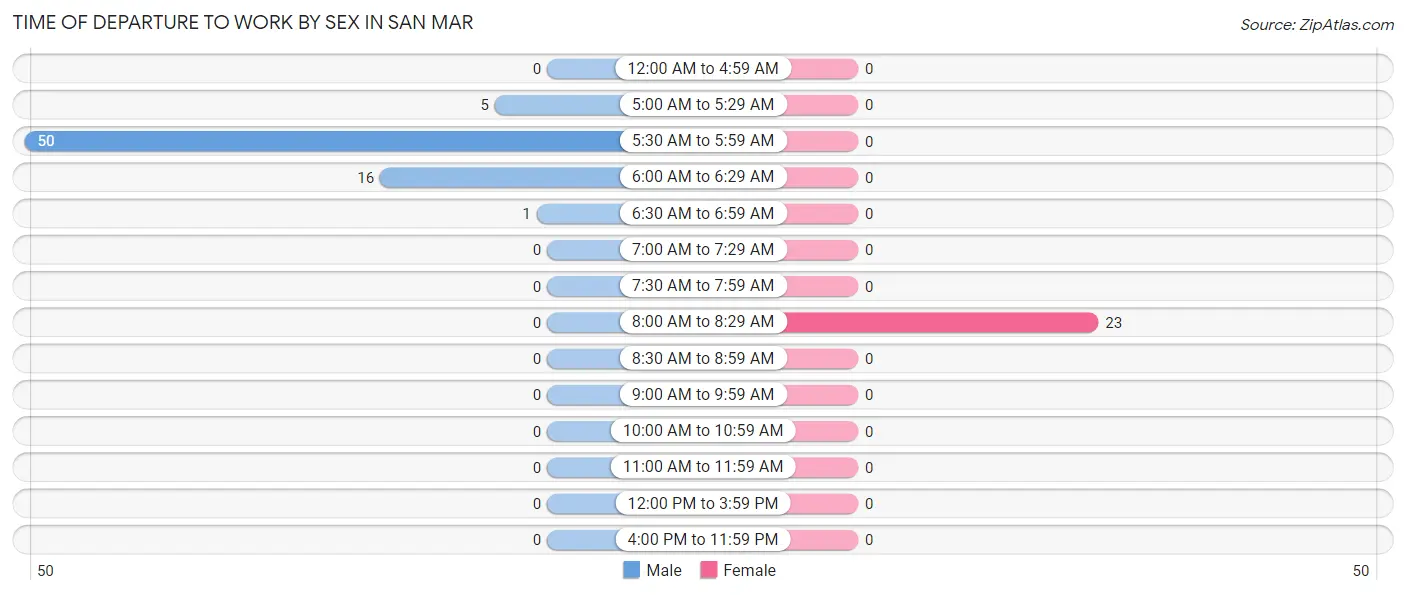
The most frequent times of departure to work in San Mar are 5:30 AM to 5:59 AM (50, 69.4%) for males and 8:00 AM to 8:29 AM (23, 100.0%) for females.
| Time of Departure | Male | Female |
| 12:00 AM to 4:59 AM | 0 (0.0%) | 0 (0.0%) |
| 5:00 AM to 5:29 AM | 5 (6.9%) | 0 (0.0%) |
| 5:30 AM to 5:59 AM | 50 (69.4%) | 0 (0.0%) |
| 6:00 AM to 6:29 AM | 16 (22.2%) | 0 (0.0%) |
| 6:30 AM to 6:59 AM | 1 (1.4%) | 0 (0.0%) |
| 7:00 AM to 7:29 AM | 0 (0.0%) | 0 (0.0%) |
| 7:30 AM to 7:59 AM | 0 (0.0%) | 0 (0.0%) |
| 8:00 AM to 8:29 AM | 0 (0.0%) | 23 (100.0%) |
| 8:30 AM to 8:59 AM | 0 (0.0%) | 0 (0.0%) |
| 9:00 AM to 9:59 AM | 0 (0.0%) | 0 (0.0%) |
| 10:00 AM to 10:59 AM | 0 (0.0%) | 0 (0.0%) |
| 11:00 AM to 11:59 AM | 0 (0.0%) | 0 (0.0%) |
| 12:00 PM to 3:59 PM | 0 (0.0%) | 0 (0.0%) |
| 4:00 PM to 11:59 PM | 0 (0.0%) | 0 (0.0%) |
| Total | 72 (100.0%) | 23 (100.0%) |
Housing Occupancy in San Mar
Occupancy by Ownership in San Mar
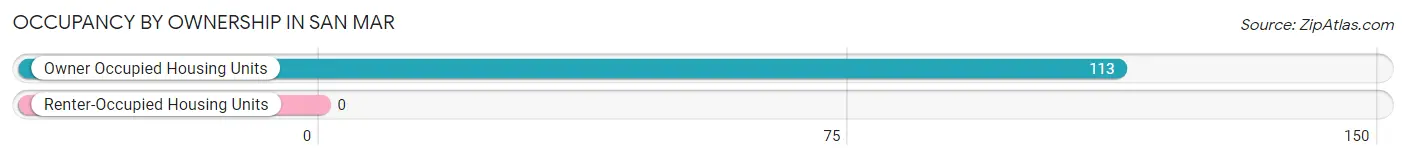
Of the total 113 dwellings in San Mar, owner-occupied units account for 113 (100.0%), while renter-occupied units make up 0 (0.0%).
| Occupancy | # Housing Units | % Housing Units |
| Owner Occupied Housing Units | 113 | 100.0% |
| Renter-Occupied Housing Units | 0 | 0.0% |
| Total Occupied Housing Units | 113 | 100.0% |
Occupancy by Household Size in San Mar
| Household Size | # Housing Units | % Housing Units |
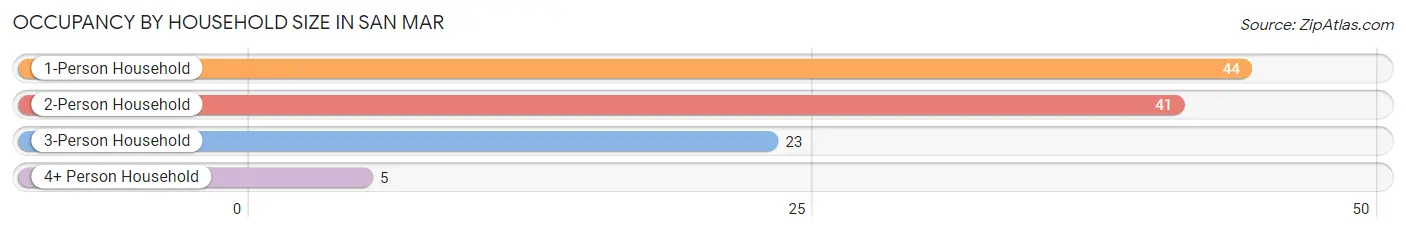
| 1-Person Household | 44 | 38.9% |
| 2-Person Household | 41 | 36.3% |
| 3-Person Household | 23 | 20.3% |
| 4+ Person Household | 5 | 4.4% |
| Total Housing Units | 113 | 100.0% |
Occupancy by Ownership by Household Size in San Mar
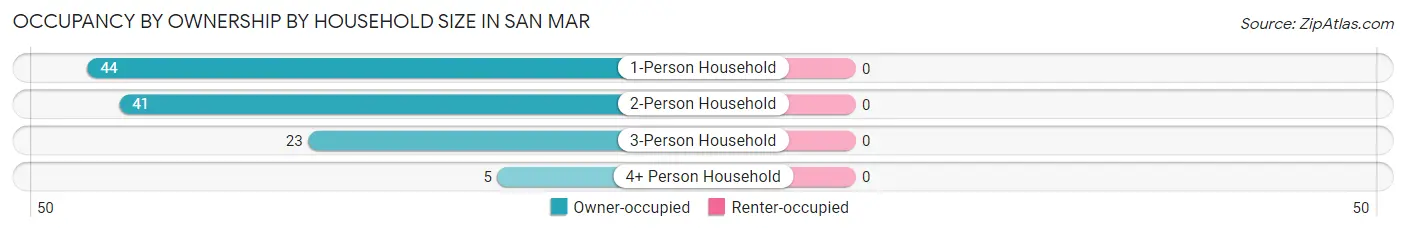
| Household Size | Owner-occupied | Renter-occupied |
| 1-Person Household | 44 (100.0%) | 0 (0.0%) |
| 2-Person Household | 41 (100.0%) | 0 (0.0%) |
| 3-Person Household | 23 (100.0%) | 0 (0.0%) |
| 4+ Person Household | 5 (100.0%) | 0 (0.0%) |
| Total Housing Units | 113 (100.0%) | 0 (0.0%) |
Occupancy by Educational Attainment in San Mar
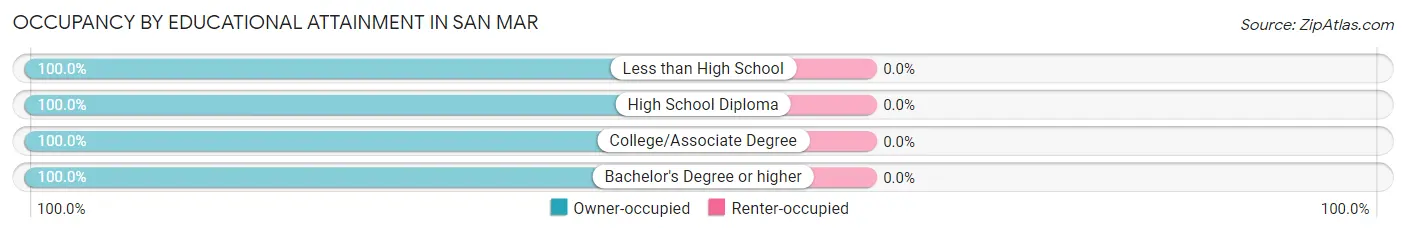
| Household Size | Owner-occupied | Renter-occupied |
| Less than High School | 24 (100.0%) | 0 (0.0%) |
| High School Diploma | 71 (100.0%) | 0 (0.0%) |
| College/Associate Degree | 5 (100.0%) | 0 (0.0%) |
| Bachelor's Degree or higher | 13 (100.0%) | 0 (0.0%) |
Occupancy by Age of Householder in San Mar
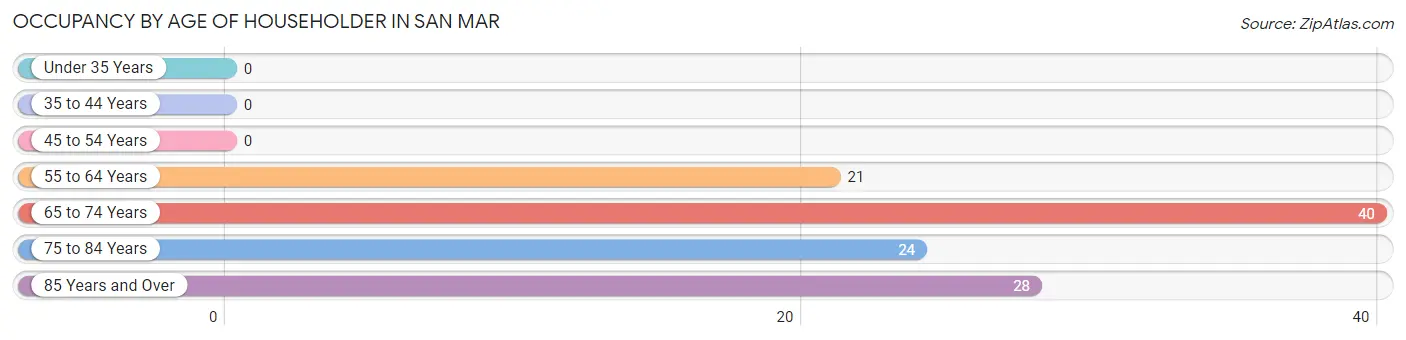
| Age Bracket | # Households | % Households |
| Under 35 Years | 0 | 0.0% |
| 35 to 44 Years | 0 | 0.0% |
| 45 to 54 Years | 0 | 0.0% |
| 55 to 64 Years | 21 | 18.6% |
| 65 to 74 Years | 40 | 35.4% |
| 75 to 84 Years | 24 | 21.2% |
| 85 Years and Over | 28 | 24.8% |
| Total | 113 | 100.0% |
Housing Finances in San Mar
Median Income by Occupancy in San Mar
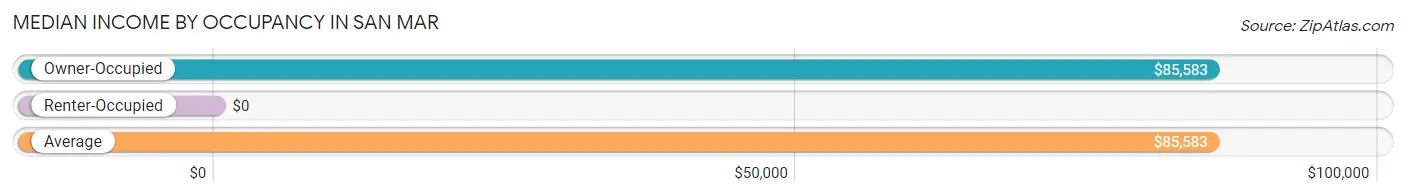
| Occupancy Type | # Households | Median Income |
| Owner-Occupied | 113 (100.0%) | $85,583 |
| Renter-Occupied | 0 (0.0%) | $0 |
| Average | 113 (100.0%) | $85,583 |
Occupancy by Householder Income Bracket in San Mar
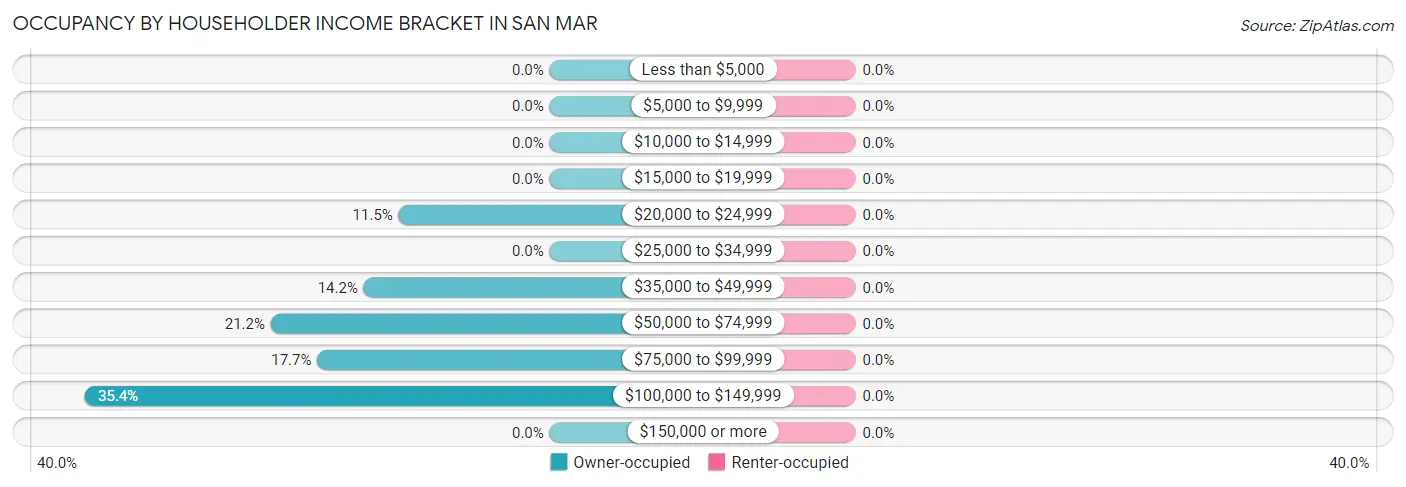
| Income Bracket | Owner-occupied | Renter-occupied |
| Less than $5,000 | 0 (0.0%) | 0 (0.0%) |
| $5,000 to $9,999 | 0 (0.0%) | 0 (0.0%) |
| $10,000 to $14,999 | 0 (0.0%) | 0 (0.0%) |
| $15,000 to $19,999 | 0 (0.0%) | 0 (0.0%) |
| $20,000 to $24,999 | 13 (11.5%) | 0 (0.0%) |
| $25,000 to $34,999 | 0 (0.0%) | 0 (0.0%) |
| $35,000 to $49,999 | 16 (14.2%) | 0 (0.0%) |
| $50,000 to $74,999 | 24 (21.2%) | 0 (0.0%) |
| $75,000 to $99,999 | 20 (17.7%) | 0 (0.0%) |
| $100,000 to $149,999 | 40 (35.4%) | 0 (0.0%) |
| $150,000 or more | 0 (0.0%) | 0 (0.0%) |
| Total | 113 (100.0%) | 0 (0.0%) |
Monthly Housing Cost Tiers in San Mar
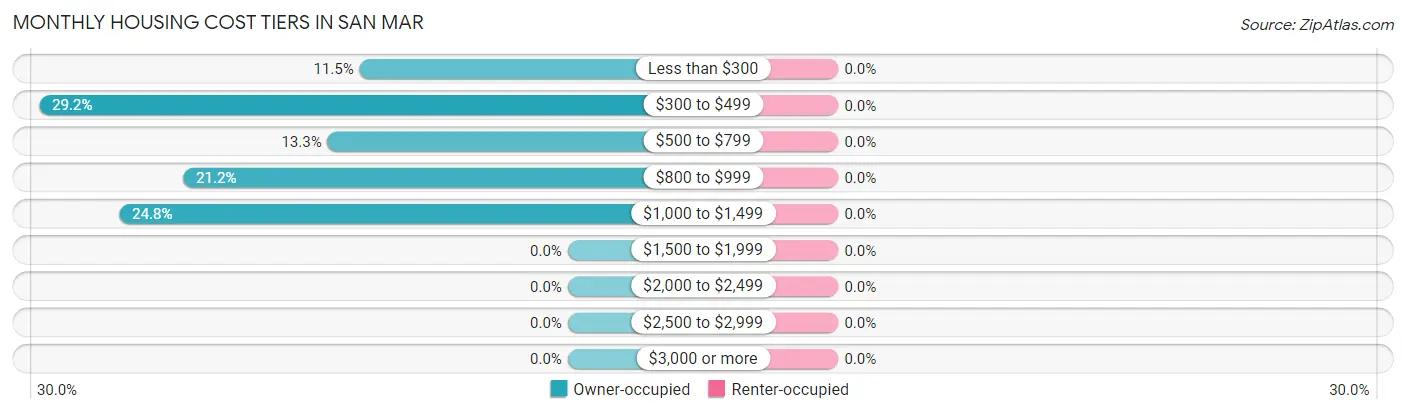
| Monthly Cost | Owner-occupied | Renter-occupied |
| Less than $300 | 13 (11.5%) | 0 (0.0%) |
| $300 to $499 | 33 (29.2%) | 0 (0.0%) |
| $500 to $799 | 15 (13.3%) | 0 (0.0%) |
| $800 to $999 | 24 (21.2%) | 0 (0.0%) |
| $1,000 to $1,499 | 28 (24.8%) | 0 (0.0%) |
| $1,500 to $1,999 | 0 (0.0%) | 0 (0.0%) |
| $2,000 to $2,499 | 0 (0.0%) | 0 (0.0%) |
| $2,500 to $2,999 | 0 (0.0%) | 0 (0.0%) |
| $3,000 or more | 0 (0.0%) | 0 (0.0%) |
| Total | 113 (100.0%) | 0 (0.0%) |
Physical Housing Characteristics in San Mar
Housing Structures in San Mar
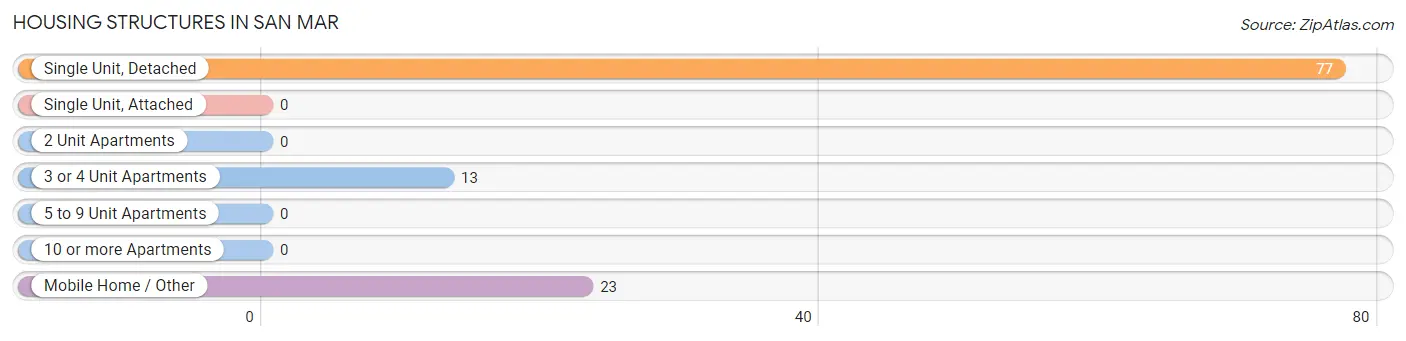
| Structure Type | # Housing Units | % Housing Units |
| Single Unit, Detached | 77 | 68.1% |
| Single Unit, Attached | 0 | 0.0% |
| 2 Unit Apartments | 0 | 0.0% |
| 3 or 4 Unit Apartments | 13 | 11.5% |
| 5 to 9 Unit Apartments | 0 | 0.0% |
| 10 or more Apartments | 0 | 0.0% |
| Mobile Home / Other | 23 | 20.3% |
| Total | 113 | 100.0% |
Housing Structures by Occupancy in San Mar
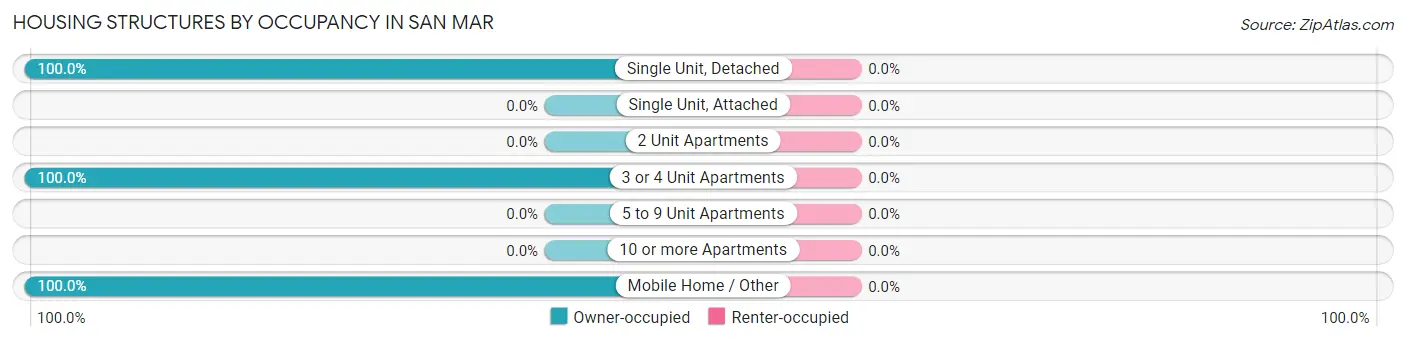
| Structure Type | Owner-occupied | Renter-occupied |
| Single Unit, Detached | 77 (100.0%) | 0 (0.0%) |
| Single Unit, Attached | 0 (0.0%) | 0 (0.0%) |
| 2 Unit Apartments | 0 (0.0%) | 0 (0.0%) |
| 3 or 4 Unit Apartments | 13 (100.0%) | 0 (0.0%) |
| 5 to 9 Unit Apartments | 0 (0.0%) | 0 (0.0%) |
| 10 or more Apartments | 0 (0.0%) | 0 (0.0%) |
| Mobile Home / Other | 23 (100.0%) | 0 (0.0%) |
| Total | 113 (100.0%) | 0 (0.0%) |
Housing Structures by Number of Rooms in San Mar
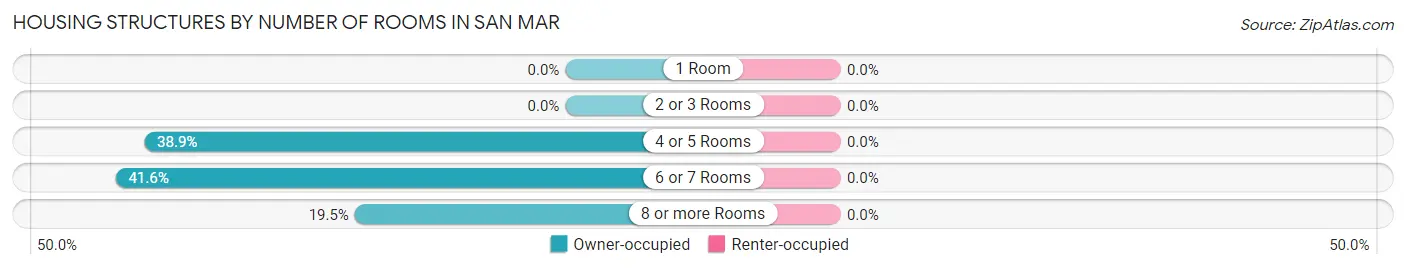
| Number of Rooms | Owner-occupied | Renter-occupied |
| 1 Room | 0 (0.0%) | 0 (0.0%) |
| 2 or 3 Rooms | 0 (0.0%) | 0 (0.0%) |
| 4 or 5 Rooms | 44 (38.9%) | 0 (0.0%) |
| 6 or 7 Rooms | 47 (41.6%) | 0 (0.0%) |
| 8 or more Rooms | 22 (19.5%) | 0 (0.0%) |
| Total | 113 (100.0%) | 0 (0.0%) |
Housing Structure by Heating Type in San Mar
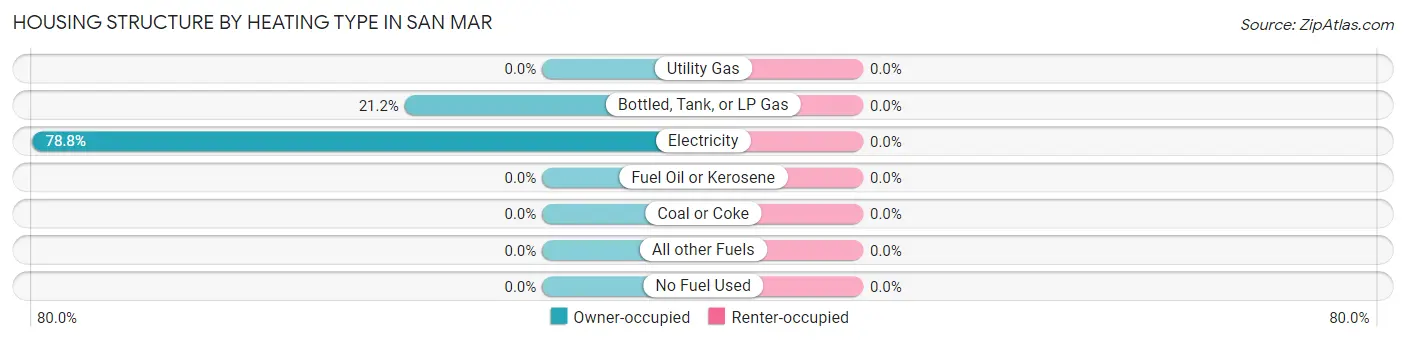
| Heating Type | Owner-occupied | Renter-occupied |
| Utility Gas | 0 (0.0%) | 0 (0.0%) |
| Bottled, Tank, or LP Gas | 24 (21.2%) | 0 (0.0%) |
| Electricity | 89 (78.8%) | 0 (0.0%) |
| Fuel Oil or Kerosene | 0 (0.0%) | 0 (0.0%) |
| Coal or Coke | 0 (0.0%) | 0 (0.0%) |
| All other Fuels | 0 (0.0%) | 0 (0.0%) |
| No Fuel Used | 0 (0.0%) | 0 (0.0%) |
| Total | 113 (100.0%) | 0 (0.0%) |
Household Vehicle Usage in San Mar
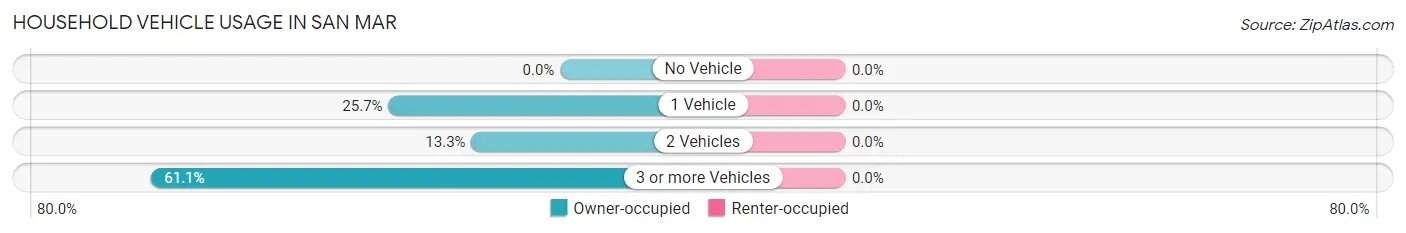
| Vehicles per Household | Owner-occupied | Renter-occupied |
| No Vehicle | 0 (0.0%) | 0 (0.0%) |
| 1 Vehicle | 29 (25.7%) | 0 (0.0%) |
| 2 Vehicles | 15 (13.3%) | 0 (0.0%) |
| 3 or more Vehicles | 69 (61.1%) | 0 (0.0%) |
| Total | 113 (100.0%) | 0 (0.0%) |
Real Estate & Mortgages in San Mar
Real Estate and Mortgage Overview in San Mar
| Characteristic | Without Mortgage | With Mortgage |
| Housing Units | 85 | 28 |
| Median Property Value | $189,100 | $0 |
| Median Household Income | $53,906 | $0 |
| Monthly Housing Costs | $479 | $0 |
| Real Estate Taxes | $2,518 | $0 |
Property Value by Mortgage Status in San Mar
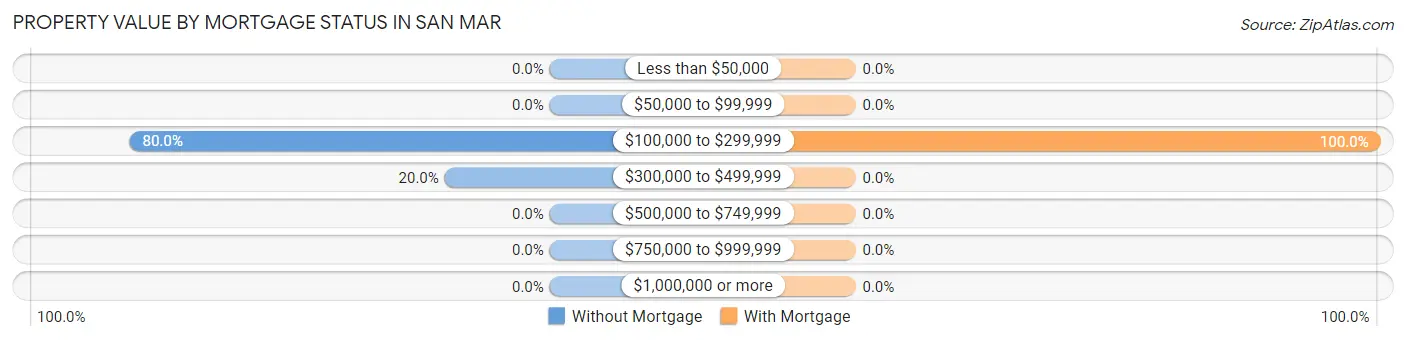
| Property Value | Without Mortgage | With Mortgage |
| Less than $50,000 | 0 (0.0%) | 0 (0.0%) |
| $50,000 to $99,999 | 0 (0.0%) | 0 (0.0%) |
| $100,000 to $299,999 | 68 (80.0%) | 28 (100.0%) |
| $300,000 to $499,999 | 17 (20.0%) | 0 (0.0%) |
| $500,000 to $749,999 | 0 (0.0%) | 0 (0.0%) |
| $750,000 to $999,999 | 0 (0.0%) | 0 (0.0%) |
| $1,000,000 or more | 0 (0.0%) | 0 (0.0%) |
| Total | 85 (100.0%) | 28 (100.0%) |
Household Income by Mortgage Status in San Mar
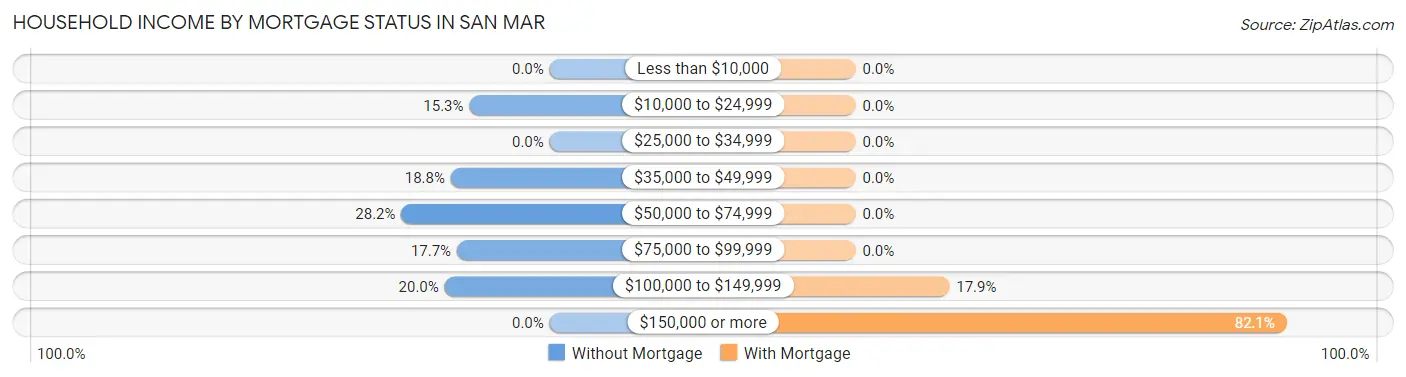
| Household Income | Without Mortgage | With Mortgage |
| Less than $10,000 | 0 (0.0%) | 0 (0.0%) |
| $10,000 to $24,999 | 13 (15.3%) | 0 (0.0%) |
| $25,000 to $34,999 | 0 (0.0%) | 0 (0.0%) |
| $35,000 to $49,999 | 16 (18.8%) | 0 (0.0%) |
| $50,000 to $74,999 | 24 (28.2%) | 0 (0.0%) |
| $75,000 to $99,999 | 15 (17.6%) | 0 (0.0%) |
| $100,000 to $149,999 | 17 (20.0%) | 5 (17.9%) |
| $150,000 or more | 0 (0.0%) | 23 (82.1%) |
| Total | 85 (100.0%) | 28 (100.0%) |
Property Value to Household Income Ratio in San Mar
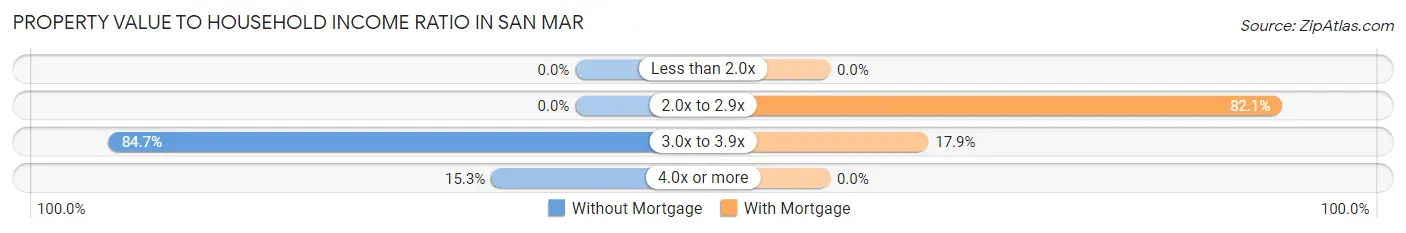
| Value-to-Income Ratio | Without Mortgage | With Mortgage |
| Less than 2.0x | 0 (0.0%) | 0 (0.0%) |
| 2.0x to 2.9x | 0 (0.0%) | 23 (82.1%) |
| 3.0x to 3.9x | 72 (84.7%) | 5 (17.9%) |
| 4.0x or more | 13 (15.3%) | 0 (0.0%) |
| Total | 85 (100.0%) | 28 (100.0%) |
Real Estate Taxes by Mortgage Status in San Mar
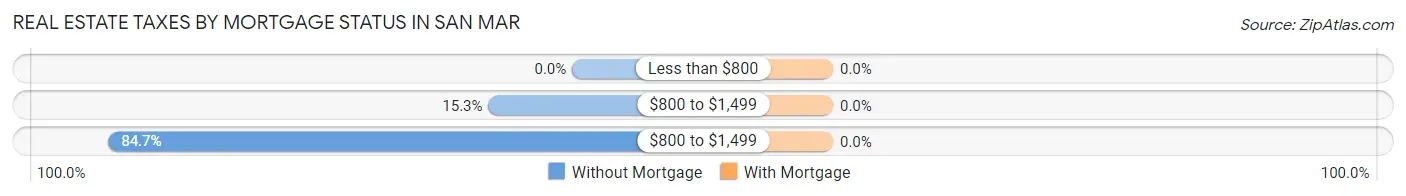
| Property Taxes | Without Mortgage | With Mortgage |
| Less than $800 | 0 (0.0%) | 0 (0.0%) |
| $800 to $1,499 | 13 (15.3%) | 0 (0.0%) |
| $800 to $1,499 | 72 (84.7%) | 0 (0.0%) |
| Total | 85 (100.0%) | 28 (100.0%) |
Health & Disability in San Mar
Health Insurance Coverage by Age in San Mar
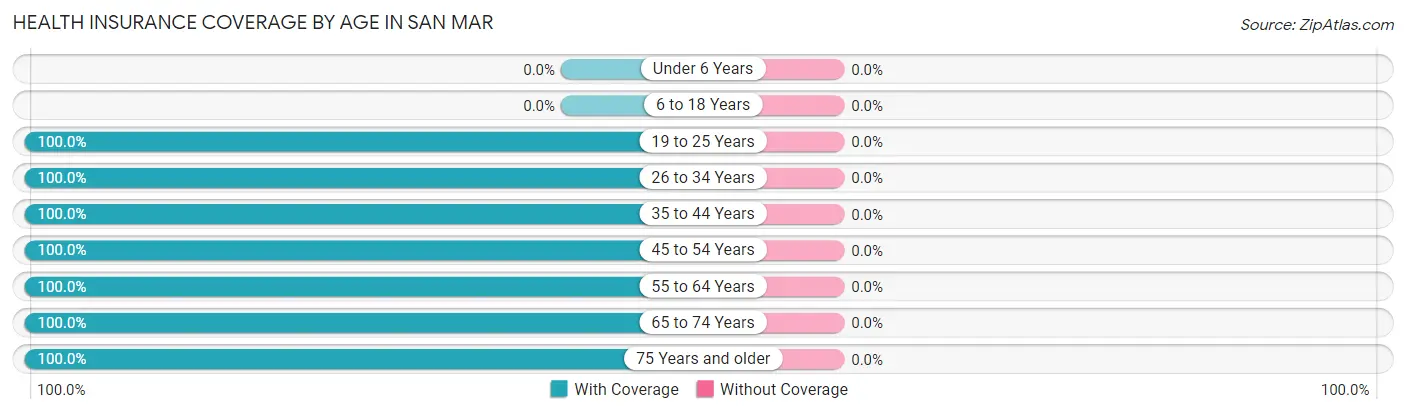
| Age Bracket | With Coverage | Without Coverage |
| Under 6 Years | 0 (0.0%) | 0 (0.0%) |
| 6 to 18 Years | 0 (0.0%) | 0 (0.0%) |
| 19 to 25 Years | 22 (100.0%) | 0 (0.0%) |
| 26 to 34 Years | 33 (100.0%) | 0 (0.0%) |
| 35 to 44 Years | 4 (100.0%) | 0 (0.0%) |
| 45 to 54 Years | 1 (100.0%) | 0 (0.0%) |
| 55 to 64 Years | 45 (100.0%) | 0 (0.0%) |
| 65 to 74 Years | 62 (100.0%) | 0 (0.0%) |
| 75 Years and older | 77 (100.0%) | 0 (0.0%) |
| Total | 244 (100.0%) | 0 (0.0%) |
Health Insurance Coverage by Citizenship Status in San Mar
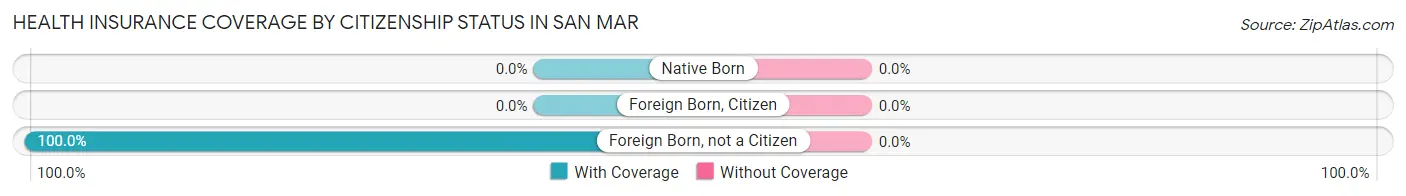
| Citizenship Status | With Coverage | Without Coverage |
| Native Born | 0 (0.0%) | 0 (0.0%) |
| Foreign Born, Citizen | 0 (0.0%) | 0 (0.0%) |
| Foreign Born, not a Citizen | 22 (100.0%) | 0 (0.0%) |
Health Insurance Coverage by Household Income in San Mar
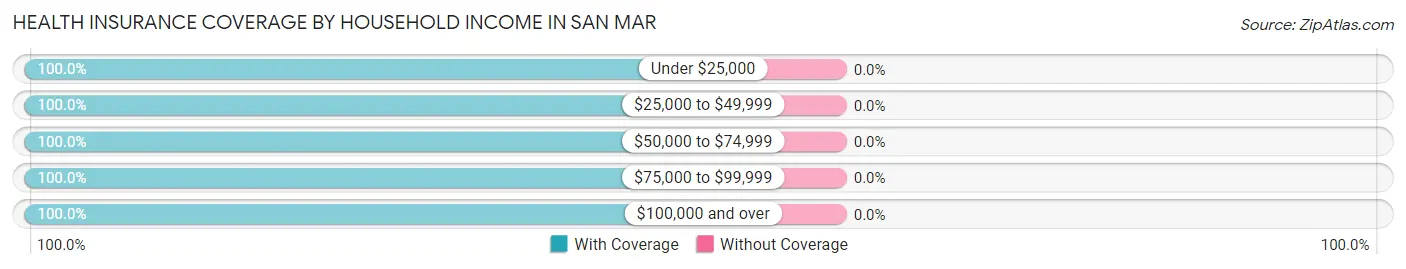
| Household Income | With Coverage | Without Coverage |
| Under $25,000 | 13 (100.0%) | 0 (0.0%) |
| $25,000 to $49,999 | 16 (100.0%) | 0 (0.0%) |
| $50,000 to $74,999 | 49 (100.0%) | 0 (0.0%) |
| $75,000 to $99,999 | 39 (100.0%) | 0 (0.0%) |
| $100,000 and over | 107 (100.0%) | 0 (0.0%) |
Public vs Private Health Insurance Coverage by Age in San Mar
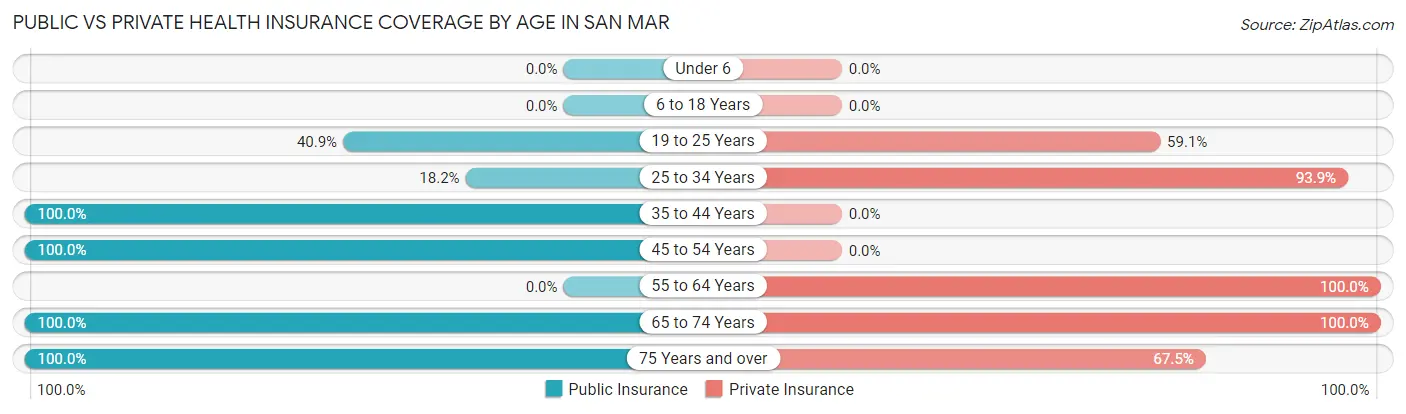
| Age Bracket | Public Insurance | Private Insurance |
| Under 6 | 0 (0.0%) | 0 (0.0%) |
| 6 to 18 Years | 0 (0.0%) | 0 (0.0%) |
| 19 to 25 Years | 9 (40.9%) | 13 (59.1%) |
| 25 to 34 Years | 6 (18.2%) | 31 (93.9%) |
| 35 to 44 Years | 4 (100.0%) | 0 (0.0%) |
| 45 to 54 Years | 1 (100.0%) | 0 (0.0%) |
| 55 to 64 Years | 0 (0.0%) | 45 (100.0%) |
| 65 to 74 Years | 62 (100.0%) | 62 (100.0%) |
| 75 Years and over | 77 (100.0%) | 52 (67.5%) |
| Total | 159 (65.2%) | 203 (83.2%) |
Disability Status by Sex by Age in San Mar
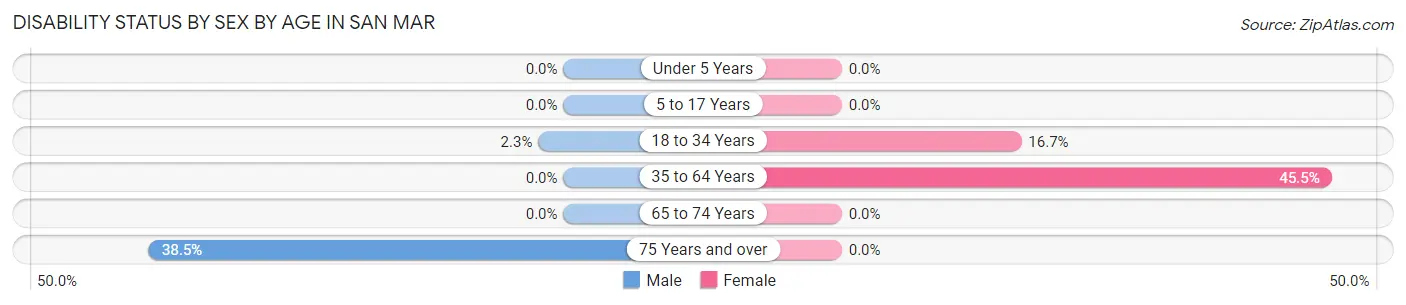
| Age Bracket | Male | Female |
| Under 5 Years | 0 (0.0%) | 0 (0.0%) |
| 5 to 17 Years | 0 (0.0%) | 0 (0.0%) |
| 18 to 34 Years | 1 (2.3%) | 2 (16.7%) |
| 35 to 64 Years | 0 (0.0%) | 5 (45.5%) |
| 65 to 74 Years | 0 (0.0%) | 0 (0.0%) |
| 75 Years and over | 15 (38.5%) | 0 (0.0%) |
Disability Class by Sex by Age in San Mar
Disability Class: Hearing Difficulty
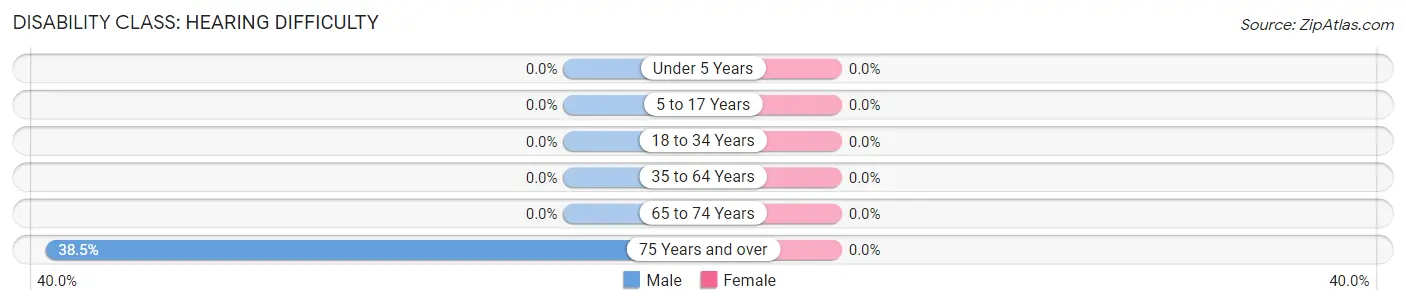
| Age Bracket | Male | Female |
| Under 5 Years | 0 (0.0%) | 0 (0.0%) |
| 5 to 17 Years | 0 (0.0%) | 0 (0.0%) |
| 18 to 34 Years | 0 (0.0%) | 0 (0.0%) |
| 35 to 64 Years | 0 (0.0%) | 0 (0.0%) |
| 65 to 74 Years | 0 (0.0%) | 0 (0.0%) |
| 75 Years and over | 15 (38.5%) | 0 (0.0%) |
Disability Class: Vision Difficulty
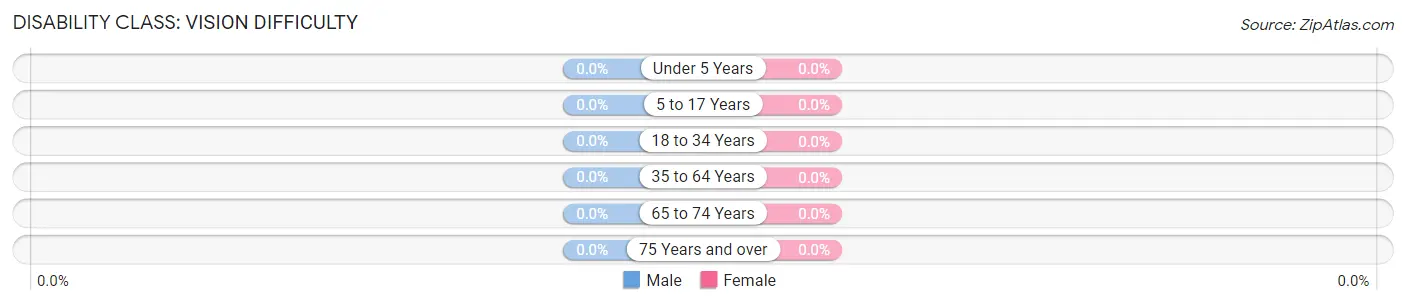
| Age Bracket | Male | Female |
| Under 5 Years | 0 (0.0%) | 0 (0.0%) |
| 5 to 17 Years | 0 (0.0%) | 0 (0.0%) |
| 18 to 34 Years | 0 (0.0%) | 0 (0.0%) |
| 35 to 64 Years | 0 (0.0%) | 0 (0.0%) |
| 65 to 74 Years | 0 (0.0%) | 0 (0.0%) |
| 75 Years and over | 0 (0.0%) | 0 (0.0%) |
Disability Class: Cognitive Difficulty
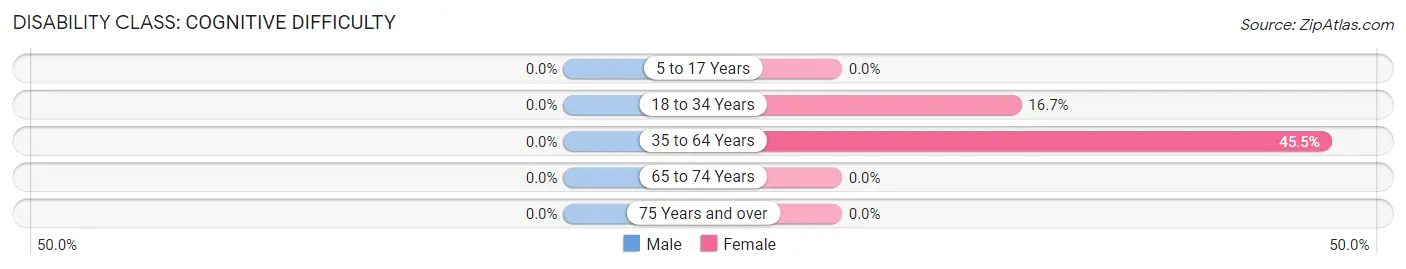
| Age Bracket | Male | Female |
| 5 to 17 Years | 0 (0.0%) | 0 (0.0%) |
| 18 to 34 Years | 0 (0.0%) | 2 (16.7%) |
| 35 to 64 Years | 0 (0.0%) | 5 (45.5%) |
| 65 to 74 Years | 0 (0.0%) | 0 (0.0%) |
| 75 Years and over | 0 (0.0%) | 0 (0.0%) |
Disability Class: Ambulatory Difficulty
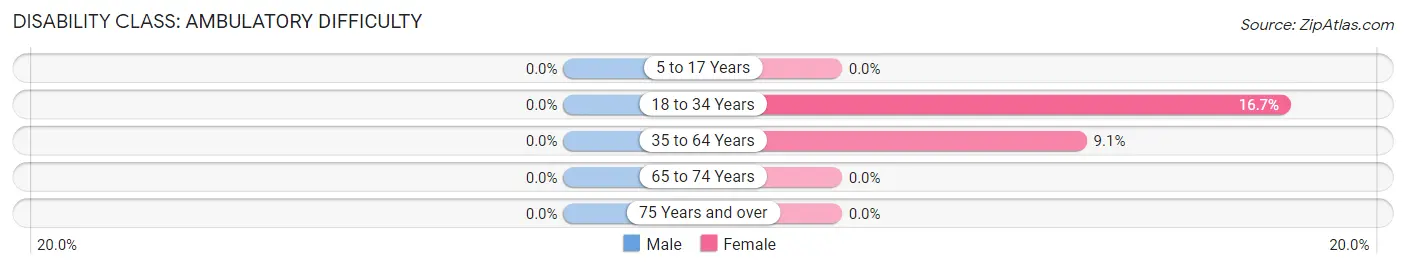
| Age Bracket | Male | Female |
| 5 to 17 Years | 0 (0.0%) | 0 (0.0%) |
| 18 to 34 Years | 0 (0.0%) | 2 (16.7%) |
| 35 to 64 Years | 0 (0.0%) | 1 (9.1%) |
| 65 to 74 Years | 0 (0.0%) | 0 (0.0%) |
| 75 Years and over | 0 (0.0%) | 0 (0.0%) |
Disability Class: Self-Care Difficulty

| Age Bracket | Male | Female |
| 5 to 17 Years | 0 (0.0%) | 0 (0.0%) |
| 18 to 34 Years | 0 (0.0%) | 2 (16.7%) |
| 35 to 64 Years | 0 (0.0%) | 1 (9.1%) |
| 65 to 74 Years | 0 (0.0%) | 0 (0.0%) |
| 75 Years and over | 0 (0.0%) | 0 (0.0%) |
Technology Access in San Mar
Computing Device Access in San Mar
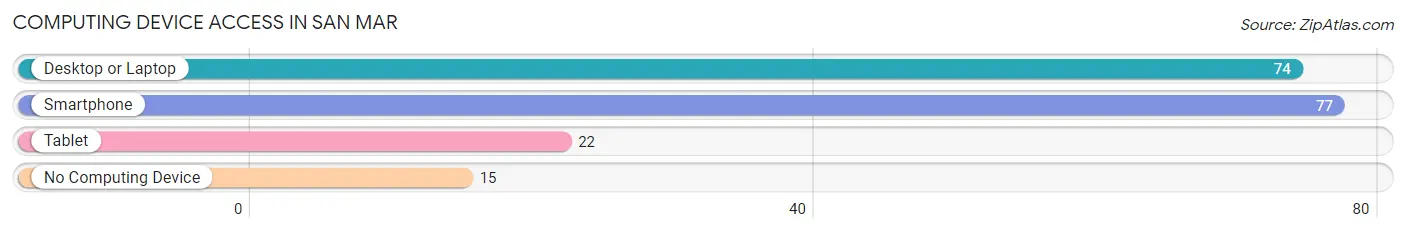
| Device Type | # Households | % Households |
| Desktop or Laptop | 74 | 65.5% |
| Smartphone | 77 | 68.1% |
| Tablet | 22 | 19.5% |
| No Computing Device | 15 | 13.3% |
| Total | 113 | 100.0% |
Internet Access in San Mar
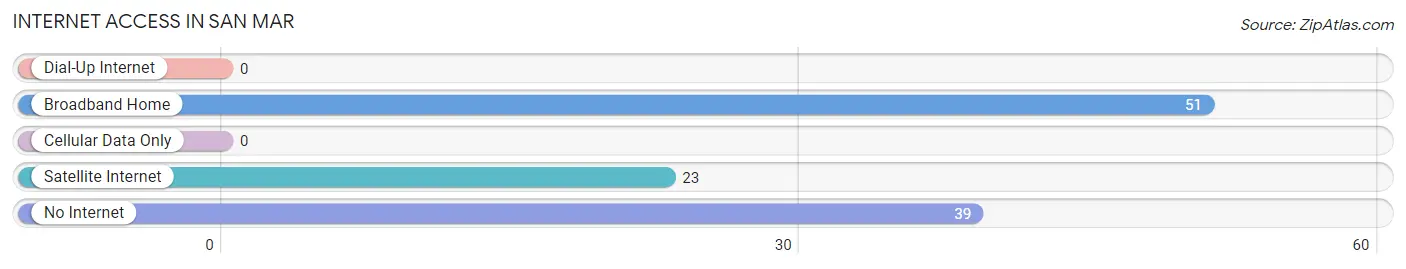
| Internet Type | # Households | % Households |
| Dial-Up Internet | 0 | 0.0% |
| Broadband Home | 51 | 45.1% |
| Cellular Data Only | 0 | 0.0% |
| Satellite Internet | 23 | 20.3% |
| No Internet | 39 | 34.5% |
| Total | 113 | 100.0% |
San Mar Summary
San Mar is a small town located in Maryland, United States. It is situated in the northern part of the state, near the border with Pennsylvania. The town has a population of approximately 2,000 people and is part of the Washington-Arlington-Alexandria metropolitan area.
History
San Mar was founded in 1790 by a group of settlers from Pennsylvania. The town was named after the San Mar River, which runs through the area. The settlers were attracted to the area due to its fertile soil and abundant natural resources. The town quickly grew and became a thriving agricultural community.
In the early 19th century, the town was home to a number of mills and factories, which provided employment for many of the town’s residents. The town also had a number of churches, schools, and other public buildings.
In the late 19th century, the town began to decline as the local economy shifted away from agriculture and towards industry. The town’s population decreased and many of the businesses and factories closed.
In the early 20th century, the town began to experience a resurgence as new businesses and industries moved into the area. The town’s population began to grow again and the local economy began to diversify.
Geography
San Mar is located in the northern part of Maryland, near the border with Pennsylvania. The town is situated in a rural area and is surrounded by rolling hills and farmland. The town is located near the San Mar River, which runs through the area.
The town has a total area of 1.2 square miles, all of which is land. The town has a humid subtropical climate, with hot, humid summers and cold, wet winters.
Economy
The economy of San Mar is largely based on agriculture and tourism. The town is home to a number of farms, which produce a variety of crops, including corn, soybeans, and wheat. The town also has a number of wineries and breweries, which attract tourists from around the region.
The town also has a number of small businesses, including restaurants, shops, and other services. The town is also home to a number of manufacturing companies, which produce a variety of products, including furniture, clothing, and electronics.
Demographics
As of the 2010 census, the population of San Mar was 2,000 people. The town has a population density of 1,636 people per square mile. The town is predominantly white, with a small African American population. The median household income is $50,000 and the median home value is $150,000.
The town has a number of public schools, including an elementary school, a middle school, and a high school. The town also has a number of private schools, including a Catholic school and a Christian school.
Conclusion
San Mar is a small town located in Maryland, United States. It is situated in the northern part of the state, near the border with Pennsylvania. The town has a population of approximately 2,000 people and is part of the Washington-Arlington-Alexandria metropolitan area. The town’s economy is largely based on agriculture and tourism, and the town has a number of small businesses, including restaurants, shops, and other services. The town is predominantly white, with a small African American population. The town has a number of public schools, including an elementary school, a middle school, and a high school.
Common Questions
What is Per Capita Income in San Mar?
Per Capita income in San Mar is $30,346.
What is the Median Family Income in San Mar?
Median Family Income in San Mar is $130,054.
What is the Median Household income in San Mar?
Median Household Income in San Mar is $85,583.
What is Inequality or Gini Index in San Mar?
Inequality or Gini Index in San Mar is 0.26.
What is the Total Population of San Mar?
Total Population of San Mar is 353.
What is the Total Male Population of San Mar?
Total Male Population of San Mar is 179.
What is the Total Female Population of San Mar?
Total Female Population of San Mar is 174.
What is the Ratio of Males per 100 Females in San Mar?
There are 102.87 Males per 100 Females in San Mar.
What is the Ratio of Females per 100 Males in San Mar?
There are 97.21 Females per 100 Males in San Mar.
What is the Median Population Age in San Mar?
Median Population Age in San Mar is 71.4 Years.
What is the Average Family Size in San Mar
Average Family Size in San Mar is 2.9 People.
What is the Average Household Size in San Mar
Average Household Size in San Mar is 2.0 People.
How Large is the Labor Force in San Mar?
There are 124 People in the Labor Forcein in San Mar.
What is the Percentage of People in the Labor Force in San Mar?
35.6% of People are in the Labor Force in San Mar.
What is the Unemployment Rate in San Mar?
Unemployment Rate in San Mar is 23.4%.