Mountain Lake Park, MD Map & Demographics
Mountain Lake Park Map
Mountain Lake Park Overview
$35,365
PER CAPITA INCOME
$72,353
AVG FAMILY INCOME
$55,000
AVG HOUSEHOLD INCOME
41.2%
WAGE / INCOME GAP [ % ]
58.8¢/ $1
WAGE / INCOME GAP [ $ ]
0.48
INEQUALITY / GINI INDEX
2,117
TOTAL POPULATION
1,014
MALE POPULATION
1,103
FEMALE POPULATION
91.93
MALES / 100 FEMALES
108.78
FEMALES / 100 MALES
44.3
MEDIAN AGE
2.6
AVG FAMILY SIZE
2.1
AVG HOUSEHOLD SIZE
1,078
LABOR FORCE [ PEOPLE ]
60.3%
PERCENT IN LABOR FORCE
7.4%
UNEMPLOYMENT RATE
Income in Mountain Lake Park
Income Overview in Mountain Lake Park
Per Capita Income in Mountain Lake Park is $35,365, while median incomes of families and households are $72,353 and $55,000 respectively.
| Characteristic | Number | Measure |
| Per Capita Income | 2,117 | $35,365 |
| Median Family Income | 594 | $72,353 |
| Mean Family Income | 594 | $99,218 |
| Median Household Income | 960 | $55,000 |
| Mean Household Income | 960 | $75,937 |
| Income Deficit | 594 | $0 |
| Wage / Income Gap (%) | 2,117 | 41.20% |
| Wage / Income Gap ($) | 2,117 | 58.80¢ per $1 |
| Gini / Inequality Index | 2,117 | 0.48 |
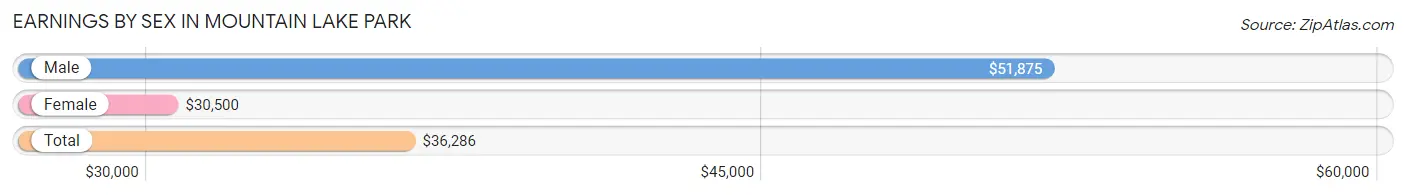
Earnings by Sex in Mountain Lake Park
Average Earnings in Mountain Lake Park are $36,286, $51,875 for men and $30,500 for women, a difference of 41.2%.
| Sex | Number | Average Earnings |
| Male | 581 (51.7%) | $51,875 |
| Female | 542 (48.3%) | $30,500 |
| Total | 1,123 (100.0%) | $36,286 |
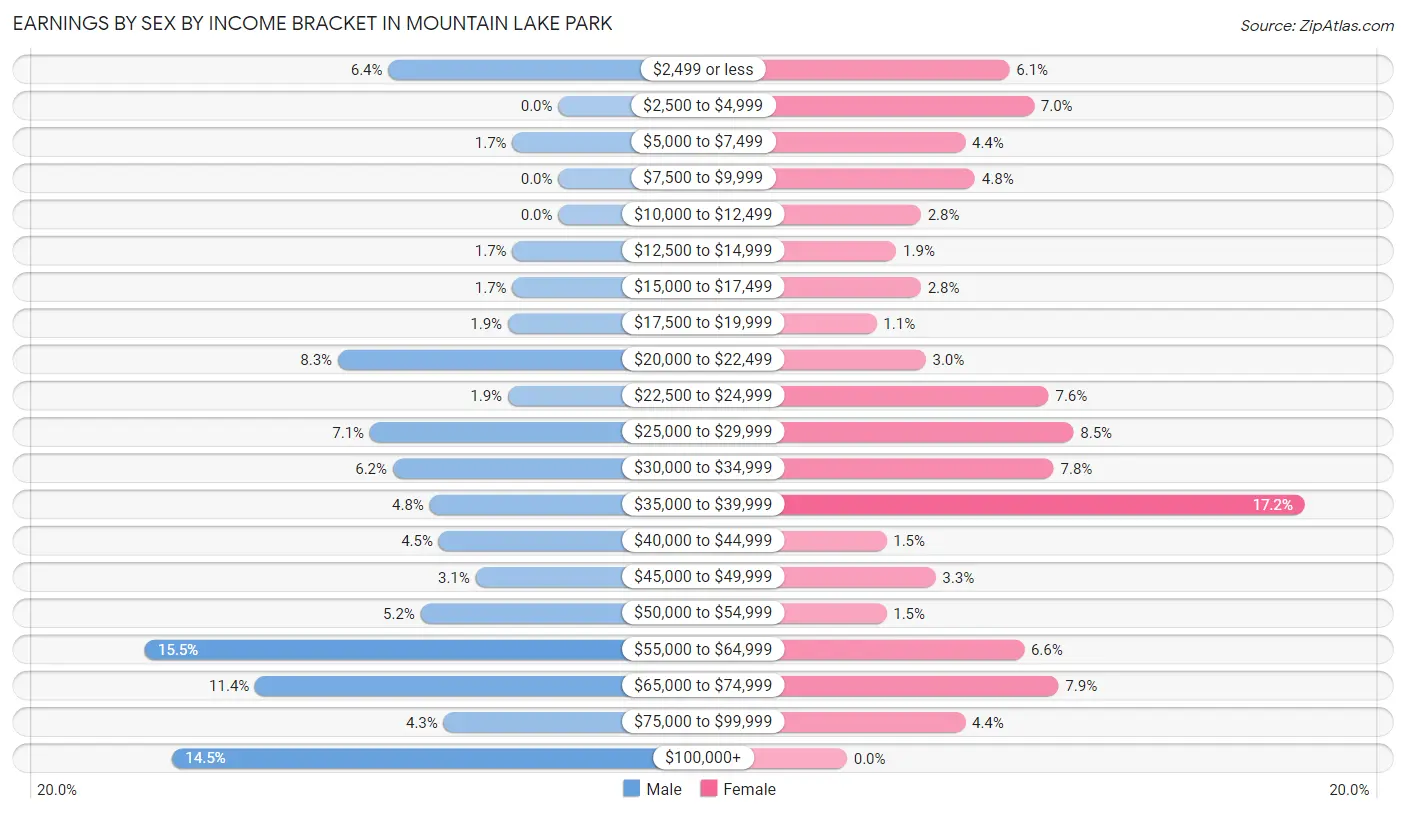
Earnings by Sex by Income Bracket in Mountain Lake Park
The most common earnings brackets in Mountain Lake Park are $55,000 to $64,999 for men (90 | 15.5%) and $35,000 to $39,999 for women (93 | 17.2%).
| Income | Male | Female |
| $2,499 or less | 37 (6.4%) | 33 (6.1%) |
| $2,500 to $4,999 | 0 (0.0%) | 38 (7.0%) |
| $5,000 to $7,499 | 10 (1.7%) | 24 (4.4%) |
| $7,500 to $9,999 | 0 (0.0%) | 26 (4.8%) |
| $10,000 to $12,499 | 0 (0.0%) | 15 (2.8%) |
| $12,500 to $14,999 | 10 (1.7%) | 10 (1.8%) |
| $15,000 to $17,499 | 10 (1.7%) | 15 (2.8%) |
| $17,500 to $19,999 | 11 (1.9%) | 6 (1.1%) |
| $20,000 to $22,499 | 48 (8.3%) | 16 (2.9%) |
| $22,500 to $24,999 | 11 (1.9%) | 41 (7.6%) |
| $25,000 to $29,999 | 41 (7.1%) | 46 (8.5%) |
| $30,000 to $34,999 | 36 (6.2%) | 42 (7.7%) |
| $35,000 to $39,999 | 28 (4.8%) | 93 (17.2%) |
| $40,000 to $44,999 | 26 (4.5%) | 8 (1.5%) |
| $45,000 to $49,999 | 18 (3.1%) | 18 (3.3%) |
| $50,000 to $54,999 | 30 (5.2%) | 8 (1.5%) |
| $55,000 to $64,999 | 90 (15.5%) | 36 (6.6%) |
| $65,000 to $74,999 | 66 (11.4%) | 43 (7.9%) |
| $75,000 to $99,999 | 25 (4.3%) | 24 (4.4%) |
| $100,000+ | 84 (14.5%) | 0 (0.0%) |
| Total | 581 (100.0%) | 542 (100.0%) |
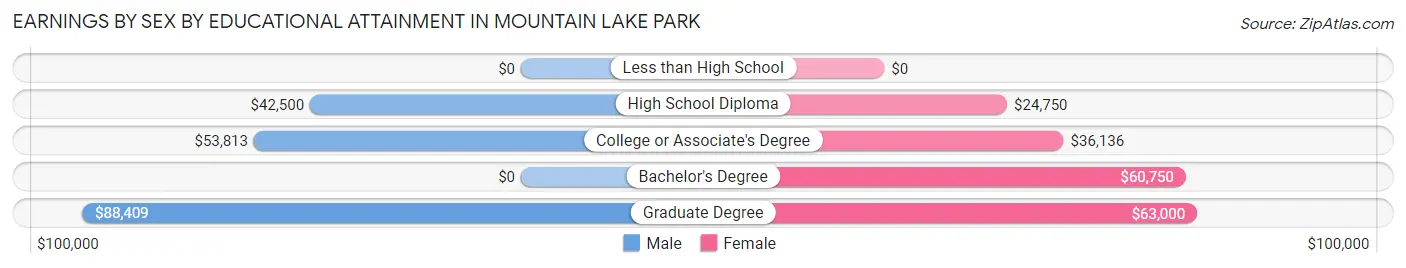
Earnings by Sex by Educational Attainment in Mountain Lake Park
Average earnings in Mountain Lake Park are $54,896 for men and $33,277 for women, a difference of 39.4%. Men with an educational attainment of graduate degree enjoy the highest average annual earnings of $88,409, while those with high school diploma education earn the least with $42,500. Women with an educational attainment of graduate degree earn the most with the average annual earnings of $63,000, while those with high school diploma education have the smallest earnings of $24,750.
| Educational Attainment | Male Income | Female Income |
| Less than High School | - | - |
| High School Diploma | $42,500 | $24,750 |
| College or Associate's Degree | $53,813 | $36,136 |
| Bachelor's Degree | - | - |
| Graduate Degree | $88,409 | $63,000 |
| Total | $54,896 | $33,277 |
Family Income in Mountain Lake Park
Family Income Brackets in Mountain Lake Park
According to the Mountain Lake Park family income data, there are 153 families falling into the $50,000 to $74,999 income range, which is the most common income bracket and makes up 25.8% of all families.
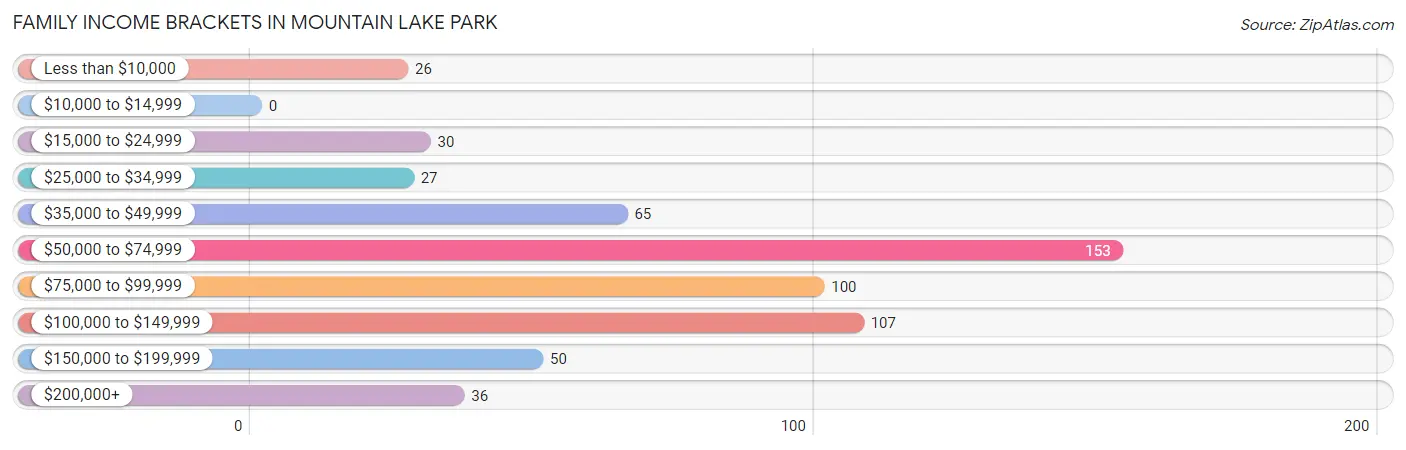
| Income Bracket | # Families | % Families |
| Less than $10,000 | 26 | 4.4% |
| $10,000 to $14,999 | 0 | 0.0% |
| $15,000 to $24,999 | 30 | 5.1% |
| $25,000 to $34,999 | 27 | 4.5% |
| $35,000 to $49,999 | 65 | 10.9% |
| $50,000 to $74,999 | 153 | 25.8% |
| $75,000 to $99,999 | 100 | 16.8% |
| $100,000 to $149,999 | 107 | 18.0% |
| $150,000 to $199,999 | 50 | 8.4% |
| $200,000+ | 36 | 6.1% |
Family Income by Famaliy Size in Mountain Lake Park
4-person families (73 | 12.3%) account for the highest median family income in Mountain Lake Park with $128,393 per family, while 2-person families (397 | 66.8%) have the highest median income of $34,081 per family member.
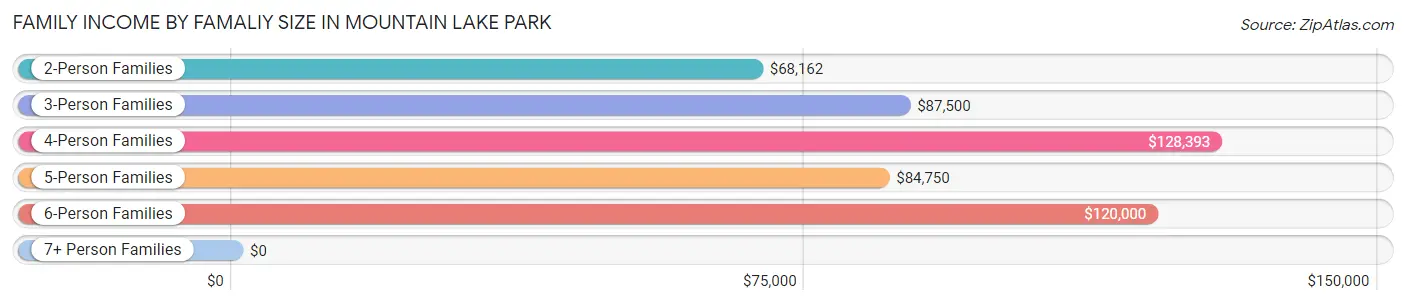
| Income Bracket | # Families | Median Income |
| 2-Person Families | 397 (66.8%) | $68,162 |
| 3-Person Families | 64 (10.8%) | $87,500 |
| 4-Person Families | 73 (12.3%) | $128,393 |
| 5-Person Families | 31 (5.2%) | $84,750 |
| 6-Person Families | 24 (4.0%) | $120,000 |
| 7+ Person Families | 5 (0.8%) | $0 |
| Total | 594 (100.0%) | $72,353 |
Family Income by Number of Earners in Mountain Lake Park
The median family income in Mountain Lake Park is $72,353, with families comprising 3+ earners (36) having the highest median family income of $250,001, while families with 1 earner (255) have the lowest median family income of $54,276, accounting for 6.1% and 42.9% of families, respectively.
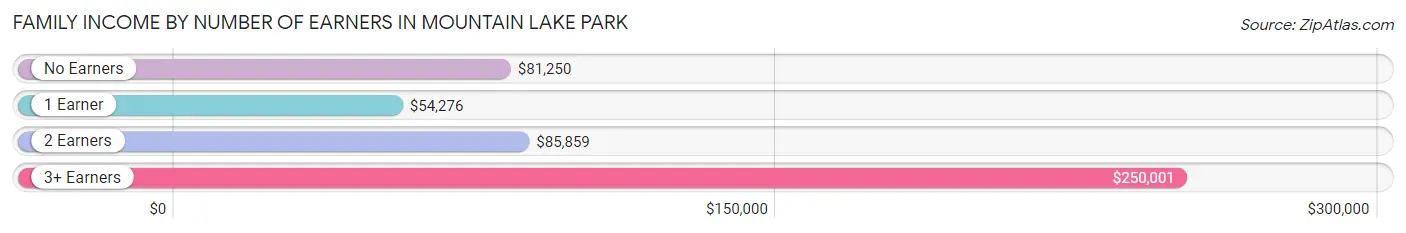
| Number of Earners | # Families | Median Income |
| No Earners | 58 (9.8%) | $81,250 |
| 1 Earner | 255 (42.9%) | $54,276 |
| 2 Earners | 245 (41.2%) | $85,859 |
| 3+ Earners | 36 (6.1%) | $250,001 |
| Total | 594 (100.0%) | $72,353 |
Household Income in Mountain Lake Park
Household Income Brackets in Mountain Lake Park
With 167 households falling in the category, the $50,000 to $74,999 income range is the most frequent in Mountain Lake Park, accounting for 17.4% of all households. In contrast, only 35 households (3.6%) fall into the less than $10,000 income bracket, making it the least populous group.
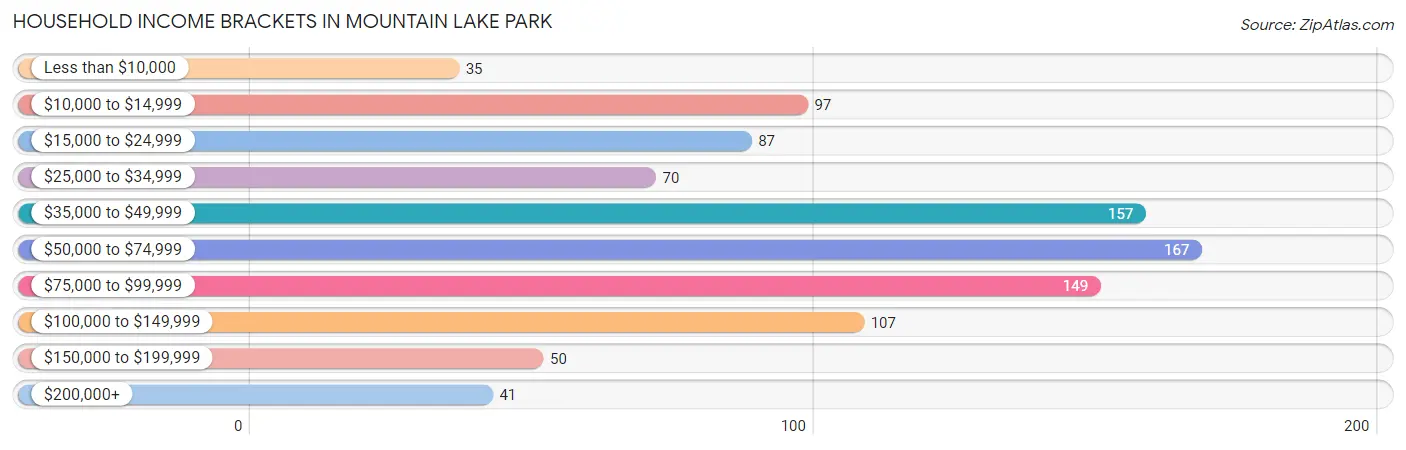
| Income Bracket | # Households | % Households |
| Less than $10,000 | 35 | 3.6% |
| $10,000 to $14,999 | 97 | 10.1% |
| $15,000 to $24,999 | 87 | 9.1% |
| $25,000 to $34,999 | 70 | 7.3% |
| $35,000 to $49,999 | 157 | 16.4% |
| $50,000 to $74,999 | 167 | 17.4% |
| $75,000 to $99,999 | 149 | 15.5% |
| $100,000 to $149,999 | 107 | 11.1% |
| $150,000 to $199,999 | 50 | 5.2% |
| $200,000+ | 41 | 4.3% |
Household Income by Householder Age in Mountain Lake Park
The median household income in Mountain Lake Park is $55,000, with the highest median household income of $61,786 found in the 25 to 44 years age bracket for the primary householder. A total of 274 households (28.5%) fall into this category. Meanwhile, the 15 to 24 years age bracket for the primary householder has the lowest median household income of $0, with 29 households (3.0%) in this group.
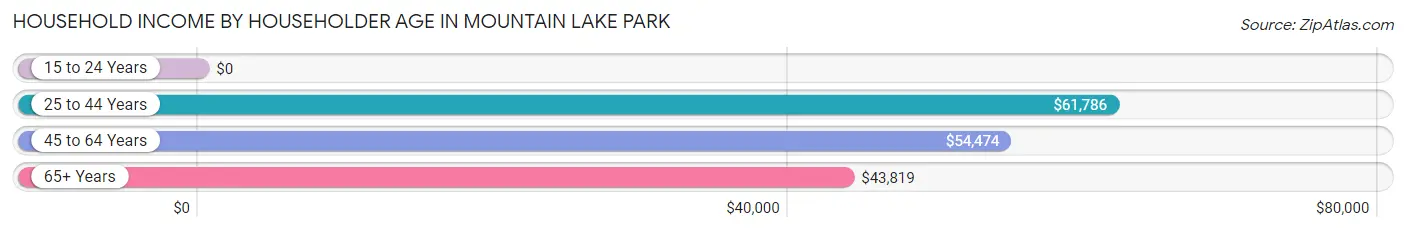
| Income Bracket | # Households | Median Income |
| 15 to 24 Years | 29 (3.0%) | $0 |
| 25 to 44 Years | 274 (28.5%) | $61,786 |
| 45 to 64 Years | 348 (36.2%) | $54,474 |
| 65+ Years | 309 (32.2%) | $43,819 |
| Total | 960 (100.0%) | $55,000 |
Poverty in Mountain Lake Park
Income Below Poverty by Sex and Age in Mountain Lake Park
With 11.5% poverty level for males and 14.4% for females among the residents of Mountain Lake Park, 12 to 14 year old males and 55 to 64 year old females are the most vulnerable to poverty, with 21 males (42.0%) and 49 females (26.8%) in their respective age groups living below the poverty level.
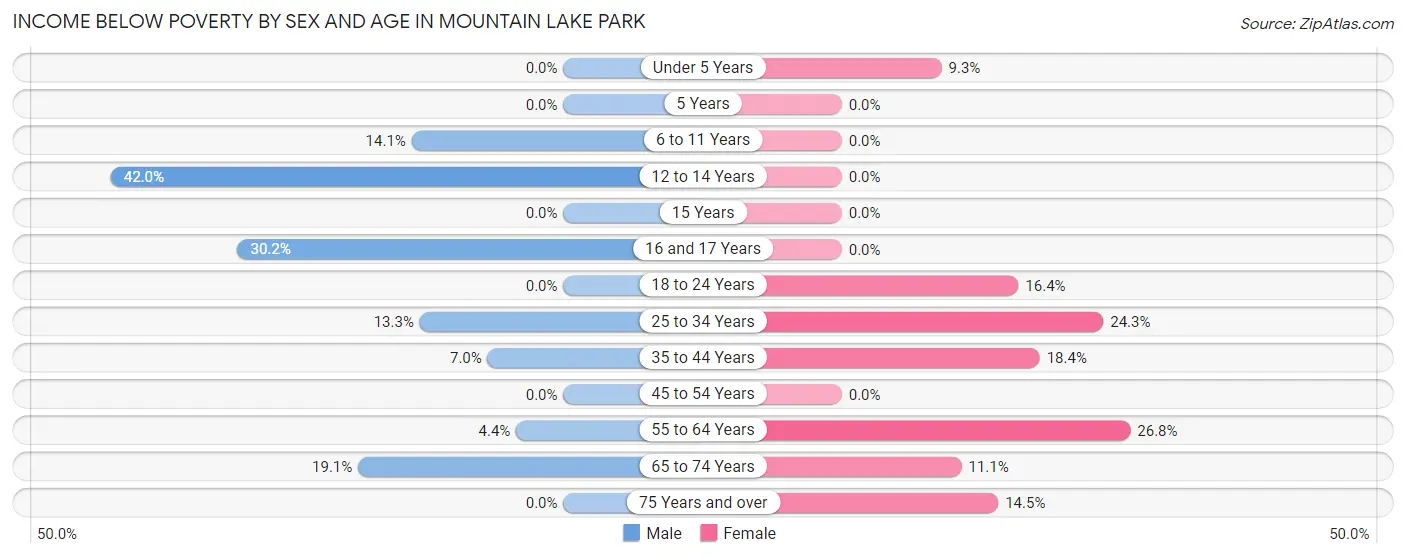
| Age Bracket | Male | Female |
| Under 5 Years | 0 (0.0%) | 5 (9.3%) |
| 5 Years | 0 (0.0%) | 0 (0.0%) |
| 6 to 11 Years | 10 (14.1%) | 0 (0.0%) |
| 12 to 14 Years | 21 (42.0%) | 0 (0.0%) |
| 15 Years | 0 (0.0%) | 0 (0.0%) |
| 16 and 17 Years | 26 (30.2%) | 0 (0.0%) |
| 18 to 24 Years | 0 (0.0%) | 10 (16.4%) |
| 25 to 34 Years | 16 (13.3%) | 25 (24.3%) |
| 35 to 44 Years | 13 (7.0%) | 27 (18.4%) |
| 45 to 54 Years | 0 (0.0%) | 0 (0.0%) |
| 55 to 64 Years | 6 (4.4%) | 49 (26.8%) |
| 65 to 74 Years | 20 (19.1%) | 15 (11.1%) |
| 75 Years and over | 0 (0.0%) | 18 (14.5%) |
| Total | 112 (11.5%) | 149 (14.4%) |
Income Above Poverty by Sex and Age in Mountain Lake Park
According to the poverty statistics in Mountain Lake Park, males aged under 5 years and females aged 6 to 11 years are the age groups that are most secure financially, with 100.0% of males and 100.0% of females in these age groups living above the poverty line.
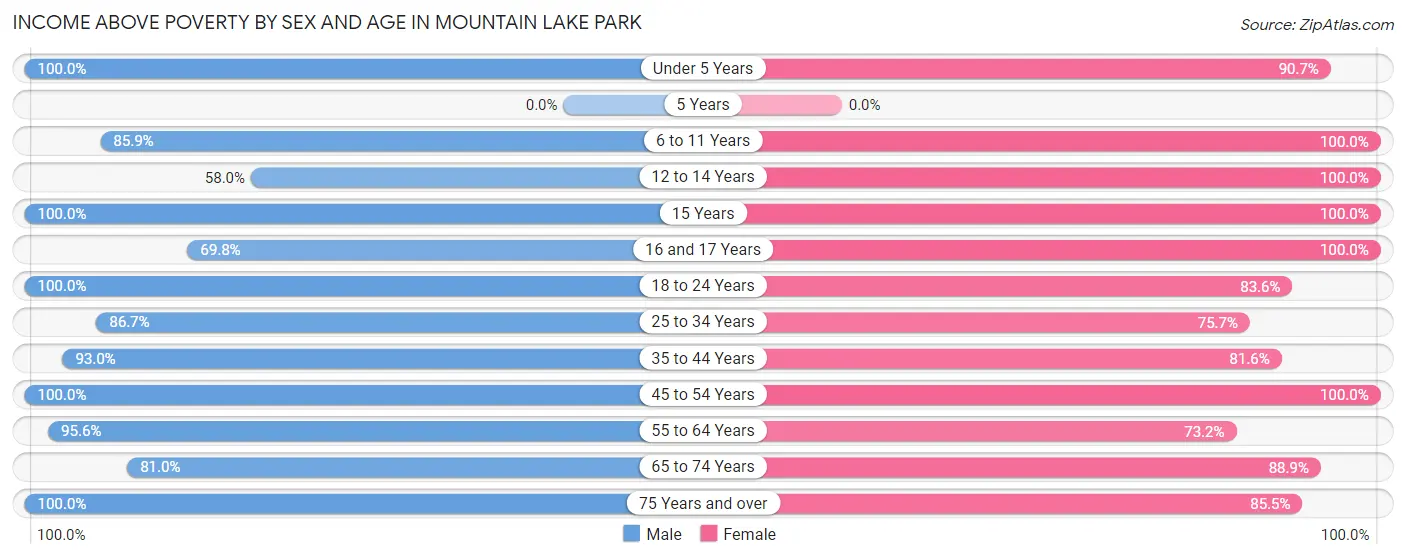
| Age Bracket | Male | Female |
| Under 5 Years | 35 (100.0%) | 49 (90.7%) |
| 5 Years | 0 (0.0%) | 0 (0.0%) |
| 6 to 11 Years | 61 (85.9%) | 53 (100.0%) |
| 12 to 14 Years | 29 (58.0%) | 41 (100.0%) |
| 15 Years | 5 (100.0%) | 15 (100.0%) |
| 16 and 17 Years | 60 (69.8%) | 8 (100.0%) |
| 18 to 24 Years | 24 (100.0%) | 51 (83.6%) |
| 25 to 34 Years | 104 (86.7%) | 78 (75.7%) |
| 35 to 44 Years | 172 (93.0%) | 120 (81.6%) |
| 45 to 54 Years | 89 (100.0%) | 112 (100.0%) |
| 55 to 64 Years | 131 (95.6%) | 134 (73.2%) |
| 65 to 74 Years | 85 (80.9%) | 120 (88.9%) |
| 75 Years and over | 68 (100.0%) | 106 (85.5%) |
| Total | 863 (88.5%) | 887 (85.6%) |
Income Below Poverty Among Married-Couple Families in Mountain Lake Park
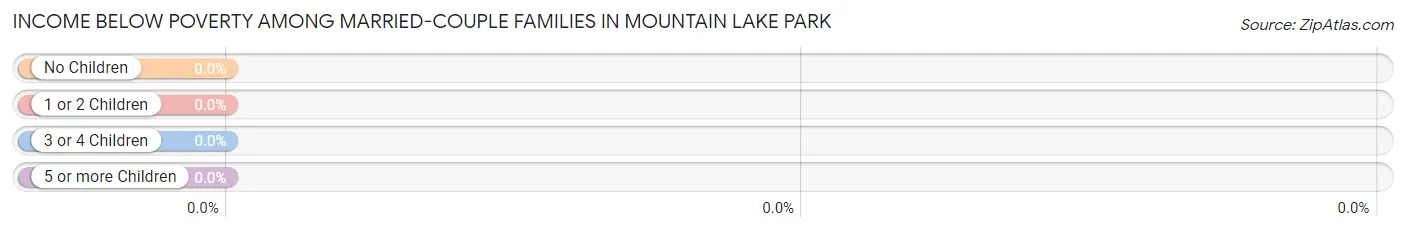
| Children | Above Poverty | Below Poverty |
| No Children | 267 (100.0%) | 0 (0.0%) |
| 1 or 2 Children | 115 (100.0%) | 0 (0.0%) |
| 3 or 4 Children | 29 (100.0%) | 0 (0.0%) |
| 5 or more Children | 5 (100.0%) | 0 (0.0%) |
| Total | 416 (100.0%) | 0 (0.0%) |
Income Below Poverty Among Single-Parent Households in Mountain Lake Park
According to the poverty data in Mountain Lake Park, 10.5% or 6 single-father households and 37.2% or 45 single-mother households are living below the poverty line. Among single-father households, those with 1 or 2 children have the highest poverty rate, with 6 households (15.0%) experiencing poverty. Likewise, among single-mother households, those with 1 or 2 children have the highest poverty rate, with 40 households (52.6%) falling below the poverty line.
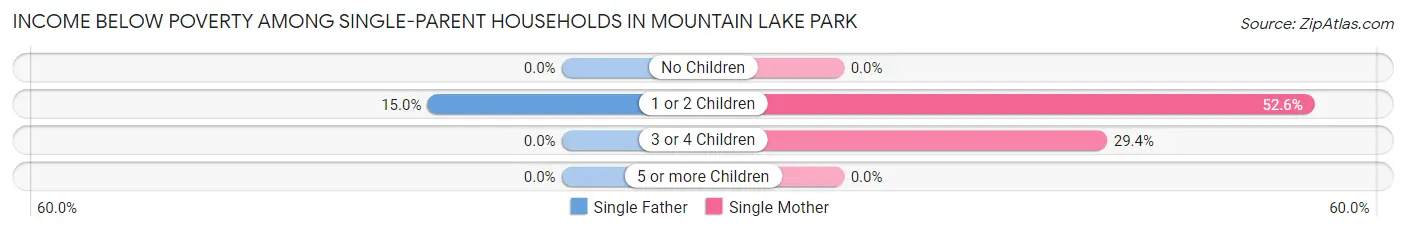
| Children | Single Father | Single Mother |
| No Children | 0 (0.0%) | 0 (0.0%) |
| 1 or 2 Children | 6 (15.0%) | 40 (52.6%) |
| 3 or 4 Children | 0 (0.0%) | 5 (29.4%) |
| 5 or more Children | 0 (0.0%) | 0 (0.0%) |
| Total | 6 (10.5%) | 45 (37.2%) |
Income Below Poverty Among Married-Couple vs Single-Parent Households in Mountain Lake Park
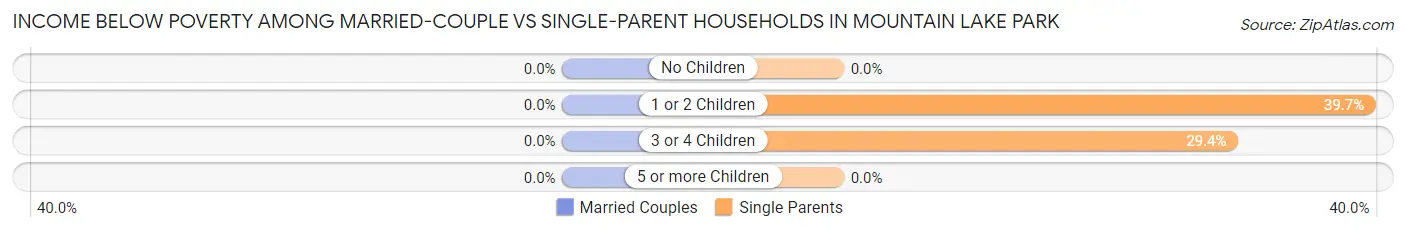
| Children | Married-Couple Families | Single-Parent Households |
| No Children | 0 (0.0%) | 0 (0.0%) |
| 1 or 2 Children | 0 (0.0%) | 46 (39.7%) |
| 3 or 4 Children | 0 (0.0%) | 5 (29.4%) |
| 5 or more Children | 0 (0.0%) | 0 (0.0%) |
| Total | 0 (0.0%) | 51 (28.6%) |
Race in Mountain Lake Park
The most populous races in Mountain Lake Park are White / Caucasian (1,982 | 93.6%), Two or more Races (59 | 2.8%), and Some other Race (46 | 2.2%).
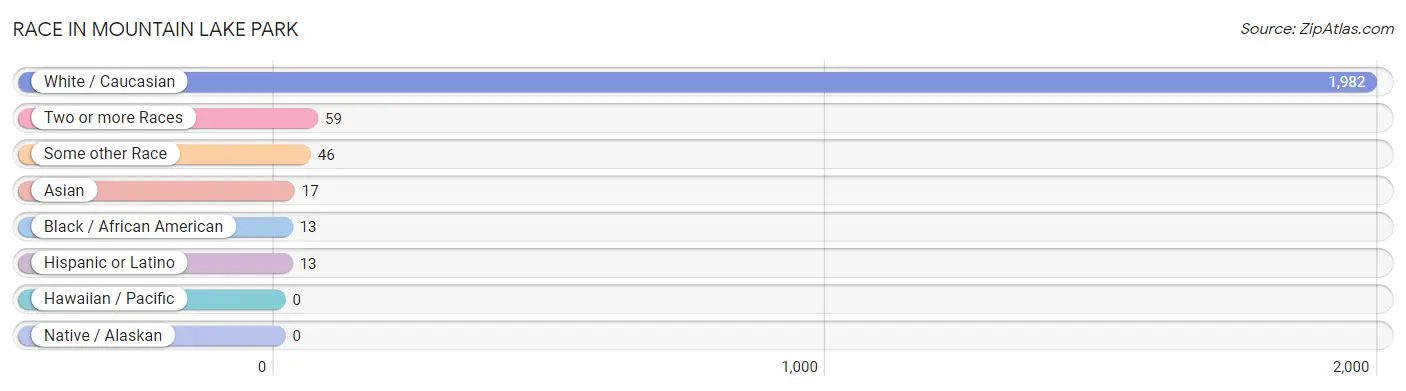
| Race | # Population | % Population |
| Asian | 17 | 0.8% |
| Black / African American | 13 | 0.6% |
| Hawaiian / Pacific | 0 | 0.0% |
| Hispanic or Latino | 13 | 0.6% |
| Native / Alaskan | 0 | 0.0% |
| White / Caucasian | 1,982 | 93.6% |
| Two or more Races | 59 | 2.8% |
| Some other Race | 46 | 2.2% |
| Total | 2,117 | 100.0% |
Ancestry in Mountain Lake Park
The most populous ancestries reported in Mountain Lake Park are German (633 | 29.9%), Irish (303 | 14.3%), English (183 | 8.6%), American (118 | 5.6%), and Polish (95 | 4.5%), together accounting for 62.9% of all Mountain Lake Park residents.
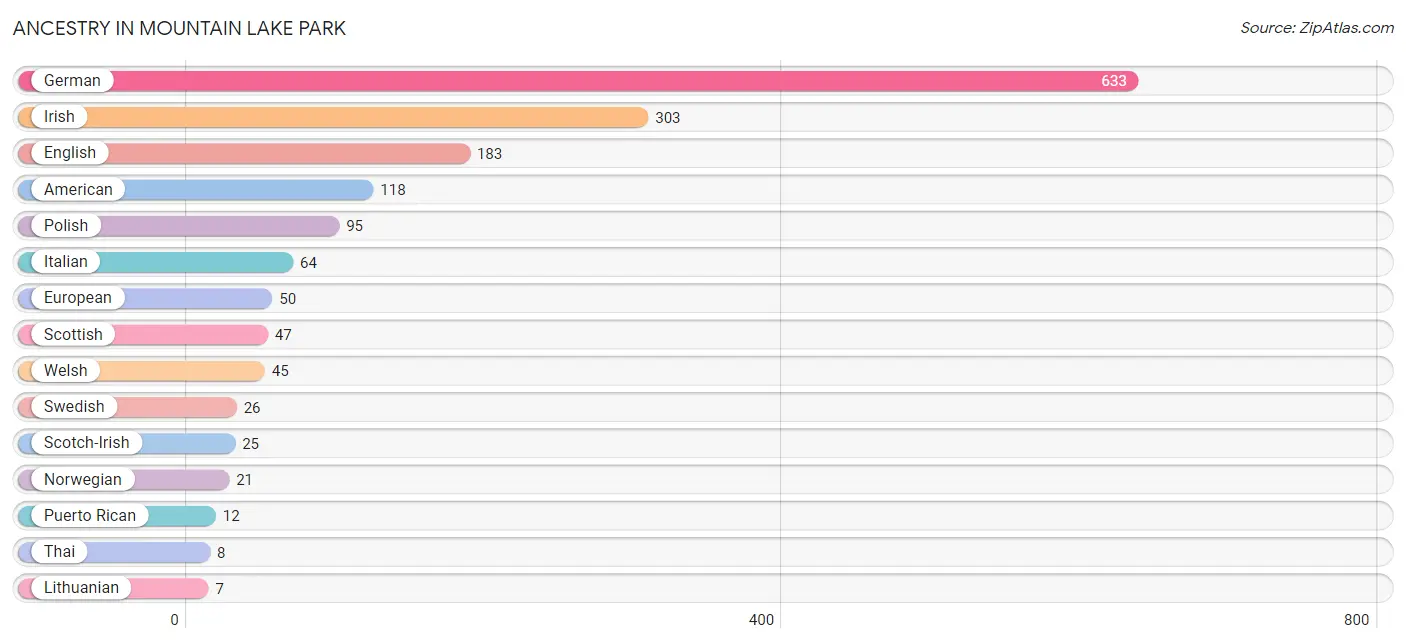
| Ancestry | # Population | % Population |
| American | 118 | 5.6% |
| British | 5 | 0.2% |
| Dutch | 5 | 0.2% |
| English | 183 | 8.6% |
| European | 50 | 2.4% |
| French | 6 | 0.3% |
| French Canadian | 5 | 0.2% |
| German | 633 | 29.9% |
| Haitian | 2 | 0.1% |
| Indian (Asian) | 6 | 0.3% |
| Irish | 303 | 14.3% |
| Italian | 64 | 3.0% |
| Korean | 5 | 0.2% |
| Lithuanian | 7 | 0.3% |
| Mexican | 1 | 0.1% |
| Northern European | 5 | 0.2% |
| Norwegian | 21 | 1.0% |
| Pennsylvania German | 4 | 0.2% |
| Polish | 95 | 4.5% |
| Puerto Rican | 12 | 0.6% |
| Scandinavian | 4 | 0.2% |
| Scotch-Irish | 25 | 1.2% |
| Scottish | 47 | 2.2% |
| Serbian | 4 | 0.2% |
| Swedish | 26 | 1.2% |
| Swiss | 2 | 0.1% |
| Thai | 8 | 0.4% |
| Ukrainian | 5 | 0.2% |
| Welsh | 45 | 2.1% | View All 29 Rows |
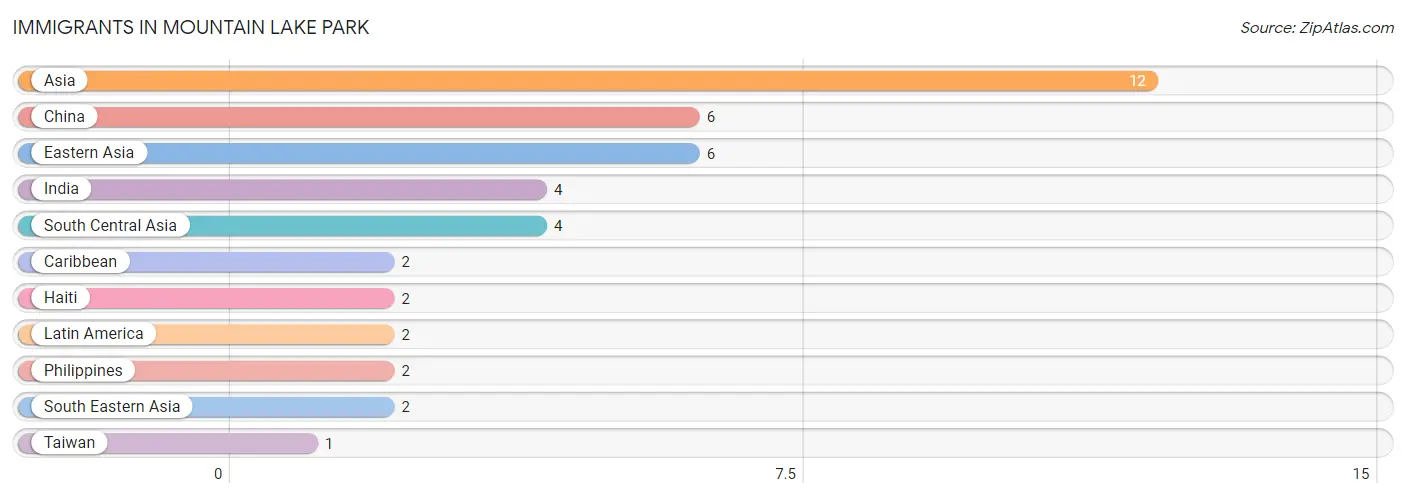
Immigrants in Mountain Lake Park
The most numerous immigrant groups reported in Mountain Lake Park came from Asia (12 | 0.6%), China (6 | 0.3%), Eastern Asia (6 | 0.3%), India (4 | 0.2%), and South Central Asia (4 | 0.2%), together accounting for 1.5% of all Mountain Lake Park residents.
| Immigration Origin | # Population | % Population |
| Asia | 12 | 0.6% |
| Caribbean | 2 | 0.1% |
| China | 6 | 0.3% |
| Eastern Asia | 6 | 0.3% |
| Haiti | 2 | 0.1% |
| India | 4 | 0.2% |
| Latin America | 2 | 0.1% |
| Philippines | 2 | 0.1% |
| South Central Asia | 4 | 0.2% |
| South Eastern Asia | 2 | 0.1% |
| Taiwan | 1 | 0.1% | View All 11 Rows |
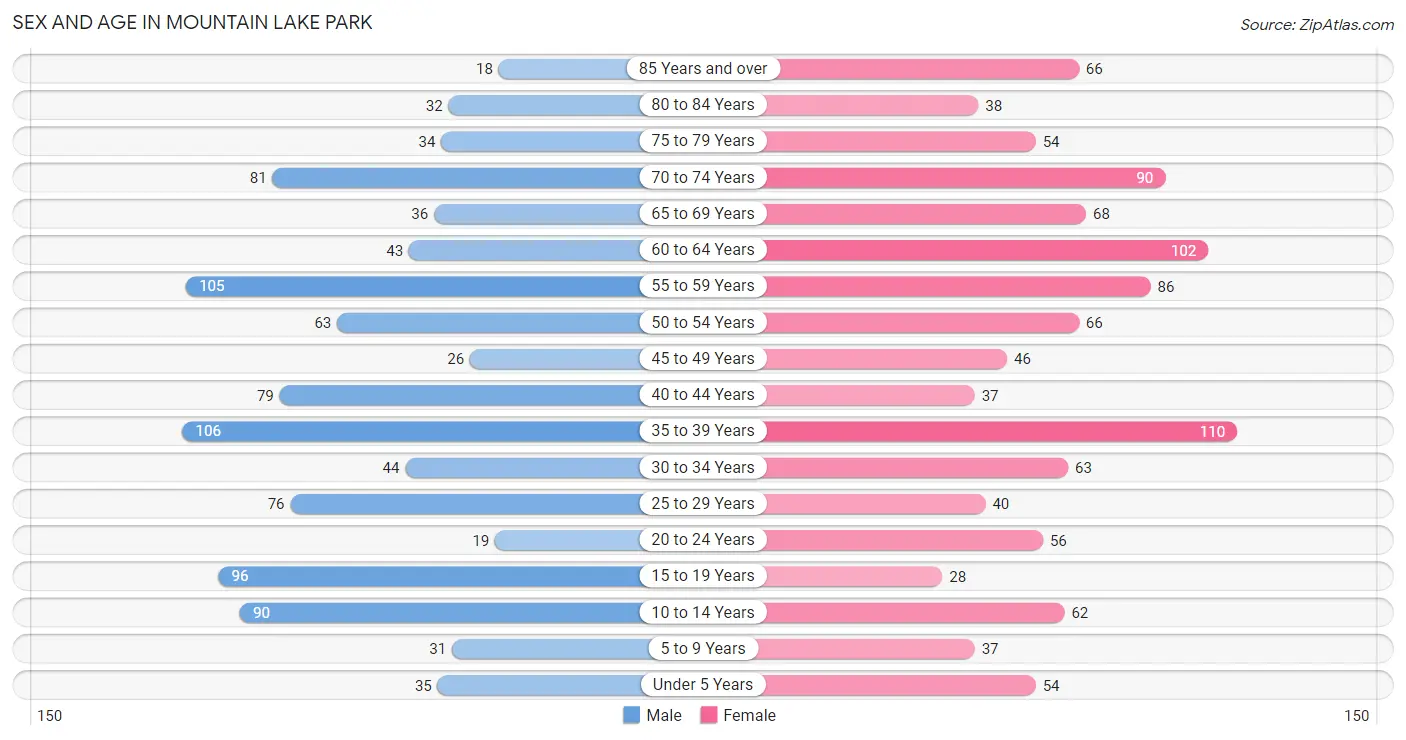
Sex and Age in Mountain Lake Park
Sex and Age in Mountain Lake Park
The most populous age groups in Mountain Lake Park are 35 to 39 Years (106 | 10.4%) for men and 35 to 39 Years (110 | 10.0%) for women.
| Age Bracket | Male | Female |
| Under 5 Years | 35 (3.5%) | 54 (4.9%) |
| 5 to 9 Years | 31 (3.1%) | 37 (3.4%) |
| 10 to 14 Years | 90 (8.9%) | 62 (5.6%) |
| 15 to 19 Years | 96 (9.5%) | 28 (2.5%) |
| 20 to 24 Years | 19 (1.9%) | 56 (5.1%) |
| 25 to 29 Years | 76 (7.5%) | 40 (3.6%) |
| 30 to 34 Years | 44 (4.3%) | 63 (5.7%) |
| 35 to 39 Years | 106 (10.4%) | 110 (10.0%) |
| 40 to 44 Years | 79 (7.8%) | 37 (3.4%) |
| 45 to 49 Years | 26 (2.6%) | 46 (4.2%) |
| 50 to 54 Years | 63 (6.2%) | 66 (6.0%) |
| 55 to 59 Years | 105 (10.4%) | 86 (7.8%) |
| 60 to 64 Years | 43 (4.2%) | 102 (9.2%) |
| 65 to 69 Years | 36 (3.5%) | 68 (6.2%) |
| 70 to 74 Years | 81 (8.0%) | 90 (8.2%) |
| 75 to 79 Years | 34 (3.4%) | 54 (4.9%) |
| 80 to 84 Years | 32 (3.2%) | 38 (3.5%) |
| 85 Years and over | 18 (1.8%) | 66 (6.0%) |
| Total | 1,014 (100.0%) | 1,103 (100.0%) |
Families and Households in Mountain Lake Park
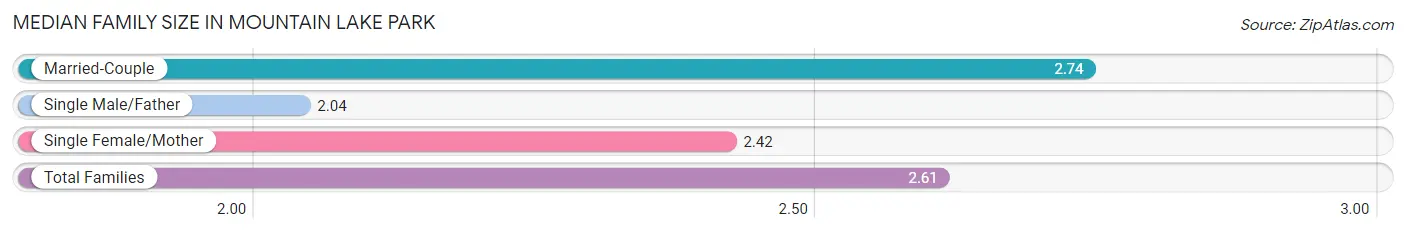
Median Family Size in Mountain Lake Park
The median family size in Mountain Lake Park is 2.61 persons per family, with married-couple families (416 | 70.0%) accounting for the largest median family size of 2.74 persons per family. On the other hand, single male/father families (57 | 9.6%) represent the smallest median family size with 2.04 persons per family.
| Family Type | # Families | Family Size |
| Married-Couple | 416 (70.0%) | 2.74 |
| Single Male/Father | 57 (9.6%) | 2.04 |
| Single Female/Mother | 121 (20.4%) | 2.42 |
| Total Families | 594 (100.0%) | 2.61 |
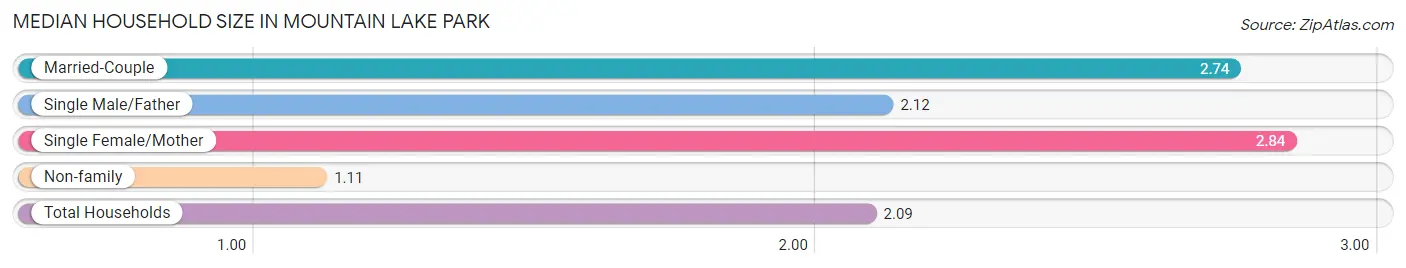
Median Household Size in Mountain Lake Park
The median household size in Mountain Lake Park is 2.09 persons per household, with single female/mother households (121 | 12.6%) accounting for the largest median household size of 2.84 persons per household. non-family households (366 | 38.1%) represent the smallest median household size with 1.11 persons per household.
| Household Type | # Households | Household Size |
| Married-Couple | 416 (43.3%) | 2.74 |
| Single Male/Father | 57 (5.9%) | 2.12 |
| Single Female/Mother | 121 (12.6%) | 2.84 |
| Non-family | 366 (38.1%) | 1.11 |
| Total Households | 960 (100.0%) | 2.09 |
Household Size by Marriage Status in Mountain Lake Park
Out of a total of 960 households in Mountain Lake Park, 594 (61.9%) are family households, while 366 (38.1%) are nonfamily households. The most numerous type of family households are 2-person households, comprising 358, and the most common type of nonfamily households are 1-person households, comprising 335.
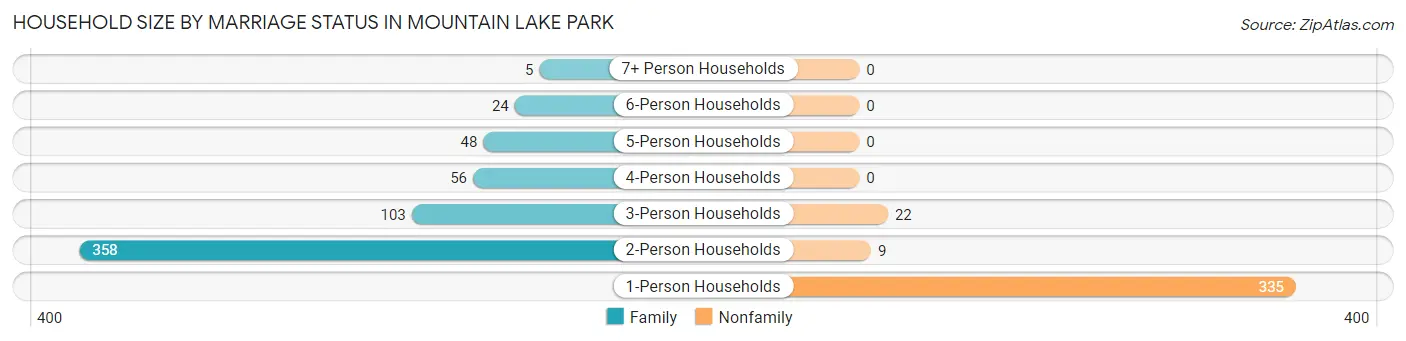
| Household Size | Family Households | Nonfamily Households |
| 1-Person Households | - | 335 (34.9%) |
| 2-Person Households | 358 (37.3%) | 9 (0.9%) |
| 3-Person Households | 103 (10.7%) | 22 (2.3%) |
| 4-Person Households | 56 (5.8%) | 0 (0.0%) |
| 5-Person Households | 48 (5.0%) | 0 (0.0%) |
| 6-Person Households | 24 (2.5%) | 0 (0.0%) |
| 7+ Person Households | 5 (0.5%) | 0 (0.0%) |
| Total | 594 (61.9%) | 366 (38.1%) |
Female Fertility in Mountain Lake Park
Fertility by Age in Mountain Lake Park
Average fertility rate in Mountain Lake Park is 26.0 births per 1,000 women. Women in the age bracket of 20 to 34 years have the highest fertility rate with 63.0 births per 1,000 women. Women in the age bracket of 20 to 34 years acount for 100.0% of all women with births.
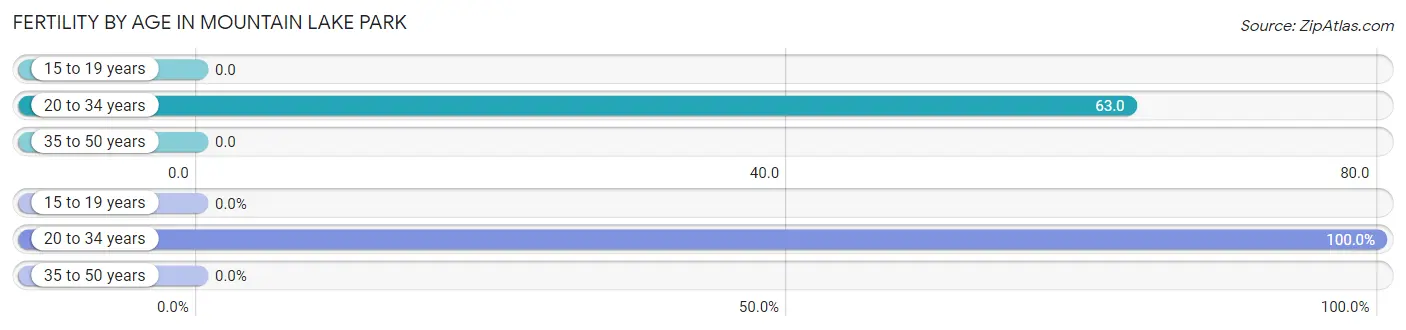
| Age Bracket | Women with Births | Births / 1,000 Women |
| 15 to 19 years | 0 (0.0%) | 0.0 |
| 20 to 34 years | 10 (100.0%) | 63.0 |
| 35 to 50 years | 0 (0.0%) | 0.0 |
| Total | 10 (100.0%) | 26.0 |
Fertility by Age by Marriage Status in Mountain Lake Park
60.0% of women with births (10) in Mountain Lake Park are married. The highest percentage of unmarried women with births falls into 20 to 34 years age bracket with 40.0% of them unmarried at the time of birth, while the lowest percentage of unmarried women with births belong to 20 to 34 years age bracket with 40.0% of them unmarried.
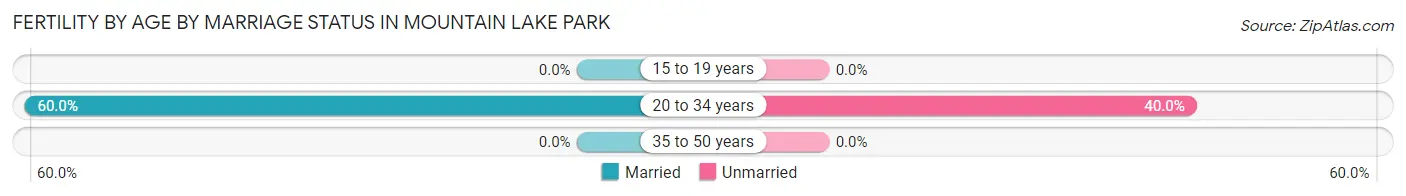
| Age Bracket | Married | Unmarried |
| 15 to 19 years | 0 (0.0%) | 0 (0.0%) |
| 20 to 34 years | 6 (60.0%) | 4 (40.0%) |
| 35 to 50 years | 0 (0.0%) | 0 (0.0%) |
| Total | 6 (60.0%) | 4 (40.0%) |
Fertility by Education in Mountain Lake Park
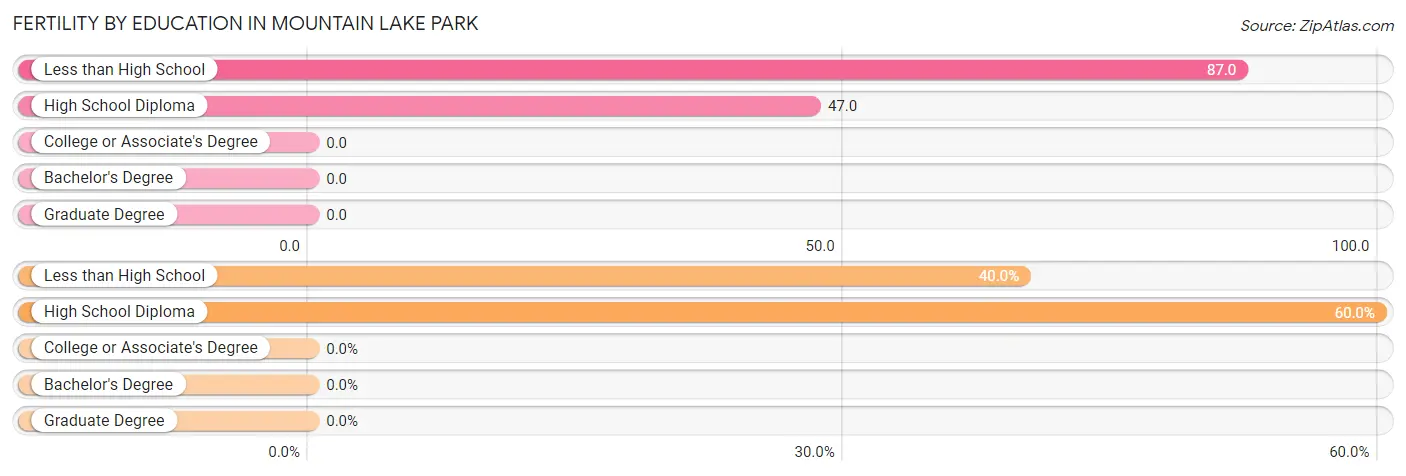
| Educational Attainment | Women with Births | Births / 1,000 Women |
| Less than High School | 4 (40.0%) | 87.0 |
| High School Diploma | 6 (60.0%) | 47.0 |
| College or Associate's Degree | 0 (0.0%) | 0.0 |
| Bachelor's Degree | 0 (0.0%) | 0.0 |
| Graduate Degree | 0 (0.0%) | 0.0 |
| Total | 10 (100.0%) | 26.0 |
Fertility by Education by Marriage Status in Mountain Lake Park
40.0% of women with births in Mountain Lake Park are unmarried. Women with the educational attainment of high school diploma are most likely to be married with 100.0% of them married at childbirth, while women with the educational attainment of less than high school are least likely to be married with 100.0% of them unmarried at childbirth.
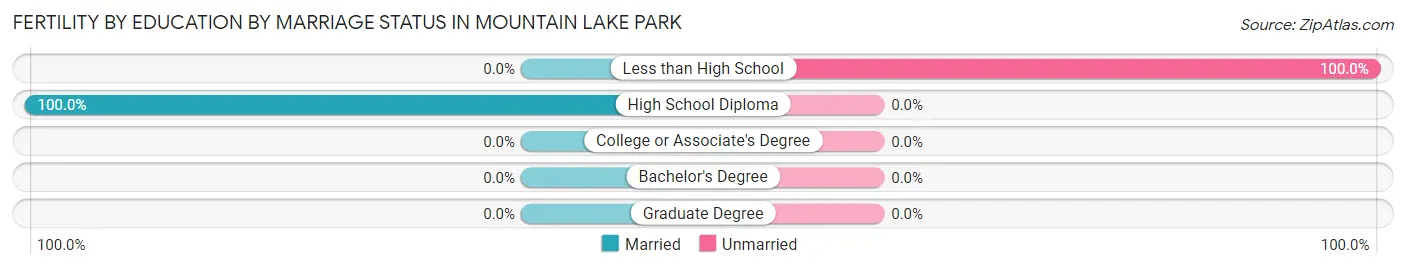
| Educational Attainment | Married | Unmarried |
| Less than High School | 0 (0.0%) | 4 (100.0%) |
| High School Diploma | 6 (100.0%) | 0 (0.0%) |
| College or Associate's Degree | 0 (0.0%) | 0 (0.0%) |
| Bachelor's Degree | 0 (0.0%) | 0 (0.0%) |
| Graduate Degree | 0 (0.0%) | 0 (0.0%) |
| Total | 6 (60.0%) | 4 (40.0%) |
Employment Characteristics in Mountain Lake Park
Employment by Class of Employer in Mountain Lake Park
Among the 978 employed individuals in Mountain Lake Park, private company employees (495 | 50.6%), self-employed (not incorporated) (133 | 13.6%), and not-for-profit organizations (114 | 11.7%) make up the most common classes of employment.
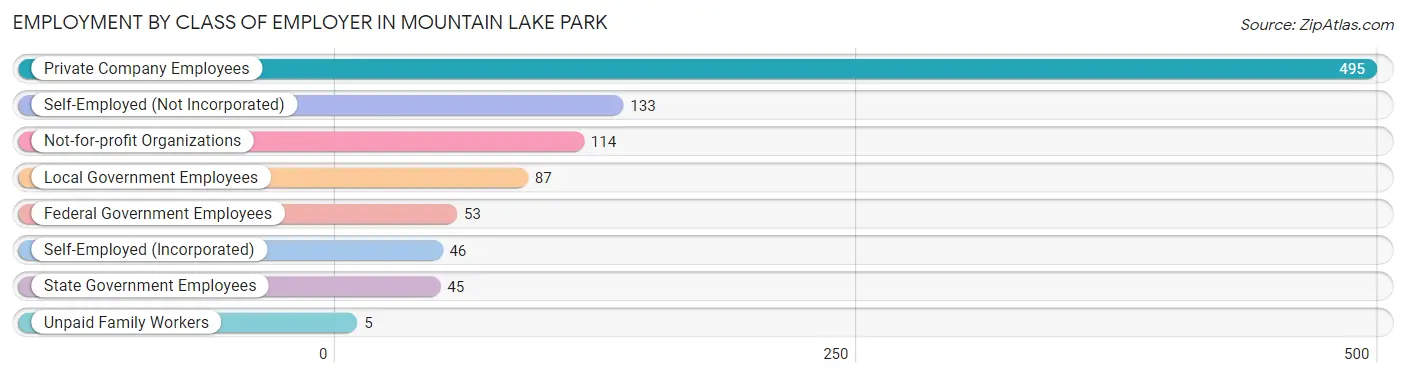
| Employer Class | # Employees | % Employees |
| Private Company Employees | 495 | 50.6% |
| Self-Employed (Incorporated) | 46 | 4.7% |
| Self-Employed (Not Incorporated) | 133 | 13.6% |
| Not-for-profit Organizations | 114 | 11.7% |
| Local Government Employees | 87 | 8.9% |
| State Government Employees | 45 | 4.6% |
| Federal Government Employees | 53 | 5.4% |
| Unpaid Family Workers | 5 | 0.5% |
| Total | 978 | 100.0% |
Employment Status by Age in Mountain Lake Park
According to the labor force statistics for Mountain Lake Park, out of the total population over 16 years of age (1,788), 60.3% or 1,078 individuals are in the labor force, with 7.4% or 80 of them unemployed. The age group with the highest labor force participation rate is 20 to 24 years, with 100.0% or 75 individuals in the labor force. Within the labor force, the 16 to 19 years age range has the highest percentage of unemployed individuals, with 54.3% or 19 of them being unemployed.
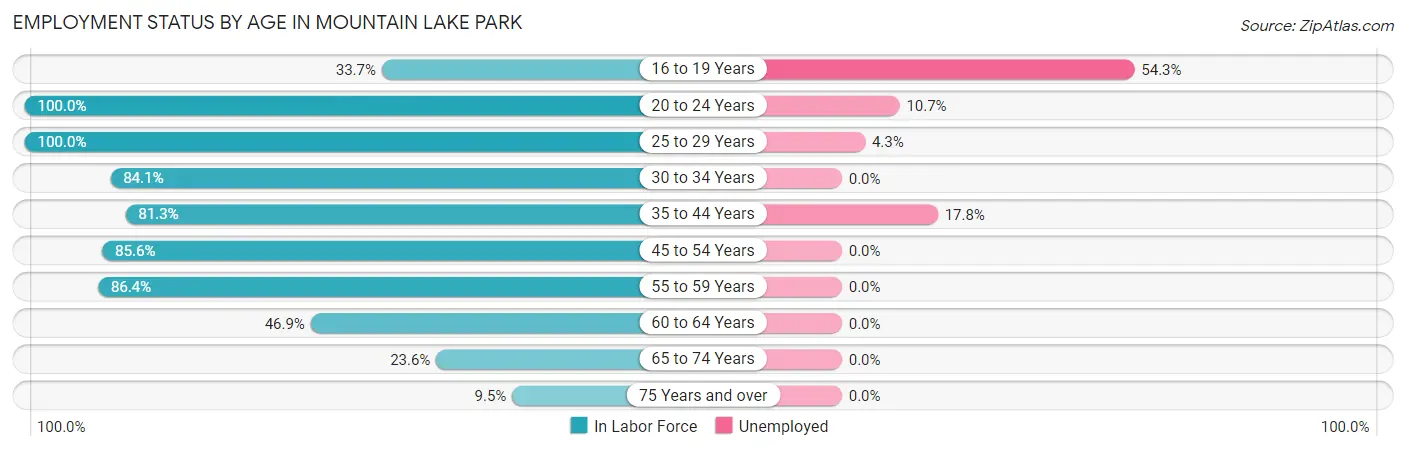
| Age Bracket | In Labor Force | Unemployed |
| 16 to 19 Years | 35 (33.7%) | 19 (54.3%) |
| 20 to 24 Years | 75 (100.0%) | 8 (10.7%) |
| 25 to 29 Years | 116 (100.0%) | 5 (4.3%) |
| 30 to 34 Years | 90 (84.1%) | 0 (0.0%) |
| 35 to 44 Years | 270 (81.3%) | 48 (17.8%) |
| 45 to 54 Years | 172 (85.6%) | 0 (0.0%) |
| 55 to 59 Years | 165 (86.4%) | 0 (0.0%) |
| 60 to 64 Years | 68 (46.9%) | 0 (0.0%) |
| 65 to 74 Years | 65 (23.6%) | 0 (0.0%) |
| 75 Years and over | 23 (9.5%) | 0 (0.0%) |
| Total | 1,078 (60.3%) | 80 (7.4%) |
Employment Status by Educational Attainment in Mountain Lake Park
According to labor force statistics for Mountain Lake Park, 80.7% of individuals (881) out of the total population between 25 and 64 years of age (1,092) are in the labor force, with 6.0% or 53 of them being unemployed. The group with the highest labor force participation rate are those with the educational attainment of bachelor's degree or higher, with 91.8% or 179 individuals in the labor force. Within the labor force, individuals with college / associate degree education have the highest percentage of unemployment, with 7.7% or 20 of them being unemployed.
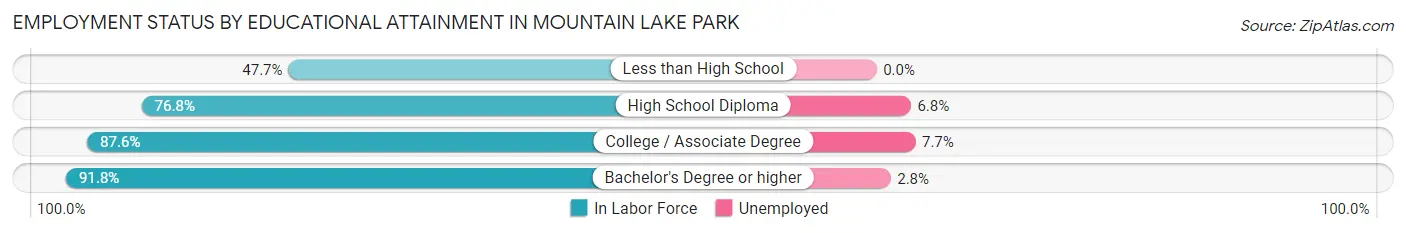
| Educational Attainment | In Labor Force | Unemployed |
| Less than High School | 31 (47.7%) | 0 (0.0%) |
| High School Diploma | 410 (76.8%) | 36 (6.8%) |
| College / Associate Degree | 261 (87.6%) | 23 (7.7%) |
| Bachelor's Degree or higher | 179 (91.8%) | 5 (2.8%) |
| Total | 881 (80.7%) | 66 (6.0%) |
Employment Occupations by Sex in Mountain Lake Park
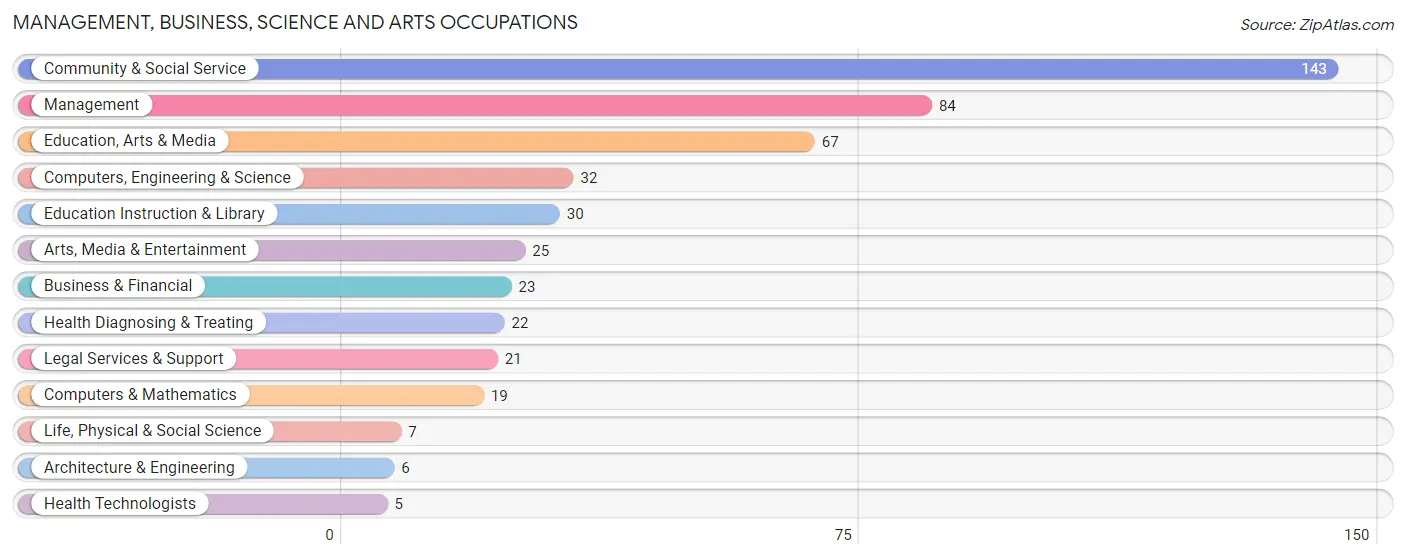
Management, Business, Science and Arts Occupations
The most common Management, Business, Science and Arts occupations in Mountain Lake Park are Community & Social Service (143 | 14.3%), Management (84 | 8.4%), Education, Arts & Media (67 | 6.7%), Computers, Engineering & Science (32 | 3.2%), and Education Instruction & Library (30 | 3.0%).
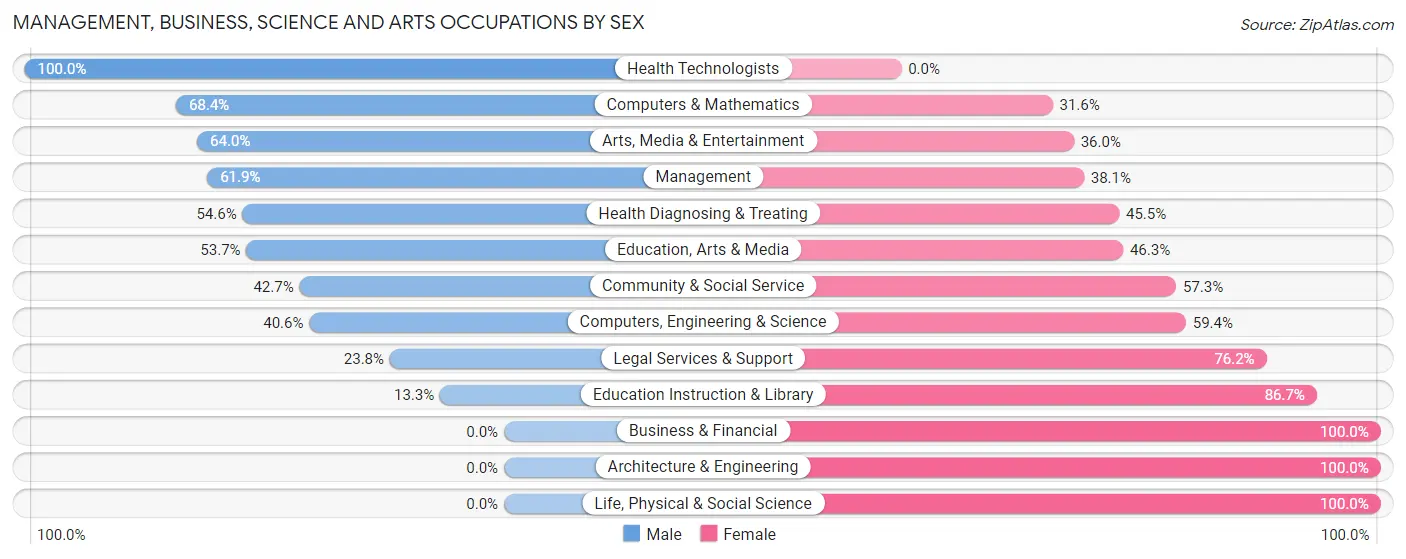
Management, Business, Science and Arts Occupations by Sex
Within the Management, Business, Science and Arts occupations in Mountain Lake Park, the most male-oriented occupations are Health Technologists (100.0%), Computers & Mathematics (68.4%), and Arts, Media & Entertainment (64.0%), while the most female-oriented occupations are Business & Financial (100.0%), Architecture & Engineering (100.0%), and Life, Physical & Social Science (100.0%).
| Occupation | Male | Female |
| Management | 52 (61.9%) | 32 (38.1%) |
| Business & Financial | 0 (0.0%) | 23 (100.0%) |
| Computers, Engineering & Science | 13 (40.6%) | 19 (59.4%) |
| Computers & Mathematics | 13 (68.4%) | 6 (31.6%) |
| Architecture & Engineering | 0 (0.0%) | 6 (100.0%) |
| Life, Physical & Social Science | 0 (0.0%) | 7 (100.0%) |
| Community & Social Service | 61 (42.7%) | 82 (57.3%) |
| Education, Arts & Media | 36 (53.7%) | 31 (46.3%) |
| Legal Services & Support | 5 (23.8%) | 16 (76.2%) |
| Education Instruction & Library | 4 (13.3%) | 26 (86.7%) |
| Arts, Media & Entertainment | 16 (64.0%) | 9 (36.0%) |
| Health Diagnosing & Treating | 12 (54.5%) | 10 (45.5%) |
| Health Technologists | 5 (100.0%) | 0 (0.0%) |
| Total (Category) | 138 (45.4%) | 166 (54.6%) |
| Total (Overall) | 502 (50.2%) | 497 (49.7%) |
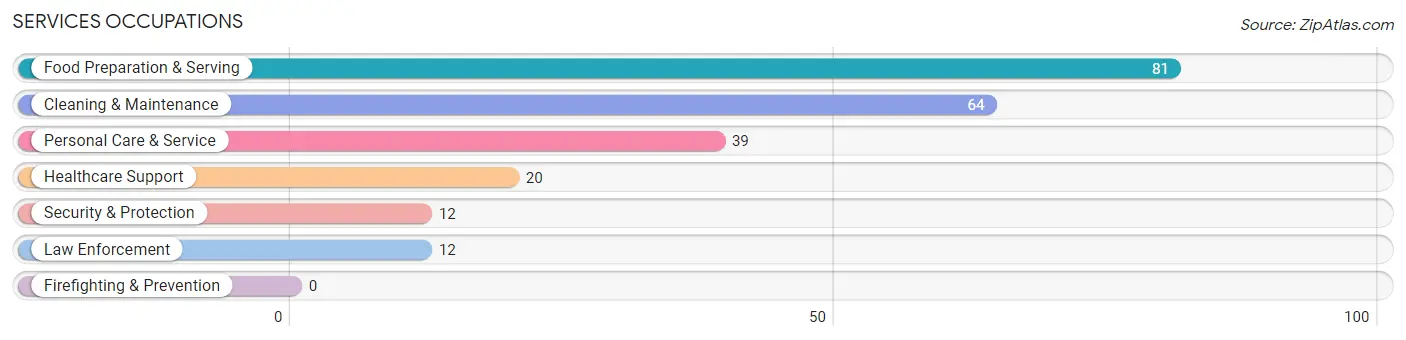
Services Occupations
The most common Services occupations in Mountain Lake Park are Food Preparation & Serving (81 | 8.1%), Cleaning & Maintenance (64 | 6.4%), Personal Care & Service (39 | 3.9%), Healthcare Support (20 | 2.0%), and Security & Protection (12 | 1.2%).
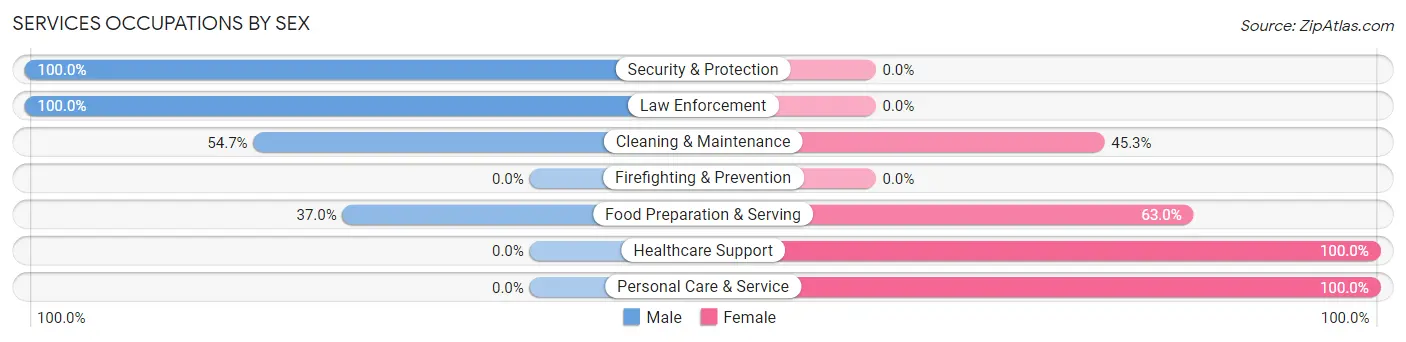
Services Occupations by Sex
Within the Services occupations in Mountain Lake Park, the most male-oriented occupations are Security & Protection (100.0%), Law Enforcement (100.0%), and Cleaning & Maintenance (54.7%), while the most female-oriented occupations are Healthcare Support (100.0%), Personal Care & Service (100.0%), and Food Preparation & Serving (63.0%).
| Occupation | Male | Female |
| Healthcare Support | 0 (0.0%) | 20 (100.0%) |
| Security & Protection | 12 (100.0%) | 0 (0.0%) |
| Firefighting & Prevention | 0 (0.0%) | 0 (0.0%) |
| Law Enforcement | 12 (100.0%) | 0 (0.0%) |
| Food Preparation & Serving | 30 (37.0%) | 51 (63.0%) |
| Cleaning & Maintenance | 35 (54.7%) | 29 (45.3%) |
| Personal Care & Service | 0 (0.0%) | 39 (100.0%) |
| Total (Category) | 77 (35.6%) | 139 (64.3%) |
| Total (Overall) | 502 (50.2%) | 497 (49.7%) |
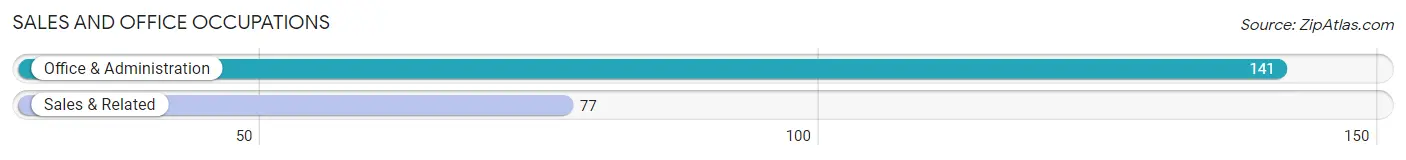
Sales and Office Occupations
The most common Sales and Office occupations in Mountain Lake Park are Office & Administration (141 | 14.1%), and Sales & Related (77 | 7.7%).
Sales and Office Occupations by Sex
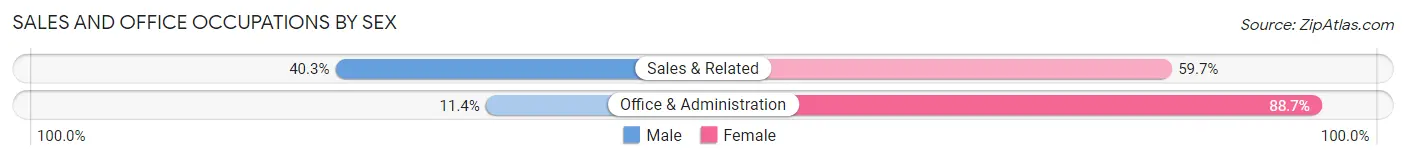
| Occupation | Male | Female |
| Sales & Related | 31 (40.3%) | 46 (59.7%) |
| Office & Administration | 16 (11.4%) | 125 (88.6%) |
| Total (Category) | 47 (21.6%) | 171 (78.4%) |
| Total (Overall) | 502 (50.2%) | 497 (49.7%) |
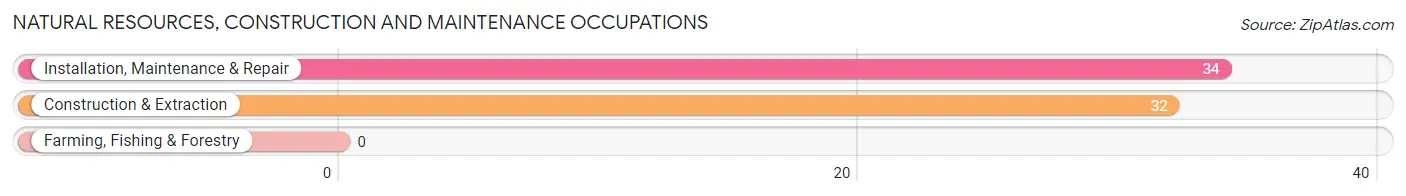
Natural Resources, Construction and Maintenance Occupations
The most common Natural Resources, Construction and Maintenance occupations in Mountain Lake Park are Installation, Maintenance & Repair (34 | 3.4%), and Construction & Extraction (32 | 3.2%).
Natural Resources, Construction and Maintenance Occupations by Sex
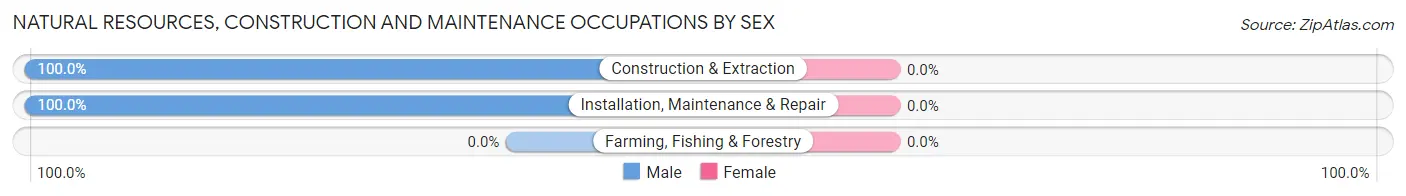
| Occupation | Male | Female |
| Farming, Fishing & Forestry | 0 (0.0%) | 0 (0.0%) |
| Construction & Extraction | 32 (100.0%) | 0 (0.0%) |
| Installation, Maintenance & Repair | 34 (100.0%) | 0 (0.0%) |
| Total (Category) | 66 (100.0%) | 0 (0.0%) |
| Total (Overall) | 502 (50.2%) | 497 (49.7%) |
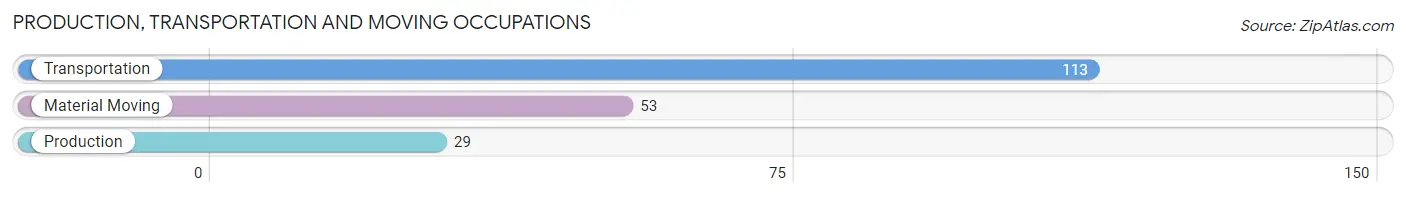
Production, Transportation and Moving Occupations
The most common Production, Transportation and Moving occupations in Mountain Lake Park are Transportation (113 | 11.3%), Material Moving (53 | 5.3%), and Production (29 | 2.9%).
Production, Transportation and Moving Occupations by Sex
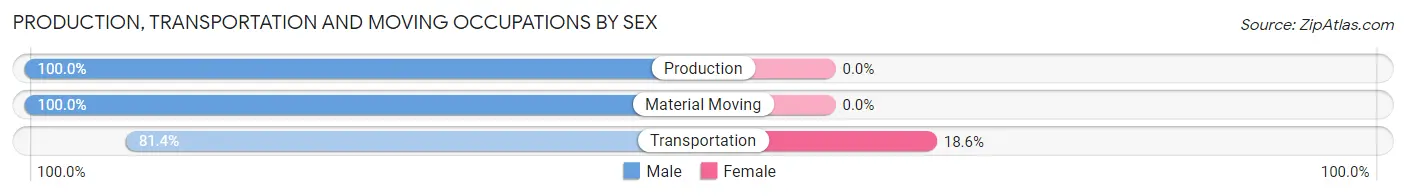
| Occupation | Male | Female |
| Production | 29 (100.0%) | 0 (0.0%) |
| Transportation | 92 (81.4%) | 21 (18.6%) |
| Material Moving | 53 (100.0%) | 0 (0.0%) |
| Total (Category) | 174 (89.2%) | 21 (10.8%) |
| Total (Overall) | 502 (50.2%) | 497 (49.7%) |
Employment Industries by Sex in Mountain Lake Park
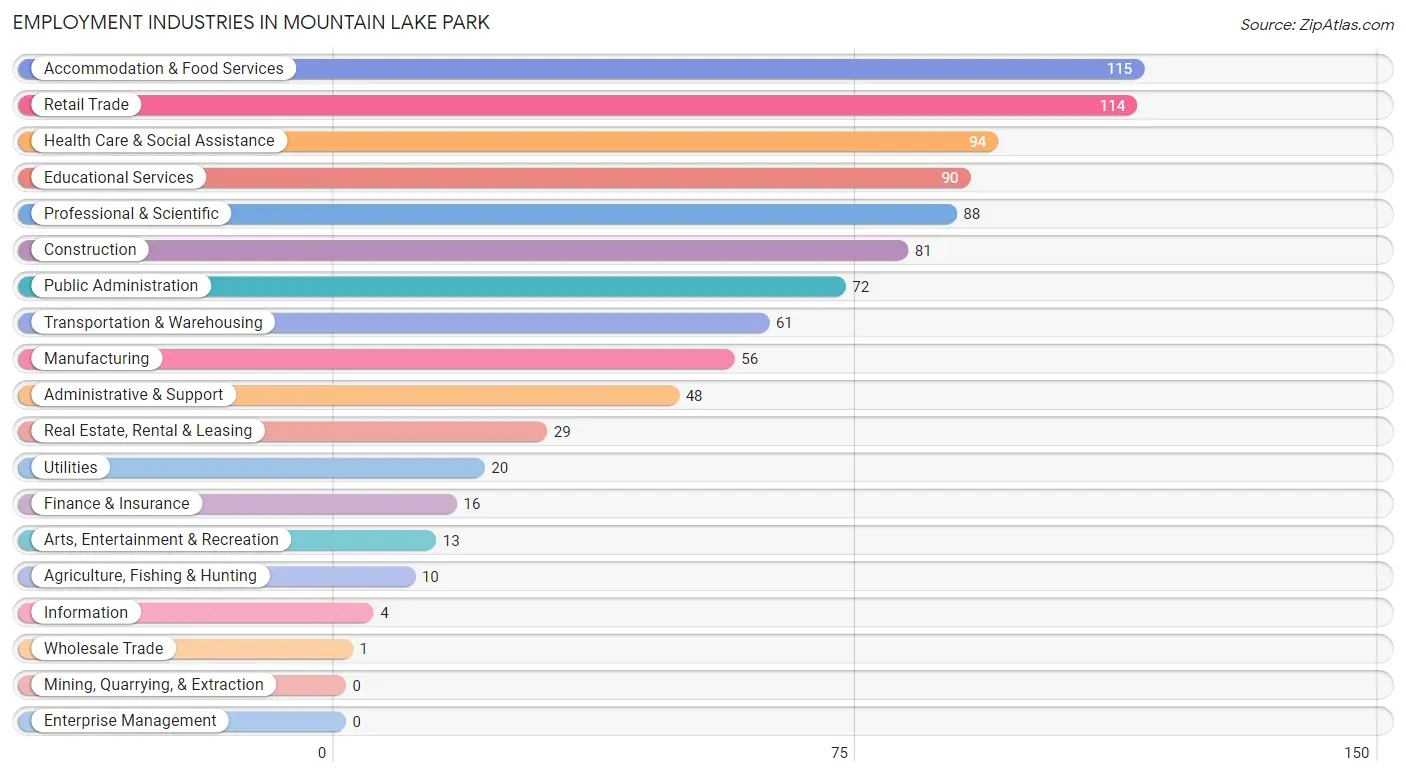
Employment Industries in Mountain Lake Park
The major employment industries in Mountain Lake Park include Accommodation & Food Services (115 | 11.5%), Retail Trade (114 | 11.4%), Health Care & Social Assistance (94 | 9.4%), Educational Services (90 | 9.0%), and Professional & Scientific (88 | 8.8%).
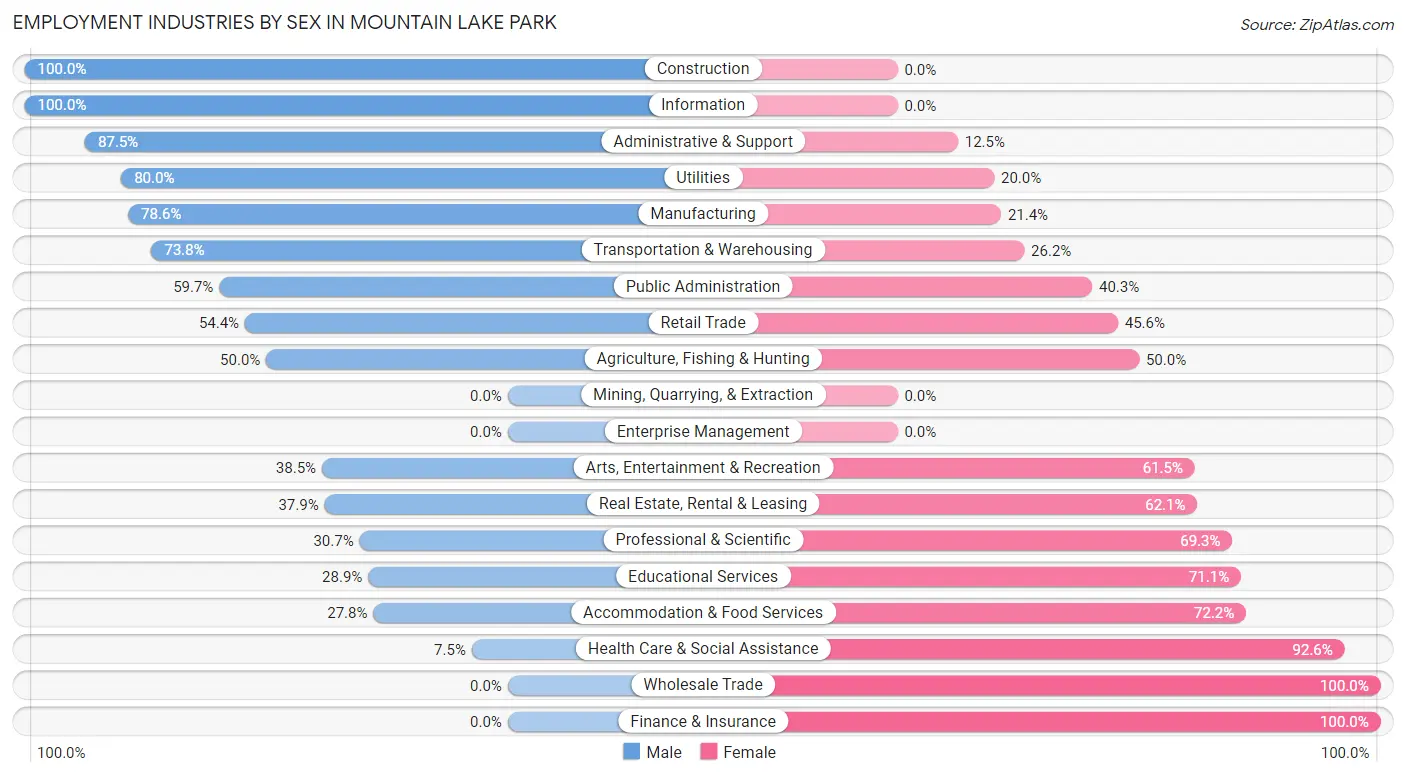
Employment Industries by Sex in Mountain Lake Park
The Mountain Lake Park industries that see more men than women are Construction (100.0%), Information (100.0%), and Administrative & Support (87.5%), whereas the industries that tend to have a higher number of women are Wholesale Trade (100.0%), Finance & Insurance (100.0%), and Health Care & Social Assistance (92.5%).
| Industry | Male | Female |
| Agriculture, Fishing & Hunting | 5 (50.0%) | 5 (50.0%) |
| Mining, Quarrying, & Extraction | 0 (0.0%) | 0 (0.0%) |
| Construction | 81 (100.0%) | 0 (0.0%) |
| Manufacturing | 44 (78.6%) | 12 (21.4%) |
| Wholesale Trade | 0 (0.0%) | 1 (100.0%) |
| Retail Trade | 62 (54.4%) | 52 (45.6%) |
| Transportation & Warehousing | 45 (73.8%) | 16 (26.2%) |
| Utilities | 16 (80.0%) | 4 (20.0%) |
| Information | 4 (100.0%) | 0 (0.0%) |
| Finance & Insurance | 0 (0.0%) | 16 (100.0%) |
| Real Estate, Rental & Leasing | 11 (37.9%) | 18 (62.1%) |
| Professional & Scientific | 27 (30.7%) | 61 (69.3%) |
| Enterprise Management | 0 (0.0%) | 0 (0.0%) |
| Administrative & Support | 42 (87.5%) | 6 (12.5%) |
| Educational Services | 26 (28.9%) | 64 (71.1%) |
| Health Care & Social Assistance | 7 (7.4%) | 87 (92.5%) |
| Arts, Entertainment & Recreation | 5 (38.5%) | 8 (61.5%) |
| Accommodation & Food Services | 32 (27.8%) | 83 (72.2%) |
| Public Administration | 43 (59.7%) | 29 (40.3%) |
| Total | 502 (50.2%) | 497 (49.7%) |
Education in Mountain Lake Park
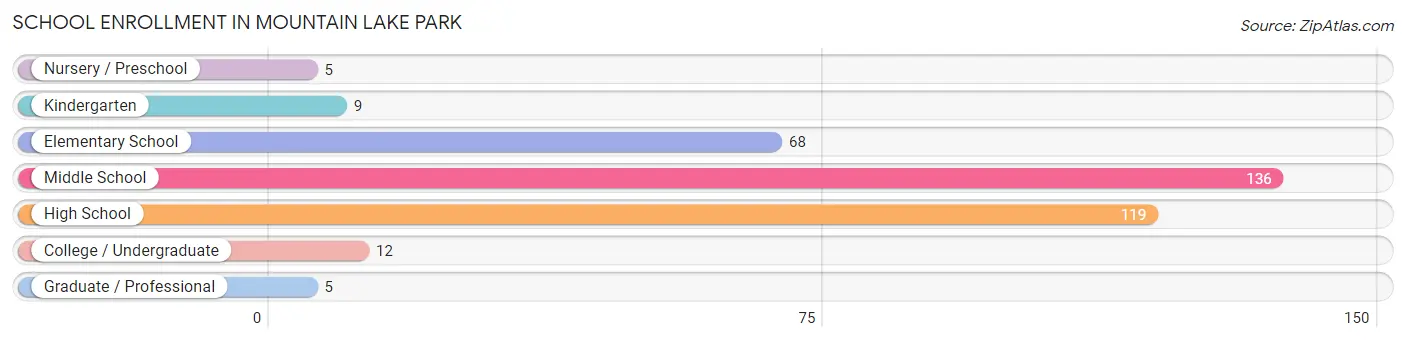
School Enrollment in Mountain Lake Park
The most common levels of schooling among the 354 students in Mountain Lake Park are middle school (136 | 38.4%), high school (119 | 33.6%), and elementary school (68 | 19.2%).
| School Level | # Students | % Students |
| Nursery / Preschool | 5 | 1.4% |
| Kindergarten | 9 | 2.5% |
| Elementary School | 68 | 19.2% |
| Middle School | 136 | 38.4% |
| High School | 119 | 33.6% |
| College / Undergraduate | 12 | 3.4% |
| Graduate / Professional | 5 | 1.4% |
| Total | 354 | 100.0% |
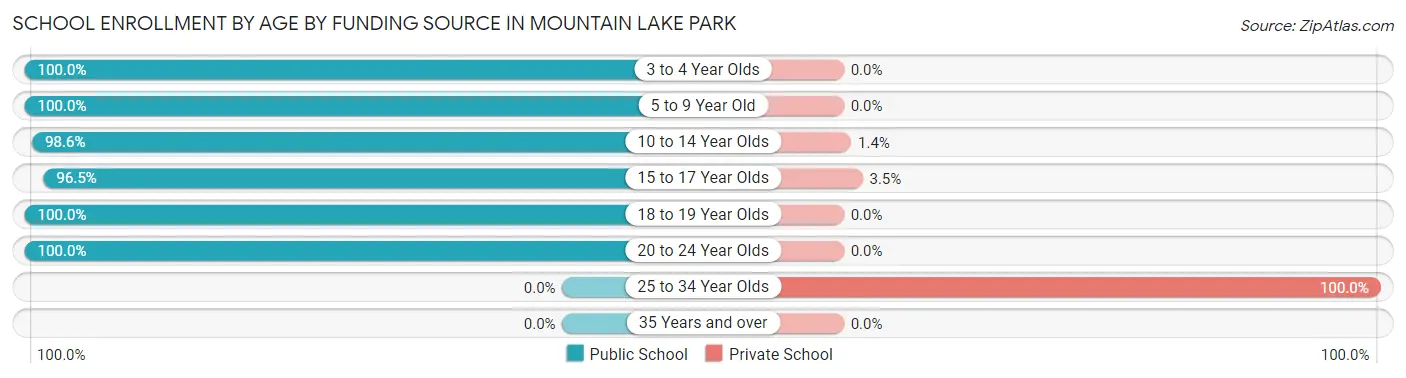
School Enrollment by Age by Funding Source in Mountain Lake Park
Out of a total of 354 students who are enrolled in schools in Mountain Lake Park, 11 (3.1%) attend a private institution, while the remaining 343 (96.9%) are enrolled in public schools. The age group of 25 to 34 year olds has the highest likelihood of being enrolled in private schools, with 5 (100.0% in the age bracket) enrolled. Conversely, the age group of 3 to 4 year olds has the lowest likelihood of being enrolled in a private school, with 5 (100.0% in the age bracket) attending a public institution.
| Age Bracket | Public School | Private School |
| 3 to 4 Year Olds | 5 (100.0%) | 0 (0.0%) |
| 5 to 9 Year Old | 68 (100.0%) | 0 (0.0%) |
| 10 to 14 Year Olds | 143 (98.6%) | 2 (1.4%) |
| 15 to 17 Year Olds | 110 (96.5%) | 4 (3.5%) |
| 18 to 19 Year Olds | 9 (100.0%) | 0 (0.0%) |
| 20 to 24 Year Olds | 8 (100.0%) | 0 (0.0%) |
| 25 to 34 Year Olds | 0 (0.0%) | 5 (100.0%) |
| 35 Years and over | 0 (0.0%) | 0 (0.0%) |
| Total | 343 (96.9%) | 11 (3.1%) |
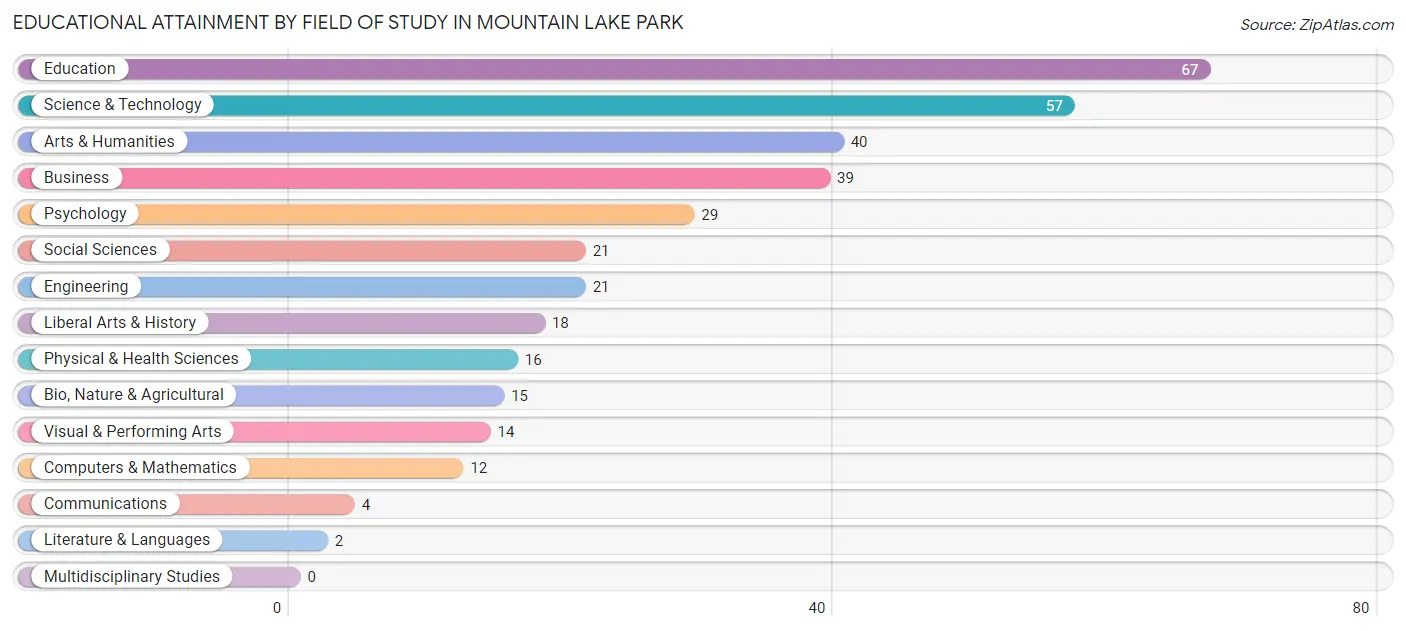
Educational Attainment by Field of Study in Mountain Lake Park
Education (67 | 18.9%), science & technology (57 | 16.1%), arts & humanities (40 | 11.3%), business (39 | 11.0%), and psychology (29 | 8.2%) are the most common fields of study among 355 individuals in Mountain Lake Park who have obtained a bachelor's degree or higher.
| Field of Study | # Graduates | % Graduates |
| Computers & Mathematics | 12 | 3.4% |
| Bio, Nature & Agricultural | 15 | 4.2% |
| Physical & Health Sciences | 16 | 4.5% |
| Psychology | 29 | 8.2% |
| Social Sciences | 21 | 5.9% |
| Engineering | 21 | 5.9% |
| Multidisciplinary Studies | 0 | 0.0% |
| Science & Technology | 57 | 16.1% |
| Business | 39 | 11.0% |
| Education | 67 | 18.9% |
| Literature & Languages | 2 | 0.6% |
| Liberal Arts & History | 18 | 5.1% |
| Visual & Performing Arts | 14 | 3.9% |
| Communications | 4 | 1.1% |
| Arts & Humanities | 40 | 11.3% |
| Total | 355 | 100.0% |
Transportation & Commute in Mountain Lake Park
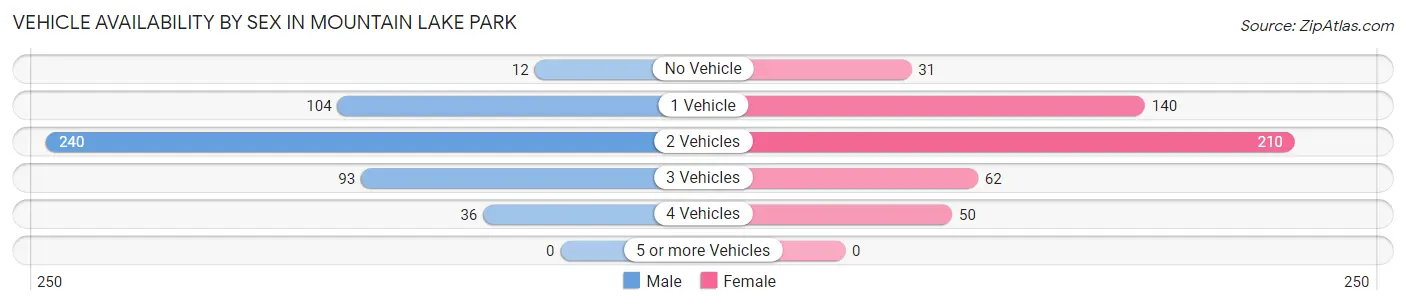
Vehicle Availability by Sex in Mountain Lake Park
The most prevalent vehicle ownership categories in Mountain Lake Park are males with 2 vehicles (240, accounting for 49.5%) and females with 2 vehicles (210, making up 48.7%).
| Vehicles Available | Male | Female |
| No Vehicle | 12 (2.5%) | 31 (6.3%) |
| 1 Vehicle | 104 (21.4%) | 140 (28.4%) |
| 2 Vehicles | 240 (49.5%) | 210 (42.6%) |
| 3 Vehicles | 93 (19.2%) | 62 (12.6%) |
| 4 Vehicles | 36 (7.4%) | 50 (10.1%) |
| 5 or more Vehicles | 0 (0.0%) | 0 (0.0%) |
| Total | 485 (100.0%) | 493 (100.0%) |
Commute Time in Mountain Lake Park
The most frequently occuring commute durations in Mountain Lake Park are 5 to 9 minutes (206 commuters, 23.1%), 20 to 24 minutes (192 commuters, 21.5%), and 10 to 14 minutes (118 commuters, 13.2%).
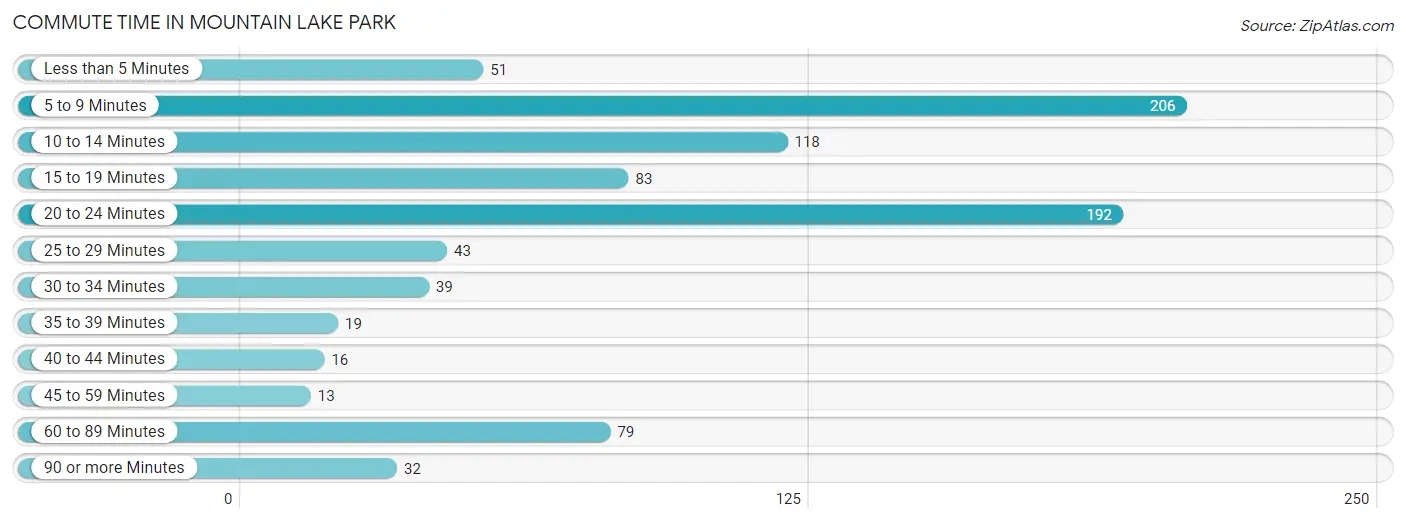
| Commute Time | # Commuters | % Commuters |
| Less than 5 Minutes | 51 | 5.7% |
| 5 to 9 Minutes | 206 | 23.1% |
| 10 to 14 Minutes | 118 | 13.2% |
| 15 to 19 Minutes | 83 | 9.3% |
| 20 to 24 Minutes | 192 | 21.5% |
| 25 to 29 Minutes | 43 | 4.8% |
| 30 to 34 Minutes | 39 | 4.4% |
| 35 to 39 Minutes | 19 | 2.1% |
| 40 to 44 Minutes | 16 | 1.8% |
| 45 to 59 Minutes | 13 | 1.5% |
| 60 to 89 Minutes | 79 | 8.9% |
| 90 or more Minutes | 32 | 3.6% |
Commute Time by Sex in Mountain Lake Park
The most common commute times in Mountain Lake Park are 5 to 9 minutes (97 commuters, 21.1%) for males and 20 to 24 minutes (119 commuters, 27.6%) for females.
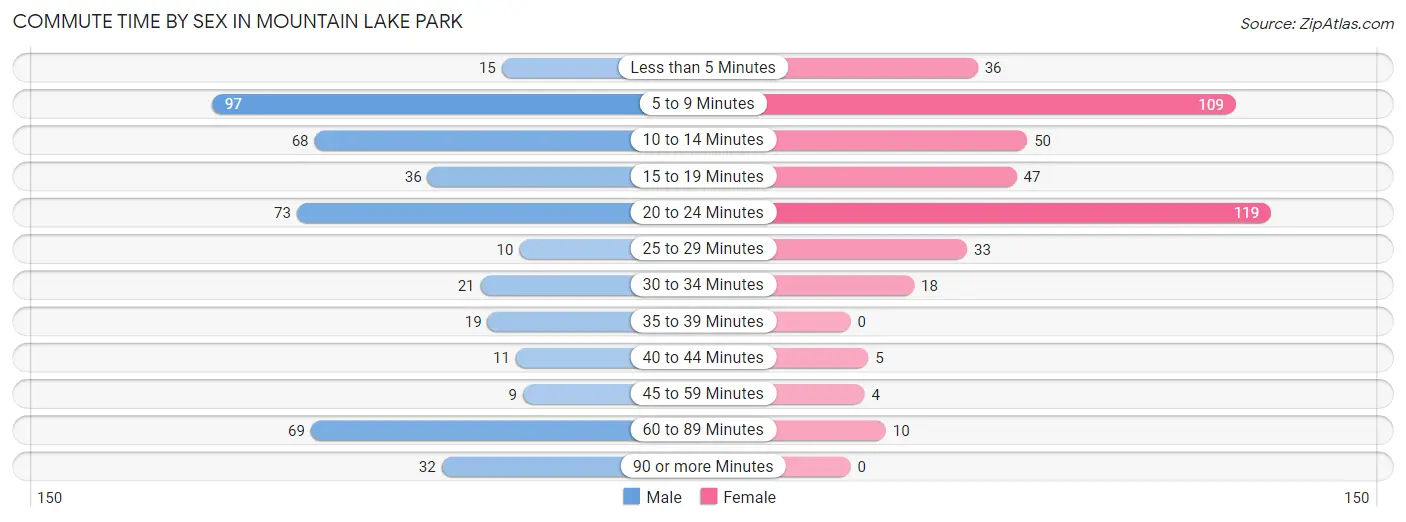
| Commute Time | Male | Female |
| Less than 5 Minutes | 15 (3.3%) | 36 (8.4%) |
| 5 to 9 Minutes | 97 (21.1%) | 109 (25.3%) |
| 10 to 14 Minutes | 68 (14.8%) | 50 (11.6%) |
| 15 to 19 Minutes | 36 (7.8%) | 47 (10.9%) |
| 20 to 24 Minutes | 73 (15.9%) | 119 (27.6%) |
| 25 to 29 Minutes | 10 (2.2%) | 33 (7.7%) |
| 30 to 34 Minutes | 21 (4.6%) | 18 (4.2%) |
| 35 to 39 Minutes | 19 (4.1%) | 0 (0.0%) |
| 40 to 44 Minutes | 11 (2.4%) | 5 (1.2%) |
| 45 to 59 Minutes | 9 (2.0%) | 4 (0.9%) |
| 60 to 89 Minutes | 69 (15.0%) | 10 (2.3%) |
| 90 or more Minutes | 32 (7.0%) | 0 (0.0%) |
Time of Departure to Work by Sex in Mountain Lake Park
The most frequent times of departure to work in Mountain Lake Park are 12:00 PM to 3:59 PM (80, 17.4%) for males and 7:30 AM to 7:59 AM (115, 26.7%) for females.
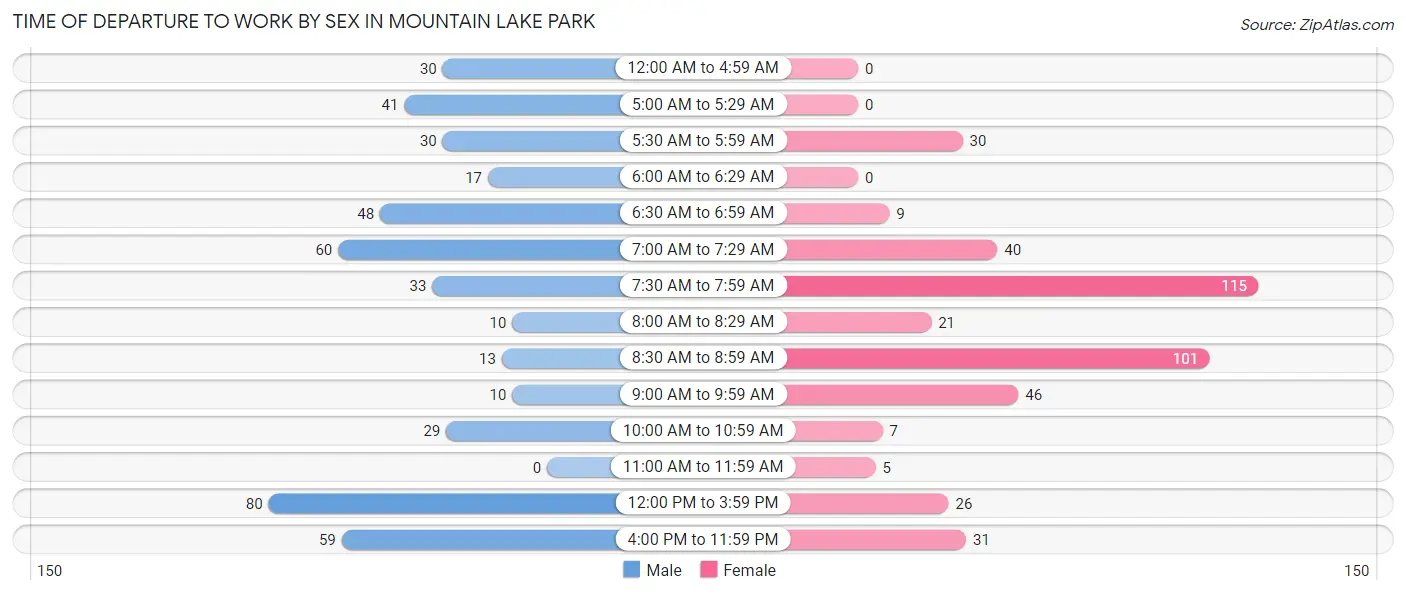
| Time of Departure | Male | Female |
| 12:00 AM to 4:59 AM | 30 (6.5%) | 0 (0.0%) |
| 5:00 AM to 5:29 AM | 41 (8.9%) | 0 (0.0%) |
| 5:30 AM to 5:59 AM | 30 (6.5%) | 30 (7.0%) |
| 6:00 AM to 6:29 AM | 17 (3.7%) | 0 (0.0%) |
| 6:30 AM to 6:59 AM | 48 (10.4%) | 9 (2.1%) |
| 7:00 AM to 7:29 AM | 60 (13.0%) | 40 (9.3%) |
| 7:30 AM to 7:59 AM | 33 (7.2%) | 115 (26.7%) |
| 8:00 AM to 8:29 AM | 10 (2.2%) | 21 (4.9%) |
| 8:30 AM to 8:59 AM | 13 (2.8%) | 101 (23.4%) |
| 9:00 AM to 9:59 AM | 10 (2.2%) | 46 (10.7%) |
| 10:00 AM to 10:59 AM | 29 (6.3%) | 7 (1.6%) |
| 11:00 AM to 11:59 AM | 0 (0.0%) | 5 (1.2%) |
| 12:00 PM to 3:59 PM | 80 (17.4%) | 26 (6.0%) |
| 4:00 PM to 11:59 PM | 59 (12.8%) | 31 (7.2%) |
| Total | 460 (100.0%) | 431 (100.0%) |
Housing Occupancy in Mountain Lake Park
Occupancy by Ownership in Mountain Lake Park
Of the total 960 dwellings in Mountain Lake Park, owner-occupied units account for 603 (62.8%), while renter-occupied units make up 357 (37.2%).
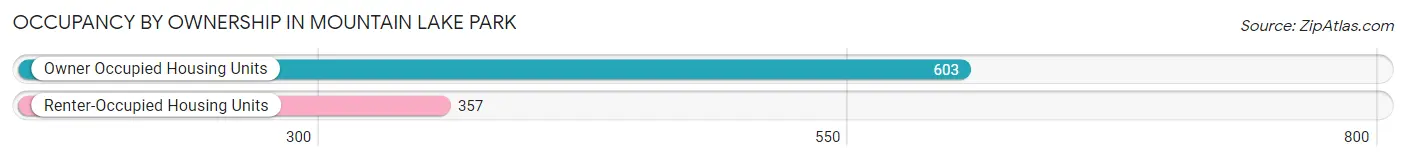
| Occupancy | # Housing Units | % Housing Units |
| Owner Occupied Housing Units | 603 | 62.8% |
| Renter-Occupied Housing Units | 357 | 37.2% |
| Total Occupied Housing Units | 960 | 100.0% |
Occupancy by Household Size in Mountain Lake Park
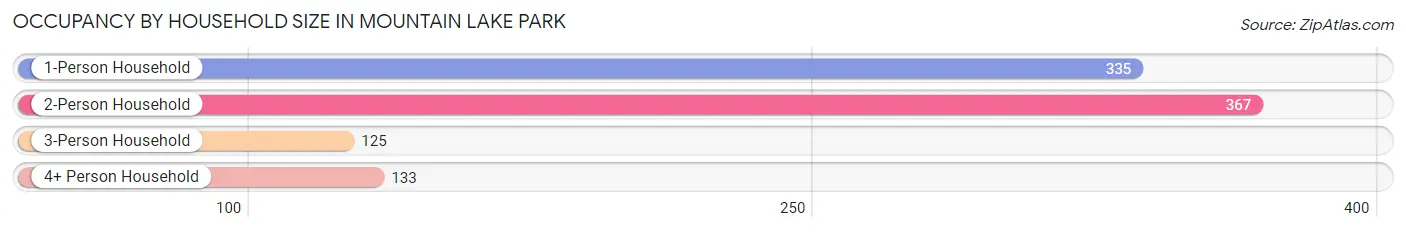
| Household Size | # Housing Units | % Housing Units |
| 1-Person Household | 335 | 34.9% |
| 2-Person Household | 367 | 38.2% |
| 3-Person Household | 125 | 13.0% |
| 4+ Person Household | 133 | 13.9% |
| Total Housing Units | 960 | 100.0% |
Occupancy by Ownership by Household Size in Mountain Lake Park
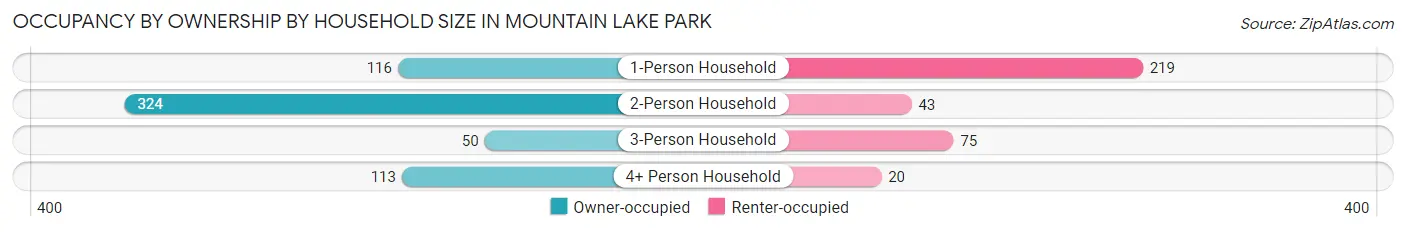
| Household Size | Owner-occupied | Renter-occupied |
| 1-Person Household | 116 (34.6%) | 219 (65.4%) |
| 2-Person Household | 324 (88.3%) | 43 (11.7%) |
| 3-Person Household | 50 (40.0%) | 75 (60.0%) |
| 4+ Person Household | 113 (85.0%) | 20 (15.0%) |
| Total Housing Units | 603 (62.8%) | 357 (37.2%) |
Occupancy by Educational Attainment in Mountain Lake Park
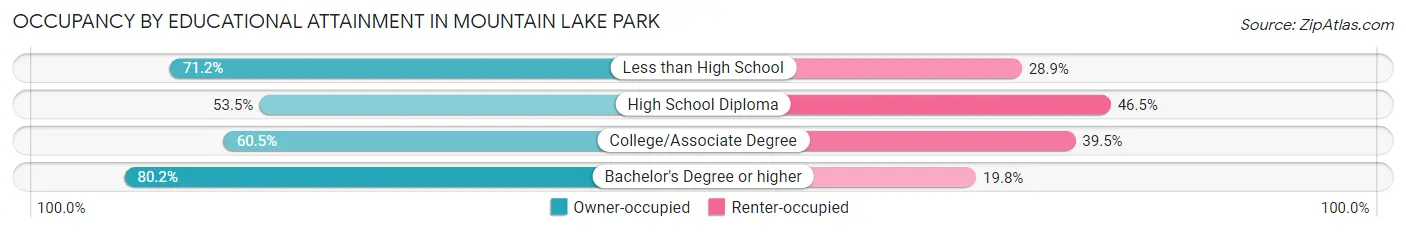
| Household Size | Owner-occupied | Renter-occupied |
| Less than High School | 37 (71.2%) | 15 (28.8%) |
| High School Diploma | 214 (53.5%) | 186 (46.5%) |
| College/Associate Degree | 170 (60.5%) | 111 (39.5%) |
| Bachelor's Degree or higher | 182 (80.2%) | 45 (19.8%) |
Occupancy by Age of Householder in Mountain Lake Park
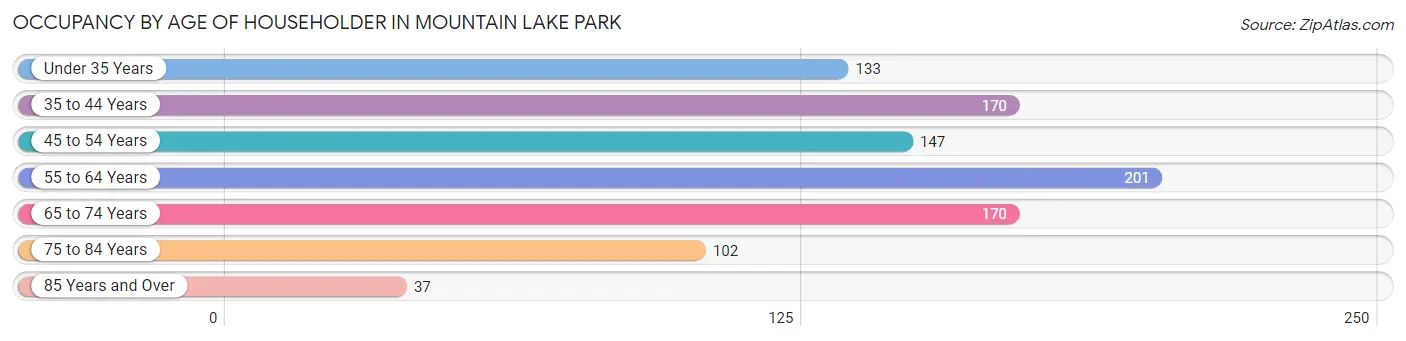
| Age Bracket | # Households | % Households |
| Under 35 Years | 133 | 13.9% |
| 35 to 44 Years | 170 | 17.7% |
| 45 to 54 Years | 147 | 15.3% |
| 55 to 64 Years | 201 | 20.9% |
| 65 to 74 Years | 170 | 17.7% |
| 75 to 84 Years | 102 | 10.6% |
| 85 Years and Over | 37 | 3.8% |
| Total | 960 | 100.0% |
Housing Finances in Mountain Lake Park
Median Income by Occupancy in Mountain Lake Park
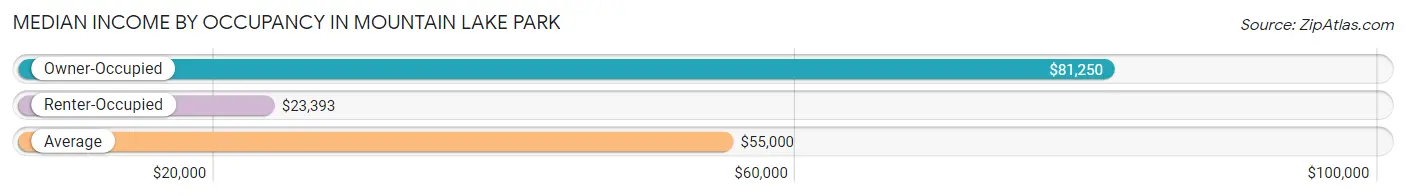
| Occupancy Type | # Households | Median Income |
| Owner-Occupied | 603 (62.8%) | $81,250 |
| Renter-Occupied | 357 (37.2%) | $23,393 |
| Average | 960 (100.0%) | $55,000 |
Occupancy by Householder Income Bracket in Mountain Lake Park
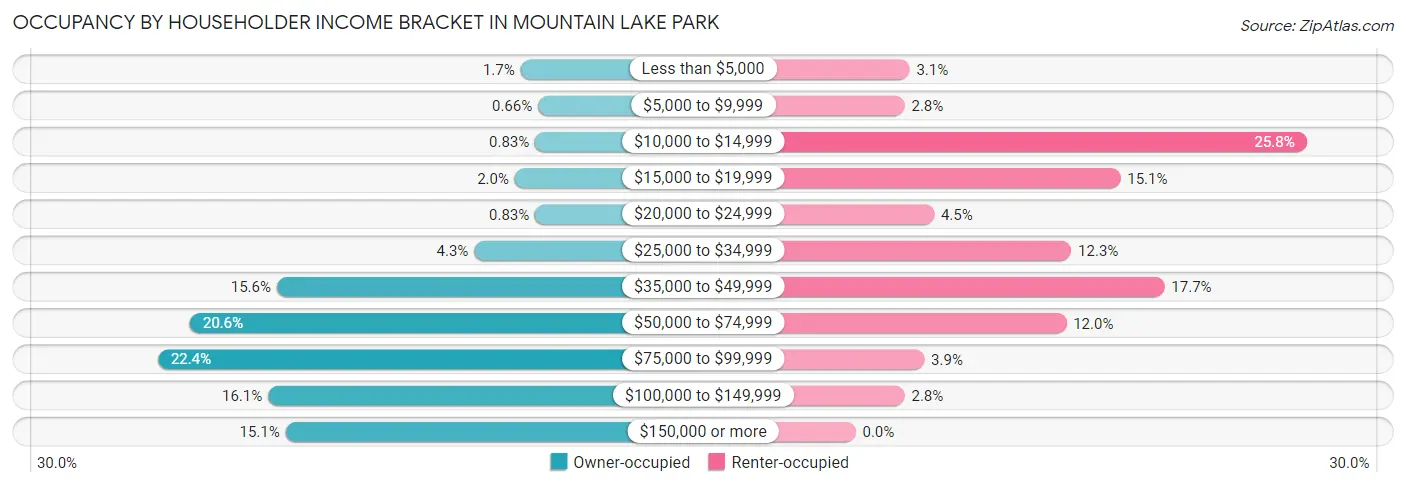
| Income Bracket | Owner-occupied | Renter-occupied |
| Less than $5,000 | 10 (1.7%) | 11 (3.1%) |
| $5,000 to $9,999 | 4 (0.7%) | 10 (2.8%) |
| $10,000 to $14,999 | 5 (0.8%) | 92 (25.8%) |
| $15,000 to $19,999 | 12 (2.0%) | 54 (15.1%) |
| $20,000 to $24,999 | 5 (0.8%) | 16 (4.5%) |
| $25,000 to $34,999 | 26 (4.3%) | 44 (12.3%) |
| $35,000 to $49,999 | 94 (15.6%) | 63 (17.6%) |
| $50,000 to $74,999 | 124 (20.6%) | 43 (12.0%) |
| $75,000 to $99,999 | 135 (22.4%) | 14 (3.9%) |
| $100,000 to $149,999 | 97 (16.1%) | 10 (2.8%) |
| $150,000 or more | 91 (15.1%) | 0 (0.0%) |
| Total | 603 (100.0%) | 357 (100.0%) |
Monthly Housing Cost Tiers in Mountain Lake Park
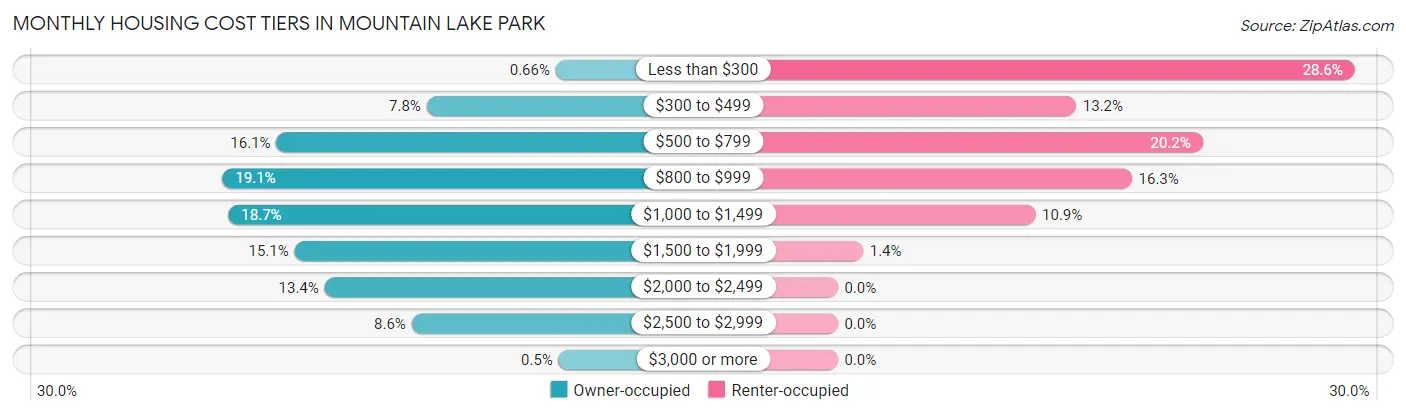
| Monthly Cost | Owner-occupied | Renter-occupied |
| Less than $300 | 4 (0.7%) | 102 (28.6%) |
| $300 to $499 | 47 (7.8%) | 47 (13.2%) |
| $500 to $799 | 97 (16.1%) | 72 (20.2%) |
| $800 to $999 | 115 (19.1%) | 58 (16.3%) |
| $1,000 to $1,499 | 113 (18.7%) | 39 (10.9%) |
| $1,500 to $1,999 | 91 (15.1%) | 5 (1.4%) |
| $2,000 to $2,499 | 81 (13.4%) | 0 (0.0%) |
| $2,500 to $2,999 | 52 (8.6%) | 0 (0.0%) |
| $3,000 or more | 3 (0.5%) | 0 (0.0%) |
| Total | 603 (100.0%) | 357 (100.0%) |
Physical Housing Characteristics in Mountain Lake Park
Housing Structures in Mountain Lake Park
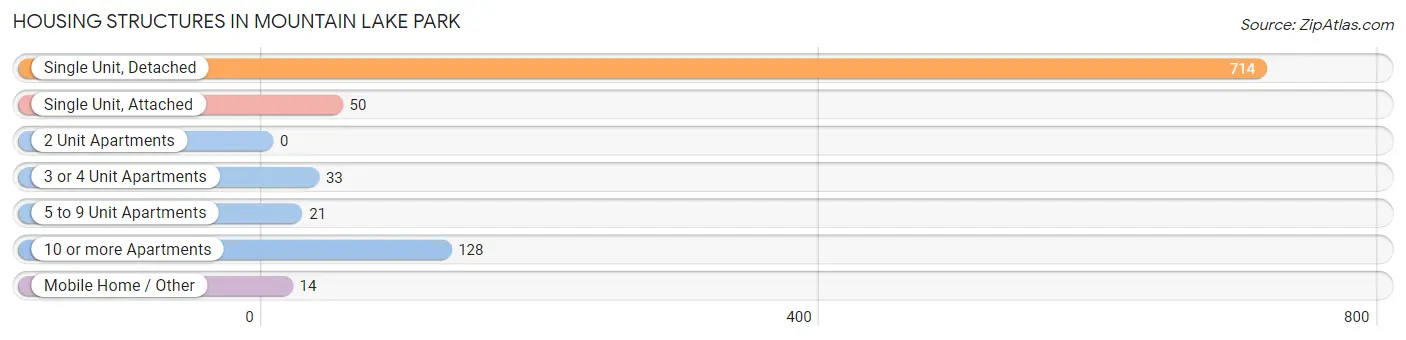
| Structure Type | # Housing Units | % Housing Units |
| Single Unit, Detached | 714 | 74.4% |
| Single Unit, Attached | 50 | 5.2% |
| 2 Unit Apartments | 0 | 0.0% |
| 3 or 4 Unit Apartments | 33 | 3.4% |
| 5 to 9 Unit Apartments | 21 | 2.2% |
| 10 or more Apartments | 128 | 13.3% |
| Mobile Home / Other | 14 | 1.5% |
| Total | 960 | 100.0% |
Housing Structures by Occupancy in Mountain Lake Park
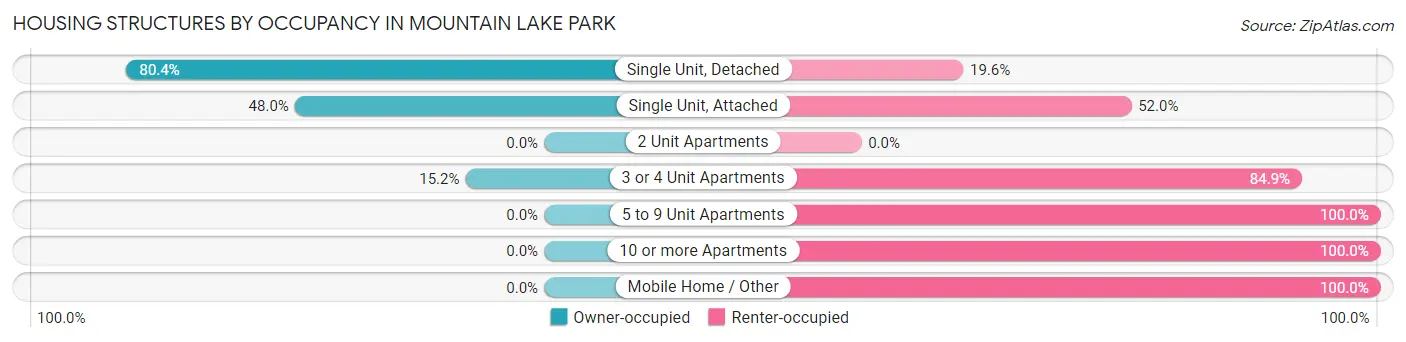
| Structure Type | Owner-occupied | Renter-occupied |
| Single Unit, Detached | 574 (80.4%) | 140 (19.6%) |
| Single Unit, Attached | 24 (48.0%) | 26 (52.0%) |
| 2 Unit Apartments | 0 (0.0%) | 0 (0.0%) |
| 3 or 4 Unit Apartments | 5 (15.1%) | 28 (84.9%) |
| 5 to 9 Unit Apartments | 0 (0.0%) | 21 (100.0%) |
| 10 or more Apartments | 0 (0.0%) | 128 (100.0%) |
| Mobile Home / Other | 0 (0.0%) | 14 (100.0%) |
| Total | 603 (62.8%) | 357 (37.2%) |
Housing Structures by Number of Rooms in Mountain Lake Park
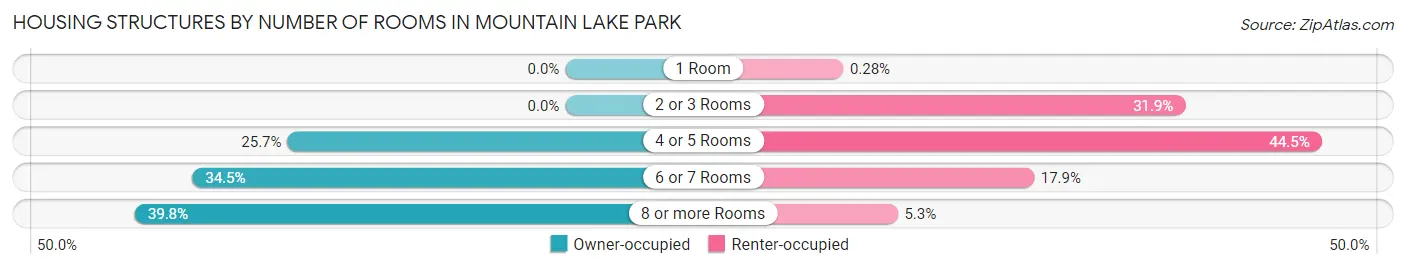
| Number of Rooms | Owner-occupied | Renter-occupied |
| 1 Room | 0 (0.0%) | 1 (0.3%) |
| 2 or 3 Rooms | 0 (0.0%) | 114 (31.9%) |
| 4 or 5 Rooms | 155 (25.7%) | 159 (44.5%) |
| 6 or 7 Rooms | 208 (34.5%) | 64 (17.9%) |
| 8 or more Rooms | 240 (39.8%) | 19 (5.3%) |
| Total | 603 (100.0%) | 357 (100.0%) |
Housing Structure by Heating Type in Mountain Lake Park
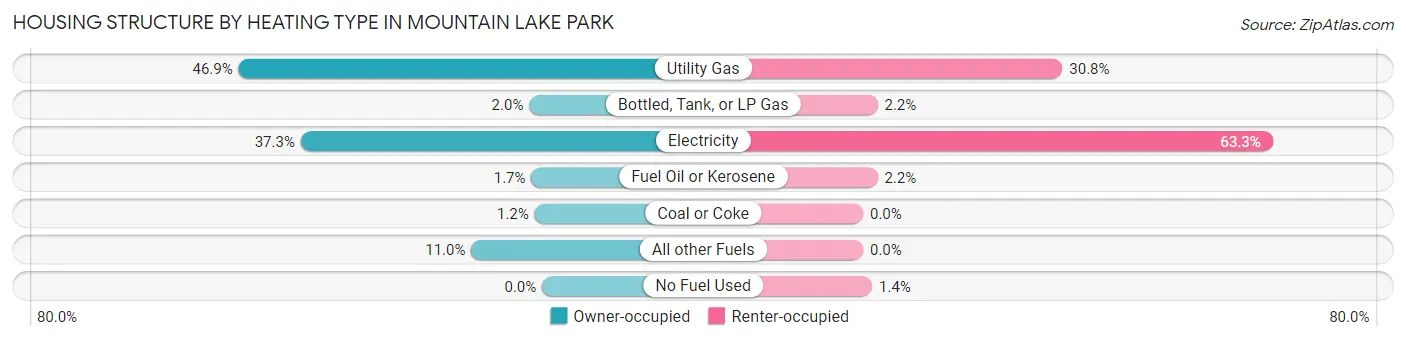
| Heating Type | Owner-occupied | Renter-occupied |
| Utility Gas | 283 (46.9%) | 110 (30.8%) |
| Bottled, Tank, or LP Gas | 12 (2.0%) | 8 (2.2%) |
| Electricity | 225 (37.3%) | 226 (63.3%) |
| Fuel Oil or Kerosene | 10 (1.7%) | 8 (2.2%) |
| Coal or Coke | 7 (1.2%) | 0 (0.0%) |
| All other Fuels | 66 (11.0%) | 0 (0.0%) |
| No Fuel Used | 0 (0.0%) | 5 (1.4%) |
| Total | 603 (100.0%) | 357 (100.0%) |
Household Vehicle Usage in Mountain Lake Park
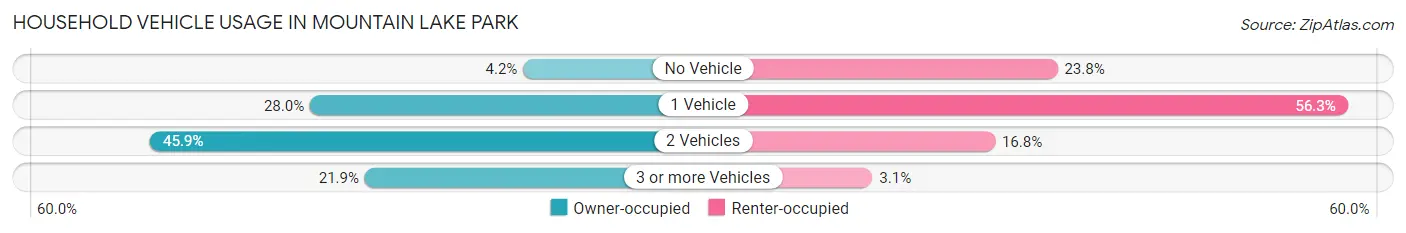
| Vehicles per Household | Owner-occupied | Renter-occupied |
| No Vehicle | 25 (4.2%) | 85 (23.8%) |
| 1 Vehicle | 169 (28.0%) | 201 (56.3%) |
| 2 Vehicles | 277 (45.9%) | 60 (16.8%) |
| 3 or more Vehicles | 132 (21.9%) | 11 (3.1%) |
| Total | 603 (100.0%) | 357 (100.0%) |
Real Estate & Mortgages in Mountain Lake Park
Real Estate and Mortgage Overview in Mountain Lake Park
| Characteristic | Without Mortgage | With Mortgage |
| Housing Units | 161 | 442 |
| Median Property Value | $236,300 | $173,800 |
| Median Household Income | $80,250 | $59 |
| Monthly Housing Costs | $643 | $3 |
| Real Estate Taxes | $2,638 | $5 |
Property Value by Mortgage Status in Mountain Lake Park
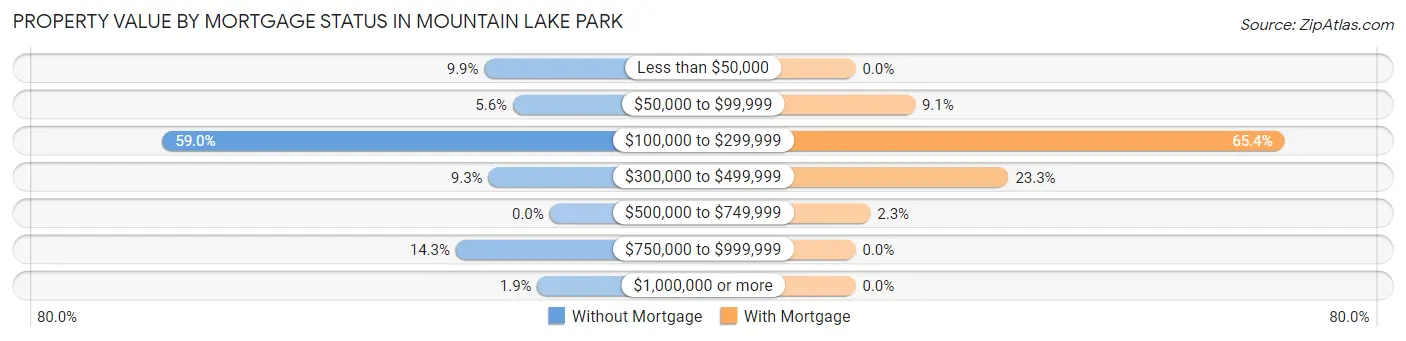
| Property Value | Without Mortgage | With Mortgage |
| Less than $50,000 | 16 (9.9%) | 0 (0.0%) |
| $50,000 to $99,999 | 9 (5.6%) | 40 (9.0%) |
| $100,000 to $299,999 | 95 (59.0%) | 289 (65.4%) |
| $300,000 to $499,999 | 15 (9.3%) | 103 (23.3%) |
| $500,000 to $749,999 | 0 (0.0%) | 10 (2.3%) |
| $750,000 to $999,999 | 23 (14.3%) | 0 (0.0%) |
| $1,000,000 or more | 3 (1.9%) | 0 (0.0%) |
| Total | 161 (100.0%) | 442 (100.0%) |
Household Income by Mortgage Status in Mountain Lake Park
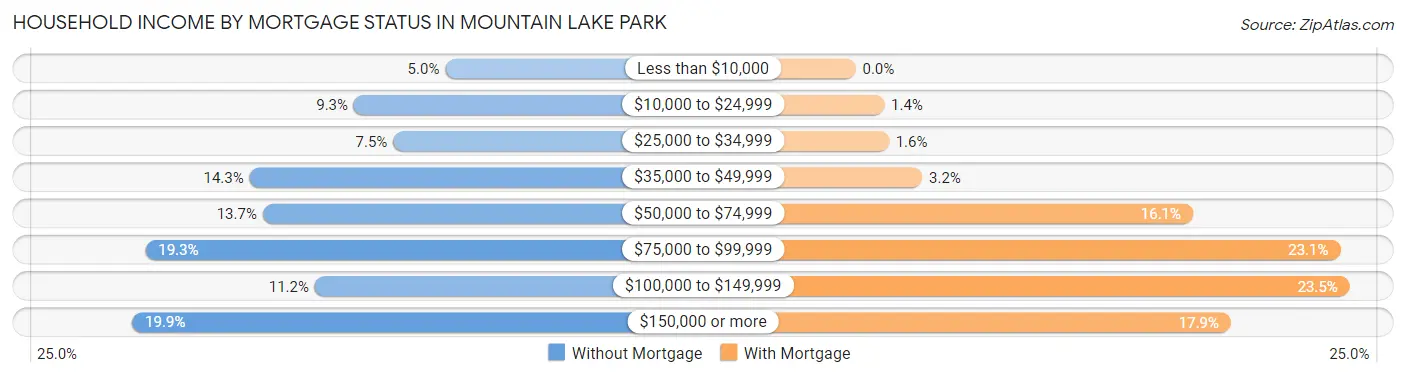
| Household Income | Without Mortgage | With Mortgage |
| Less than $10,000 | 8 (5.0%) | 0 (0.0%) |
| $10,000 to $24,999 | 15 (9.3%) | 6 (1.4%) |
| $25,000 to $34,999 | 12 (7.4%) | 7 (1.6%) |
| $35,000 to $49,999 | 23 (14.3%) | 14 (3.2%) |
| $50,000 to $74,999 | 22 (13.7%) | 71 (16.1%) |
| $75,000 to $99,999 | 31 (19.3%) | 102 (23.1%) |
| $100,000 to $149,999 | 18 (11.2%) | 104 (23.5%) |
| $150,000 or more | 32 (19.9%) | 79 (17.9%) |
| Total | 161 (100.0%) | 442 (100.0%) |
Property Value to Household Income Ratio in Mountain Lake Park
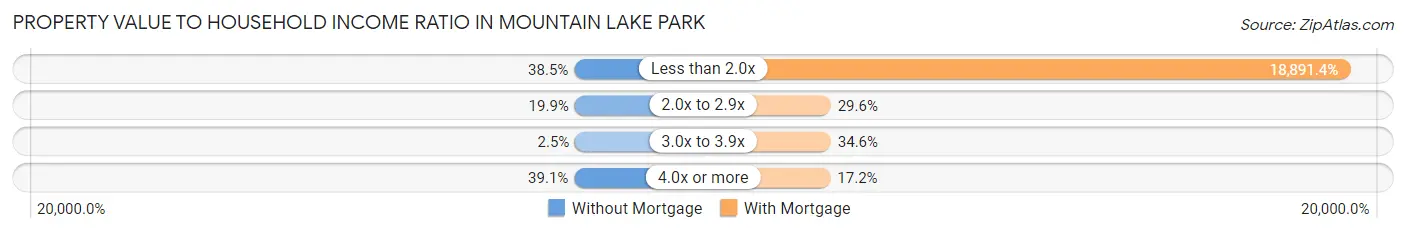
| Value-to-Income Ratio | Without Mortgage | With Mortgage |
| Less than 2.0x | 62 (38.5%) | 83,500 (18,891.4%) |
| 2.0x to 2.9x | 32 (19.9%) | 131 (29.6%) |
| 3.0x to 3.9x | 4 (2.5%) | 153 (34.6%) |
| 4.0x or more | 63 (39.1%) | 76 (17.2%) |
| Total | 161 (100.0%) | 442 (100.0%) |
Real Estate Taxes by Mortgage Status in Mountain Lake Park
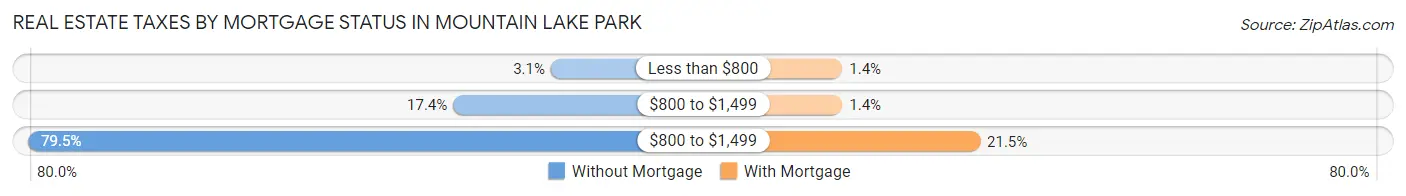
| Property Taxes | Without Mortgage | With Mortgage |
| Less than $800 | 5 (3.1%) | 6 (1.4%) |
| $800 to $1,499 | 28 (17.4%) | 6 (1.4%) |
| $800 to $1,499 | 128 (79.5%) | 95 (21.5%) |
| Total | 161 (100.0%) | 442 (100.0%) |
Health & Disability in Mountain Lake Park
Health Insurance Coverage by Age in Mountain Lake Park
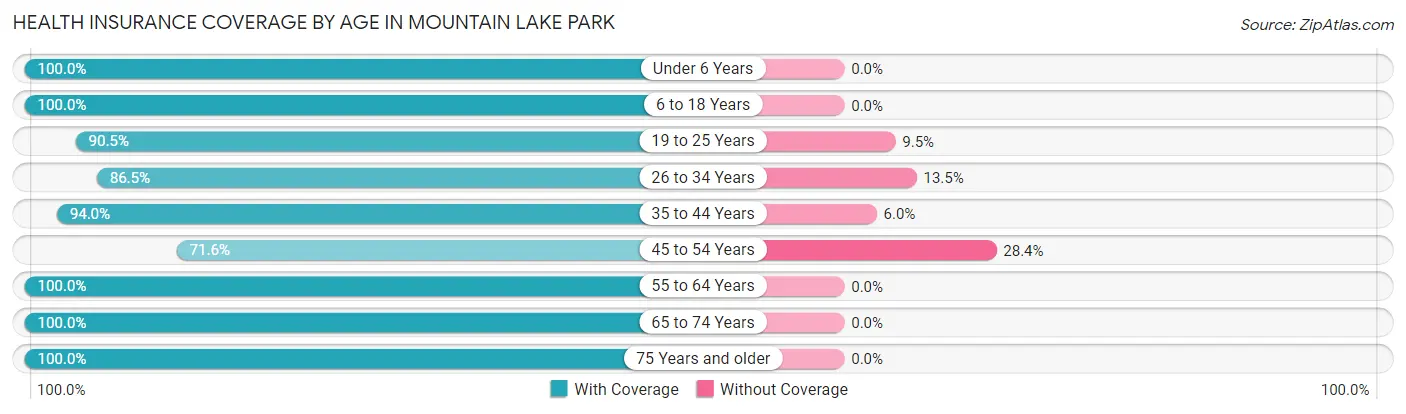
| Age Bracket | With Coverage | Without Coverage |
| Under 6 Years | 89 (100.0%) | 0 (0.0%) |
| 6 to 18 Years | 344 (100.0%) | 0 (0.0%) |
| 19 to 25 Years | 95 (90.5%) | 10 (9.5%) |
| 26 to 34 Years | 167 (86.5%) | 26 (13.5%) |
| 35 to 44 Years | 312 (94.0%) | 20 (6.0%) |
| 45 to 54 Years | 144 (71.6%) | 57 (28.4%) |
| 55 to 64 Years | 320 (100.0%) | 0 (0.0%) |
| 65 to 74 Years | 240 (100.0%) | 0 (0.0%) |
| 75 Years and older | 192 (100.0%) | 0 (0.0%) |
| Total | 1,903 (94.4%) | 113 (5.6%) |
Health Insurance Coverage by Citizenship Status in Mountain Lake Park
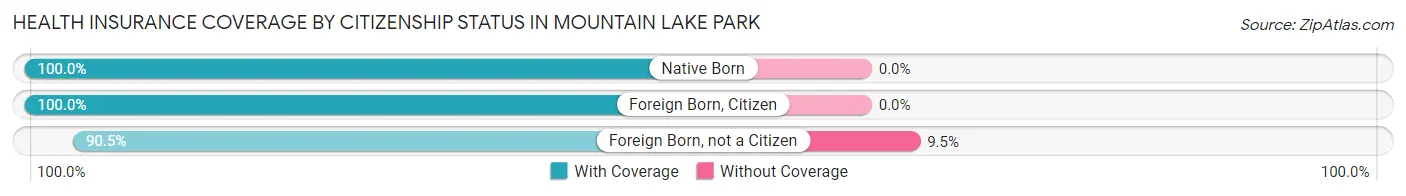
| Citizenship Status | With Coverage | Without Coverage |
| Native Born | 89 (100.0%) | 0 (0.0%) |
| Foreign Born, Citizen | 344 (100.0%) | 0 (0.0%) |
| Foreign Born, not a Citizen | 95 (90.5%) | 10 (9.5%) |
Health Insurance Coverage by Household Income in Mountain Lake Park
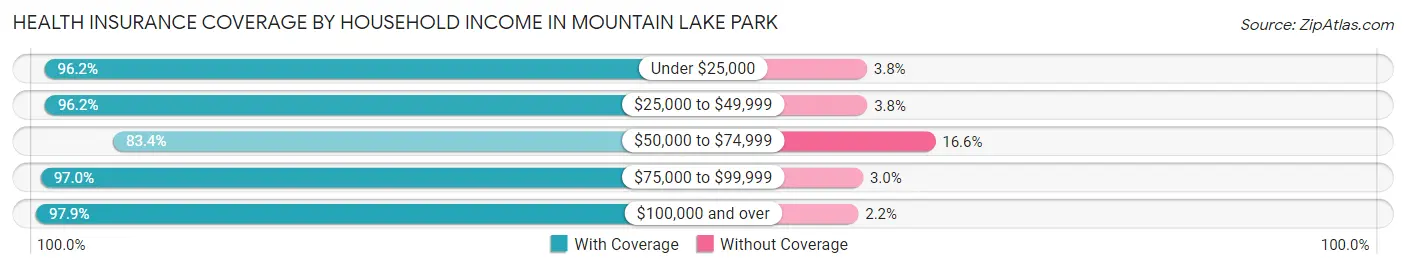
| Household Income | With Coverage | Without Coverage |
| Under $25,000 | 256 (96.2%) | 10 (3.8%) |
| $25,000 to $49,999 | 427 (96.2%) | 17 (3.8%) |
| $50,000 to $74,999 | 317 (83.4%) | 63 (16.6%) |
| $75,000 to $99,999 | 352 (97.0%) | 11 (3.0%) |
| $100,000 and over | 546 (97.9%) | 12 (2.1%) |
Public vs Private Health Insurance Coverage by Age in Mountain Lake Park
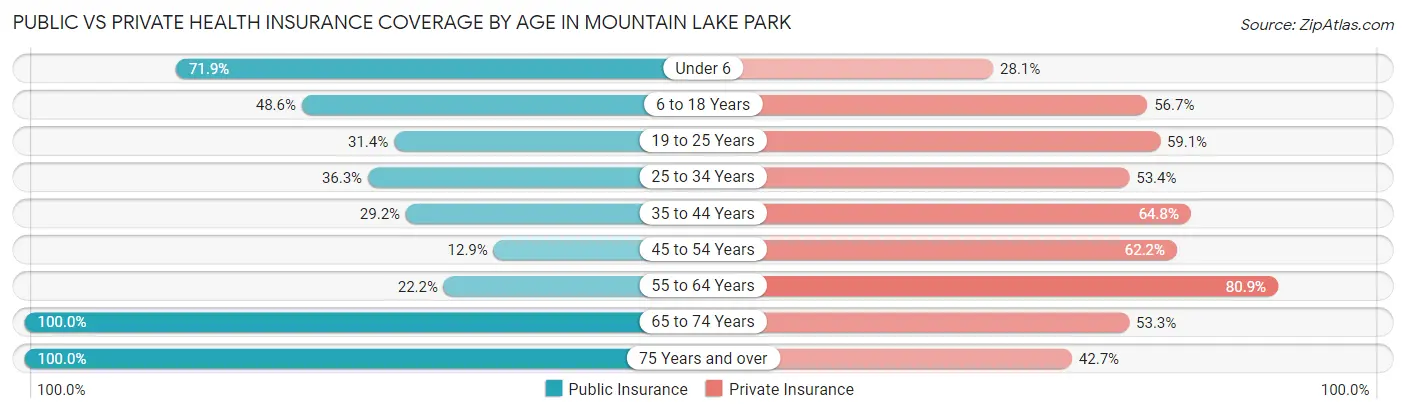
| Age Bracket | Public Insurance | Private Insurance |
| Under 6 | 64 (71.9%) | 25 (28.1%) |
| 6 to 18 Years | 167 (48.5%) | 195 (56.7%) |
| 19 to 25 Years | 33 (31.4%) | 62 (59.1%) |
| 25 to 34 Years | 70 (36.3%) | 103 (53.4%) |
| 35 to 44 Years | 97 (29.2%) | 215 (64.8%) |
| 45 to 54 Years | 26 (12.9%) | 125 (62.2%) |
| 55 to 64 Years | 71 (22.2%) | 259 (80.9%) |
| 65 to 74 Years | 240 (100.0%) | 128 (53.3%) |
| 75 Years and over | 192 (100.0%) | 82 (42.7%) |
| Total | 960 (47.6%) | 1,194 (59.2%) |
Disability Status by Sex by Age in Mountain Lake Park
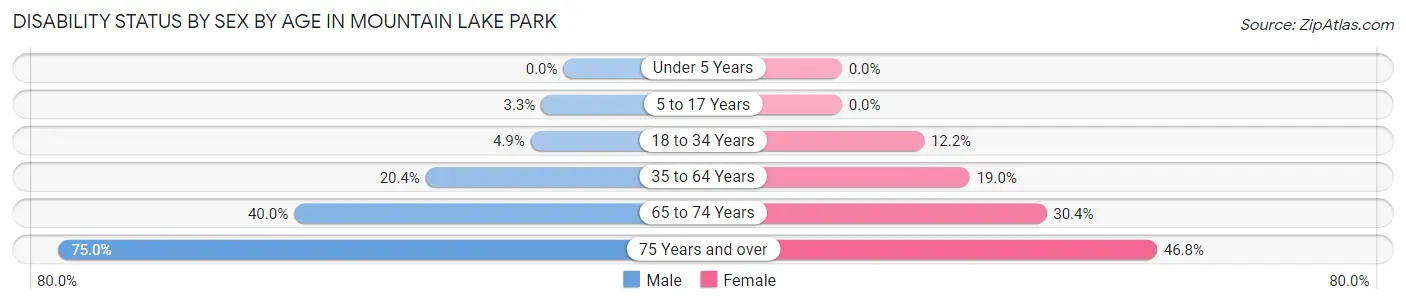
| Age Bracket | Male | Female |
| Under 5 Years | 0 (0.0%) | 0 (0.0%) |
| 5 to 17 Years | 7 (3.3%) | 0 (0.0%) |
| 18 to 34 Years | 7 (4.9%) | 20 (12.2%) |
| 35 to 64 Years | 84 (20.4%) | 84 (19.0%) |
| 65 to 74 Years | 42 (40.0%) | 41 (30.4%) |
| 75 Years and over | 51 (75.0%) | 58 (46.8%) |
Disability Class by Sex by Age in Mountain Lake Park
Disability Class: Hearing Difficulty
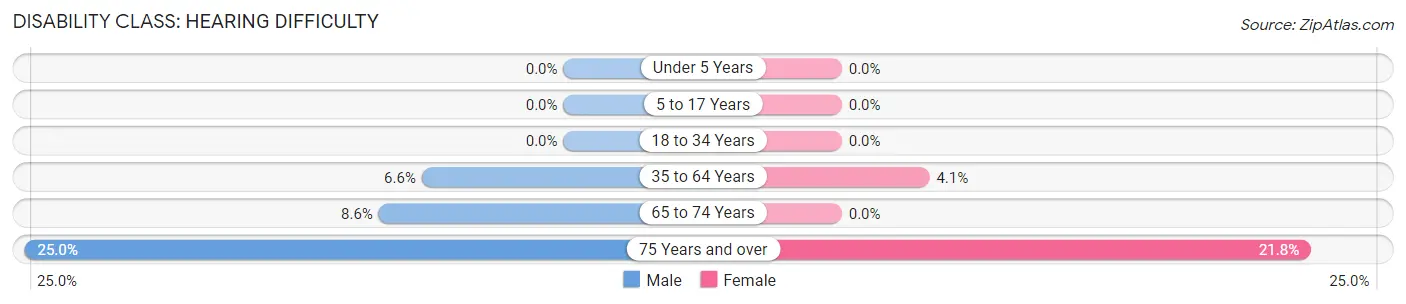
| Age Bracket | Male | Female |
| Under 5 Years | 0 (0.0%) | 0 (0.0%) |
| 5 to 17 Years | 0 (0.0%) | 0 (0.0%) |
| 18 to 34 Years | 0 (0.0%) | 0 (0.0%) |
| 35 to 64 Years | 27 (6.6%) | 18 (4.1%) |
| 65 to 74 Years | 9 (8.6%) | 0 (0.0%) |
| 75 Years and over | 17 (25.0%) | 27 (21.8%) |
Disability Class: Vision Difficulty
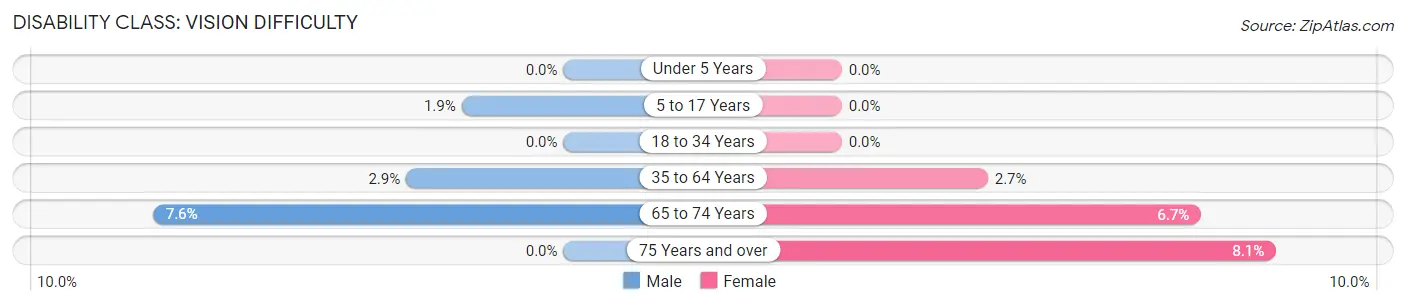
| Age Bracket | Male | Female |
| Under 5 Years | 0 (0.0%) | 0 (0.0%) |
| 5 to 17 Years | 4 (1.9%) | 0 (0.0%) |
| 18 to 34 Years | 0 (0.0%) | 0 (0.0%) |
| 35 to 64 Years | 12 (2.9%) | 12 (2.7%) |
| 65 to 74 Years | 8 (7.6%) | 9 (6.7%) |
| 75 Years and over | 0 (0.0%) | 10 (8.1%) |
Disability Class: Cognitive Difficulty
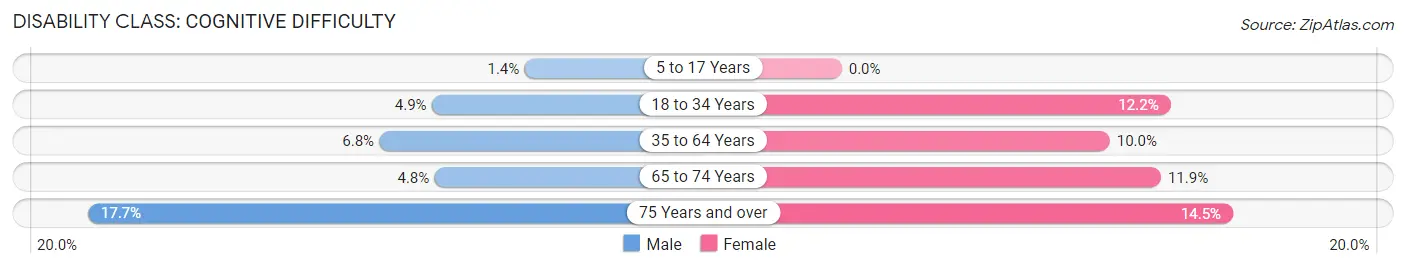
| Age Bracket | Male | Female |
| 5 to 17 Years | 3 (1.4%) | 0 (0.0%) |
| 18 to 34 Years | 7 (4.9%) | 20 (12.2%) |
| 35 to 64 Years | 28 (6.8%) | 44 (10.0%) |
| 65 to 74 Years | 5 (4.8%) | 16 (11.8%) |
| 75 Years and over | 12 (17.6%) | 18 (14.5%) |
Disability Class: Ambulatory Difficulty
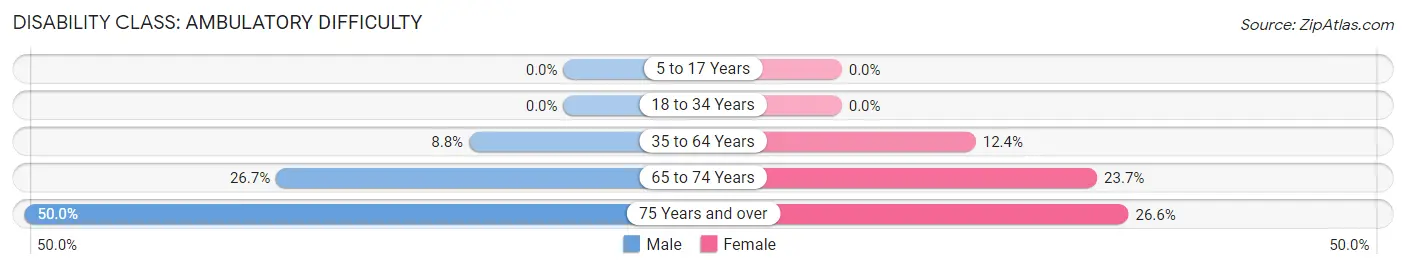
| Age Bracket | Male | Female |
| 5 to 17 Years | 0 (0.0%) | 0 (0.0%) |
| 18 to 34 Years | 0 (0.0%) | 0 (0.0%) |
| 35 to 64 Years | 36 (8.8%) | 55 (12.4%) |
| 65 to 74 Years | 28 (26.7%) | 32 (23.7%) |
| 75 Years and over | 34 (50.0%) | 33 (26.6%) |
Disability Class: Self-Care Difficulty
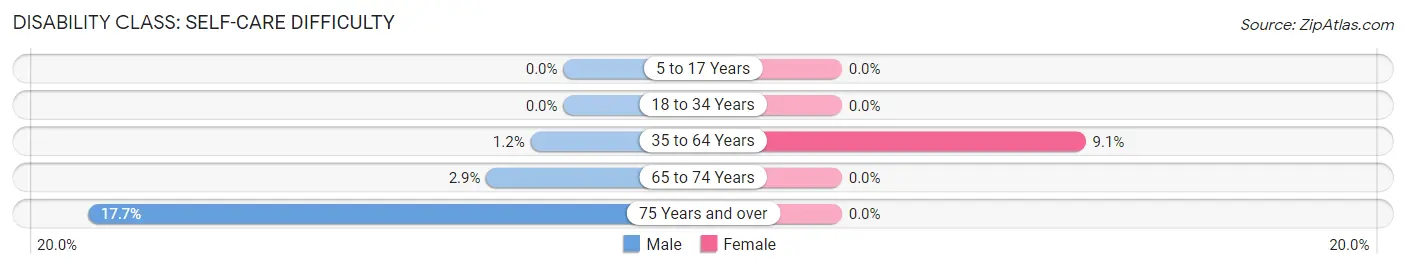
| Age Bracket | Male | Female |
| 5 to 17 Years | 0 (0.0%) | 0 (0.0%) |
| 18 to 34 Years | 0 (0.0%) | 0 (0.0%) |
| 35 to 64 Years | 5 (1.2%) | 40 (9.0%) |
| 65 to 74 Years | 3 (2.9%) | 0 (0.0%) |
| 75 Years and over | 12 (17.6%) | 0 (0.0%) |
Technology Access in Mountain Lake Park
Computing Device Access in Mountain Lake Park
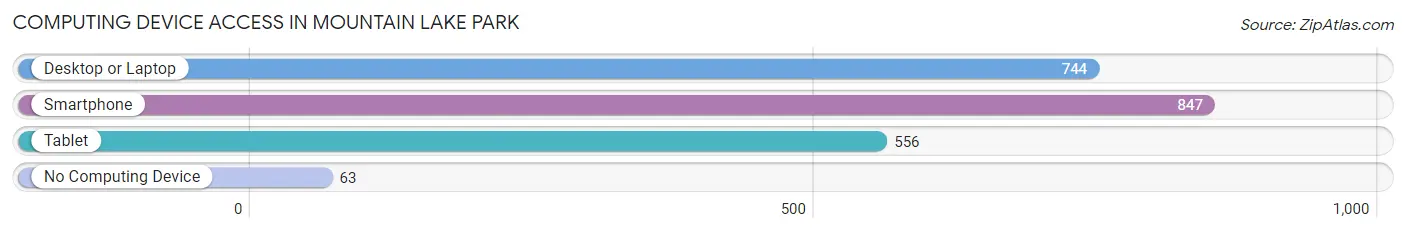
| Device Type | # Households | % Households |
| Desktop or Laptop | 744 | 77.5% |
| Smartphone | 847 | 88.2% |
| Tablet | 556 | 57.9% |
| No Computing Device | 63 | 6.6% |
| Total | 960 | 100.0% |
Internet Access in Mountain Lake Park
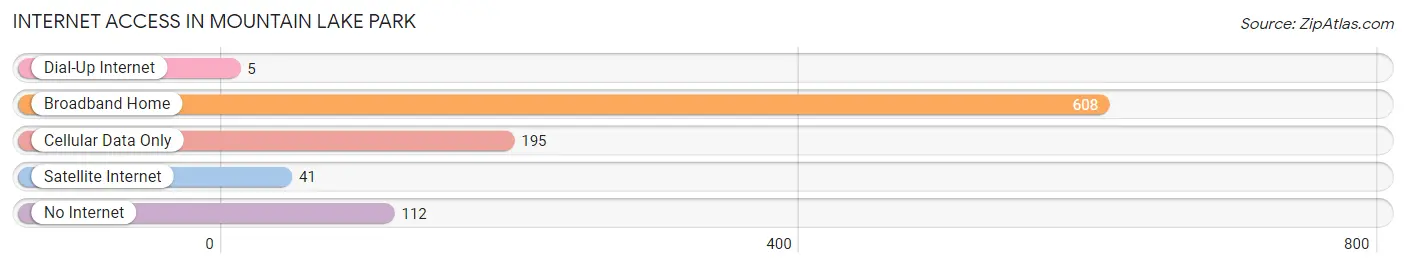
| Internet Type | # Households | % Households |
| Dial-Up Internet | 5 | 0.5% |
| Broadband Home | 608 | 63.3% |
| Cellular Data Only | 195 | 20.3% |
| Satellite Internet | 41 | 4.3% |
| No Internet | 112 | 11.7% |
| Total | 960 | 100.0% |
Mountain Lake Park Summary
Mountain Lake Park is a town located in Garrett County, Maryland. It is situated in the Appalachian Mountains, and is surrounded by the Allegheny Mountains to the east and the Monongahela National Forest to the west. The town is located approximately two hours from Washington, D.C. and Baltimore, Maryland.
History
Mountain Lake Park was founded in 1891 by a group of investors from Baltimore, Maryland. The town was originally known as Mountain Lake Park and was intended to be a summer resort destination. The town was designed to be a “model town” with wide streets, large lots, and a variety of amenities. The town was also designed to be a “dry town”, meaning that alcohol was not allowed to be sold or consumed within the town limits.
The town quickly became a popular destination for vacationers from the Baltimore and Washington, D.C. areas. The town was also home to a variety of businesses, including a hotel, a general store, a post office, and a bank.
In the early 1900s, the town began to experience a decline in popularity as a vacation destination. This decline was due in part to the increasing popularity of automobile travel, which allowed people to travel farther distances for their vacations.
In the 1950s, the town experienced a resurgence in popularity as a summer resort destination. This resurgence was due in part to the construction of a new hotel, the Mountain Lake Hotel, which was built in 1954. The hotel was a popular destination for vacationers from the Baltimore and Washington, D.C. areas.
Geography
Mountain Lake Park is located in the Appalachian Mountains of western Maryland. The town is situated in a valley surrounded by the Allegheny Mountains to the east and the Monongahela National Forest to the west. The town is located approximately two hours from Washington, D.C. and Baltimore, Maryland.
The town is situated at an elevation of 2,000 feet above sea level. The town is located in a temperate climate zone, with average temperatures ranging from the low 30s in the winter to the mid-80s in the summer.
Economy
Mountain Lake Park is a small town with a population of approximately 1,000 people. The town’s economy is largely based on tourism, with the town’s main attractions being the Mountain Lake Hotel and the surrounding natural beauty. The town is also home to a variety of small businesses, including restaurants, shops, and other services.
Demographics
As of the 2010 census, the population of Mountain Lake Park was 1,039. The racial makeup of the town was 95.3% White, 1.2% African American, 0.3% Native American, 0.7% Asian, 0.1% Pacific Islander, 0.7% from other races, and 1.9% from two or more races. Hispanic or Latino of any race were 2.2% of the population.
The median household income in Mountain Lake Park was $41,250, and the median family income was $50,000. The per capita income for the town was $20,945. About 8.3% of families and 10.3% of the population were below the poverty line, including 14.3% of those under age 18 and 6.3% of those age 65 or over.
Common Questions
What is Per Capita Income in Mountain Lake Park?
Per Capita income in Mountain Lake Park is $35,365.
What is the Median Family Income in Mountain Lake Park?
Median Family Income in Mountain Lake Park is $72,353.
What is the Median Household income in Mountain Lake Park?
Median Household Income in Mountain Lake Park is $55,000.
What is Income or Wage Gap in Mountain Lake Park?
Income or Wage Gap in Mountain Lake Park is 41.2%.
Women in Mountain Lake Park earn 58.8 cents for every dollar earned by a man.
What is Inequality or Gini Index in Mountain Lake Park?
Inequality or Gini Index in Mountain Lake Park is 0.48.
What is the Total Population of Mountain Lake Park?
Total Population of Mountain Lake Park is 2,117.
What is the Total Male Population of Mountain Lake Park?
Total Male Population of Mountain Lake Park is 1,014.
What is the Total Female Population of Mountain Lake Park?
Total Female Population of Mountain Lake Park is 1,103.
What is the Ratio of Males per 100 Females in Mountain Lake Park?
There are 91.93 Males per 100 Females in Mountain Lake Park.
What is the Ratio of Females per 100 Males in Mountain Lake Park?
There are 108.78 Females per 100 Males in Mountain Lake Park.
What is the Median Population Age in Mountain Lake Park?
Median Population Age in Mountain Lake Park is 44.3 Years.
What is the Average Family Size in Mountain Lake Park
Average Family Size in Mountain Lake Park is 2.6 People.
What is the Average Household Size in Mountain Lake Park
Average Household Size in Mountain Lake Park is 2.1 People.
How Large is the Labor Force in Mountain Lake Park?
There are 1,078 People in the Labor Forcein in Mountain Lake Park.
What is the Percentage of People in the Labor Force in Mountain Lake Park?
60.3% of People are in the Labor Force in Mountain Lake Park.
What is the Unemployment Rate in Mountain Lake Park?
Unemployment Rate in Mountain Lake Park is 7.4%.