North East, MD Map & Demographics
North East Map
North East Overview
$46,350
PER CAPITA INCOME
$86,298
AVG FAMILY INCOME
$85,378
AVG HOUSEHOLD INCOME
39.8%
WAGE / INCOME GAP [ % ]
60.2¢/ $1
WAGE / INCOME GAP [ $ ]
$15,186
FAMILY INCOME DEFICIT
0.47
INEQUALITY / GINI INDEX
4,061
TOTAL POPULATION
2,308
MALE POPULATION
1,753
FEMALE POPULATION
131.66
MALES / 100 FEMALES
75.95
FEMALES / 100 MALES
35.8
MEDIAN AGE
3.5
AVG FAMILY SIZE
2.4
AVG HOUSEHOLD SIZE
2,135
LABOR FORCE [ PEOPLE ]
65.9%
PERCENT IN LABOR FORCE
4.7%
UNEMPLOYMENT RATE
North East Zip Codes
Income in North East
Income Overview in North East
Per Capita Income in North East is $46,350, while median incomes of families and households are $86,298 and $85,378 respectively.
| Characteristic | Number | Measure |
| Per Capita Income | 4,061 | $46,350 |
| Median Family Income | 853 | $86,298 |
| Mean Family Income | 853 | $105,049 |
| Median Household Income | 1,724 | $85,378 |
| Mean Household Income | 1,724 | $107,652 |
| Income Deficit | 853 | $15,186 |
| Wage / Income Gap (%) | 4,061 | 39.84% |
| Wage / Income Gap ($) | 4,061 | 60.16¢ per $1 |
| Gini / Inequality Index | 4,061 | 0.47 |
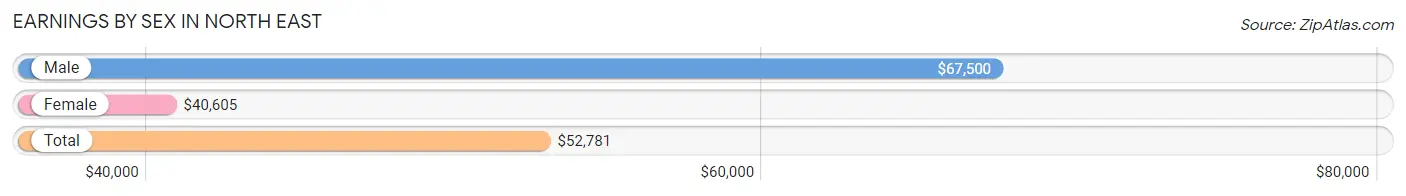
Earnings by Sex in North East
Average Earnings in North East are $52,781, $67,500 for men and $40,605 for women, a difference of 39.8%.
| Sex | Number | Average Earnings |
| Male | 1,154 (52.5%) | $67,500 |
| Female | 1,045 (47.5%) | $40,605 |
| Total | 2,199 (100.0%) | $52,781 |
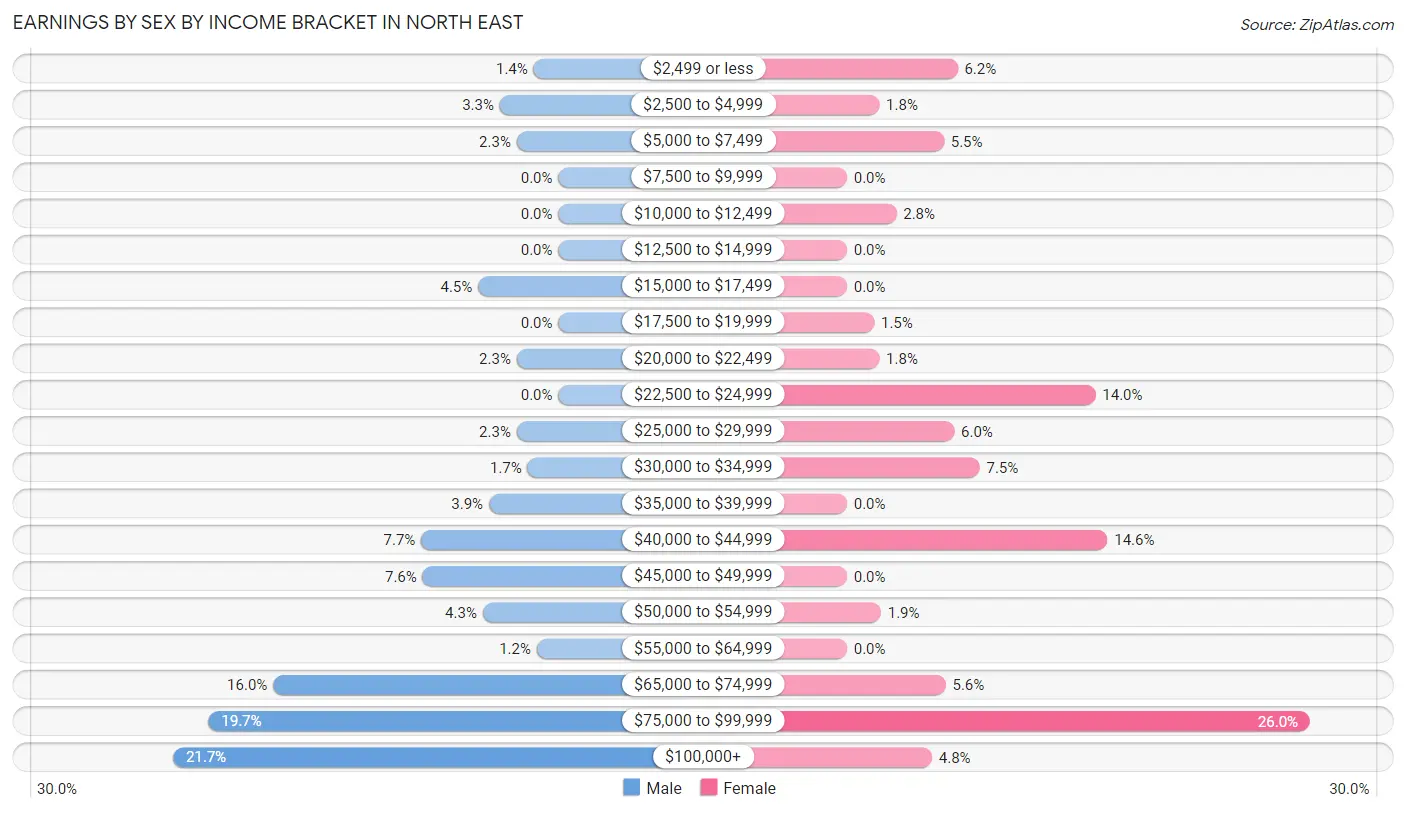
Earnings by Sex by Income Bracket in North East
The most common earnings brackets in North East are $100,000+ for men (250 | 21.7%) and $75,000 to $99,999 for women (272 | 26.0%).
| Income | Male | Female |
| $2,499 or less | 16 (1.4%) | 65 (6.2%) |
| $2,500 to $4,999 | 38 (3.3%) | 19 (1.8%) |
| $5,000 to $7,499 | 27 (2.3%) | 57 (5.4%) |
| $7,500 to $9,999 | 0 (0.0%) | 0 (0.0%) |
| $10,000 to $12,499 | 0 (0.0%) | 29 (2.8%) |
| $12,500 to $14,999 | 0 (0.0%) | 0 (0.0%) |
| $15,000 to $17,499 | 52 (4.5%) | 0 (0.0%) |
| $17,500 to $19,999 | 0 (0.0%) | 16 (1.5%) |
| $20,000 to $22,499 | 27 (2.3%) | 19 (1.8%) |
| $22,500 to $24,999 | 0 (0.0%) | 146 (14.0%) |
| $25,000 to $29,999 | 27 (2.3%) | 63 (6.0%) |
| $30,000 to $34,999 | 20 (1.7%) | 78 (7.5%) |
| $35,000 to $39,999 | 45 (3.9%) | 0 (0.0%) |
| $40,000 to $44,999 | 89 (7.7%) | 153 (14.6%) |
| $45,000 to $49,999 | 88 (7.6%) | 0 (0.0%) |
| $50,000 to $54,999 | 49 (4.3%) | 20 (1.9%) |
| $55,000 to $64,999 | 14 (1.2%) | 0 (0.0%) |
| $65,000 to $74,999 | 185 (16.0%) | 58 (5.6%) |
| $75,000 to $99,999 | 227 (19.7%) | 272 (26.0%) |
| $100,000+ | 250 (21.7%) | 50 (4.8%) |
| Total | 1,154 (100.0%) | 1,045 (100.0%) |
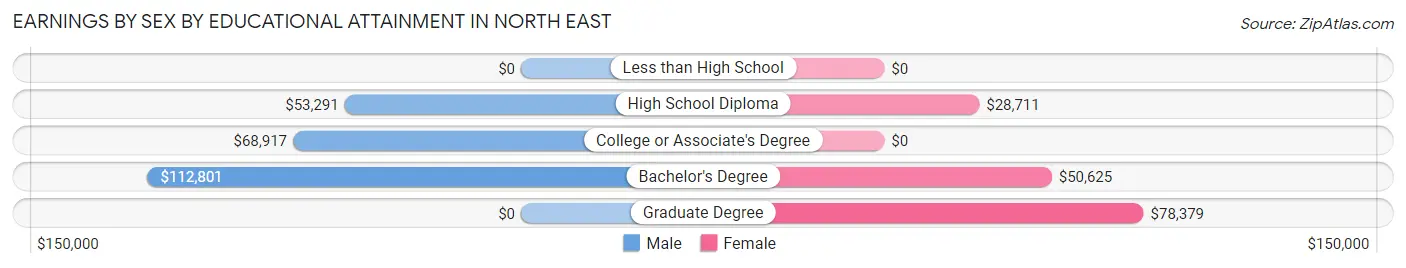
Earnings by Sex by Educational Attainment in North East
Average earnings in North East are $69,179 for men and $42,158 for women, a difference of 39.1%. Men with an educational attainment of bachelor's degree enjoy the highest average annual earnings of $112,801, while those with high school diploma education earn the least with $53,291. Women with an educational attainment of graduate degree earn the most with the average annual earnings of $78,379, while those with high school diploma education have the smallest earnings of $28,711.
| Educational Attainment | Male Income | Female Income |
| Less than High School | - | - |
| High School Diploma | $53,291 | $28,711 |
| College or Associate's Degree | $68,917 | $0 |
| Bachelor's Degree | $112,801 | $50,625 |
| Graduate Degree | - | - |
| Total | $69,179 | $42,158 |
Family Income in North East
Family Income Brackets in North East
According to the North East family income data, there are 271 families falling into the $100,000 to $149,999 income range, which is the most common income bracket and makes up 31.8% of all families.
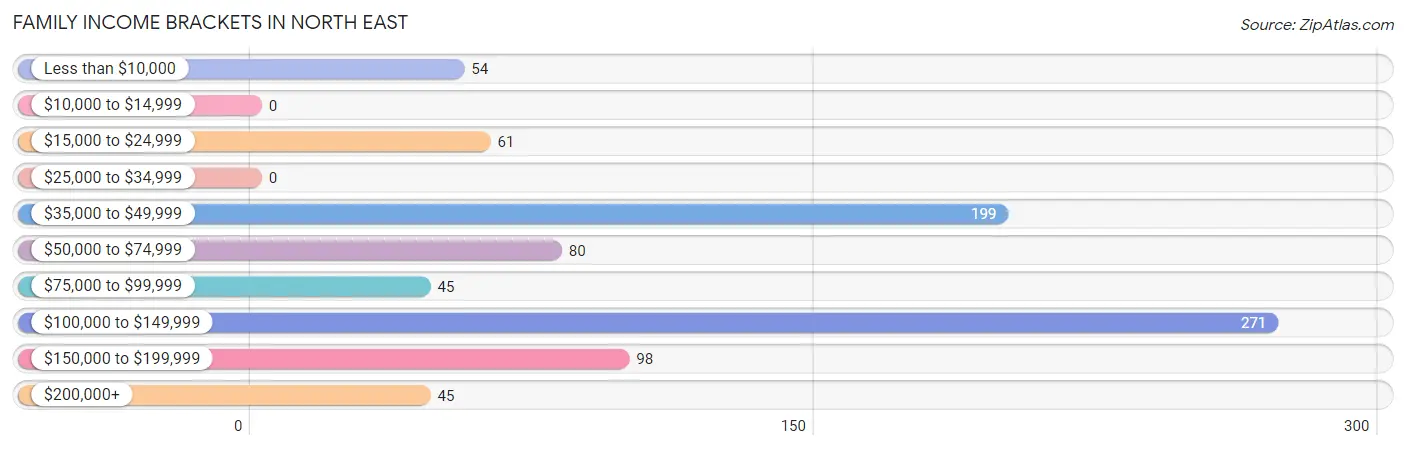
| Income Bracket | # Families | % Families |
| Less than $10,000 | 54 | 6.3% |
| $10,000 to $14,999 | 0 | 0.0% |
| $15,000 to $24,999 | 61 | 7.2% |
| $25,000 to $34,999 | 0 | 0.0% |
| $35,000 to $49,999 | 199 | 23.3% |
| $50,000 to $74,999 | 80 | 9.4% |
| $75,000 to $99,999 | 45 | 5.3% |
| $100,000 to $149,999 | 271 | 31.8% |
| $150,000 to $199,999 | 98 | 11.5% |
| $200,000+ | 45 | 5.3% |
Family Income by Famaliy Size in North East
4-person families (84 | 9.9%) account for the highest median family income in North East with $181,571 per family, while 4-person families (84 | 9.9%) have the highest median income of $45,393 per family member.
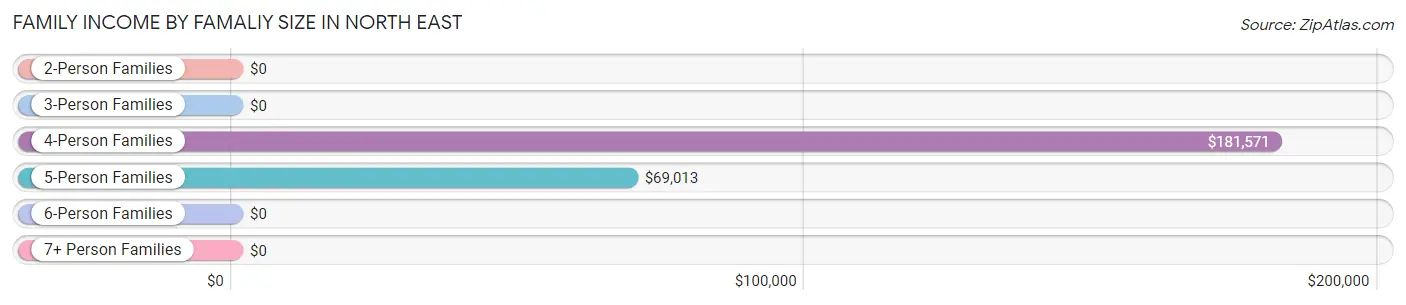
| Income Bracket | # Families | Median Income |
| 2-Person Families | 409 (47.9%) | $0 |
| 3-Person Families | 109 (12.8%) | $0 |
| 4-Person Families | 84 (9.9%) | $181,571 |
| 5-Person Families | 219 (25.7%) | $69,013 |
| 6-Person Families | 32 (3.7%) | $0 |
| 7+ Person Families | 0 (0.0%) | $0 |
| Total | 853 (100.0%) | $86,298 |
Family Income by Number of Earners in North East
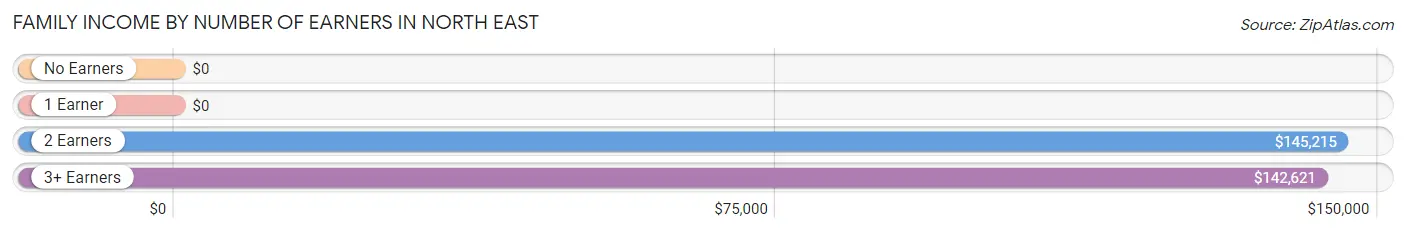
| Number of Earners | # Families | Median Income |
| No Earners | 52 (6.1%) | $0 |
| 1 Earner | 429 (50.3%) | $0 |
| 2 Earners | 283 (33.2%) | $145,215 |
| 3+ Earners | 89 (10.4%) | $142,621 |
| Total | 853 (100.0%) | $86,298 |
Household Income in North East
Household Income Brackets in North East
With 428 households falling in the category, the $100,000 to $149,999 income range is the most frequent in North East, accounting for 24.8% of all households. In contrast, only 47 households (2.7%) fall into the less than $10,000 income bracket, making it the least populous group.
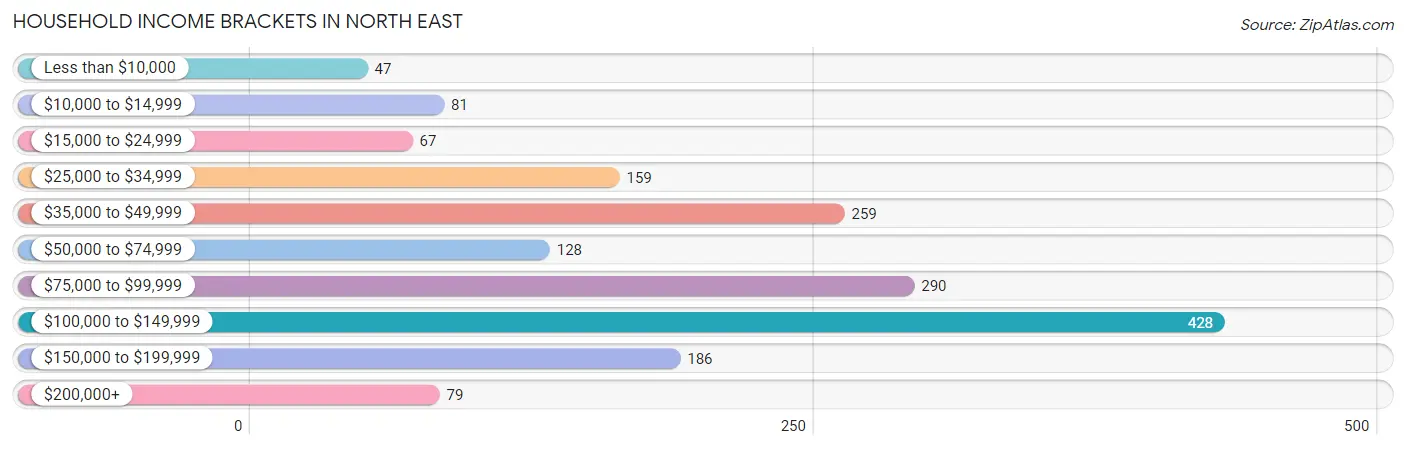
| Income Bracket | # Households | % Households |
| Less than $10,000 | 47 | 2.7% |
| $10,000 to $14,999 | 81 | 4.7% |
| $15,000 to $24,999 | 67 | 3.9% |
| $25,000 to $34,999 | 159 | 9.2% |
| $35,000 to $49,999 | 259 | 15.0% |
| $50,000 to $74,999 | 128 | 7.4% |
| $75,000 to $99,999 | 290 | 16.8% |
| $100,000 to $149,999 | 428 | 24.8% |
| $150,000 to $199,999 | 186 | 10.8% |
| $200,000+ | 79 | 4.6% |
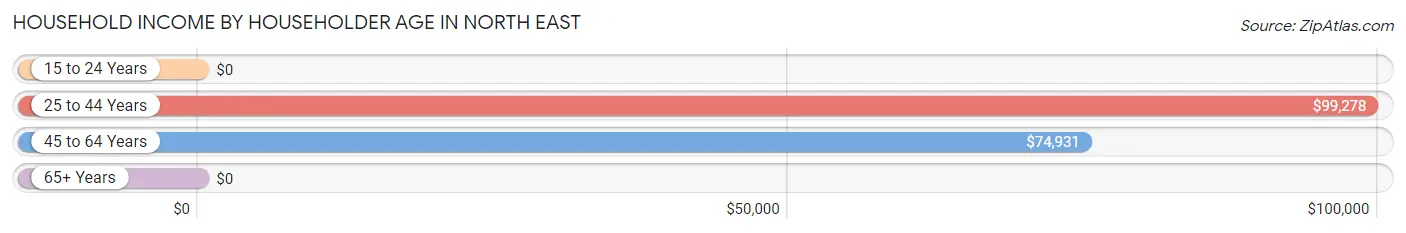
Household Income by Householder Age in North East
The median household income in North East is $85,378, with the highest median household income of $99,278 found in the 25 to 44 years age bracket for the primary householder. A total of 664 households (38.5%) fall into this category. Meanwhile, the 15 to 24 years age bracket for the primary householder has the lowest median household income of $0, with 37 households (2.1%) in this group.
| Income Bracket | # Households | Median Income |
| 15 to 24 Years | 37 (2.1%) | $0 |
| 25 to 44 Years | 664 (38.5%) | $99,278 |
| 45 to 64 Years | 716 (41.5%) | $74,931 |
| 65+ Years | 307 (17.8%) | $0 |
| Total | 1,724 (100.0%) | $85,378 |
Poverty in North East
Income Below Poverty by Sex and Age in North East
With 11.1% poverty level for males and 18.9% for females among the residents of North East, 5 year old males and 12 to 14 year old females are the most vulnerable to poverty, with 56 males (100.0%) and 29 females (100.0%) in their respective age groups living below the poverty level.
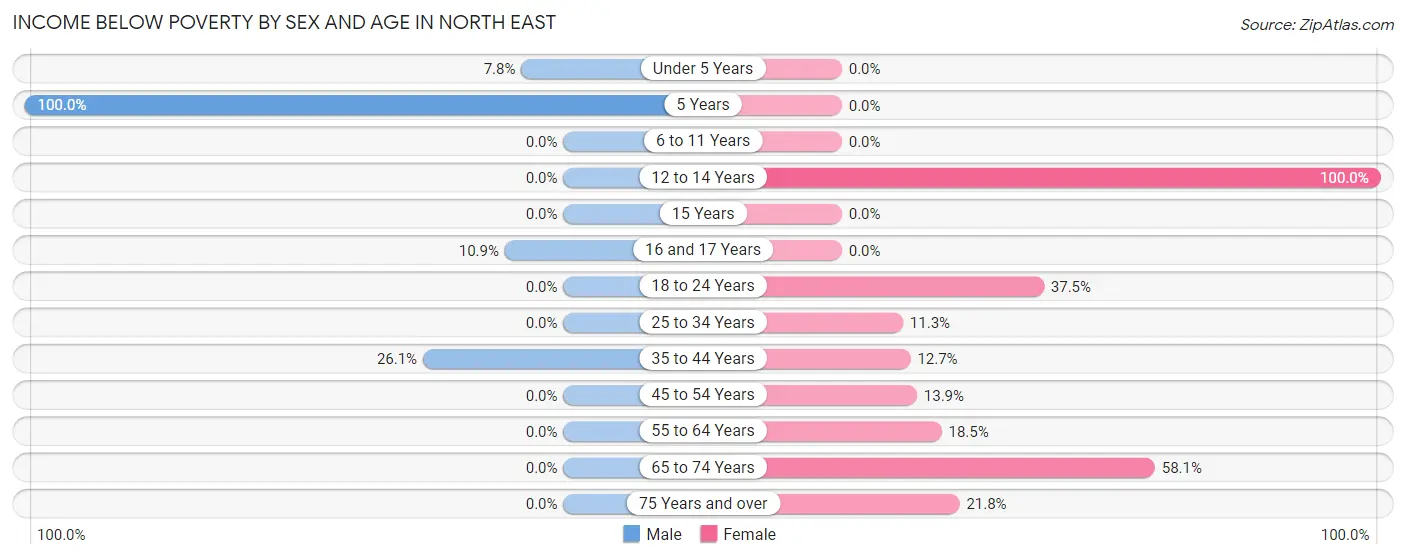
| Age Bracket | Male | Female |
| Under 5 Years | 22 (7.8%) | 0 (0.0%) |
| 5 Years | 56 (100.0%) | 0 (0.0%) |
| 6 to 11 Years | 0 (0.0%) | 0 (0.0%) |
| 12 to 14 Years | 0 (0.0%) | 29 (100.0%) |
| 15 Years | 0 (0.0%) | 0 (0.0%) |
| 16 and 17 Years | 25 (10.9%) | 0 (0.0%) |
| 18 to 24 Years | 0 (0.0%) | 84 (37.5%) |
| 25 to 34 Years | 0 (0.0%) | 27 (11.3%) |
| 35 to 44 Years | 153 (26.1%) | 27 (12.7%) |
| 45 to 54 Years | 0 (0.0%) | 39 (13.9%) |
| 55 to 64 Years | 0 (0.0%) | 45 (18.5%) |
| 65 to 74 Years | 0 (0.0%) | 61 (58.1%) |
| 75 Years and over | 0 (0.0%) | 19 (21.8%) |
| Total | 256 (11.1%) | 331 (18.9%) |
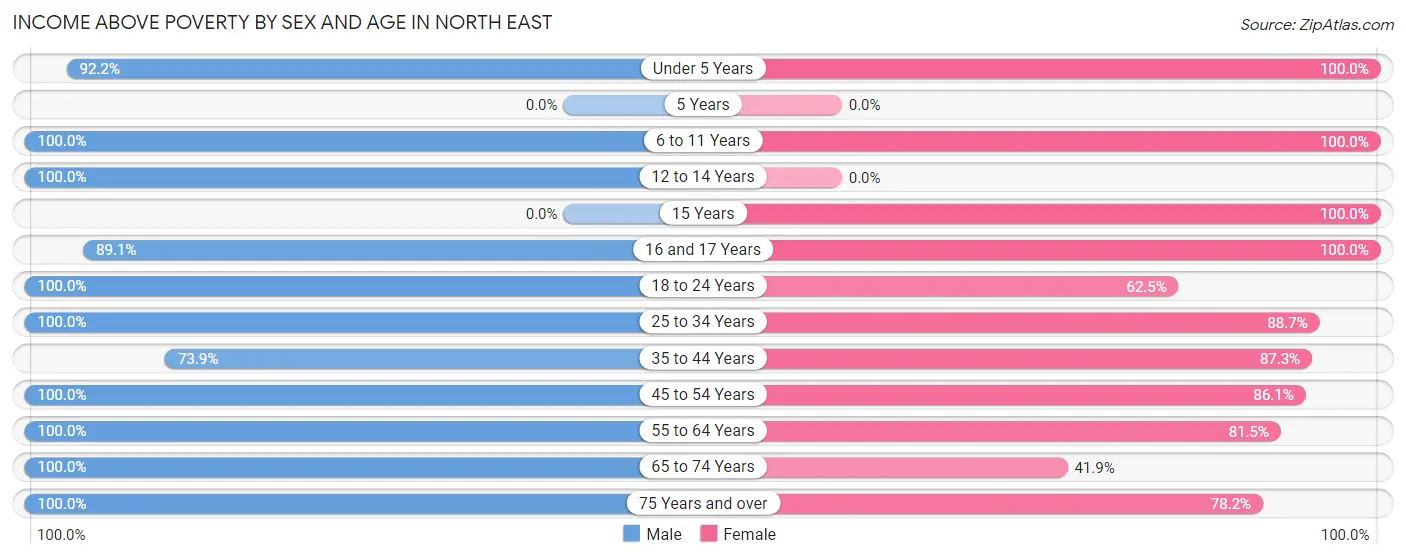
Income Above Poverty by Sex and Age in North East
According to the poverty statistics in North East, males aged 6 to 11 years and females aged under 5 years are the age groups that are most secure financially, with 100.0% of males and 100.0% of females in these age groups living above the poverty line.
| Age Bracket | Male | Female |
| Under 5 Years | 260 (92.2%) | 161 (100.0%) |
| 5 Years | 0 (0.0%) | 0 (0.0%) |
| 6 to 11 Years | 83 (100.0%) | 115 (100.0%) |
| 12 to 14 Years | 63 (100.0%) | 0 (0.0%) |
| 15 Years | 0 (0.0%) | 32 (100.0%) |
| 16 and 17 Years | 205 (89.1%) | 27 (100.0%) |
| 18 to 24 Years | 102 (100.0%) | 140 (62.5%) |
| 25 to 34 Years | 315 (100.0%) | 211 (88.7%) |
| 35 to 44 Years | 434 (73.9%) | 185 (87.3%) |
| 45 to 54 Years | 224 (100.0%) | 241 (86.1%) |
| 55 to 64 Years | 193 (100.0%) | 198 (81.5%) |
| 65 to 74 Years | 153 (100.0%) | 44 (41.9%) |
| 75 Years and over | 20 (100.0%) | 68 (78.2%) |
| Total | 2,052 (88.9%) | 1,422 (81.1%) |
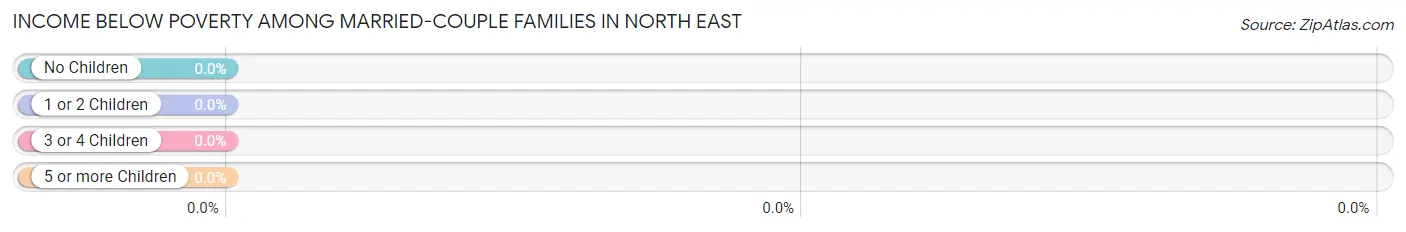
Income Below Poverty Among Married-Couple Families in North East
| Children | Above Poverty | Below Poverty |
| No Children | 221 (100.0%) | 0 (0.0%) |
| 1 or 2 Children | 127 (100.0%) | 0 (0.0%) |
| 3 or 4 Children | 143 (100.0%) | 0 (0.0%) |
| 5 or more Children | 0 (0.0%) | 0 (0.0%) |
| Total | 491 (100.0%) | 0 (0.0%) |
Income Below Poverty Among Single-Parent Households in North East
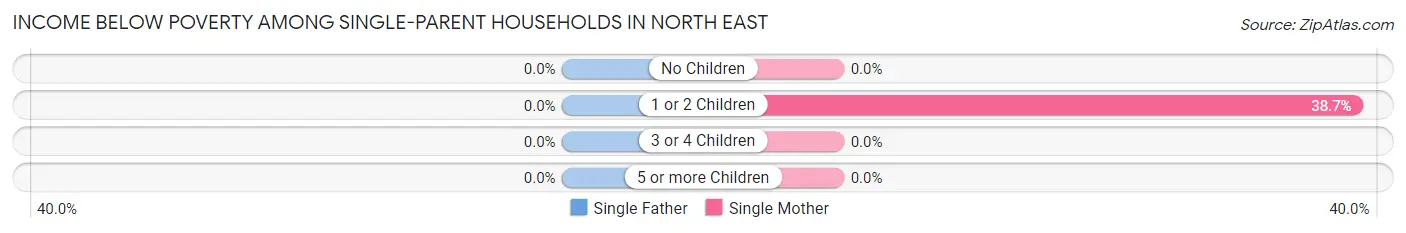
| Children | Single Father | Single Mother |
| No Children | 0 (0.0%) | 0 (0.0%) |
| 1 or 2 Children | 0 (0.0%) | 115 (38.7%) |
| 3 or 4 Children | 0 (0.0%) | 0 (0.0%) |
| 5 or more Children | 0 (0.0%) | 0 (0.0%) |
| Total | 0 (0.0%) | 115 (33.7%) |
Income Below Poverty Among Married-Couple vs Single-Parent Households in North East
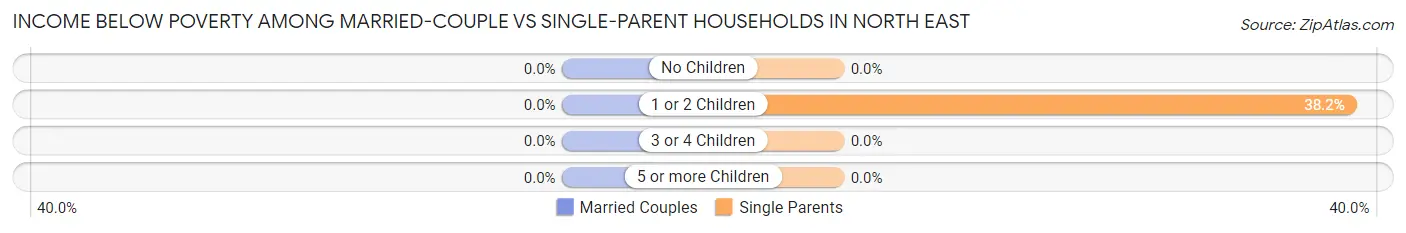
| Children | Married-Couple Families | Single-Parent Households |
| No Children | 0 (0.0%) | 0 (0.0%) |
| 1 or 2 Children | 0 (0.0%) | 115 (38.2%) |
| 3 or 4 Children | 0 (0.0%) | 0 (0.0%) |
| 5 or more Children | 0 (0.0%) | 0 (0.0%) |
| Total | 0 (0.0%) | 115 (31.8%) |
Race in North East
The most populous races in North East are White / Caucasian (3,256 | 80.2%), Black / African American (508 | 12.5%), and Two or more Races (238 | 5.9%).
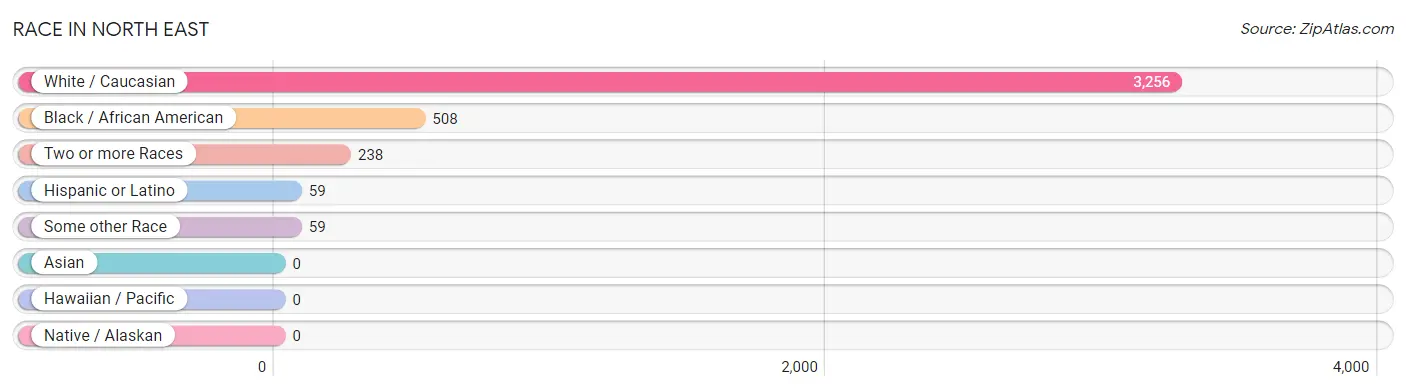
| Race | # Population | % Population |
| Asian | 0 | 0.0% |
| Black / African American | 508 | 12.5% |
| Hawaiian / Pacific | 0 | 0.0% |
| Hispanic or Latino | 59 | 1.5% |
| Native / Alaskan | 0 | 0.0% |
| White / Caucasian | 3,256 | 80.2% |
| Two or more Races | 238 | 5.9% |
| Some other Race | 59 | 1.5% |
| Total | 4,061 | 100.0% |
Ancestry in North East
The most populous ancestries reported in North East are European (588 | 14.5%), German (549 | 13.5%), Irish (534 | 13.2%), English (252 | 6.2%), and Polish (244 | 6.0%), together accounting for 53.4% of all North East residents.
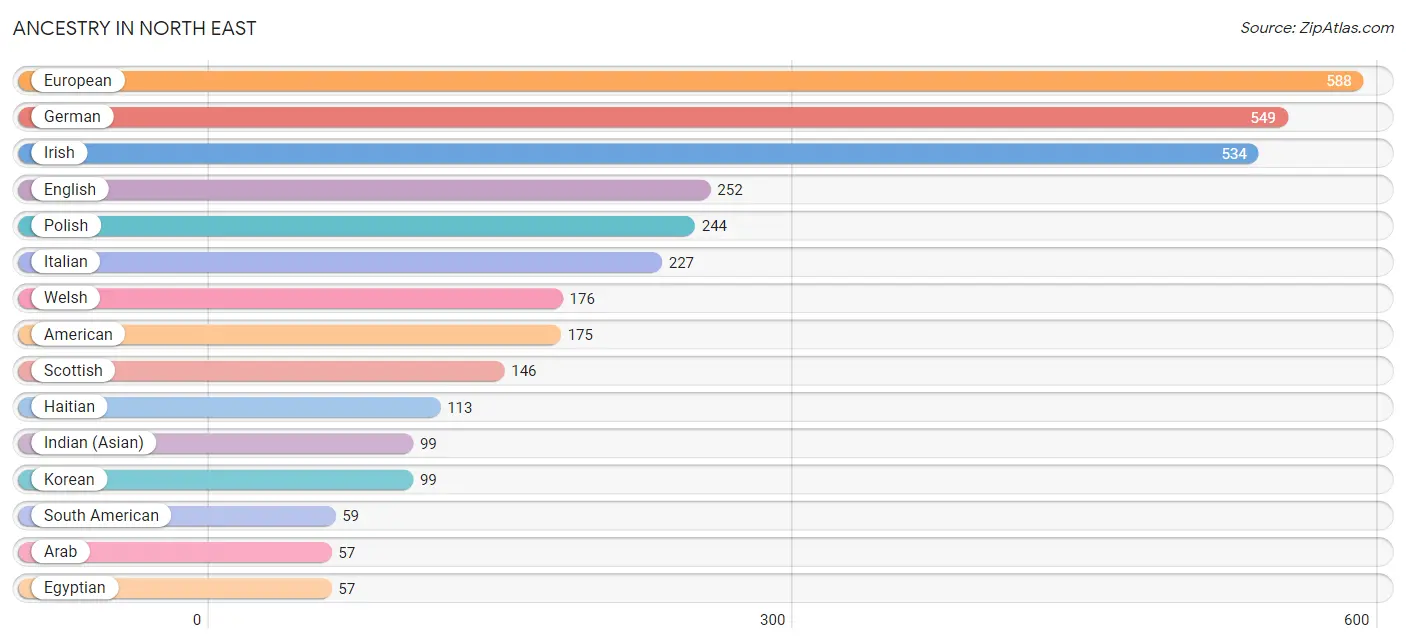
| Ancestry | # Population | % Population |
| American | 175 | 4.3% |
| Arab | 57 | 1.4% |
| Bhutanese | 17 | 0.4% |
| Brazilian | 18 | 0.4% |
| Colombian | 27 | 0.7% |
| Croatian | 22 | 0.5% |
| Egyptian | 57 | 1.4% |
| English | 252 | 6.2% |
| European | 588 | 14.5% |
| German | 549 | 13.5% |
| Ghanaian | 45 | 1.1% |
| Haitian | 113 | 2.8% |
| Indian (Asian) | 99 | 2.4% |
| Irish | 534 | 13.2% |
| Italian | 227 | 5.6% |
| Korean | 99 | 2.4% |
| Lumbee | 41 | 1.0% |
| Norwegian | 17 | 0.4% |
| Peruvian | 32 | 0.8% |
| Polish | 244 | 6.0% |
| Scottish | 146 | 3.6% |
| South American | 59 | 1.5% |
| Subsaharan African | 45 | 1.1% |
| Swedish | 17 | 0.4% |
| Welsh | 176 | 4.3% | View All 25 Rows |
Immigrants in North East
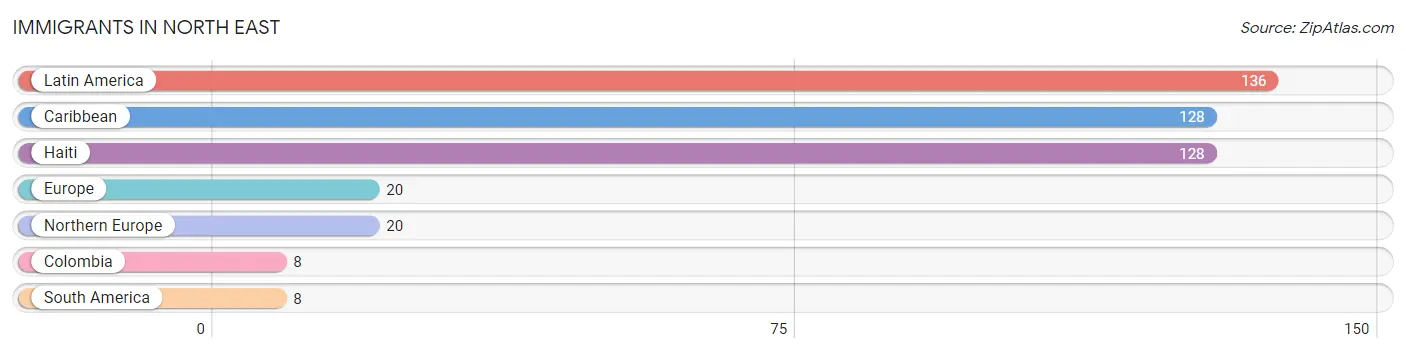
The most numerous immigrant groups reported in North East came from Latin America (136 | 3.4%), Caribbean (128 | 3.2%), Haiti (128 | 3.2%), Europe (20 | 0.5%), and Northern Europe (20 | 0.5%), together accounting for 10.6% of all North East residents.
| Immigration Origin | # Population | % Population |
| Caribbean | 128 | 3.2% |
| Colombia | 8 | 0.2% |
| Europe | 20 | 0.5% |
| Haiti | 128 | 3.2% |
| Latin America | 136 | 3.4% |
| Northern Europe | 20 | 0.5% |
| South America | 8 | 0.2% | View All 7 Rows |
Sex and Age in North East
Sex and Age in North East
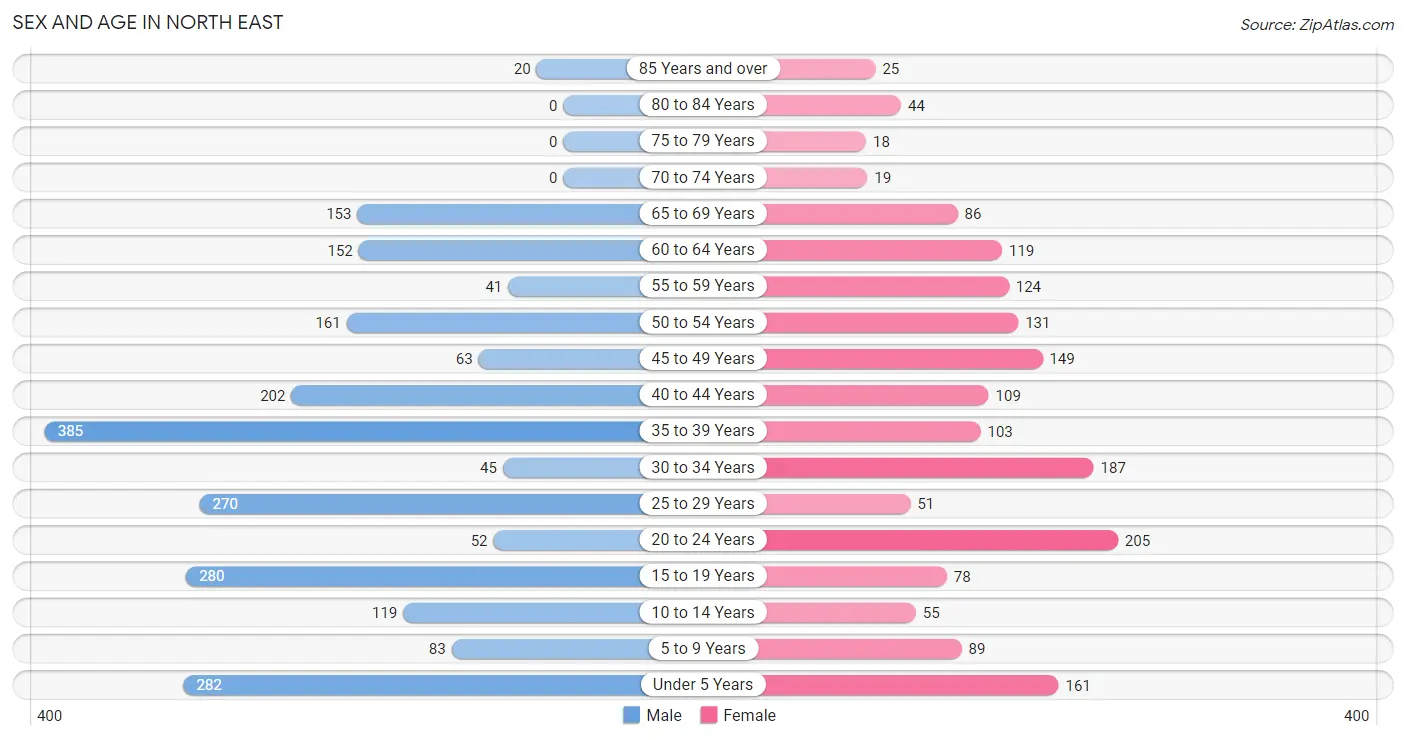
The most populous age groups in North East are 35 to 39 Years (385 | 16.7%) for men and 20 to 24 Years (205 | 11.7%) for women.
| Age Bracket | Male | Female |
| Under 5 Years | 282 (12.2%) | 161 (9.2%) |
| 5 to 9 Years | 83 (3.6%) | 89 (5.1%) |
| 10 to 14 Years | 119 (5.2%) | 55 (3.1%) |
| 15 to 19 Years | 280 (12.1%) | 78 (4.4%) |
| 20 to 24 Years | 52 (2.2%) | 205 (11.7%) |
| 25 to 29 Years | 270 (11.7%) | 51 (2.9%) |
| 30 to 34 Years | 45 (1.9%) | 187 (10.7%) |
| 35 to 39 Years | 385 (16.7%) | 103 (5.9%) |
| 40 to 44 Years | 202 (8.7%) | 109 (6.2%) |
| 45 to 49 Years | 63 (2.7%) | 149 (8.5%) |
| 50 to 54 Years | 161 (7.0%) | 131 (7.5%) |
| 55 to 59 Years | 41 (1.8%) | 124 (7.1%) |
| 60 to 64 Years | 152 (6.6%) | 119 (6.8%) |
| 65 to 69 Years | 153 (6.6%) | 86 (4.9%) |
| 70 to 74 Years | 0 (0.0%) | 19 (1.1%) |
| 75 to 79 Years | 0 (0.0%) | 18 (1.0%) |
| 80 to 84 Years | 0 (0.0%) | 44 (2.5%) |
| 85 Years and over | 20 (0.9%) | 25 (1.4%) |
| Total | 2,308 (100.0%) | 1,753 (100.0%) |
Families and Households in North East
Median Family Size in North East
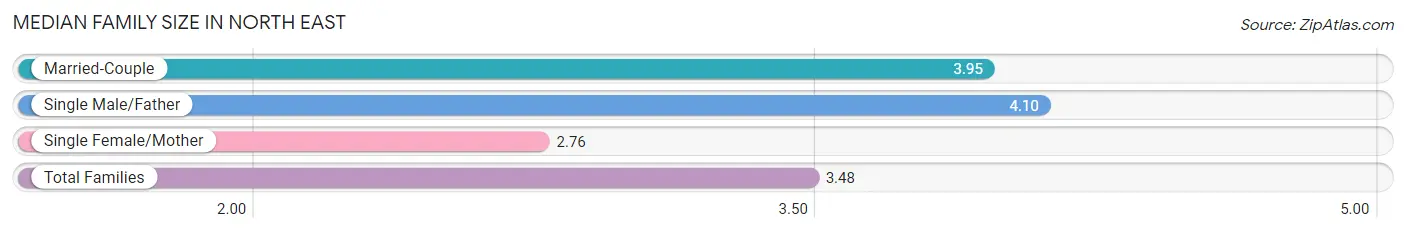
The median family size in North East is 3.48 persons per family, with single male/father families (21 | 2.5%) accounting for the largest median family size of 4.1 persons per family. On the other hand, single female/mother families (341 | 40.0%) represent the smallest median family size with 2.76 persons per family.
| Family Type | # Families | Family Size |
| Married-Couple | 491 (57.6%) | 3.95 |
| Single Male/Father | 21 (2.5%) | 4.10 |
| Single Female/Mother | 341 (40.0%) | 2.76 |
| Total Families | 853 (100.0%) | 3.48 |
Median Household Size in North East
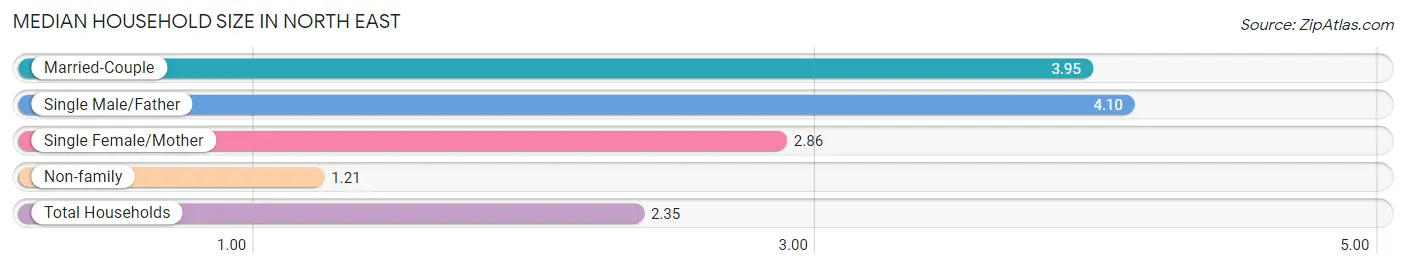
The median household size in North East is 2.35 persons per household, with single male/father households (21 | 1.2%) accounting for the largest median household size of 4.1 persons per household. non-family households (871 | 50.5%) represent the smallest median household size with 1.21 persons per household.
| Household Type | # Households | Household Size |
| Married-Couple | 491 (28.5%) | 3.95 |
| Single Male/Father | 21 (1.2%) | 4.10 |
| Single Female/Mother | 341 (19.8%) | 2.86 |
| Non-family | 871 (50.5%) | 1.21 |
| Total Households | 1,724 (100.0%) | 2.35 |
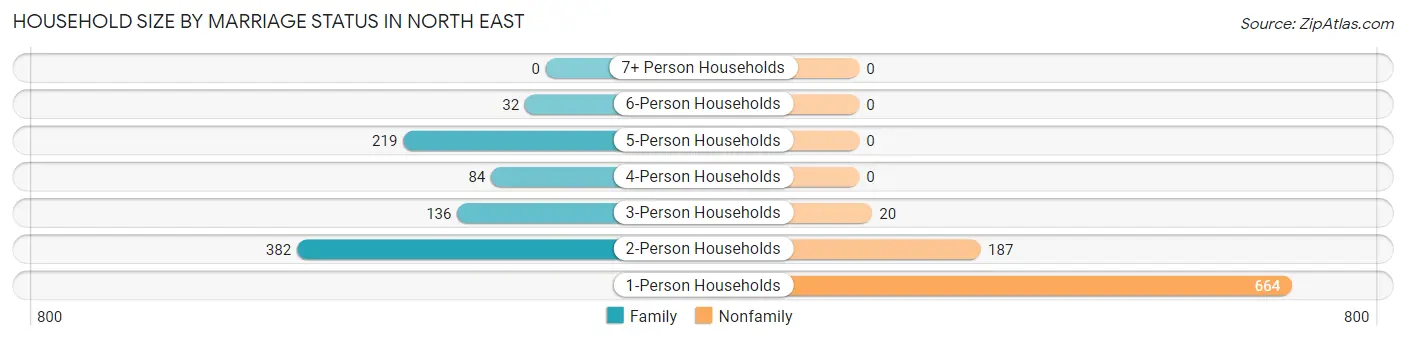
Household Size by Marriage Status in North East
Out of a total of 1,724 households in North East, 853 (49.5%) are family households, while 871 (50.5%) are nonfamily households. The most numerous type of family households are 2-person households, comprising 382, and the most common type of nonfamily households are 1-person households, comprising 664.
| Household Size | Family Households | Nonfamily Households |
| 1-Person Households | - | 664 (38.5%) |
| 2-Person Households | 382 (22.2%) | 187 (10.8%) |
| 3-Person Households | 136 (7.9%) | 20 (1.2%) |
| 4-Person Households | 84 (4.9%) | 0 (0.0%) |
| 5-Person Households | 219 (12.7%) | 0 (0.0%) |
| 6-Person Households | 32 (1.9%) | 0 (0.0%) |
| 7+ Person Households | 0 (0.0%) | 0 (0.0%) |
| Total | 853 (49.5%) | 871 (50.5%) |
Female Fertility in North East
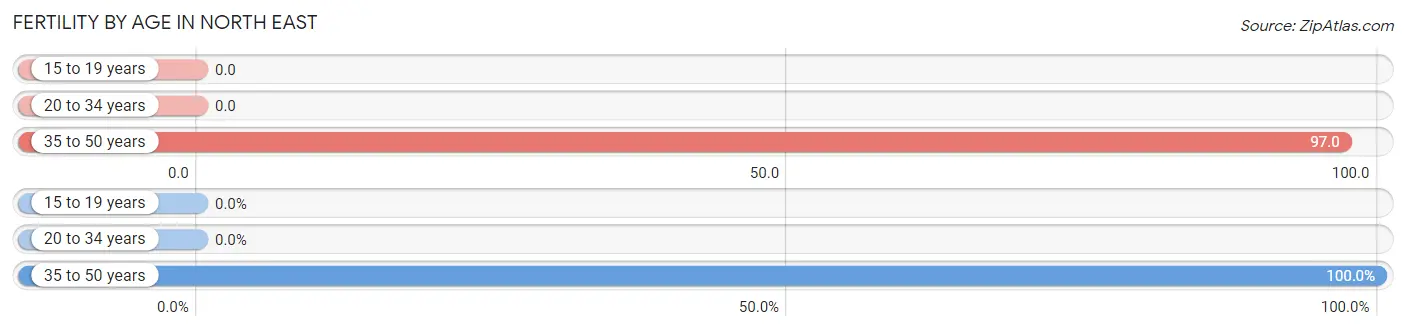
Fertility by Age in North East
Average fertility rate in North East is 40.0 births per 1,000 women. Women in the age bracket of 35 to 50 years have the highest fertility rate with 97.0 births per 1,000 women. Women in the age bracket of 35 to 50 years acount for 100.0% of all women with births.
| Age Bracket | Women with Births | Births / 1,000 Women |
| 15 to 19 years | 0 (0.0%) | 0.0 |
| 20 to 34 years | 0 (0.0%) | 0.0 |
| 35 to 50 years | 35 (100.0%) | 97.0 |
| Total | 35 (100.0%) | 40.0 |
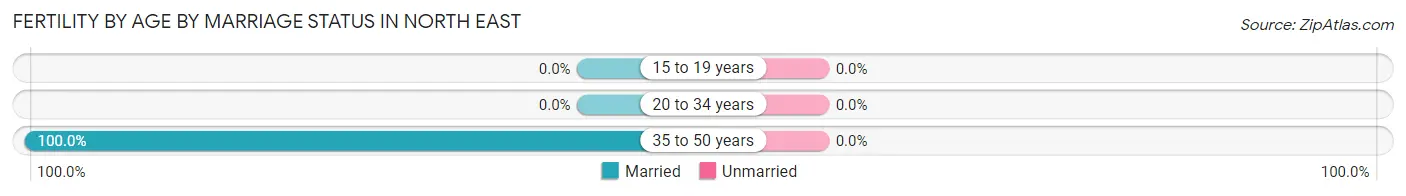
Fertility by Age by Marriage Status in North East
| Age Bracket | Married | Unmarried |
| 15 to 19 years | 0 (0.0%) | 0 (0.0%) |
| 20 to 34 years | 0 (0.0%) | 0 (0.0%) |
| 35 to 50 years | 35 (100.0%) | 0 (0.0%) |
| Total | 35 (100.0%) | 0 (0.0%) |
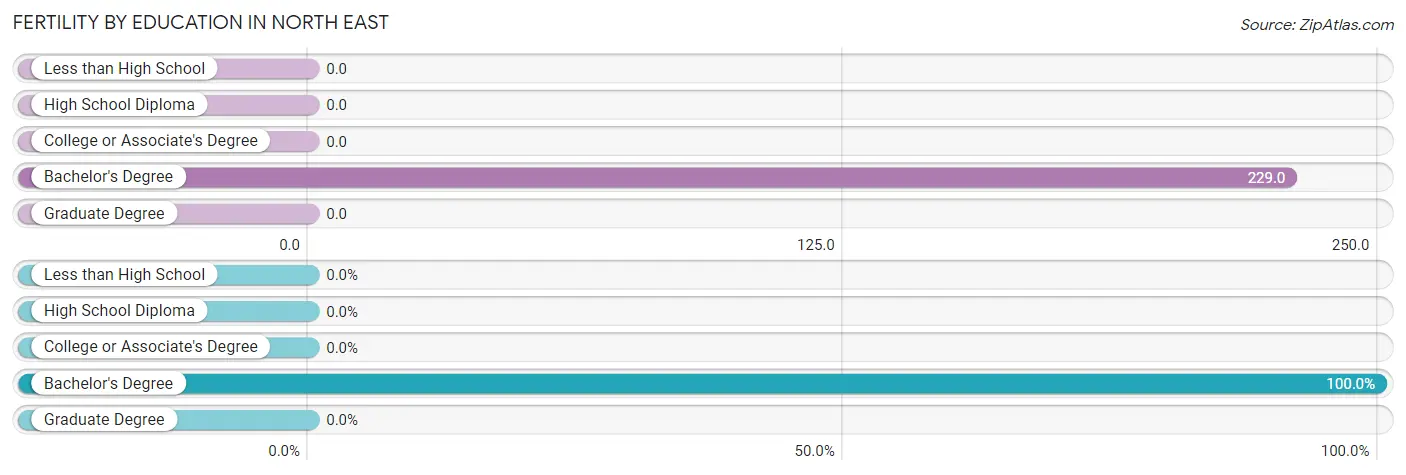
Fertility by Education in North East
| Educational Attainment | Women with Births | Births / 1,000 Women |
| Less than High School | 0 (0.0%) | 0.0 |
| High School Diploma | 0 (0.0%) | 0.0 |
| College or Associate's Degree | 0 (0.0%) | 0.0 |
| Bachelor's Degree | 35 (100.0%) | 229.0 |
| Graduate Degree | 0 (0.0%) | 0.0 |
| Total | 35 (100.0%) | 40.0 |
Fertility by Education by Marriage Status in North East
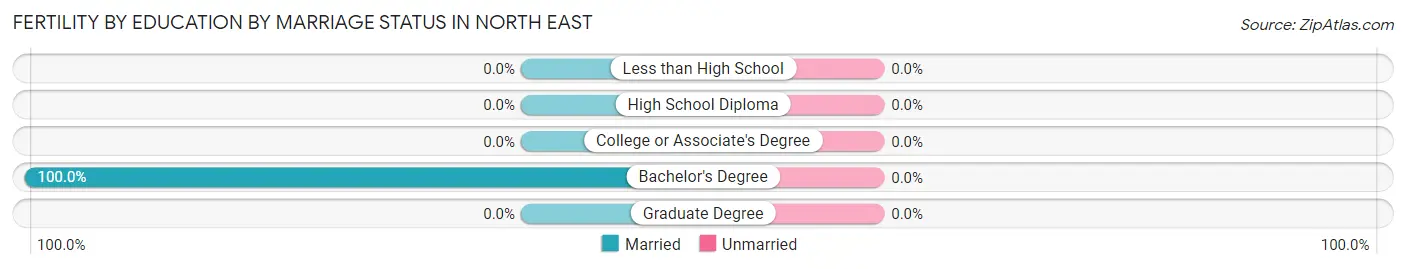
| Educational Attainment | Married | Unmarried |
| Less than High School | 0 (0.0%) | 0 (0.0%) |
| High School Diploma | 0 (0.0%) | 0 (0.0%) |
| College or Associate's Degree | 0 (0.0%) | 0 (0.0%) |
| Bachelor's Degree | 35 (100.0%) | 0 (0.0%) |
| Graduate Degree | 0 (0.0%) | 0 (0.0%) |
| Total | 35 (100.0%) | 0 (0.0%) |
Employment Characteristics in North East
Employment by Class of Employer in North East
Among the 2,025 employed individuals in North East, private company employees (1,102 | 54.4%), local government employees (321 | 15.9%), and federal government employees (295 | 14.6%) make up the most common classes of employment.
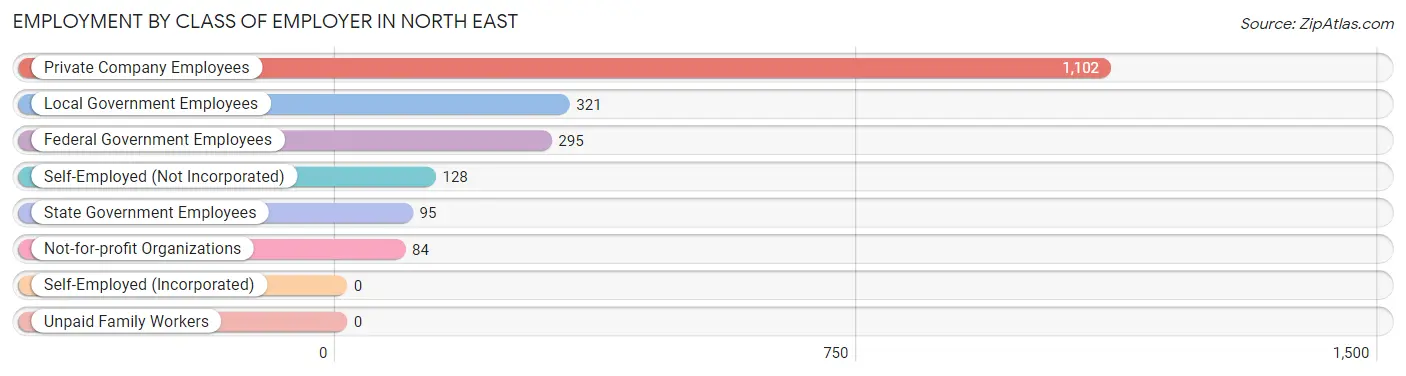
| Employer Class | # Employees | % Employees |
| Private Company Employees | 1,102 | 54.4% |
| Self-Employed (Incorporated) | 0 | 0.0% |
| Self-Employed (Not Incorporated) | 128 | 6.3% |
| Not-for-profit Organizations | 84 | 4.2% |
| Local Government Employees | 321 | 15.9% |
| State Government Employees | 95 | 4.7% |
| Federal Government Employees | 295 | 14.6% |
| Unpaid Family Workers | 0 | 0.0% |
| Total | 2,025 | 100.0% |
Employment Status by Age in North East
According to the labor force statistics for North East, out of the total population over 16 years of age (3,240), 65.9% or 2,135 individuals are in the labor force, with 4.7% or 100 of them unemployed. The age group with the highest labor force participation rate is 25 to 29 years, with 100.0% or 321 individuals in the labor force. Within the labor force, the 16 to 19 years age range has the highest percentage of unemployed individuals, with 100.0% or 38 of them being unemployed.
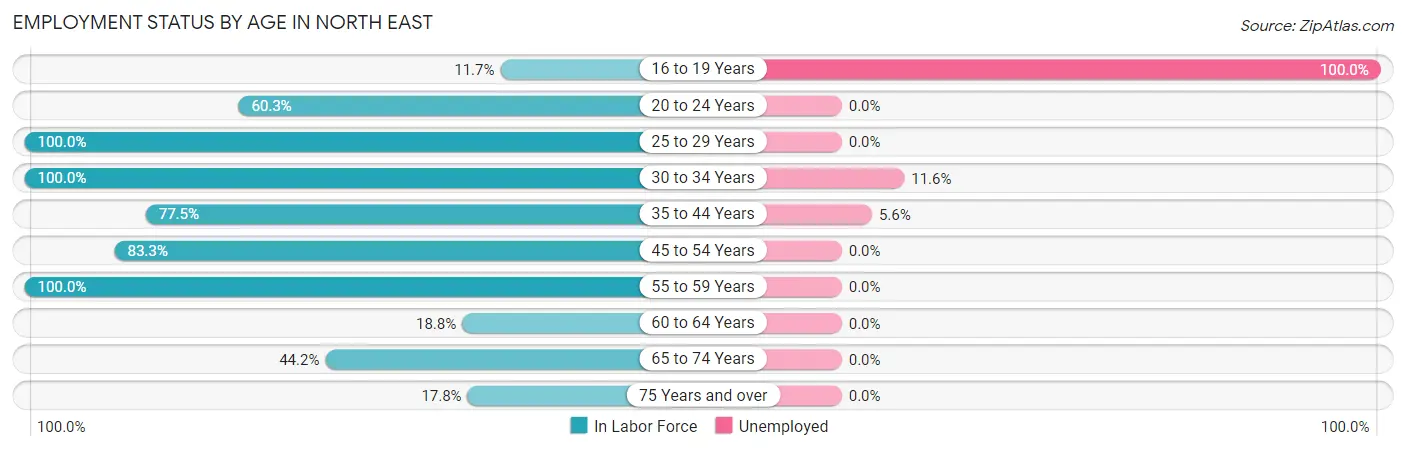
| Age Bracket | In Labor Force | Unemployed |
| 16 to 19 Years | 38 (11.7%) | 38 (100.0%) |
| 20 to 24 Years | 155 (60.3%) | 0 (0.0%) |
| 25 to 29 Years | 321 (100.0%) | 0 (0.0%) |
| 30 to 34 Years | 232 (100.0%) | 27 (11.6%) |
| 35 to 44 Years | 619 (77.5%) | 35 (5.6%) |
| 45 to 54 Years | 420 (83.3%) | 0 (0.0%) |
| 55 to 59 Years | 165 (100.0%) | 0 (0.0%) |
| 60 to 64 Years | 51 (18.8%) | 0 (0.0%) |
| 65 to 74 Years | 114 (44.2%) | 0 (0.0%) |
| 75 Years and over | 19 (17.8%) | 0 (0.0%) |
| Total | 2,135 (65.9%) | 100 (4.7%) |
Employment Status by Educational Attainment in North East
According to labor force statistics for North East, 78.9% of individuals (1,808) out of the total population between 25 and 64 years of age (2,292) are in the labor force, with 3.4% or 61 of them being unemployed. The group with the highest labor force participation rate are those with the educational attainment of bachelor's degree or higher, with 93.8% or 676 individuals in the labor force. Within the labor force, individuals with high school diploma education have the highest percentage of unemployment, with 9.1% or 33 of them being unemployed.
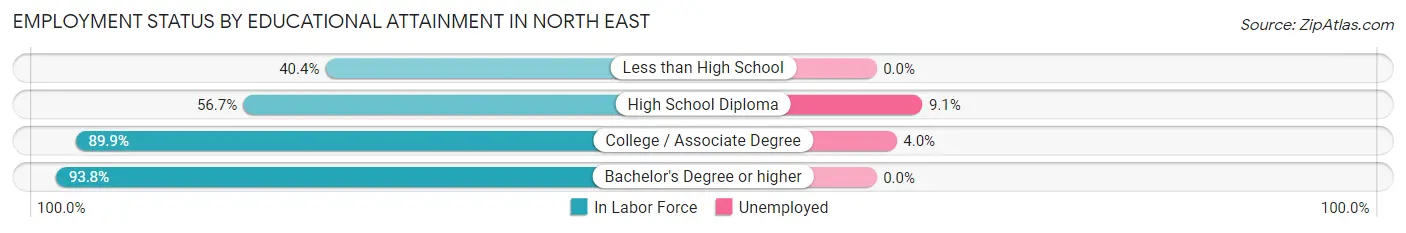
| Educational Attainment | In Labor Force | Unemployed |
| Less than High School | 55 (40.4%) | 0 (0.0%) |
| High School Diploma | 364 (56.7%) | 58 (9.1%) |
| College / Associate Degree | 713 (89.9%) | 32 (4.0%) |
| Bachelor's Degree or higher | 676 (93.8%) | 0 (0.0%) |
| Total | 1,808 (78.9%) | 78 (3.4%) |
Employment Occupations by Sex in North East
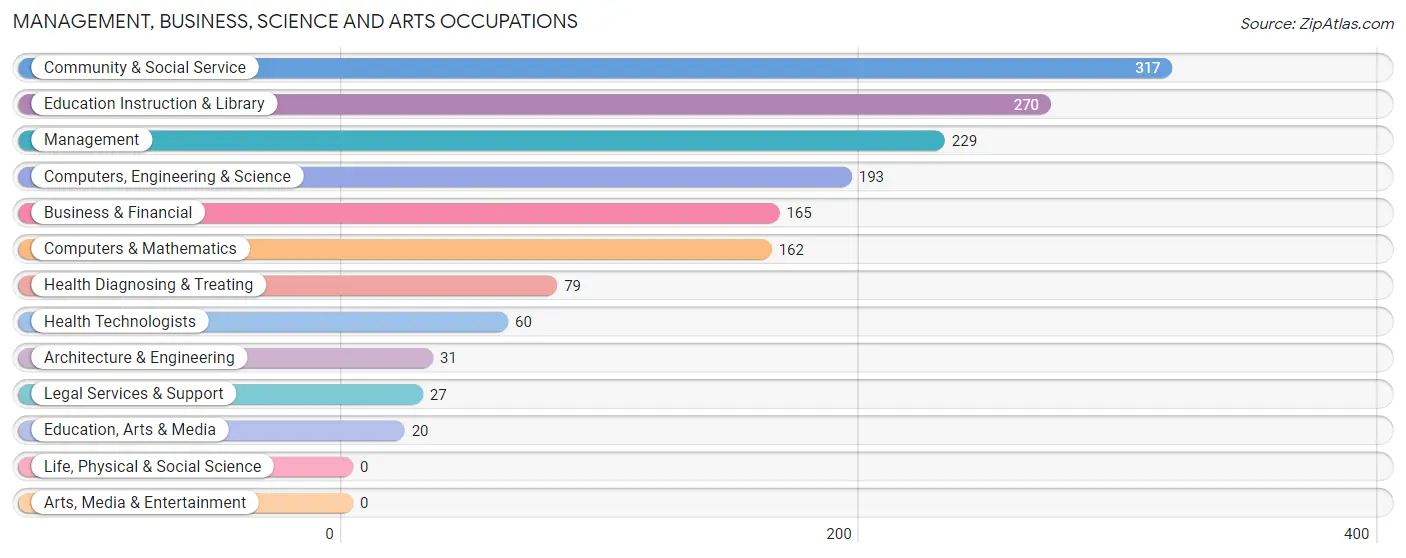
Management, Business, Science and Arts Occupations
The most common Management, Business, Science and Arts occupations in North East are Community & Social Service (317 | 15.8%), Education Instruction & Library (270 | 13.5%), Management (229 | 11.4%), Computers, Engineering & Science (193 | 9.6%), and Business & Financial (165 | 8.2%).
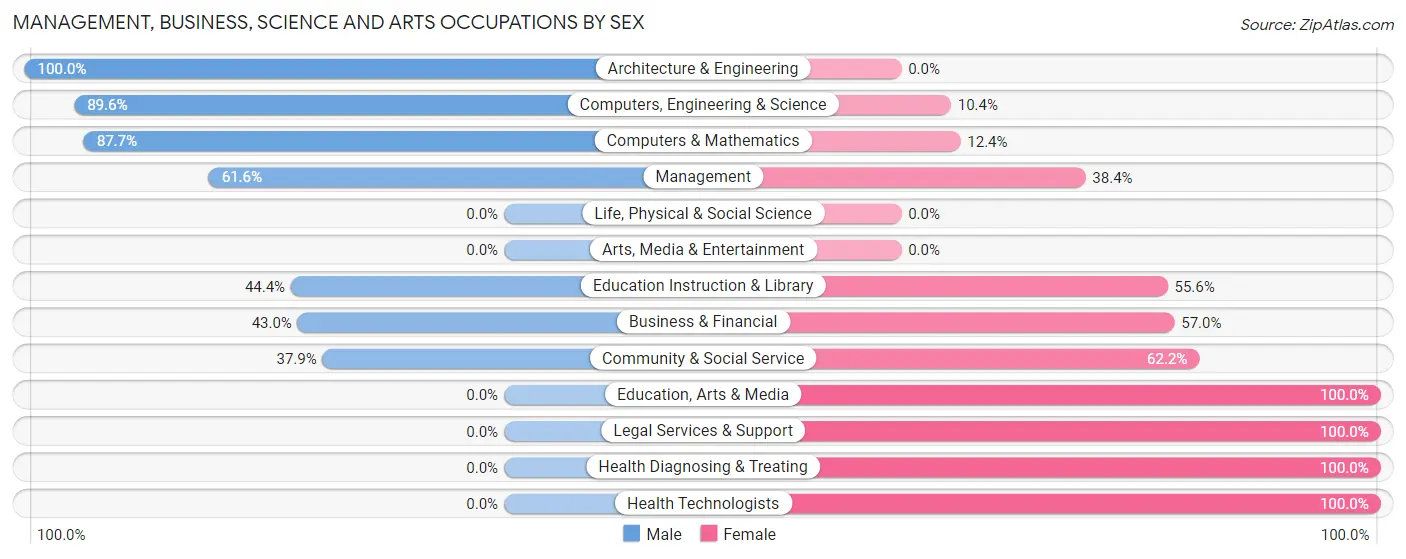
Management, Business, Science and Arts Occupations by Sex
Within the Management, Business, Science and Arts occupations in North East, the most male-oriented occupations are Architecture & Engineering (100.0%), Computers, Engineering & Science (89.6%), and Computers & Mathematics (87.6%), while the most female-oriented occupations are Education, Arts & Media (100.0%), Legal Services & Support (100.0%), and Health Diagnosing & Treating (100.0%).
| Occupation | Male | Female |
| Management | 141 (61.6%) | 88 (38.4%) |
| Business & Financial | 71 (43.0%) | 94 (57.0%) |
| Computers, Engineering & Science | 173 (89.6%) | 20 (10.4%) |
| Computers & Mathematics | 142 (87.6%) | 20 (12.3%) |
| Architecture & Engineering | 31 (100.0%) | 0 (0.0%) |
| Life, Physical & Social Science | 0 (0.0%) | 0 (0.0%) |
| Community & Social Service | 120 (37.9%) | 197 (62.2%) |
| Education, Arts & Media | 0 (0.0%) | 20 (100.0%) |
| Legal Services & Support | 0 (0.0%) | 27 (100.0%) |
| Education Instruction & Library | 120 (44.4%) | 150 (55.6%) |
| Arts, Media & Entertainment | 0 (0.0%) | 0 (0.0%) |
| Health Diagnosing & Treating | 0 (0.0%) | 79 (100.0%) |
| Health Technologists | 0 (0.0%) | 60 (100.0%) |
| Total (Category) | 505 (51.4%) | 478 (48.6%) |
| Total (Overall) | 1,053 (52.5%) | 953 (47.5%) |
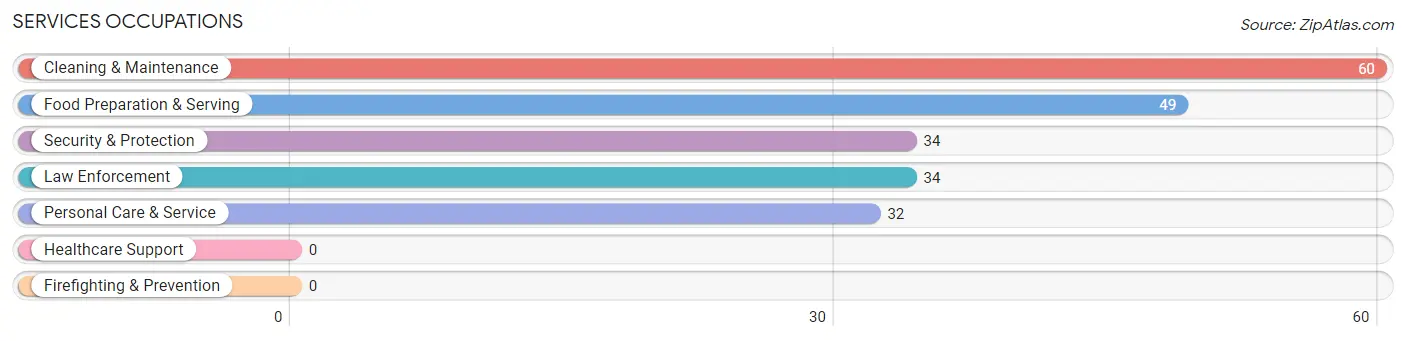
Services Occupations
The most common Services occupations in North East are Cleaning & Maintenance (60 | 3.0%), Food Preparation & Serving (49 | 2.4%), Security & Protection (34 | 1.7%), Law Enforcement (34 | 1.7%), and Personal Care & Service (32 | 1.6%).
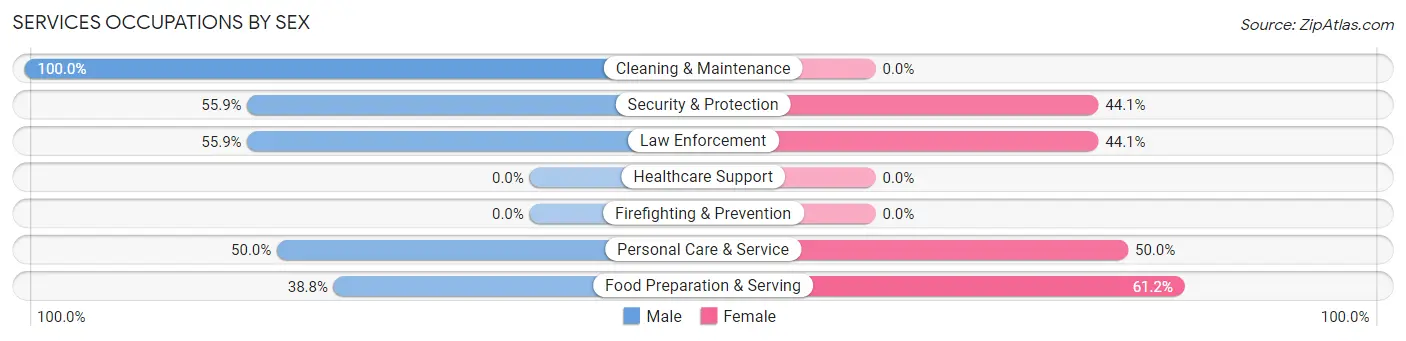
Services Occupations by Sex
Within the Services occupations in North East, the most male-oriented occupations are Cleaning & Maintenance (100.0%), Security & Protection (55.9%), and Law Enforcement (55.9%), while the most female-oriented occupations are Food Preparation & Serving (61.2%), Personal Care & Service (50.0%), and Security & Protection (44.1%).
| Occupation | Male | Female |
| Healthcare Support | 0 (0.0%) | 0 (0.0%) |
| Security & Protection | 19 (55.9%) | 15 (44.1%) |
| Firefighting & Prevention | 0 (0.0%) | 0 (0.0%) |
| Law Enforcement | 19 (55.9%) | 15 (44.1%) |
| Food Preparation & Serving | 19 (38.8%) | 30 (61.2%) |
| Cleaning & Maintenance | 60 (100.0%) | 0 (0.0%) |
| Personal Care & Service | 16 (50.0%) | 16 (50.0%) |
| Total (Category) | 114 (65.1%) | 61 (34.9%) |
| Total (Overall) | 1,053 (52.5%) | 953 (47.5%) |
Sales and Office Occupations
The most common Sales and Office occupations in North East are Sales & Related (232 | 11.6%), and Office & Administration (207 | 10.3%).
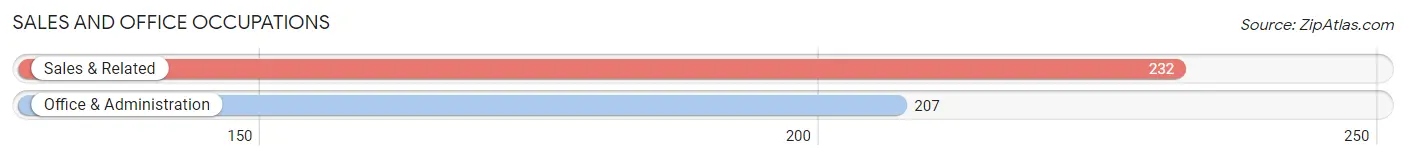
Sales and Office Occupations by Sex
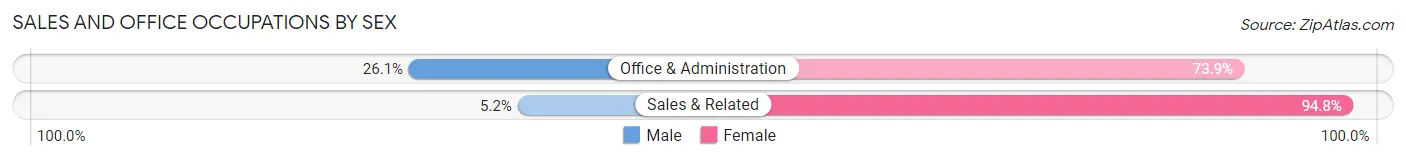
| Occupation | Male | Female |
| Sales & Related | 12 (5.2%) | 220 (94.8%) |
| Office & Administration | 54 (26.1%) | 153 (73.9%) |
| Total (Category) | 66 (15.0%) | 373 (85.0%) |
| Total (Overall) | 1,053 (52.5%) | 953 (47.5%) |
Natural Resources, Construction and Maintenance Occupations
The most common Natural Resources, Construction and Maintenance occupations in North East are Installation, Maintenance & Repair (85 | 4.2%), and Construction & Extraction (57 | 2.8%).
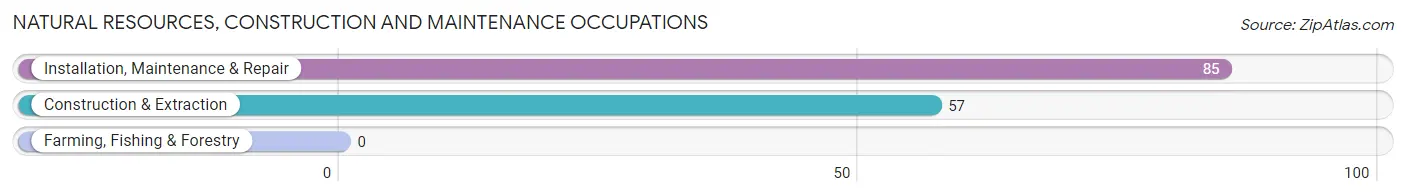
Natural Resources, Construction and Maintenance Occupations by Sex
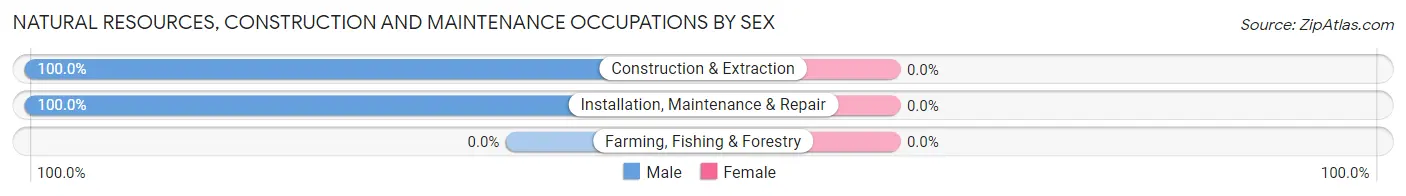
| Occupation | Male | Female |
| Farming, Fishing & Forestry | 0 (0.0%) | 0 (0.0%) |
| Construction & Extraction | 57 (100.0%) | 0 (0.0%) |
| Installation, Maintenance & Repair | 85 (100.0%) | 0 (0.0%) |
| Total (Category) | 142 (100.0%) | 0 (0.0%) |
| Total (Overall) | 1,053 (52.5%) | 953 (47.5%) |
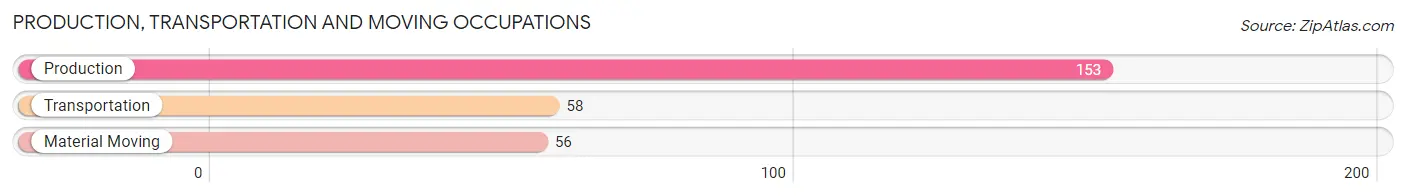
Production, Transportation and Moving Occupations
The most common Production, Transportation and Moving occupations in North East are Production (153 | 7.6%), Transportation (58 | 2.9%), and Material Moving (56 | 2.8%).
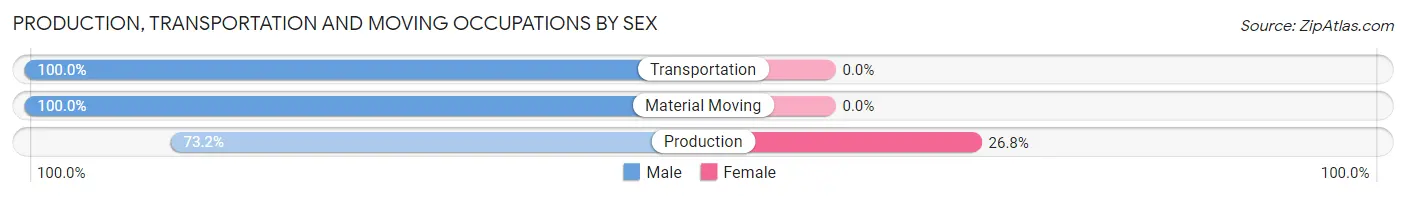
Production, Transportation and Moving Occupations by Sex
| Occupation | Male | Female |
| Production | 112 (73.2%) | 41 (26.8%) |
| Transportation | 58 (100.0%) | 0 (0.0%) |
| Material Moving | 56 (100.0%) | 0 (0.0%) |
| Total (Category) | 226 (84.6%) | 41 (15.4%) |
| Total (Overall) | 1,053 (52.5%) | 953 (47.5%) |
Employment Industries by Sex in North East
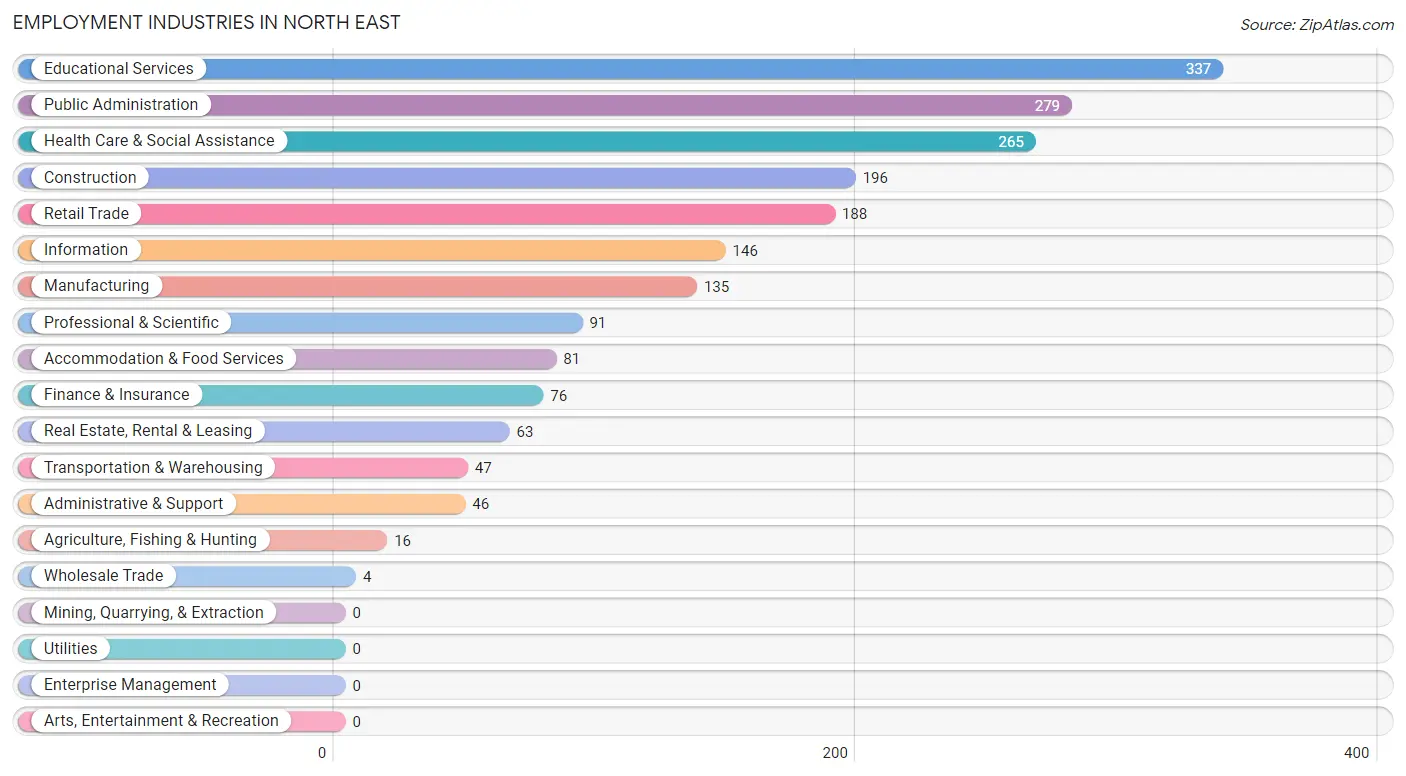
Employment Industries in North East
The major employment industries in North East include Educational Services (337 | 16.8%), Public Administration (279 | 13.9%), Health Care & Social Assistance (265 | 13.2%), Construction (196 | 9.8%), and Retail Trade (188 | 9.4%).
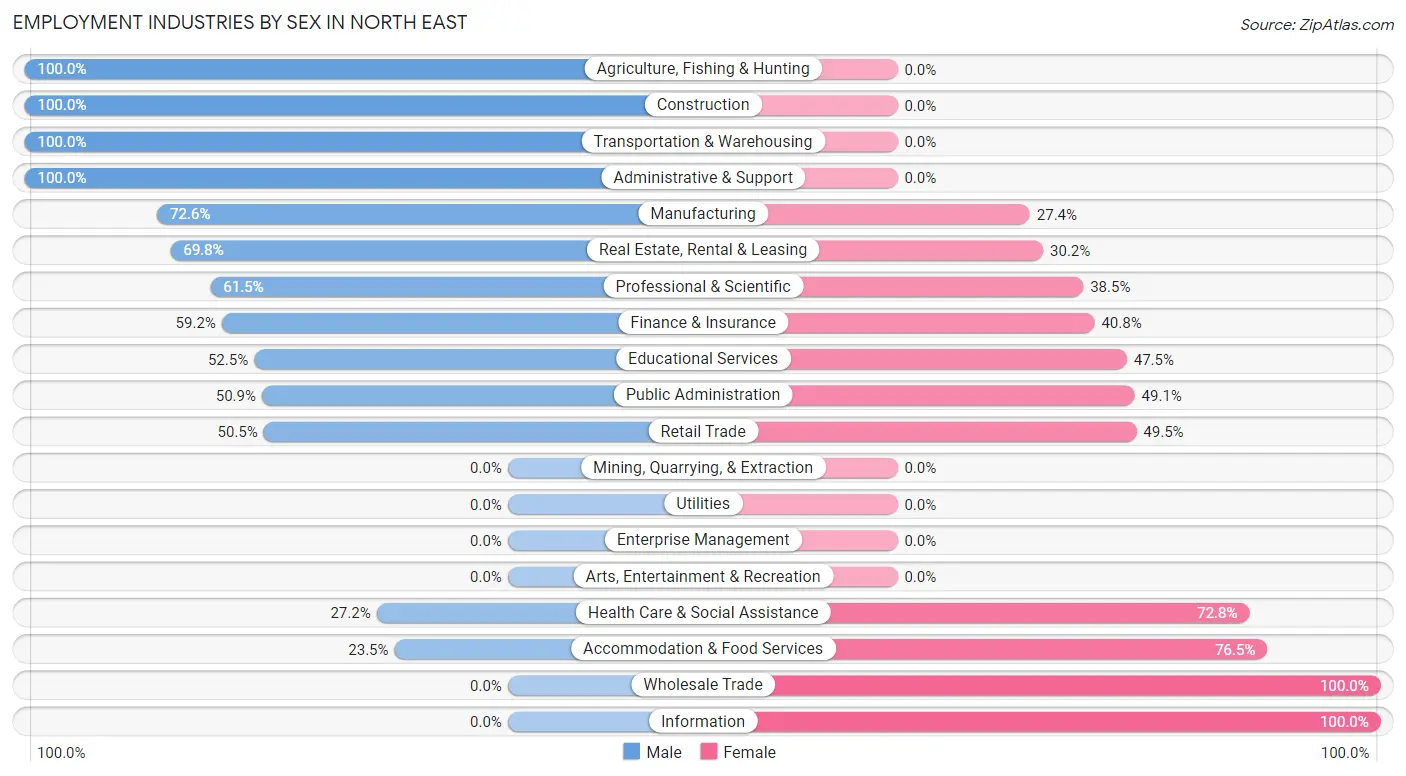
Employment Industries by Sex in North East
The North East industries that see more men than women are Agriculture, Fishing & Hunting (100.0%), Construction (100.0%), and Transportation & Warehousing (100.0%), whereas the industries that tend to have a higher number of women are Wholesale Trade (100.0%), Information (100.0%), and Accommodation & Food Services (76.5%).
| Industry | Male | Female |
| Agriculture, Fishing & Hunting | 16 (100.0%) | 0 (0.0%) |
| Mining, Quarrying, & Extraction | 0 (0.0%) | 0 (0.0%) |
| Construction | 196 (100.0%) | 0 (0.0%) |
| Manufacturing | 98 (72.6%) | 37 (27.4%) |
| Wholesale Trade | 0 (0.0%) | 4 (100.0%) |
| Retail Trade | 95 (50.5%) | 93 (49.5%) |
| Transportation & Warehousing | 47 (100.0%) | 0 (0.0%) |
| Utilities | 0 (0.0%) | 0 (0.0%) |
| Information | 0 (0.0%) | 146 (100.0%) |
| Finance & Insurance | 45 (59.2%) | 31 (40.8%) |
| Real Estate, Rental & Leasing | 44 (69.8%) | 19 (30.2%) |
| Professional & Scientific | 56 (61.5%) | 35 (38.5%) |
| Enterprise Management | 0 (0.0%) | 0 (0.0%) |
| Administrative & Support | 46 (100.0%) | 0 (0.0%) |
| Educational Services | 177 (52.5%) | 160 (47.5%) |
| Health Care & Social Assistance | 72 (27.2%) | 193 (72.8%) |
| Arts, Entertainment & Recreation | 0 (0.0%) | 0 (0.0%) |
| Accommodation & Food Services | 19 (23.5%) | 62 (76.5%) |
| Public Administration | 142 (50.9%) | 137 (49.1%) |
| Total | 1,053 (52.5%) | 953 (47.5%) |
Education in North East
School Enrollment in North East
The most common levels of schooling among the 723 students in North East are nursery / preschool (179 | 24.8%), middle school (174 | 24.1%), and high school (151 | 20.9%).
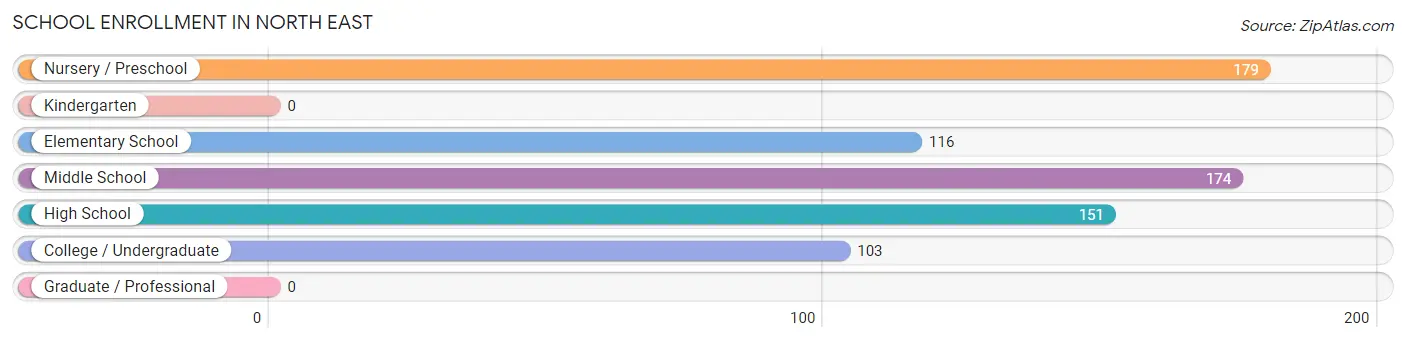
| School Level | # Students | % Students |
| Nursery / Preschool | 179 | 24.8% |
| Kindergarten | 0 | 0.0% |
| Elementary School | 116 | 16.0% |
| Middle School | 174 | 24.1% |
| High School | 151 | 20.9% |
| College / Undergraduate | 103 | 14.2% |
| Graduate / Professional | 0 | 0.0% |
| Total | 723 | 100.0% |
School Enrollment by Age by Funding Source in North East
Out of a total of 723 students who are enrolled in schools in North East, 64 (8.9%) attend a private institution, while the remaining 659 (91.1%) are enrolled in public schools. The age group of 35 years and over has the highest likelihood of being enrolled in private schools, with 20 (42.5% in the age bracket) enrolled. Conversely, the age group of 5 to 9 year old has the lowest likelihood of being enrolled in a private school, with 172 (100.0% in the age bracket) attending a public institution.
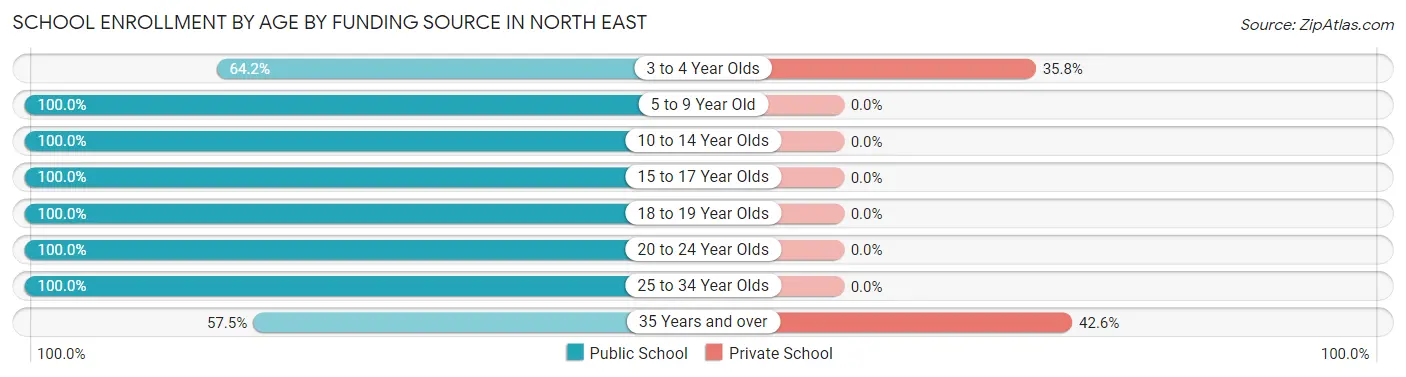
| Age Bracket | Public School | Private School |
| 3 to 4 Year Olds | 79 (64.2%) | 44 (35.8%) |
| 5 to 9 Year Old | 172 (100.0%) | 0 (0.0%) |
| 10 to 14 Year Olds | 174 (100.0%) | 0 (0.0%) |
| 15 to 17 Year Olds | 101 (100.0%) | 0 (0.0%) |
| 18 to 19 Year Olds | 50 (100.0%) | 0 (0.0%) |
| 20 to 24 Year Olds | 24 (100.0%) | 0 (0.0%) |
| 25 to 34 Year Olds | 32 (100.0%) | 0 (0.0%) |
| 35 Years and over | 27 (57.5%) | 20 (42.5%) |
| Total | 659 (91.1%) | 64 (8.9%) |
Educational Attainment by Field of Study in North East
Education (271 | 29.1%), liberal arts & history (171 | 18.4%), business (155 | 16.7%), computers & mathematics (97 | 10.4%), and social sciences (63 | 6.8%) are the most common fields of study among 930 individuals in North East who have obtained a bachelor's degree or higher.
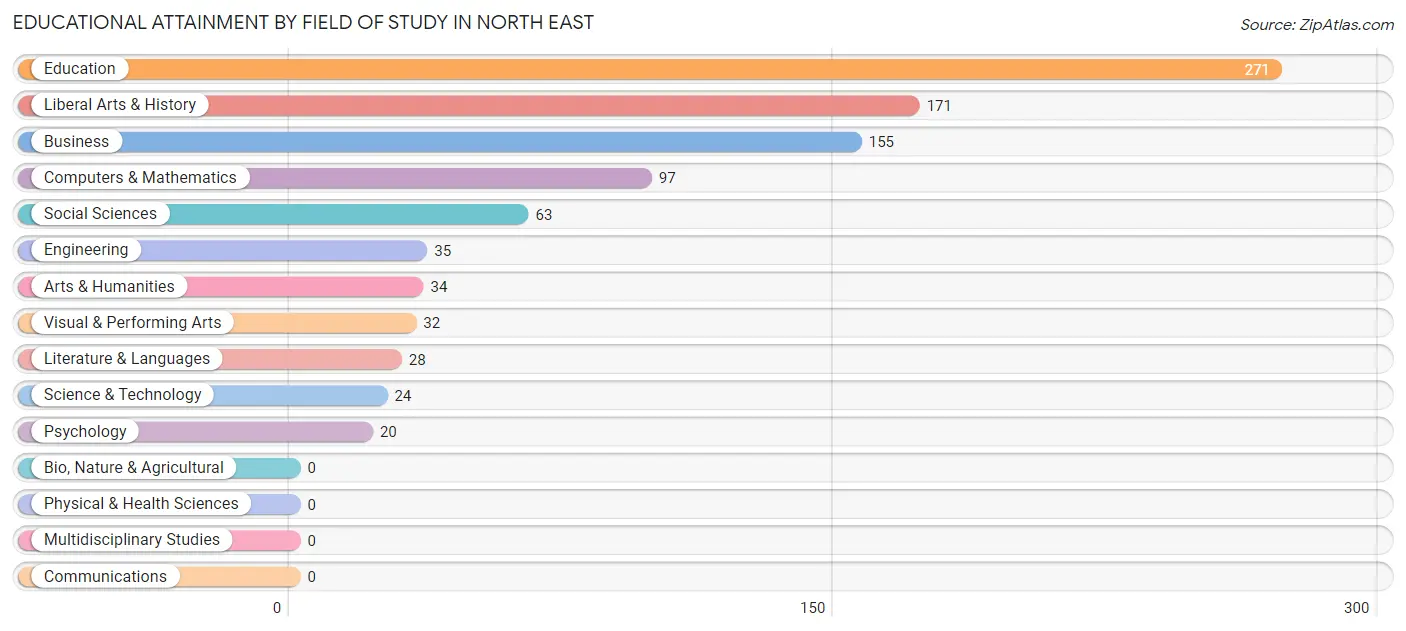
| Field of Study | # Graduates | % Graduates |
| Computers & Mathematics | 97 | 10.4% |
| Bio, Nature & Agricultural | 0 | 0.0% |
| Physical & Health Sciences | 0 | 0.0% |
| Psychology | 20 | 2.1% |
| Social Sciences | 63 | 6.8% |
| Engineering | 35 | 3.8% |
| Multidisciplinary Studies | 0 | 0.0% |
| Science & Technology | 24 | 2.6% |
| Business | 155 | 16.7% |
| Education | 271 | 29.1% |
| Literature & Languages | 28 | 3.0% |
| Liberal Arts & History | 171 | 18.4% |
| Visual & Performing Arts | 32 | 3.4% |
| Communications | 0 | 0.0% |
| Arts & Humanities | 34 | 3.7% |
| Total | 930 | 100.0% |
Transportation & Commute in North East
Vehicle Availability by Sex in North East
The most prevalent vehicle ownership categories in North East are males with 2 vehicles (490, accounting for 45.2%) and females with 2 vehicles (304, making up 52.0%).
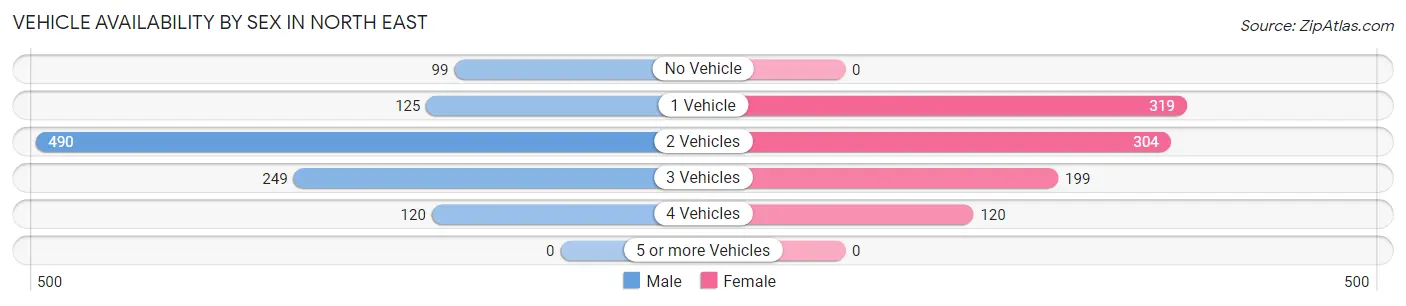
| Vehicles Available | Male | Female |
| No Vehicle | 99 (9.1%) | 0 (0.0%) |
| 1 Vehicle | 125 (11.5%) | 319 (33.9%) |
| 2 Vehicles | 490 (45.2%) | 304 (32.3%) |
| 3 Vehicles | 249 (23.0%) | 199 (21.1%) |
| 4 Vehicles | 120 (11.1%) | 120 (12.7%) |
| 5 or more Vehicles | 0 (0.0%) | 0 (0.0%) |
| Total | 1,083 (100.0%) | 942 (100.0%) |
Commute Time in North East
The most frequently occuring commute durations in North East are 25 to 29 minutes (231 commuters, 12.3%), 45 to 59 minutes (216 commuters, 11.5%), and 15 to 19 minutes (203 commuters, 10.8%).
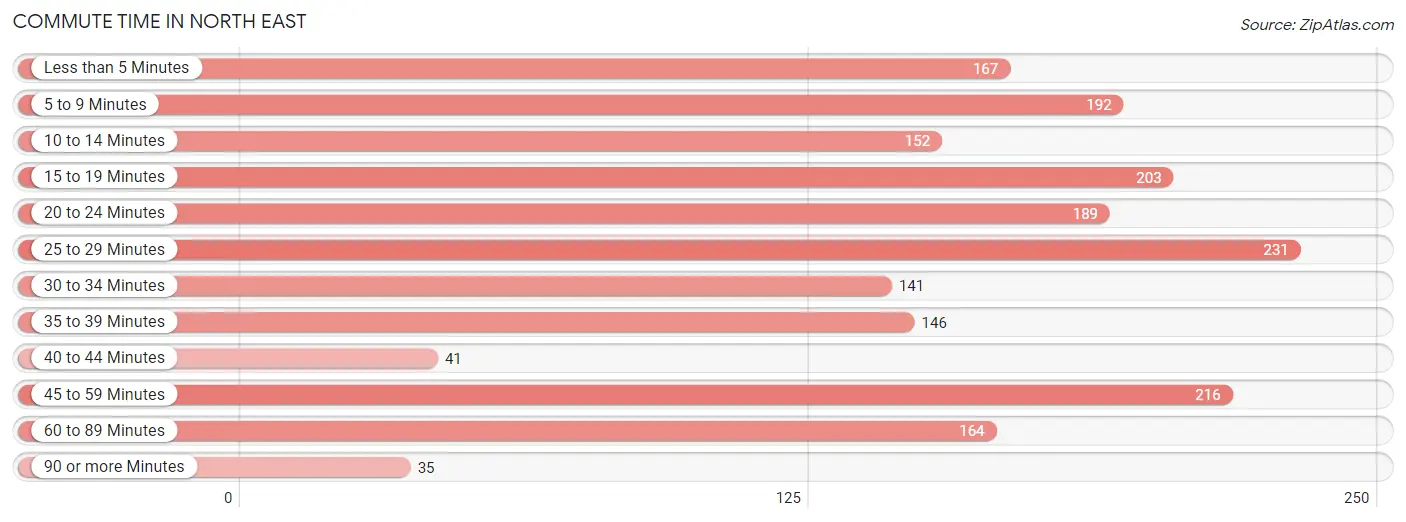
| Commute Time | # Commuters | % Commuters |
| Less than 5 Minutes | 167 | 8.9% |
| 5 to 9 Minutes | 192 | 10.2% |
| 10 to 14 Minutes | 152 | 8.1% |
| 15 to 19 Minutes | 203 | 10.8% |
| 20 to 24 Minutes | 189 | 10.1% |
| 25 to 29 Minutes | 231 | 12.3% |
| 30 to 34 Minutes | 141 | 7.5% |
| 35 to 39 Minutes | 146 | 7.8% |
| 40 to 44 Minutes | 41 | 2.2% |
| 45 to 59 Minutes | 216 | 11.5% |
| 60 to 89 Minutes | 164 | 8.7% |
| 90 or more Minutes | 35 | 1.9% |
Commute Time by Sex in North East
The most common commute times in North East are 20 to 24 minutes (147 commuters, 15.0%) for males and less than 5 minutes (167 commuters, 18.6%) for females.
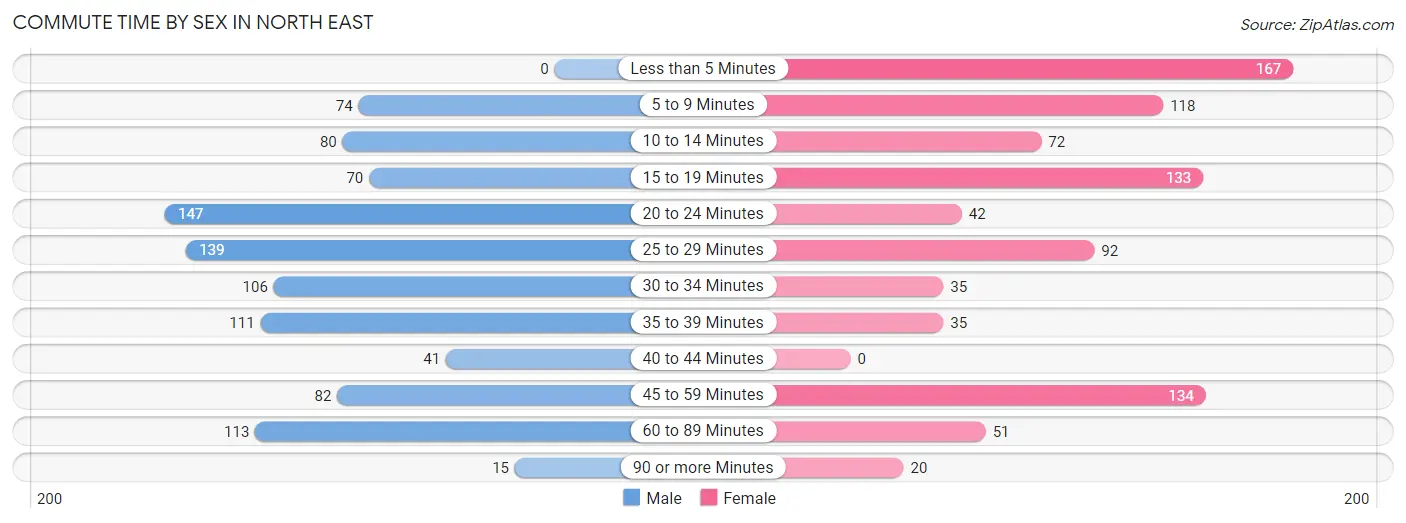
| Commute Time | Male | Female |
| Less than 5 Minutes | 0 (0.0%) | 167 (18.6%) |
| 5 to 9 Minutes | 74 (7.6%) | 118 (13.1%) |
| 10 to 14 Minutes | 80 (8.2%) | 72 (8.0%) |
| 15 to 19 Minutes | 70 (7.2%) | 133 (14.8%) |
| 20 to 24 Minutes | 147 (15.0%) | 42 (4.7%) |
| 25 to 29 Minutes | 139 (14.2%) | 92 (10.2%) |
| 30 to 34 Minutes | 106 (10.8%) | 35 (3.9%) |
| 35 to 39 Minutes | 111 (11.4%) | 35 (3.9%) |
| 40 to 44 Minutes | 41 (4.2%) | 0 (0.0%) |
| 45 to 59 Minutes | 82 (8.4%) | 134 (14.9%) |
| 60 to 89 Minutes | 113 (11.6%) | 51 (5.7%) |
| 90 or more Minutes | 15 (1.5%) | 20 (2.2%) |
Time of Departure to Work by Sex in North East
The most frequent times of departure to work in North East are 6:30 AM to 6:59 AM (183, 18.7%) for males and 7:00 AM to 7:29 AM (327, 36.4%) for females.
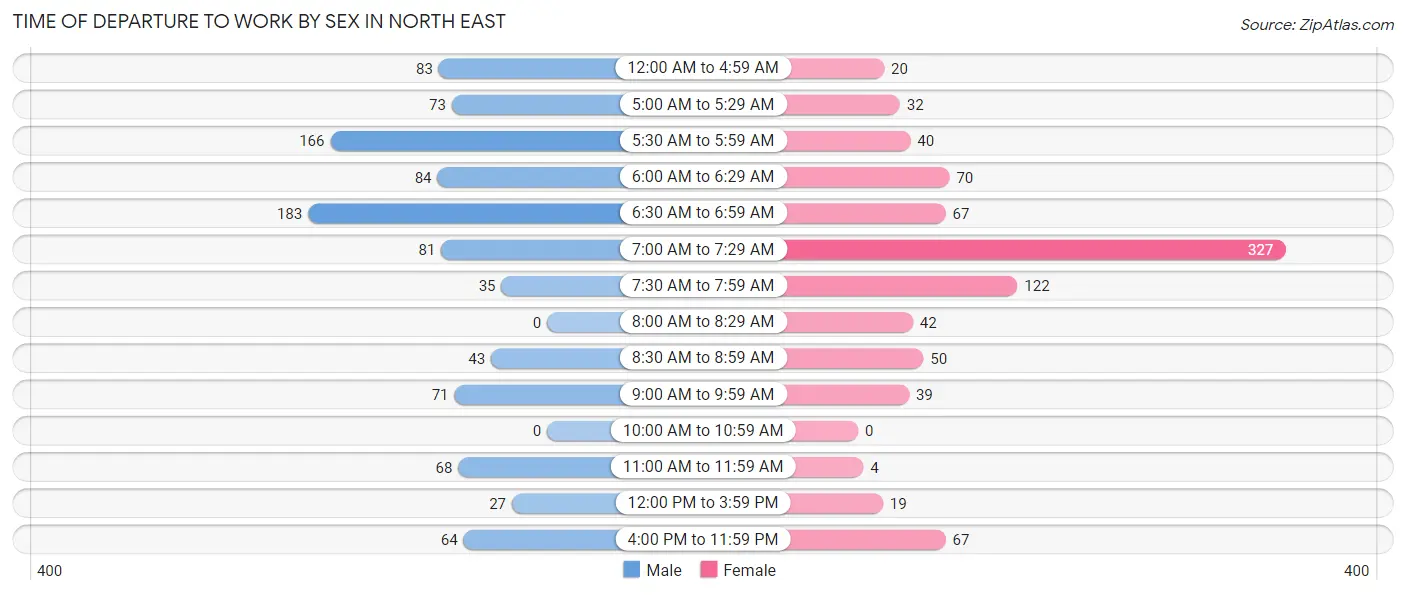
| Time of Departure | Male | Female |
| 12:00 AM to 4:59 AM | 83 (8.5%) | 20 (2.2%) |
| 5:00 AM to 5:29 AM | 73 (7.5%) | 32 (3.6%) |
| 5:30 AM to 5:59 AM | 166 (17.0%) | 40 (4.4%) |
| 6:00 AM to 6:29 AM | 84 (8.6%) | 70 (7.8%) |
| 6:30 AM to 6:59 AM | 183 (18.7%) | 67 (7.4%) |
| 7:00 AM to 7:29 AM | 81 (8.3%) | 327 (36.4%) |
| 7:30 AM to 7:59 AM | 35 (3.6%) | 122 (13.6%) |
| 8:00 AM to 8:29 AM | 0 (0.0%) | 42 (4.7%) |
| 8:30 AM to 8:59 AM | 43 (4.4%) | 50 (5.6%) |
| 9:00 AM to 9:59 AM | 71 (7.3%) | 39 (4.3%) |
| 10:00 AM to 10:59 AM | 0 (0.0%) | 0 (0.0%) |
| 11:00 AM to 11:59 AM | 68 (7.0%) | 4 (0.4%) |
| 12:00 PM to 3:59 PM | 27 (2.8%) | 19 (2.1%) |
| 4:00 PM to 11:59 PM | 64 (6.5%) | 67 (7.4%) |
| Total | 978 (100.0%) | 899 (100.0%) |
Housing Occupancy in North East
Occupancy by Ownership in North East
Of the total 1,724 dwellings in North East, owner-occupied units account for 996 (57.8%), while renter-occupied units make up 728 (42.2%).
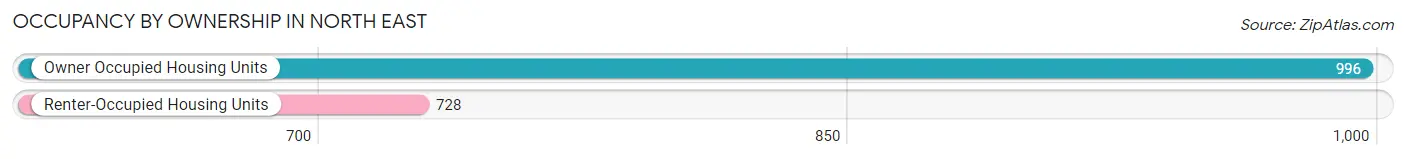
| Occupancy | # Housing Units | % Housing Units |
| Owner Occupied Housing Units | 996 | 57.8% |
| Renter-Occupied Housing Units | 728 | 42.2% |
| Total Occupied Housing Units | 1,724 | 100.0% |
Occupancy by Household Size in North East
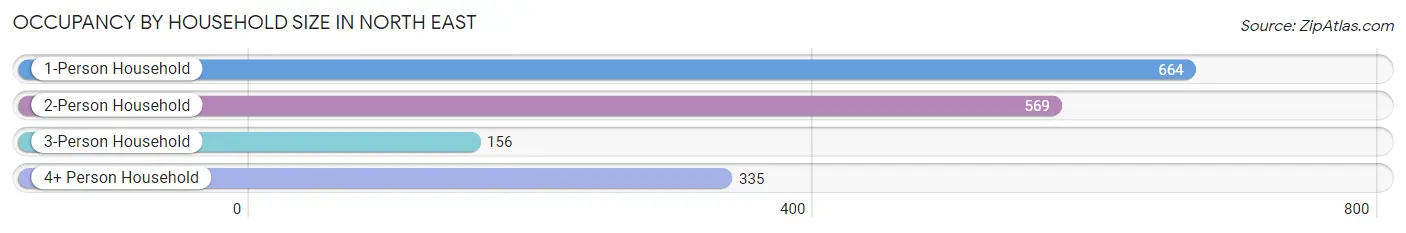
| Household Size | # Housing Units | % Housing Units |
| 1-Person Household | 664 | 38.5% |
| 2-Person Household | 569 | 33.0% |
| 3-Person Household | 156 | 9.0% |
| 4+ Person Household | 335 | 19.4% |
| Total Housing Units | 1,724 | 100.0% |
Occupancy by Ownership by Household Size in North East
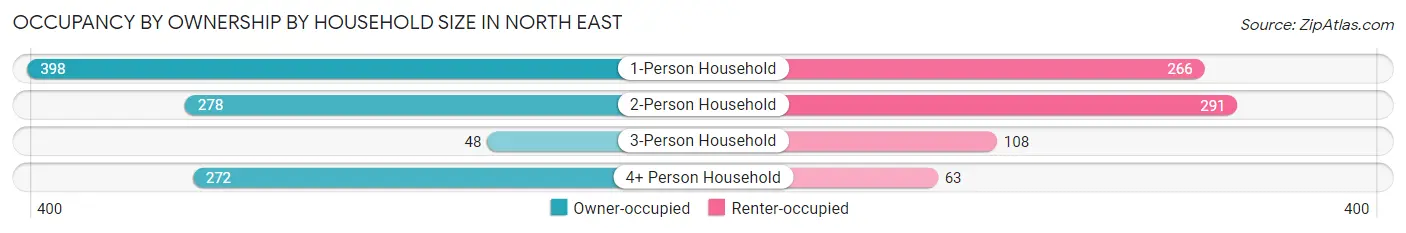
| Household Size | Owner-occupied | Renter-occupied |
| 1-Person Household | 398 (59.9%) | 266 (40.1%) |
| 2-Person Household | 278 (48.9%) | 291 (51.1%) |
| 3-Person Household | 48 (30.8%) | 108 (69.2%) |
| 4+ Person Household | 272 (81.2%) | 63 (18.8%) |
| Total Housing Units | 996 (57.8%) | 728 (42.2%) |
Occupancy by Educational Attainment in North East
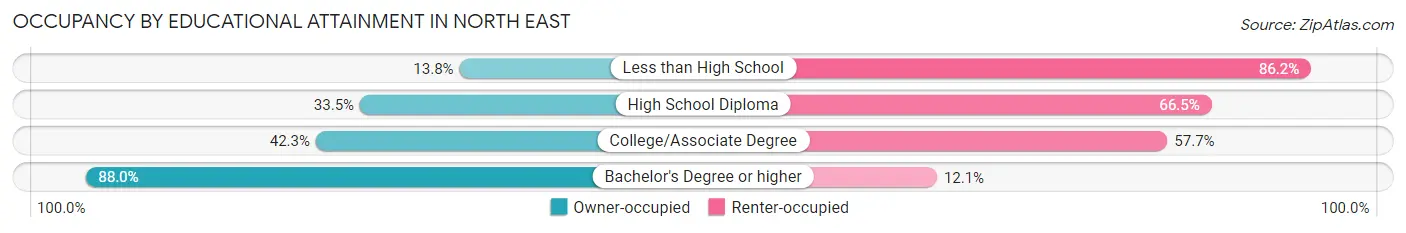
| Household Size | Owner-occupied | Renter-occupied |
| Less than High School | 4 (13.8%) | 25 (86.2%) |
| High School Diploma | 120 (33.5%) | 238 (66.5%) |
| College/Associate Degree | 281 (42.3%) | 384 (57.7%) |
| Bachelor's Degree or higher | 591 (87.9%) | 81 (12.0%) |
Occupancy by Age of Householder in North East
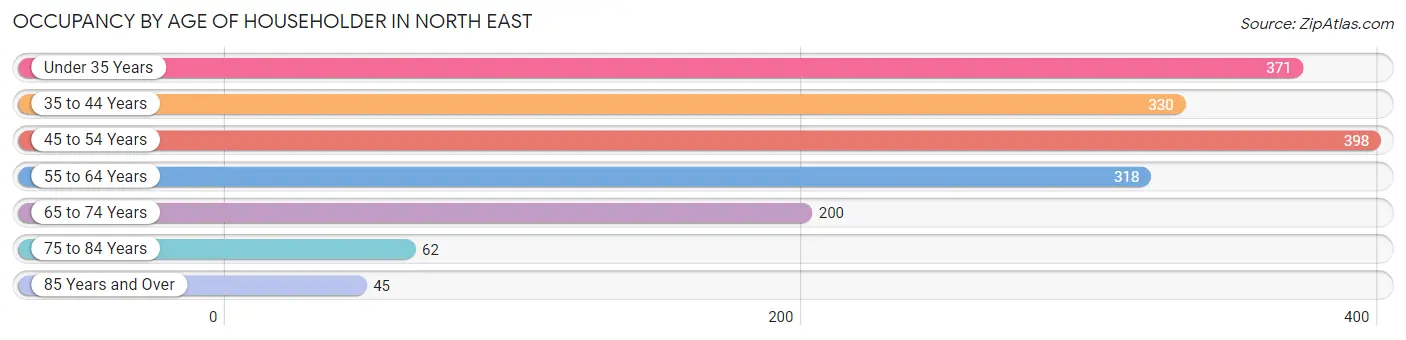
| Age Bracket | # Households | % Households |
| Under 35 Years | 371 | 21.5% |
| 35 to 44 Years | 330 | 19.1% |
| 45 to 54 Years | 398 | 23.1% |
| 55 to 64 Years | 318 | 18.4% |
| 65 to 74 Years | 200 | 11.6% |
| 75 to 84 Years | 62 | 3.6% |
| 85 Years and Over | 45 | 2.6% |
| Total | 1,724 | 100.0% |
Housing Finances in North East
Median Income by Occupancy in North East
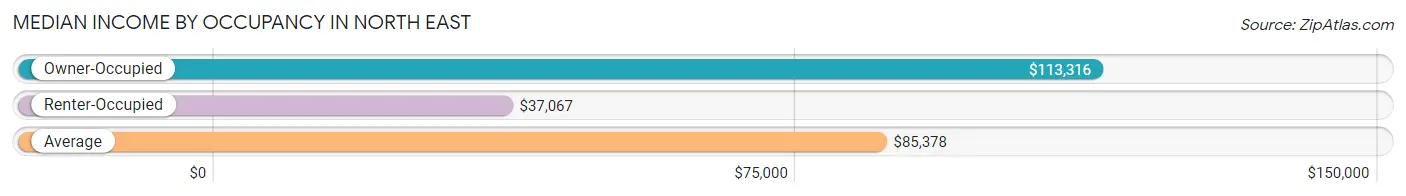
| Occupancy Type | # Households | Median Income |
| Owner-Occupied | 996 (57.8%) | $113,316 |
| Renter-Occupied | 728 (42.2%) | $37,067 |
| Average | 1,724 (100.0%) | $85,378 |
Occupancy by Householder Income Bracket in North East
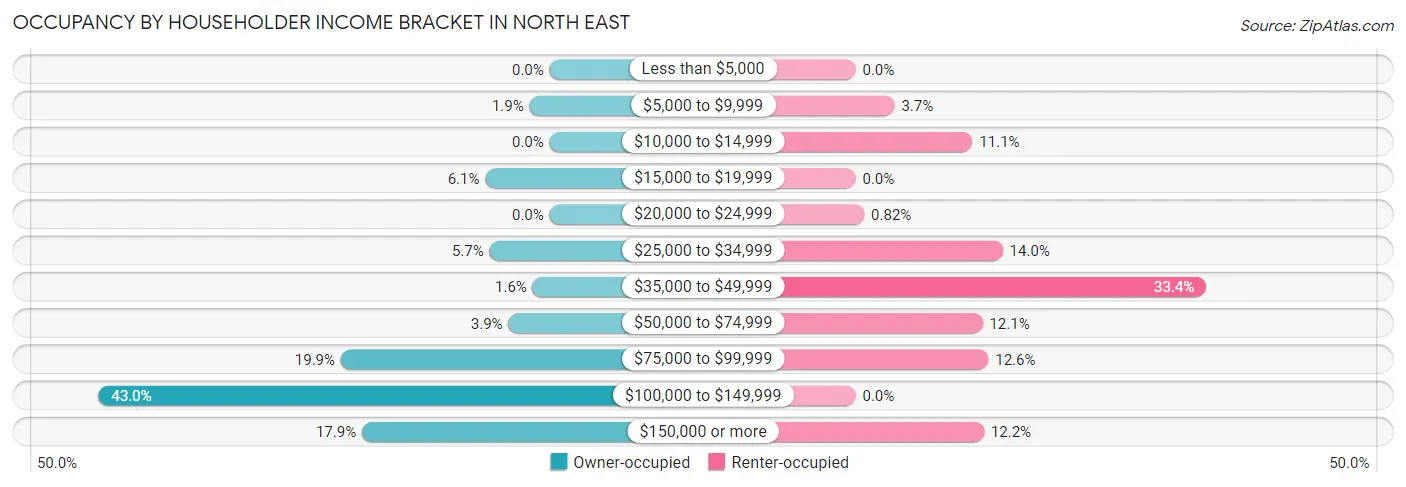
| Income Bracket | Owner-occupied | Renter-occupied |
| Less than $5,000 | 0 (0.0%) | 0 (0.0%) |
| $5,000 to $9,999 | 19 (1.9%) | 27 (3.7%) |
| $10,000 to $14,999 | 0 (0.0%) | 81 (11.1%) |
| $15,000 to $19,999 | 61 (6.1%) | 0 (0.0%) |
| $20,000 to $24,999 | 0 (0.0%) | 6 (0.8%) |
| $25,000 to $34,999 | 57 (5.7%) | 102 (14.0%) |
| $35,000 to $49,999 | 16 (1.6%) | 243 (33.4%) |
| $50,000 to $74,999 | 39 (3.9%) | 88 (12.1%) |
| $75,000 to $99,999 | 198 (19.9%) | 92 (12.6%) |
| $100,000 to $149,999 | 428 (43.0%) | 0 (0.0%) |
| $150,000 or more | 178 (17.9%) | 89 (12.2%) |
| Total | 996 (100.0%) | 728 (100.0%) |
Monthly Housing Cost Tiers in North East
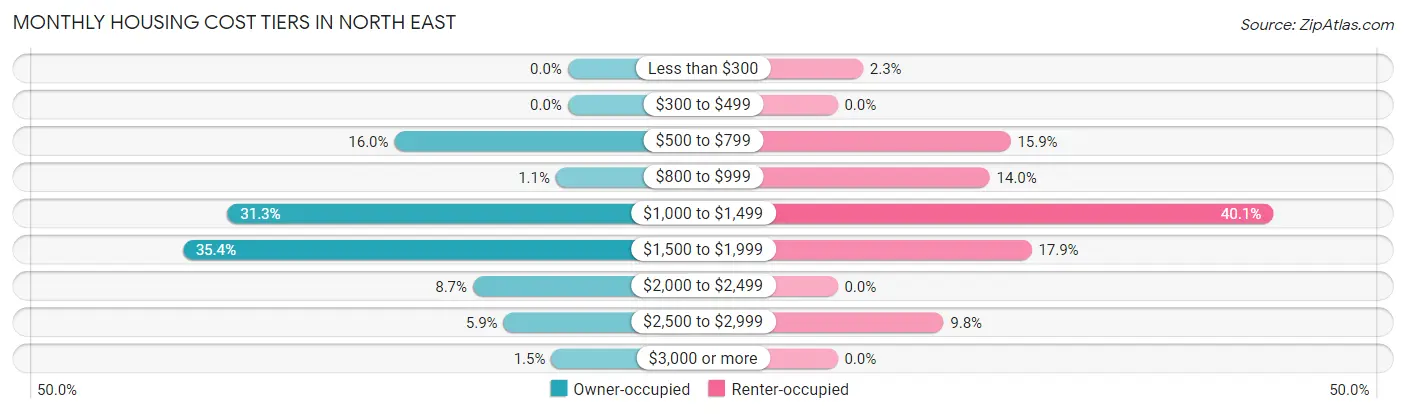
| Monthly Cost | Owner-occupied | Renter-occupied |
| Less than $300 | 0 (0.0%) | 17 (2.3%) |
| $300 to $499 | 0 (0.0%) | 0 (0.0%) |
| $500 to $799 | 159 (16.0%) | 116 (15.9%) |
| $800 to $999 | 11 (1.1%) | 102 (14.0%) |
| $1,000 to $1,499 | 312 (31.3%) | 292 (40.1%) |
| $1,500 to $1,999 | 353 (35.4%) | 130 (17.9%) |
| $2,000 to $2,499 | 87 (8.7%) | 0 (0.0%) |
| $2,500 to $2,999 | 59 (5.9%) | 71 (9.8%) |
| $3,000 or more | 15 (1.5%) | 0 (0.0%) |
| Total | 996 (100.0%) | 728 (100.0%) |
Physical Housing Characteristics in North East
Housing Structures in North East
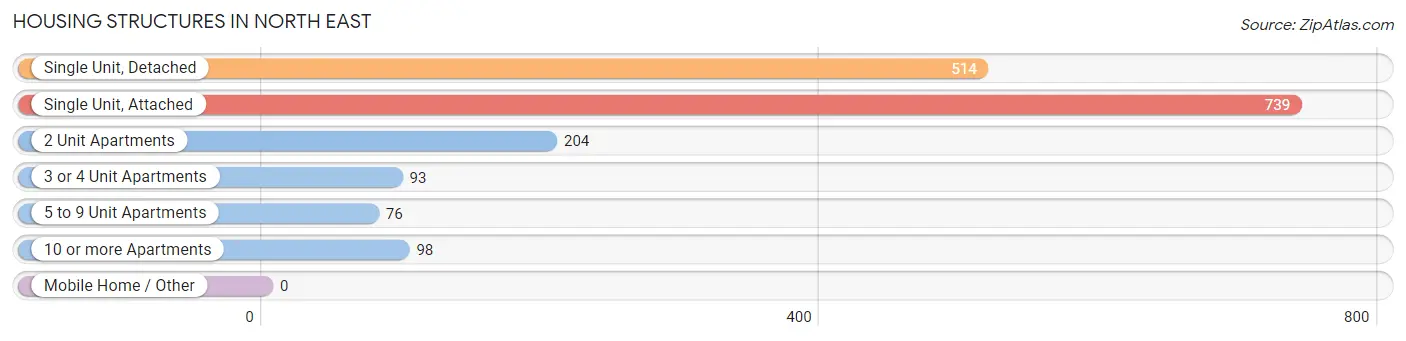
| Structure Type | # Housing Units | % Housing Units |
| Single Unit, Detached | 514 | 29.8% |
| Single Unit, Attached | 739 | 42.9% |
| 2 Unit Apartments | 204 | 11.8% |
| 3 or 4 Unit Apartments | 93 | 5.4% |
| 5 to 9 Unit Apartments | 76 | 4.4% |
| 10 or more Apartments | 98 | 5.7% |
| Mobile Home / Other | 0 | 0.0% |
| Total | 1,724 | 100.0% |
Housing Structures by Occupancy in North East
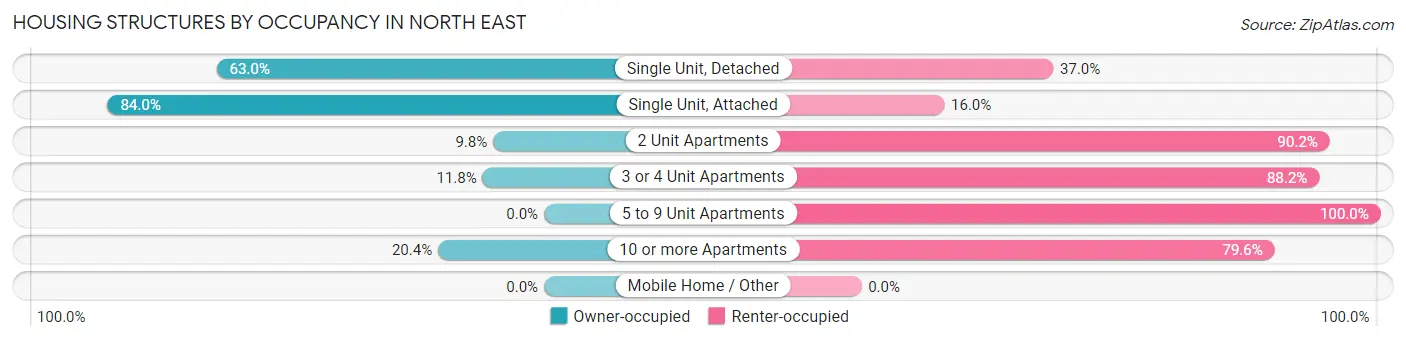
| Structure Type | Owner-occupied | Renter-occupied |
| Single Unit, Detached | 324 (63.0%) | 190 (37.0%) |
| Single Unit, Attached | 621 (84.0%) | 118 (16.0%) |
| 2 Unit Apartments | 20 (9.8%) | 184 (90.2%) |
| 3 or 4 Unit Apartments | 11 (11.8%) | 82 (88.2%) |
| 5 to 9 Unit Apartments | 0 (0.0%) | 76 (100.0%) |
| 10 or more Apartments | 20 (20.4%) | 78 (79.6%) |
| Mobile Home / Other | 0 (0.0%) | 0 (0.0%) |
| Total | 996 (57.8%) | 728 (42.2%) |
Housing Structures by Number of Rooms in North East
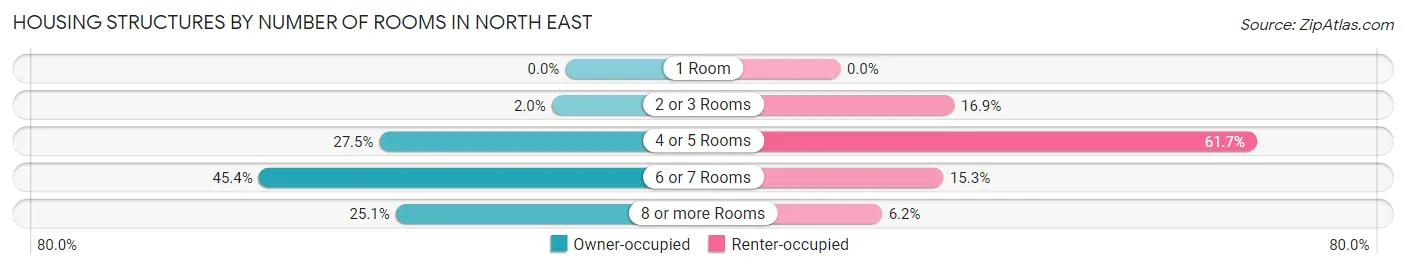
| Number of Rooms | Owner-occupied | Renter-occupied |
| 1 Room | 0 (0.0%) | 0 (0.0%) |
| 2 or 3 Rooms | 20 (2.0%) | 123 (16.9%) |
| 4 or 5 Rooms | 274 (27.5%) | 449 (61.7%) |
| 6 or 7 Rooms | 452 (45.4%) | 111 (15.2%) |
| 8 or more Rooms | 250 (25.1%) | 45 (6.2%) |
| Total | 996 (100.0%) | 728 (100.0%) |
Housing Structure by Heating Type in North East
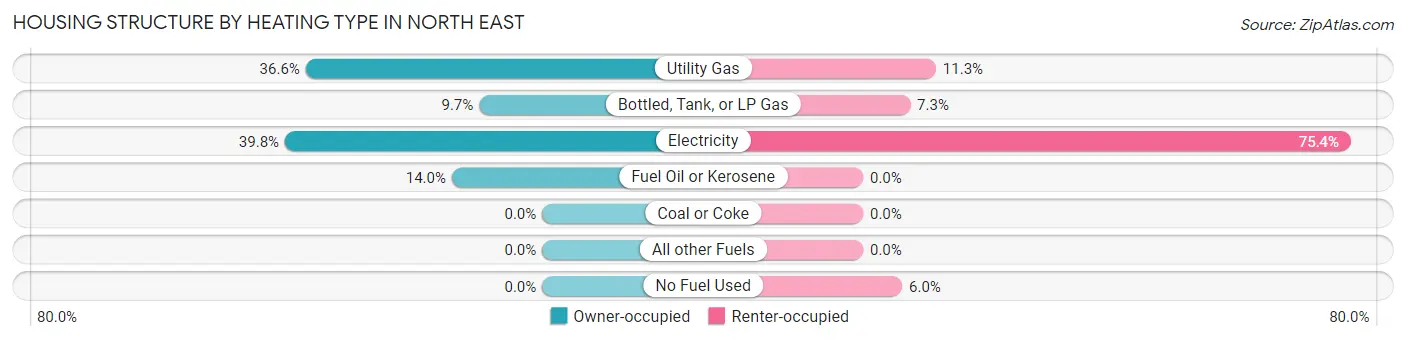
| Heating Type | Owner-occupied | Renter-occupied |
| Utility Gas | 364 (36.5%) | 82 (11.3%) |
| Bottled, Tank, or LP Gas | 97 (9.7%) | 53 (7.3%) |
| Electricity | 396 (39.8%) | 549 (75.4%) |
| Fuel Oil or Kerosene | 139 (14.0%) | 0 (0.0%) |
| Coal or Coke | 0 (0.0%) | 0 (0.0%) |
| All other Fuels | 0 (0.0%) | 0 (0.0%) |
| No Fuel Used | 0 (0.0%) | 44 (6.0%) |
| Total | 996 (100.0%) | 728 (100.0%) |
Household Vehicle Usage in North East
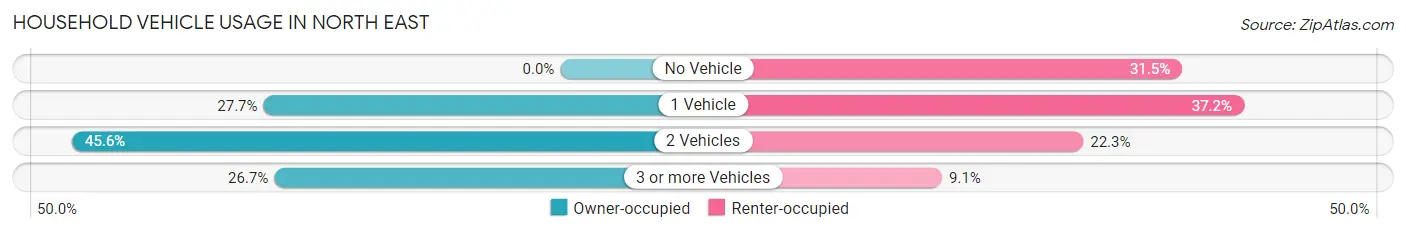
| Vehicles per Household | Owner-occupied | Renter-occupied |
| No Vehicle | 0 (0.0%) | 229 (31.5%) |
| 1 Vehicle | 276 (27.7%) | 271 (37.2%) |
| 2 Vehicles | 454 (45.6%) | 162 (22.3%) |
| 3 or more Vehicles | 266 (26.7%) | 66 (9.1%) |
| Total | 996 (100.0%) | 728 (100.0%) |
Real Estate & Mortgages in North East
Real Estate and Mortgage Overview in North East
| Characteristic | Without Mortgage | With Mortgage |
| Housing Units | 170 | 826 |
| Median Property Value | $145,900 | $229,100 |
| Median Household Income | $30,270 | $178 |
| Monthly Housing Costs | $663 | $15 |
| Real Estate Taxes | $2,500 | $0 |
Property Value by Mortgage Status in North East
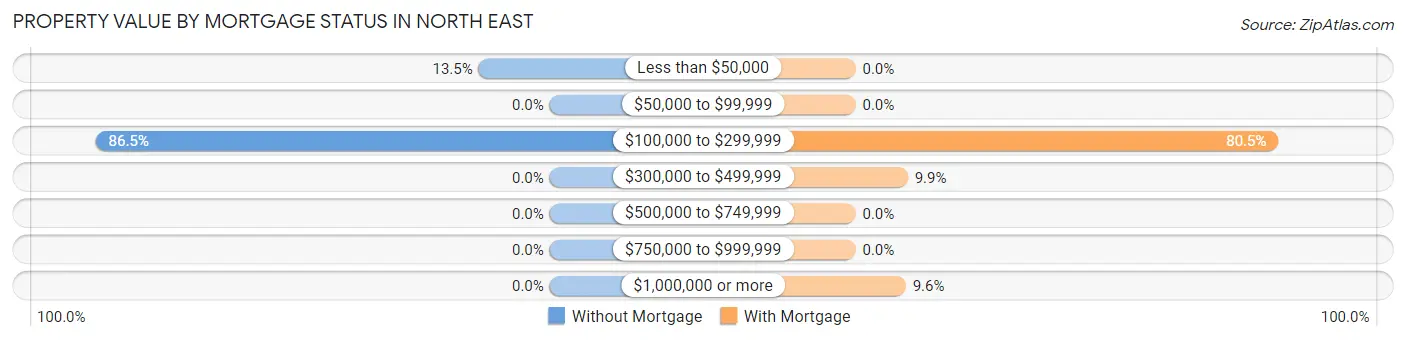
| Property Value | Without Mortgage | With Mortgage |
| Less than $50,000 | 23 (13.5%) | 0 (0.0%) |
| $50,000 to $99,999 | 0 (0.0%) | 0 (0.0%) |
| $100,000 to $299,999 | 147 (86.5%) | 665 (80.5%) |
| $300,000 to $499,999 | 0 (0.0%) | 82 (9.9%) |
| $500,000 to $749,999 | 0 (0.0%) | 0 (0.0%) |
| $750,000 to $999,999 | 0 (0.0%) | 0 (0.0%) |
| $1,000,000 or more | 0 (0.0%) | 79 (9.6%) |
| Total | 170 (100.0%) | 826 (100.0%) |
Household Income by Mortgage Status in North East
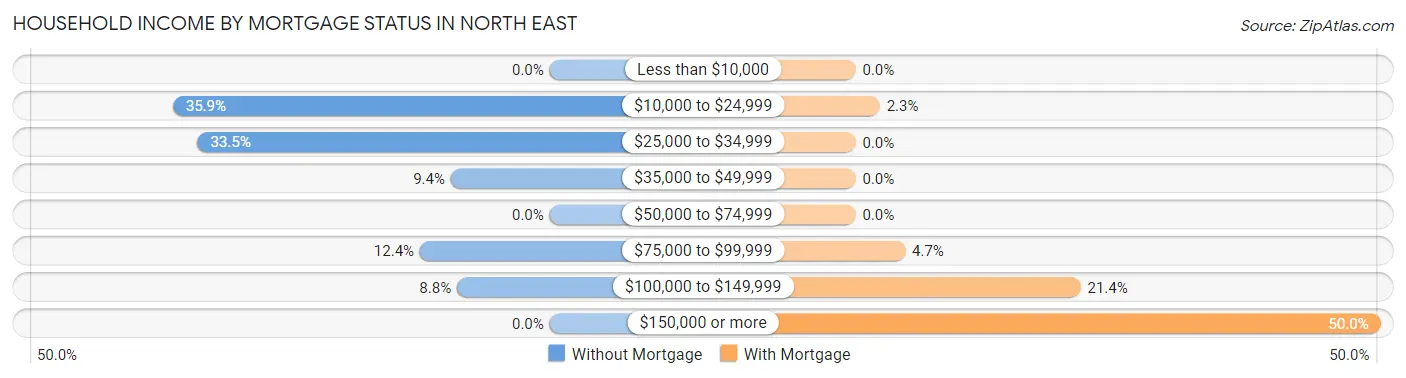
| Household Income | Without Mortgage | With Mortgage |
| Less than $10,000 | 0 (0.0%) | 0 (0.0%) |
| $10,000 to $24,999 | 61 (35.9%) | 19 (2.3%) |
| $25,000 to $34,999 | 57 (33.5%) | 0 (0.0%) |
| $35,000 to $49,999 | 16 (9.4%) | 0 (0.0%) |
| $50,000 to $74,999 | 0 (0.0%) | 0 (0.0%) |
| $75,000 to $99,999 | 21 (12.3%) | 39 (4.7%) |
| $100,000 to $149,999 | 15 (8.8%) | 177 (21.4%) |
| $150,000 or more | 0 (0.0%) | 413 (50.0%) |
| Total | 170 (100.0%) | 826 (100.0%) |
Property Value to Household Income Ratio in North East
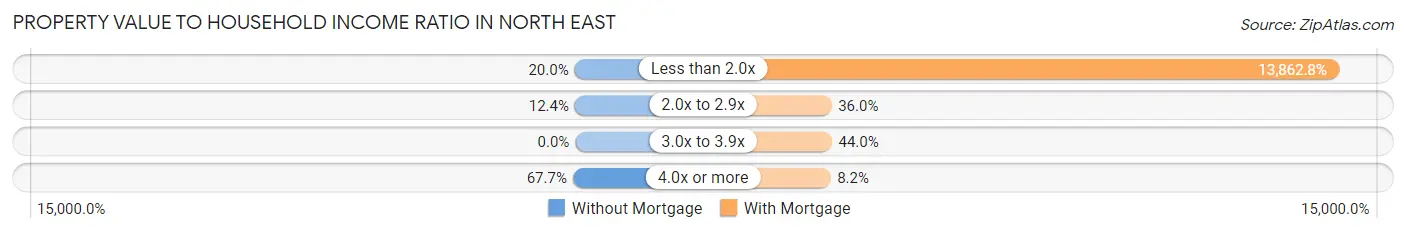
| Value-to-Income Ratio | Without Mortgage | With Mortgage |
| Less than 2.0x | 34 (20.0%) | 114,507 (13,862.8%) |
| 2.0x to 2.9x | 21 (12.3%) | 297 (36.0%) |
| 3.0x to 3.9x | 0 (0.0%) | 363 (44.0%) |
| 4.0x or more | 115 (67.6%) | 68 (8.2%) |
| Total | 170 (100.0%) | 826 (100.0%) |
Real Estate Taxes by Mortgage Status in North East
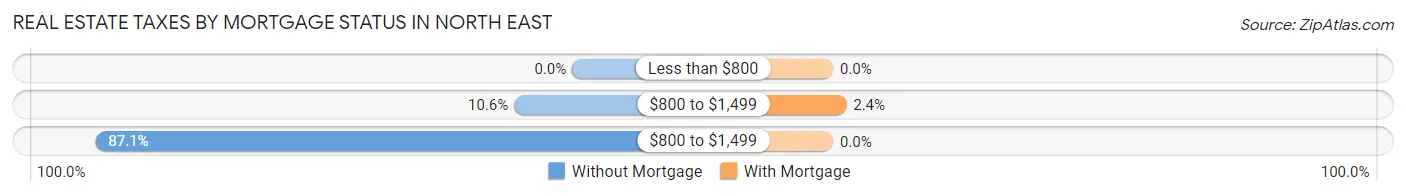
| Property Taxes | Without Mortgage | With Mortgage |
| Less than $800 | 0 (0.0%) | 0 (0.0%) |
| $800 to $1,499 | 18 (10.6%) | 20 (2.4%) |
| $800 to $1,499 | 148 (87.1%) | 0 (0.0%) |
| Total | 170 (100.0%) | 826 (100.0%) |
Health & Disability in North East
Health Insurance Coverage by Age in North East
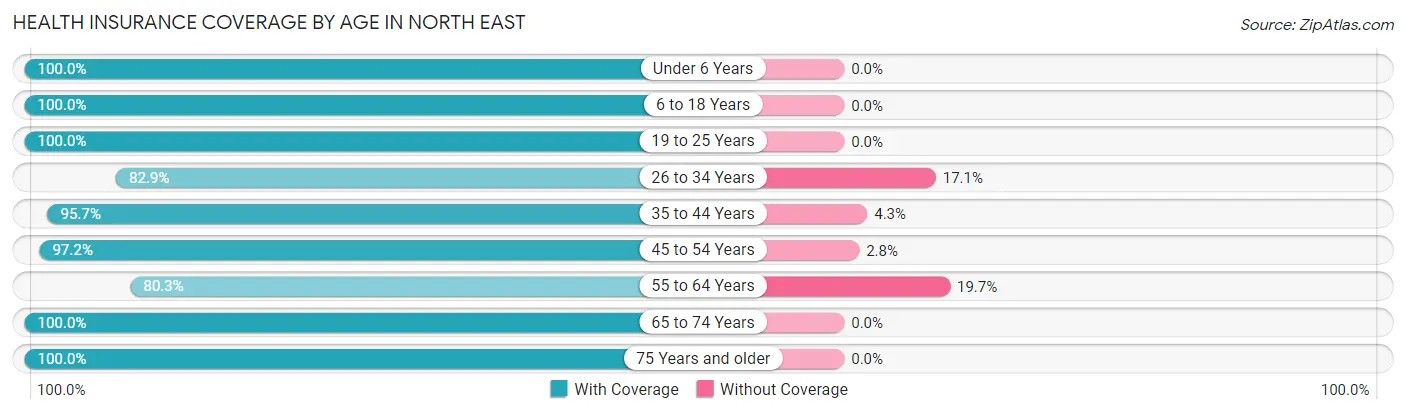
| Age Bracket | With Coverage | Without Coverage |
| Under 6 Years | 499 (100.0%) | 0 (0.0%) |
| 6 to 18 Years | 629 (100.0%) | 0 (0.0%) |
| 19 to 25 Years | 331 (100.0%) | 0 (0.0%) |
| 26 to 34 Years | 413 (82.9%) | 85 (17.1%) |
| 35 to 44 Years | 736 (95.7%) | 33 (4.3%) |
| 45 to 54 Years | 490 (97.2%) | 14 (2.8%) |
| 55 to 64 Years | 350 (80.3%) | 86 (19.7%) |
| 65 to 74 Years | 258 (100.0%) | 0 (0.0%) |
| 75 Years and older | 107 (100.0%) | 0 (0.0%) |
| Total | 3,813 (94.6%) | 218 (5.4%) |
Health Insurance Coverage by Citizenship Status in North East
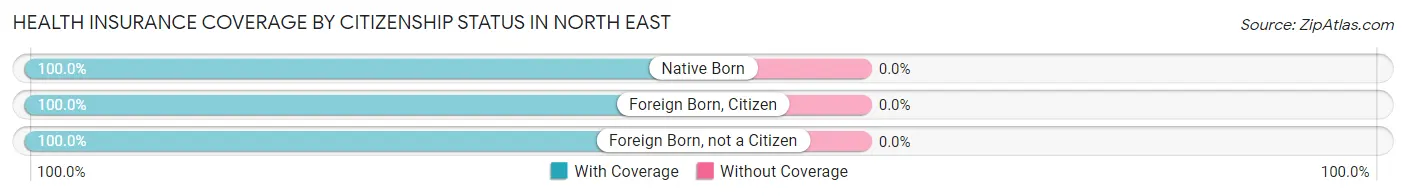
| Citizenship Status | With Coverage | Without Coverage |
| Native Born | 499 (100.0%) | 0 (0.0%) |
| Foreign Born, Citizen | 629 (100.0%) | 0 (0.0%) |
| Foreign Born, not a Citizen | 331 (100.0%) | 0 (0.0%) |
Health Insurance Coverage by Household Income in North East
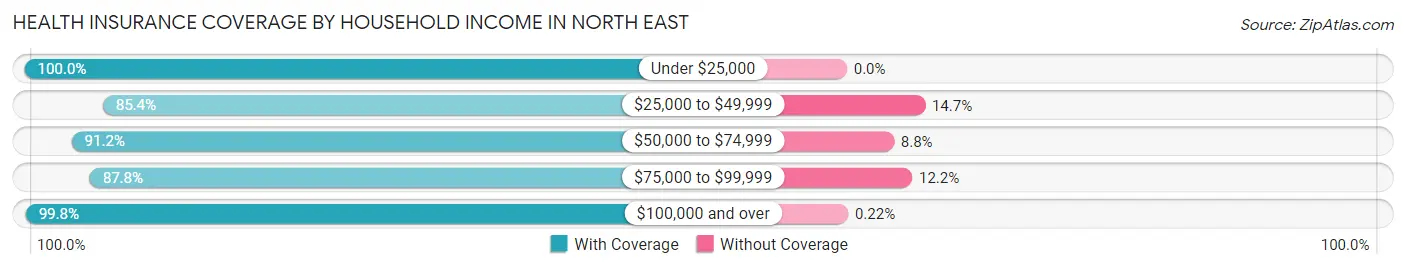
| Household Income | With Coverage | Without Coverage |
| Under $25,000 | 497 (100.0%) | 0 (0.0%) |
| $25,000 to $49,999 | 670 (85.4%) | 115 (14.6%) |
| $50,000 to $74,999 | 341 (91.2%) | 33 (8.8%) |
| $75,000 to $99,999 | 474 (87.8%) | 66 (12.2%) |
| $100,000 and over | 1,828 (99.8%) | 4 (0.2%) |
Public vs Private Health Insurance Coverage by Age in North East
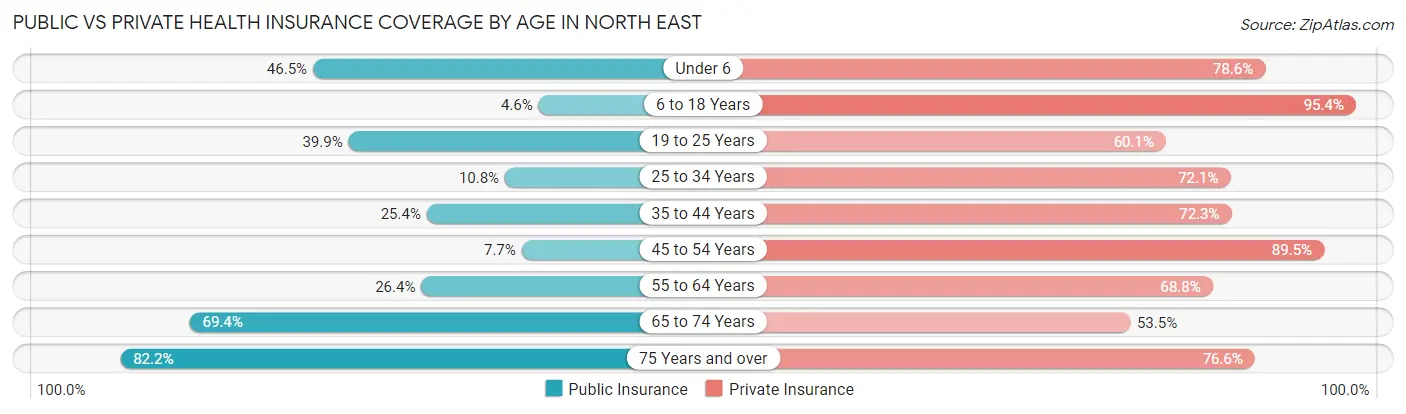
| Age Bracket | Public Insurance | Private Insurance |
| Under 6 | 232 (46.5%) | 392 (78.6%) |
| 6 to 18 Years | 29 (4.6%) | 600 (95.4%) |
| 19 to 25 Years | 132 (39.9%) | 199 (60.1%) |
| 25 to 34 Years | 54 (10.8%) | 359 (72.1%) |
| 35 to 44 Years | 195 (25.4%) | 556 (72.3%) |
| 45 to 54 Years | 39 (7.7%) | 451 (89.5%) |
| 55 to 64 Years | 115 (26.4%) | 300 (68.8%) |
| 65 to 74 Years | 179 (69.4%) | 138 (53.5%) |
| 75 Years and over | 88 (82.2%) | 82 (76.6%) |
| Total | 1,063 (26.4%) | 3,077 (76.3%) |
Disability Status by Sex by Age in North East
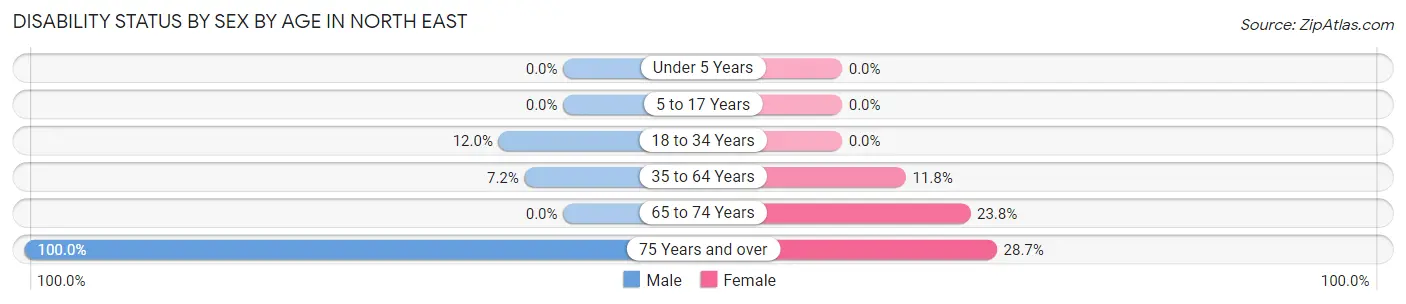
| Age Bracket | Male | Female |
| Under 5 Years | 0 (0.0%) | 0 (0.0%) |
| 5 to 17 Years | 0 (0.0%) | 0 (0.0%) |
| 18 to 34 Years | 50 (12.0%) | 0 (0.0%) |
| 35 to 64 Years | 70 (7.2%) | 87 (11.8%) |
| 65 to 74 Years | 0 (0.0%) | 25 (23.8%) |
| 75 Years and over | 20 (100.0%) | 25 (28.7%) |
Disability Class by Sex by Age in North East
Disability Class: Hearing Difficulty
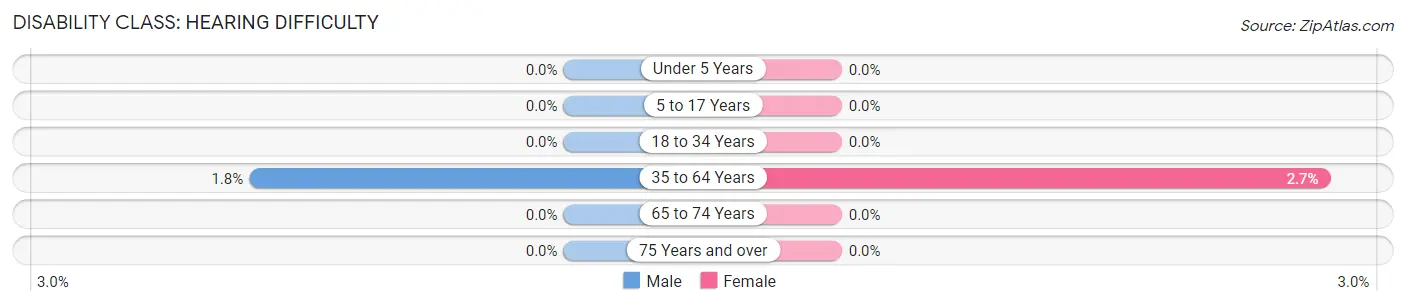
| Age Bracket | Male | Female |
| Under 5 Years | 0 (0.0%) | 0 (0.0%) |
| 5 to 17 Years | 0 (0.0%) | 0 (0.0%) |
| 18 to 34 Years | 0 (0.0%) | 0 (0.0%) |
| 35 to 64 Years | 17 (1.8%) | 20 (2.7%) |
| 65 to 74 Years | 0 (0.0%) | 0 (0.0%) |
| 75 Years and over | 0 (0.0%) | 0 (0.0%) |
Disability Class: Vision Difficulty
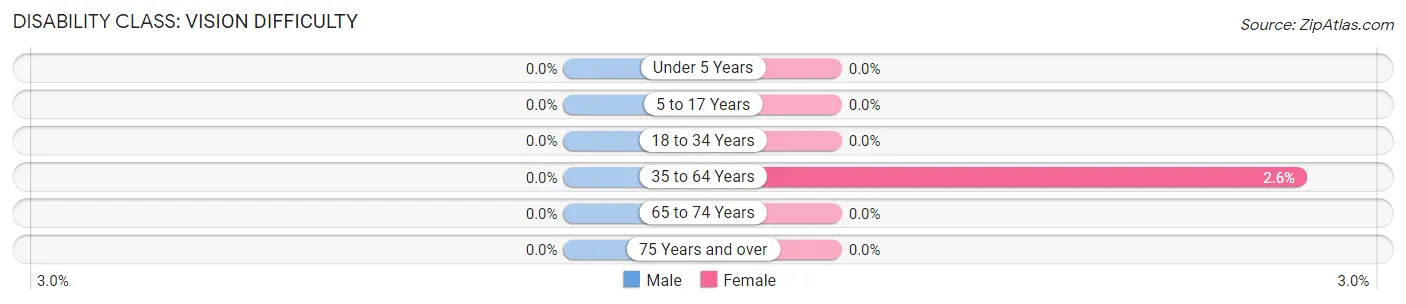
| Age Bracket | Male | Female |
| Under 5 Years | 0 (0.0%) | 0 (0.0%) |
| 5 to 17 Years | 0 (0.0%) | 0 (0.0%) |
| 18 to 34 Years | 0 (0.0%) | 0 (0.0%) |
| 35 to 64 Years | 0 (0.0%) | 19 (2.6%) |
| 65 to 74 Years | 0 (0.0%) | 0 (0.0%) |
| 75 Years and over | 0 (0.0%) | 0 (0.0%) |
Disability Class: Cognitive Difficulty
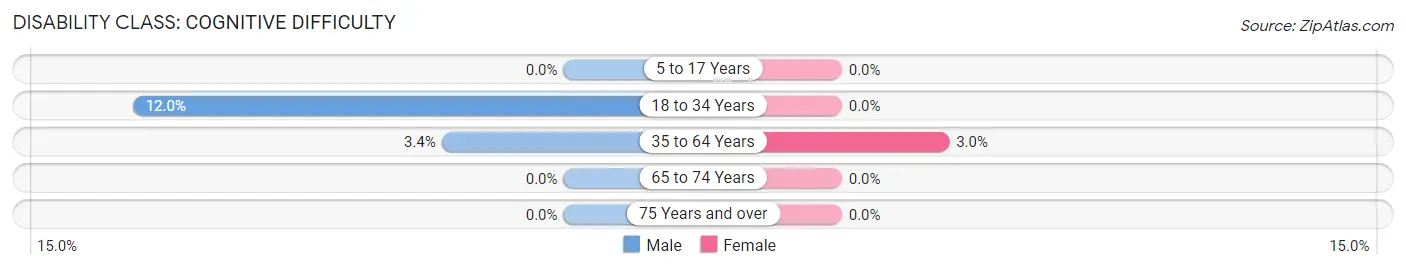
| Age Bracket | Male | Female |
| 5 to 17 Years | 0 (0.0%) | 0 (0.0%) |
| 18 to 34 Years | 50 (12.0%) | 0 (0.0%) |
| 35 to 64 Years | 33 (3.4%) | 22 (3.0%) |
| 65 to 74 Years | 0 (0.0%) | 0 (0.0%) |
| 75 Years and over | 0 (0.0%) | 0 (0.0%) |
Disability Class: Ambulatory Difficulty
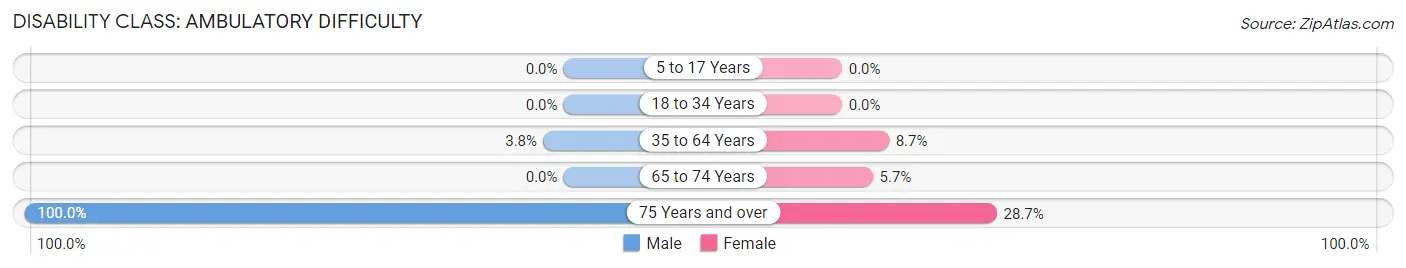
| Age Bracket | Male | Female |
| 5 to 17 Years | 0 (0.0%) | 0 (0.0%) |
| 18 to 34 Years | 0 (0.0%) | 0 (0.0%) |
| 35 to 64 Years | 37 (3.8%) | 64 (8.7%) |
| 65 to 74 Years | 0 (0.0%) | 6 (5.7%) |
| 75 Years and over | 20 (100.0%) | 25 (28.7%) |
Disability Class: Self-Care Difficulty
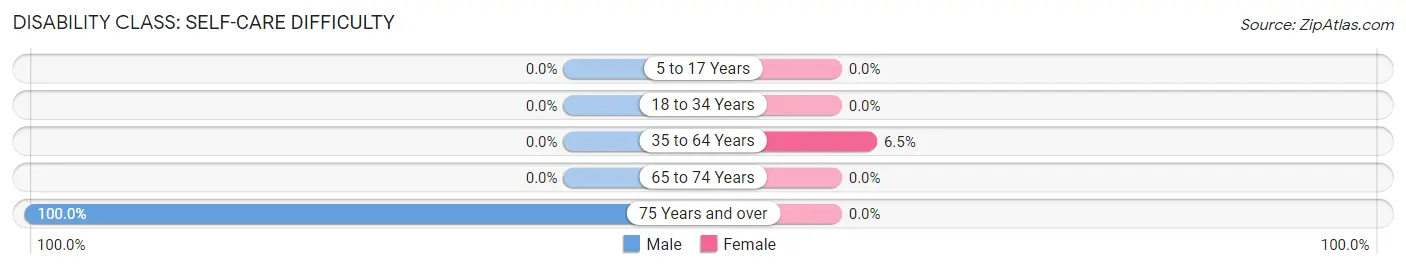
| Age Bracket | Male | Female |
| 5 to 17 Years | 0 (0.0%) | 0 (0.0%) |
| 18 to 34 Years | 0 (0.0%) | 0 (0.0%) |
| 35 to 64 Years | 0 (0.0%) | 48 (6.5%) |
| 65 to 74 Years | 0 (0.0%) | 0 (0.0%) |
| 75 Years and over | 20 (100.0%) | 0 (0.0%) |
Technology Access in North East
Computing Device Access in North East
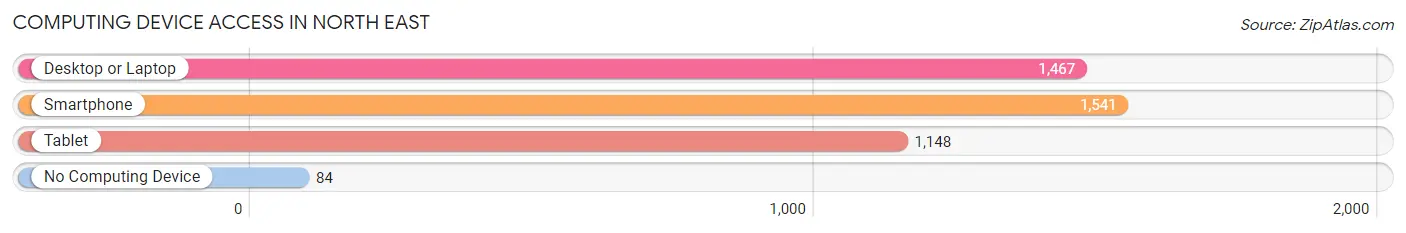
| Device Type | # Households | % Households |
| Desktop or Laptop | 1,467 | 85.1% |
| Smartphone | 1,541 | 89.4% |
| Tablet | 1,148 | 66.6% |
| No Computing Device | 84 | 4.9% |
| Total | 1,724 | 100.0% |
Internet Access in North East
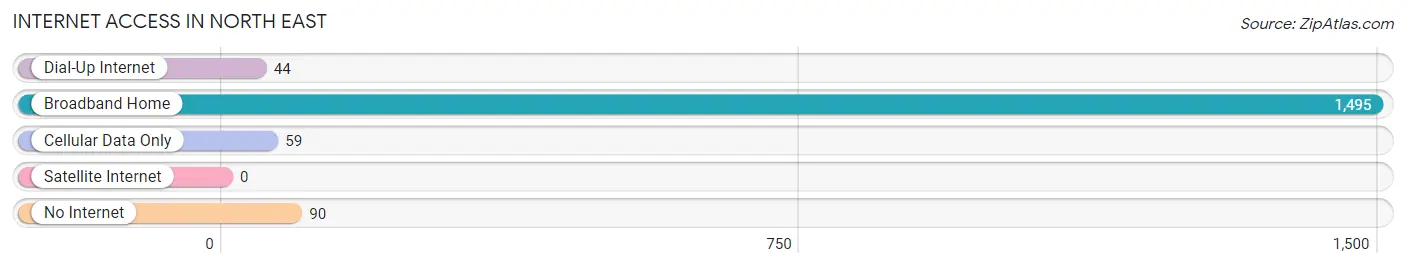
| Internet Type | # Households | % Households |
| Dial-Up Internet | 44 | 2.5% |
| Broadband Home | 1,495 | 86.7% |
| Cellular Data Only | 59 | 3.4% |
| Satellite Internet | 0 | 0.0% |
| No Internet | 90 | 5.2% |
| Total | 1,724 | 100.0% |
North East Summary
North East, Maryland is a small town located in Cecil County, Maryland. It is situated on the banks of the Elk River, and is part of the greater Baltimore-Washington metropolitan area. The town has a population of 3,619 as of the 2010 census, and is the second largest town in Cecil County.
History
North East was founded in 1787 by a group of settlers from Pennsylvania. The town was originally known as “Newmanstown”, after the first settler, John Newman. The town was renamed “North East” in 1837, after the nearby North East River.
The town was an important port during the 19th century, and was a major hub for the Chesapeake and Delaware Canal. The canal was used to transport goods and passengers between the Chesapeake Bay and the Delaware River. The town was also a major stop on the Underground Railroad, and was home to several prominent abolitionists.
Geography
North East is located in Cecil County, Maryland, on the banks of the Elk River. The town is situated at the intersection of Maryland Route 272 and Maryland Route 213. The town is approximately 25 miles northeast of Baltimore, and 40 miles south of Philadelphia.
The town has a total area of 1.3 square miles, all of which is land. The town is located in a humid subtropical climate zone, and experiences hot, humid summers and cold, wet winters.
Economy
North East’s economy is largely based on agriculture and tourism. The town is home to several farms, and is a popular destination for outdoor recreation. The town is also home to several small businesses, including restaurants, shops, and a marina.
Demographics
As of the 2010 census, North East had a population of 3,619. The racial makeup of the town was 87.3% White, 8.2% African American, 0.7% Native American, 0.7% Asian, 0.1% Pacific Islander, and 2.1% from other races. Hispanic or Latino of any race were 2.7% of the population.
The median income for a household in the town was $50,938, and the median income for a family was $60,938. The per capita income for the town was $22,938. About 8.2% of families and 10.2% of the population were below the poverty line, including 14.2% of those under age 18 and 8.2% of those age 65 or over.
Common Questions
What is Per Capita Income in North East?
Per Capita income in North East is $46,350.
What is the Median Family Income in North East?
Median Family Income in North East is $86,298.
What is the Median Household income in North East?
Median Household Income in North East is $85,378.
What is Income or Wage Gap in North East?
Income or Wage Gap in North East is 39.8%.
Women in North East earn 60.2 cents for every dollar earned by a man.
What is Family Income Deficit in North East?
Family Income Deficit in North East is $15,186.
Families that are below poverty line in North East earn $15,186 less on average than the poverty threshold level.
What is Inequality or Gini Index in North East?
Inequality or Gini Index in North East is 0.47.
What is the Total Population of North East?
Total Population of North East is 4,061.
What is the Total Male Population of North East?
Total Male Population of North East is 2,308.
What is the Total Female Population of North East?
Total Female Population of North East is 1,753.
What is the Ratio of Males per 100 Females in North East?
There are 131.66 Males per 100 Females in North East.
What is the Ratio of Females per 100 Males in North East?
There are 75.95 Females per 100 Males in North East.
What is the Median Population Age in North East?
Median Population Age in North East is 35.8 Years.
What is the Average Family Size in North East
Average Family Size in North East is 3.5 People.
What is the Average Household Size in North East
Average Household Size in North East is 2.4 People.
How Large is the Labor Force in North East?
There are 2,135 People in the Labor Forcein in North East.
What is the Percentage of People in the Labor Force in North East?
65.9% of People are in the Labor Force in North East.
What is the Unemployment Rate in North East?
Unemployment Rate in North East is 4.7%.