Fairmount, MD Map & Demographics
Fairmount Map
Fairmount Overview
$35,072
PER CAPITA INCOME
$82,143
AVG FAMILY INCOME
$66,250
AVG HOUSEHOLD INCOME
2.6%
WAGE / INCOME GAP [ % ]
97.4¢/ $1
WAGE / INCOME GAP [ $ ]
0.31
INEQUALITY / GINI INDEX
410
TOTAL POPULATION
168
MALE POPULATION
242
FEMALE POPULATION
69.42
MALES / 100 FEMALES
144.05
FEMALES / 100 MALES
55.7
MEDIAN AGE
2.7
AVG FAMILY SIZE
2.2
AVG HOUSEHOLD SIZE
219
LABOR FORCE [ PEOPLE ]
54.5%
PERCENT IN LABOR FORCE
13.7%
UNEMPLOYMENT RATE
Fairmount Area Codes
Income in Fairmount
Income Overview in Fairmount
Per Capita Income in Fairmount is $35,072, while median incomes of families and households are $82,143 and $66,250 respectively.
| Characteristic | Number | Measure |
| Per Capita Income | 410 | $35,072 |
| Median Family Income | 118 | $82,143 |
| Mean Family Income | 118 | $75,819 |
| Median Household Income | 186 | $66,250 |
| Mean Household Income | 186 | $68,065 |
| Income Deficit | 118 | $0 |
| Wage / Income Gap (%) | 410 | 2.64% |
| Wage / Income Gap ($) | 410 | 97.36¢ per $1 |
| Gini / Inequality Index | 410 | 0.31 |
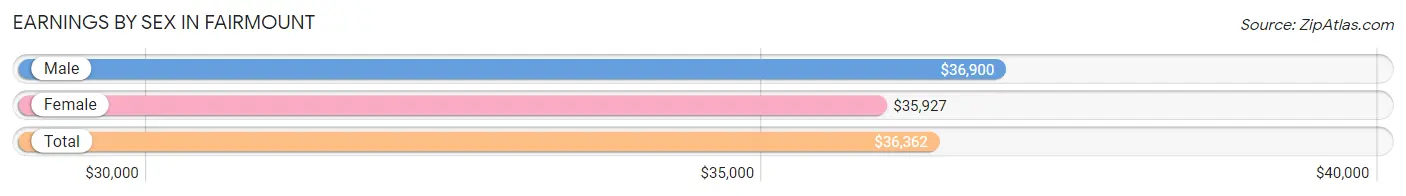
Earnings by Sex in Fairmount
Average Earnings in Fairmount are $36,362, $36,900 for men and $35,927 for women, a difference of 2.6%.
| Sex | Number | Average Earnings |
| Male | 84 (39.4%) | $36,900 |
| Female | 129 (60.6%) | $35,927 |
| Total | 213 (100.0%) | $36,362 |
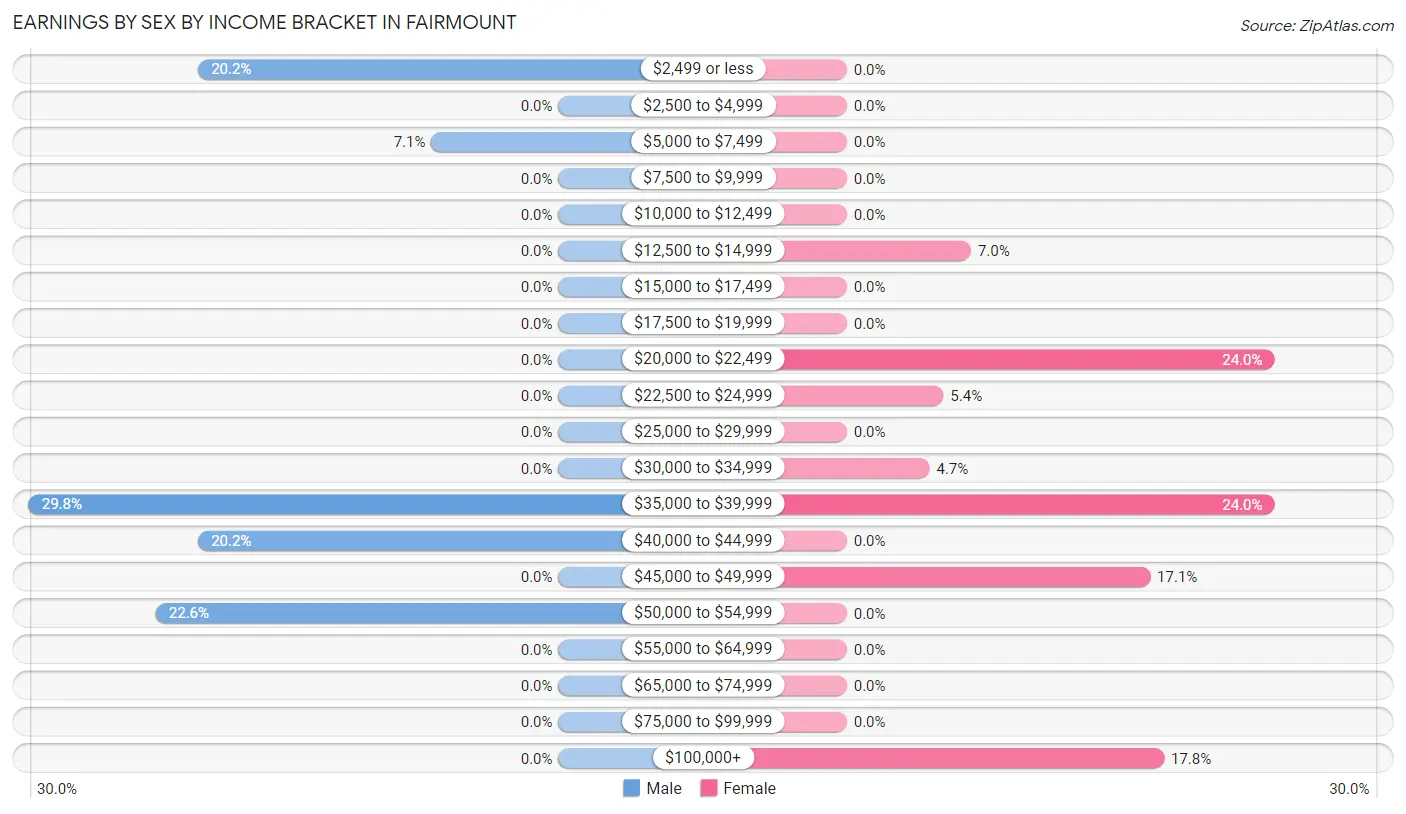
Earnings by Sex by Income Bracket in Fairmount
The most common earnings brackets in Fairmount are $35,000 to $39,999 for men (25 | 29.8%) and $20,000 to $22,499 for women (31 | 24.0%).
| Income | Male | Female |
| $2,499 or less | 17 (20.2%) | 0 (0.0%) |
| $2,500 to $4,999 | 0 (0.0%) | 0 (0.0%) |
| $5,000 to $7,499 | 6 (7.1%) | 0 (0.0%) |
| $7,500 to $9,999 | 0 (0.0%) | 0 (0.0%) |
| $10,000 to $12,499 | 0 (0.0%) | 0 (0.0%) |
| $12,500 to $14,999 | 0 (0.0%) | 9 (7.0%) |
| $15,000 to $17,499 | 0 (0.0%) | 0 (0.0%) |
| $17,500 to $19,999 | 0 (0.0%) | 0 (0.0%) |
| $20,000 to $22,499 | 0 (0.0%) | 31 (24.0%) |
| $22,500 to $24,999 | 0 (0.0%) | 7 (5.4%) |
| $25,000 to $29,999 | 0 (0.0%) | 0 (0.0%) |
| $30,000 to $34,999 | 0 (0.0%) | 6 (4.6%) |
| $35,000 to $39,999 | 25 (29.8%) | 31 (24.0%) |
| $40,000 to $44,999 | 17 (20.2%) | 0 (0.0%) |
| $45,000 to $49,999 | 0 (0.0%) | 22 (17.1%) |
| $50,000 to $54,999 | 19 (22.6%) | 0 (0.0%) |
| $55,000 to $64,999 | 0 (0.0%) | 0 (0.0%) |
| $65,000 to $74,999 | 0 (0.0%) | 0 (0.0%) |
| $75,000 to $99,999 | 0 (0.0%) | 0 (0.0%) |
| $100,000+ | 0 (0.0%) | 23 (17.8%) |
| Total | 84 (100.0%) | 129 (100.0%) |
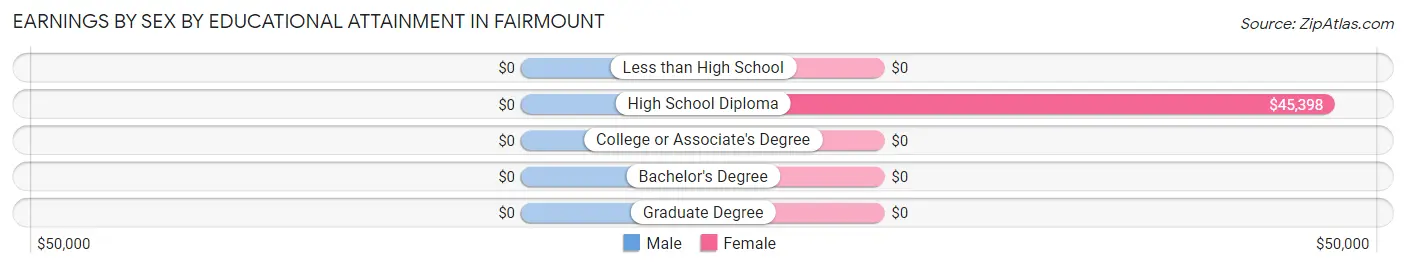
Earnings by Sex by Educational Attainment in Fairmount
| Educational Attainment | Male Income | Female Income |
| Less than High School | - | - |
| High School Diploma | - | - |
| College or Associate's Degree | - | - |
| Bachelor's Degree | - | - |
| Graduate Degree | - | - |
| Total | $37,200 | $36,452 |
Family Income in Fairmount
Family Income Brackets in Fairmount
According to the Fairmount family income data, there are 48 families falling into the $100,000 to $149,999 income range, which is the most common income bracket and makes up 40.7% of all families.
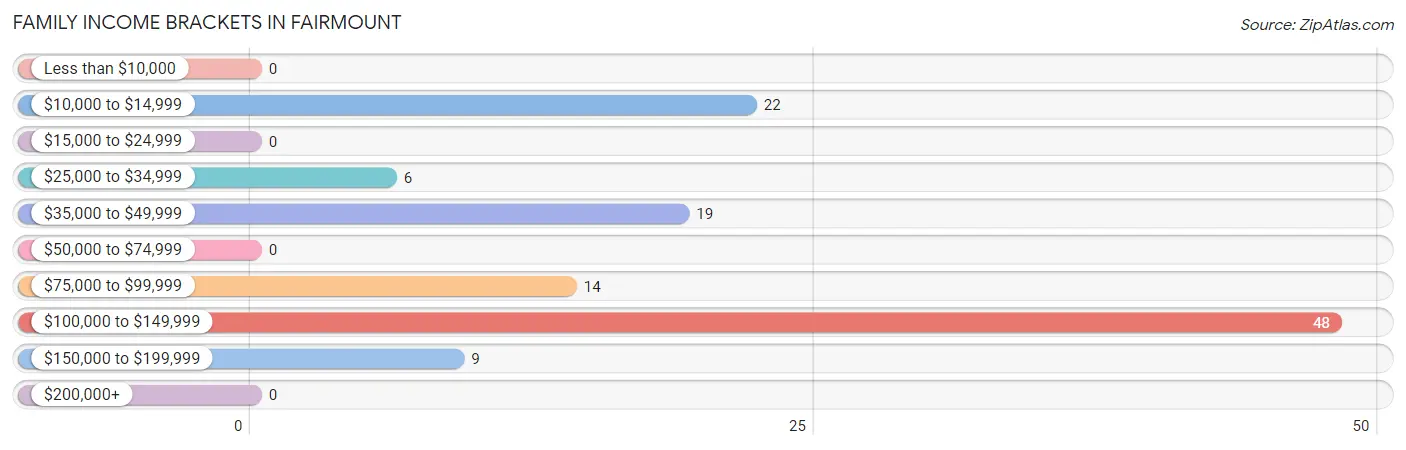
| Income Bracket | # Families | % Families |
| Less than $10,000 | 0 | 0.0% |
| $10,000 to $14,999 | 22 | 18.6% |
| $15,000 to $24,999 | 0 | 0.0% |
| $25,000 to $34,999 | 6 | 5.1% |
| $35,000 to $49,999 | 19 | 16.1% |
| $50,000 to $74,999 | 0 | 0.0% |
| $75,000 to $99,999 | 14 | 11.9% |
| $100,000 to $149,999 | 48 | 40.7% |
| $150,000 to $199,999 | 9 | 7.6% |
| $200,000+ | 0 | 0.0% |
Family Income by Famaliy Size in Fairmount
2-person families (87 | 73.7%) account for the highest median family income in Fairmount with $100,489 per family, while 2-person families (87 | 73.7%) have the highest median income of $50,244 per family member.
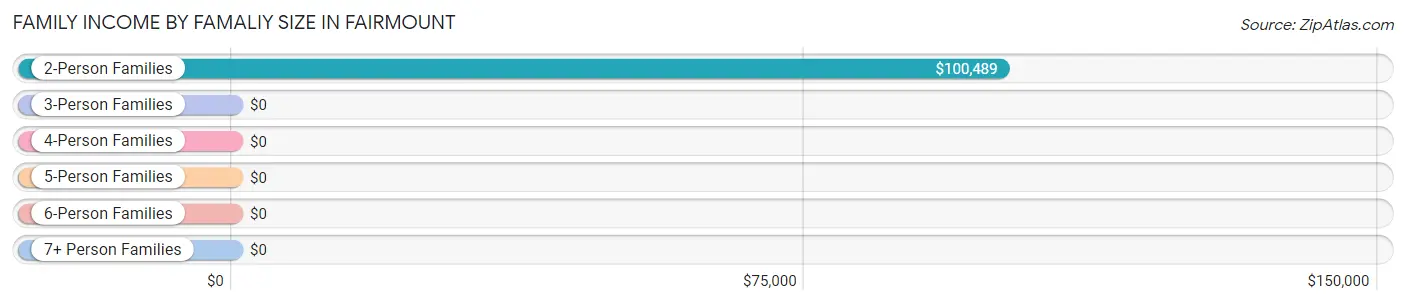
| Income Bracket | # Families | Median Income |
| 2-Person Families | 87 (73.7%) | $100,489 |
| 3-Person Families | 17 (14.4%) | $0 |
| 4-Person Families | 14 (11.9%) | $0 |
| 5-Person Families | 0 (0.0%) | $0 |
| 6-Person Families | 0 (0.0%) | $0 |
| 7+ Person Families | 0 (0.0%) | $0 |
| Total | 118 (100.0%) | $82,143 |
Family Income by Number of Earners in Fairmount
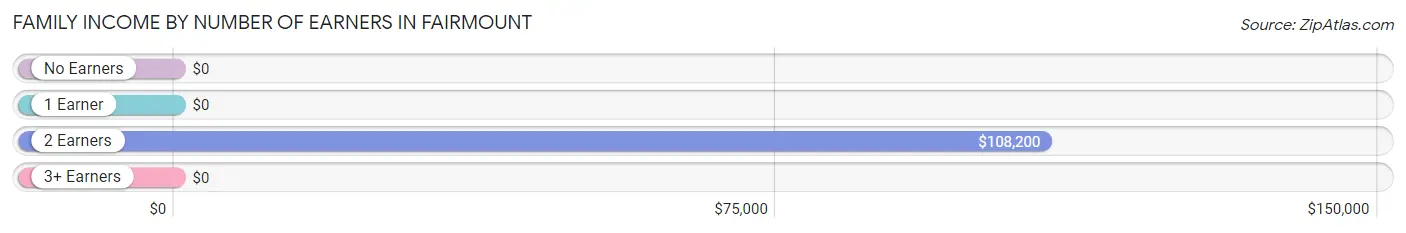
| Number of Earners | # Families | Median Income |
| No Earners | 33 (28.0%) | $0 |
| 1 Earner | 31 (26.3%) | $0 |
| 2 Earners | 54 (45.8%) | $108,200 |
| 3+ Earners | 0 (0.0%) | $0 |
| Total | 118 (100.0%) | $82,143 |
Household Income in Fairmount
Household Income Brackets in Fairmount
With 48 households falling in the category, the $100,000 to $149,999 income range is the most frequent in Fairmount, accounting for 25.8% of all households.
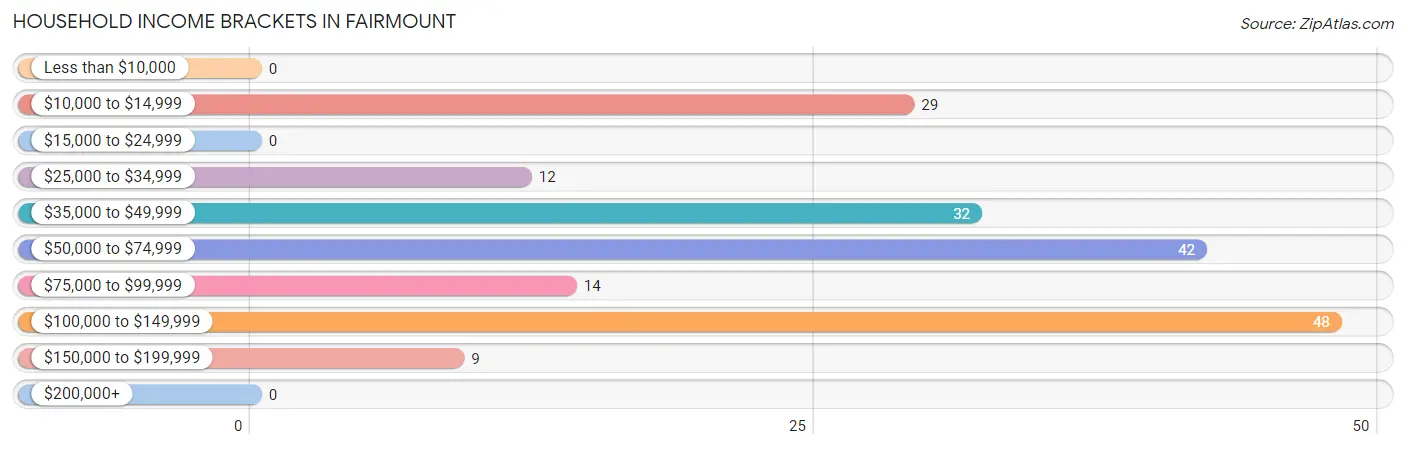
| Income Bracket | # Households | % Households |
| Less than $10,000 | 0 | 0.0% |
| $10,000 to $14,999 | 29 | 15.6% |
| $15,000 to $24,999 | 0 | 0.0% |
| $25,000 to $34,999 | 12 | 6.5% |
| $35,000 to $49,999 | 32 | 17.2% |
| $50,000 to $74,999 | 42 | 22.6% |
| $75,000 to $99,999 | 14 | 7.5% |
| $100,000 to $149,999 | 48 | 25.8% |
| $150,000 to $199,999 | 9 | 4.8% |
| $200,000+ | 0 | 0.0% |
Household Income by Householder Age in Fairmount
The median household income in Fairmount is $66,250, with the highest median household income of $101,087 found in the 45 to 64 years age bracket for the primary householder. A total of 76 households (40.9%) fall into this category. Meanwhile, the 15 to 24 years age bracket for the primary householder has the lowest median household income of $0, with 6 households (3.2%) in this group.
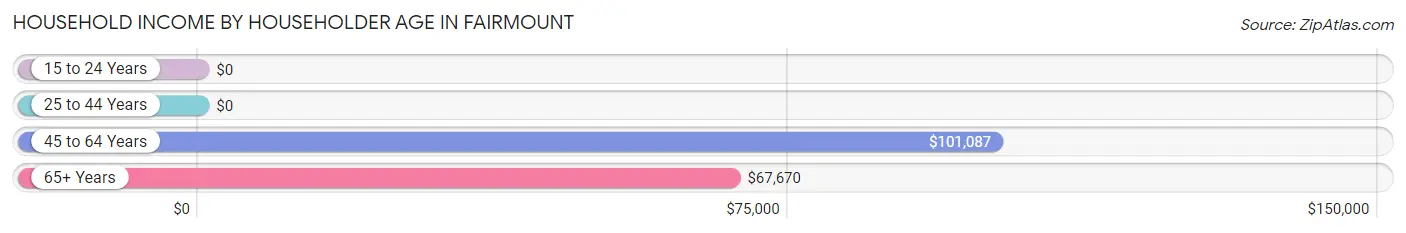
| Income Bracket | # Households | Median Income |
| 15 to 24 Years | 6 (3.2%) | $0 |
| 25 to 44 Years | 17 (9.1%) | $0 |
| 45 to 64 Years | 76 (40.9%) | $101,087 |
| 65+ Years | 87 (46.8%) | $67,670 |
| Total | 186 (100.0%) | $66,250 |
Poverty in Fairmount
Income Below Poverty by Sex and Age in Fairmount
With 13.1% poverty level for males and 9.5% for females among the residents of Fairmount, 55 to 64 year old males and 18 to 24 year old females are the most vulnerable to poverty, with 22 males (46.8%) and 23 females (43.4%) in their respective age groups living below the poverty level.
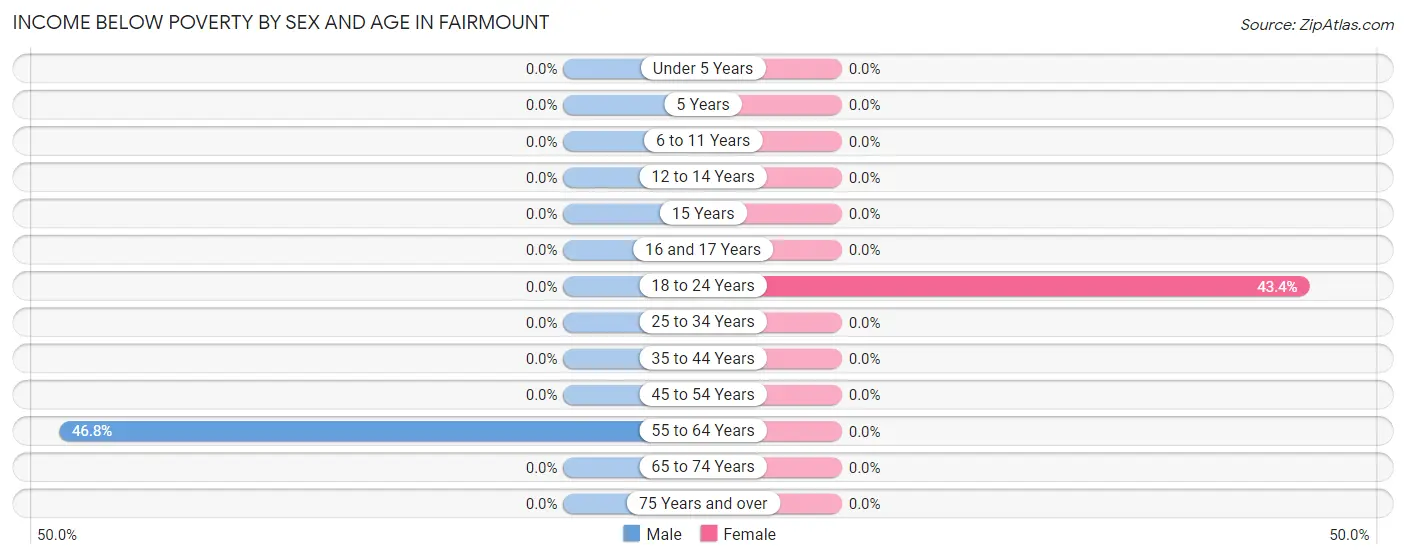
| Age Bracket | Male | Female |
| Under 5 Years | 0 (0.0%) | 0 (0.0%) |
| 5 Years | 0 (0.0%) | 0 (0.0%) |
| 6 to 11 Years | 0 (0.0%) | 0 (0.0%) |
| 12 to 14 Years | 0 (0.0%) | 0 (0.0%) |
| 15 Years | 0 (0.0%) | 0 (0.0%) |
| 16 and 17 Years | 0 (0.0%) | 0 (0.0%) |
| 18 to 24 Years | 0 (0.0%) | 23 (43.4%) |
| 25 to 34 Years | 0 (0.0%) | 0 (0.0%) |
| 35 to 44 Years | 0 (0.0%) | 0 (0.0%) |
| 45 to 54 Years | 0 (0.0%) | 0 (0.0%) |
| 55 to 64 Years | 22 (46.8%) | 0 (0.0%) |
| 65 to 74 Years | 0 (0.0%) | 0 (0.0%) |
| 75 Years and over | 0 (0.0%) | 0 (0.0%) |
| Total | 22 (13.1%) | 23 (9.5%) |
Income Above Poverty by Sex and Age in Fairmount
According to the poverty statistics in Fairmount, males aged 18 to 24 years and females aged under 5 years are the age groups that are most secure financially, with 100.0% of males and 100.0% of females in these age groups living above the poverty line.
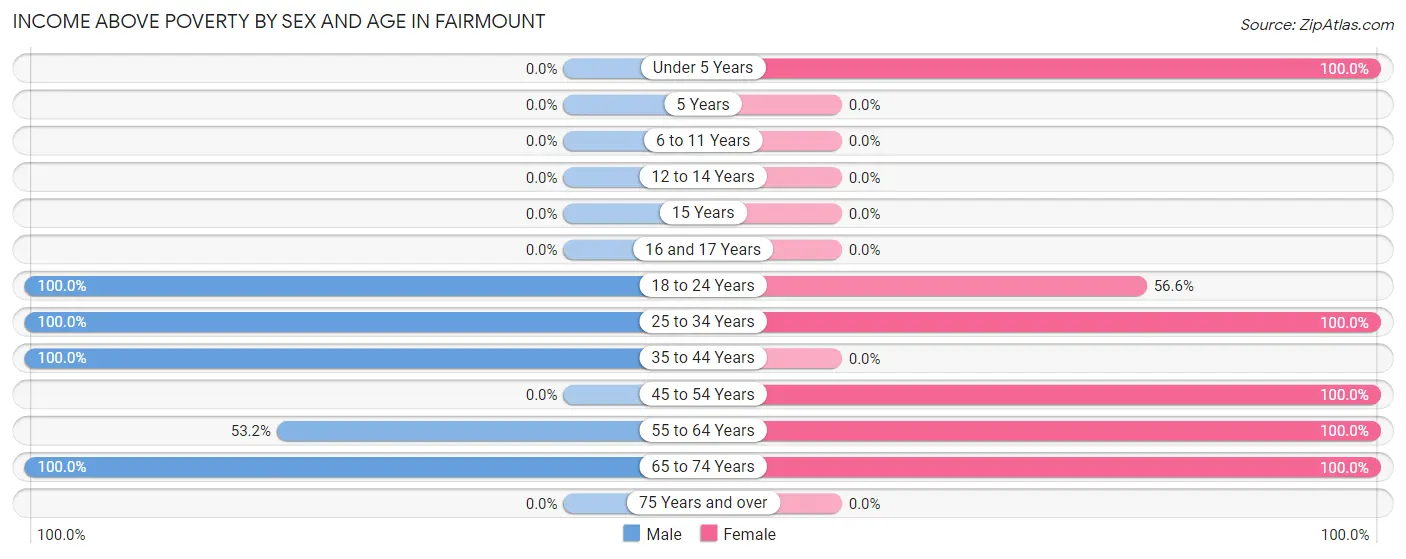
| Age Bracket | Male | Female |
| Under 5 Years | 0 (0.0%) | 8 (100.0%) |
| 5 Years | 0 (0.0%) | 0 (0.0%) |
| 6 to 11 Years | 0 (0.0%) | 0 (0.0%) |
| 12 to 14 Years | 0 (0.0%) | 0 (0.0%) |
| 15 Years | 0 (0.0%) | 0 (0.0%) |
| 16 and 17 Years | 0 (0.0%) | 0 (0.0%) |
| 18 to 24 Years | 6 (100.0%) | 30 (56.6%) |
| 25 to 34 Years | 17 (100.0%) | 36 (100.0%) |
| 35 to 44 Years | 36 (100.0%) | 0 (0.0%) |
| 45 to 54 Years | 0 (0.0%) | 34 (100.0%) |
| 55 to 64 Years | 25 (53.2%) | 37 (100.0%) |
| 65 to 74 Years | 62 (100.0%) | 74 (100.0%) |
| 75 Years and over | 0 (0.0%) | 0 (0.0%) |
| Total | 146 (86.9%) | 219 (90.5%) |
Income Below Poverty Among Married-Couple Families in Fairmount
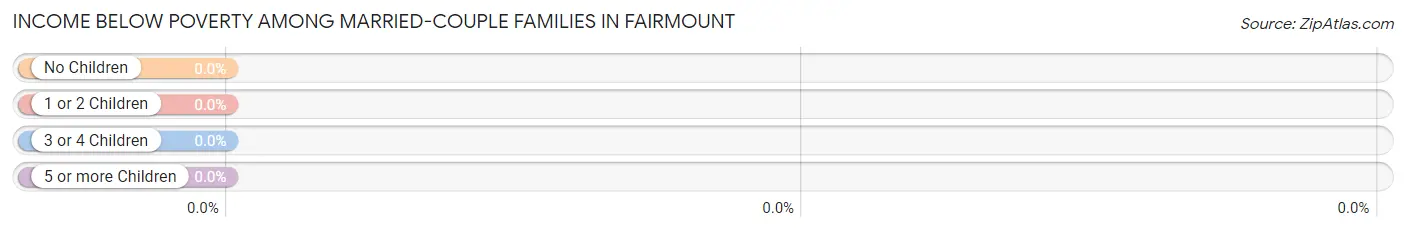
| Children | Above Poverty | Below Poverty |
| No Children | 54 (100.0%) | 0 (0.0%) |
| 1 or 2 Children | 8 (100.0%) | 0 (0.0%) |
| 3 or 4 Children | 0 (0.0%) | 0 (0.0%) |
| 5 or more Children | 0 (0.0%) | 0 (0.0%) |
| Total | 62 (100.0%) | 0 (0.0%) |
Income Below Poverty Among Single-Parent Households in Fairmount
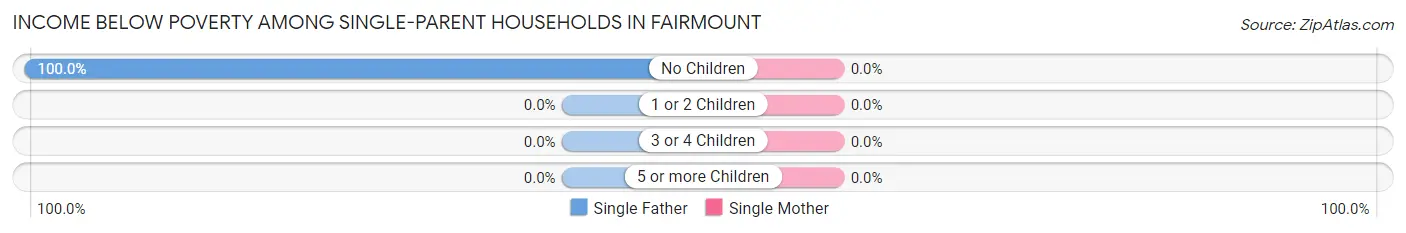
| Children | Single Father | Single Mother |
| No Children | 22 (100.0%) | 0 (0.0%) |
| 1 or 2 Children | 0 (0.0%) | 0 (0.0%) |
| 3 or 4 Children | 0 (0.0%) | 0 (0.0%) |
| 5 or more Children | 0 (0.0%) | 0 (0.0%) |
| Total | 22 (100.0%) | 0 (0.0%) |
Income Below Poverty Among Married-Couple vs Single-Parent Households in Fairmount
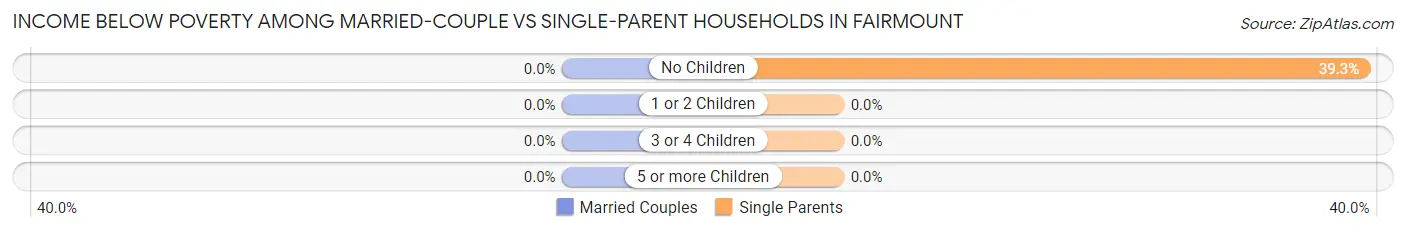
| Children | Married-Couple Families | Single-Parent Households |
| No Children | 0 (0.0%) | 22 (39.3%) |
| 1 or 2 Children | 0 (0.0%) | 0 (0.0%) |
| 3 or 4 Children | 0 (0.0%) | 0 (0.0%) |
| 5 or more Children | 0 (0.0%) | 0 (0.0%) |
| Total | 0 (0.0%) | 22 (39.3%) |
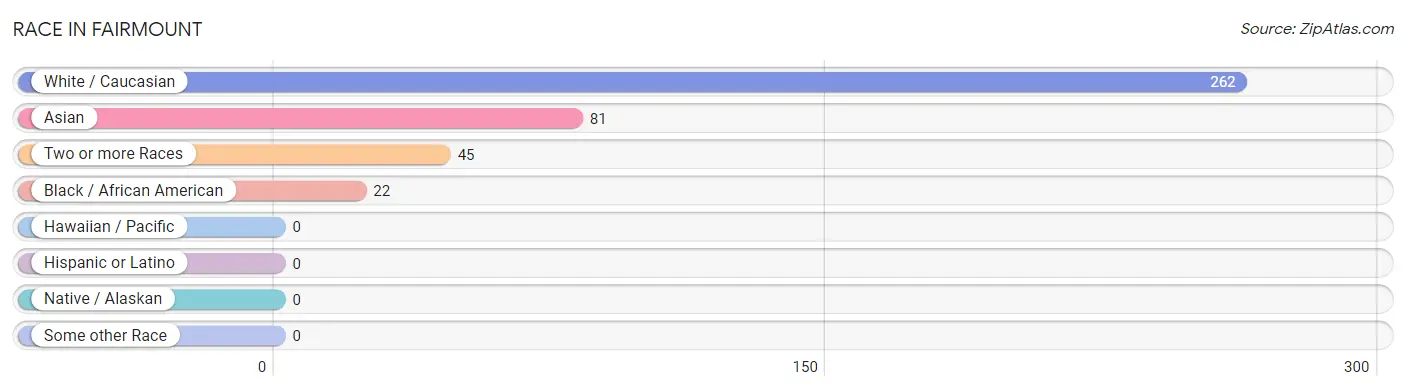
Race in Fairmount
The most populous races in Fairmount are White / Caucasian (262 | 63.9%), Asian (81 | 19.8%), and Two or more Races (45 | 11.0%).
| Race | # Population | % Population |
| Asian | 81 | 19.8% |
| Black / African American | 22 | 5.4% |
| Hawaiian / Pacific | 0 | 0.0% |
| Hispanic or Latino | 0 | 0.0% |
| Native / Alaskan | 0 | 0.0% |
| White / Caucasian | 262 | 63.9% |
| Two or more Races | 45 | 11.0% |
| Some other Race | 0 | 0.0% |
| Total | 410 | 100.0% |
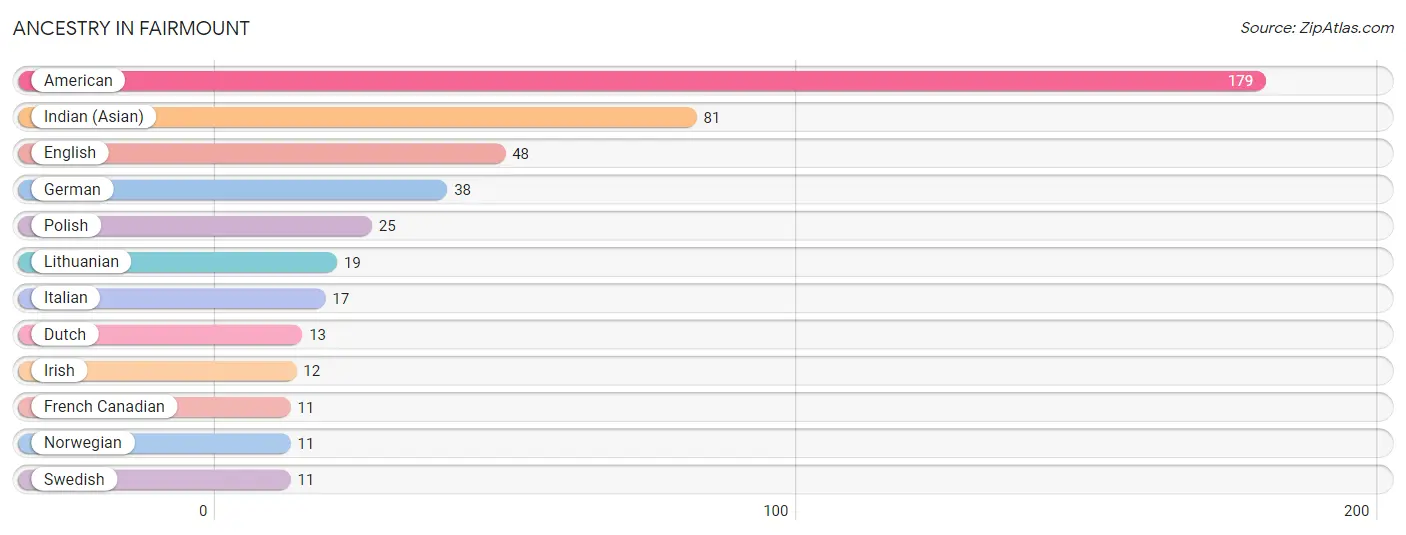
Ancestry in Fairmount
The most populous ancestries reported in Fairmount are American (179 | 43.7%), Indian (Asian) (81 | 19.8%), English (48 | 11.7%), German (38 | 9.3%), and Polish (25 | 6.1%), together accounting for 90.5% of all Fairmount residents.
| Ancestry | # Population | % Population |
| American | 179 | 43.7% |
| Dutch | 13 | 3.2% |
| English | 48 | 11.7% |
| French Canadian | 11 | 2.7% |
| German | 38 | 9.3% |
| Indian (Asian) | 81 | 19.8% |
| Irish | 12 | 2.9% |
| Italian | 17 | 4.2% |
| Lithuanian | 19 | 4.6% |
| Norwegian | 11 | 2.7% |
| Polish | 25 | 6.1% |
| Swedish | 11 | 2.7% | View All 12 Rows |
Immigrants in Fairmount

| Immigration Origin | # Population | % Population | View All 0 Rows |
Sex and Age in Fairmount
Sex and Age in Fairmount
The most populous age groups in Fairmount are 65 to 69 Years (51 | 30.4%) for men and 70 to 74 Years (42 | 17.4%) for women.
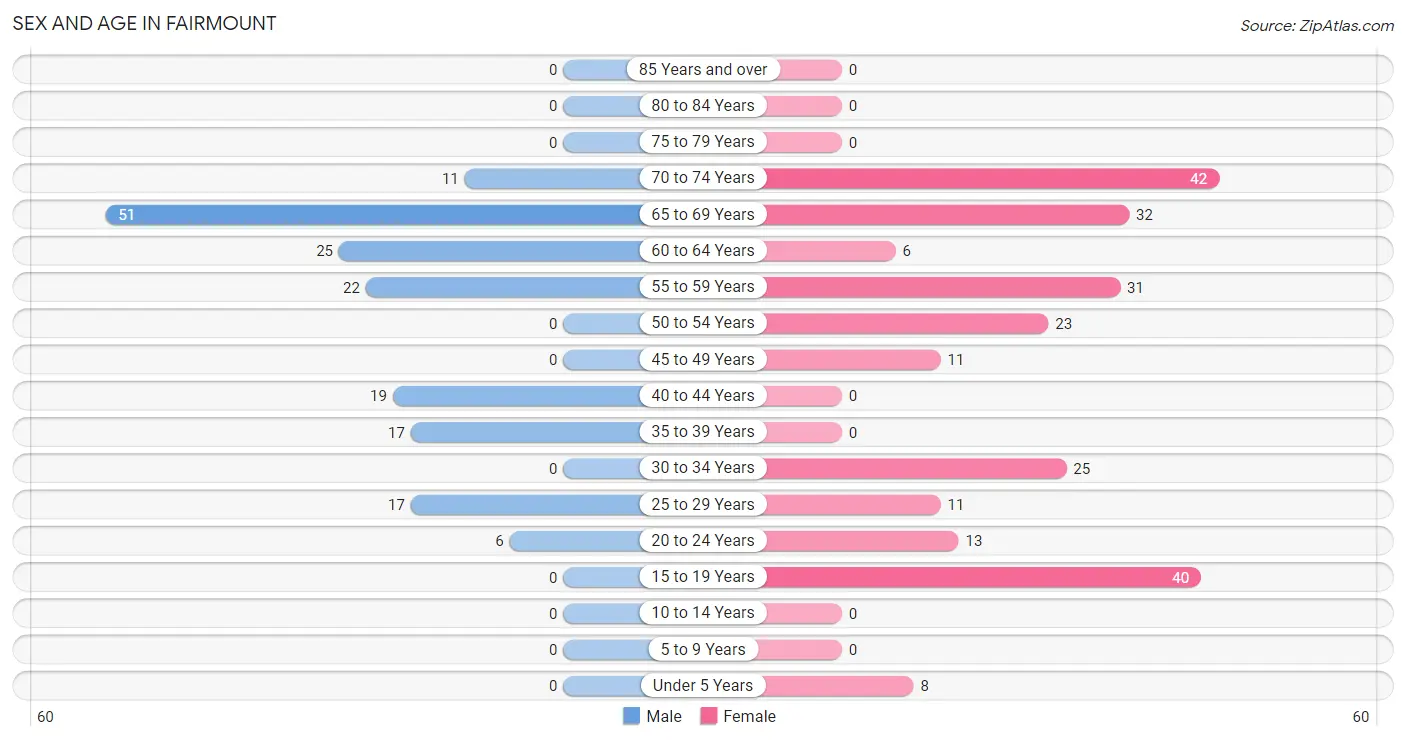
| Age Bracket | Male | Female |
| Under 5 Years | 0 (0.0%) | 8 (3.3%) |
| 5 to 9 Years | 0 (0.0%) | 0 (0.0%) |
| 10 to 14 Years | 0 (0.0%) | 0 (0.0%) |
| 15 to 19 Years | 0 (0.0%) | 40 (16.5%) |
| 20 to 24 Years | 6 (3.6%) | 13 (5.4%) |
| 25 to 29 Years | 17 (10.1%) | 11 (4.5%) |
| 30 to 34 Years | 0 (0.0%) | 25 (10.3%) |
| 35 to 39 Years | 17 (10.1%) | 0 (0.0%) |
| 40 to 44 Years | 19 (11.3%) | 0 (0.0%) |
| 45 to 49 Years | 0 (0.0%) | 11 (4.5%) |
| 50 to 54 Years | 0 (0.0%) | 23 (9.5%) |
| 55 to 59 Years | 22 (13.1%) | 31 (12.8%) |
| 60 to 64 Years | 25 (14.9%) | 6 (2.5%) |
| 65 to 69 Years | 51 (30.4%) | 32 (13.2%) |
| 70 to 74 Years | 11 (6.6%) | 42 (17.4%) |
| 75 to 79 Years | 0 (0.0%) | 0 (0.0%) |
| 80 to 84 Years | 0 (0.0%) | 0 (0.0%) |
| 85 Years and over | 0 (0.0%) | 0 (0.0%) |
| Total | 168 (100.0%) | 242 (100.0%) |
Families and Households in Fairmount
Median Family Size in Fairmount
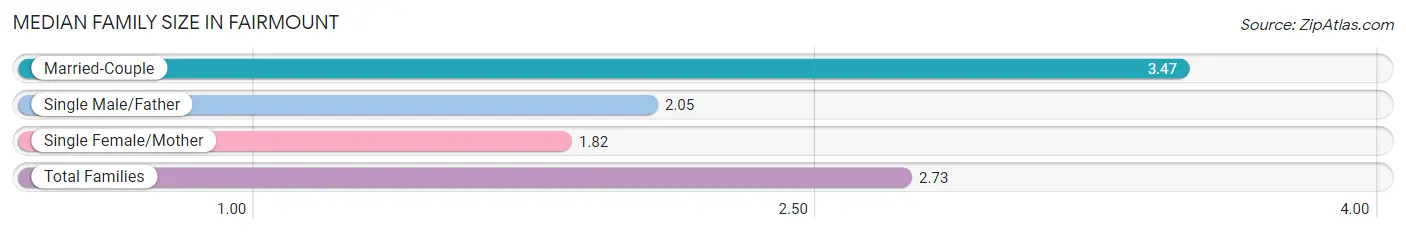
The median family size in Fairmount is 2.73 persons per family, with married-couple families (62 | 52.5%) accounting for the largest median family size of 3.47 persons per family. On the other hand, single female/mother families (34 | 28.8%) represent the smallest median family size with 1.82 persons per family.
| Family Type | # Families | Family Size |
| Married-Couple | 62 (52.5%) | 3.47 |
| Single Male/Father | 22 (18.6%) | 2.05 |
| Single Female/Mother | 34 (28.8%) | 1.82 |
| Total Families | 118 (100.0%) | 2.73 |
Median Household Size in Fairmount
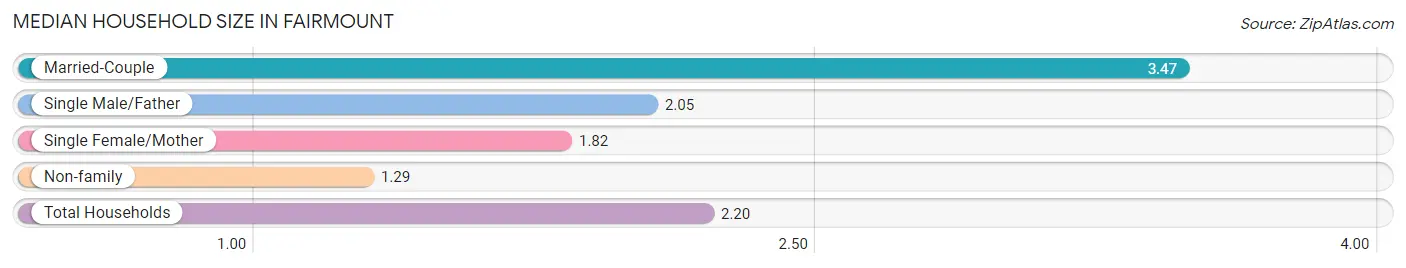
The median household size in Fairmount is 2.20 persons per household, with married-couple households (62 | 33.3%) accounting for the largest median household size of 3.47 persons per household. non-family households (68 | 36.6%) represent the smallest median household size with 1.29 persons per household.
| Household Type | # Households | Household Size |
| Married-Couple | 62 (33.3%) | 3.47 |
| Single Male/Father | 22 (11.8%) | 2.05 |
| Single Female/Mother | 34 (18.3%) | 1.82 |
| Non-family | 68 (36.6%) | 1.29 |
| Total Households | 186 (100.0%) | 2.20 |
Household Size by Marriage Status in Fairmount
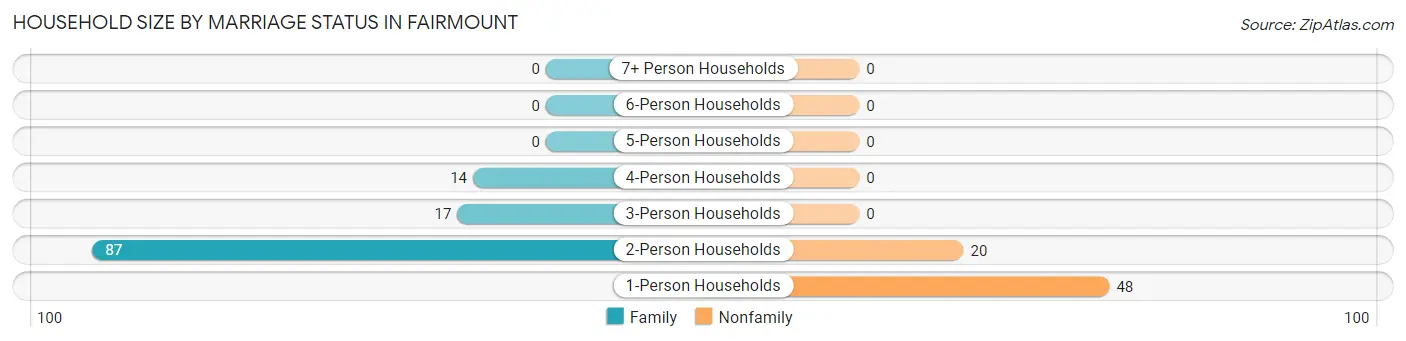
Out of a total of 186 households in Fairmount, 118 (63.4%) are family households, while 68 (36.6%) are nonfamily households. The most numerous type of family households are 2-person households, comprising 87, and the most common type of nonfamily households are 1-person households, comprising 48.
| Household Size | Family Households | Nonfamily Households |
| 1-Person Households | - | 48 (25.8%) |
| 2-Person Households | 87 (46.8%) | 20 (10.7%) |
| 3-Person Households | 17 (9.1%) | 0 (0.0%) |
| 4-Person Households | 14 (7.5%) | 0 (0.0%) |
| 5-Person Households | 0 (0.0%) | 0 (0.0%) |
| 6-Person Households | 0 (0.0%) | 0 (0.0%) |
| 7+ Person Households | 0 (0.0%) | 0 (0.0%) |
| Total | 118 (63.4%) | 68 (36.6%) |
Female Fertility in Fairmount
Fertility by Age in Fairmount
| Age Bracket | Women with Births | Births / 1,000 Women |
| 15 to 19 years | 0 (0.0%) | 0.0 |
| 20 to 34 years | 0 (0.0%) | 0.0 |
| 35 to 50 years | 0 (0.0%) | 0.0 |
| Total | 0 (0.0%) | 0.0 |
Fertility by Age by Marriage Status in Fairmount
| Age Bracket | Married | Unmarried |
| 15 to 19 years | 0 (0.0%) | 0 (0.0%) |
| 20 to 34 years | 0 (0.0%) | 0 (0.0%) |
| 35 to 50 years | 0 (0.0%) | 0 (0.0%) |
| Total | 0 (0.0%) | 0 (0.0%) |
Fertility by Education in Fairmount
| Educational Attainment | Women with Births | Births / 1,000 Women |
| Less than High School | 0 (0.0%) | 0.0 |
| High School Diploma | 0 (0.0%) | 0.0 |
| College or Associate's Degree | 0 (0.0%) | 0.0 |
| Bachelor's Degree | 0 (0.0%) | 0.0 |
| Graduate Degree | 0 (0.0%) | 0.0 |
| Total | 0 (0.0%) | 0.0 |
Fertility by Education by Marriage Status in Fairmount
| Educational Attainment | Married | Unmarried |
| Less than High School | 0 (0.0%) | 0 (0.0%) |
| High School Diploma | 0 (0.0%) | 0 (0.0%) |
| College or Associate's Degree | 0 (0.0%) | 0 (0.0%) |
| Bachelor's Degree | 0 (0.0%) | 0 (0.0%) |
| Graduate Degree | 0 (0.0%) | 0 (0.0%) |
| Total | 0 (0.0%) | 0 (0.0%) |
Employment Characteristics in Fairmount
Employment by Class of Employer in Fairmount
Among the 189 employed individuals in Fairmount, private company employees (121 | 64.0%), local government employees (45 | 23.8%), and not-for-profit organizations (9 | 4.8%) make up the most common classes of employment.
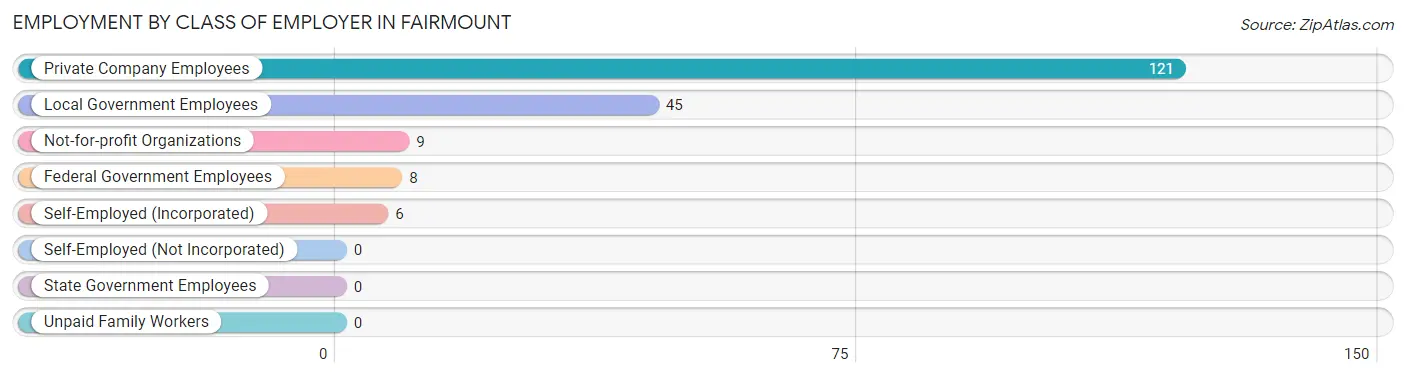
| Employer Class | # Employees | % Employees |
| Private Company Employees | 121 | 64.0% |
| Self-Employed (Incorporated) | 6 | 3.2% |
| Self-Employed (Not Incorporated) | 0 | 0.0% |
| Not-for-profit Organizations | 9 | 4.8% |
| Local Government Employees | 45 | 23.8% |
| State Government Employees | 0 | 0.0% |
| Federal Government Employees | 8 | 4.2% |
| Unpaid Family Workers | 0 | 0.0% |
| Total | 189 | 100.0% |
Employment Status by Age in Fairmount
According to the labor force statistics for Fairmount, out of the total population over 16 years of age (402), 54.5% or 219 individuals are in the labor force, with 13.7% or 30 of them unemployed. The age group with the highest labor force participation rate is 20 to 24 years, with 100.0% or 19 individuals in the labor force. Within the labor force, the 16 to 19 years age range has the highest percentage of unemployed individuals, with 100.0% or 23 of them being unemployed.
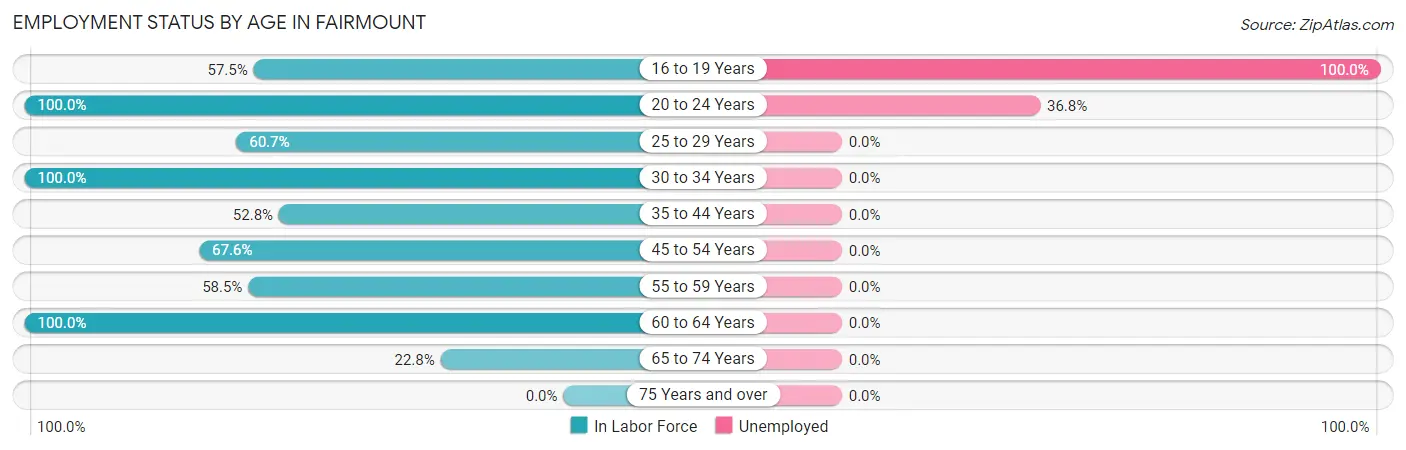
| Age Bracket | In Labor Force | Unemployed |
| 16 to 19 Years | 23 (57.5%) | 23 (100.0%) |
| 20 to 24 Years | 19 (100.0%) | 7 (36.8%) |
| 25 to 29 Years | 17 (60.7%) | 0 (0.0%) |
| 30 to 34 Years | 25 (100.0%) | 0 (0.0%) |
| 35 to 44 Years | 19 (52.8%) | 0 (0.0%) |
| 45 to 54 Years | 23 (67.6%) | 0 (0.0%) |
| 55 to 59 Years | 31 (58.5%) | 0 (0.0%) |
| 60 to 64 Years | 31 (100.0%) | 0 (0.0%) |
| 65 to 74 Years | 31 (22.8%) | 0 (0.0%) |
| 75 Years and over | 0 (0.0%) | 0 (0.0%) |
| Total | 219 (54.5%) | 30 (13.7%) |
Employment Status by Educational Attainment in Fairmount
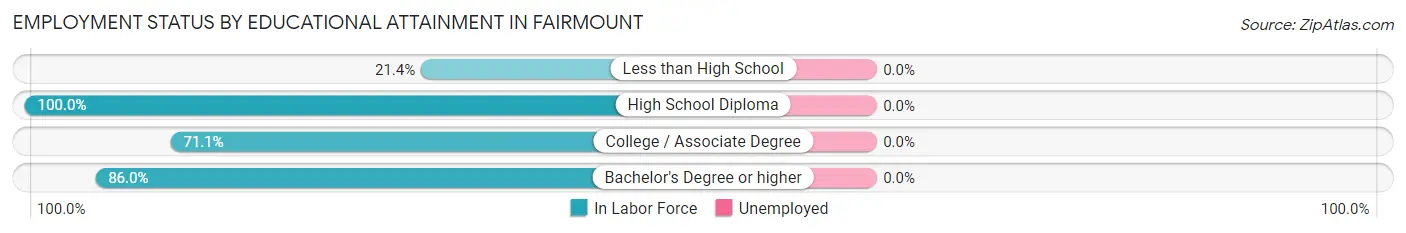
| Educational Attainment | In Labor Force | Unemployed |
| Less than High School | 9 (21.4%) | 0 (0.0%) |
| High School Diploma | 6 (100.0%) | 0 (0.0%) |
| College / Associate Degree | 27 (71.1%) | 0 (0.0%) |
| Bachelor's Degree or higher | 104 (86.0%) | 0 (0.0%) |
| Total | 146 (70.5%) | 0 (0.0%) |
Employment Occupations by Sex in Fairmount
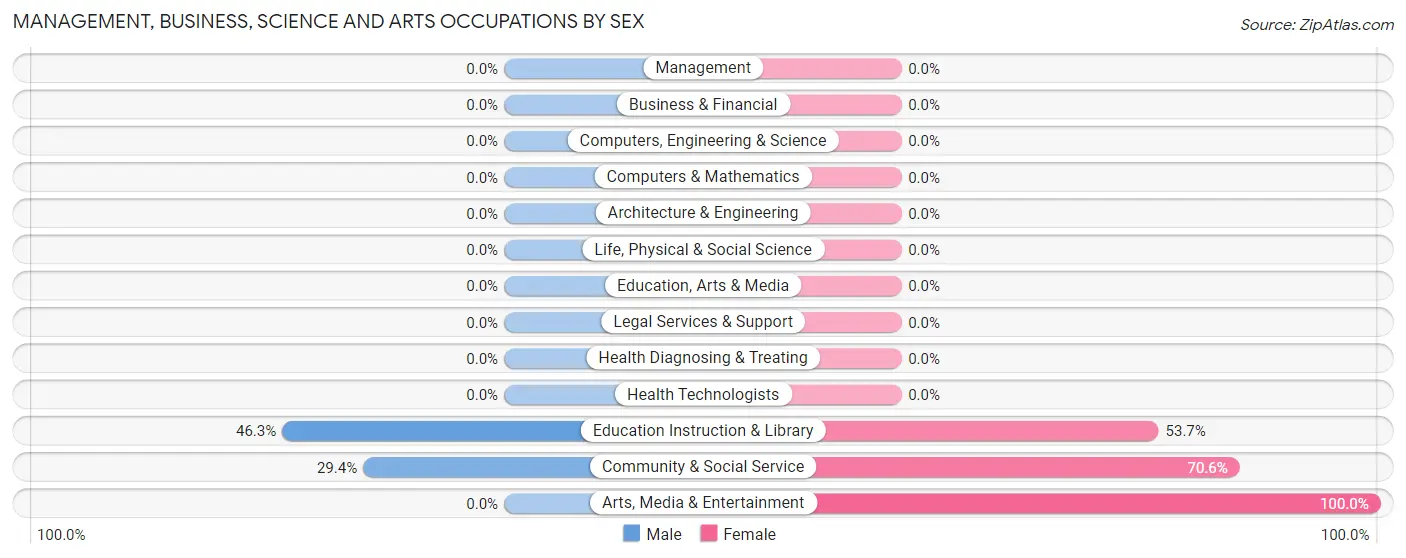
Management, Business, Science and Arts Occupations
The most common Management, Business, Science and Arts occupations in Fairmount are Community & Social Service (85 | 45.0%), Education Instruction & Library (54 | 28.6%), and Arts, Media & Entertainment (31 | 16.4%).
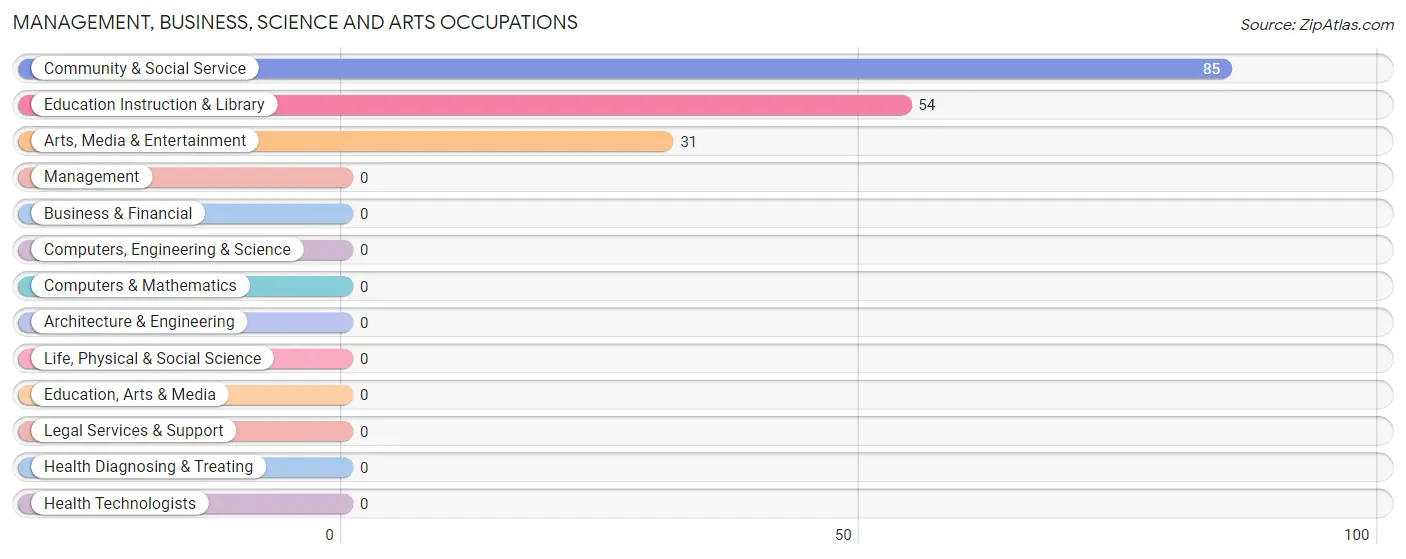
Management, Business, Science and Arts Occupations by Sex
Within the Management, Business, Science and Arts occupations in Fairmount, the most male-oriented occupations are Education Instruction & Library (46.3%), and Community & Social Service (29.4%), while the most female-oriented occupations are Arts, Media & Entertainment (100.0%), Community & Social Service (70.6%), and Education Instruction & Library (53.7%).
| Occupation | Male | Female |
| Management | 0 (0.0%) | 0 (0.0%) |
| Business & Financial | 0 (0.0%) | 0 (0.0%) |
| Computers, Engineering & Science | 0 (0.0%) | 0 (0.0%) |
| Computers & Mathematics | 0 (0.0%) | 0 (0.0%) |
| Architecture & Engineering | 0 (0.0%) | 0 (0.0%) |
| Life, Physical & Social Science | 0 (0.0%) | 0 (0.0%) |
| Community & Social Service | 25 (29.4%) | 60 (70.6%) |
| Education, Arts & Media | 0 (0.0%) | 0 (0.0%) |
| Legal Services & Support | 0 (0.0%) | 0 (0.0%) |
| Education Instruction & Library | 25 (46.3%) | 29 (53.7%) |
| Arts, Media & Entertainment | 0 (0.0%) | 31 (100.0%) |
| Health Diagnosing & Treating | 0 (0.0%) | 0 (0.0%) |
| Health Technologists | 0 (0.0%) | 0 (0.0%) |
| Total (Category) | 25 (29.4%) | 60 (70.6%) |
| Total (Overall) | 67 (35.4%) | 122 (64.5%) |
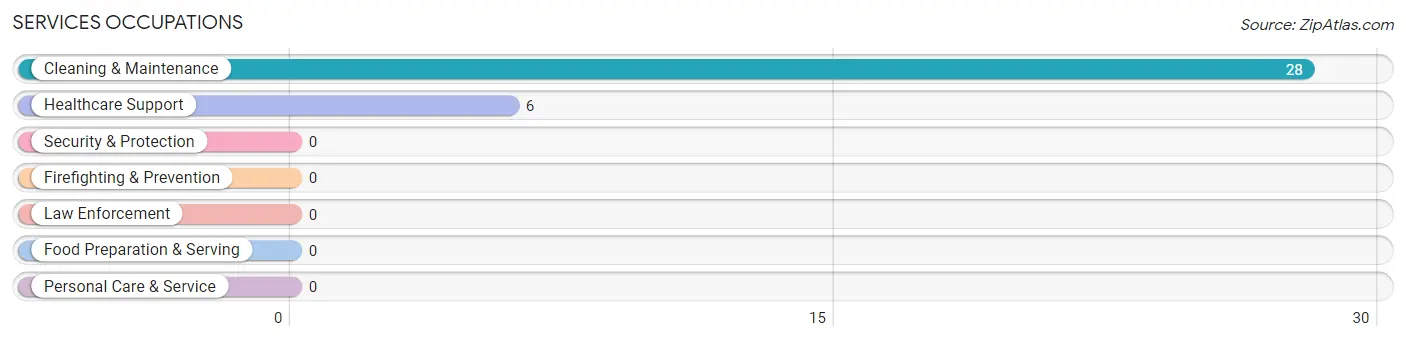
Services Occupations
The most common Services occupations in Fairmount are Cleaning & Maintenance (28 | 14.8%), and Healthcare Support (6 | 3.2%).
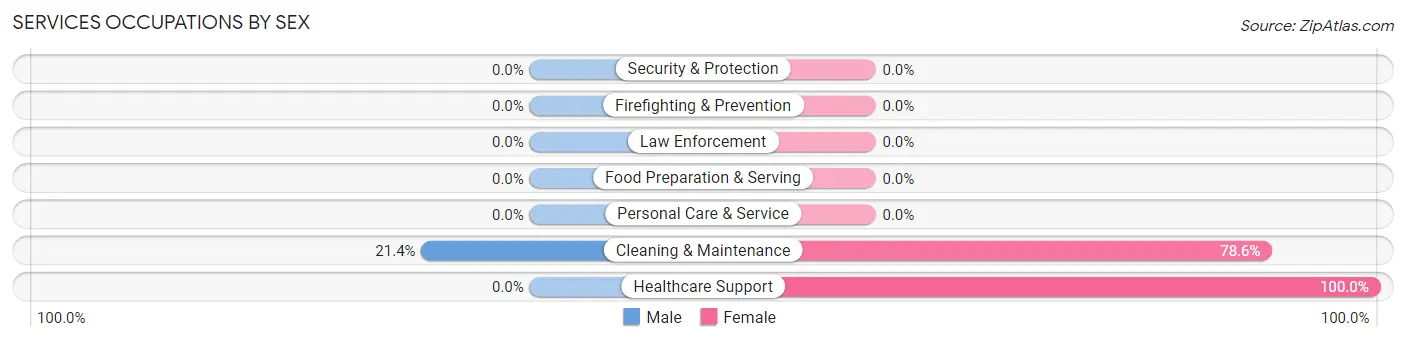
Services Occupations by Sex
| Occupation | Male | Female |
| Healthcare Support | 0 (0.0%) | 6 (100.0%) |
| Security & Protection | 0 (0.0%) | 0 (0.0%) |
| Firefighting & Prevention | 0 (0.0%) | 0 (0.0%) |
| Law Enforcement | 0 (0.0%) | 0 (0.0%) |
| Food Preparation & Serving | 0 (0.0%) | 0 (0.0%) |
| Cleaning & Maintenance | 6 (21.4%) | 22 (78.6%) |
| Personal Care & Service | 0 (0.0%) | 0 (0.0%) |
| Total (Category) | 6 (17.6%) | 28 (82.4%) |
| Total (Overall) | 67 (35.4%) | 122 (64.5%) |
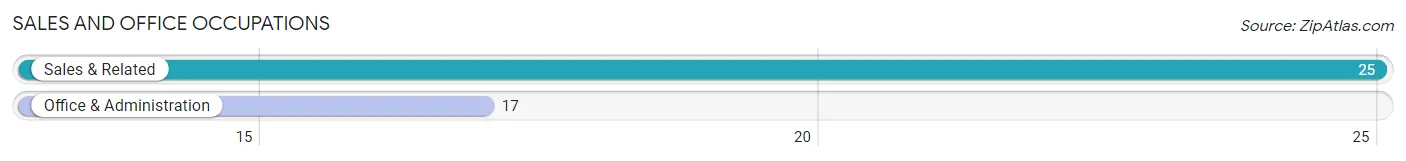
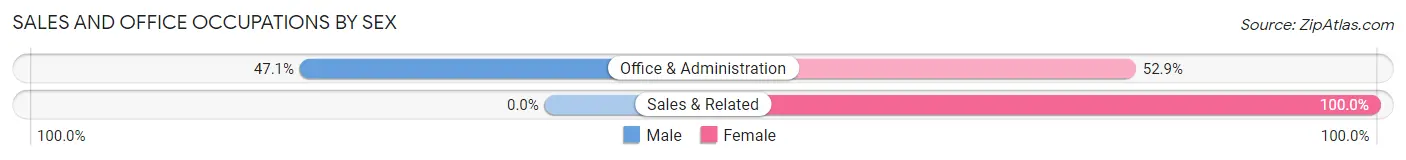
Sales and Office Occupations
The most common Sales and Office occupations in Fairmount are Sales & Related (25 | 13.2%), and Office & Administration (17 | 9.0%).
Sales and Office Occupations by Sex
| Occupation | Male | Female |
| Sales & Related | 0 (0.0%) | 25 (100.0%) |
| Office & Administration | 8 (47.1%) | 9 (52.9%) |
| Total (Category) | 8 (19.1%) | 34 (80.9%) |
| Total (Overall) | 67 (35.4%) | 122 (64.5%) |
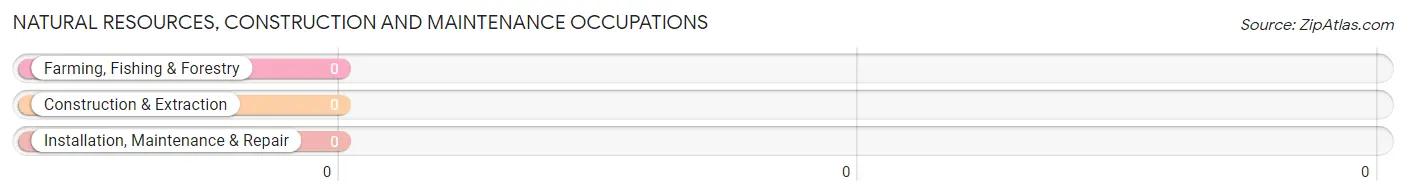
Natural Resources, Construction and Maintenance Occupations
Natural Resources, Construction and Maintenance Occupations by Sex
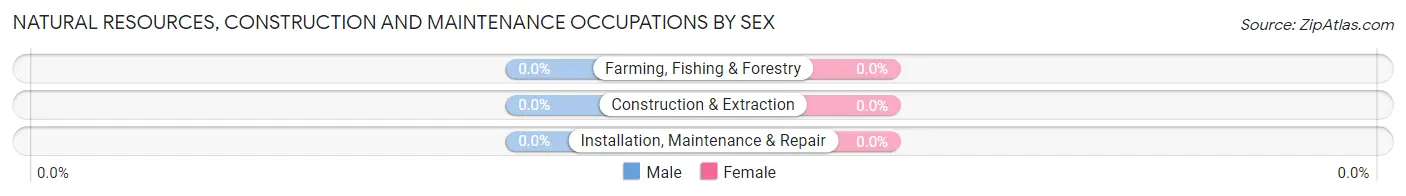
| Occupation | Male | Female |
| Farming, Fishing & Forestry | 0 (0.0%) | 0 (0.0%) |
| Construction & Extraction | 0 (0.0%) | 0 (0.0%) |
| Installation, Maintenance & Repair | 0 (0.0%) | 0 (0.0%) |
| Total (Category) | 0 (0.0%) | 0 (0.0%) |
| Total (Overall) | 67 (35.4%) | 122 (64.5%) |
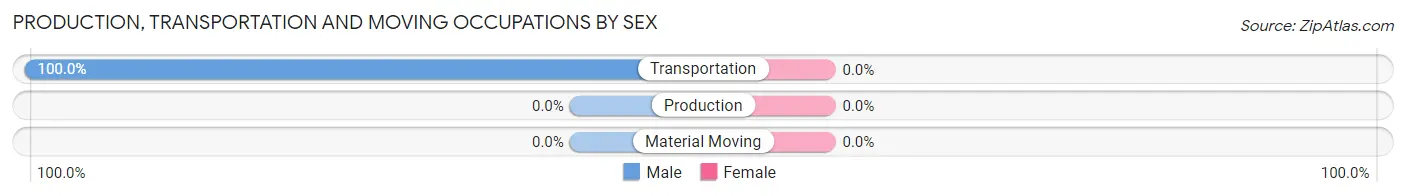
Production, Transportation and Moving Occupations
The most common Production, Transportation and Moving occupations in Fairmount are , and Transportation (28 | 14.8%).
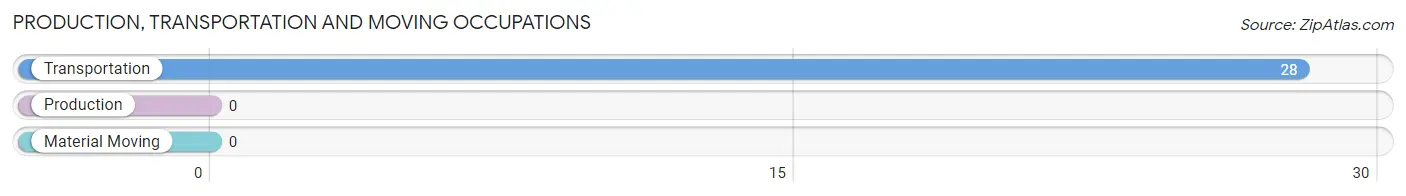
Production, Transportation and Moving Occupations by Sex
| Occupation | Male | Female |
| Production | 0 (0.0%) | 0 (0.0%) |
| Transportation | 28 (100.0%) | 0 (0.0%) |
| Material Moving | 0 (0.0%) | 0 (0.0%) |
| Total (Category) | 28 (100.0%) | 0 (0.0%) |
| Total (Overall) | 67 (35.4%) | 122 (64.5%) |
Employment Industries by Sex in Fairmount
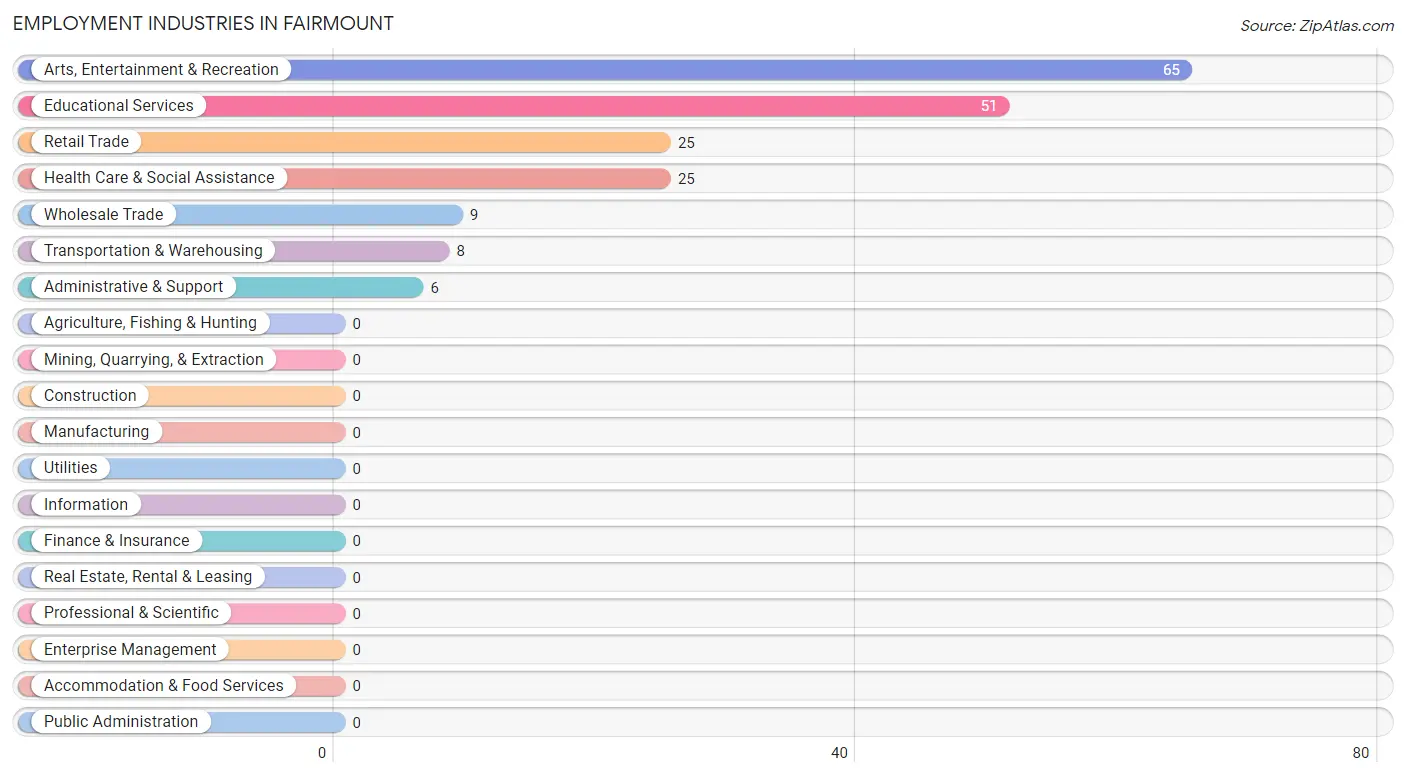
Employment Industries in Fairmount
The major employment industries in Fairmount include Arts, Entertainment & Recreation (65 | 34.4%), Educational Services (51 | 27.0%), Retail Trade (25 | 13.2%), Health Care & Social Assistance (25 | 13.2%), and Wholesale Trade (9 | 4.8%).
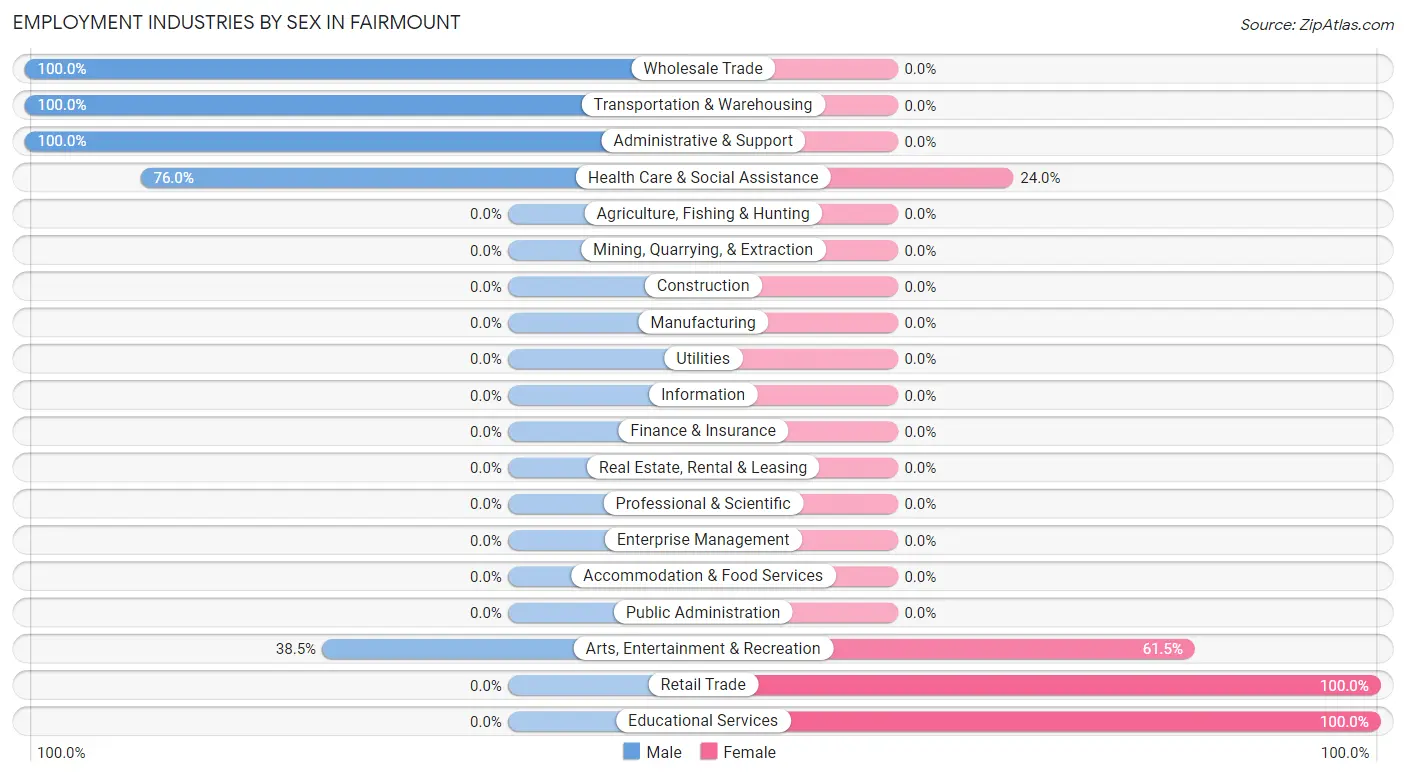
Employment Industries by Sex in Fairmount
The Fairmount industries that see more men than women are Wholesale Trade (100.0%), Transportation & Warehousing (100.0%), and Administrative & Support (100.0%), whereas the industries that tend to have a higher number of women are Retail Trade (100.0%), Educational Services (100.0%), and Arts, Entertainment & Recreation (61.5%).
| Industry | Male | Female |
| Agriculture, Fishing & Hunting | 0 (0.0%) | 0 (0.0%) |
| Mining, Quarrying, & Extraction | 0 (0.0%) | 0 (0.0%) |
| Construction | 0 (0.0%) | 0 (0.0%) |
| Manufacturing | 0 (0.0%) | 0 (0.0%) |
| Wholesale Trade | 9 (100.0%) | 0 (0.0%) |
| Retail Trade | 0 (0.0%) | 25 (100.0%) |
| Transportation & Warehousing | 8 (100.0%) | 0 (0.0%) |
| Utilities | 0 (0.0%) | 0 (0.0%) |
| Information | 0 (0.0%) | 0 (0.0%) |
| Finance & Insurance | 0 (0.0%) | 0 (0.0%) |
| Real Estate, Rental & Leasing | 0 (0.0%) | 0 (0.0%) |
| Professional & Scientific | 0 (0.0%) | 0 (0.0%) |
| Enterprise Management | 0 (0.0%) | 0 (0.0%) |
| Administrative & Support | 6 (100.0%) | 0 (0.0%) |
| Educational Services | 0 (0.0%) | 51 (100.0%) |
| Health Care & Social Assistance | 19 (76.0%) | 6 (24.0%) |
| Arts, Entertainment & Recreation | 25 (38.5%) | 40 (61.5%) |
| Accommodation & Food Services | 0 (0.0%) | 0 (0.0%) |
| Public Administration | 0 (0.0%) | 0 (0.0%) |
| Total | 67 (35.4%) | 122 (64.5%) |
Education in Fairmount
School Enrollment in Fairmount
| School Level | # Students | % Students |
| Nursery / Preschool | 0 | 0.0% |
| Kindergarten | 0 | 0.0% |
| Elementary School | 0 | 0.0% |
| Middle School | 0 | 0.0% |
| High School | 0 | 0.0% |
| College / Undergraduate | 0 | 0.0% |
| Graduate / Professional | 0 | 0.0% |
| Total | 0 | 0.0% |
School Enrollment by Age by Funding Source in Fairmount
| Age Bracket | Public School | Private School |
| 3 to 4 Year Olds | 0 (0.0%) | 0 (0.0%) |
| 5 to 9 Year Old | 0 (0.0%) | 0 (0.0%) |
| 10 to 14 Year Olds | 0 (0.0%) | 0 (0.0%) |
| 15 to 17 Year Olds | 0 (0.0%) | 0 (0.0%) |
| 18 to 19 Year Olds | 0 (0.0%) | 0 (0.0%) |
| 20 to 24 Year Olds | 0 (0.0%) | 0 (0.0%) |
| 25 to 34 Year Olds | 0 (0.0%) | 0 (0.0%) |
| 35 Years and over | 0 (0.0%) | 0 (0.0%) |
| Total | 0 (0.0%) | 0 (0.0%) |
Educational Attainment by Field of Study in Fairmount
Visual & performing arts (56 | 38.4%), engineering (25 | 17.1%), arts & humanities (25 | 17.1%), education (23 | 15.8%), and physical & health sciences (17 | 11.6%) are the most common fields of study among 146 individuals in Fairmount who have obtained a bachelor's degree or higher.
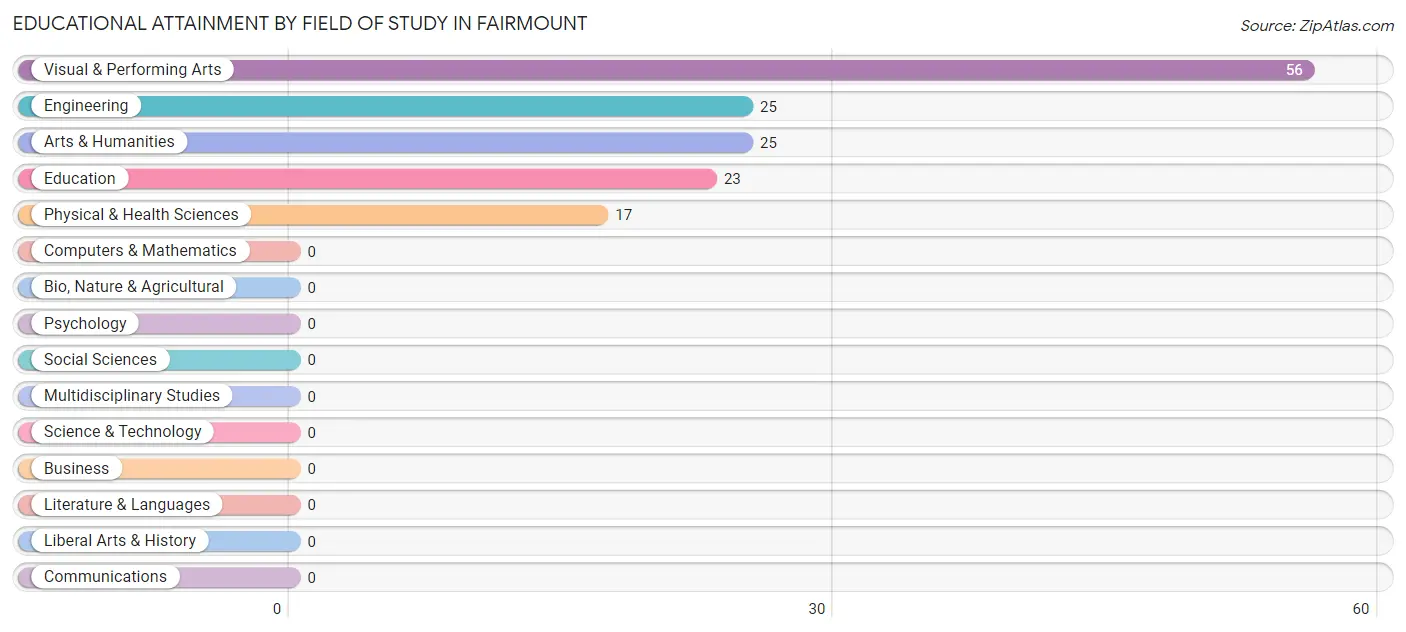
| Field of Study | # Graduates | % Graduates |
| Computers & Mathematics | 0 | 0.0% |
| Bio, Nature & Agricultural | 0 | 0.0% |
| Physical & Health Sciences | 17 | 11.6% |
| Psychology | 0 | 0.0% |
| Social Sciences | 0 | 0.0% |
| Engineering | 25 | 17.1% |
| Multidisciplinary Studies | 0 | 0.0% |
| Science & Technology | 0 | 0.0% |
| Business | 0 | 0.0% |
| Education | 23 | 15.8% |
| Literature & Languages | 0 | 0.0% |
| Liberal Arts & History | 0 | 0.0% |
| Visual & Performing Arts | 56 | 38.4% |
| Communications | 0 | 0.0% |
| Arts & Humanities | 25 | 17.1% |
| Total | 146 | 100.0% |
Transportation & Commute in Fairmount
Vehicle Availability by Sex in Fairmount
The most prevalent vehicle ownership categories in Fairmount are males with 2 vehicles (42, accounting for 62.7%) and females with 2 vehicles (78, making up 34.4%).
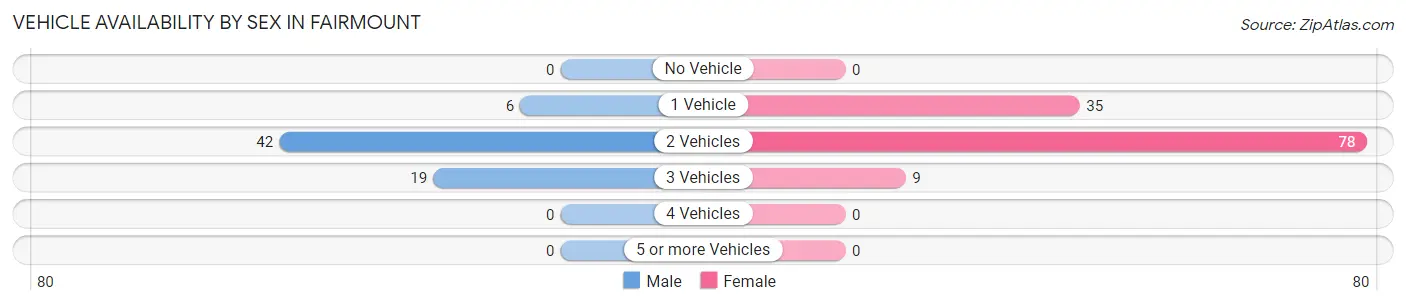
| Vehicles Available | Male | Female |
| No Vehicle | 0 (0.0%) | 0 (0.0%) |
| 1 Vehicle | 6 (9.0%) | 35 (28.7%) |
| 2 Vehicles | 42 (62.7%) | 78 (63.9%) |
| 3 Vehicles | 19 (28.4%) | 9 (7.4%) |
| 4 Vehicles | 0 (0.0%) | 0 (0.0%) |
| 5 or more Vehicles | 0 (0.0%) | 0 (0.0%) |
| Total | 67 (100.0%) | 122 (100.0%) |
Commute Time in Fairmount
The most frequently occuring commute durations in Fairmount are 30 to 34 minutes (100 commuters, 52.9%), 20 to 24 minutes (38 commuters, 20.1%), and 15 to 19 minutes (31 commuters, 16.4%).
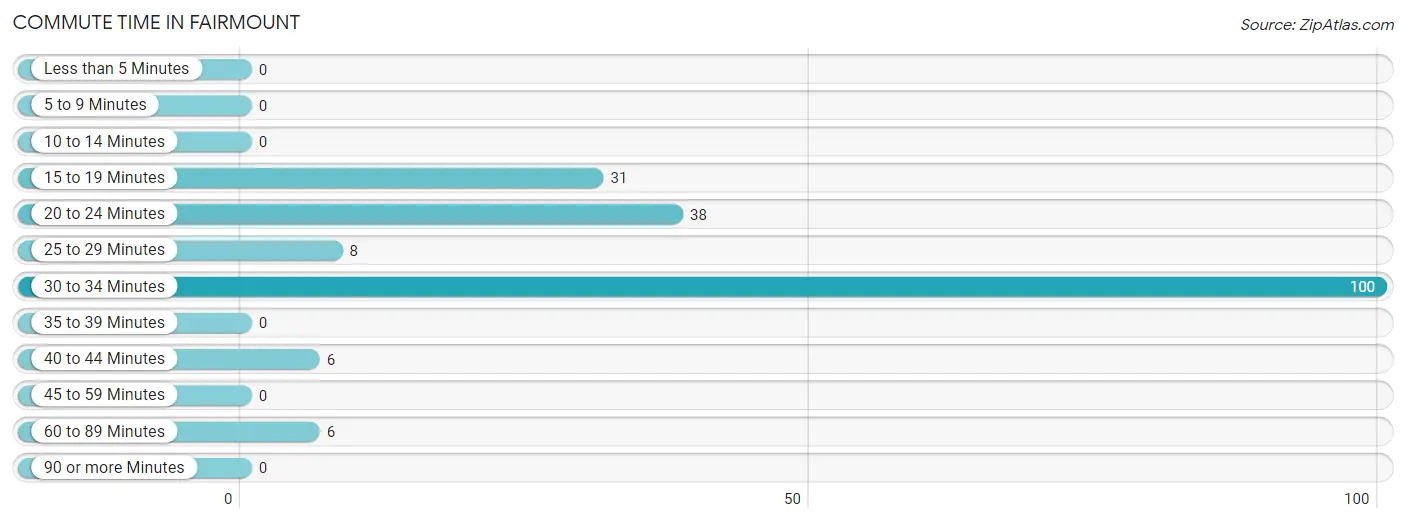
| Commute Time | # Commuters | % Commuters |
| Less than 5 Minutes | 0 | 0.0% |
| 5 to 9 Minutes | 0 | 0.0% |
| 10 to 14 Minutes | 0 | 0.0% |
| 15 to 19 Minutes | 31 | 16.4% |
| 20 to 24 Minutes | 38 | 20.1% |
| 25 to 29 Minutes | 8 | 4.2% |
| 30 to 34 Minutes | 100 | 52.9% |
| 35 to 39 Minutes | 0 | 0.0% |
| 40 to 44 Minutes | 6 | 3.2% |
| 45 to 59 Minutes | 0 | 0.0% |
| 60 to 89 Minutes | 6 | 3.2% |
| 90 or more Minutes | 0 | 0.0% |
Commute Time by Sex in Fairmount
The most common commute times in Fairmount are 30 to 34 minutes (44 commuters, 65.7%) for males and 30 to 34 minutes (56 commuters, 45.9%) for females.
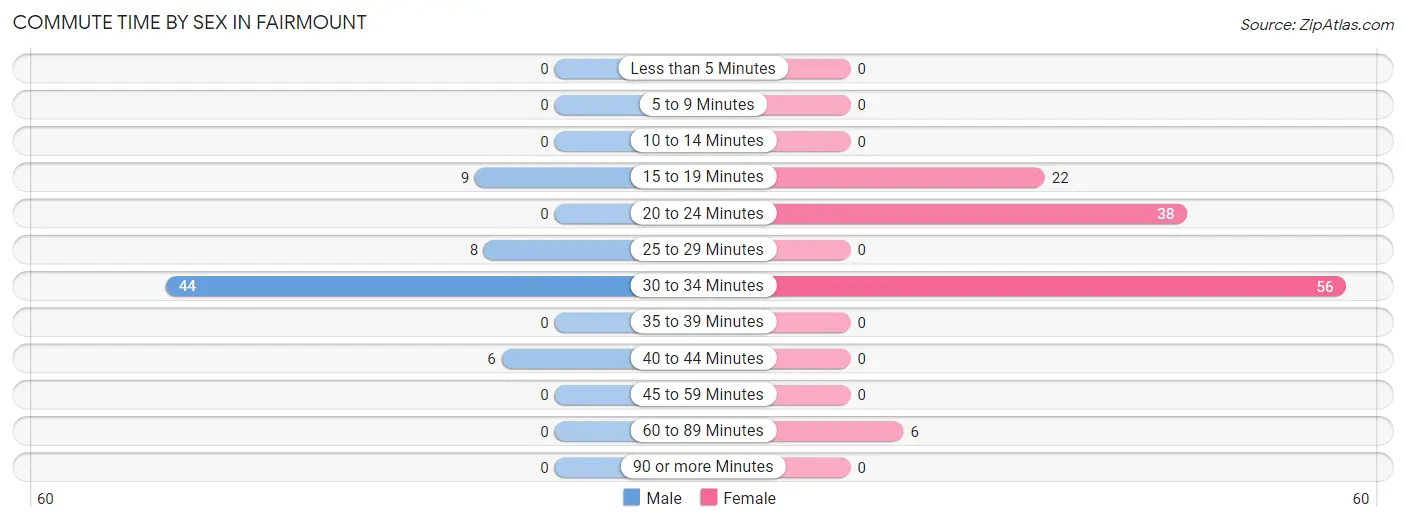
| Commute Time | Male | Female |
| Less than 5 Minutes | 0 (0.0%) | 0 (0.0%) |
| 5 to 9 Minutes | 0 (0.0%) | 0 (0.0%) |
| 10 to 14 Minutes | 0 (0.0%) | 0 (0.0%) |
| 15 to 19 Minutes | 9 (13.4%) | 22 (18.0%) |
| 20 to 24 Minutes | 0 (0.0%) | 38 (31.1%) |
| 25 to 29 Minutes | 8 (11.9%) | 0 (0.0%) |
| 30 to 34 Minutes | 44 (65.7%) | 56 (45.9%) |
| 35 to 39 Minutes | 0 (0.0%) | 0 (0.0%) |
| 40 to 44 Minutes | 6 (9.0%) | 0 (0.0%) |
| 45 to 59 Minutes | 0 (0.0%) | 0 (0.0%) |
| 60 to 89 Minutes | 0 (0.0%) | 6 (4.9%) |
| 90 or more Minutes | 0 (0.0%) | 0 (0.0%) |
Time of Departure to Work by Sex in Fairmount
The most frequent times of departure to work in Fairmount are 9:00 AM to 9:59 AM (25, 37.3%) for males and 9:00 AM to 9:59 AM (31, 25.4%) for females.
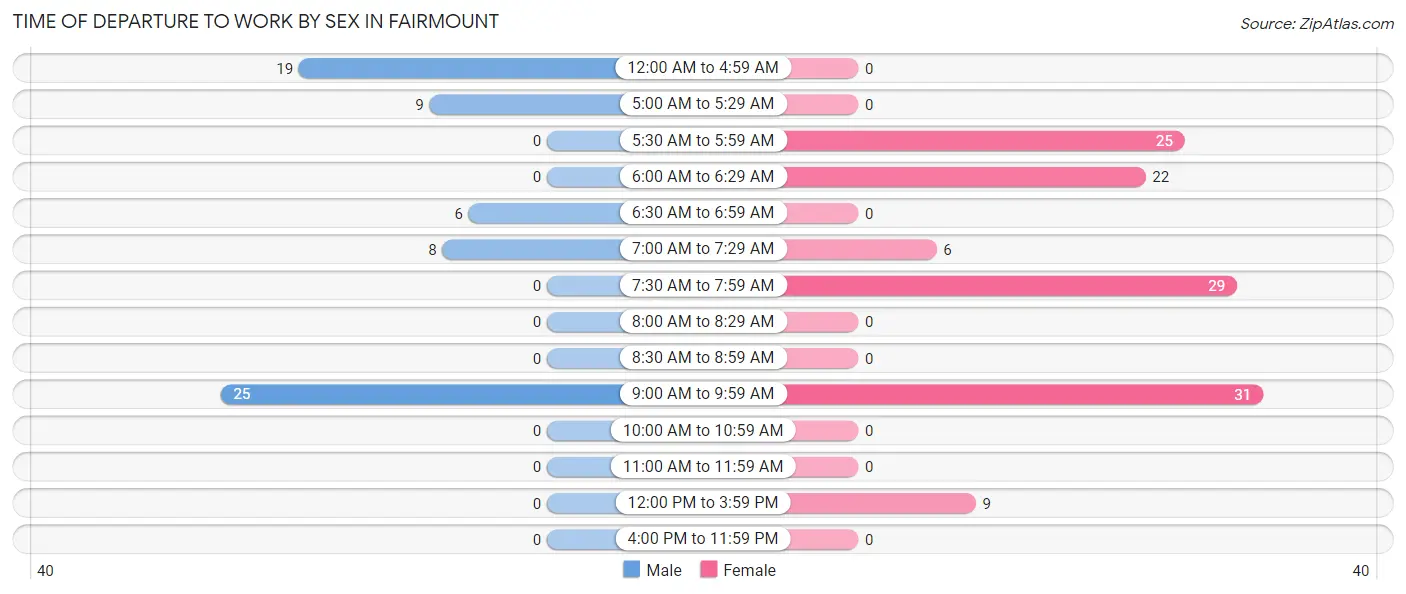
| Time of Departure | Male | Female |
| 12:00 AM to 4:59 AM | 19 (28.4%) | 0 (0.0%) |
| 5:00 AM to 5:29 AM | 9 (13.4%) | 0 (0.0%) |
| 5:30 AM to 5:59 AM | 0 (0.0%) | 25 (20.5%) |
| 6:00 AM to 6:29 AM | 0 (0.0%) | 22 (18.0%) |
| 6:30 AM to 6:59 AM | 6 (9.0%) | 0 (0.0%) |
| 7:00 AM to 7:29 AM | 8 (11.9%) | 6 (4.9%) |
| 7:30 AM to 7:59 AM | 0 (0.0%) | 29 (23.8%) |
| 8:00 AM to 8:29 AM | 0 (0.0%) | 0 (0.0%) |
| 8:30 AM to 8:59 AM | 0 (0.0%) | 0 (0.0%) |
| 9:00 AM to 9:59 AM | 25 (37.3%) | 31 (25.4%) |
| 10:00 AM to 10:59 AM | 0 (0.0%) | 0 (0.0%) |
| 11:00 AM to 11:59 AM | 0 (0.0%) | 0 (0.0%) |
| 12:00 PM to 3:59 PM | 0 (0.0%) | 9 (7.4%) |
| 4:00 PM to 11:59 PM | 0 (0.0%) | 0 (0.0%) |
| Total | 67 (100.0%) | 122 (100.0%) |
Housing Occupancy in Fairmount
Occupancy by Ownership in Fairmount
Of the total 186 dwellings in Fairmount, owner-occupied units account for 152 (81.7%), while renter-occupied units make up 34 (18.3%).
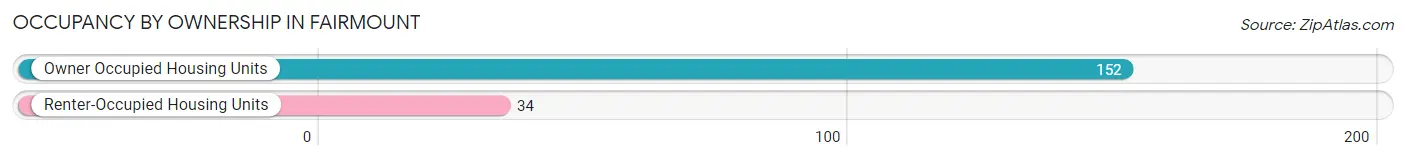
| Occupancy | # Housing Units | % Housing Units |
| Owner Occupied Housing Units | 152 | 81.7% |
| Renter-Occupied Housing Units | 34 | 18.3% |
| Total Occupied Housing Units | 186 | 100.0% |
Occupancy by Household Size in Fairmount
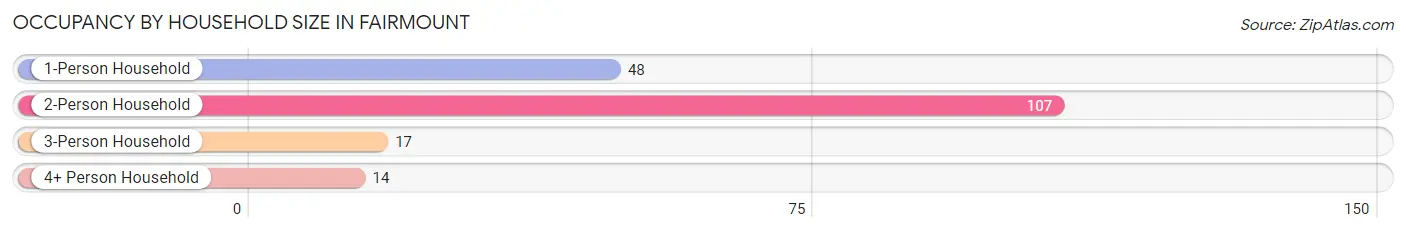
| Household Size | # Housing Units | % Housing Units |
| 1-Person Household | 48 | 25.8% |
| 2-Person Household | 107 | 57.5% |
| 3-Person Household | 17 | 9.1% |
| 4+ Person Household | 14 | 7.5% |
| Total Housing Units | 186 | 100.0% |
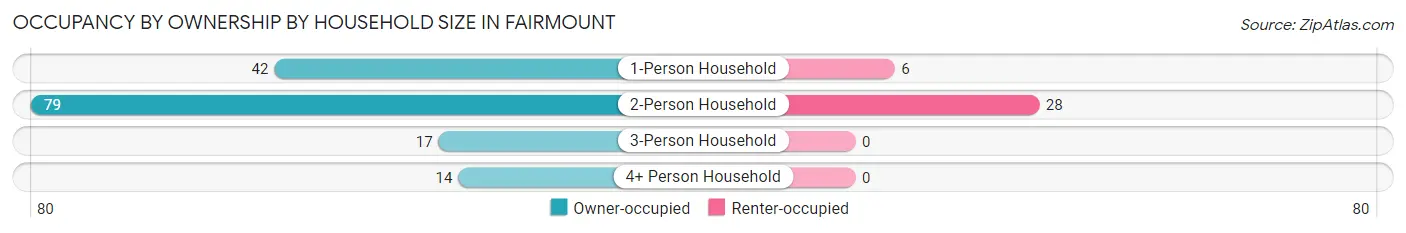
Occupancy by Ownership by Household Size in Fairmount
| Household Size | Owner-occupied | Renter-occupied |
| 1-Person Household | 42 (87.5%) | 6 (12.5%) |
| 2-Person Household | 79 (73.8%) | 28 (26.2%) |
| 3-Person Household | 17 (100.0%) | 0 (0.0%) |
| 4+ Person Household | 14 (100.0%) | 0 (0.0%) |
| Total Housing Units | 152 (81.7%) | 34 (18.3%) |
Occupancy by Educational Attainment in Fairmount
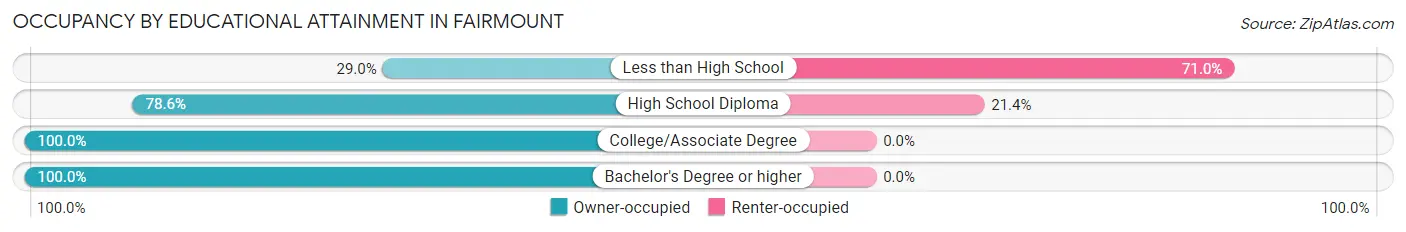
| Household Size | Owner-occupied | Renter-occupied |
| Less than High School | 9 (29.0%) | 22 (71.0%) |
| High School Diploma | 44 (78.6%) | 12 (21.4%) |
| College/Associate Degree | 51 (100.0%) | 0 (0.0%) |
| Bachelor's Degree or higher | 48 (100.0%) | 0 (0.0%) |
Occupancy by Age of Householder in Fairmount
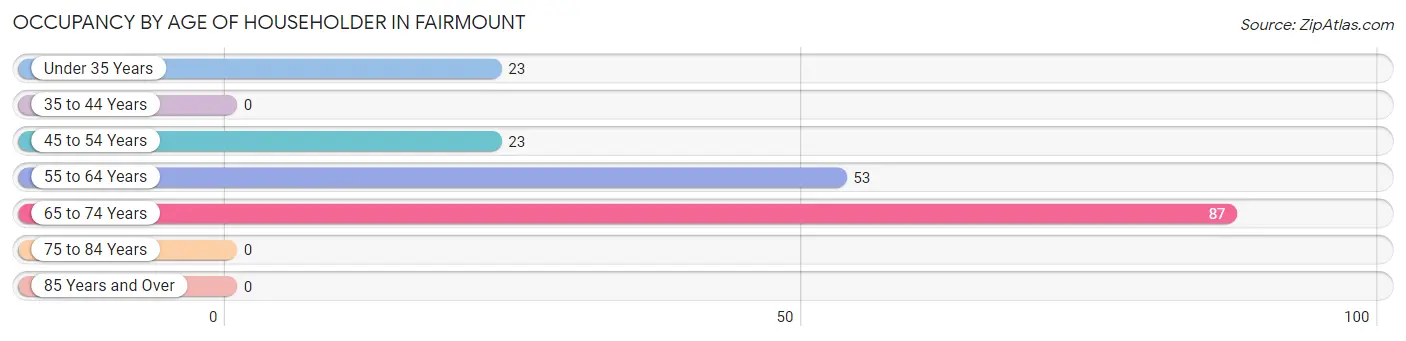
| Age Bracket | # Households | % Households |
| Under 35 Years | 23 | 12.4% |
| 35 to 44 Years | 0 | 0.0% |
| 45 to 54 Years | 23 | 12.4% |
| 55 to 64 Years | 53 | 28.5% |
| 65 to 74 Years | 87 | 46.8% |
| 75 to 84 Years | 0 | 0.0% |
| 85 Years and Over | 0 | 0.0% |
| Total | 186 | 100.0% |
Housing Finances in Fairmount
Median Income by Occupancy in Fairmount
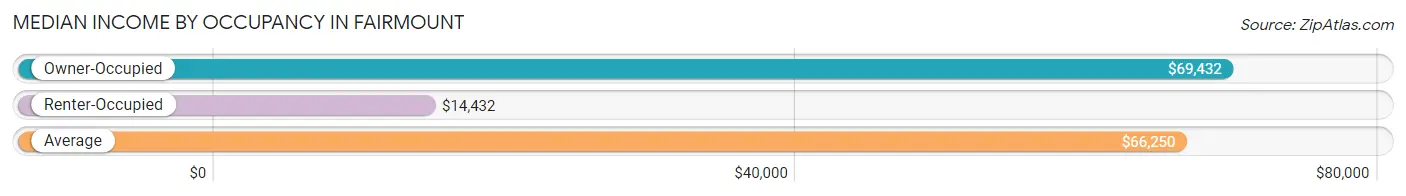
| Occupancy Type | # Households | Median Income |
| Owner-Occupied | 152 (81.7%) | $69,432 |
| Renter-Occupied | 34 (18.3%) | $14,432 |
| Average | 186 (100.0%) | $66,250 |
Occupancy by Householder Income Bracket in Fairmount
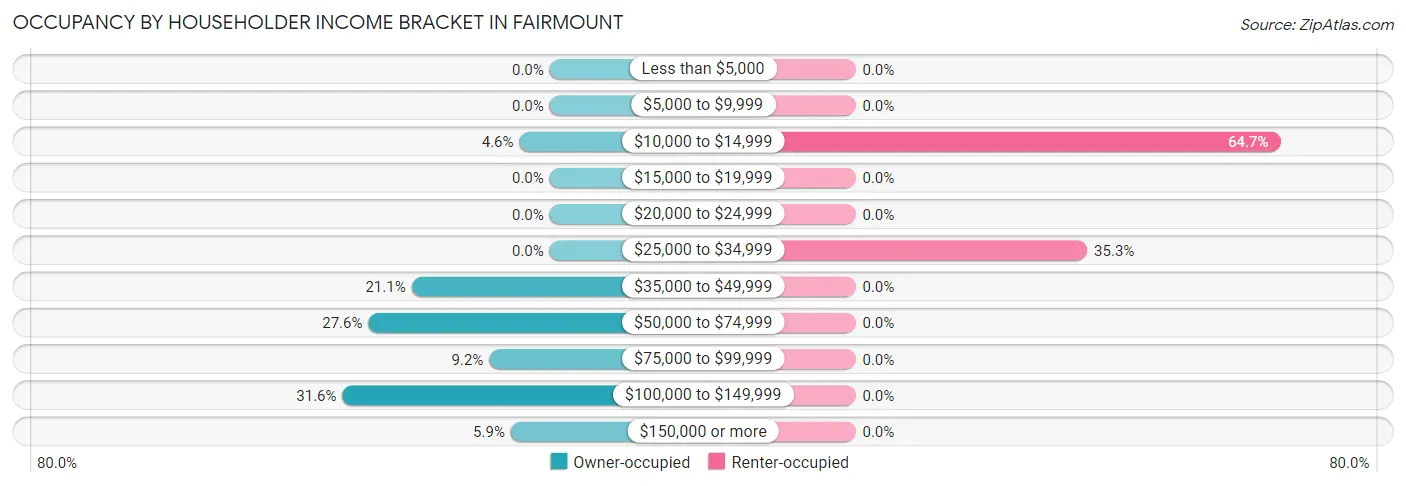
| Income Bracket | Owner-occupied | Renter-occupied |
| Less than $5,000 | 0 (0.0%) | 0 (0.0%) |
| $5,000 to $9,999 | 0 (0.0%) | 0 (0.0%) |
| $10,000 to $14,999 | 7 (4.6%) | 22 (64.7%) |
| $15,000 to $19,999 | 0 (0.0%) | 0 (0.0%) |
| $20,000 to $24,999 | 0 (0.0%) | 0 (0.0%) |
| $25,000 to $34,999 | 0 (0.0%) | 12 (35.3%) |
| $35,000 to $49,999 | 32 (21.0%) | 0 (0.0%) |
| $50,000 to $74,999 | 42 (27.6%) | 0 (0.0%) |
| $75,000 to $99,999 | 14 (9.2%) | 0 (0.0%) |
| $100,000 to $149,999 | 48 (31.6%) | 0 (0.0%) |
| $150,000 or more | 9 (5.9%) | 0 (0.0%) |
| Total | 152 (100.0%) | 34 (100.0%) |
Monthly Housing Cost Tiers in Fairmount
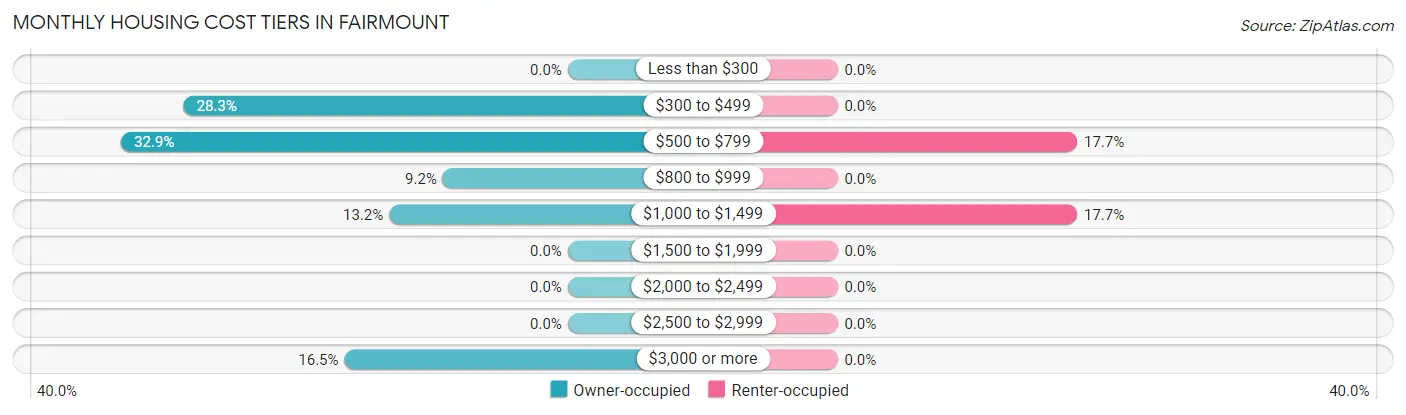
| Monthly Cost | Owner-occupied | Renter-occupied |
| Less than $300 | 0 (0.0%) | 0 (0.0%) |
| $300 to $499 | 43 (28.3%) | 0 (0.0%) |
| $500 to $799 | 50 (32.9%) | 6 (17.6%) |
| $800 to $999 | 14 (9.2%) | 0 (0.0%) |
| $1,000 to $1,499 | 20 (13.2%) | 6 (17.6%) |
| $1,500 to $1,999 | 0 (0.0%) | 0 (0.0%) |
| $2,000 to $2,499 | 0 (0.0%) | 0 (0.0%) |
| $2,500 to $2,999 | 0 (0.0%) | 0 (0.0%) |
| $3,000 or more | 25 (16.5%) | 0 (0.0%) |
| Total | 152 (100.0%) | 34 (100.0%) |
Physical Housing Characteristics in Fairmount
Housing Structures in Fairmount
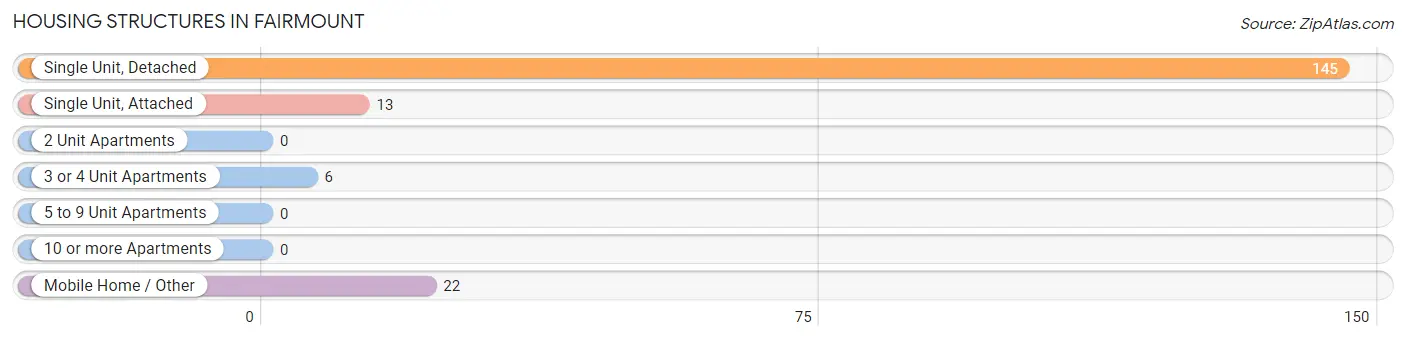
| Structure Type | # Housing Units | % Housing Units |
| Single Unit, Detached | 145 | 78.0% |
| Single Unit, Attached | 13 | 7.0% |
| 2 Unit Apartments | 0 | 0.0% |
| 3 or 4 Unit Apartments | 6 | 3.2% |
| 5 to 9 Unit Apartments | 0 | 0.0% |
| 10 or more Apartments | 0 | 0.0% |
| Mobile Home / Other | 22 | 11.8% |
| Total | 186 | 100.0% |
Housing Structures by Occupancy in Fairmount
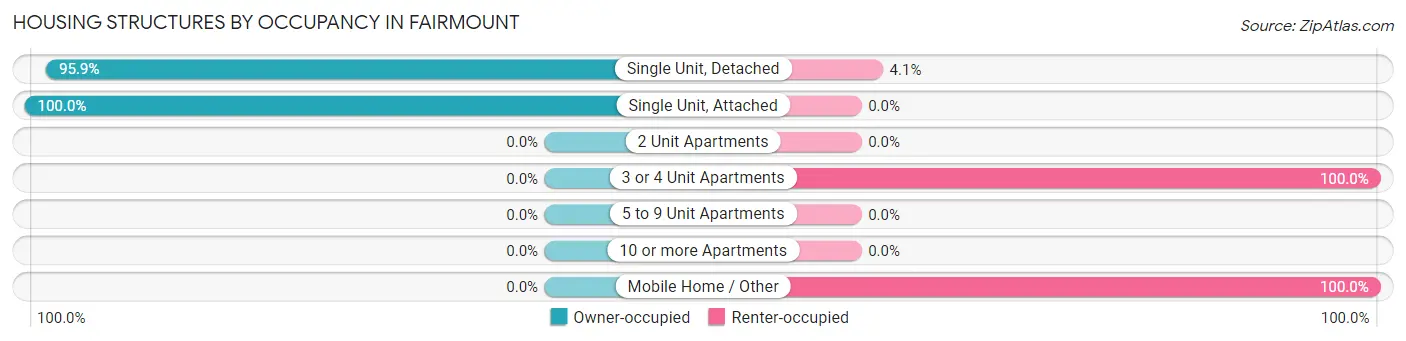
| Structure Type | Owner-occupied | Renter-occupied |
| Single Unit, Detached | 139 (95.9%) | 6 (4.1%) |
| Single Unit, Attached | 13 (100.0%) | 0 (0.0%) |
| 2 Unit Apartments | 0 (0.0%) | 0 (0.0%) |
| 3 or 4 Unit Apartments | 0 (0.0%) | 6 (100.0%) |
| 5 to 9 Unit Apartments | 0 (0.0%) | 0 (0.0%) |
| 10 or more Apartments | 0 (0.0%) | 0 (0.0%) |
| Mobile Home / Other | 0 (0.0%) | 22 (100.0%) |
| Total | 152 (81.7%) | 34 (18.3%) |
Housing Structures by Number of Rooms in Fairmount
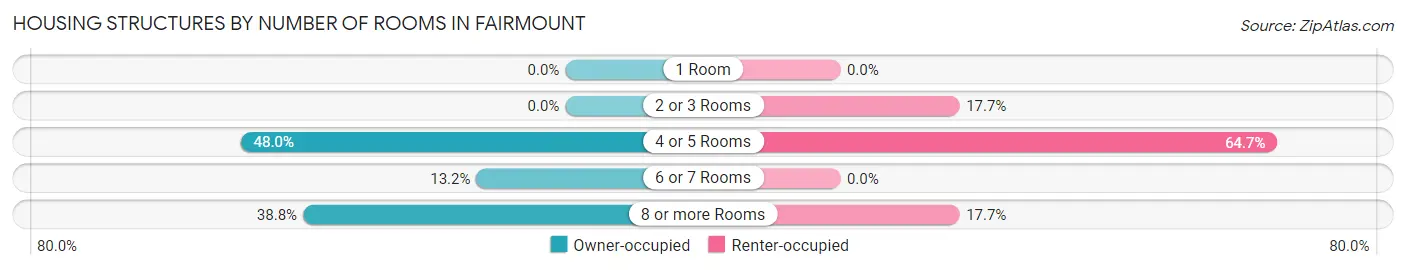
| Number of Rooms | Owner-occupied | Renter-occupied |
| 1 Room | 0 (0.0%) | 0 (0.0%) |
| 2 or 3 Rooms | 0 (0.0%) | 6 (17.6%) |
| 4 or 5 Rooms | 73 (48.0%) | 22 (64.7%) |
| 6 or 7 Rooms | 20 (13.2%) | 0 (0.0%) |
| 8 or more Rooms | 59 (38.8%) | 6 (17.6%) |
| Total | 152 (100.0%) | 34 (100.0%) |
Housing Structure by Heating Type in Fairmount
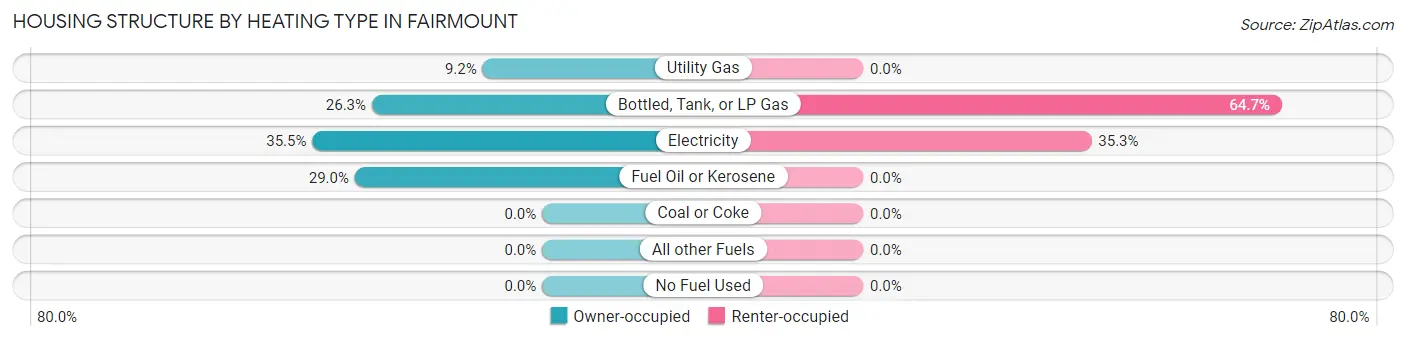
| Heating Type | Owner-occupied | Renter-occupied |
| Utility Gas | 14 (9.2%) | 0 (0.0%) |
| Bottled, Tank, or LP Gas | 40 (26.3%) | 22 (64.7%) |
| Electricity | 54 (35.5%) | 12 (35.3%) |
| Fuel Oil or Kerosene | 44 (28.9%) | 0 (0.0%) |
| Coal or Coke | 0 (0.0%) | 0 (0.0%) |
| All other Fuels | 0 (0.0%) | 0 (0.0%) |
| No Fuel Used | 0 (0.0%) | 0 (0.0%) |
| Total | 152 (100.0%) | 34 (100.0%) |
Household Vehicle Usage in Fairmount
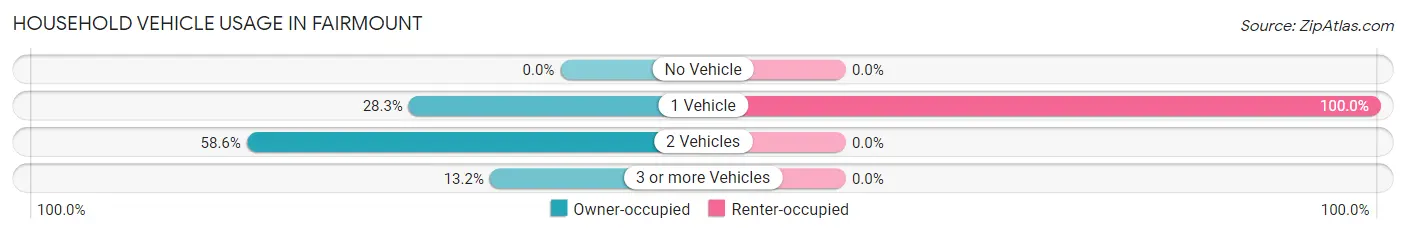
| Vehicles per Household | Owner-occupied | Renter-occupied |
| No Vehicle | 0 (0.0%) | 0 (0.0%) |
| 1 Vehicle | 43 (28.3%) | 34 (100.0%) |
| 2 Vehicles | 89 (58.6%) | 0 (0.0%) |
| 3 or more Vehicles | 20 (13.2%) | 0 (0.0%) |
| Total | 152 (100.0%) | 34 (100.0%) |
Real Estate & Mortgages in Fairmount
Real Estate and Mortgage Overview in Fairmount
| Characteristic | Without Mortgage | With Mortgage |
| Housing Units | 75 | 77 |
| Median Property Value | - | - |
| Median Household Income | $49,844 | $9 |
| Monthly Housing Costs | $431 | $25 |
| Real Estate Taxes | - | - |
Property Value by Mortgage Status in Fairmount
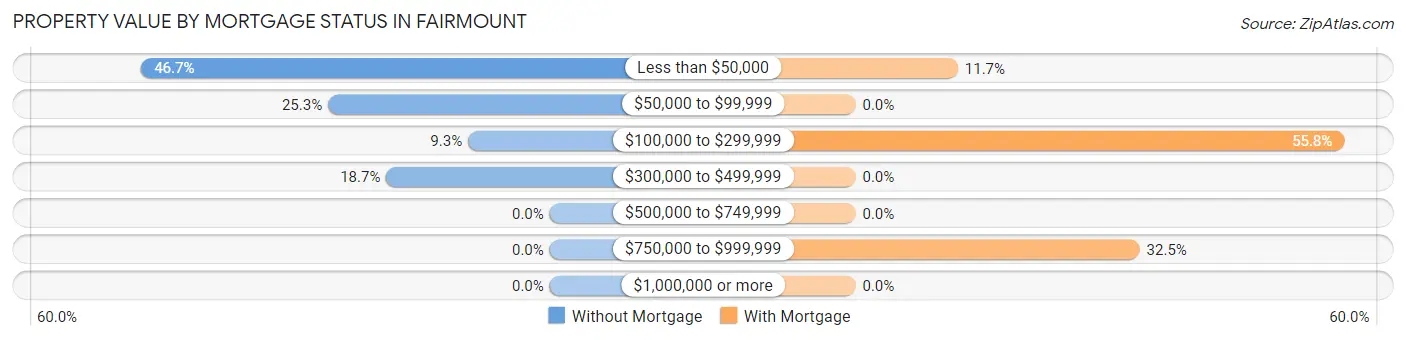
| Property Value | Without Mortgage | With Mortgage |
| Less than $50,000 | 35 (46.7%) | 9 (11.7%) |
| $50,000 to $99,999 | 19 (25.3%) | 0 (0.0%) |
| $100,000 to $299,999 | 7 (9.3%) | 43 (55.8%) |
| $300,000 to $499,999 | 14 (18.7%) | 0 (0.0%) |
| $500,000 to $749,999 | 0 (0.0%) | 0 (0.0%) |
| $750,000 to $999,999 | 0 (0.0%) | 25 (32.5%) |
| $1,000,000 or more | 0 (0.0%) | 0 (0.0%) |
| Total | 75 (100.0%) | 77 (100.0%) |
Household Income by Mortgage Status in Fairmount
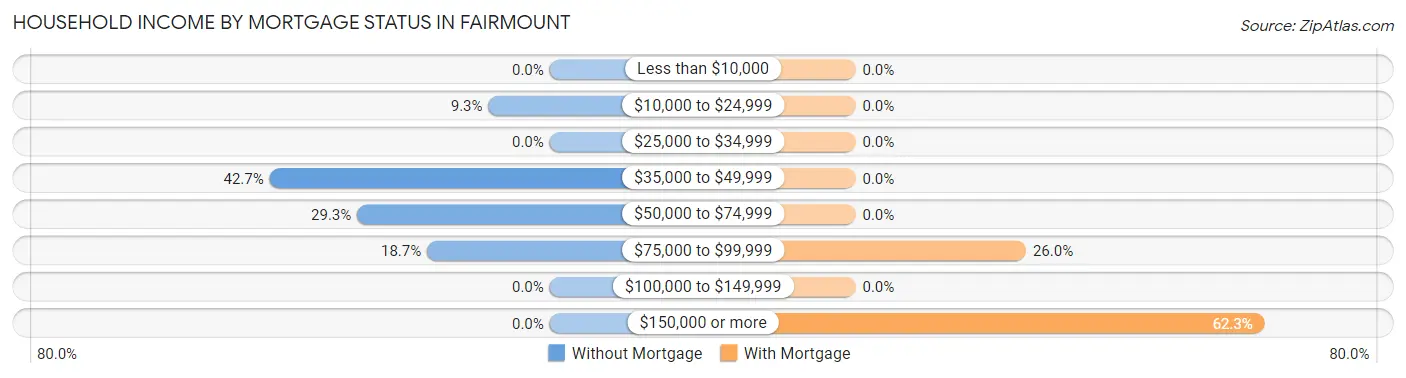
| Household Income | Without Mortgage | With Mortgage |
| Less than $10,000 | 0 (0.0%) | 0 (0.0%) |
| $10,000 to $24,999 | 7 (9.3%) | 0 (0.0%) |
| $25,000 to $34,999 | 0 (0.0%) | 0 (0.0%) |
| $35,000 to $49,999 | 32 (42.7%) | 0 (0.0%) |
| $50,000 to $74,999 | 22 (29.3%) | 0 (0.0%) |
| $75,000 to $99,999 | 14 (18.7%) | 20 (26.0%) |
| $100,000 to $149,999 | 0 (0.0%) | 0 (0.0%) |
| $150,000 or more | 0 (0.0%) | 48 (62.3%) |
| Total | 75 (100.0%) | 77 (100.0%) |
Property Value to Household Income Ratio in Fairmount
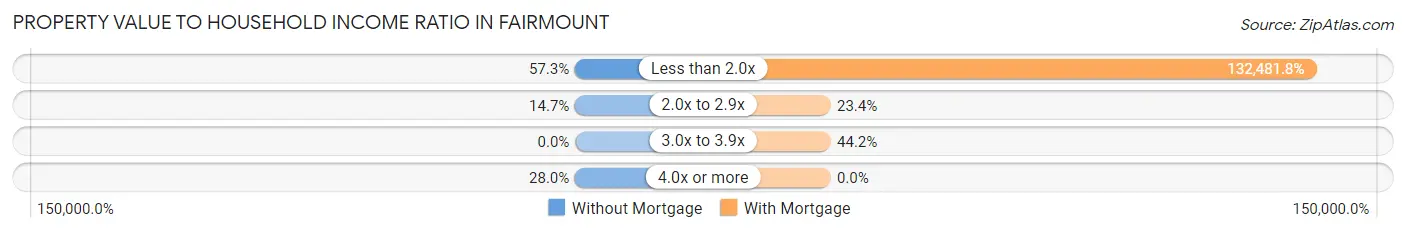
| Value-to-Income Ratio | Without Mortgage | With Mortgage |
| Less than 2.0x | 43 (57.3%) | 102,011 (132,481.8%) |
| 2.0x to 2.9x | 11 (14.7%) | 18 (23.4%) |
| 3.0x to 3.9x | 0 (0.0%) | 34 (44.2%) |
| 4.0x or more | 21 (28.0%) | 0 (0.0%) |
| Total | 75 (100.0%) | 77 (100.0%) |
Real Estate Taxes by Mortgage Status in Fairmount
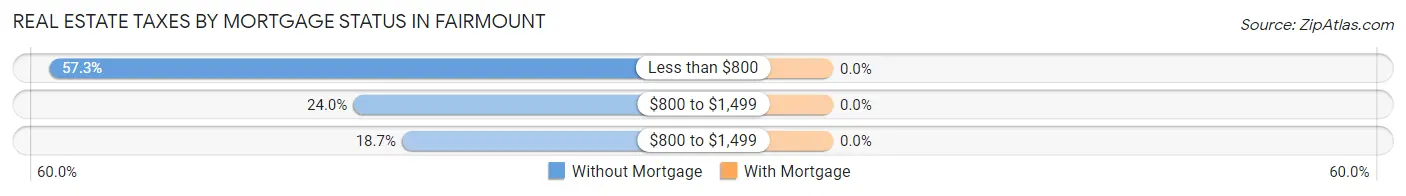
| Property Taxes | Without Mortgage | With Mortgage |
| Less than $800 | 43 (57.3%) | 0 (0.0%) |
| $800 to $1,499 | 18 (24.0%) | 0 (0.0%) |
| $800 to $1,499 | 14 (18.7%) | 0 (0.0%) |
| Total | 75 (100.0%) | 77 (100.0%) |
Health & Disability in Fairmount
Health Insurance Coverage by Age in Fairmount
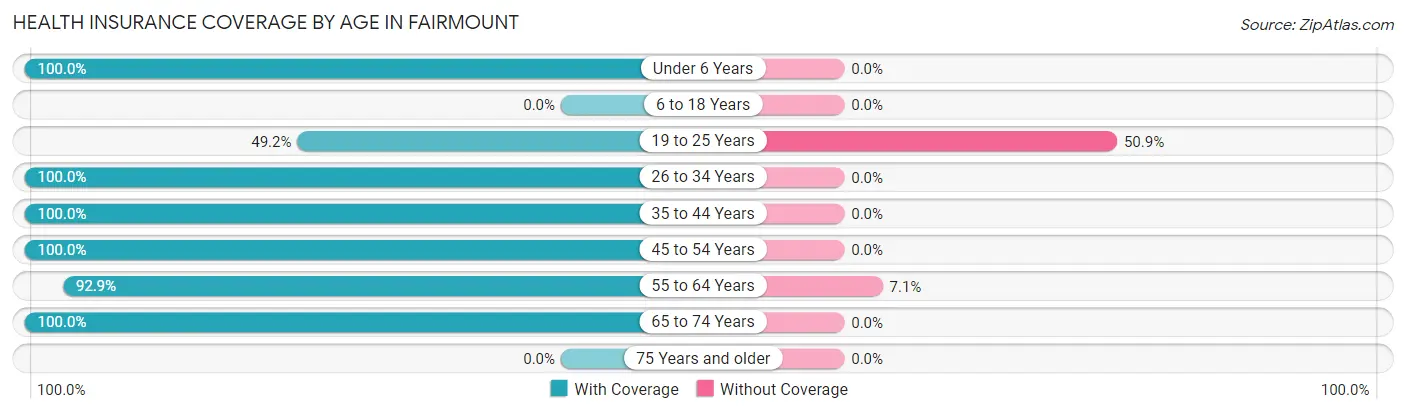
| Age Bracket | With Coverage | Without Coverage |
| Under 6 Years | 8 (100.0%) | 0 (0.0%) |
| 6 to 18 Years | 0 (0.0%) | 0 (0.0%) |
| 19 to 25 Years | 29 (49.1%) | 30 (50.8%) |
| 26 to 34 Years | 53 (100.0%) | 0 (0.0%) |
| 35 to 44 Years | 36 (100.0%) | 0 (0.0%) |
| 45 to 54 Years | 34 (100.0%) | 0 (0.0%) |
| 55 to 64 Years | 78 (92.9%) | 6 (7.1%) |
| 65 to 74 Years | 136 (100.0%) | 0 (0.0%) |
| 75 Years and older | 0 (0.0%) | 0 (0.0%) |
| Total | 374 (91.2%) | 36 (8.8%) |
Health Insurance Coverage by Citizenship Status in Fairmount
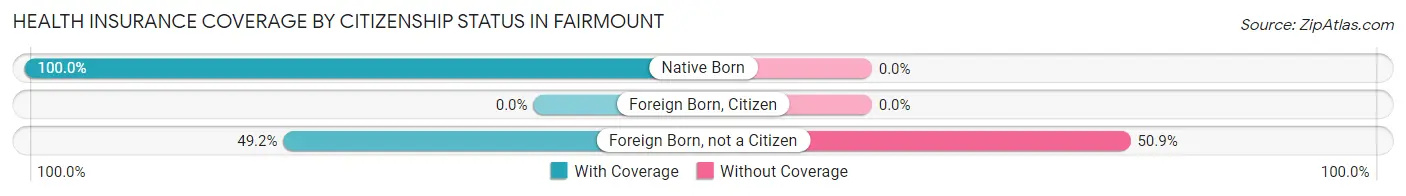
| Citizenship Status | With Coverage | Without Coverage |
| Native Born | 8 (100.0%) | 0 (0.0%) |
| Foreign Born, Citizen | 0 (0.0%) | 0 (0.0%) |
| Foreign Born, not a Citizen | 29 (49.1%) | 30 (50.8%) |
Health Insurance Coverage by Household Income in Fairmount
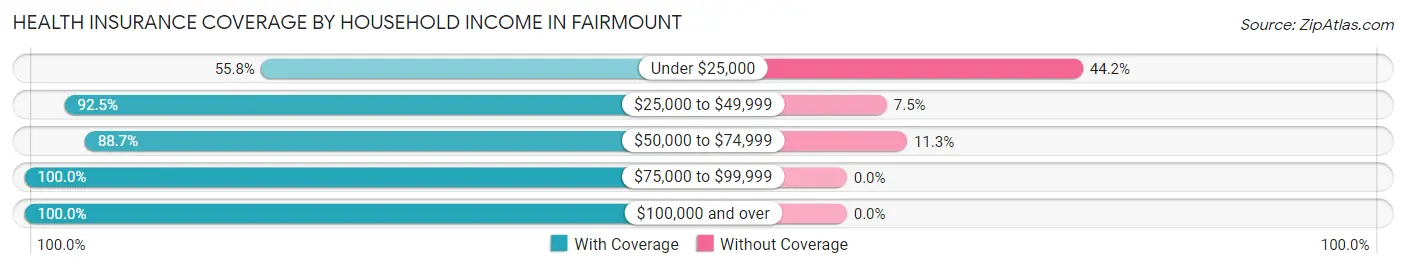
| Household Income | With Coverage | Without Coverage |
| Under $25,000 | 29 (55.8%) | 23 (44.2%) |
| $25,000 to $49,999 | 74 (92.5%) | 6 (7.5%) |
| $50,000 to $74,999 | 55 (88.7%) | 7 (11.3%) |
| $75,000 to $99,999 | 81 (100.0%) | 0 (0.0%) |
| $100,000 and over | 135 (100.0%) | 0 (0.0%) |
Public vs Private Health Insurance Coverage by Age in Fairmount
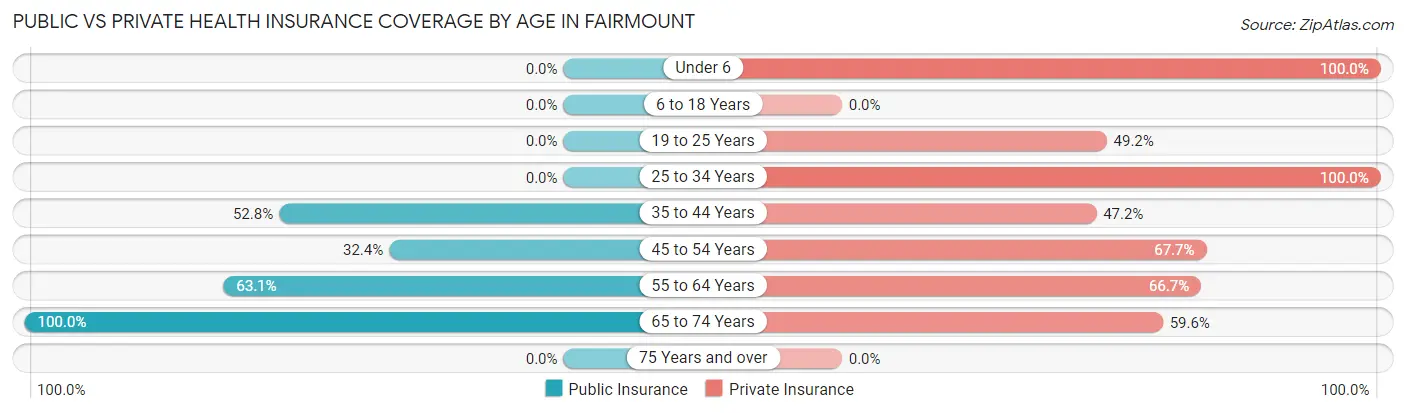
| Age Bracket | Public Insurance | Private Insurance |
| Under 6 | 0 (0.0%) | 8 (100.0%) |
| 6 to 18 Years | 0 (0.0%) | 0 (0.0%) |
| 19 to 25 Years | 0 (0.0%) | 29 (49.1%) |
| 25 to 34 Years | 0 (0.0%) | 53 (100.0%) |
| 35 to 44 Years | 19 (52.8%) | 17 (47.2%) |
| 45 to 54 Years | 11 (32.4%) | 23 (67.6%) |
| 55 to 64 Years | 53 (63.1%) | 56 (66.7%) |
| 65 to 74 Years | 136 (100.0%) | 81 (59.6%) |
| 75 Years and over | 0 (0.0%) | 0 (0.0%) |
| Total | 219 (53.4%) | 267 (65.1%) |
Disability Status by Sex by Age in Fairmount
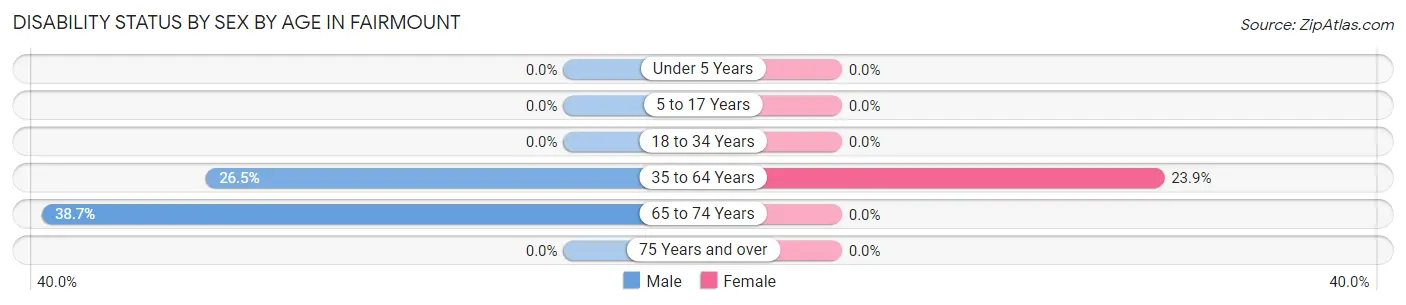
| Age Bracket | Male | Female |
| Under 5 Years | 0 (0.0%) | 0 (0.0%) |
| 5 to 17 Years | 0 (0.0%) | 0 (0.0%) |
| 18 to 34 Years | 0 (0.0%) | 0 (0.0%) |
| 35 to 64 Years | 22 (26.5%) | 17 (23.9%) |
| 65 to 74 Years | 24 (38.7%) | 0 (0.0%) |
| 75 Years and over | 0 (0.0%) | 0 (0.0%) |
Disability Class by Sex by Age in Fairmount
Disability Class: Hearing Difficulty
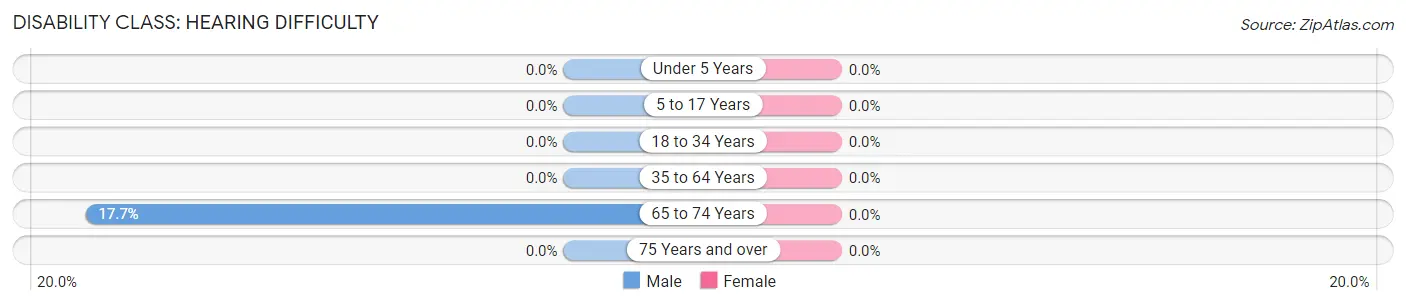
| Age Bracket | Male | Female |
| Under 5 Years | 0 (0.0%) | 0 (0.0%) |
| 5 to 17 Years | 0 (0.0%) | 0 (0.0%) |
| 18 to 34 Years | 0 (0.0%) | 0 (0.0%) |
| 35 to 64 Years | 0 (0.0%) | 0 (0.0%) |
| 65 to 74 Years | 11 (17.7%) | 0 (0.0%) |
| 75 Years and over | 0 (0.0%) | 0 (0.0%) |
Disability Class: Vision Difficulty
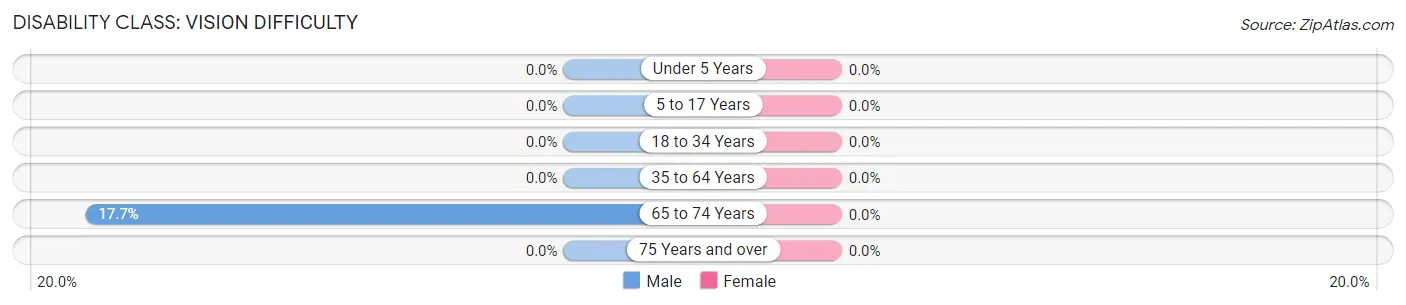
| Age Bracket | Male | Female |
| Under 5 Years | 0 (0.0%) | 0 (0.0%) |
| 5 to 17 Years | 0 (0.0%) | 0 (0.0%) |
| 18 to 34 Years | 0 (0.0%) | 0 (0.0%) |
| 35 to 64 Years | 0 (0.0%) | 0 (0.0%) |
| 65 to 74 Years | 11 (17.7%) | 0 (0.0%) |
| 75 Years and over | 0 (0.0%) | 0 (0.0%) |
Disability Class: Cognitive Difficulty
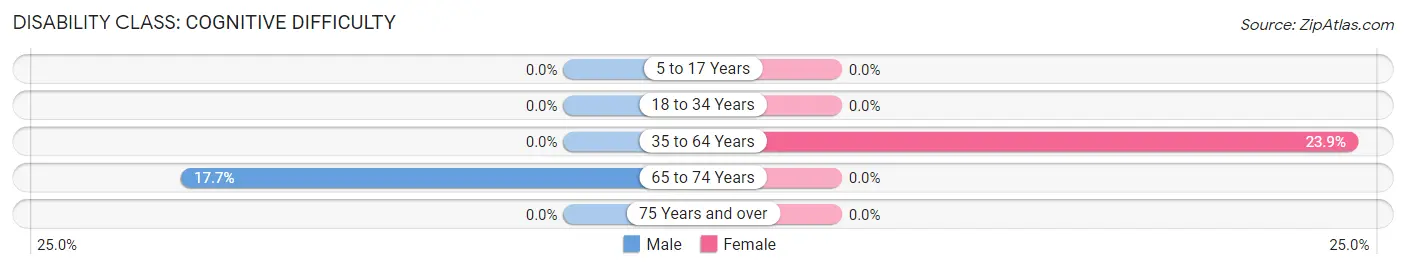
| Age Bracket | Male | Female |
| 5 to 17 Years | 0 (0.0%) | 0 (0.0%) |
| 18 to 34 Years | 0 (0.0%) | 0 (0.0%) |
| 35 to 64 Years | 0 (0.0%) | 17 (23.9%) |
| 65 to 74 Years | 11 (17.7%) | 0 (0.0%) |
| 75 Years and over | 0 (0.0%) | 0 (0.0%) |
Disability Class: Ambulatory Difficulty
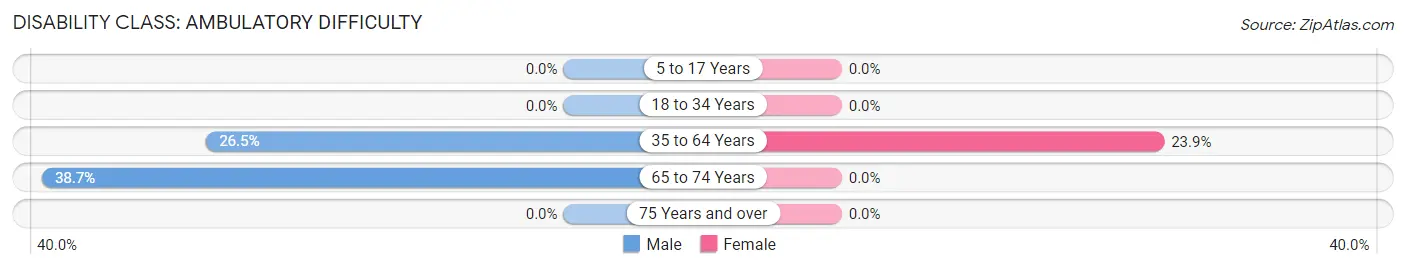
| Age Bracket | Male | Female |
| 5 to 17 Years | 0 (0.0%) | 0 (0.0%) |
| 18 to 34 Years | 0 (0.0%) | 0 (0.0%) |
| 35 to 64 Years | 22 (26.5%) | 17 (23.9%) |
| 65 to 74 Years | 24 (38.7%) | 0 (0.0%) |
| 75 Years and over | 0 (0.0%) | 0 (0.0%) |
Disability Class: Self-Care Difficulty
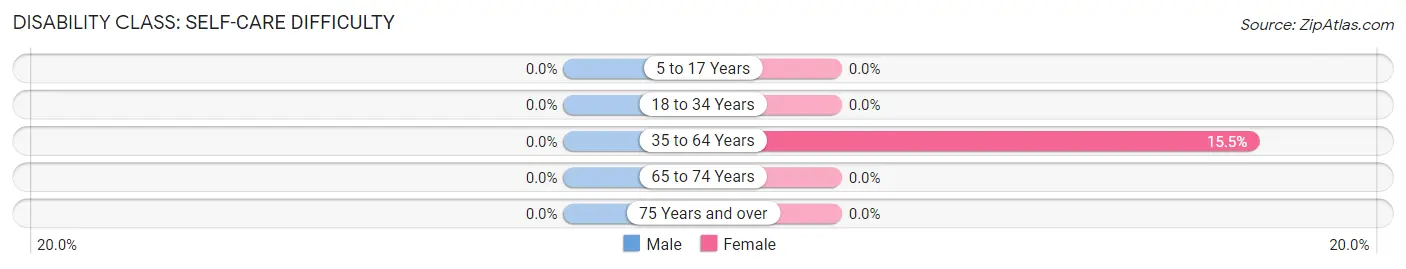
| Age Bracket | Male | Female |
| 5 to 17 Years | 0 (0.0%) | 0 (0.0%) |
| 18 to 34 Years | 0 (0.0%) | 0 (0.0%) |
| 35 to 64 Years | 0 (0.0%) | 11 (15.5%) |
| 65 to 74 Years | 0 (0.0%) | 0 (0.0%) |
| 75 Years and over | 0 (0.0%) | 0 (0.0%) |
Technology Access in Fairmount
Computing Device Access in Fairmount
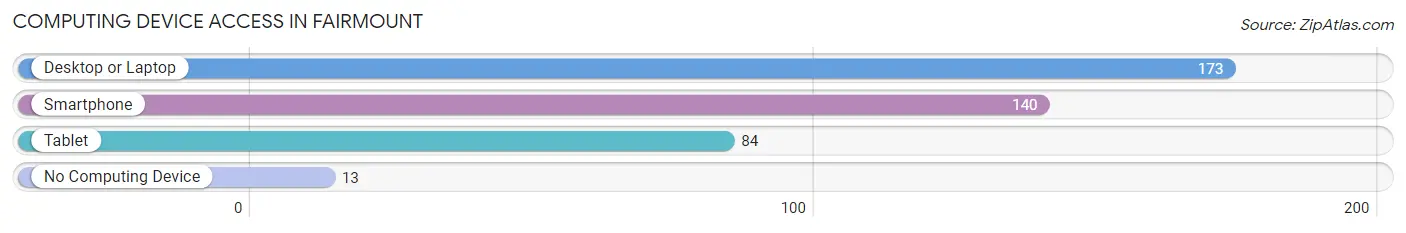
| Device Type | # Households | % Households |
| Desktop or Laptop | 173 | 93.0% |
| Smartphone | 140 | 75.3% |
| Tablet | 84 | 45.2% |
| No Computing Device | 13 | 7.0% |
| Total | 186 | 100.0% |
Internet Access in Fairmount
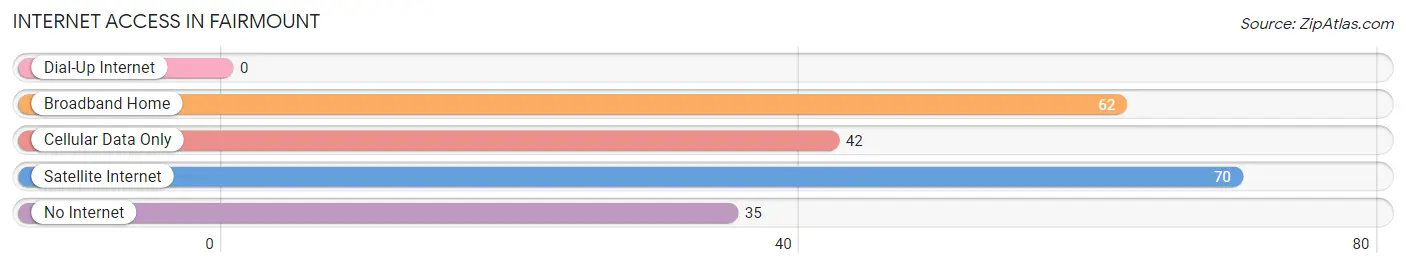
| Internet Type | # Households | % Households |
| Dial-Up Internet | 0 | 0.0% |
| Broadband Home | 62 | 33.3% |
| Cellular Data Only | 42 | 22.6% |
| Satellite Internet | 70 | 37.6% |
| No Internet | 35 | 18.8% |
| Total | 186 | 100.0% |
Fairmount Summary
History
The area now known as Fairmount, Maryland was first settled in the late 1700s by a group of German immigrants. The town was originally called “Germantown” and was located in what is now Montgomery County. The town was renamed “Fairmount” in 1845, after the nearby Fairmount Mansion. The mansion was built in 1790 by a wealthy landowner, and it served as a popular destination for visitors from the surrounding area.
In the late 1800s, Fairmount began to grow and develop as a small rural community. The town was home to a variety of businesses, including a general store, a blacksmith shop, and a post office. The town also had a school, a church, and a few other small businesses.
In the early 1900s, Fairmount began to experience a period of growth and prosperity. The town was home to a variety of industries, including a brickyard, a sawmill, and a canning factory. The town also had a number of stores, including a grocery store, a hardware store, and a drug store.
In the mid-1900s, Fairmount experienced a period of decline. The town’s industries began to close, and the population began to decline. In the late 1900s, the town began to experience a period of revitalization. The town was home to a variety of new businesses, including a restaurant, a bakery, and a coffee shop.
Geography
Fairmount is located in Montgomery County, Maryland. The town is situated in the northern part of the county, near the Potomac River. The town is bordered by the towns of Poolesville, Germantown, and Damascus. The town is located approximately 25 miles northwest of Washington, D.C.
The town of Fairmount is located in a rural area, and it is surrounded by rolling hills and farmland. The town is located in a valley, and it is surrounded by the Catoctin Mountains to the north and the Bull Run Mountains to the south. The town is located at an elevation of approximately 500 feet above sea level.
Economy
The economy of Fairmount is largely based on agriculture and tourism. The town is home to a variety of farms, including dairy farms, vegetable farms, and fruit farms. The town is also home to a number of wineries and breweries.
The town is also home to a variety of small businesses, including restaurants, cafes, and shops. The town is also home to a number of bed and breakfasts, which attract visitors from the surrounding area.
Demographics
As of the 2010 census, the population of Fairmount was 1,845. The town has a population density of approximately 1,000 people per square mile. The median age of the town’s population is 43.7 years.
The racial makeup of the town is 87.3% White, 8.2% African American, 0.7% Asian, 0.2% Native American, and 3.6% from other races. The town has a large Hispanic population, with approximately 15.3% of the population identifying as Hispanic or Latino.
The median household income in Fairmount is $76,250, and the median family income is $86,250. The town has a poverty rate of 8.3%. The town has a high rate of homeownership, with approximately 75% of the population owning their own homes.
Common Questions
What is Per Capita Income in Fairmount?
Per Capita income in Fairmount is $35,072.
What is the Median Family Income in Fairmount?
Median Family Income in Fairmount is $82,143.
What is the Median Household income in Fairmount?
Median Household Income in Fairmount is $66,250.
What is Income or Wage Gap in Fairmount?
Income or Wage Gap in Fairmount is 2.6%.
Women in Fairmount earn 97.4 cents for every dollar earned by a man.
What is Inequality or Gini Index in Fairmount?
Inequality or Gini Index in Fairmount is 0.31.
What is the Total Population of Fairmount?
Total Population of Fairmount is 410.
What is the Total Male Population of Fairmount?
Total Male Population of Fairmount is 168.
What is the Total Female Population of Fairmount?
Total Female Population of Fairmount is 242.
What is the Ratio of Males per 100 Females in Fairmount?
There are 69.42 Males per 100 Females in Fairmount.
What is the Ratio of Females per 100 Males in Fairmount?
There are 144.05 Females per 100 Males in Fairmount.
What is the Median Population Age in Fairmount?
Median Population Age in Fairmount is 55.7 Years.
What is the Average Family Size in Fairmount
Average Family Size in Fairmount is 2.7 People.
What is the Average Household Size in Fairmount
Average Household Size in Fairmount is 2.2 People.
How Large is the Labor Force in Fairmount?
There are 219 People in the Labor Forcein in Fairmount.
What is the Percentage of People in the Labor Force in Fairmount?
54.5% of People are in the Labor Force in Fairmount.
What is the Unemployment Rate in Fairmount?
Unemployment Rate in Fairmount is 13.7%.