Ocean Pines, MD Map & Demographics
Ocean Pines Map
Ocean Pines Overview
$50,886
PER CAPITA INCOME
$95,625
AVG FAMILY INCOME
$88,632
AVG HOUSEHOLD INCOME
17.6%
WAGE / INCOME GAP [ % ]
82.4¢/ $1
WAGE / INCOME GAP [ $ ]
0.40
INEQUALITY / GINI INDEX
12,312
TOTAL POPULATION
6,061
MALE POPULATION
6,251
FEMALE POPULATION
96.96
MALES / 100 FEMALES
103.13
FEMALES / 100 MALES
62.6
MEDIAN AGE
2.5
AVG FAMILY SIZE
2.1
AVG HOUSEHOLD SIZE
4,967
LABOR FORCE [ PEOPLE ]
45.1%
PERCENT IN LABOR FORCE
5.5%
UNEMPLOYMENT RATE
Income in Ocean Pines
Income Overview in Ocean Pines
Per Capita Income in Ocean Pines is $50,886, while median incomes of families and households are $95,625 and $88,632 respectively.
| Characteristic | Number | Measure |
| Per Capita Income | 12,312 | $50,886 |
| Median Family Income | 3,953 | $95,625 |
| Mean Family Income | 3,953 | $119,493 |
| Median Household Income | 5,787 | $88,632 |
| Mean Household Income | 5,787 | $107,323 |
| Income Deficit | 3,953 | $0 |
| Wage / Income Gap (%) | 12,312 | 17.59% |
| Wage / Income Gap ($) | 12,312 | 82.41¢ per $1 |
| Gini / Inequality Index | 12,312 | 0.40 |
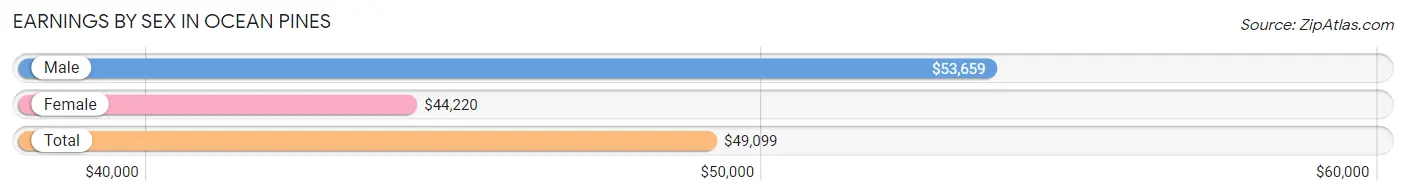
Earnings by Sex in Ocean Pines
Average Earnings in Ocean Pines are $49,099, $53,659 for men and $44,220 for women, a difference of 17.6%.
| Sex | Number | Average Earnings |
| Male | 3,039 (56.0%) | $53,659 |
| Female | 2,389 (44.0%) | $44,220 |
| Total | 5,428 (100.0%) | $49,099 |
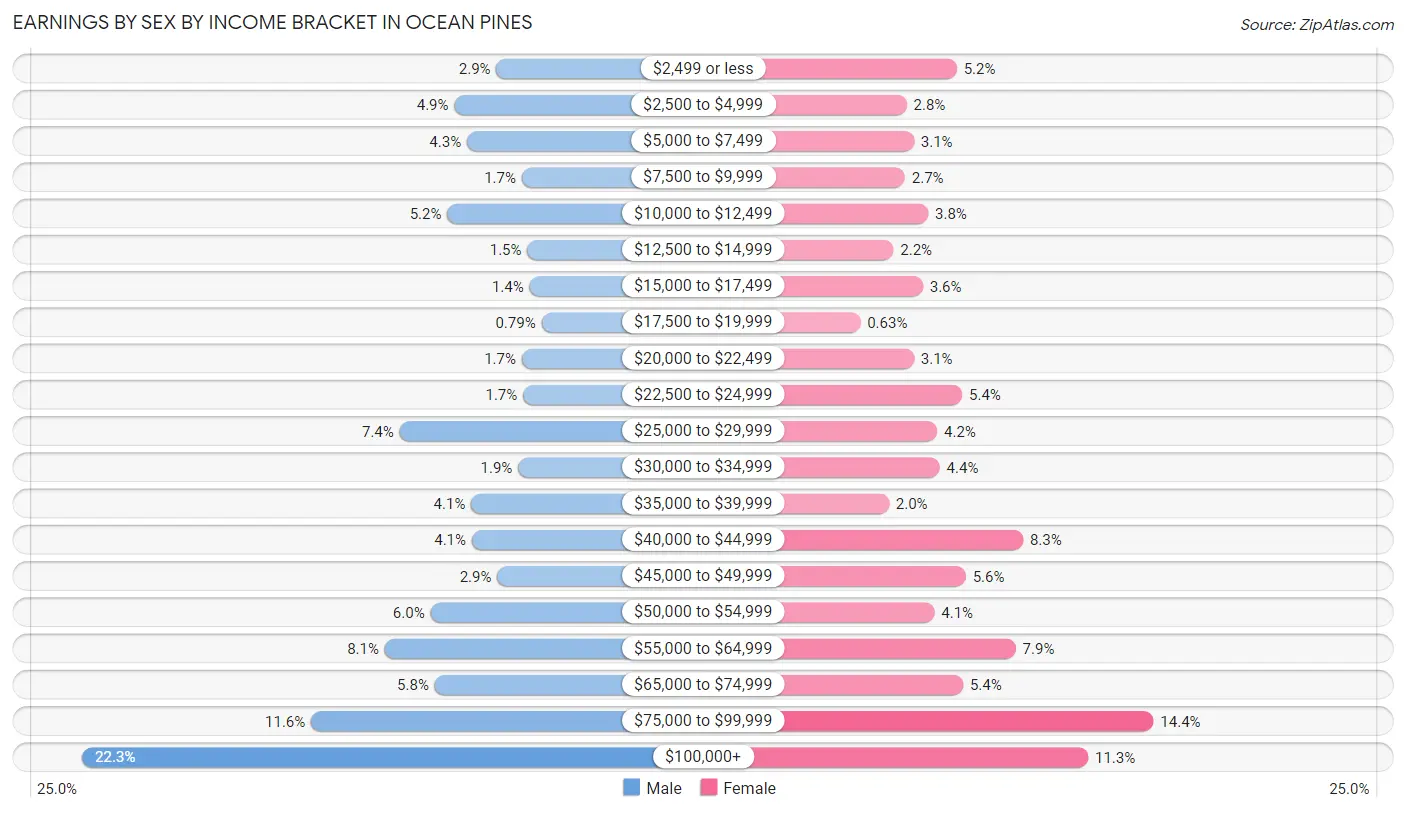
Earnings by Sex by Income Bracket in Ocean Pines
The most common earnings brackets in Ocean Pines are $100,000+ for men (678 | 22.3%) and $75,000 to $99,999 for women (343 | 14.4%).
| Income | Male | Female |
| $2,499 or less | 88 (2.9%) | 123 (5.1%) |
| $2,500 to $4,999 | 148 (4.9%) | 67 (2.8%) |
| $5,000 to $7,499 | 130 (4.3%) | 75 (3.1%) |
| $7,500 to $9,999 | 52 (1.7%) | 65 (2.7%) |
| $10,000 to $12,499 | 158 (5.2%) | 91 (3.8%) |
| $12,500 to $14,999 | 44 (1.5%) | 52 (2.2%) |
| $15,000 to $17,499 | 41 (1.3%) | 85 (3.6%) |
| $17,500 to $19,999 | 24 (0.8%) | 15 (0.6%) |
| $20,000 to $22,499 | 52 (1.7%) | 75 (3.1%) |
| $22,500 to $24,999 | 50 (1.7%) | 129 (5.4%) |
| $25,000 to $29,999 | 226 (7.4%) | 101 (4.2%) |
| $30,000 to $34,999 | 57 (1.9%) | 104 (4.3%) |
| $35,000 to $39,999 | 124 (4.1%) | 47 (2.0%) |
| $40,000 to $44,999 | 123 (4.1%) | 197 (8.3%) |
| $45,000 to $49,999 | 87 (2.9%) | 133 (5.6%) |
| $50,000 to $54,999 | 182 (6.0%) | 98 (4.1%) |
| $55,000 to $64,999 | 247 (8.1%) | 189 (7.9%) |
| $65,000 to $74,999 | 176 (5.8%) | 130 (5.4%) |
| $75,000 to $99,999 | 352 (11.6%) | 343 (14.4%) |
| $100,000+ | 678 (22.3%) | 270 (11.3%) |
| Total | 3,039 (100.0%) | 2,389 (100.0%) |
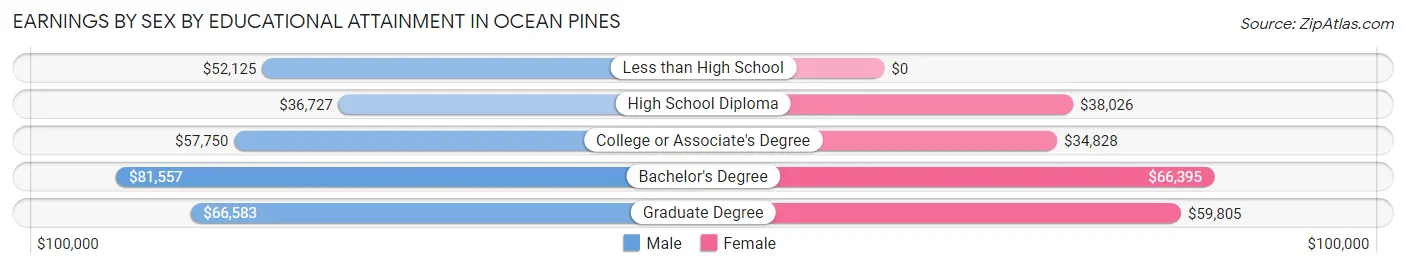
Earnings by Sex by Educational Attainment in Ocean Pines
Average earnings in Ocean Pines are $54,970 for men and $47,850 for women, a difference of 13.0%. Men with an educational attainment of bachelor's degree enjoy the highest average annual earnings of $81,557, while those with high school diploma education earn the least with $36,727. Women with an educational attainment of bachelor's degree earn the most with the average annual earnings of $66,395, while those with college or associate's degree education have the smallest earnings of $34,828.
| Educational Attainment | Male Income | Female Income |
| Less than High School | $52,125 | $0 |
| High School Diploma | $36,727 | $38,026 |
| College or Associate's Degree | $57,750 | $34,828 |
| Bachelor's Degree | $81,557 | $66,395 |
| Graduate Degree | $66,583 | $59,805 |
| Total | $54,970 | $47,850 |
Family Income in Ocean Pines
Family Income Brackets in Ocean Pines
According to the Ocean Pines family income data, there are 885 families falling into the $100,000 to $149,999 income range, which is the most common income bracket and makes up 22.4% of all families. Conversely, the $10,000 to $14,999 income bracket is the least frequent group with only 12 families (0.3%) belonging to this category.
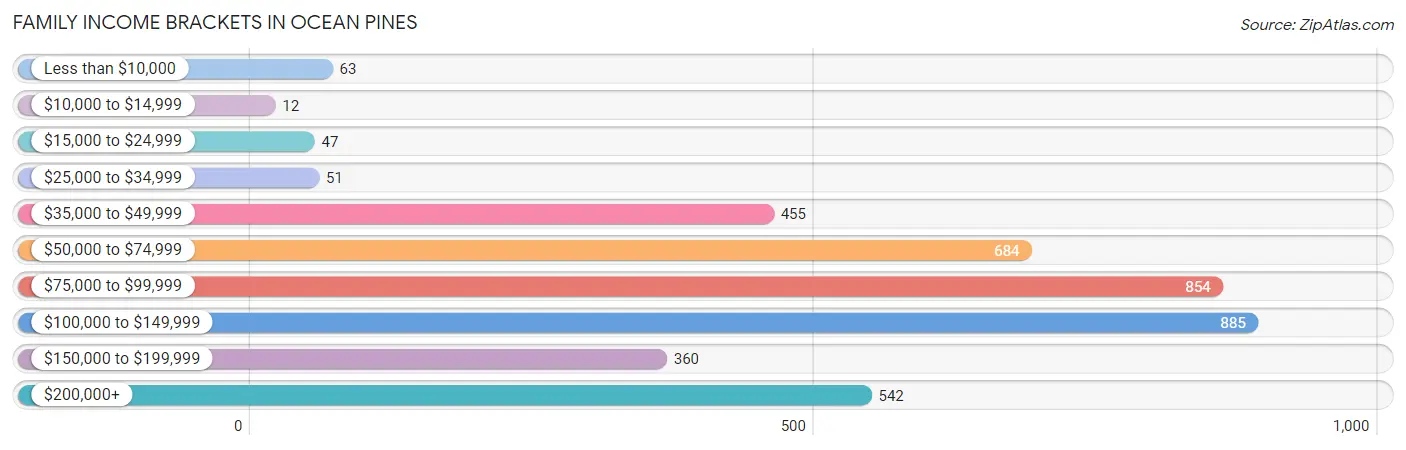
| Income Bracket | # Families | % Families |
| Less than $10,000 | 63 | 1.6% |
| $10,000 to $14,999 | 12 | 0.3% |
| $15,000 to $24,999 | 47 | 1.2% |
| $25,000 to $34,999 | 51 | 1.3% |
| $35,000 to $49,999 | 455 | 11.5% |
| $50,000 to $74,999 | 684 | 17.3% |
| $75,000 to $99,999 | 854 | 21.6% |
| $100,000 to $149,999 | 885 | 22.4% |
| $150,000 to $199,999 | 360 | 9.1% |
| $200,000+ | 542 | 13.7% |
Family Income by Famaliy Size in Ocean Pines
4-person families (219 | 5.5%) account for the highest median family income in Ocean Pines with $99,656 per family, while 2-person families (2,677 | 67.7%) have the highest median income of $47,264 per family member.
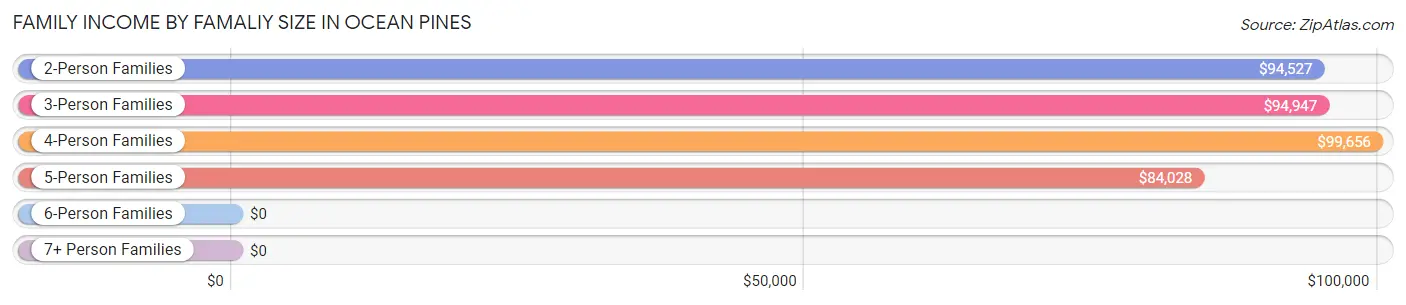
| Income Bracket | # Families | Median Income |
| 2-Person Families | 2,677 (67.7%) | $94,527 |
| 3-Person Families | 828 (20.9%) | $94,947 |
| 4-Person Families | 219 (5.5%) | $99,656 |
| 5-Person Families | 150 (3.8%) | $84,028 |
| 6-Person Families | 42 (1.1%) | $0 |
| 7+ Person Families | 37 (0.9%) | $0 |
| Total | 3,953 (100.0%) | $95,625 |
Family Income by Number of Earners in Ocean Pines
The median family income in Ocean Pines is $95,625, with families comprising 3+ earners (135) having the highest median family income of $157,917, while families with no earners (1,261) have the lowest median family income of $69,906, accounting for 3.4% and 31.9% of families, respectively.
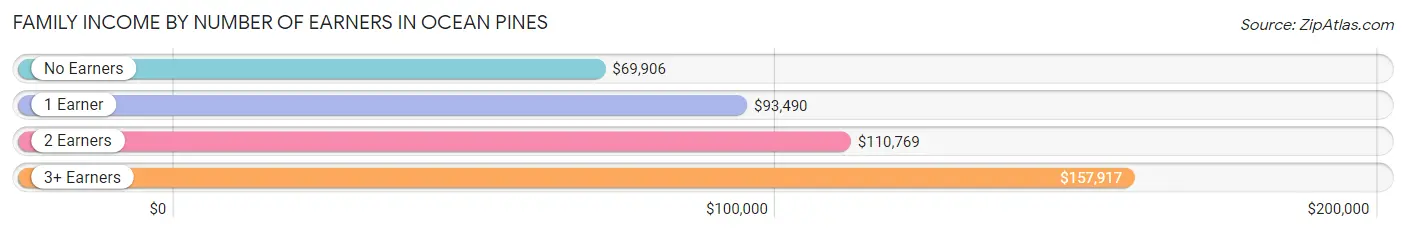
| Number of Earners | # Families | Median Income |
| No Earners | 1,261 (31.9%) | $69,906 |
| 1 Earner | 1,215 (30.7%) | $93,490 |
| 2 Earners | 1,342 (34.0%) | $110,769 |
| 3+ Earners | 135 (3.4%) | $157,917 |
| Total | 3,953 (100.0%) | $95,625 |
Household Income in Ocean Pines
Household Income Brackets in Ocean Pines
With 1,198 households falling in the category, the $100,000 to $149,999 income range is the most frequent in Ocean Pines, accounting for 20.7% of all households. In contrast, only 69 households (1.2%) fall into the $10,000 to $14,999 income bracket, making it the least populous group.
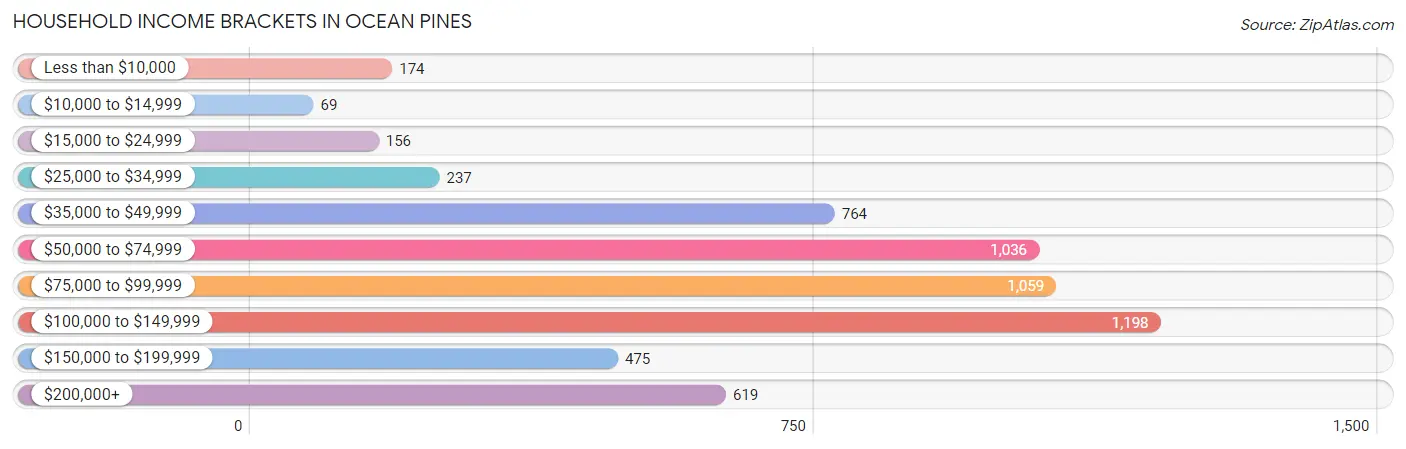
| Income Bracket | # Households | % Households |
| Less than $10,000 | 174 | 3.0% |
| $10,000 to $14,999 | 69 | 1.2% |
| $15,000 to $24,999 | 156 | 2.7% |
| $25,000 to $34,999 | 237 | 4.1% |
| $35,000 to $49,999 | 764 | 13.2% |
| $50,000 to $74,999 | 1,036 | 17.9% |
| $75,000 to $99,999 | 1,059 | 18.3% |
| $100,000 to $149,999 | 1,198 | 20.7% |
| $150,000 to $199,999 | 475 | 8.2% |
| $200,000+ | 619 | 10.7% |
Household Income by Householder Age in Ocean Pines
The median household income in Ocean Pines is $88,632, with the highest median household income of $103,578 found in the 25 to 44 years age bracket for the primary householder. A total of 783 households (13.5%) fall into this category. Meanwhile, the 15 to 24 years age bracket for the primary householder has the lowest median household income of $0, with 27 households (0.5%) in this group.
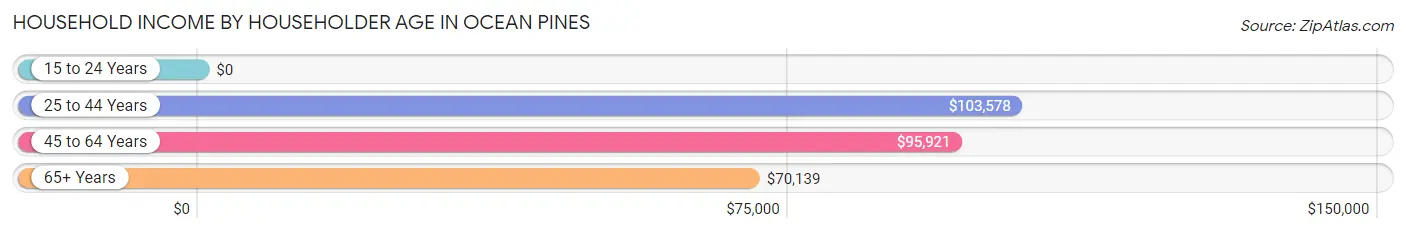
| Income Bracket | # Households | Median Income |
| 15 to 24 Years | 27 (0.5%) | $0 |
| 25 to 44 Years | 783 (13.5%) | $103,578 |
| 45 to 64 Years | 1,794 (31.0%) | $95,921 |
| 65+ Years | 3,183 (55.0%) | $70,139 |
| Total | 5,787 (100.0%) | $88,632 |
Poverty in Ocean Pines
Income Below Poverty by Sex and Age in Ocean Pines
With 3.3% poverty level for males and 5.5% for females among the residents of Ocean Pines, 18 to 24 year old males and 15 year old females are the most vulnerable to poverty, with 44 males (23.3%) and 9 females (25.0%) in their respective age groups living below the poverty level.
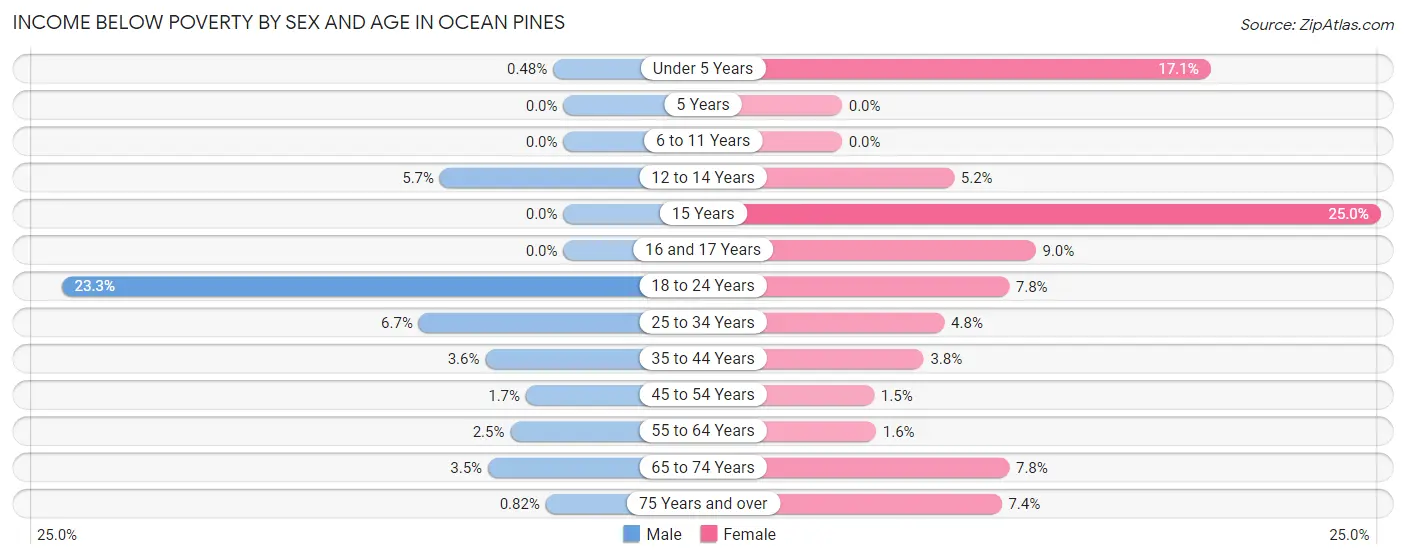
| Age Bracket | Male | Female |
| Under 5 Years | 1 (0.5%) | 26 (17.1%) |
| 5 Years | 0 (0.0%) | 0 (0.0%) |
| 6 to 11 Years | 0 (0.0%) | 0 (0.0%) |
| 12 to 14 Years | 9 (5.7%) | 9 (5.2%) |
| 15 Years | 0 (0.0%) | 9 (25.0%) |
| 16 and 17 Years | 0 (0.0%) | 8 (9.0%) |
| 18 to 24 Years | 44 (23.3%) | 10 (7.7%) |
| 25 to 34 Years | 31 (6.7%) | 25 (4.8%) |
| 35 to 44 Years | 18 (3.6%) | 13 (3.8%) |
| 45 to 54 Years | 10 (1.7%) | 8 (1.5%) |
| 55 to 64 Years | 28 (2.5%) | 17 (1.6%) |
| 65 to 74 Years | 49 (3.5%) | 123 (7.8%) |
| 75 Years and over | 9 (0.8%) | 93 (7.4%) |
| Total | 199 (3.3%) | 341 (5.5%) |
Income Above Poverty by Sex and Age in Ocean Pines
According to the poverty statistics in Ocean Pines, males aged 5 years and females aged 5 years are the age groups that are most secure financially, with 100.0% of males and 100.0% of females in these age groups living above the poverty line.
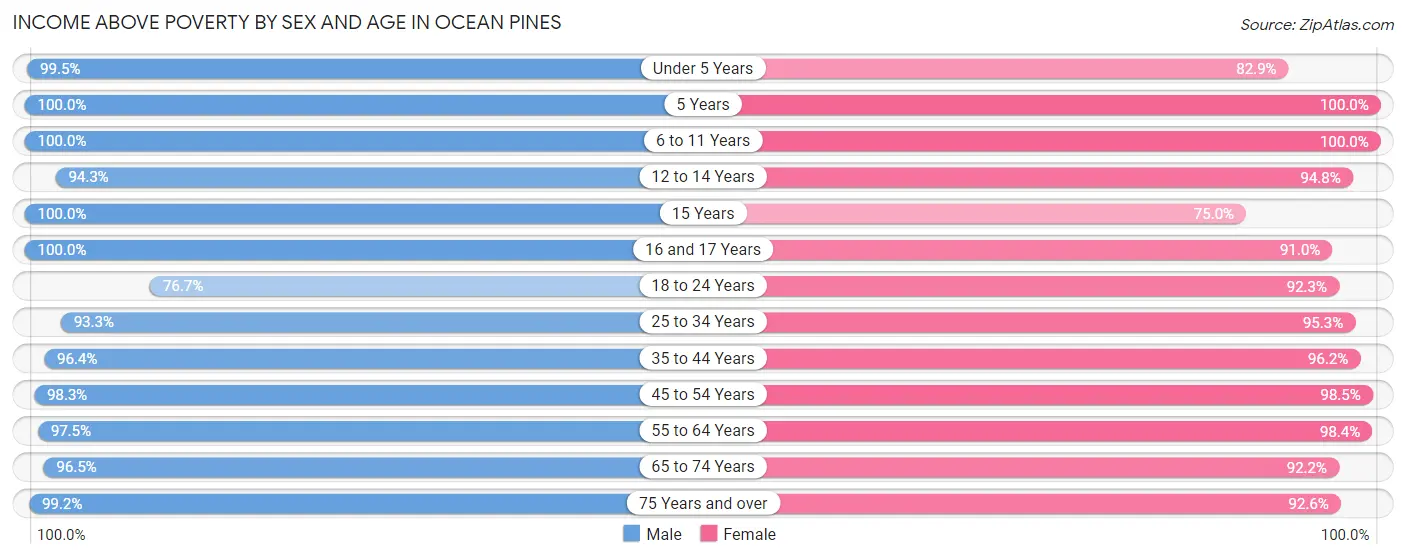
| Age Bracket | Male | Female |
| Under 5 Years | 208 (99.5%) | 126 (82.9%) |
| 5 Years | 37 (100.0%) | 43 (100.0%) |
| 6 to 11 Years | 130 (100.0%) | 293 (100.0%) |
| 12 to 14 Years | 148 (94.3%) | 164 (94.8%) |
| 15 Years | 42 (100.0%) | 27 (75.0%) |
| 16 and 17 Years | 80 (100.0%) | 81 (91.0%) |
| 18 to 24 Years | 145 (76.7%) | 119 (92.2%) |
| 25 to 34 Years | 431 (93.3%) | 501 (95.3%) |
| 35 to 44 Years | 479 (96.4%) | 330 (96.2%) |
| 45 to 54 Years | 566 (98.3%) | 530 (98.5%) |
| 55 to 64 Years | 1,110 (97.5%) | 1,061 (98.4%) |
| 65 to 74 Years | 1,353 (96.5%) | 1,462 (92.2%) |
| 75 Years and over | 1,083 (99.2%) | 1,162 (92.6%) |
| Total | 5,812 (96.7%) | 5,899 (94.5%) |
Income Below Poverty Among Married-Couple Families in Ocean Pines
The poverty statistics for married-couple families in Ocean Pines show that 1.6% or 50 of the total 3,156 families live below the poverty line. Families with 1 or 2 children have the highest poverty rate of 2.9%, comprising of 13 families. On the other hand, families with 3 or 4 children have the lowest poverty rate of 0.0%, which includes 0 families.
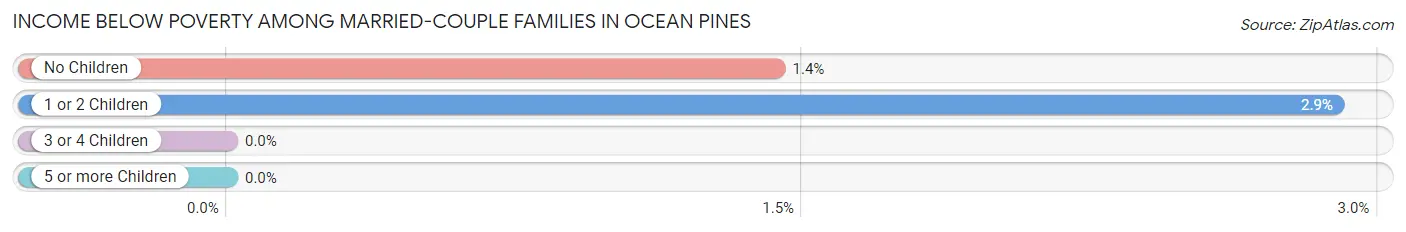
| Children | Above Poverty | Below Poverty |
| No Children | 2,554 (98.6%) | 37 (1.4%) |
| 1 or 2 Children | 437 (97.1%) | 13 (2.9%) |
| 3 or 4 Children | 110 (100.0%) | 0 (0.0%) |
| 5 or more Children | 5 (100.0%) | 0 (0.0%) |
| Total | 3,106 (98.4%) | 50 (1.6%) |
Income Below Poverty Among Single-Parent Households in Ocean Pines
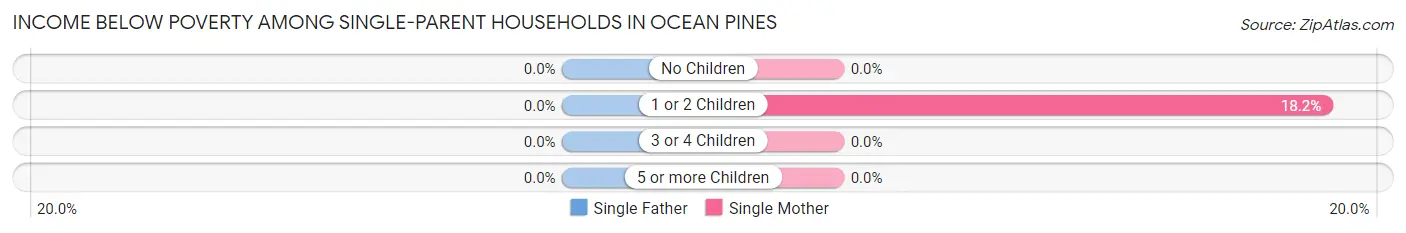
| Children | Single Father | Single Mother |
| No Children | 0 (0.0%) | 0 (0.0%) |
| 1 or 2 Children | 0 (0.0%) | 33 (18.2%) |
| 3 or 4 Children | 0 (0.0%) | 0 (0.0%) |
| 5 or more Children | 0 (0.0%) | 0 (0.0%) |
| Total | 0 (0.0%) | 33 (5.3%) |
Income Below Poverty Among Married-Couple vs Single-Parent Households in Ocean Pines
The poverty data for Ocean Pines shows that 50 of the married-couple family households (1.6%) and 33 of the single-parent households (4.1%) are living below the poverty level. Within the married-couple family households, those with 1 or 2 children have the highest poverty rate, with 13 households (2.9%) falling below the poverty line. Among the single-parent households, those with 1 or 2 children have the highest poverty rate, with 33 household (11.6%) living below poverty.
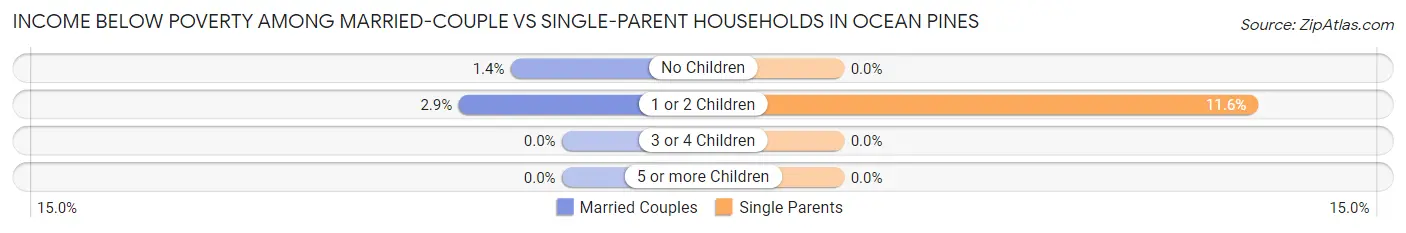
| Children | Married-Couple Families | Single-Parent Households |
| No Children | 37 (1.4%) | 0 (0.0%) |
| 1 or 2 Children | 13 (2.9%) | 33 (11.6%) |
| 3 or 4 Children | 0 (0.0%) | 0 (0.0%) |
| 5 or more Children | 0 (0.0%) | 0 (0.0%) |
| Total | 50 (1.6%) | 33 (4.1%) |
Race in Ocean Pines
The most populous races in Ocean Pines are White / Caucasian (11,131 | 90.4%), Asian (425 | 3.5%), and Hispanic or Latino (414 | 3.4%).
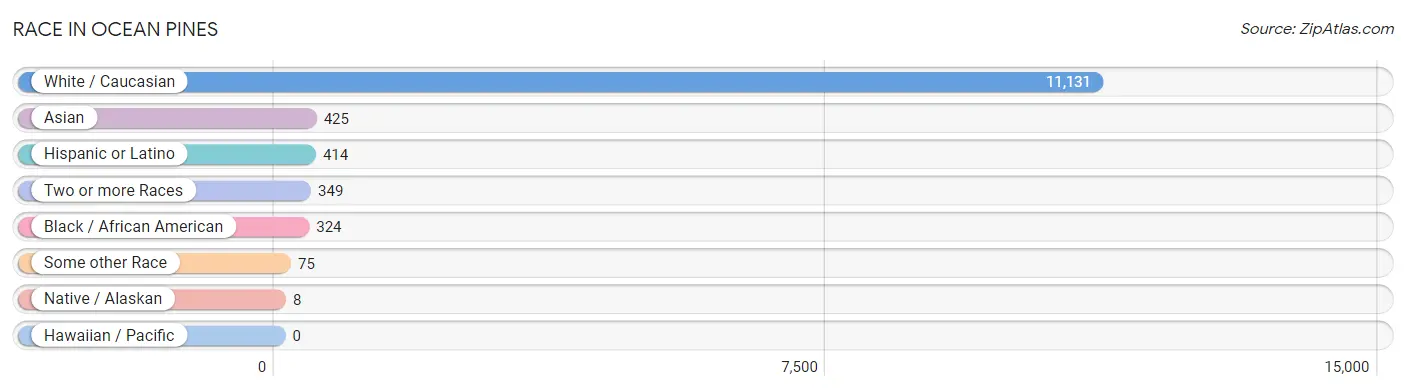
| Race | # Population | % Population |
| Asian | 425 | 3.5% |
| Black / African American | 324 | 2.6% |
| Hawaiian / Pacific | 0 | 0.0% |
| Hispanic or Latino | 414 | 3.4% |
| Native / Alaskan | 8 | 0.1% |
| White / Caucasian | 11,131 | 90.4% |
| Two or more Races | 349 | 2.8% |
| Some other Race | 75 | 0.6% |
| Total | 12,312 | 100.0% |
Ancestry in Ocean Pines
The most populous ancestries reported in Ocean Pines are German (2,901 | 23.6%), Irish (2,677 | 21.7%), English (1,720 | 14.0%), Italian (866 | 7.0%), and American (669 | 5.4%), together accounting for 71.7% of all Ocean Pines residents.
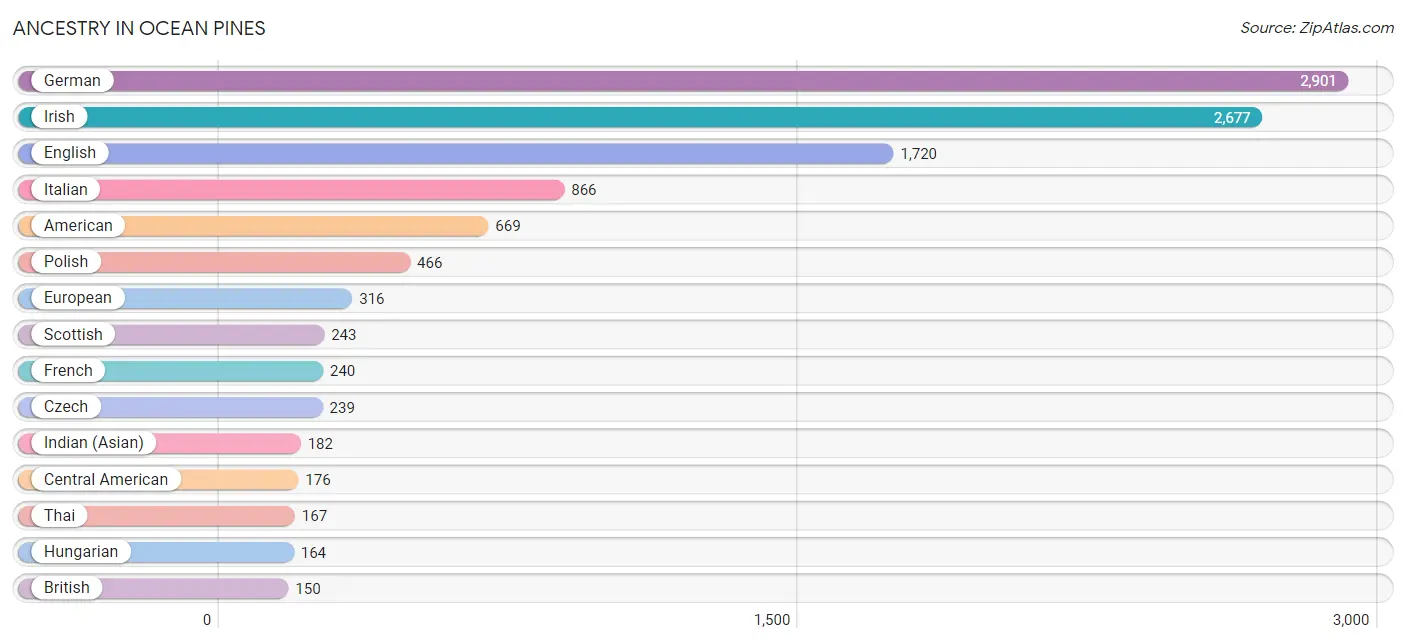
| Ancestry | # Population | % Population |
| Albanian | 13 | 0.1% |
| American | 669 | 5.4% |
| Arab | 53 | 0.4% |
| Austrian | 60 | 0.5% |
| Bhutanese | 63 | 0.5% |
| British | 150 | 1.2% |
| Canadian | 15 | 0.1% |
| Central American | 176 | 1.4% |
| Czech | 239 | 1.9% |
| Czechoslovakian | 21 | 0.2% |
| Delaware | 13 | 0.1% |
| Dutch | 103 | 0.8% |
| Eastern European | 15 | 0.1% |
| English | 1,720 | 14.0% |
| European | 316 | 2.6% |
| Filipino | 17 | 0.1% |
| French | 240 | 1.9% |
| French Canadian | 94 | 0.8% |
| German | 2,901 | 23.6% |
| Greek | 147 | 1.2% |
| Haitian | 10 | 0.1% |
| Hungarian | 164 | 1.3% |
| Icelander | 3 | 0.0% |
| Indian (Asian) | 182 | 1.5% |
| Irish | 2,677 | 21.7% |
| Italian | 866 | 7.0% |
| Korean | 83 | 0.7% |
| Latvian | 16 | 0.1% |
| Lebanese | 53 | 0.4% |
| Lithuanian | 64 | 0.5% |
| Lumbee | 6 | 0.1% |
| Macedonian | 12 | 0.1% |
| Maltese | 142 | 1.1% |
| Mexican | 48 | 0.4% |
| Nicaraguan | 47 | 0.4% |
| Nigerian | 41 | 0.3% |
| Norwegian | 17 | 0.1% |
| Peruvian | 77 | 0.6% |
| Polish | 466 | 3.8% |
| Portuguese | 32 | 0.3% |
| Puerto Rican | 33 | 0.3% |
| Romanian | 31 | 0.3% |
| Russian | 127 | 1.0% |
| Salvadoran | 129 | 1.1% |
| Scandinavian | 17 | 0.1% |
| Scotch-Irish | 92 | 0.7% |
| Scottish | 243 | 2.0% |
| Serbian | 9 | 0.1% |
| Slavic | 14 | 0.1% |
| Slovak | 71 | 0.6% |
| Slovene | 9 | 0.1% |
| South American | 77 | 0.6% |
| Spaniard | 12 | 0.1% |
| Spanish | 68 | 0.5% |
| Sri Lankan | 48 | 0.4% |
| Subsaharan African | 41 | 0.3% |
| Swedish | 84 | 0.7% |
| Swiss | 11 | 0.1% |
| Thai | 167 | 1.4% |
| Ukrainian | 16 | 0.1% |
| Welsh | 84 | 0.7% | View All 61 Rows |
Immigrants in Ocean Pines
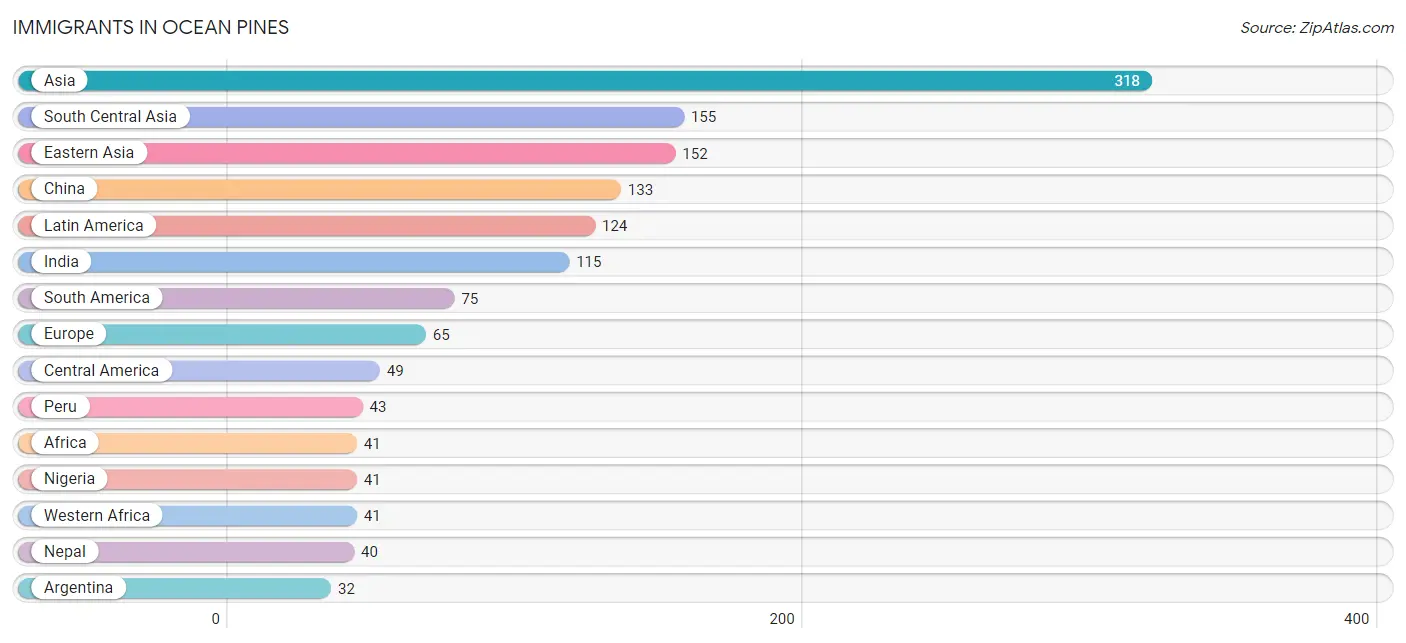
The most numerous immigrant groups reported in Ocean Pines came from Asia (318 | 2.6%), South Central Asia (155 | 1.3%), Eastern Asia (152 | 1.2%), China (133 | 1.1%), and Latin America (124 | 1.0%), together accounting for 7.2% of all Ocean Pines residents.
| Immigration Origin | # Population | % Population |
| Africa | 41 | 0.3% |
| Argentina | 32 | 0.3% |
| Asia | 318 | 2.6% |
| Canada | 26 | 0.2% |
| Central America | 49 | 0.4% |
| China | 133 | 1.1% |
| Eastern Asia | 152 | 1.2% |
| Eastern Europe | 27 | 0.2% |
| El Salvador | 22 | 0.2% |
| England | 6 | 0.1% |
| Europe | 65 | 0.5% |
| Germany | 21 | 0.2% |
| India | 115 | 0.9% |
| Italy | 10 | 0.1% |
| Japan | 19 | 0.2% |
| Latin America | 124 | 1.0% |
| Mexico | 17 | 0.1% |
| Nepal | 40 | 0.3% |
| Nicaragua | 10 | 0.1% |
| Nigeria | 41 | 0.3% |
| Northern Europe | 7 | 0.1% |
| Peru | 43 | 0.4% |
| Romania | 18 | 0.2% |
| Serbia | 9 | 0.1% |
| South America | 75 | 0.6% |
| South Central Asia | 155 | 1.3% |
| Southern Europe | 10 | 0.1% |
| Taiwan | 17 | 0.1% |
| Turkey | 11 | 0.1% |
| Western Africa | 41 | 0.3% |
| Western Asia | 11 | 0.1% |
| Western Europe | 21 | 0.2% | View All 32 Rows |
Sex and Age in Ocean Pines
Sex and Age in Ocean Pines
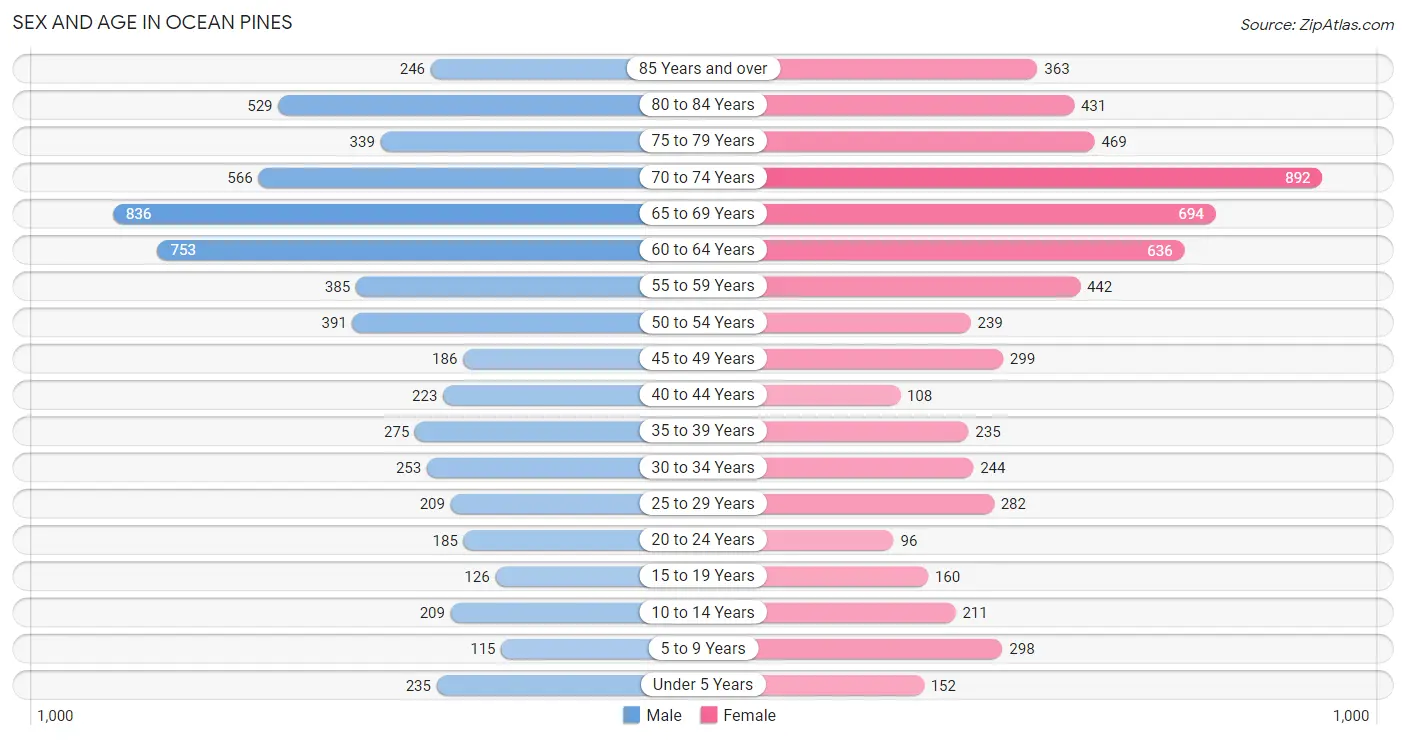
The most populous age groups in Ocean Pines are 65 to 69 Years (836 | 13.8%) for men and 70 to 74 Years (892 | 14.3%) for women.
| Age Bracket | Male | Female |
| Under 5 Years | 235 (3.9%) | 152 (2.4%) |
| 5 to 9 Years | 115 (1.9%) | 298 (4.8%) |
| 10 to 14 Years | 209 (3.5%) | 211 (3.4%) |
| 15 to 19 Years | 126 (2.1%) | 160 (2.6%) |
| 20 to 24 Years | 185 (3.0%) | 96 (1.5%) |
| 25 to 29 Years | 209 (3.5%) | 282 (4.5%) |
| 30 to 34 Years | 253 (4.2%) | 244 (3.9%) |
| 35 to 39 Years | 275 (4.5%) | 235 (3.8%) |
| 40 to 44 Years | 223 (3.7%) | 108 (1.7%) |
| 45 to 49 Years | 186 (3.1%) | 299 (4.8%) |
| 50 to 54 Years | 391 (6.5%) | 239 (3.8%) |
| 55 to 59 Years | 385 (6.4%) | 442 (7.1%) |
| 60 to 64 Years | 753 (12.4%) | 636 (10.2%) |
| 65 to 69 Years | 836 (13.8%) | 694 (11.1%) |
| 70 to 74 Years | 566 (9.3%) | 892 (14.3%) |
| 75 to 79 Years | 339 (5.6%) | 469 (7.5%) |
| 80 to 84 Years | 529 (8.7%) | 431 (6.9%) |
| 85 Years and over | 246 (4.1%) | 363 (5.8%) |
| Total | 6,061 (100.0%) | 6,251 (100.0%) |
Families and Households in Ocean Pines
Median Family Size in Ocean Pines
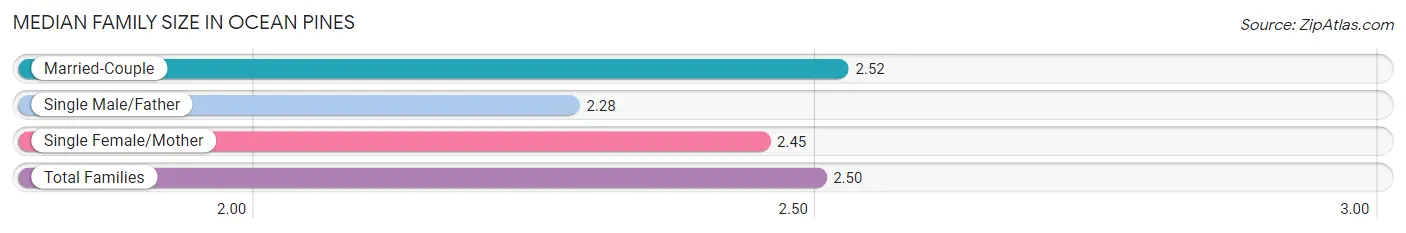
The median family size in Ocean Pines is 2.50 persons per family, with married-couple families (3,156 | 79.8%) accounting for the largest median family size of 2.52 persons per family. On the other hand, single male/father families (179 | 4.5%) represent the smallest median family size with 2.28 persons per family.
| Family Type | # Families | Family Size |
| Married-Couple | 3,156 (79.8%) | 2.52 |
| Single Male/Father | 179 (4.5%) | 2.28 |
| Single Female/Mother | 618 (15.6%) | 2.45 |
| Total Families | 3,953 (100.0%) | 2.50 |
Median Household Size in Ocean Pines
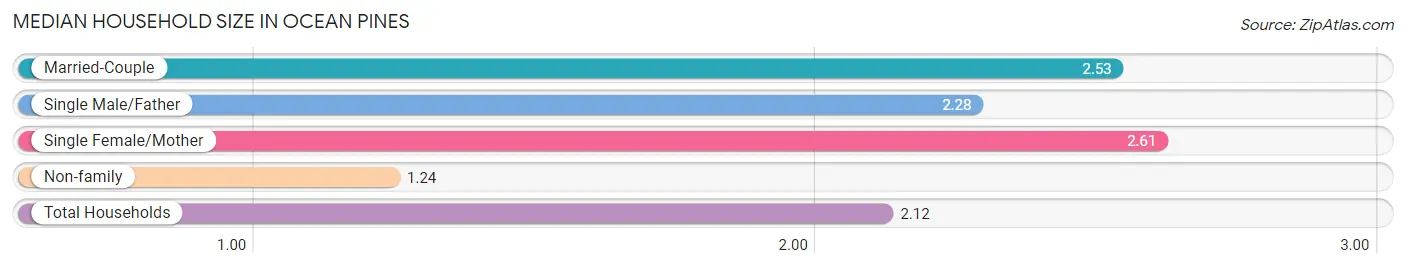
The median household size in Ocean Pines is 2.12 persons per household, with single female/mother households (618 | 10.7%) accounting for the largest median household size of 2.61 persons per household. non-family households (1,834 | 31.7%) represent the smallest median household size with 1.24 persons per household.
| Household Type | # Households | Household Size |
| Married-Couple | 3,156 (54.5%) | 2.53 |
| Single Male/Father | 179 (3.1%) | 2.28 |
| Single Female/Mother | 618 (10.7%) | 2.61 |
| Non-family | 1,834 (31.7%) | 1.24 |
| Total Households | 5,787 (100.0%) | 2.12 |
Household Size by Marriage Status in Ocean Pines
Out of a total of 5,787 households in Ocean Pines, 3,953 (68.3%) are family households, while 1,834 (31.7%) are nonfamily households. The most numerous type of family households are 2-person households, comprising 2,629, and the most common type of nonfamily households are 1-person households, comprising 1,476.
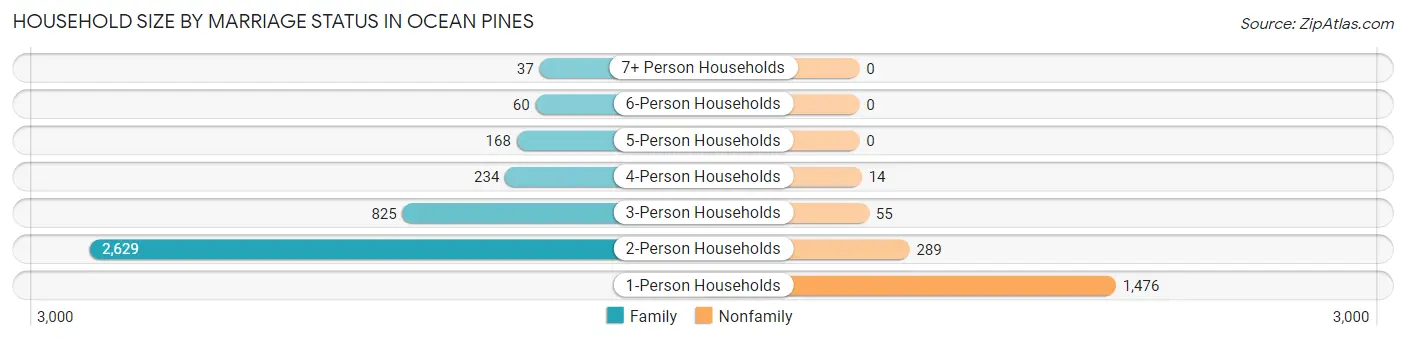
| Household Size | Family Households | Nonfamily Households |
| 1-Person Households | - | 1,476 (25.5%) |
| 2-Person Households | 2,629 (45.4%) | 289 (5.0%) |
| 3-Person Households | 825 (14.3%) | 55 (0.9%) |
| 4-Person Households | 234 (4.0%) | 14 (0.2%) |
| 5-Person Households | 168 (2.9%) | 0 (0.0%) |
| 6-Person Households | 60 (1.0%) | 0 (0.0%) |
| 7+ Person Households | 37 (0.6%) | 0 (0.0%) |
| Total | 3,953 (68.3%) | 1,834 (31.7%) |
Female Fertility in Ocean Pines
Fertility by Age in Ocean Pines
Average fertility rate in Ocean Pines is 93.0 births per 1,000 women. Women in the age bracket of 20 to 34 years have the highest fertility rate with 138.0 births per 1,000 women. Women in the age bracket of 20 to 34 years acount for 62.3% of all women with births.
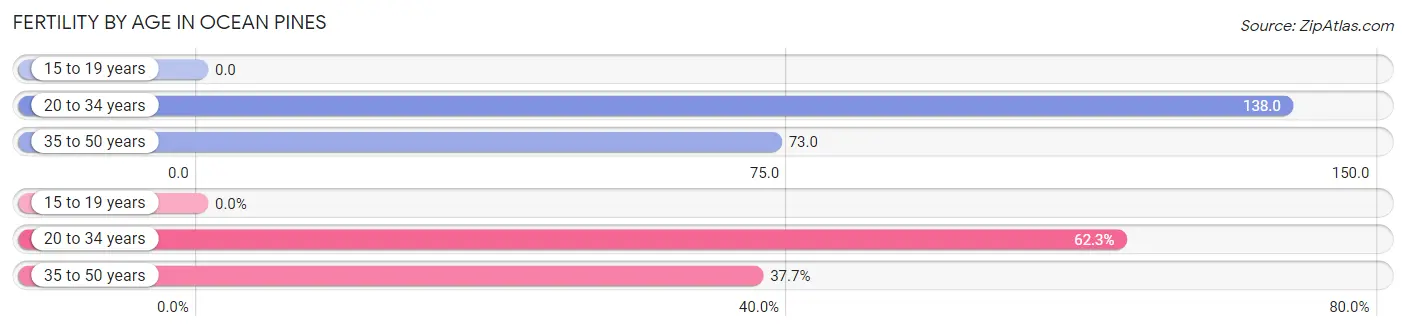
| Age Bracket | Women with Births | Births / 1,000 Women |
| 15 to 19 years | 0 (0.0%) | 0.0 |
| 20 to 34 years | 86 (62.3%) | 138.0 |
| 35 to 50 years | 52 (37.7%) | 73.0 |
| Total | 138 (100.0%) | 93.0 |
Fertility by Age by Marriage Status in Ocean Pines
70.3% of women with births (138) in Ocean Pines are married. The highest percentage of unmarried women with births falls into 20 to 34 years age bracket with 47.7% of them unmarried at the time of birth, while the lowest percentage of unmarried women with births belong to 35 to 50 years age bracket with 0.0% of them unmarried.
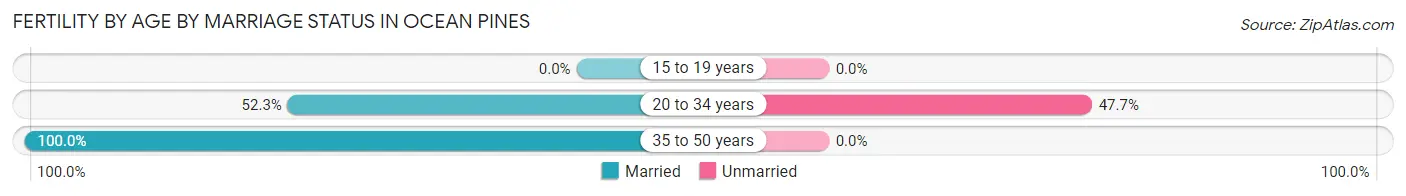
| Age Bracket | Married | Unmarried |
| 15 to 19 years | 0 (0.0%) | 0 (0.0%) |
| 20 to 34 years | 45 (52.3%) | 41 (47.7%) |
| 35 to 50 years | 52 (100.0%) | 0 (0.0%) |
| Total | 97 (70.3%) | 41 (29.7%) |
Fertility by Education in Ocean Pines
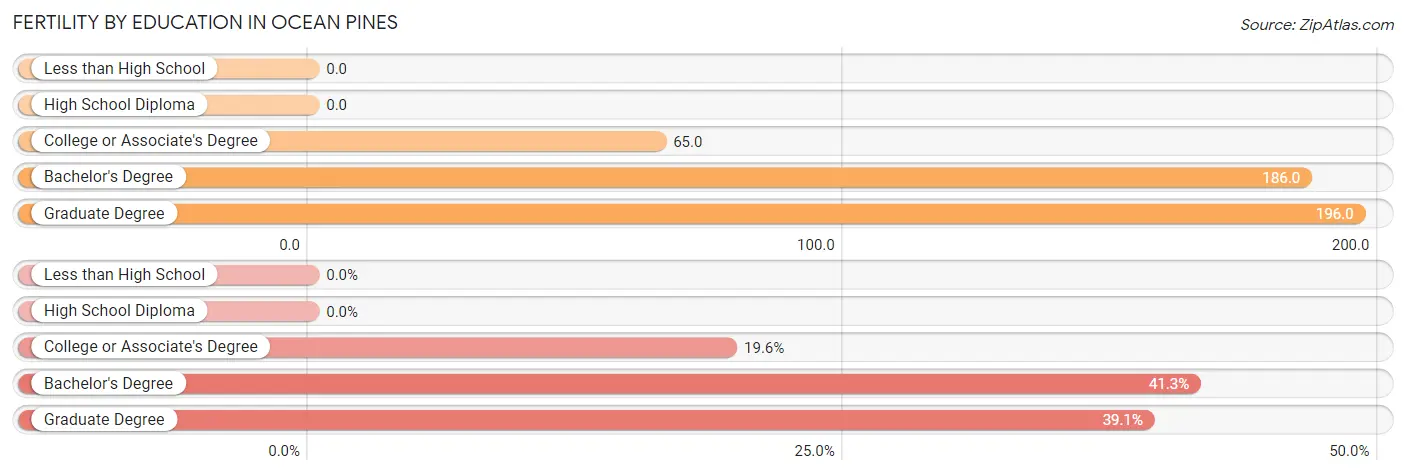
| Educational Attainment | Women with Births | Births / 1,000 Women |
| Less than High School | 0 (0.0%) | 0.0 |
| High School Diploma | 0 (0.0%) | 0.0 |
| College or Associate's Degree | 27 (19.6%) | 65.0 |
| Bachelor's Degree | 57 (41.3%) | 186.0 |
| Graduate Degree | 54 (39.1%) | 196.0 |
| Total | 138 (100.0%) | 93.0 |
Fertility by Education by Marriage Status in Ocean Pines
29.7% of women with births in Ocean Pines are unmarried. Women with the educational attainment of graduate degree are most likely to be married with 100.0% of them married at childbirth, while women with the educational attainment of college or associate's degree are least likely to be married with 92.6% of them unmarried at childbirth.
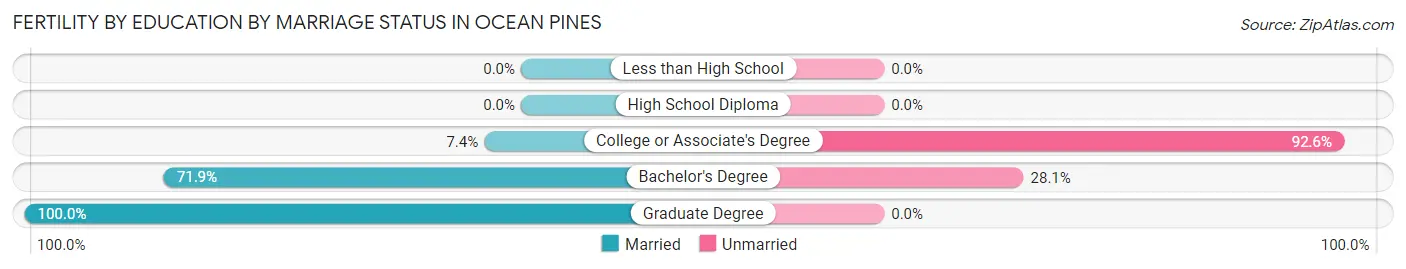
| Educational Attainment | Married | Unmarried |
| Less than High School | 0 (0.0%) | 0 (0.0%) |
| High School Diploma | 0 (0.0%) | 0 (0.0%) |
| College or Associate's Degree | 2 (7.4%) | 25 (92.6%) |
| Bachelor's Degree | 41 (71.9%) | 16 (28.1%) |
| Graduate Degree | 54 (100.0%) | 0 (0.0%) |
| Total | 97 (70.3%) | 41 (29.7%) |
Employment Characteristics in Ocean Pines
Employment by Class of Employer in Ocean Pines
Among the 4,644 employed individuals in Ocean Pines, private company employees (3,184 | 68.6%), not-for-profit organizations (310 | 6.7%), and self-employed (not incorporated) (298 | 6.4%) make up the most common classes of employment.
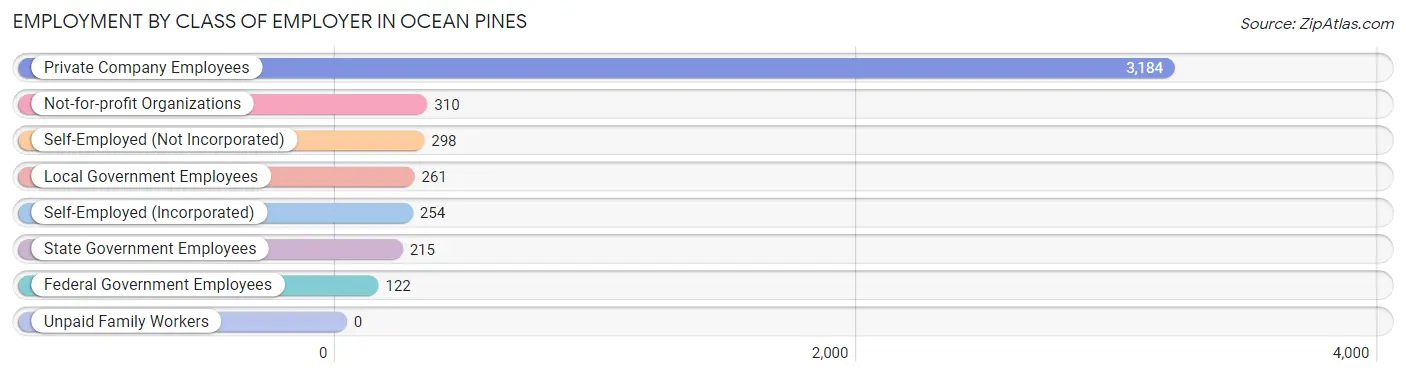
| Employer Class | # Employees | % Employees |
| Private Company Employees | 3,184 | 68.6% |
| Self-Employed (Incorporated) | 254 | 5.5% |
| Self-Employed (Not Incorporated) | 298 | 6.4% |
| Not-for-profit Organizations | 310 | 6.7% |
| Local Government Employees | 261 | 5.6% |
| State Government Employees | 215 | 4.6% |
| Federal Government Employees | 122 | 2.6% |
| Unpaid Family Workers | 0 | 0.0% |
| Total | 4,644 | 100.0% |
Employment Status by Age in Ocean Pines
According to the labor force statistics for Ocean Pines, out of the total population over 16 years of age (11,014), 45.1% or 4,967 individuals are in the labor force, with 5.5% or 273 of them unemployed. The age group with the highest labor force participation rate is 35 to 44 years, with 82.2% or 691 individuals in the labor force. Within the labor force, the 20 to 24 years age range has the highest percentage of unemployed individuals, with 54.4% or 99 of them being unemployed.
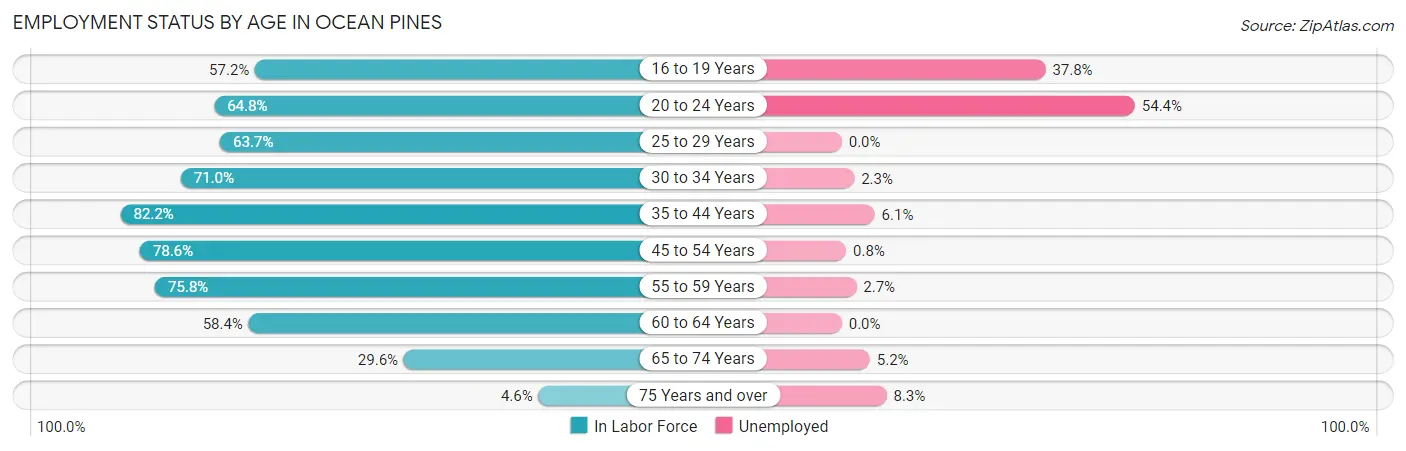
| Age Bracket | In Labor Force | Unemployed |
| 16 to 19 Years | 119 (57.2%) | 45 (37.8%) |
| 20 to 24 Years | 182 (64.8%) | 99 (54.4%) |
| 25 to 29 Years | 313 (63.7%) | 0 (0.0%) |
| 30 to 34 Years | 353 (71.0%) | 8 (2.3%) |
| 35 to 44 Years | 691 (82.2%) | 42 (6.1%) |
| 45 to 54 Years | 876 (78.6%) | 7 (0.8%) |
| 55 to 59 Years | 627 (75.8%) | 17 (2.7%) |
| 60 to 64 Years | 811 (58.4%) | 0 (0.0%) |
| 65 to 74 Years | 884 (29.6%) | 46 (5.2%) |
| 75 Years and over | 109 (4.6%) | 9 (8.3%) |
| Total | 4,967 (45.1%) | 273 (5.5%) |
Employment Status by Educational Attainment in Ocean Pines
According to labor force statistics for Ocean Pines, 71.1% of individuals (3,669) out of the total population between 25 and 64 years of age (5,160) are in the labor force, with 2.0% or 73 of them being unemployed. The group with the highest labor force participation rate are those with the educational attainment of bachelor's degree or higher, with 78.1% or 1,506 individuals in the labor force. Within the labor force, individuals with high school diploma education have the highest percentage of unemployment, with 4.8% or 37 of them being unemployed.
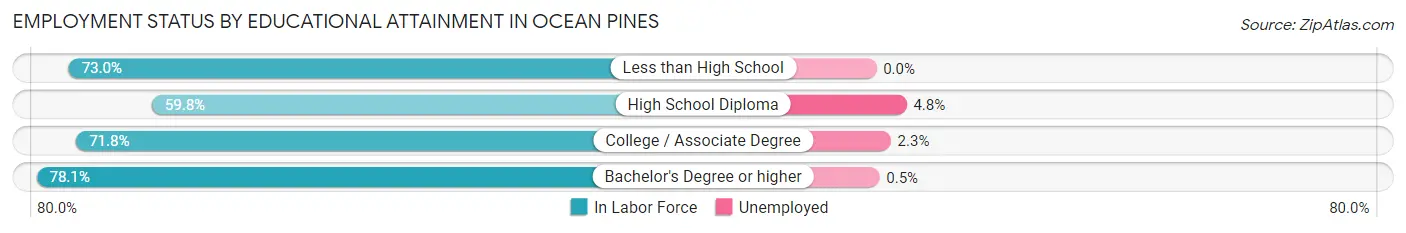
| Educational Attainment | In Labor Force | Unemployed |
| Less than High School | 138 (73.0%) | 0 (0.0%) |
| High School Diploma | 778 (59.8%) | 62 (4.8%) |
| College / Associate Degree | 1,251 (71.8%) | 40 (2.3%) |
| Bachelor's Degree or higher | 1,506 (78.1%) | 10 (0.5%) |
| Total | 3,669 (71.1%) | 103 (2.0%) |
Employment Occupations by Sex in Ocean Pines
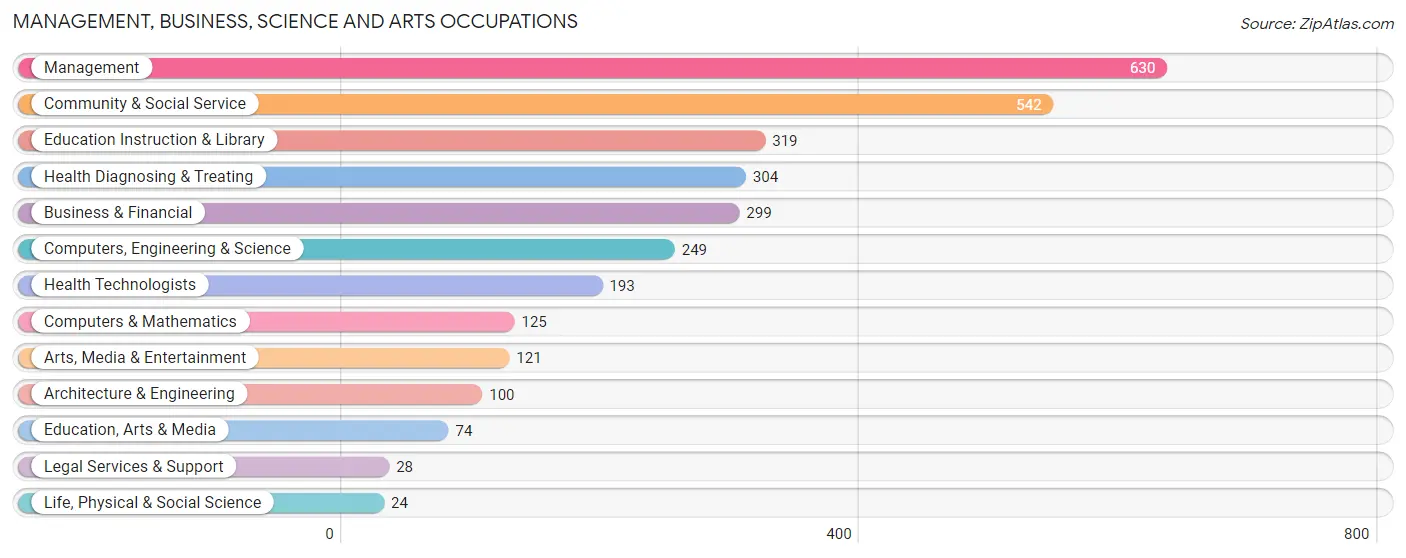
Management, Business, Science and Arts Occupations
The most common Management, Business, Science and Arts occupations in Ocean Pines are Management (630 | 13.4%), Community & Social Service (542 | 11.6%), Education Instruction & Library (319 | 6.8%), Health Diagnosing & Treating (304 | 6.5%), and Business & Financial (299 | 6.4%).
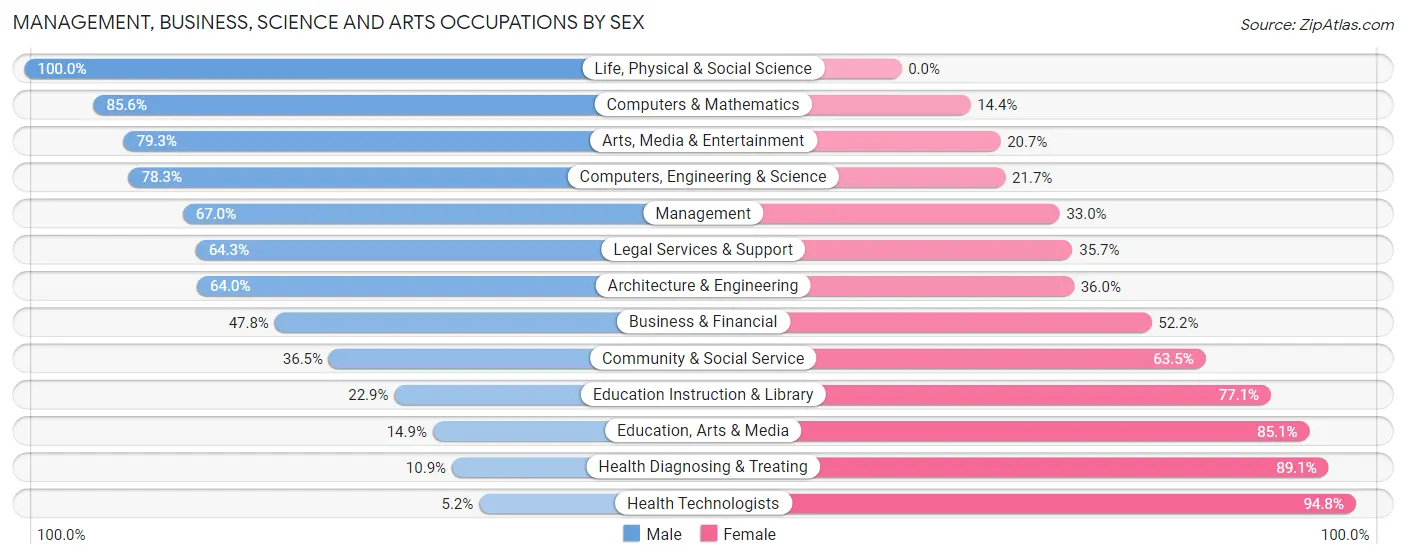
Management, Business, Science and Arts Occupations by Sex
Within the Management, Business, Science and Arts occupations in Ocean Pines, the most male-oriented occupations are Life, Physical & Social Science (100.0%), Computers & Mathematics (85.6%), and Arts, Media & Entertainment (79.3%), while the most female-oriented occupations are Health Technologists (94.8%), Health Diagnosing & Treating (89.1%), and Education, Arts & Media (85.1%).
| Occupation | Male | Female |
| Management | 422 (67.0%) | 208 (33.0%) |
| Business & Financial | 143 (47.8%) | 156 (52.2%) |
| Computers, Engineering & Science | 195 (78.3%) | 54 (21.7%) |
| Computers & Mathematics | 107 (85.6%) | 18 (14.4%) |
| Architecture & Engineering | 64 (64.0%) | 36 (36.0%) |
| Life, Physical & Social Science | 24 (100.0%) | 0 (0.0%) |
| Community & Social Service | 198 (36.5%) | 344 (63.5%) |
| Education, Arts & Media | 11 (14.9%) | 63 (85.1%) |
| Legal Services & Support | 18 (64.3%) | 10 (35.7%) |
| Education Instruction & Library | 73 (22.9%) | 246 (77.1%) |
| Arts, Media & Entertainment | 96 (79.3%) | 25 (20.7%) |
| Health Diagnosing & Treating | 33 (10.9%) | 271 (89.1%) |
| Health Technologists | 10 (5.2%) | 183 (94.8%) |
| Total (Category) | 991 (49.0%) | 1,033 (51.0%) |
| Total (Overall) | 2,718 (57.9%) | 1,975 (42.1%) |
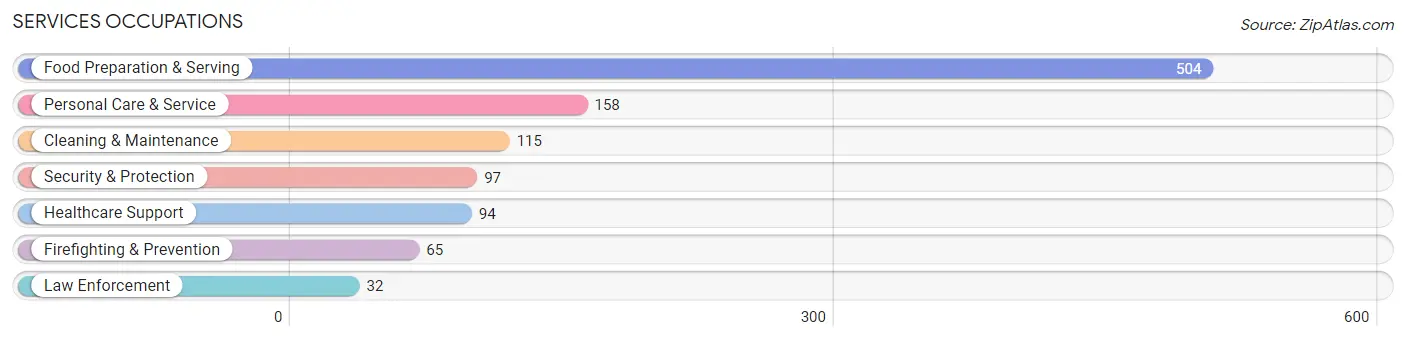
Services Occupations
The most common Services occupations in Ocean Pines are Food Preparation & Serving (504 | 10.7%), Personal Care & Service (158 | 3.4%), Cleaning & Maintenance (115 | 2.5%), Security & Protection (97 | 2.1%), and Healthcare Support (94 | 2.0%).
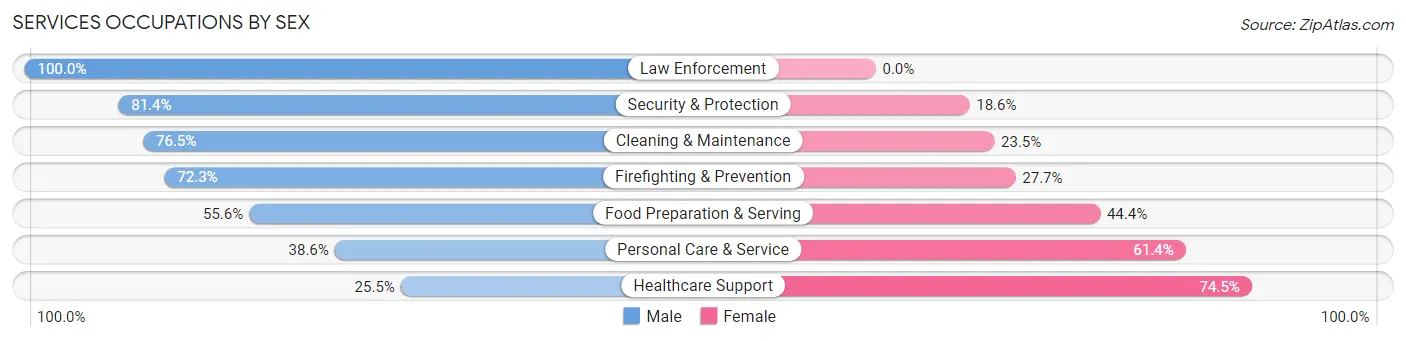
Services Occupations by Sex
Within the Services occupations in Ocean Pines, the most male-oriented occupations are Law Enforcement (100.0%), Security & Protection (81.4%), and Cleaning & Maintenance (76.5%), while the most female-oriented occupations are Healthcare Support (74.5%), Personal Care & Service (61.4%), and Food Preparation & Serving (44.4%).
| Occupation | Male | Female |
| Healthcare Support | 24 (25.5%) | 70 (74.5%) |
| Security & Protection | 79 (81.4%) | 18 (18.6%) |
| Firefighting & Prevention | 47 (72.3%) | 18 (27.7%) |
| Law Enforcement | 32 (100.0%) | 0 (0.0%) |
| Food Preparation & Serving | 280 (55.6%) | 224 (44.4%) |
| Cleaning & Maintenance | 88 (76.5%) | 27 (23.5%) |
| Personal Care & Service | 61 (38.6%) | 97 (61.4%) |
| Total (Category) | 532 (55.0%) | 436 (45.0%) |
| Total (Overall) | 2,718 (57.9%) | 1,975 (42.1%) |
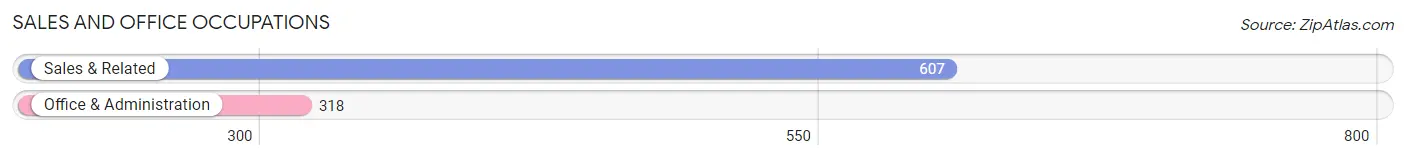
Sales and Office Occupations
The most common Sales and Office occupations in Ocean Pines are Sales & Related (607 | 12.9%), and Office & Administration (318 | 6.8%).
Sales and Office Occupations by Sex
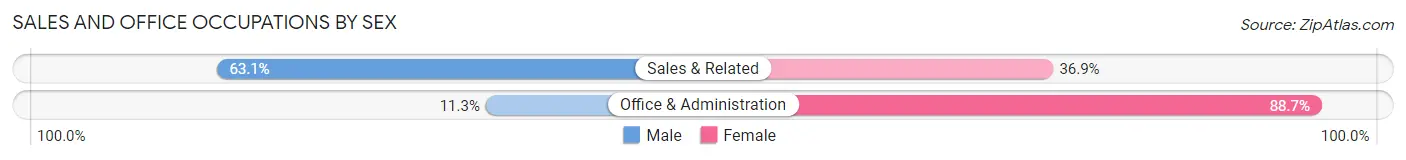
| Occupation | Male | Female |
| Sales & Related | 383 (63.1%) | 224 (36.9%) |
| Office & Administration | 36 (11.3%) | 282 (88.7%) |
| Total (Category) | 419 (45.3%) | 506 (54.7%) |
| Total (Overall) | 2,718 (57.9%) | 1,975 (42.1%) |
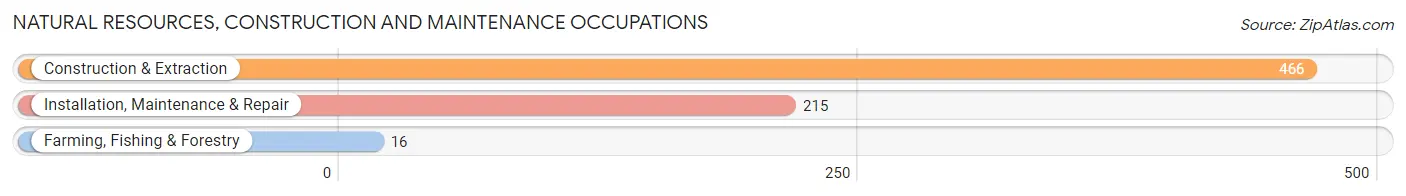
Natural Resources, Construction and Maintenance Occupations
The most common Natural Resources, Construction and Maintenance occupations in Ocean Pines are Construction & Extraction (466 | 9.9%), Installation, Maintenance & Repair (215 | 4.6%), and Farming, Fishing & Forestry (16 | 0.3%).
Natural Resources, Construction and Maintenance Occupations by Sex
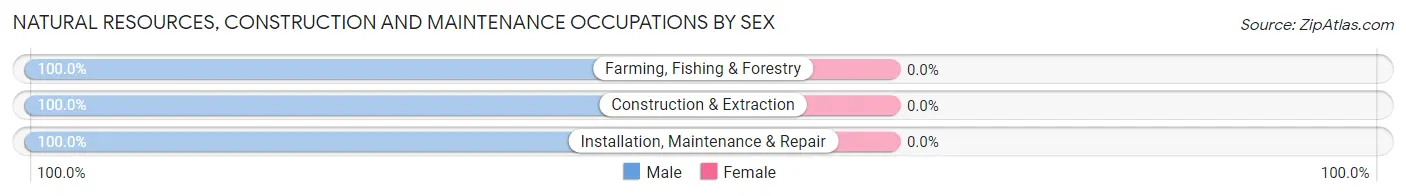
| Occupation | Male | Female |
| Farming, Fishing & Forestry | 16 (100.0%) | 0 (0.0%) |
| Construction & Extraction | 466 (100.0%) | 0 (0.0%) |
| Installation, Maintenance & Repair | 215 (100.0%) | 0 (0.0%) |
| Total (Category) | 697 (100.0%) | 0 (0.0%) |
| Total (Overall) | 2,718 (57.9%) | 1,975 (42.1%) |
Production, Transportation and Moving Occupations
The most common Production, Transportation and Moving occupations in Ocean Pines are Transportation (28 | 0.6%), Material Moving (26 | 0.5%), and Production (25 | 0.5%).
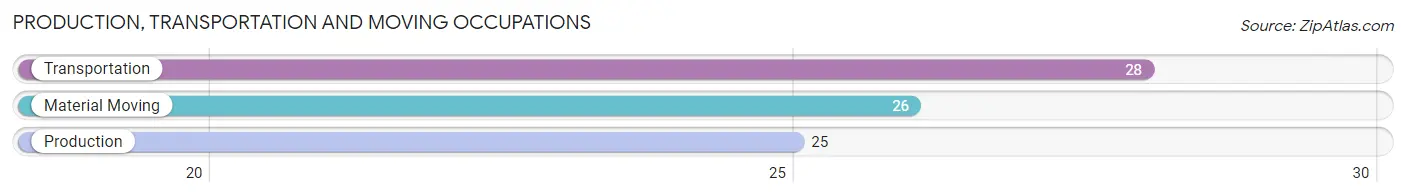
Production, Transportation and Moving Occupations by Sex
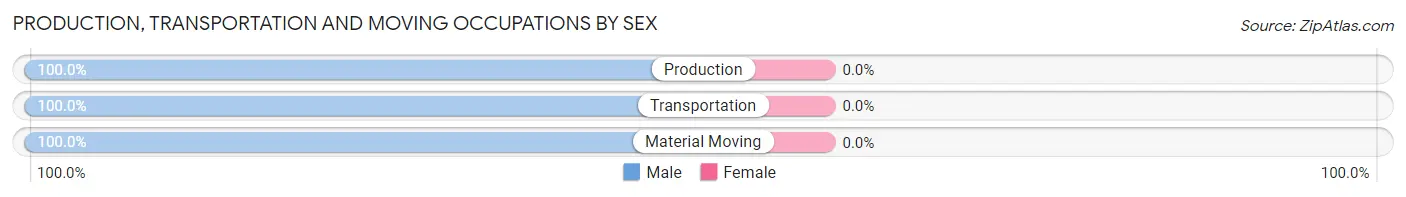
| Occupation | Male | Female |
| Production | 25 (100.0%) | 0 (0.0%) |
| Transportation | 28 (100.0%) | 0 (0.0%) |
| Material Moving | 26 (100.0%) | 0 (0.0%) |
| Total (Category) | 79 (100.0%) | 0 (0.0%) |
| Total (Overall) | 2,718 (57.9%) | 1,975 (42.1%) |
Employment Industries by Sex in Ocean Pines
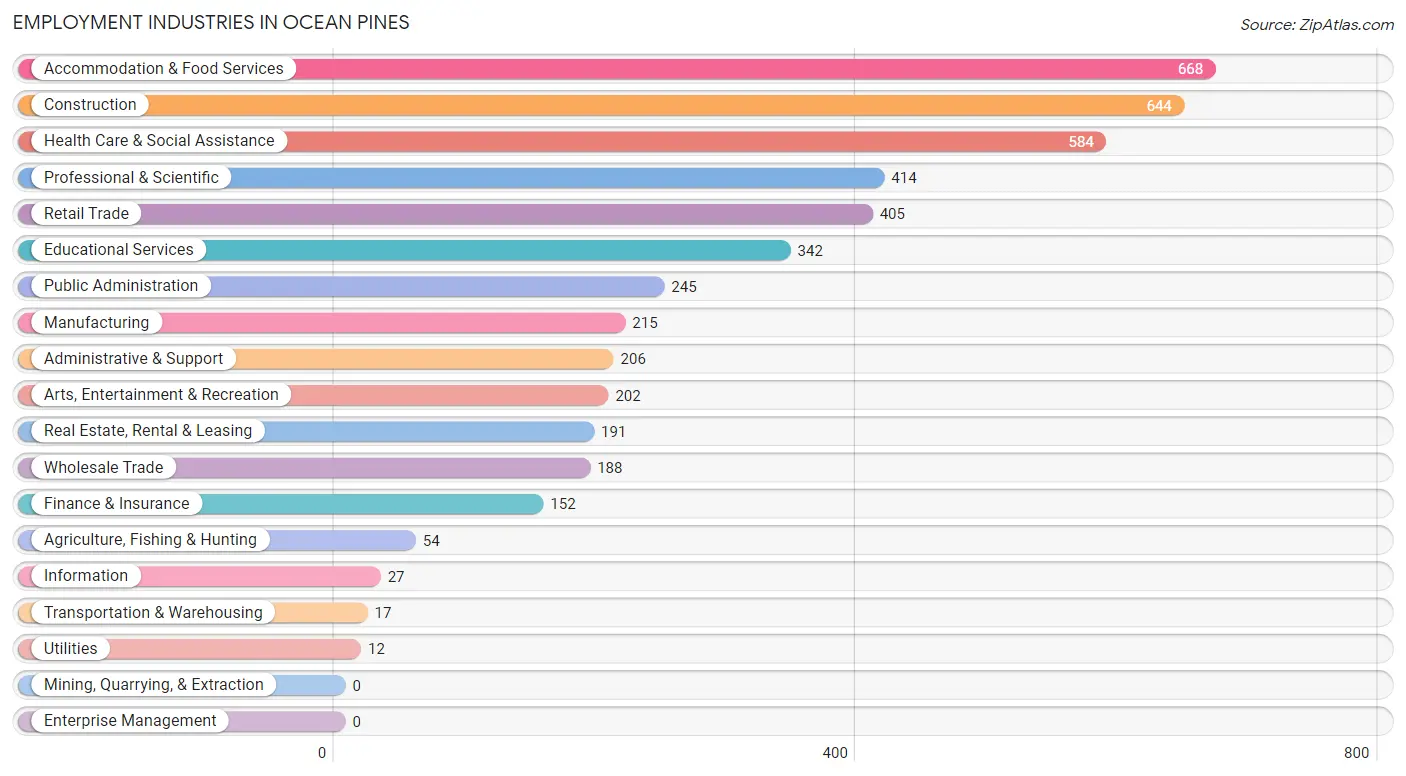
Employment Industries in Ocean Pines
The major employment industries in Ocean Pines include Accommodation & Food Services (668 | 14.2%), Construction (644 | 13.7%), Health Care & Social Assistance (584 | 12.4%), Professional & Scientific (414 | 8.8%), and Retail Trade (405 | 8.6%).
Employment Industries by Sex in Ocean Pines
The Ocean Pines industries that see more men than women are Information (100.0%), Construction (96.4%), and Wholesale Trade (76.6%), whereas the industries that tend to have a higher number of women are Transportation & Warehousing (100.0%), Utilities (100.0%), and Health Care & Social Assistance (82.2%).
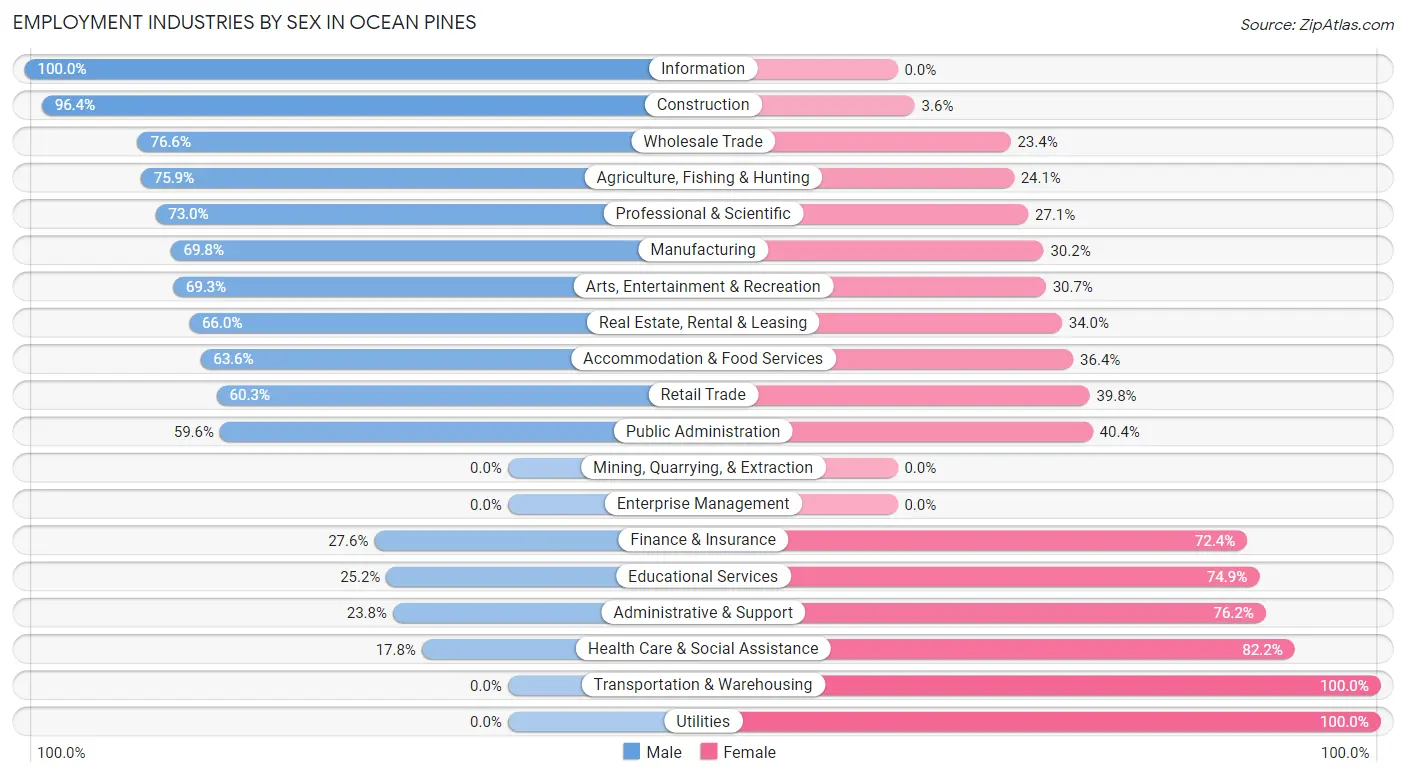
| Industry | Male | Female |
| Agriculture, Fishing & Hunting | 41 (75.9%) | 13 (24.1%) |
| Mining, Quarrying, & Extraction | 0 (0.0%) | 0 (0.0%) |
| Construction | 621 (96.4%) | 23 (3.6%) |
| Manufacturing | 150 (69.8%) | 65 (30.2%) |
| Wholesale Trade | 144 (76.6%) | 44 (23.4%) |
| Retail Trade | 244 (60.3%) | 161 (39.8%) |
| Transportation & Warehousing | 0 (0.0%) | 17 (100.0%) |
| Utilities | 0 (0.0%) | 12 (100.0%) |
| Information | 27 (100.0%) | 0 (0.0%) |
| Finance & Insurance | 42 (27.6%) | 110 (72.4%) |
| Real Estate, Rental & Leasing | 126 (66.0%) | 65 (34.0%) |
| Professional & Scientific | 302 (73.0%) | 112 (27.1%) |
| Enterprise Management | 0 (0.0%) | 0 (0.0%) |
| Administrative & Support | 49 (23.8%) | 157 (76.2%) |
| Educational Services | 86 (25.2%) | 256 (74.9%) |
| Health Care & Social Assistance | 104 (17.8%) | 480 (82.2%) |
| Arts, Entertainment & Recreation | 140 (69.3%) | 62 (30.7%) |
| Accommodation & Food Services | 425 (63.6%) | 243 (36.4%) |
| Public Administration | 146 (59.6%) | 99 (40.4%) |
| Total | 2,718 (57.9%) | 1,975 (42.1%) |
Education in Ocean Pines
School Enrollment in Ocean Pines
The most common levels of schooling among the 1,525 students in Ocean Pines are elementary school (371 | 24.3%), high school (352 | 23.1%), and college / undergraduate (297 | 19.5%).
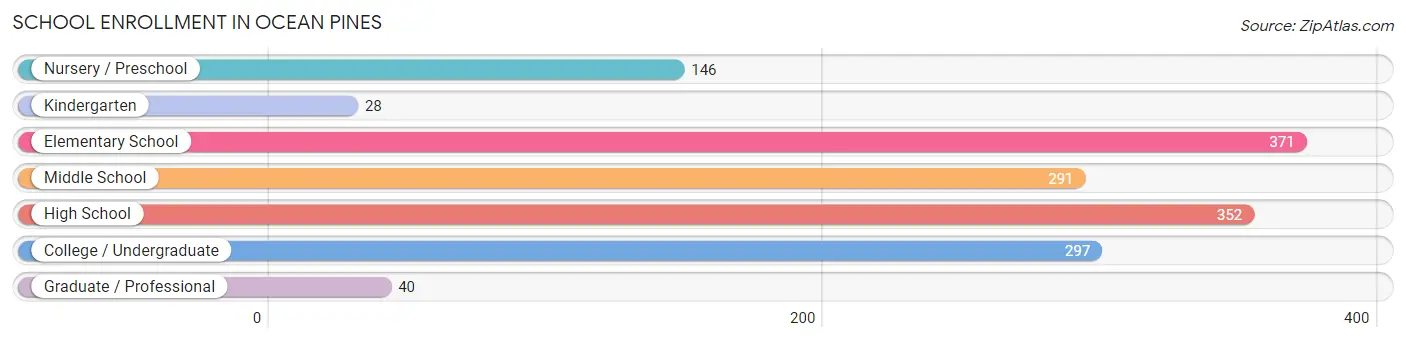
| School Level | # Students | % Students |
| Nursery / Preschool | 146 | 9.6% |
| Kindergarten | 28 | 1.8% |
| Elementary School | 371 | 24.3% |
| Middle School | 291 | 19.1% |
| High School | 352 | 23.1% |
| College / Undergraduate | 297 | 19.5% |
| Graduate / Professional | 40 | 2.6% |
| Total | 1,525 | 100.0% |
School Enrollment by Age by Funding Source in Ocean Pines
Out of a total of 1,525 students who are enrolled in schools in Ocean Pines, 242 (15.9%) attend a private institution, while the remaining 1,283 (84.1%) are enrolled in public schools. The age group of 35 years and over has the highest likelihood of being enrolled in private schools, with 96 (71.1% in the age bracket) enrolled. Conversely, the age group of 20 to 24 year olds has the lowest likelihood of being enrolled in a private school, with 85 (100.0% in the age bracket) attending a public institution.
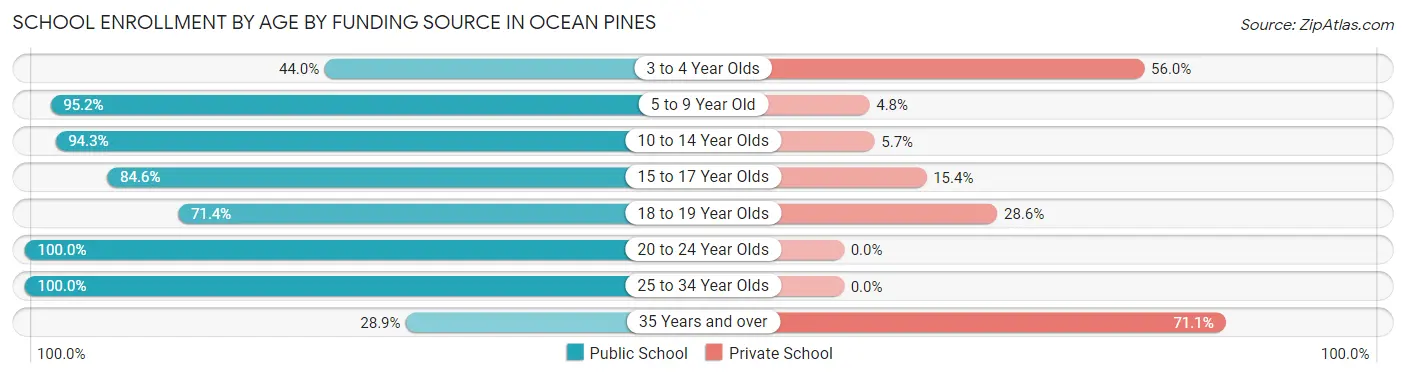
| Age Bracket | Public School | Private School |
| 3 to 4 Year Olds | 48 (44.0%) | 61 (56.0%) |
| 5 to 9 Year Old | 379 (95.2%) | 19 (4.8%) |
| 10 to 14 Year Olds | 396 (94.3%) | 24 (5.7%) |
| 15 to 17 Year Olds | 209 (84.6%) | 38 (15.4%) |
| 18 to 19 Year Olds | 10 (71.4%) | 4 (28.6%) |
| 20 to 24 Year Olds | 85 (100.0%) | 0 (0.0%) |
| 25 to 34 Year Olds | 117 (100.0%) | 0 (0.0%) |
| 35 Years and over | 39 (28.9%) | 96 (71.1%) |
| Total | 1,283 (84.1%) | 242 (15.9%) |
Educational Attainment by Field of Study in Ocean Pines
Education (797 | 20.2%), business (750 | 19.1%), science & technology (407 | 10.3%), social sciences (320 | 8.1%), and computers & mathematics (249 | 6.3%) are the most common fields of study among 3,938 individuals in Ocean Pines who have obtained a bachelor's degree or higher.
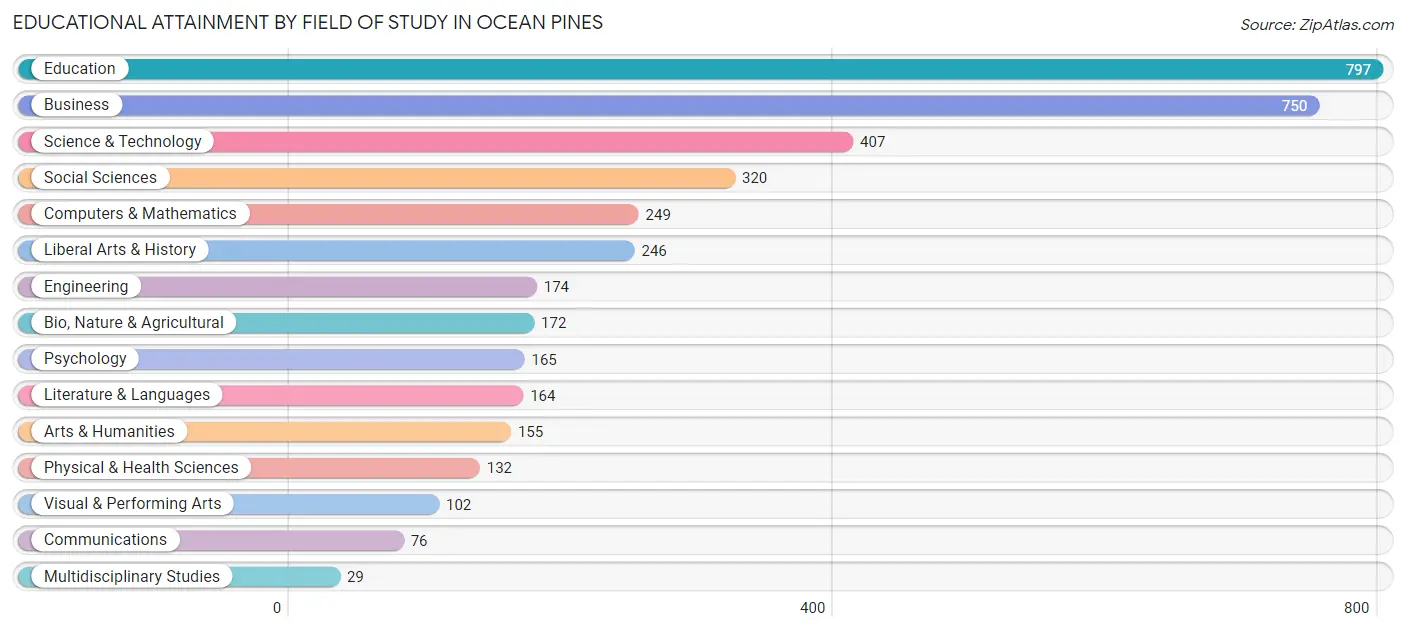
| Field of Study | # Graduates | % Graduates |
| Computers & Mathematics | 249 | 6.3% |
| Bio, Nature & Agricultural | 172 | 4.4% |
| Physical & Health Sciences | 132 | 3.4% |
| Psychology | 165 | 4.2% |
| Social Sciences | 320 | 8.1% |
| Engineering | 174 | 4.4% |
| Multidisciplinary Studies | 29 | 0.7% |
| Science & Technology | 407 | 10.3% |
| Business | 750 | 19.1% |
| Education | 797 | 20.2% |
| Literature & Languages | 164 | 4.2% |
| Liberal Arts & History | 246 | 6.2% |
| Visual & Performing Arts | 102 | 2.6% |
| Communications | 76 | 1.9% |
| Arts & Humanities | 155 | 3.9% |
| Total | 3,938 | 100.0% |
Transportation & Commute in Ocean Pines
Vehicle Availability by Sex in Ocean Pines
The most prevalent vehicle ownership categories in Ocean Pines are males with 2 vehicles (1,502, accounting for 55.9%) and females with 2 vehicles (947, making up 76.8%).
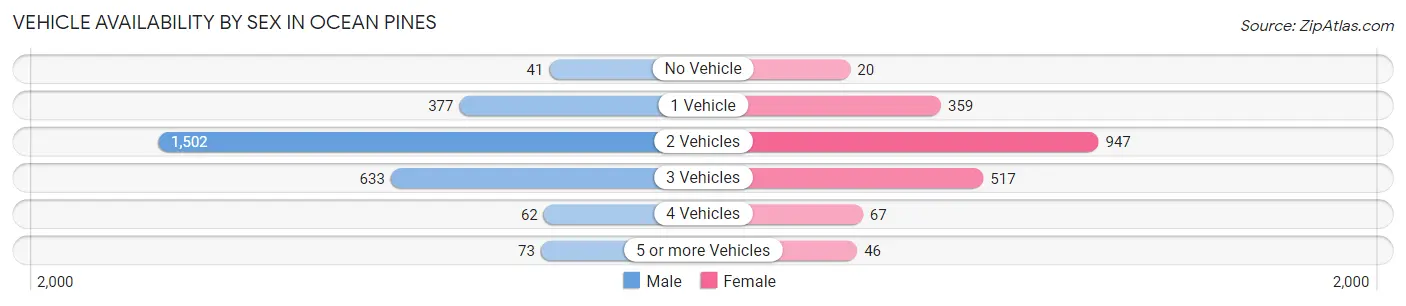
| Vehicles Available | Male | Female |
| No Vehicle | 41 (1.5%) | 20 (1.0%) |
| 1 Vehicle | 377 (14.0%) | 359 (18.3%) |
| 2 Vehicles | 1,502 (55.9%) | 947 (48.4%) |
| 3 Vehicles | 633 (23.5%) | 517 (26.4%) |
| 4 Vehicles | 62 (2.3%) | 67 (3.4%) |
| 5 or more Vehicles | 73 (2.7%) | 46 (2.4%) |
| Total | 2,688 (100.0%) | 1,956 (100.0%) |
Commute Time in Ocean Pines
The most frequently occuring commute durations in Ocean Pines are 15 to 19 minutes (863 commuters, 21.1%), 20 to 24 minutes (783 commuters, 19.1%), and 30 to 34 minutes (580 commuters, 14.2%).
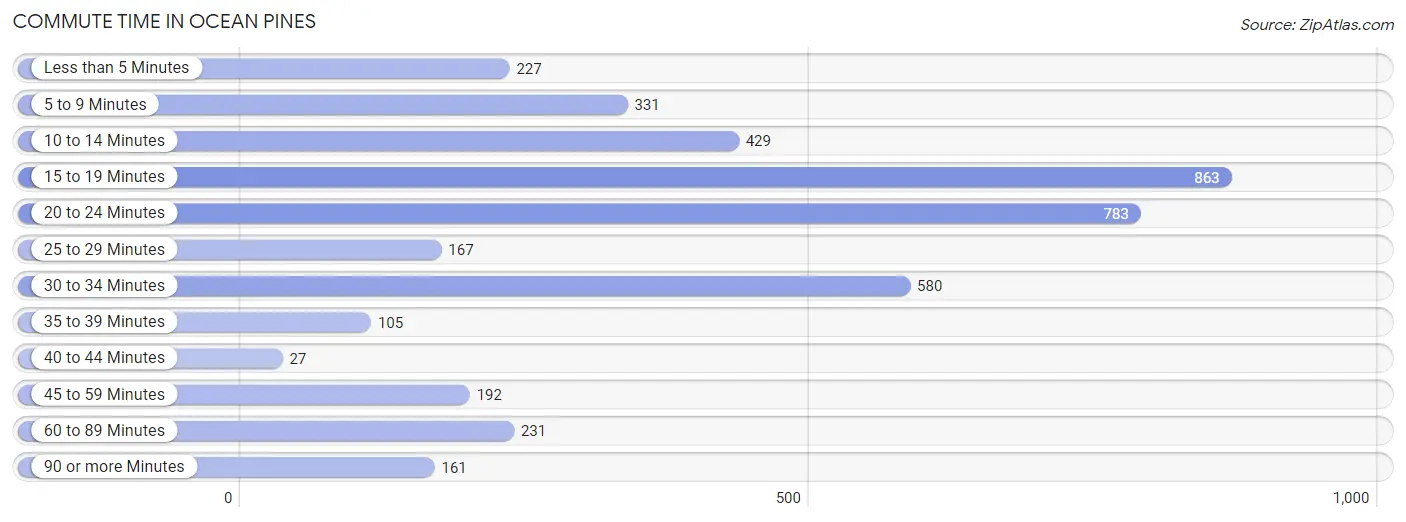
| Commute Time | # Commuters | % Commuters |
| Less than 5 Minutes | 227 | 5.5% |
| 5 to 9 Minutes | 331 | 8.1% |
| 10 to 14 Minutes | 429 | 10.5% |
| 15 to 19 Minutes | 863 | 21.1% |
| 20 to 24 Minutes | 783 | 19.1% |
| 25 to 29 Minutes | 167 | 4.1% |
| 30 to 34 Minutes | 580 | 14.2% |
| 35 to 39 Minutes | 105 | 2.6% |
| 40 to 44 Minutes | 27 | 0.7% |
| 45 to 59 Minutes | 192 | 4.7% |
| 60 to 89 Minutes | 231 | 5.6% |
| 90 or more Minutes | 161 | 3.9% |
Commute Time by Sex in Ocean Pines
The most common commute times in Ocean Pines are 20 to 24 minutes (489 commuters, 20.3%) for males and 15 to 19 minutes (392 commuters, 23.3%) for females.
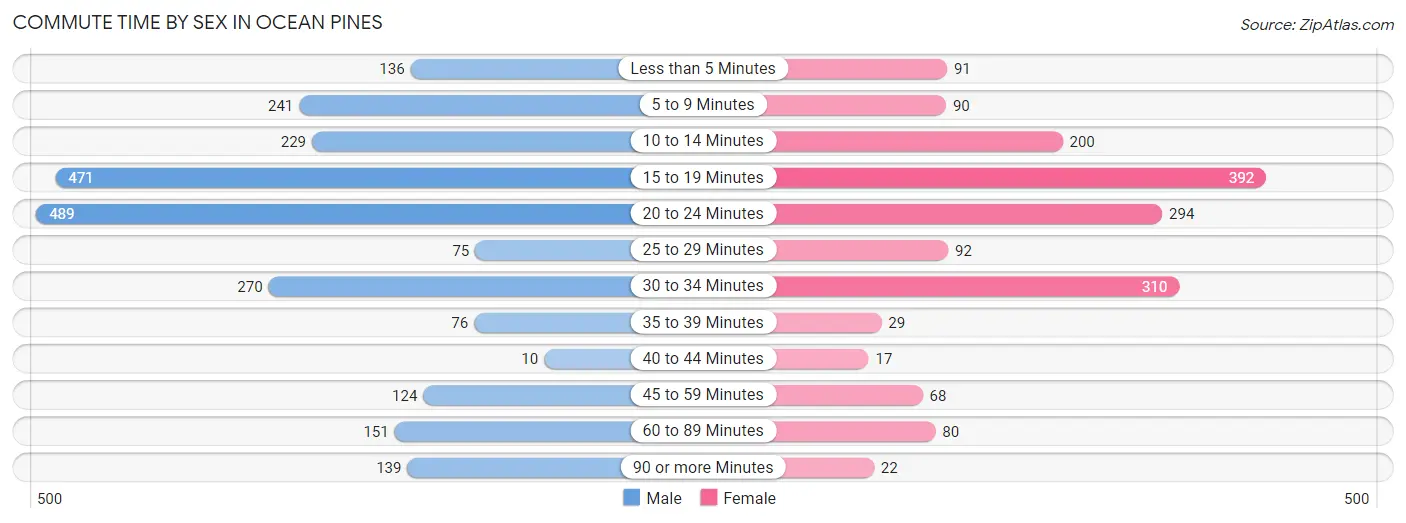
| Commute Time | Male | Female |
| Less than 5 Minutes | 136 (5.6%) | 91 (5.4%) |
| 5 to 9 Minutes | 241 (10.0%) | 90 (5.3%) |
| 10 to 14 Minutes | 229 (9.5%) | 200 (11.9%) |
| 15 to 19 Minutes | 471 (19.5%) | 392 (23.3%) |
| 20 to 24 Minutes | 489 (20.3%) | 294 (17.4%) |
| 25 to 29 Minutes | 75 (3.1%) | 92 (5.5%) |
| 30 to 34 Minutes | 270 (11.2%) | 310 (18.4%) |
| 35 to 39 Minutes | 76 (3.2%) | 29 (1.7%) |
| 40 to 44 Minutes | 10 (0.4%) | 17 (1.0%) |
| 45 to 59 Minutes | 124 (5.1%) | 68 (4.0%) |
| 60 to 89 Minutes | 151 (6.3%) | 80 (4.8%) |
| 90 or more Minutes | 139 (5.8%) | 22 (1.3%) |
Time of Departure to Work by Sex in Ocean Pines
The most frequent times of departure to work in Ocean Pines are 7:00 AM to 7:29 AM (426, 17.7%) for males and 8:00 AM to 8:29 AM (285, 16.9%) for females.
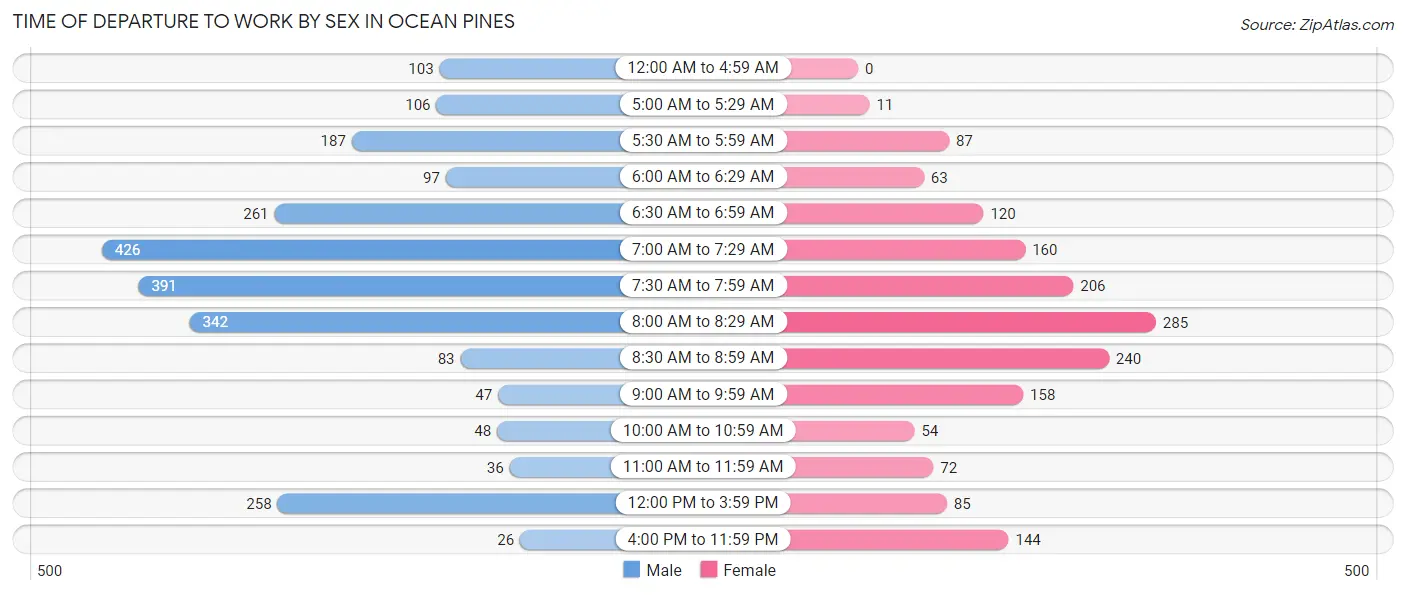
| Time of Departure | Male | Female |
| 12:00 AM to 4:59 AM | 103 (4.3%) | 0 (0.0%) |
| 5:00 AM to 5:29 AM | 106 (4.4%) | 11 (0.6%) |
| 5:30 AM to 5:59 AM | 187 (7.8%) | 87 (5.2%) |
| 6:00 AM to 6:29 AM | 97 (4.0%) | 63 (3.7%) |
| 6:30 AM to 6:59 AM | 261 (10.8%) | 120 (7.1%) |
| 7:00 AM to 7:29 AM | 426 (17.7%) | 160 (9.5%) |
| 7:30 AM to 7:59 AM | 391 (16.2%) | 206 (12.2%) |
| 8:00 AM to 8:29 AM | 342 (14.2%) | 285 (16.9%) |
| 8:30 AM to 8:59 AM | 83 (3.4%) | 240 (14.2%) |
| 9:00 AM to 9:59 AM | 47 (1.9%) | 158 (9.4%) |
| 10:00 AM to 10:59 AM | 48 (2.0%) | 54 (3.2%) |
| 11:00 AM to 11:59 AM | 36 (1.5%) | 72 (4.3%) |
| 12:00 PM to 3:59 PM | 258 (10.7%) | 85 (5.0%) |
| 4:00 PM to 11:59 PM | 26 (1.1%) | 144 (8.6%) |
| Total | 2,411 (100.0%) | 1,685 (100.0%) |
Housing Occupancy in Ocean Pines
Occupancy by Ownership in Ocean Pines
Of the total 5,787 dwellings in Ocean Pines, owner-occupied units account for 5,130 (88.6%), while renter-occupied units make up 657 (11.4%).
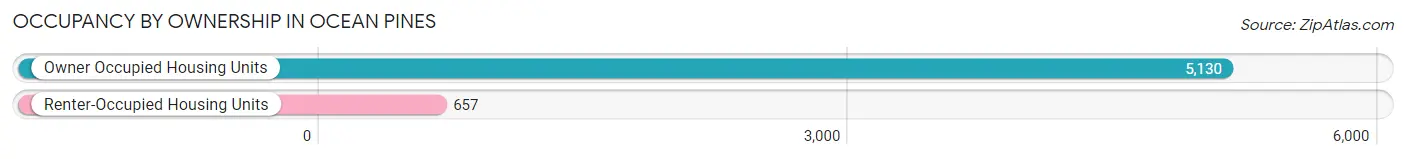
| Occupancy | # Housing Units | % Housing Units |
| Owner Occupied Housing Units | 5,130 | 88.6% |
| Renter-Occupied Housing Units | 657 | 11.4% |
| Total Occupied Housing Units | 5,787 | 100.0% |
Occupancy by Household Size in Ocean Pines
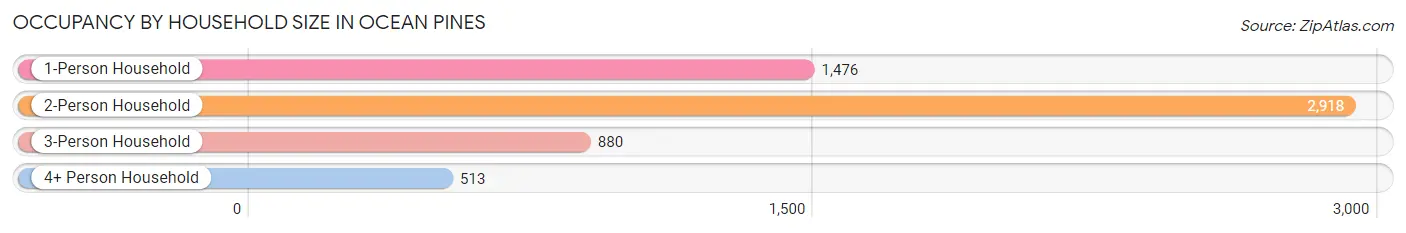
| Household Size | # Housing Units | % Housing Units |
| 1-Person Household | 1,476 | 25.5% |
| 2-Person Household | 2,918 | 50.4% |
| 3-Person Household | 880 | 15.2% |
| 4+ Person Household | 513 | 8.9% |
| Total Housing Units | 5,787 | 100.0% |
Occupancy by Ownership by Household Size in Ocean Pines
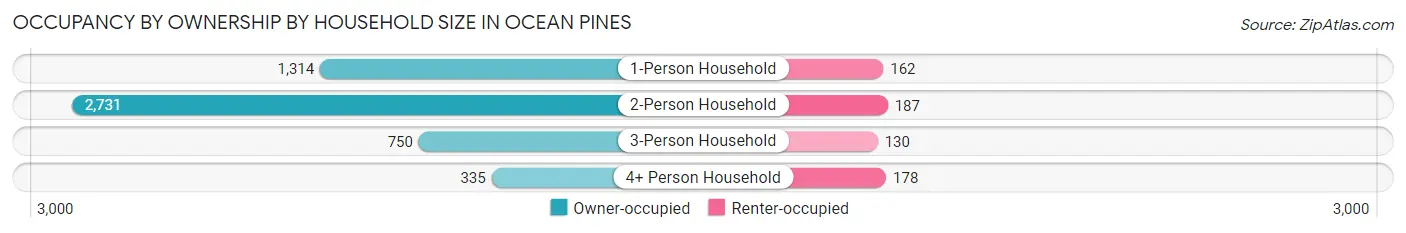
| Household Size | Owner-occupied | Renter-occupied |
| 1-Person Household | 1,314 (89.0%) | 162 (11.0%) |
| 2-Person Household | 2,731 (93.6%) | 187 (6.4%) |
| 3-Person Household | 750 (85.2%) | 130 (14.8%) |
| 4+ Person Household | 335 (65.3%) | 178 (34.7%) |
| Total Housing Units | 5,130 (88.6%) | 657 (11.4%) |
Occupancy by Educational Attainment in Ocean Pines
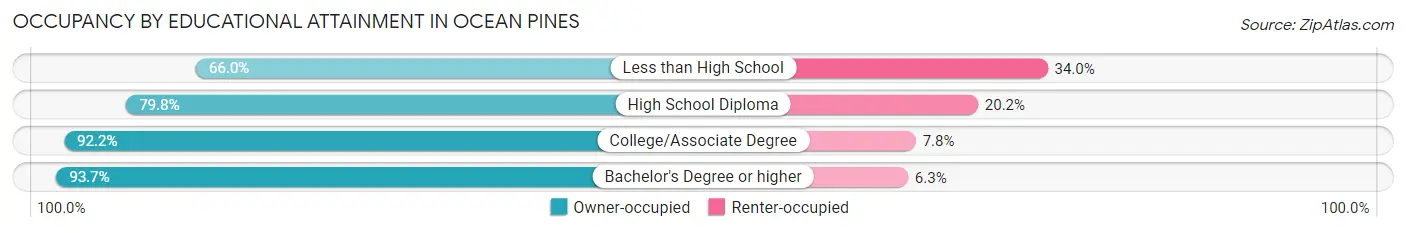
| Household Size | Owner-occupied | Renter-occupied |
| Less than High School | 173 (66.0%) | 89 (34.0%) |
| High School Diploma | 1,097 (79.8%) | 277 (20.2%) |
| College/Associate Degree | 1,775 (92.2%) | 151 (7.8%) |
| Bachelor's Degree or higher | 2,085 (93.7%) | 140 (6.3%) |
Occupancy by Age of Householder in Ocean Pines
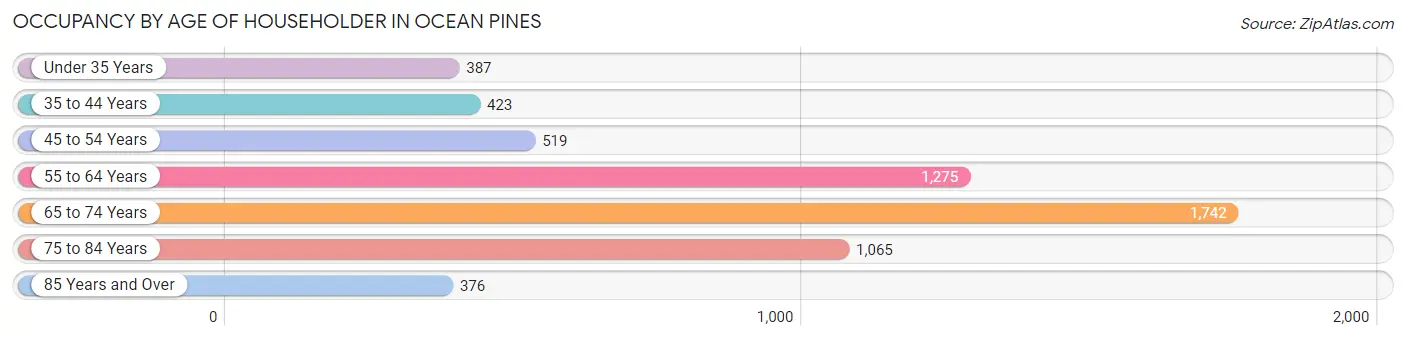
| Age Bracket | # Households | % Households |
| Under 35 Years | 387 | 6.7% |
| 35 to 44 Years | 423 | 7.3% |
| 45 to 54 Years | 519 | 9.0% |
| 55 to 64 Years | 1,275 | 22.0% |
| 65 to 74 Years | 1,742 | 30.1% |
| 75 to 84 Years | 1,065 | 18.4% |
| 85 Years and Over | 376 | 6.5% |
| Total | 5,787 | 100.0% |
Housing Finances in Ocean Pines
Median Income by Occupancy in Ocean Pines
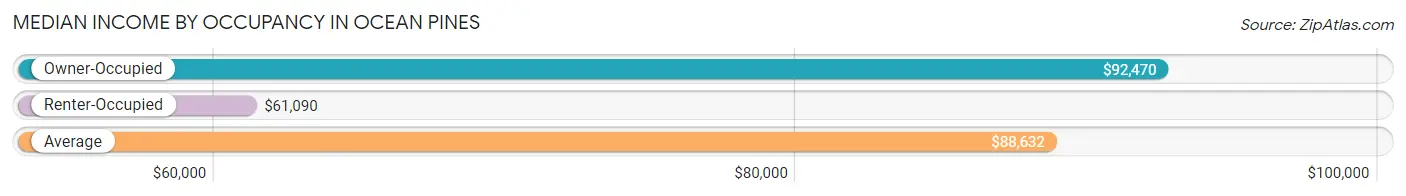
| Occupancy Type | # Households | Median Income |
| Owner-Occupied | 5,130 (88.6%) | $92,470 |
| Renter-Occupied | 657 (11.4%) | $61,090 |
| Average | 5,787 (100.0%) | $88,632 |
Occupancy by Householder Income Bracket in Ocean Pines
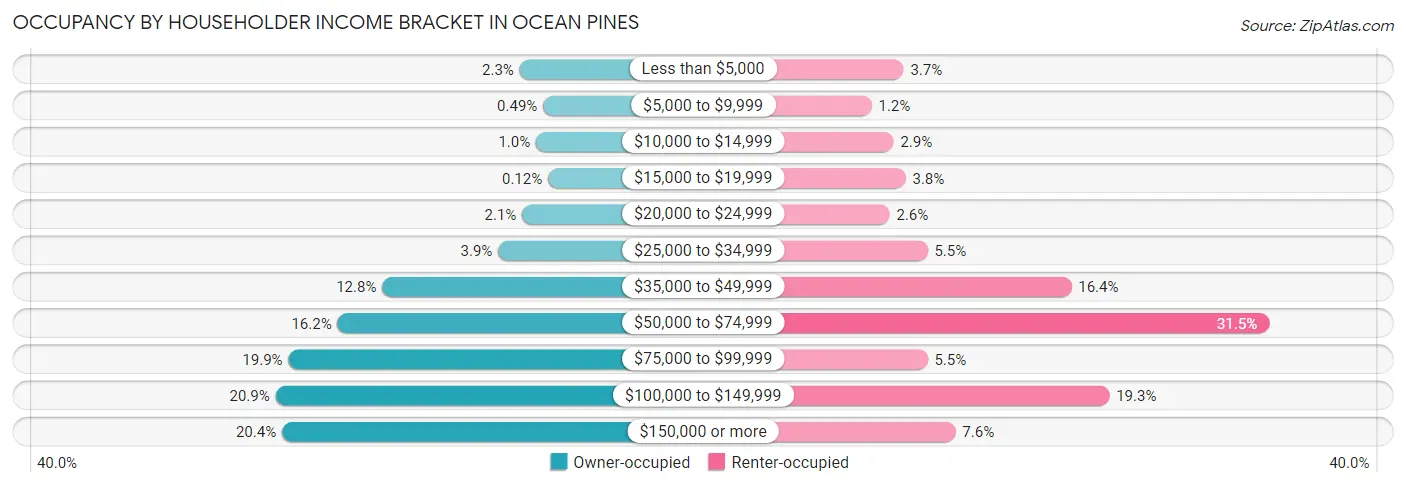
| Income Bracket | Owner-occupied | Renter-occupied |
| Less than $5,000 | 117 (2.3%) | 24 (3.6%) |
| $5,000 to $9,999 | 25 (0.5%) | 8 (1.2%) |
| $10,000 to $14,999 | 53 (1.0%) | 19 (2.9%) |
| $15,000 to $19,999 | 6 (0.1%) | 25 (3.8%) |
| $20,000 to $24,999 | 107 (2.1%) | 17 (2.6%) |
| $25,000 to $34,999 | 201 (3.9%) | 36 (5.5%) |
| $35,000 to $49,999 | 654 (12.8%) | 108 (16.4%) |
| $50,000 to $74,999 | 829 (16.2%) | 207 (31.5%) |
| $75,000 to $99,999 | 1,021 (19.9%) | 36 (5.5%) |
| $100,000 to $149,999 | 1,071 (20.9%) | 127 (19.3%) |
| $150,000 or more | 1,046 (20.4%) | 50 (7.6%) |
| Total | 5,130 (100.0%) | 657 (100.0%) |
Monthly Housing Cost Tiers in Ocean Pines
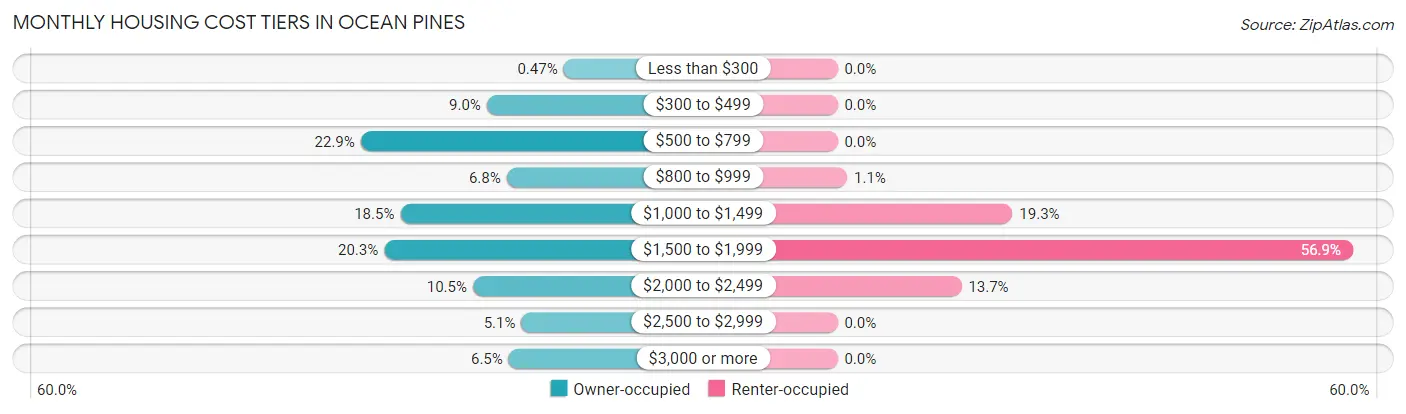
| Monthly Cost | Owner-occupied | Renter-occupied |
| Less than $300 | 24 (0.5%) | 0 (0.0%) |
| $300 to $499 | 459 (8.9%) | 0 (0.0%) |
| $500 to $799 | 1,174 (22.9%) | 0 (0.0%) |
| $800 to $999 | 347 (6.8%) | 7 (1.1%) |
| $1,000 to $1,499 | 949 (18.5%) | 127 (19.3%) |
| $1,500 to $1,999 | 1,041 (20.3%) | 374 (56.9%) |
| $2,000 to $2,499 | 538 (10.5%) | 90 (13.7%) |
| $2,500 to $2,999 | 263 (5.1%) | 0 (0.0%) |
| $3,000 or more | 335 (6.5%) | 0 (0.0%) |
| Total | 5,130 (100.0%) | 657 (100.0%) |
Physical Housing Characteristics in Ocean Pines
Housing Structures in Ocean Pines
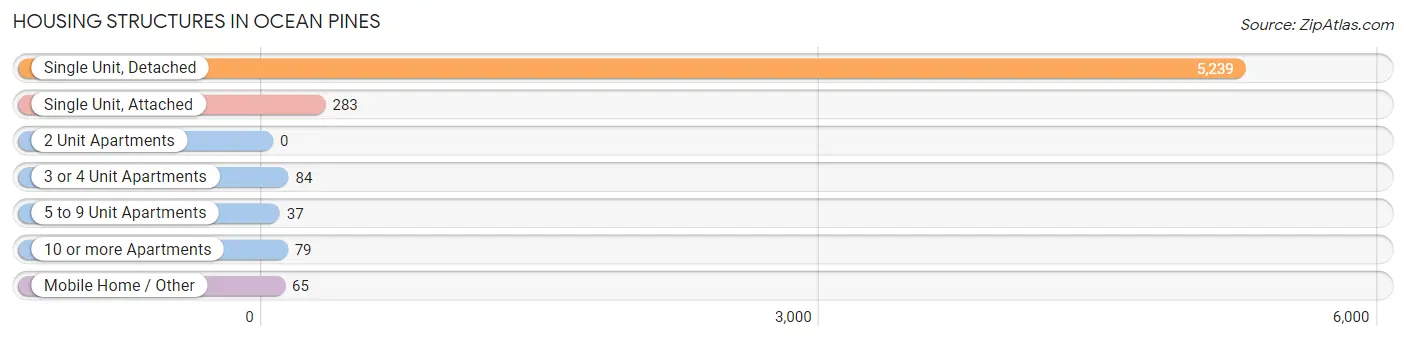
| Structure Type | # Housing Units | % Housing Units |
| Single Unit, Detached | 5,239 | 90.5% |
| Single Unit, Attached | 283 | 4.9% |
| 2 Unit Apartments | 0 | 0.0% |
| 3 or 4 Unit Apartments | 84 | 1.5% |
| 5 to 9 Unit Apartments | 37 | 0.6% |
| 10 or more Apartments | 79 | 1.4% |
| Mobile Home / Other | 65 | 1.1% |
| Total | 5,787 | 100.0% |
Housing Structures by Occupancy in Ocean Pines
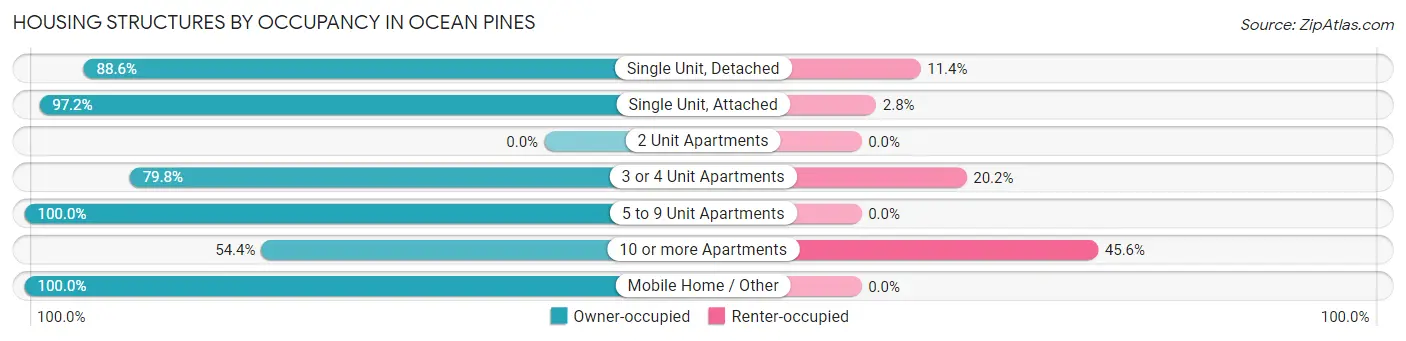
| Structure Type | Owner-occupied | Renter-occupied |
| Single Unit, Detached | 4,643 (88.6%) | 596 (11.4%) |
| Single Unit, Attached | 275 (97.2%) | 8 (2.8%) |
| 2 Unit Apartments | 0 (0.0%) | 0 (0.0%) |
| 3 or 4 Unit Apartments | 67 (79.8%) | 17 (20.2%) |
| 5 to 9 Unit Apartments | 37 (100.0%) | 0 (0.0%) |
| 10 or more Apartments | 43 (54.4%) | 36 (45.6%) |
| Mobile Home / Other | 65 (100.0%) | 0 (0.0%) |
| Total | 5,130 (88.6%) | 657 (11.4%) |
Housing Structures by Number of Rooms in Ocean Pines
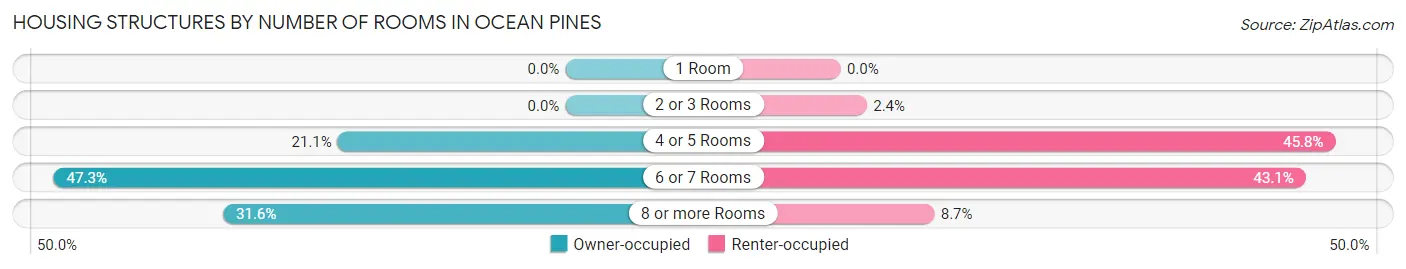
| Number of Rooms | Owner-occupied | Renter-occupied |
| 1 Room | 0 (0.0%) | 0 (0.0%) |
| 2 or 3 Rooms | 0 (0.0%) | 16 (2.4%) |
| 4 or 5 Rooms | 1,080 (21.0%) | 301 (45.8%) |
| 6 or 7 Rooms | 2,427 (47.3%) | 283 (43.1%) |
| 8 or more Rooms | 1,623 (31.6%) | 57 (8.7%) |
| Total | 5,130 (100.0%) | 657 (100.0%) |
Housing Structure by Heating Type in Ocean Pines
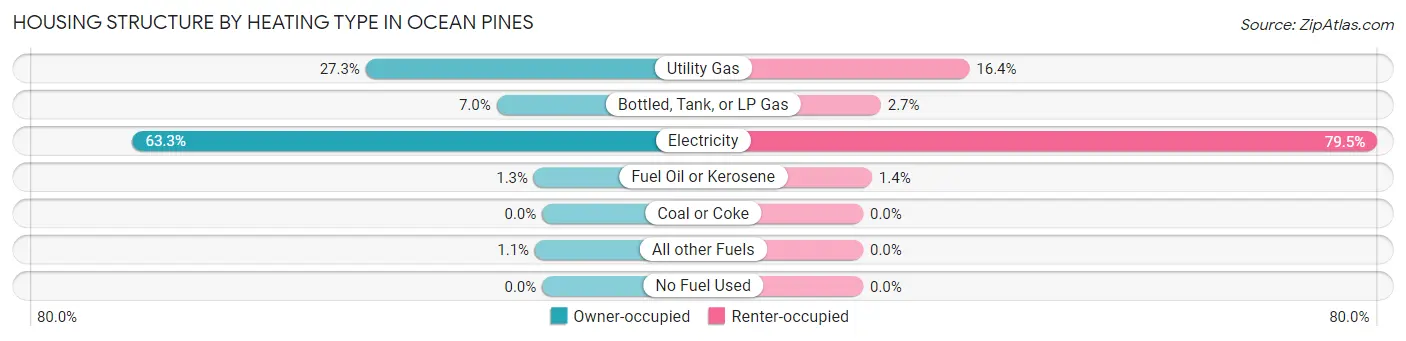
| Heating Type | Owner-occupied | Renter-occupied |
| Utility Gas | 1,399 (27.3%) | 108 (16.4%) |
| Bottled, Tank, or LP Gas | 361 (7.0%) | 18 (2.7%) |
| Electricity | 3,248 (63.3%) | 522 (79.4%) |
| Fuel Oil or Kerosene | 65 (1.3%) | 9 (1.4%) |
| Coal or Coke | 0 (0.0%) | 0 (0.0%) |
| All other Fuels | 57 (1.1%) | 0 (0.0%) |
| No Fuel Used | 0 (0.0%) | 0 (0.0%) |
| Total | 5,130 (100.0%) | 657 (100.0%) |
Household Vehicle Usage in Ocean Pines
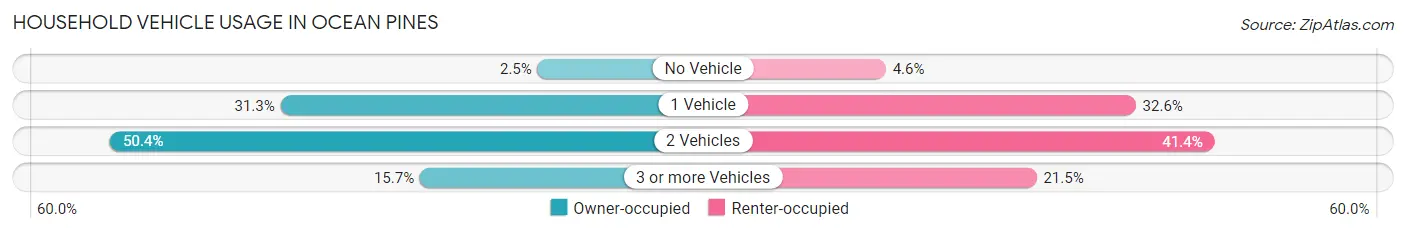
| Vehicles per Household | Owner-occupied | Renter-occupied |
| No Vehicle | 130 (2.5%) | 30 (4.6%) |
| 1 Vehicle | 1,607 (31.3%) | 214 (32.6%) |
| 2 Vehicles | 2,587 (50.4%) | 272 (41.4%) |
| 3 or more Vehicles | 806 (15.7%) | 141 (21.5%) |
| Total | 5,130 (100.0%) | 657 (100.0%) |
Real Estate & Mortgages in Ocean Pines
Real Estate and Mortgage Overview in Ocean Pines
| Characteristic | Without Mortgage | With Mortgage |
| Housing Units | 2,037 | 3,093 |
| Median Property Value | $306,800 | $335,400 |
| Median Household Income | $73,652 | $701 |
| Monthly Housing Costs | $647 | $324 |
| Real Estate Taxes | $2,429 | $22 |
Property Value by Mortgage Status in Ocean Pines
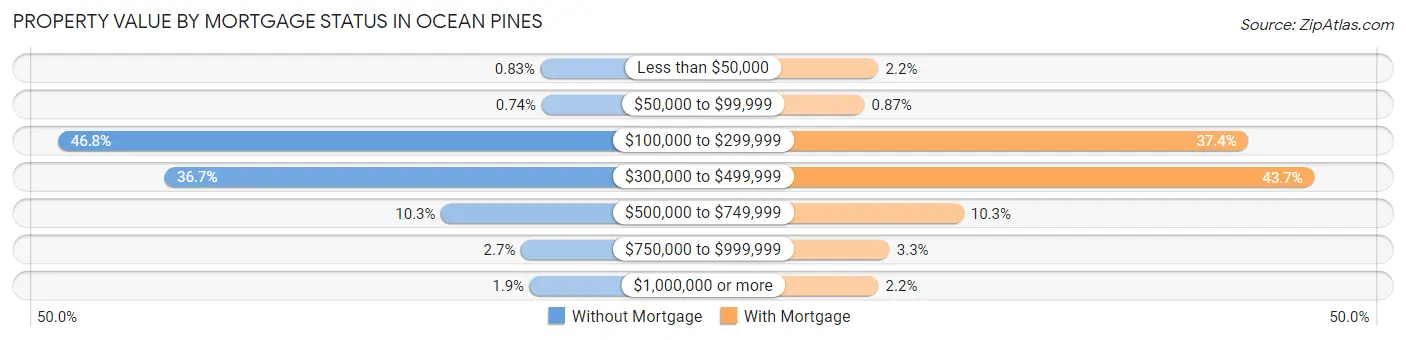
| Property Value | Without Mortgage | With Mortgage |
| Less than $50,000 | 17 (0.8%) | 68 (2.2%) |
| $50,000 to $99,999 | 15 (0.7%) | 27 (0.9%) |
| $100,000 to $299,999 | 954 (46.8%) | 1,158 (37.4%) |
| $300,000 to $499,999 | 748 (36.7%) | 1,352 (43.7%) |
| $500,000 to $749,999 | 210 (10.3%) | 319 (10.3%) |
| $750,000 to $999,999 | 55 (2.7%) | 101 (3.3%) |
| $1,000,000 or more | 38 (1.9%) | 68 (2.2%) |
| Total | 2,037 (100.0%) | 3,093 (100.0%) |
Household Income by Mortgage Status in Ocean Pines
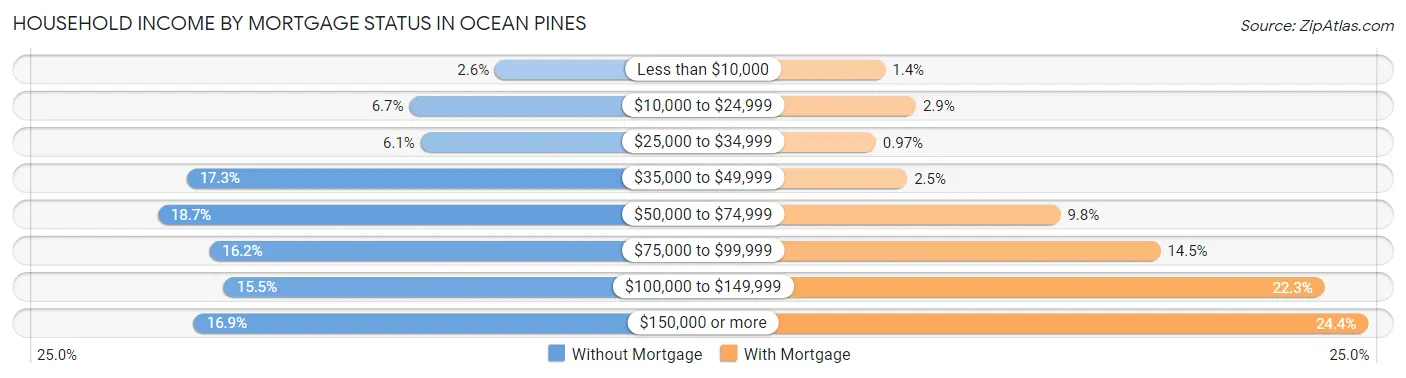
| Household Income | Without Mortgage | With Mortgage |
| Less than $10,000 | 53 (2.6%) | 44 (1.4%) |
| $10,000 to $24,999 | 136 (6.7%) | 89 (2.9%) |
| $25,000 to $34,999 | 125 (6.1%) | 30 (1.0%) |
| $35,000 to $49,999 | 352 (17.3%) | 76 (2.5%) |
| $50,000 to $74,999 | 380 (18.6%) | 302 (9.8%) |
| $75,000 to $99,999 | 330 (16.2%) | 449 (14.5%) |
| $100,000 to $149,999 | 316 (15.5%) | 691 (22.3%) |
| $150,000 or more | 345 (16.9%) | 755 (24.4%) |
| Total | 2,037 (100.0%) | 3,093 (100.0%) |
Property Value to Household Income Ratio in Ocean Pines
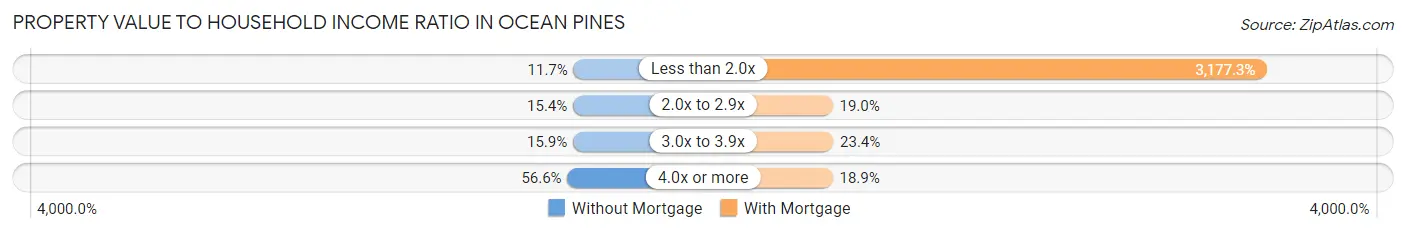
| Value-to-Income Ratio | Without Mortgage | With Mortgage |
| Less than 2.0x | 238 (11.7%) | 98,273 (3,177.3%) |
| 2.0x to 2.9x | 314 (15.4%) | 586 (19.0%) |
| 3.0x to 3.9x | 324 (15.9%) | 724 (23.4%) |
| 4.0x or more | 1,152 (56.6%) | 585 (18.9%) |
| Total | 2,037 (100.0%) | 3,093 (100.0%) |
Real Estate Taxes by Mortgage Status in Ocean Pines
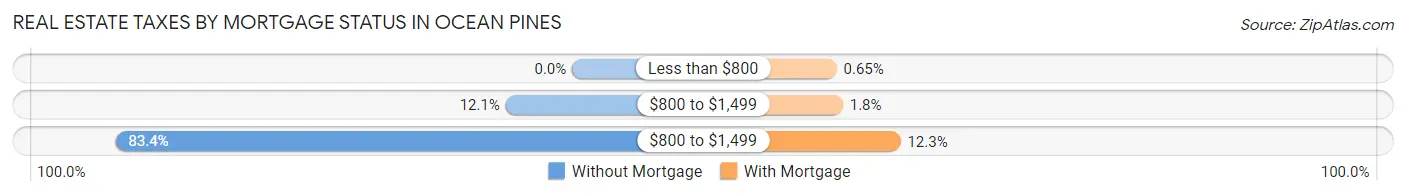
| Property Taxes | Without Mortgage | With Mortgage |
| Less than $800 | 0 (0.0%) | 20 (0.6%) |
| $800 to $1,499 | 247 (12.1%) | 55 (1.8%) |
| $800 to $1,499 | 1,699 (83.4%) | 381 (12.3%) |
| Total | 2,037 (100.0%) | 3,093 (100.0%) |
Health & Disability in Ocean Pines
Health Insurance Coverage by Age in Ocean Pines
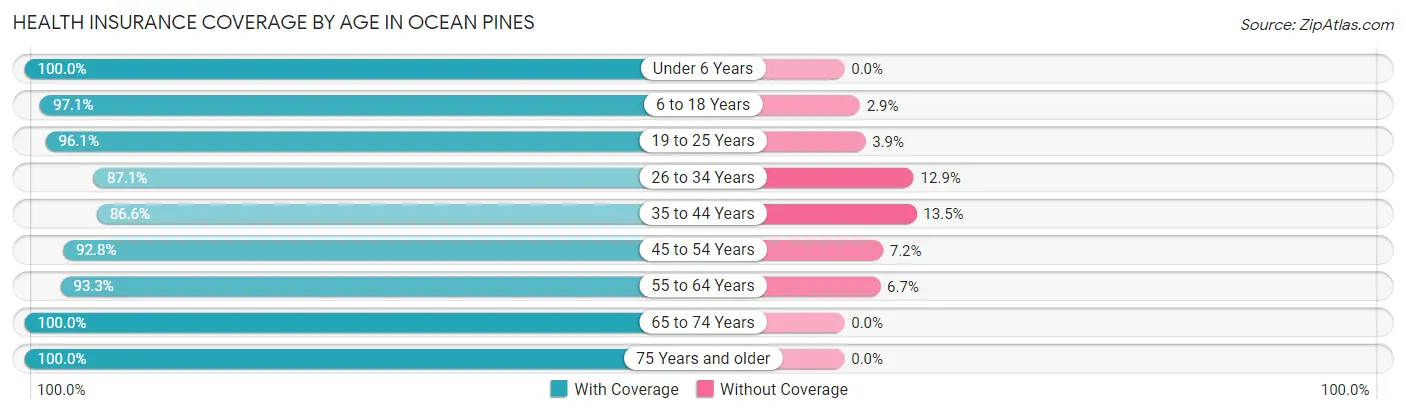
| Age Bracket | With Coverage | Without Coverage |
| Under 6 Years | 467 (100.0%) | 0 (0.0%) |
| 6 to 18 Years | 1,009 (97.1%) | 30 (2.9%) |
| 19 to 25 Years | 296 (96.1%) | 12 (3.9%) |
| 26 to 34 Years | 835 (87.1%) | 124 (12.9%) |
| 35 to 44 Years | 727 (86.6%) | 113 (13.5%) |
| 45 to 54 Years | 1,034 (92.8%) | 80 (7.2%) |
| 55 to 64 Years | 2,068 (93.3%) | 148 (6.7%) |
| 65 to 74 Years | 2,987 (100.0%) | 0 (0.0%) |
| 75 Years and older | 2,347 (100.0%) | 0 (0.0%) |
| Total | 11,770 (95.9%) | 507 (4.1%) |
Health Insurance Coverage by Citizenship Status in Ocean Pines
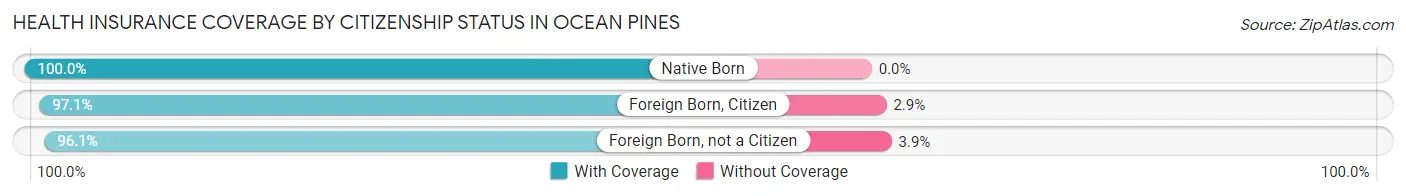
| Citizenship Status | With Coverage | Without Coverage |
| Native Born | 467 (100.0%) | 0 (0.0%) |
| Foreign Born, Citizen | 1,009 (97.1%) | 30 (2.9%) |
| Foreign Born, not a Citizen | 296 (96.1%) | 12 (3.9%) |
Health Insurance Coverage by Household Income in Ocean Pines
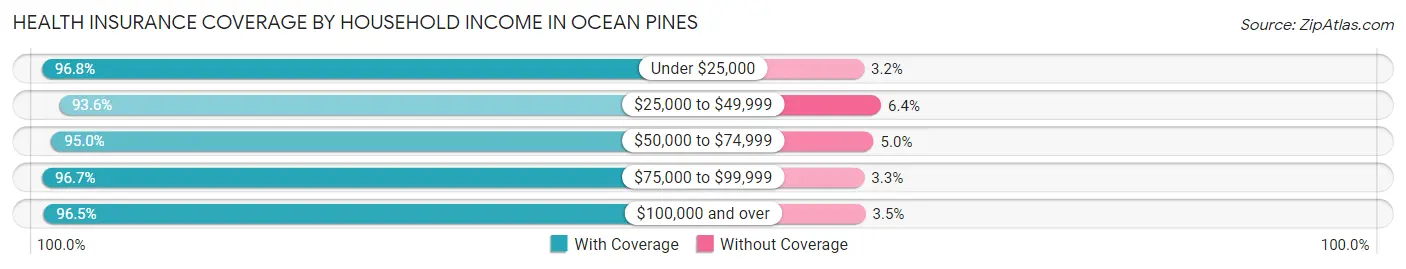
| Household Income | With Coverage | Without Coverage |
| Under $25,000 | 507 (96.8%) | 17 (3.2%) |
| $25,000 to $49,999 | 1,643 (93.6%) | 113 (6.4%) |
| $50,000 to $74,999 | 1,924 (95.0%) | 102 (5.0%) |
| $75,000 to $99,999 | 2,375 (96.7%) | 81 (3.3%) |
| $100,000 and over | 5,321 (96.5%) | 194 (3.5%) |
Public vs Private Health Insurance Coverage by Age in Ocean Pines
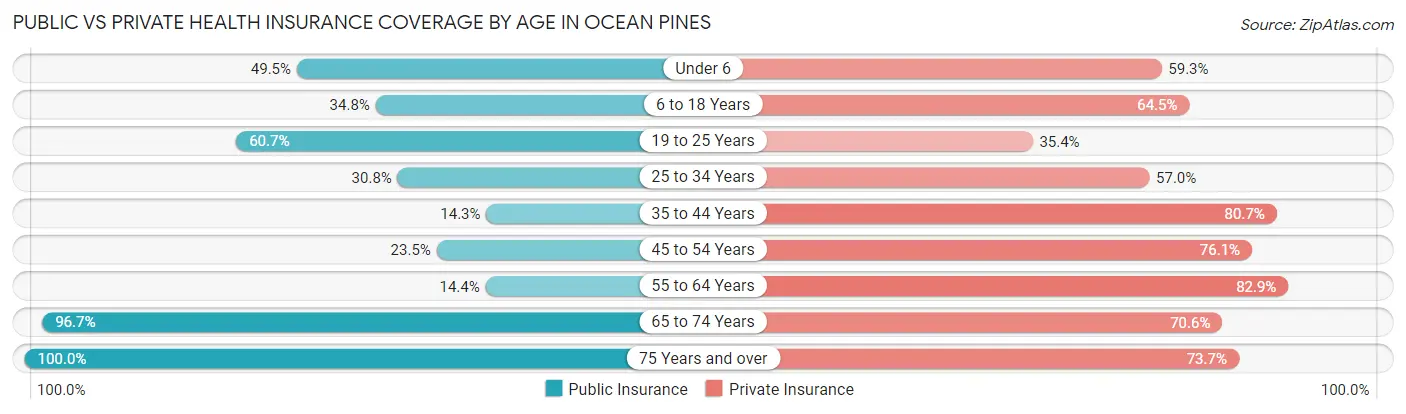
| Age Bracket | Public Insurance | Private Insurance |
| Under 6 | 231 (49.5%) | 277 (59.3%) |
| 6 to 18 Years | 362 (34.8%) | 670 (64.5%) |
| 19 to 25 Years | 187 (60.7%) | 109 (35.4%) |
| 25 to 34 Years | 295 (30.8%) | 547 (57.0%) |
| 35 to 44 Years | 120 (14.3%) | 678 (80.7%) |
| 45 to 54 Years | 262 (23.5%) | 848 (76.1%) |
| 55 to 64 Years | 320 (14.4%) | 1,836 (82.9%) |
| 65 to 74 Years | 2,889 (96.7%) | 2,109 (70.6%) |
| 75 Years and over | 2,347 (100.0%) | 1,729 (73.7%) |
| Total | 7,013 (57.1%) | 8,803 (71.7%) |
Disability Status by Sex by Age in Ocean Pines
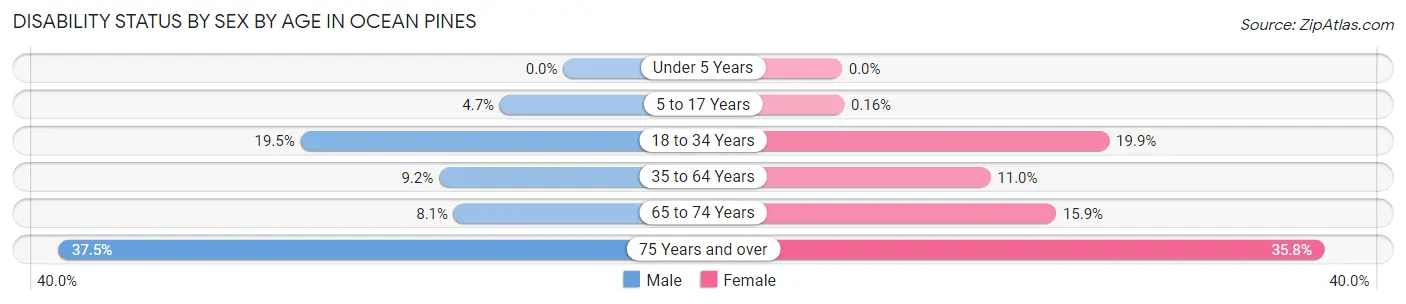
| Age Bracket | Male | Female |
| Under 5 Years | 0 (0.0%) | 0 (0.0%) |
| 5 to 17 Years | 21 (4.7%) | 1 (0.2%) |
| 18 to 34 Years | 127 (19.5%) | 130 (19.9%) |
| 35 to 64 Years | 204 (9.2%) | 216 (11.0%) |
| 65 to 74 Years | 114 (8.1%) | 252 (15.9%) |
| 75 Years and over | 409 (37.4%) | 449 (35.8%) |
Disability Class by Sex by Age in Ocean Pines
Disability Class: Hearing Difficulty
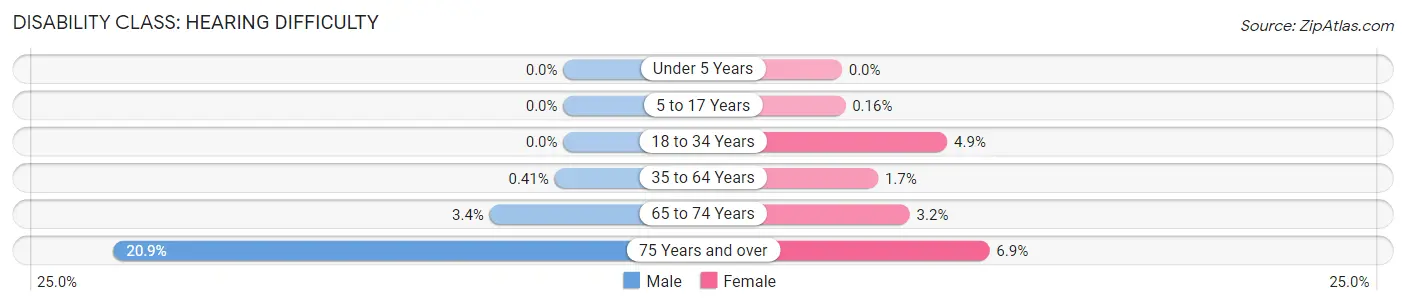
| Age Bracket | Male | Female |
| Under 5 Years | 0 (0.0%) | 0 (0.0%) |
| 5 to 17 Years | 0 (0.0%) | 1 (0.2%) |
| 18 to 34 Years | 0 (0.0%) | 32 (4.9%) |
| 35 to 64 Years | 9 (0.4%) | 33 (1.7%) |
| 65 to 74 Years | 48 (3.4%) | 50 (3.2%) |
| 75 Years and over | 228 (20.9%) | 86 (6.9%) |
Disability Class: Vision Difficulty
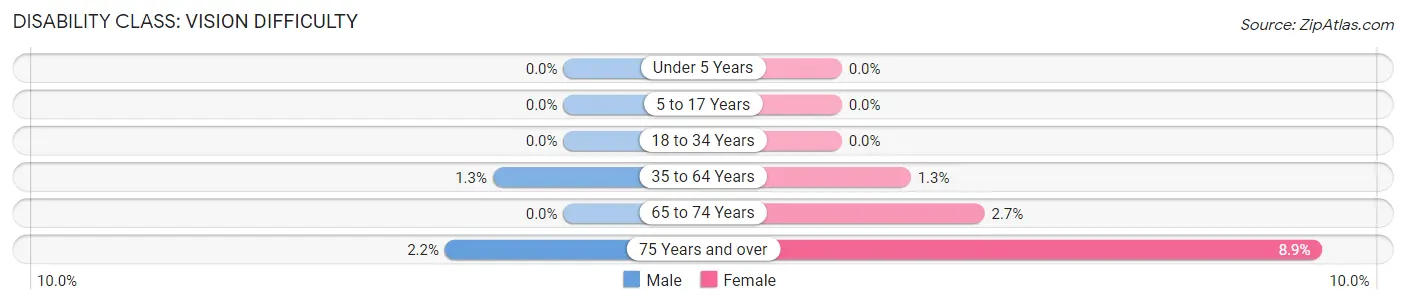
| Age Bracket | Male | Female |
| Under 5 Years | 0 (0.0%) | 0 (0.0%) |
| 5 to 17 Years | 0 (0.0%) | 0 (0.0%) |
| 18 to 34 Years | 0 (0.0%) | 0 (0.0%) |
| 35 to 64 Years | 29 (1.3%) | 25 (1.3%) |
| 65 to 74 Years | 0 (0.0%) | 42 (2.6%) |
| 75 Years and over | 24 (2.2%) | 112 (8.9%) |
Disability Class: Cognitive Difficulty
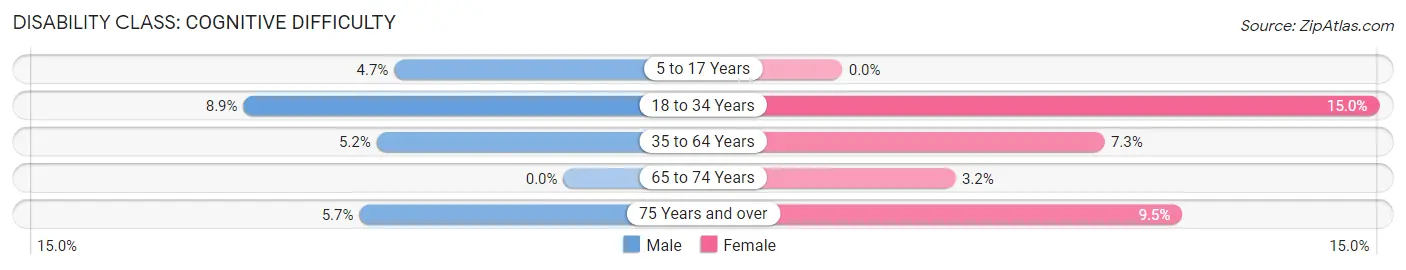
| Age Bracket | Male | Female |
| 5 to 17 Years | 21 (4.7%) | 0 (0.0%) |
| 18 to 34 Years | 58 (8.9%) | 98 (15.0%) |
| 35 to 64 Years | 115 (5.2%) | 143 (7.3%) |
| 65 to 74 Years | 0 (0.0%) | 50 (3.2%) |
| 75 Years and over | 62 (5.7%) | 119 (9.5%) |
Disability Class: Ambulatory Difficulty
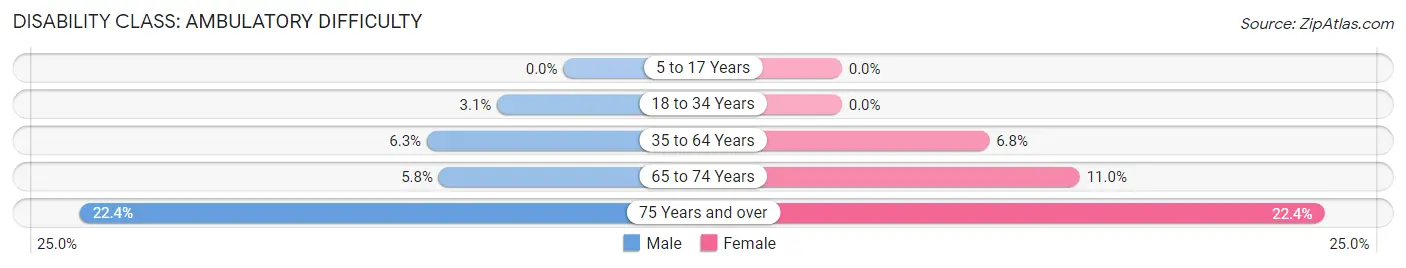
| Age Bracket | Male | Female |
| 5 to 17 Years | 0 (0.0%) | 0 (0.0%) |
| 18 to 34 Years | 20 (3.1%) | 0 (0.0%) |
| 35 to 64 Years | 140 (6.3%) | 134 (6.8%) |
| 65 to 74 Years | 81 (5.8%) | 175 (11.0%) |
| 75 Years and over | 245 (22.4%) | 281 (22.4%) |
Disability Class: Self-Care Difficulty
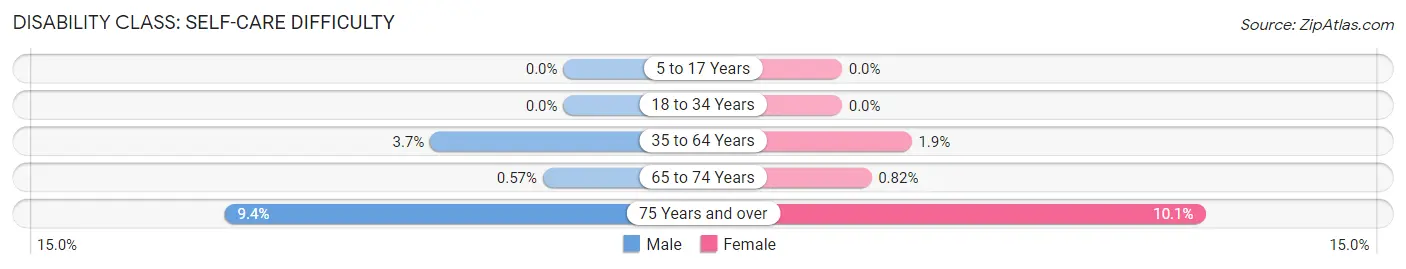
| Age Bracket | Male | Female |
| 5 to 17 Years | 0 (0.0%) | 0 (0.0%) |
| 18 to 34 Years | 0 (0.0%) | 0 (0.0%) |
| 35 to 64 Years | 82 (3.7%) | 38 (1.9%) |
| 65 to 74 Years | 8 (0.6%) | 13 (0.8%) |
| 75 Years and over | 103 (9.4%) | 127 (10.1%) |
Technology Access in Ocean Pines
Computing Device Access in Ocean Pines
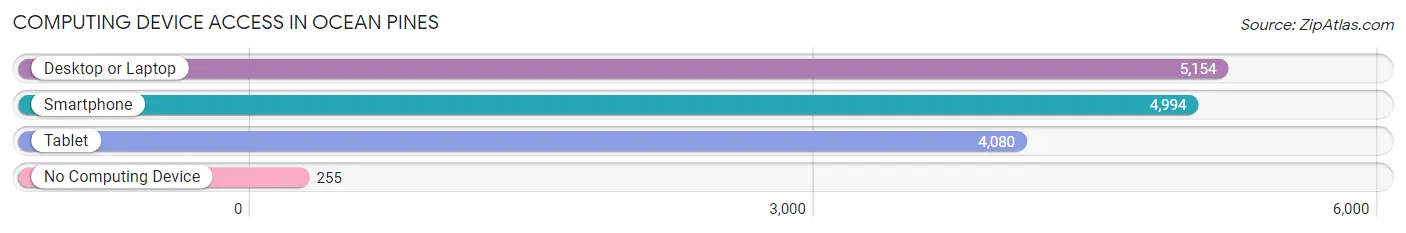
| Device Type | # Households | % Households |
| Desktop or Laptop | 5,154 | 89.1% |
| Smartphone | 4,994 | 86.3% |
| Tablet | 4,080 | 70.5% |
| No Computing Device | 255 | 4.4% |
| Total | 5,787 | 100.0% |
Internet Access in Ocean Pines
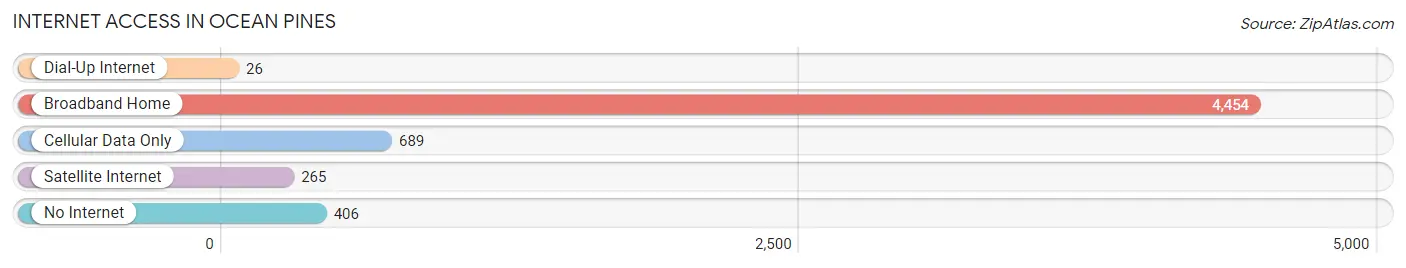
| Internet Type | # Households | % Households |
| Dial-Up Internet | 26 | 0.4% |
| Broadband Home | 4,454 | 77.0% |
| Cellular Data Only | 689 | 11.9% |
| Satellite Internet | 265 | 4.6% |
| No Internet | 406 | 7.0% |
| Total | 5,787 | 100.0% |
Ocean Pines Summary
History
Ocean Pines, Maryland is a census-designated place located in Worcester County, Maryland. It is located on the eastern shore of Maryland, just south of Ocean City. The area was first settled in the late 1700s by a group of Quakers from Pennsylvania. The Quakers named the area “Ocean Pines” because of the abundance of pine trees in the area. The area was primarily used for farming and fishing until the 1950s when the area began to be developed for residential use.
The area was officially incorporated as a town in 1973 and has since grown to become a popular vacation destination. The town is home to a variety of attractions, including a golf course, a marina, and a beach. The town also hosts a variety of events throughout the year, including the Ocean Pines Festival, which is held every summer.
Geography
Ocean Pines is located in Worcester County, Maryland, on the eastern shore of Maryland. It is located just south of Ocean City and is bordered by the Assawoman Bay to the east and the Isle of Wight Bay to the west. The town is located on a peninsula, with the Atlantic Ocean to the south and the Pocomoke River to the north. The town covers an area of approximately 8.5 square miles and has a population of approximately 10,000 people.
The town is located in a humid subtropical climate zone, with hot, humid summers and mild winters. The average temperature in the summer is around 80 degrees Fahrenheit, while the average temperature in the winter is around 40 degrees Fahrenheit. The town receives an average of 45 inches of precipitation per year, with most of it falling in the summer months.
Economy
The economy of Ocean Pines is largely based on tourism and recreation. The town is home to a variety of attractions, including a golf course, a marina, and a beach. The town also hosts a variety of events throughout the year, including the Ocean Pines Festival, which is held every summer.
The town is also home to a variety of businesses, including restaurants, retail stores, and professional services. The town is also home to a variety of manufacturing and industrial businesses, including a boat manufacturing plant and a seafood processing plant.
Demographics
As of the 2010 census, the population of Ocean Pines was 10,039. The population is predominantly white (90.2%), with a small percentage of African Americans (4.2%), Hispanics (2.7%), and Asians (1.7%). The median household income in the town is $60,000, and the median home value is $250,000. The town has a high rate of homeownership, with approximately 80% of the population owning their own homes. The town also has a high rate of educational attainment, with approximately 90% of the population having at least a high school diploma.
Common Questions
What is Per Capita Income in Ocean Pines?
Per Capita income in Ocean Pines is $50,886.
What is the Median Family Income in Ocean Pines?
Median Family Income in Ocean Pines is $95,625.
What is the Median Household income in Ocean Pines?
Median Household Income in Ocean Pines is $88,632.
What is Income or Wage Gap in Ocean Pines?
Income or Wage Gap in Ocean Pines is 17.6%.
Women in Ocean Pines earn 82.4 cents for every dollar earned by a man.
What is Inequality or Gini Index in Ocean Pines?
Inequality or Gini Index in Ocean Pines is 0.40.
What is the Total Population of Ocean Pines?
Total Population of Ocean Pines is 12,312.
What is the Total Male Population of Ocean Pines?
Total Male Population of Ocean Pines is 6,061.
What is the Total Female Population of Ocean Pines?
Total Female Population of Ocean Pines is 6,251.
What is the Ratio of Males per 100 Females in Ocean Pines?
There are 96.96 Males per 100 Females in Ocean Pines.
What is the Ratio of Females per 100 Males in Ocean Pines?
There are 103.13 Females per 100 Males in Ocean Pines.
What is the Median Population Age in Ocean Pines?
Median Population Age in Ocean Pines is 62.6 Years.
What is the Average Family Size in Ocean Pines
Average Family Size in Ocean Pines is 2.5 People.
What is the Average Household Size in Ocean Pines
Average Household Size in Ocean Pines is 2.1 People.
How Large is the Labor Force in Ocean Pines?
There are 4,967 People in the Labor Forcein in Ocean Pines.
What is the Percentage of People in the Labor Force in Ocean Pines?
45.1% of People are in the Labor Force in Ocean Pines.
What is the Unemployment Rate in Ocean Pines?
Unemployment Rate in Ocean Pines is 5.5%.