Tucker, GA Map & Demographics
Tucker Map
Tucker Overview
$43,811
PER CAPITA INCOME
$101,912
AVG FAMILY INCOME
$80,311
AVG HOUSEHOLD INCOME
10.7%
WAGE / INCOME GAP [ % ]
89.3¢/ $1
WAGE / INCOME GAP [ $ ]
0.45
INEQUALITY / GINI INDEX
36,994
TOTAL POPULATION
17,918
MALE POPULATION
19,076
FEMALE POPULATION
93.93
MALES / 100 FEMALES
106.46
FEMALES / 100 MALES
43.8
MEDIAN AGE
3.2
AVG FAMILY SIZE
2.5
AVG HOUSEHOLD SIZE
19,502
LABOR FORCE [ PEOPLE ]
63.1%
PERCENT IN LABOR FORCE
6.0%
UNEMPLOYMENT RATE
Tucker Zip Codes
Tucker Area Codes
Income in Tucker
Income Overview in Tucker
Per Capita Income in Tucker is $43,811, while median incomes of families and households are $101,912 and $80,311 respectively.
| Characteristic | Number | Measure |
| Per Capita Income | 36,994 | $43,811 |
| Median Family Income | 8,898 | $101,912 |
| Mean Family Income | 8,898 | $121,561 |
| Median Household Income | 14,906 | $80,311 |
| Mean Household Income | 14,906 | $103,383 |
| Income Deficit | 8,898 | $0 |
| Wage / Income Gap (%) | 36,994 | 10.73% |
| Wage / Income Gap ($) | 36,994 | 89.27¢ per $1 |
| Gini / Inequality Index | 36,994 | 0.45 |
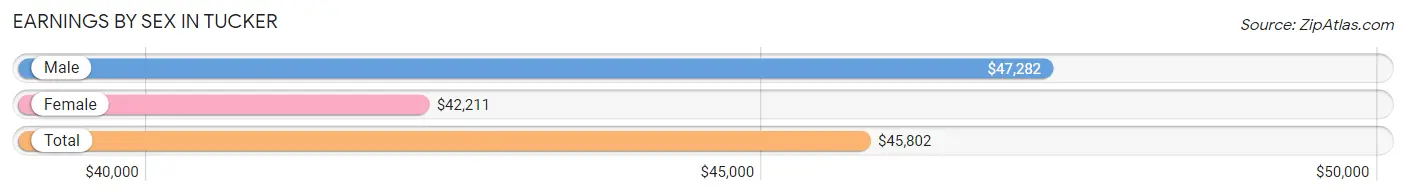
Earnings by Sex in Tucker
Average Earnings in Tucker are $45,802, $47,282 for men and $42,211 for women, a difference of 10.7%.
| Sex | Number | Average Earnings |
| Male | 10,111 (50.7%) | $47,282 |
| Female | 9,837 (49.3%) | $42,211 |
| Total | 19,948 (100.0%) | $45,802 |
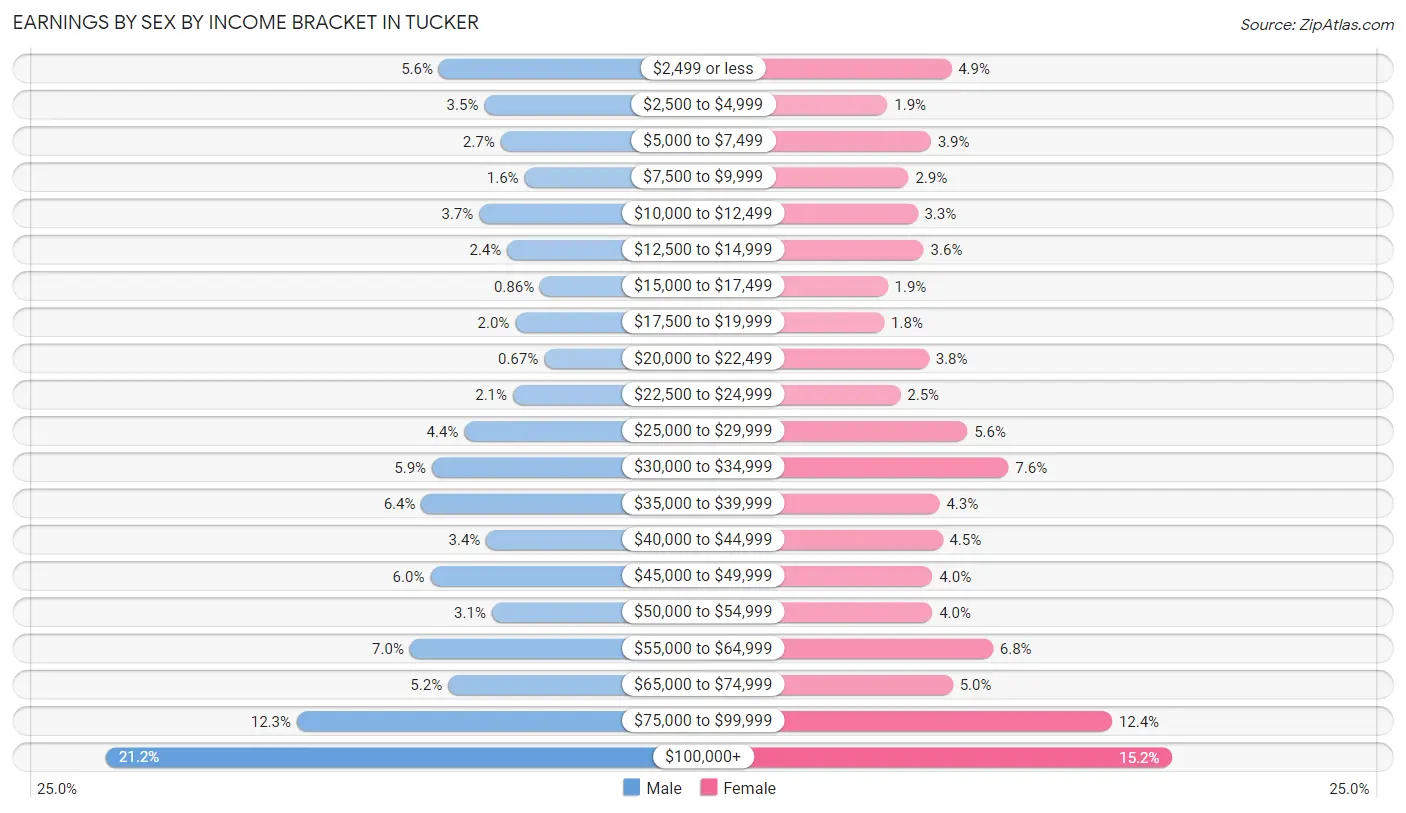
Earnings by Sex by Income Bracket in Tucker
The most common earnings brackets in Tucker are $100,000+ for men (2,143 | 21.2%) and $100,000+ for women (1,495 | 15.2%).
| Income | Male | Female |
| $2,499 or less | 566 (5.6%) | 481 (4.9%) |
| $2,500 to $4,999 | 351 (3.5%) | 187 (1.9%) |
| $5,000 to $7,499 | 274 (2.7%) | 387 (3.9%) |
| $7,500 to $9,999 | 161 (1.6%) | 284 (2.9%) |
| $10,000 to $12,499 | 375 (3.7%) | 326 (3.3%) |
| $12,500 to $14,999 | 243 (2.4%) | 354 (3.6%) |
| $15,000 to $17,499 | 87 (0.9%) | 188 (1.9%) |
| $17,500 to $19,999 | 204 (2.0%) | 172 (1.8%) |
| $20,000 to $22,499 | 68 (0.7%) | 378 (3.8%) |
| $22,500 to $24,999 | 215 (2.1%) | 247 (2.5%) |
| $25,000 to $29,999 | 446 (4.4%) | 555 (5.6%) |
| $30,000 to $34,999 | 599 (5.9%) | 745 (7.6%) |
| $35,000 to $39,999 | 649 (6.4%) | 427 (4.3%) |
| $40,000 to $44,999 | 342 (3.4%) | 441 (4.5%) |
| $45,000 to $49,999 | 607 (6.0%) | 394 (4.0%) |
| $50,000 to $54,999 | 315 (3.1%) | 393 (4.0%) |
| $55,000 to $64,999 | 704 (7.0%) | 673 (6.8%) |
| $65,000 to $74,999 | 523 (5.2%) | 488 (5.0%) |
| $75,000 to $99,999 | 1,239 (12.2%) | 1,222 (12.4%) |
| $100,000+ | 2,143 (21.2%) | 1,495 (15.2%) |
| Total | 10,111 (100.0%) | 9,837 (100.0%) |
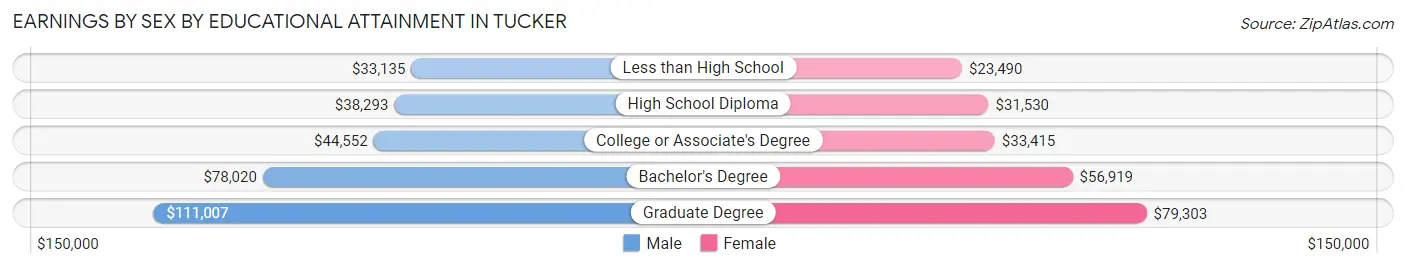
Earnings by Sex by Educational Attainment in Tucker
Average earnings in Tucker are $56,029 for men and $47,164 for women, a difference of 15.8%. Men with an educational attainment of graduate degree enjoy the highest average annual earnings of $111,007, while those with less than high school education earn the least with $33,135. Women with an educational attainment of graduate degree earn the most with the average annual earnings of $79,303, while those with less than high school education have the smallest earnings of $23,490.
| Educational Attainment | Male Income | Female Income |
| Less than High School | $33,135 | $23,490 |
| High School Diploma | $38,293 | $31,530 |
| College or Associate's Degree | $44,552 | $33,415 |
| Bachelor's Degree | $78,020 | $56,919 |
| Graduate Degree | $111,007 | $79,303 |
| Total | $56,029 | $47,164 |
Family Income in Tucker
Family Income Brackets in Tucker
According to the Tucker family income data, there are 2,136 families falling into the $100,000 to $149,999 income range, which is the most common income bracket and makes up 24.0% of all families. Conversely, the less than $10,000 income bracket is the least frequent group with only 258 families (2.9%) belonging to this category.
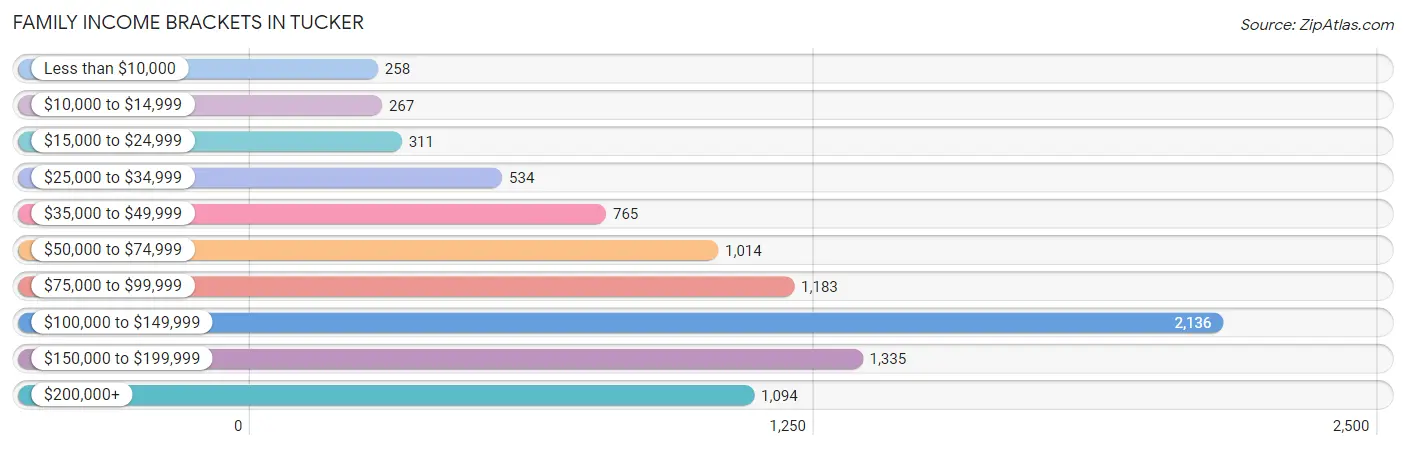
| Income Bracket | # Families | % Families |
| Less than $10,000 | 258 | 2.9% |
| $10,000 to $14,999 | 267 | 3.0% |
| $15,000 to $24,999 | 311 | 3.5% |
| $25,000 to $34,999 | 534 | 6.0% |
| $35,000 to $49,999 | 765 | 8.6% |
| $50,000 to $74,999 | 1,014 | 11.4% |
| $75,000 to $99,999 | 1,183 | 13.3% |
| $100,000 to $149,999 | 2,136 | 24.0% |
| $150,000 to $199,999 | 1,335 | 15.0% |
| $200,000+ | 1,094 | 12.3% |
Family Income by Famaliy Size in Tucker
3-person families (1,908 | 21.4%) account for the highest median family income in Tucker with $122,045 per family, while 2-person families (5,068 | 57.0%) have the highest median income of $49,293 per family member.
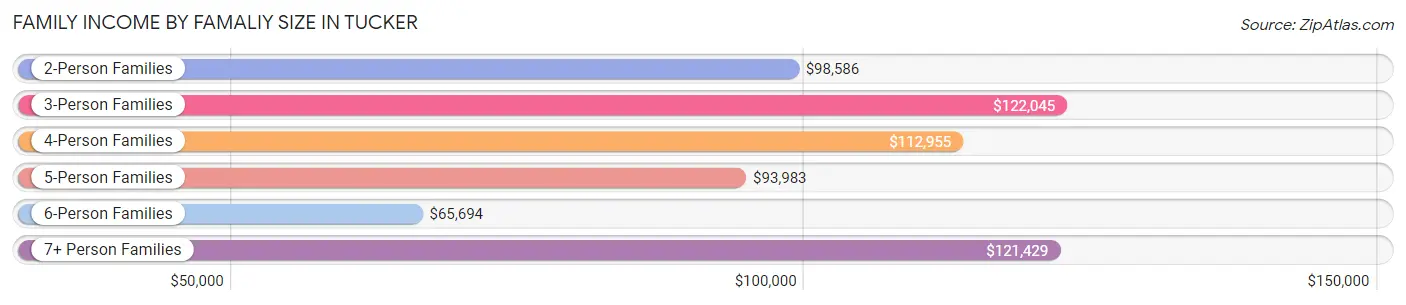
| Income Bracket | # Families | Median Income |
| 2-Person Families | 5,068 (57.0%) | $98,586 |
| 3-Person Families | 1,908 (21.4%) | $122,045 |
| 4-Person Families | 1,056 (11.9%) | $112,955 |
| 5-Person Families | 488 (5.5%) | $93,983 |
| 6-Person Families | 186 (2.1%) | $65,694 |
| 7+ Person Families | 192 (2.2%) | $121,429 |
| Total | 8,898 (100.0%) | $101,912 |
Family Income by Number of Earners in Tucker
The median family income in Tucker is $101,912, with families comprising 2 earners (3,704) having the highest median family income of $131,622, while families with 1 earner (2,930) have the lowest median family income of $64,840, accounting for 41.6% and 32.9% of families, respectively.
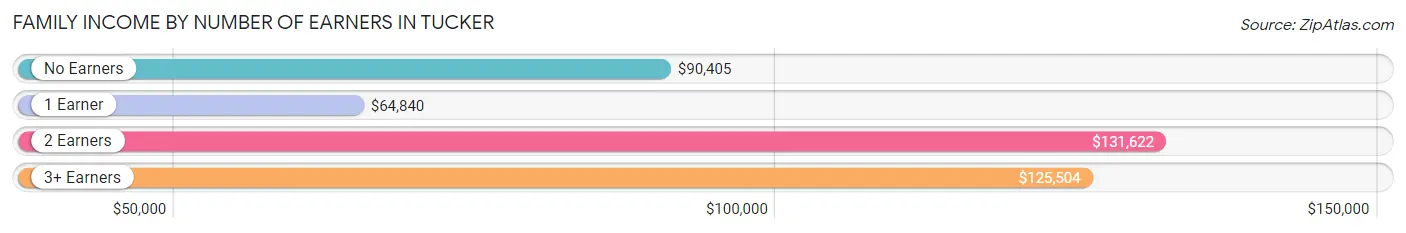
| Number of Earners | # Families | Median Income |
| No Earners | 1,309 (14.7%) | $90,405 |
| 1 Earner | 2,930 (32.9%) | $64,840 |
| 2 Earners | 3,704 (41.6%) | $131,622 |
| 3+ Earners | 955 (10.7%) | $125,504 |
| Total | 8,898 (100.0%) | $101,912 |
Household Income in Tucker
Household Income Brackets in Tucker
With 2,847 households falling in the category, the $100,000 to $149,999 income range is the most frequent in Tucker, accounting for 19.1% of all households. In contrast, only 477 households (3.2%) fall into the $10,000 to $14,999 income bracket, making it the least populous group.
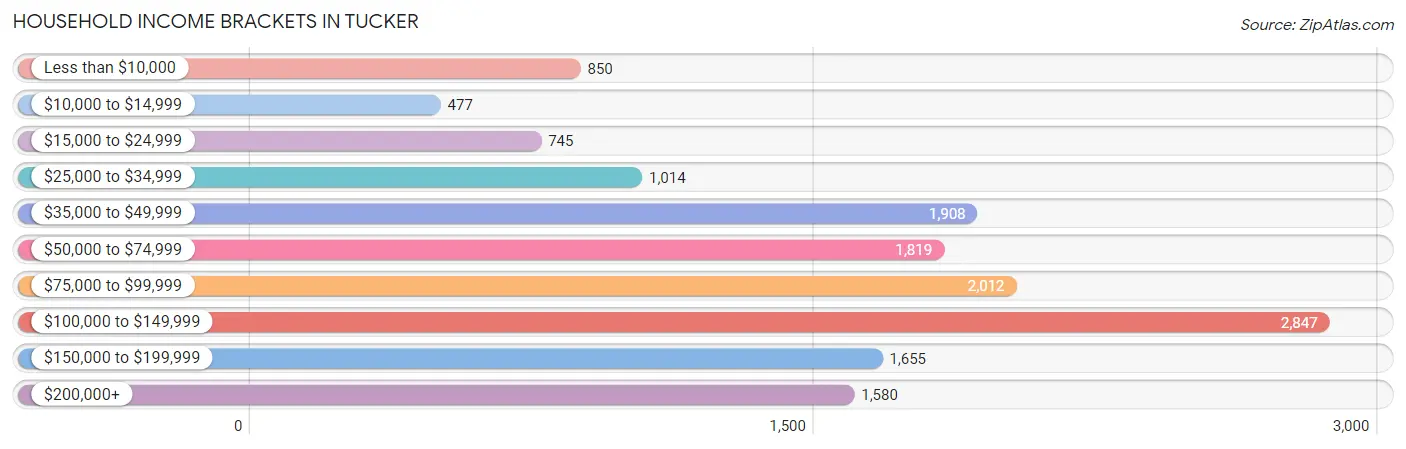
| Income Bracket | # Households | % Households |
| Less than $10,000 | 850 | 5.7% |
| $10,000 to $14,999 | 477 | 3.2% |
| $15,000 to $24,999 | 745 | 5.0% |
| $25,000 to $34,999 | 1,014 | 6.8% |
| $35,000 to $49,999 | 1,908 | 12.8% |
| $50,000 to $74,999 | 1,819 | 12.2% |
| $75,000 to $99,999 | 2,012 | 13.5% |
| $100,000 to $149,999 | 2,847 | 19.1% |
| $150,000 to $199,999 | 1,655 | 11.1% |
| $200,000+ | 1,580 | 10.6% |
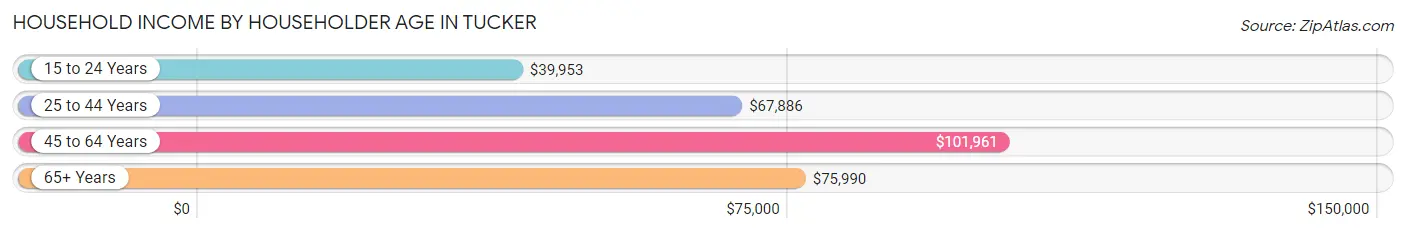
Household Income by Householder Age in Tucker
The median household income in Tucker is $80,311, with the highest median household income of $101,961 found in the 45 to 64 years age bracket for the primary householder. A total of 5,646 households (37.9%) fall into this category. Meanwhile, the 15 to 24 years age bracket for the primary householder has the lowest median household income of $39,953, with 126 households (0.9%) in this group.
| Income Bracket | # Households | Median Income |
| 15 to 24 Years | 126 (0.9%) | $39,953 |
| 25 to 44 Years | 5,008 (33.6%) | $67,886 |
| 45 to 64 Years | 5,646 (37.9%) | $101,961 |
| 65+ Years | 4,126 (27.7%) | $75,990 |
| Total | 14,906 (100.0%) | $80,311 |
Poverty in Tucker
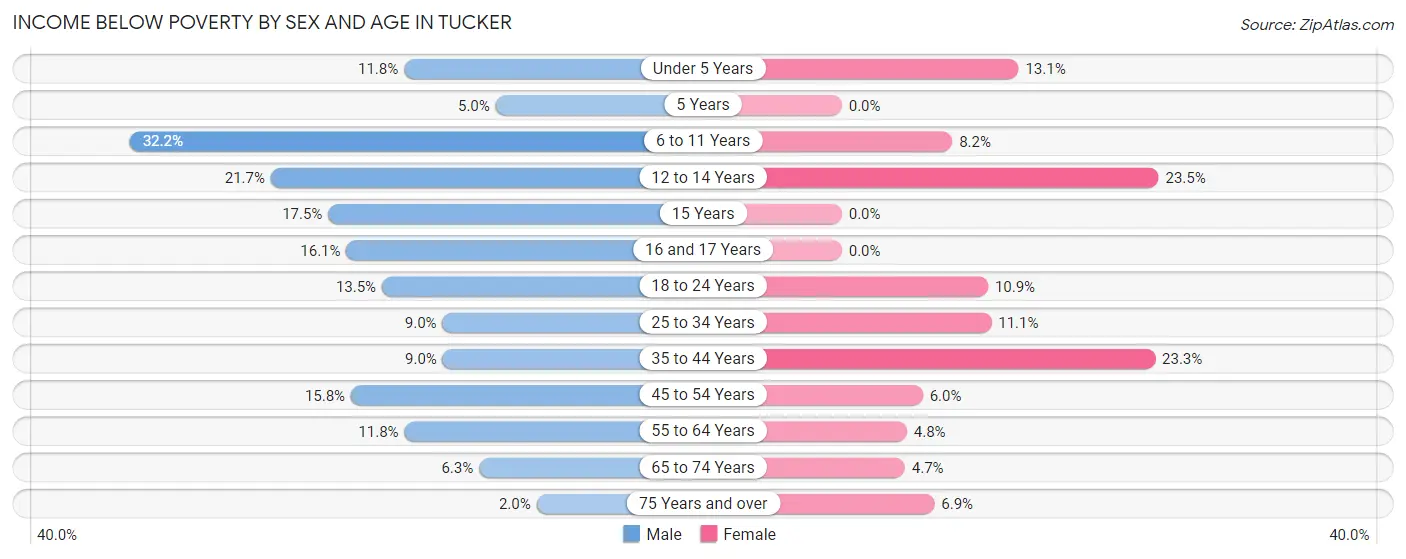
Income Below Poverty by Sex and Age in Tucker
With 12.5% poverty level for males and 10.0% for females among the residents of Tucker, 6 to 11 year old males and 12 to 14 year old females are the most vulnerable to poverty, with 346 males (32.2%) and 127 females (23.5%) in their respective age groups living below the poverty level.
| Age Bracket | Male | Female |
| Under 5 Years | 145 (11.8%) | 146 (13.1%) |
| 5 Years | 16 (5.0%) | 0 (0.0%) |
| 6 to 11 Years | 346 (32.2%) | 71 (8.2%) |
| 12 to 14 Years | 144 (21.7%) | 127 (23.5%) |
| 15 Years | 11 (17.5%) | 0 (0.0%) |
| 16 and 17 Years | 121 (16.1%) | 0 (0.0%) |
| 18 to 24 Years | 215 (13.5%) | 102 (10.8%) |
| 25 to 34 Years | 194 (9.0%) | 278 (11.1%) |
| 35 to 44 Years | 192 (9.0%) | 595 (23.3%) |
| 45 to 54 Years | 480 (15.8%) | 181 (6.0%) |
| 55 to 64 Years | 237 (11.8%) | 133 (4.8%) |
| 65 to 74 Years | 100 (6.3%) | 93 (4.7%) |
| 75 Years and over | 23 (2.0%) | 139 (6.9%) |
| Total | 2,224 (12.5%) | 1,865 (10.0%) |
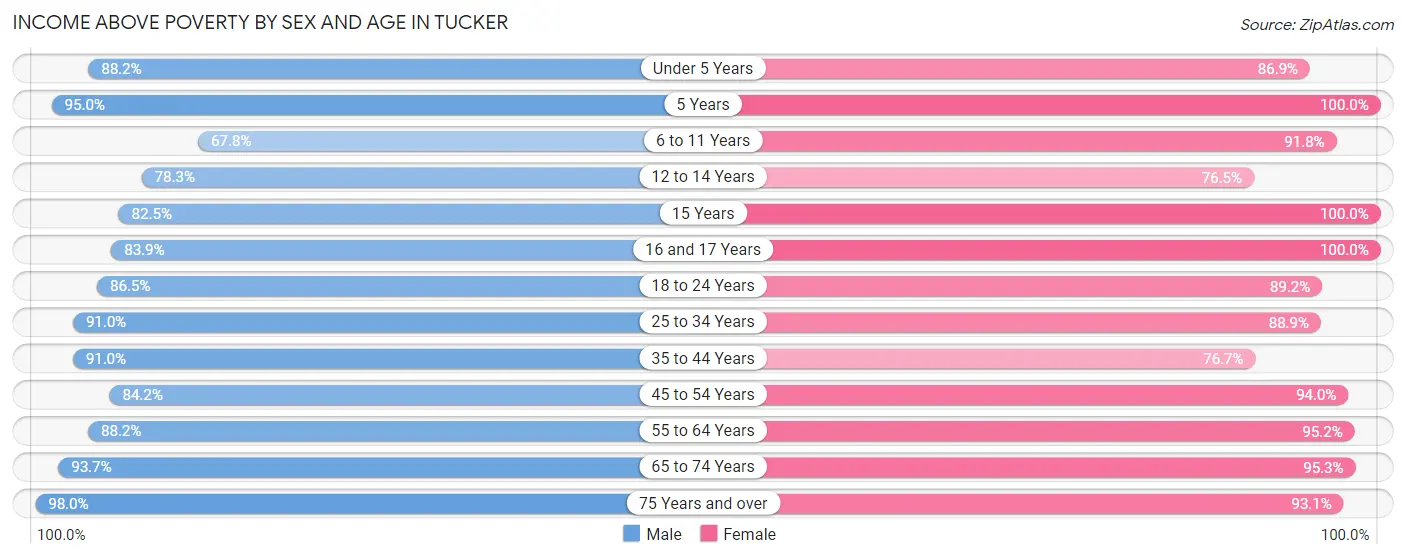
Income Above Poverty by Sex and Age in Tucker
According to the poverty statistics in Tucker, males aged 75 years and over and females aged 5 years are the age groups that are most secure financially, with 98.0% of males and 100.0% of females in these age groups living above the poverty line.
| Age Bracket | Male | Female |
| Under 5 Years | 1,081 (88.2%) | 967 (86.9%) |
| 5 Years | 302 (95.0%) | 157 (100.0%) |
| 6 to 11 Years | 729 (67.8%) | 795 (91.8%) |
| 12 to 14 Years | 519 (78.3%) | 413 (76.5%) |
| 15 Years | 52 (82.5%) | 66 (100.0%) |
| 16 and 17 Years | 630 (83.9%) | 230 (100.0%) |
| 18 to 24 Years | 1,381 (86.5%) | 838 (89.1%) |
| 25 to 34 Years | 1,966 (91.0%) | 2,227 (88.9%) |
| 35 to 44 Years | 1,952 (91.0%) | 1,963 (76.7%) |
| 45 to 54 Years | 2,563 (84.2%) | 2,829 (94.0%) |
| 55 to 64 Years | 1,772 (88.2%) | 2,619 (95.2%) |
| 65 to 74 Years | 1,497 (93.7%) | 1,894 (95.3%) |
| 75 Years and over | 1,135 (98.0%) | 1,883 (93.1%) |
| Total | 15,579 (87.5%) | 16,881 (90.0%) |
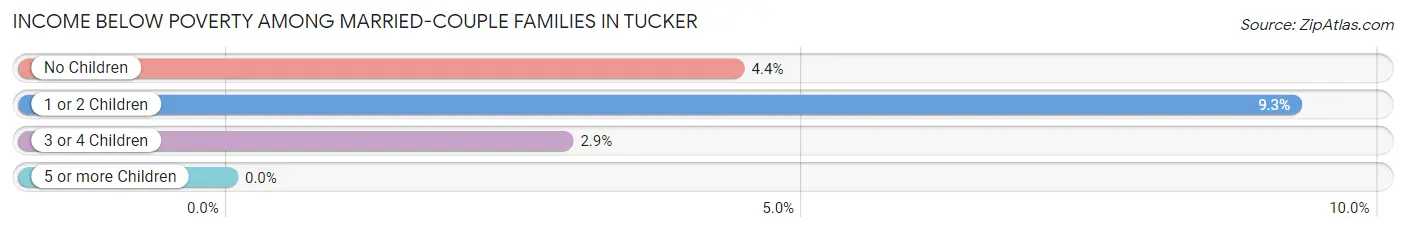
Income Below Poverty Among Married-Couple Families in Tucker
The poverty statistics for married-couple families in Tucker show that 5.6% or 329 of the total 5,890 families live below the poverty line. Families with 1 or 2 children have the highest poverty rate of 9.3%, comprising of 142 families. On the other hand, families with 3 or 4 children have the lowest poverty rate of 2.9%, which includes 10 families.
| Children | Above Poverty | Below Poverty |
| No Children | 3,838 (95.6%) | 177 (4.4%) |
| 1 or 2 Children | 1,391 (90.7%) | 142 (9.3%) |
| 3 or 4 Children | 332 (97.1%) | 10 (2.9%) |
| 5 or more Children | 0 (0.0%) | 0 (0.0%) |
| Total | 5,561 (94.4%) | 329 (5.6%) |
Income Below Poverty Among Single-Parent Households in Tucker
According to the poverty data in Tucker, 3.1% or 23 single-father households and 17.8% or 402 single-mother households are living below the poverty line. Among single-father households, those with 1 or 2 children have the highest poverty rate, with 23 households (8.3%) experiencing poverty. Likewise, among single-mother households, those with 3 or 4 children have the highest poverty rate, with 36 households (33.3%) falling below the poverty line.
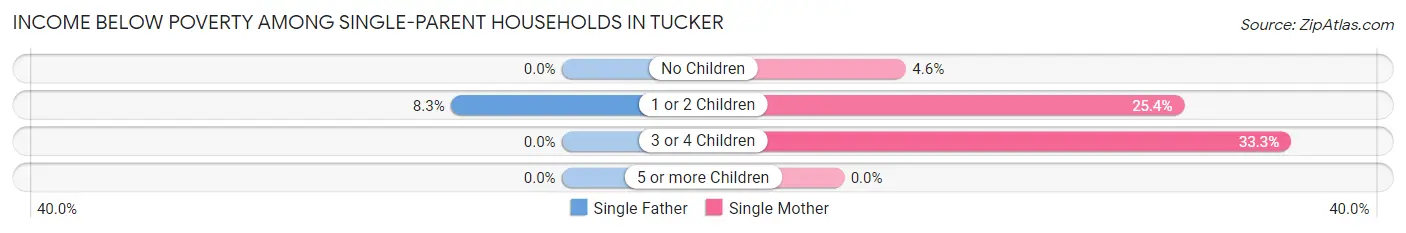
| Children | Single Father | Single Mother |
| No Children | 0 (0.0%) | 40 (4.6%) |
| 1 or 2 Children | 23 (8.3%) | 326 (25.4%) |
| 3 or 4 Children | 0 (0.0%) | 36 (33.3%) |
| 5 or more Children | 0 (0.0%) | 0 (0.0%) |
| Total | 23 (3.1%) | 402 (17.8%) |
Income Below Poverty Among Married-Couple vs Single-Parent Households in Tucker
The poverty data for Tucker shows that 329 of the married-couple family households (5.6%) and 425 of the single-parent households (14.1%) are living below the poverty level. Within the married-couple family households, those with 1 or 2 children have the highest poverty rate, with 142 households (9.3%) falling below the poverty line. Among the single-parent households, those with 3 or 4 children have the highest poverty rate, with 36 household (26.9%) living below poverty.
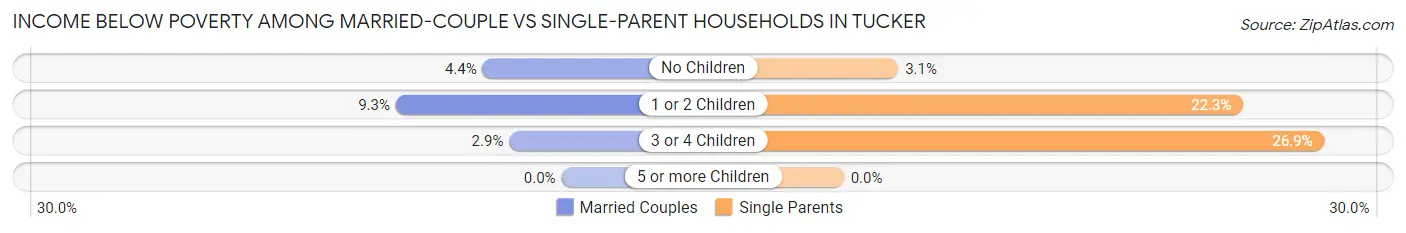
| Children | Married-Couple Families | Single-Parent Households |
| No Children | 177 (4.4%) | 40 (3.0%) |
| 1 or 2 Children | 142 (9.3%) | 349 (22.3%) |
| 3 or 4 Children | 10 (2.9%) | 36 (26.9%) |
| 5 or more Children | 0 (0.0%) | 0 (0.0%) |
| Total | 329 (5.6%) | 425 (14.1%) |
Race in Tucker
The most populous races in Tucker are White / Caucasian (17,733 | 47.9%), Black / African American (13,469 | 36.4%), and Hispanic or Latino (3,895 | 10.5%).
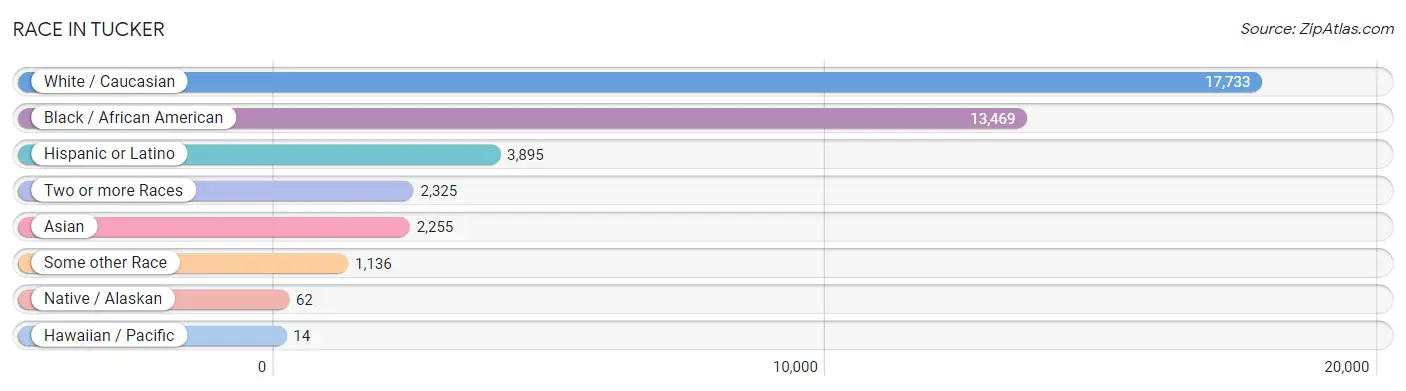
| Race | # Population | % Population |
| Asian | 2,255 | 6.1% |
| Black / African American | 13,469 | 36.4% |
| Hawaiian / Pacific | 14 | 0.0% |
| Hispanic or Latino | 3,895 | 10.5% |
| Native / Alaskan | 62 | 0.2% |
| White / Caucasian | 17,733 | 47.9% |
| Two or more Races | 2,325 | 6.3% |
| Some other Race | 1,136 | 3.1% |
| Total | 36,994 | 100.0% |
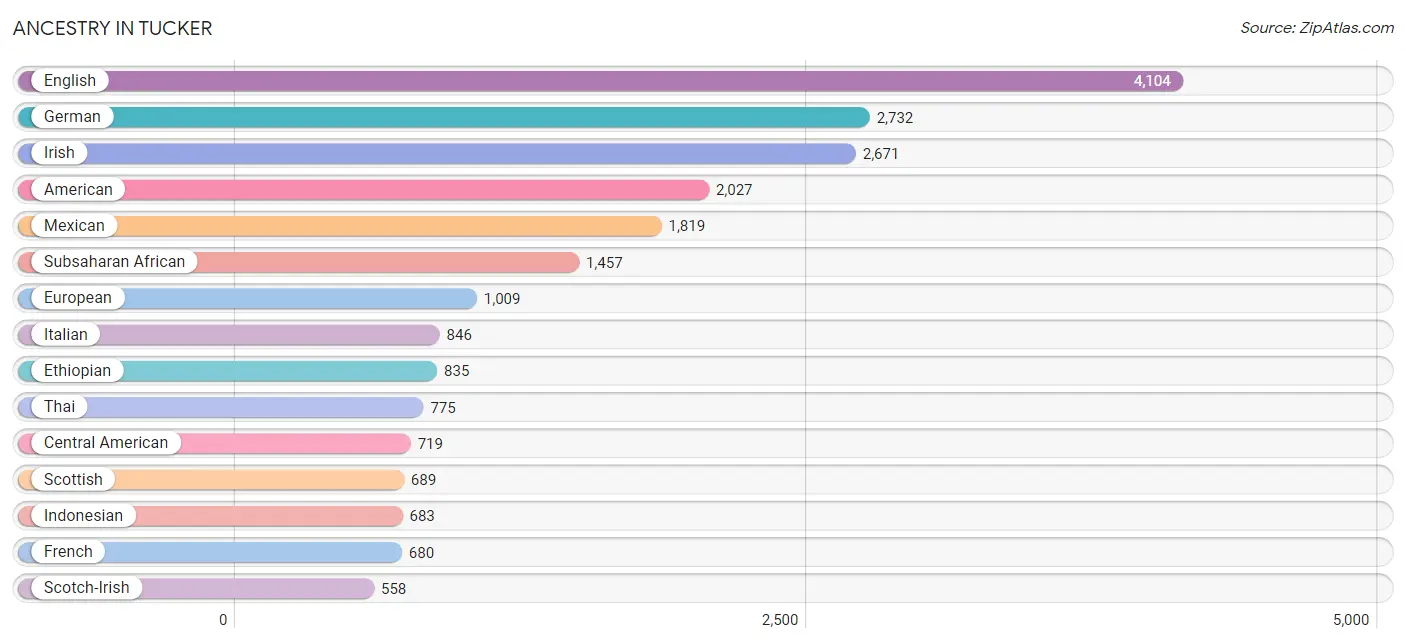
Ancestry in Tucker
The most populous ancestries reported in Tucker are English (4,104 | 11.1%), German (2,732 | 7.4%), Irish (2,671 | 7.2%), American (2,027 | 5.5%), and Mexican (1,819 | 4.9%), together accounting for 36.1% of all Tucker residents.
| Ancestry | # Population | % Population |
| African | 486 | 1.3% |
| American | 2,027 | 5.5% |
| Arab | 320 | 0.9% |
| Austrian | 9 | 0.0% |
| Bahamian | 20 | 0.1% |
| Bhutanese | 40 | 0.1% |
| Brazilian | 19 | 0.1% |
| British | 333 | 0.9% |
| British West Indian | 119 | 0.3% |
| Burmese | 168 | 0.4% |
| Canadian | 110 | 0.3% |
| Central American | 719 | 1.9% |
| Cherokee | 168 | 0.4% |
| Colombian | 63 | 0.2% |
| Croatian | 6 | 0.0% |
| Cuban | 347 | 0.9% |
| Czech | 135 | 0.4% |
| Dominican | 293 | 0.8% |
| Dutch | 334 | 0.9% |
| Eastern European | 51 | 0.1% |
| Ecuadorian | 42 | 0.1% |
| Egyptian | 24 | 0.1% |
| English | 4,104 | 11.1% |
| Ethiopian | 835 | 2.3% |
| European | 1,009 | 2.7% |
| Filipino | 26 | 0.1% |
| French | 680 | 1.8% |
| French Canadian | 16 | 0.0% |
| German | 2,732 | 7.4% |
| Ghanaian | 65 | 0.2% |
| Greek | 69 | 0.2% |
| Guatemalan | 322 | 0.9% |
| Guyanese | 21 | 0.1% |
| Haitian | 216 | 0.6% |
| Honduran | 4 | 0.0% |
| Hungarian | 73 | 0.2% |
| Indian (Asian) | 220 | 0.6% |
| Indonesian | 683 | 1.8% |
| Iranian | 129 | 0.4% |
| Iraqi | 171 | 0.5% |
| Irish | 2,671 | 7.2% |
| Iroquois | 30 | 0.1% |
| Israeli | 168 | 0.4% |
| Italian | 846 | 2.3% |
| Jamaican | 380 | 1.0% |
| Japanese | 32 | 0.1% |
| Korean | 218 | 0.6% |
| Lebanese | 38 | 0.1% |
| Lithuanian | 27 | 0.1% |
| Macedonian | 10 | 0.0% |
| Malaysian | 65 | 0.2% |
| Mexican | 1,819 | 4.9% |
| Mexican American Indian | 71 | 0.2% |
| Nicaraguan | 31 | 0.1% |
| Nigerian | 59 | 0.2% |
| Northern European | 245 | 0.7% |
| Norwegian | 18 | 0.1% |
| Pakistani | 1 | 0.0% |
| Palestinian | 15 | 0.0% |
| Panamanian | 88 | 0.2% |
| Peruvian | 57 | 0.2% |
| Polish | 449 | 1.2% |
| Portuguese | 24 | 0.1% |
| Puerto Rican | 326 | 0.9% |
| Romanian | 85 | 0.2% |
| Russian | 277 | 0.7% |
| Salvadoran | 274 | 0.7% |
| Scandinavian | 42 | 0.1% |
| Scotch-Irish | 558 | 1.5% |
| Scottish | 689 | 1.9% |
| Slovak | 9 | 0.0% |
| South American | 167 | 0.4% |
| Spaniard | 71 | 0.2% |
| Spanish | 19 | 0.1% |
| Sri Lankan | 125 | 0.3% |
| Subsaharan African | 1,457 | 3.9% |
| Sudanese | 20 | 0.1% |
| Swedish | 198 | 0.5% |
| Swiss | 49 | 0.1% |
| Thai | 775 | 2.1% |
| Tongan | 52 | 0.1% |
| Turkish | 63 | 0.2% |
| Ugandan | 14 | 0.0% |
| Venezuelan | 5 | 0.0% |
| Vietnamese | 10 | 0.0% |
| Welsh | 151 | 0.4% |
| West Indian | 91 | 0.3% |
| Yugoslavian | 107 | 0.3% | View All 88 Rows |
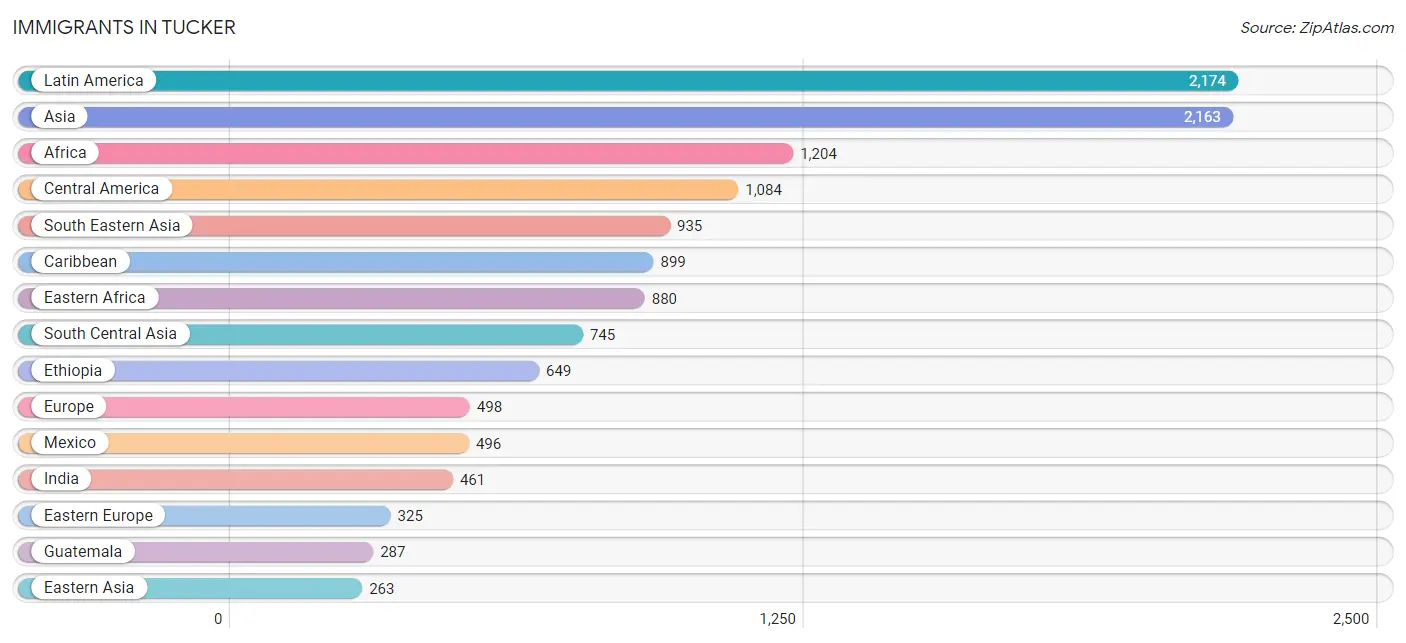
Immigrants in Tucker
The most numerous immigrant groups reported in Tucker came from Latin America (2,174 | 5.9%), Asia (2,163 | 5.9%), Africa (1,204 | 3.3%), Central America (1,084 | 2.9%), and South Eastern Asia (935 | 2.5%), together accounting for 20.4% of all Tucker residents.
| Immigration Origin | # Population | % Population |
| Africa | 1,204 | 3.3% |
| Asia | 2,163 | 5.9% |
| Bahamas | 20 | 0.1% |
| Bangladesh | 43 | 0.1% |
| Bosnia and Herzegovina | 151 | 0.4% |
| Brazil | 19 | 0.1% |
| Canada | 62 | 0.2% |
| Caribbean | 899 | 2.4% |
| Central America | 1,084 | 2.9% |
| China | 136 | 0.4% |
| Colombia | 17 | 0.1% |
| Congo | 24 | 0.1% |
| Croatia | 6 | 0.0% |
| Cuba | 209 | 0.6% |
| Dominican Republic | 104 | 0.3% |
| Eastern Africa | 880 | 2.4% |
| Eastern Asia | 263 | 0.7% |
| Eastern Europe | 325 | 0.9% |
| Ecuador | 42 | 0.1% |
| Egypt | 13 | 0.0% |
| El Salvador | 249 | 0.7% |
| England | 1 | 0.0% |
| Eritrea | 79 | 0.2% |
| Ethiopia | 649 | 1.8% |
| Europe | 498 | 1.3% |
| France | 51 | 0.1% |
| Germany | 85 | 0.2% |
| Ghana | 78 | 0.2% |
| Grenada | 14 | 0.0% |
| Guatemala | 287 | 0.8% |
| Guyana | 27 | 0.1% |
| Haiti | 204 | 0.5% |
| Honduras | 50 | 0.1% |
| India | 461 | 1.3% |
| Iran | 129 | 0.4% |
| Iraq | 152 | 0.4% |
| Israel | 15 | 0.0% |
| Italy | 3 | 0.0% |
| Jamaica | 244 | 0.7% |
| Kenya | 12 | 0.0% |
| Korea | 127 | 0.3% |
| Laos | 44 | 0.1% |
| Latin America | 2,174 | 5.9% |
| Malaysia | 12 | 0.0% |
| Mexico | 496 | 1.3% |
| Middle Africa | 24 | 0.1% |
| Northern Africa | 36 | 0.1% |
| Northern Europe | 34 | 0.1% |
| Pakistan | 112 | 0.3% |
| Panama | 2 | 0.0% |
| Philippines | 162 | 0.4% |
| Romania | 144 | 0.4% |
| Russia | 24 | 0.1% |
| South Africa | 75 | 0.2% |
| South America | 191 | 0.5% |
| South Central Asia | 745 | 2.0% |
| South Eastern Asia | 935 | 2.5% |
| Southern Europe | 3 | 0.0% |
| Sudan | 23 | 0.1% |
| Taiwan | 26 | 0.1% |
| Thailand | 1 | 0.0% |
| Turkey | 53 | 0.1% |
| Venezuela | 86 | 0.2% |
| Vietnam | 78 | 0.2% |
| Western Africa | 78 | 0.2% |
| Western Asia | 220 | 0.6% |
| Western Europe | 136 | 0.4% |
| Zimbabwe | 63 | 0.2% | View All 68 Rows |
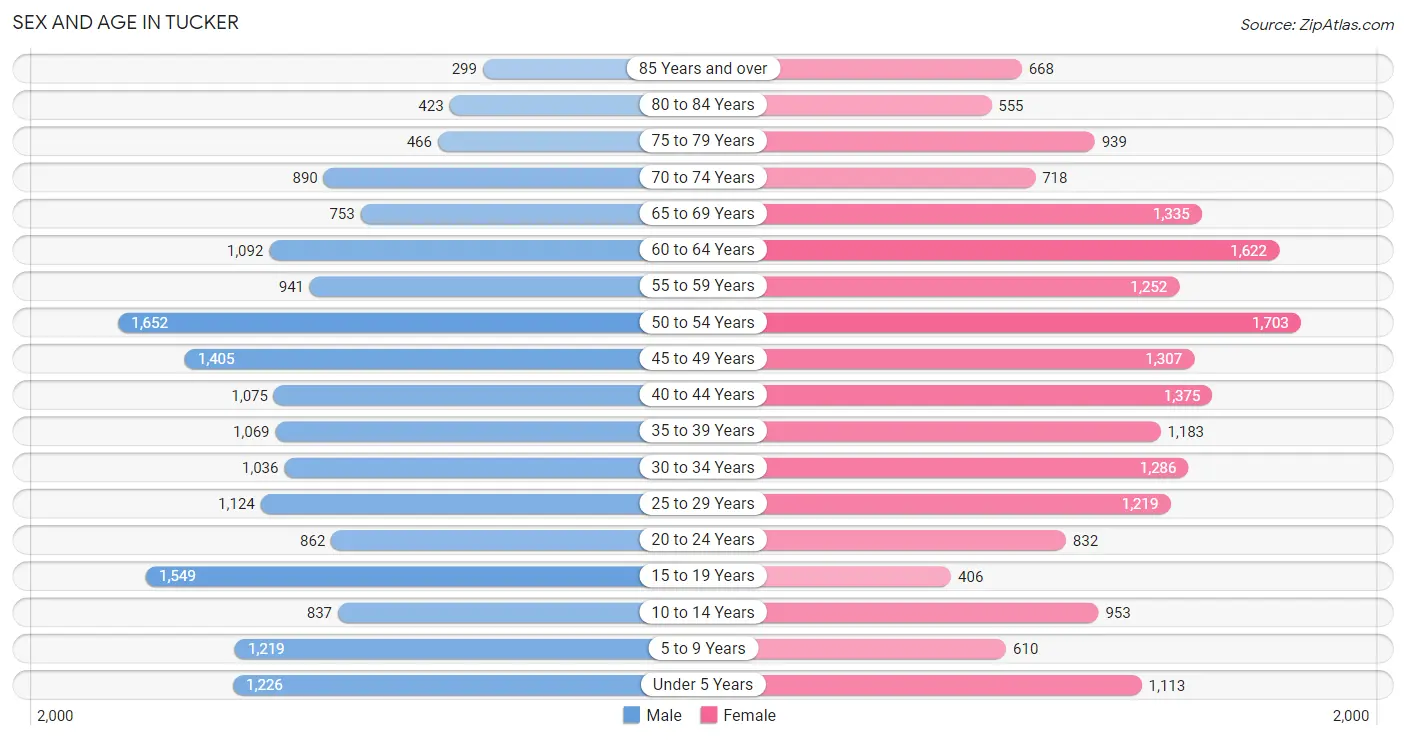
Sex and Age in Tucker
Sex and Age in Tucker
The most populous age groups in Tucker are 50 to 54 Years (1,652 | 9.2%) for men and 50 to 54 Years (1,703 | 8.9%) for women.
| Age Bracket | Male | Female |
| Under 5 Years | 1,226 (6.8%) | 1,113 (5.8%) |
| 5 to 9 Years | 1,219 (6.8%) | 610 (3.2%) |
| 10 to 14 Years | 837 (4.7%) | 953 (5.0%) |
| 15 to 19 Years | 1,549 (8.6%) | 406 (2.1%) |
| 20 to 24 Years | 862 (4.8%) | 832 (4.4%) |
| 25 to 29 Years | 1,124 (6.3%) | 1,219 (6.4%) |
| 30 to 34 Years | 1,036 (5.8%) | 1,286 (6.7%) |
| 35 to 39 Years | 1,069 (6.0%) | 1,183 (6.2%) |
| 40 to 44 Years | 1,075 (6.0%) | 1,375 (7.2%) |
| 45 to 49 Years | 1,405 (7.8%) | 1,307 (6.9%) |
| 50 to 54 Years | 1,652 (9.2%) | 1,703 (8.9%) |
| 55 to 59 Years | 941 (5.2%) | 1,252 (6.6%) |
| 60 to 64 Years | 1,092 (6.1%) | 1,622 (8.5%) |
| 65 to 69 Years | 753 (4.2%) | 1,335 (7.0%) |
| 70 to 74 Years | 890 (5.0%) | 718 (3.8%) |
| 75 to 79 Years | 466 (2.6%) | 939 (4.9%) |
| 80 to 84 Years | 423 (2.4%) | 555 (2.9%) |
| 85 Years and over | 299 (1.7%) | 668 (3.5%) |
| Total | 17,918 (100.0%) | 19,076 (100.0%) |
Families and Households in Tucker
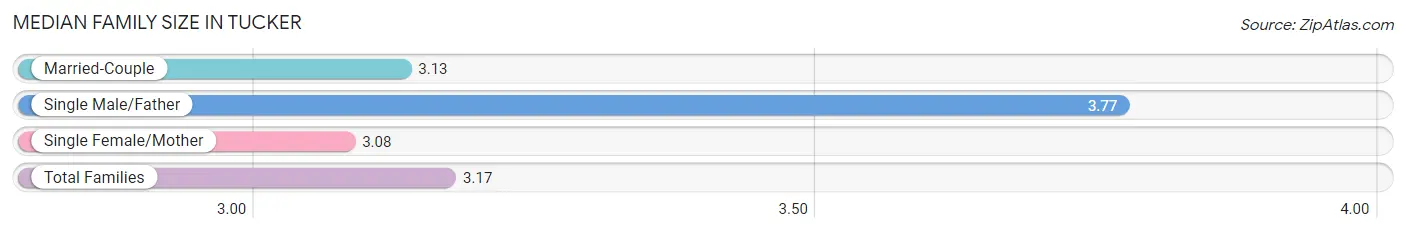
Median Family Size in Tucker
The median family size in Tucker is 3.17 persons per family, with single male/father families (746 | 8.4%) accounting for the largest median family size of 3.77 persons per family. On the other hand, single female/mother families (2,262 | 25.4%) represent the smallest median family size with 3.08 persons per family.
| Family Type | # Families | Family Size |
| Married-Couple | 5,890 (66.2%) | 3.13 |
| Single Male/Father | 746 (8.4%) | 3.77 |
| Single Female/Mother | 2,262 (25.4%) | 3.08 |
| Total Families | 8,898 (100.0%) | 3.17 |
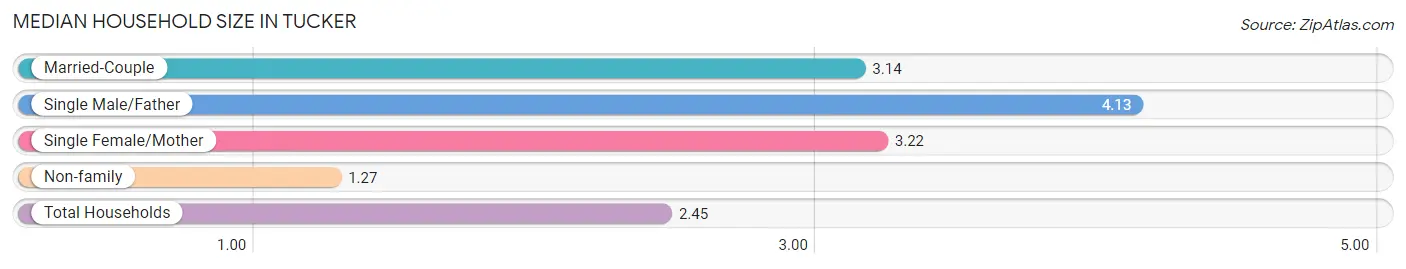
Median Household Size in Tucker
The median household size in Tucker is 2.45 persons per household, with single male/father households (746 | 5.0%) accounting for the largest median household size of 4.13 persons per household. non-family households (6,008 | 40.3%) represent the smallest median household size with 1.27 persons per household.
| Household Type | # Households | Household Size |
| Married-Couple | 5,890 (39.5%) | 3.14 |
| Single Male/Father | 746 (5.0%) | 4.13 |
| Single Female/Mother | 2,262 (15.2%) | 3.22 |
| Non-family | 6,008 (40.3%) | 1.27 |
| Total Households | 14,906 (100.0%) | 2.45 |
Household Size by Marriage Status in Tucker
Out of a total of 14,906 households in Tucker, 8,898 (59.7%) are family households, while 6,008 (40.3%) are nonfamily households. The most numerous type of family households are 2-person households, comprising 4,858, and the most common type of nonfamily households are 1-person households, comprising 4,833.
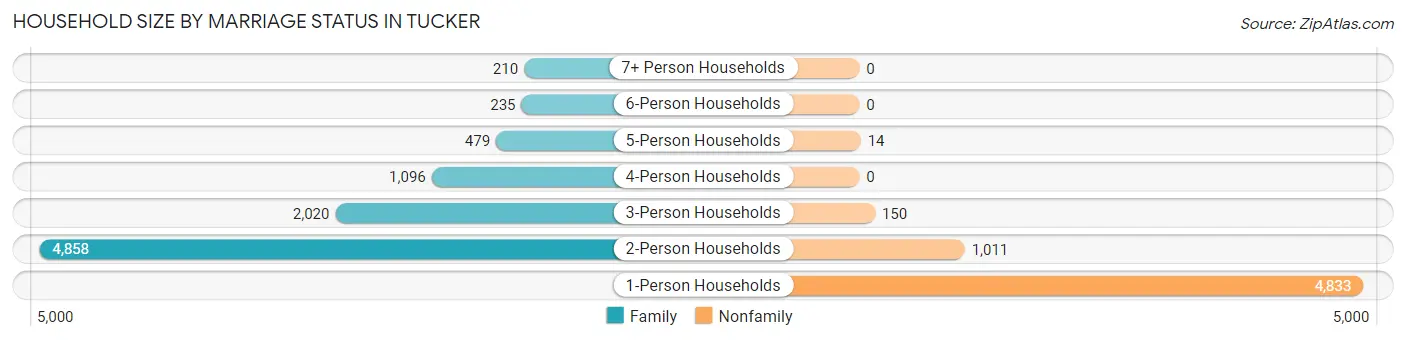
| Household Size | Family Households | Nonfamily Households |
| 1-Person Households | - | 4,833 (32.4%) |
| 2-Person Households | 4,858 (32.6%) | 1,011 (6.8%) |
| 3-Person Households | 2,020 (13.6%) | 150 (1.0%) |
| 4-Person Households | 1,096 (7.3%) | 0 (0.0%) |
| 5-Person Households | 479 (3.2%) | 14 (0.1%) |
| 6-Person Households | 235 (1.6%) | 0 (0.0%) |
| 7+ Person Households | 210 (1.4%) | 0 (0.0%) |
| Total | 8,898 (59.7%) | 6,008 (40.3%) |
Female Fertility in Tucker
Fertility by Age in Tucker
Average fertility rate in Tucker is 48.0 births per 1,000 women. Women in the age bracket of 20 to 34 years have the highest fertility rate with 75.0 births per 1,000 women. Women in the age bracket of 20 to 34 years acount for 63.5% of all women with births.
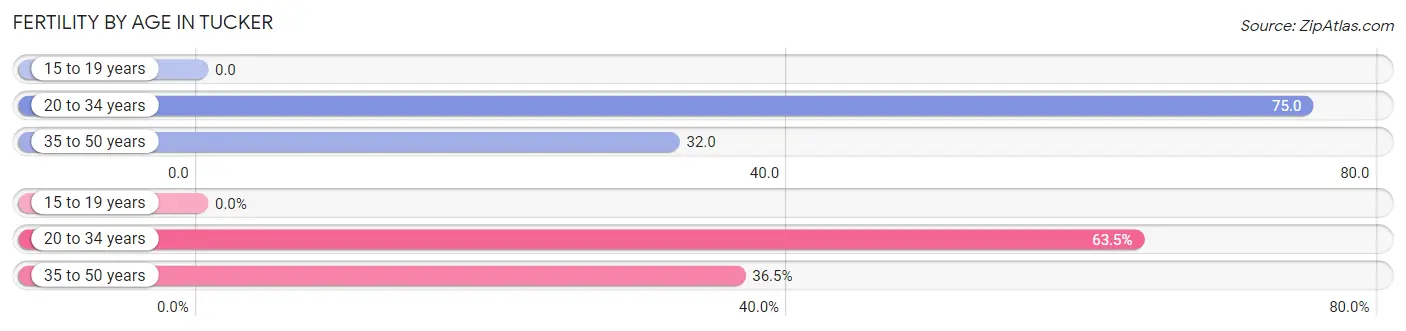
| Age Bracket | Women with Births | Births / 1,000 Women |
| 15 to 19 years | 0 (0.0%) | 0.0 |
| 20 to 34 years | 251 (63.5%) | 75.0 |
| 35 to 50 years | 144 (36.5%) | 32.0 |
| Total | 395 (100.0%) | 48.0 |
Fertility by Age by Marriage Status in Tucker
79.2% of women with births (395) in Tucker are married. The highest percentage of unmarried women with births falls into 20 to 34 years age bracket with 32.7% of them unmarried at the time of birth, while the lowest percentage of unmarried women with births belong to 35 to 50 years age bracket with 0.0% of them unmarried.
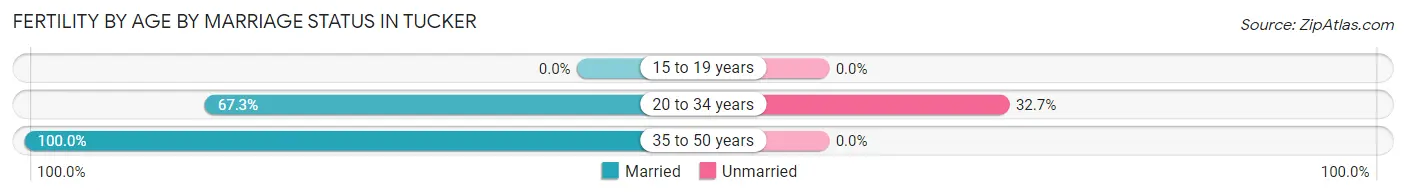
| Age Bracket | Married | Unmarried |
| 15 to 19 years | 0 (0.0%) | 0 (0.0%) |
| 20 to 34 years | 169 (67.3%) | 82 (32.7%) |
| 35 to 50 years | 144 (100.0%) | 0 (0.0%) |
| Total | 313 (79.2%) | 82 (20.8%) |
Fertility by Education in Tucker
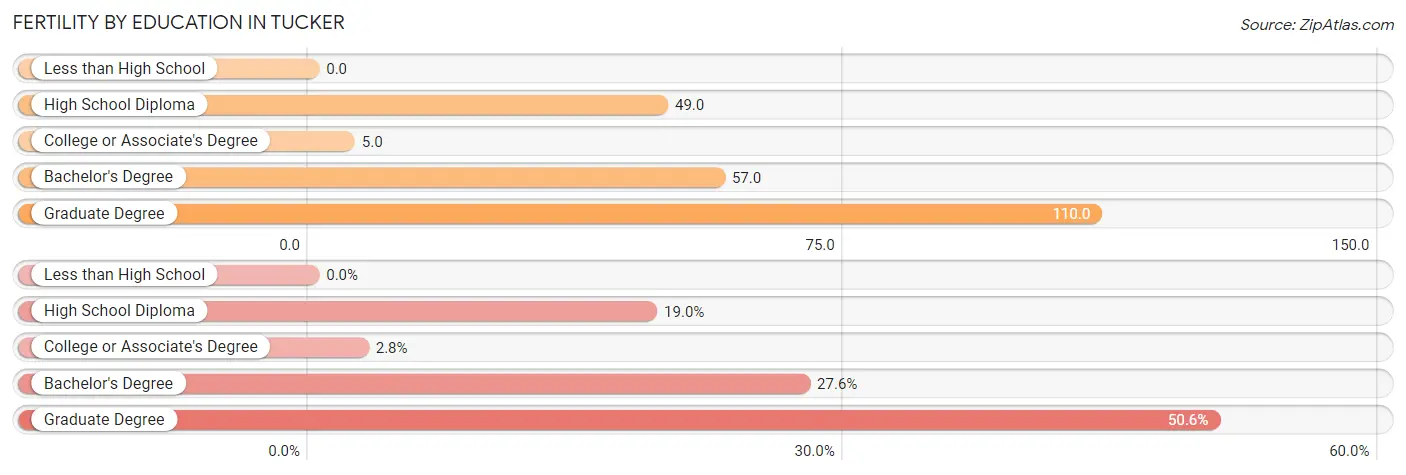
| Educational Attainment | Women with Births | Births / 1,000 Women |
| Less than High School | 0 (0.0%) | 0.0 |
| High School Diploma | 75 (19.0%) | 49.0 |
| College or Associate's Degree | 11 (2.8%) | 5.0 |
| Bachelor's Degree | 109 (27.6%) | 57.0 |
| Graduate Degree | 200 (50.6%) | 110.0 |
| Total | 395 (100.0%) | 48.0 |
Fertility by Education by Marriage Status in Tucker
20.8% of women with births in Tucker are unmarried. Women with the educational attainment of high school diploma are most likely to be married with 100.0% of them married at childbirth, while women with the educational attainment of graduate degree are least likely to be married with 39.0% of them unmarried at childbirth.
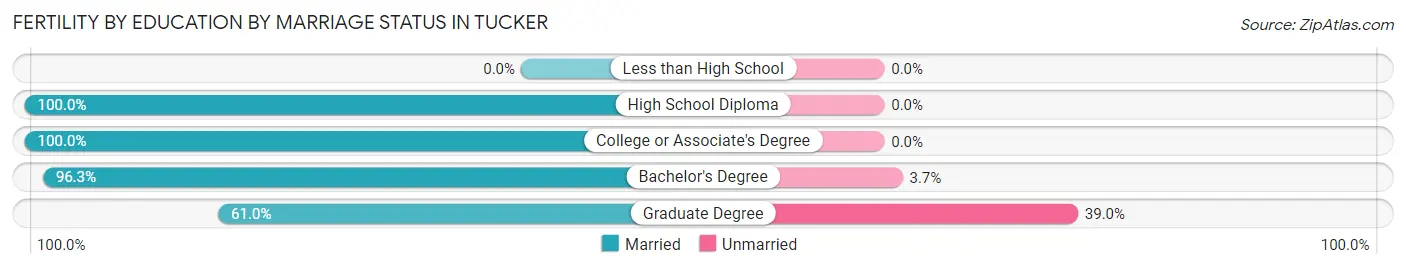
| Educational Attainment | Married | Unmarried |
| Less than High School | 0 (0.0%) | 0 (0.0%) |
| High School Diploma | 75 (100.0%) | 0 (0.0%) |
| College or Associate's Degree | 11 (100.0%) | 0 (0.0%) |
| Bachelor's Degree | 105 (96.3%) | 4 (3.7%) |
| Graduate Degree | 122 (61.0%) | 78 (39.0%) |
| Total | 313 (79.2%) | 82 (20.8%) |
Employment Characteristics in Tucker
Employment by Class of Employer in Tucker
Among the 17,755 employed individuals in Tucker, private company employees (12,037 | 67.8%), not-for-profit organizations (1,734 | 9.8%), and local government employees (1,113 | 6.3%) make up the most common classes of employment.
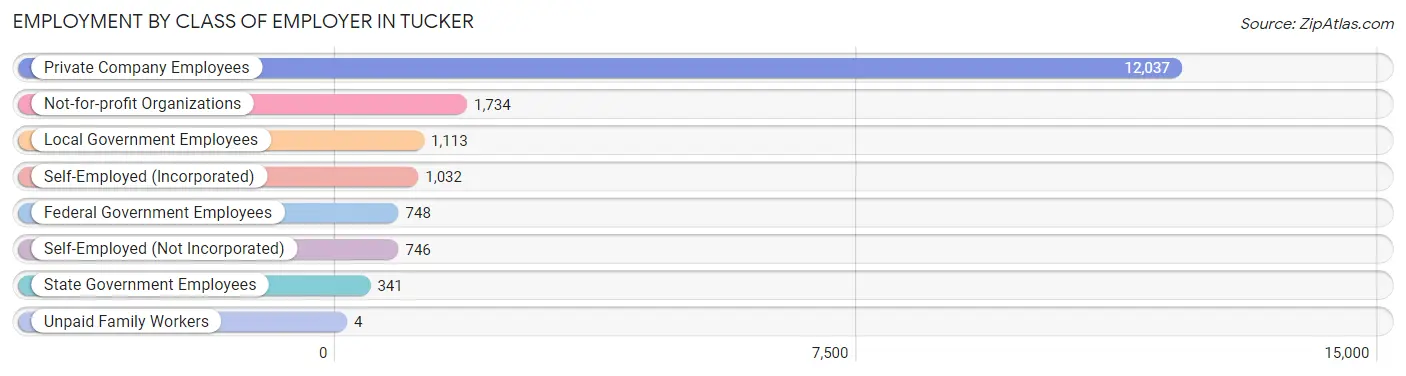
| Employer Class | # Employees | % Employees |
| Private Company Employees | 12,037 | 67.8% |
| Self-Employed (Incorporated) | 1,032 | 5.8% |
| Self-Employed (Not Incorporated) | 746 | 4.2% |
| Not-for-profit Organizations | 1,734 | 9.8% |
| Local Government Employees | 1,113 | 6.3% |
| State Government Employees | 341 | 1.9% |
| Federal Government Employees | 748 | 4.2% |
| Unpaid Family Workers | 4 | 0.0% |
| Total | 17,755 | 100.0% |
Employment Status by Age in Tucker
According to the labor force statistics for Tucker, out of the total population over 16 years of age (30,906), 63.1% or 19,502 individuals are in the labor force, with 6.0% or 1,170 of them unemployed. The age group with the highest labor force participation rate is 30 to 34 years, with 92.0% or 2,136 individuals in the labor force. Within the labor force, the 20 to 24 years age range has the highest percentage of unemployed individuals, with 10.7% or 121 of them being unemployed.
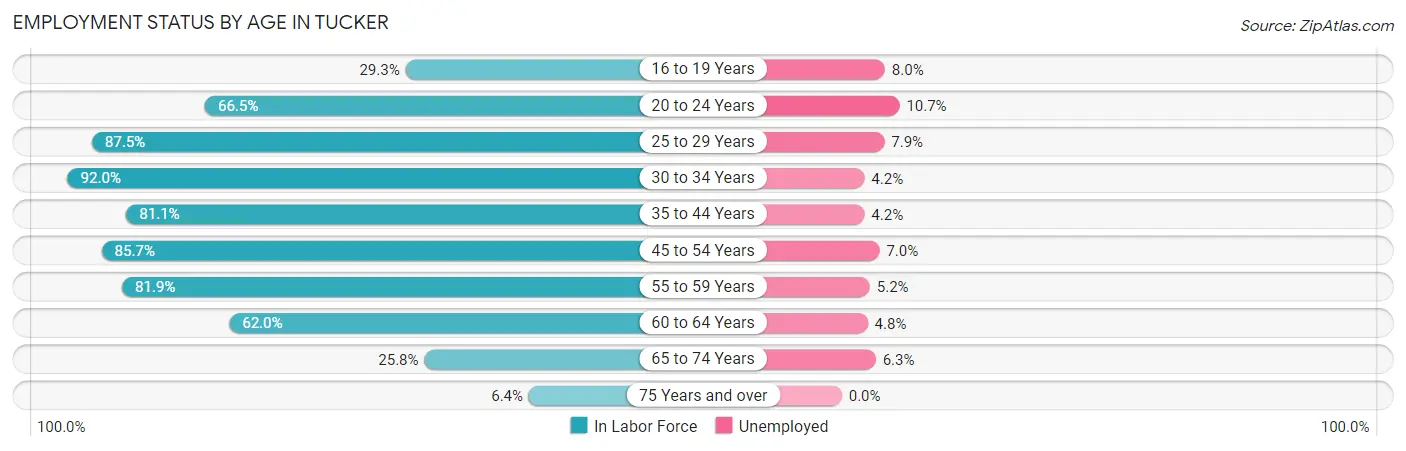
| Age Bracket | In Labor Force | Unemployed |
| 16 to 19 Years | 535 (29.3%) | 43 (8.0%) |
| 20 to 24 Years | 1,127 (66.5%) | 121 (10.7%) |
| 25 to 29 Years | 2,050 (87.5%) | 162 (7.9%) |
| 30 to 34 Years | 2,136 (92.0%) | 90 (4.2%) |
| 35 to 44 Years | 3,813 (81.1%) | 160 (4.2%) |
| 45 to 54 Years | 5,199 (85.7%) | 364 (7.0%) |
| 55 to 59 Years | 1,796 (81.9%) | 93 (5.2%) |
| 60 to 64 Years | 1,683 (62.0%) | 81 (4.8%) |
| 65 to 74 Years | 954 (25.8%) | 60 (6.3%) |
| 75 Years and over | 214 (6.4%) | 0 (0.0%) |
| Total | 19,502 (63.1%) | 1,170 (6.0%) |
Employment Status by Educational Attainment in Tucker
According to labor force statistics for Tucker, 82.0% of individuals (16,680) out of the total population between 25 and 64 years of age (20,341) are in the labor force, with 5.7% or 951 of them being unemployed. The group with the highest labor force participation rate are those with the educational attainment of bachelor's degree or higher, with 90.4% or 8,485 individuals in the labor force. Within the labor force, individuals with less than high school education have the highest percentage of unemployment, with 14.8% or 171 of them being unemployed.
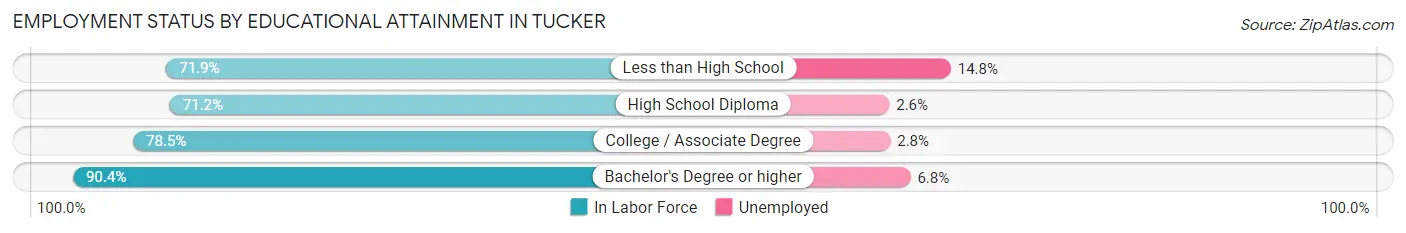
| Educational Attainment | In Labor Force | Unemployed |
| Less than High School | 1,153 (71.9%) | 237 (14.8%) |
| High School Diploma | 2,936 (71.2%) | 107 (2.6%) |
| College / Associate Degree | 4,104 (78.5%) | 146 (2.8%) |
| Bachelor's Degree or higher | 8,485 (90.4%) | 638 (6.8%) |
| Total | 16,680 (82.0%) | 1,159 (5.7%) |
Employment Occupations by Sex in Tucker
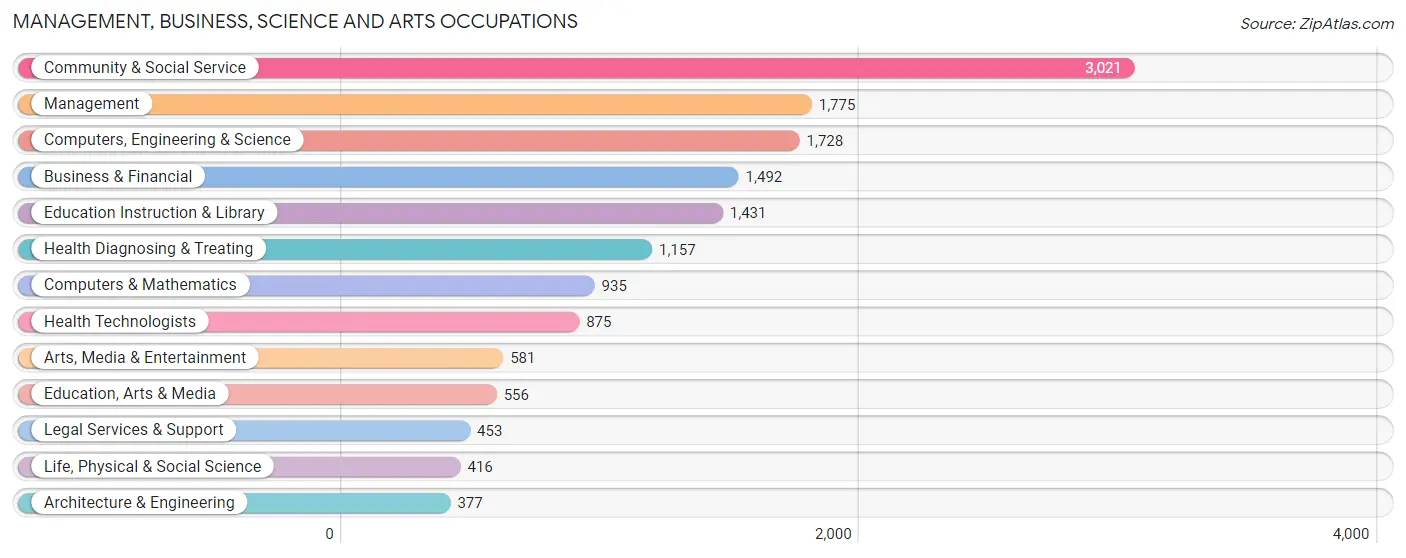
Management, Business, Science and Arts Occupations
The most common Management, Business, Science and Arts occupations in Tucker are Community & Social Service (3,021 | 16.5%), Management (1,775 | 9.7%), Computers, Engineering & Science (1,728 | 9.4%), Business & Financial (1,492 | 8.1%), and Education Instruction & Library (1,431 | 7.8%).
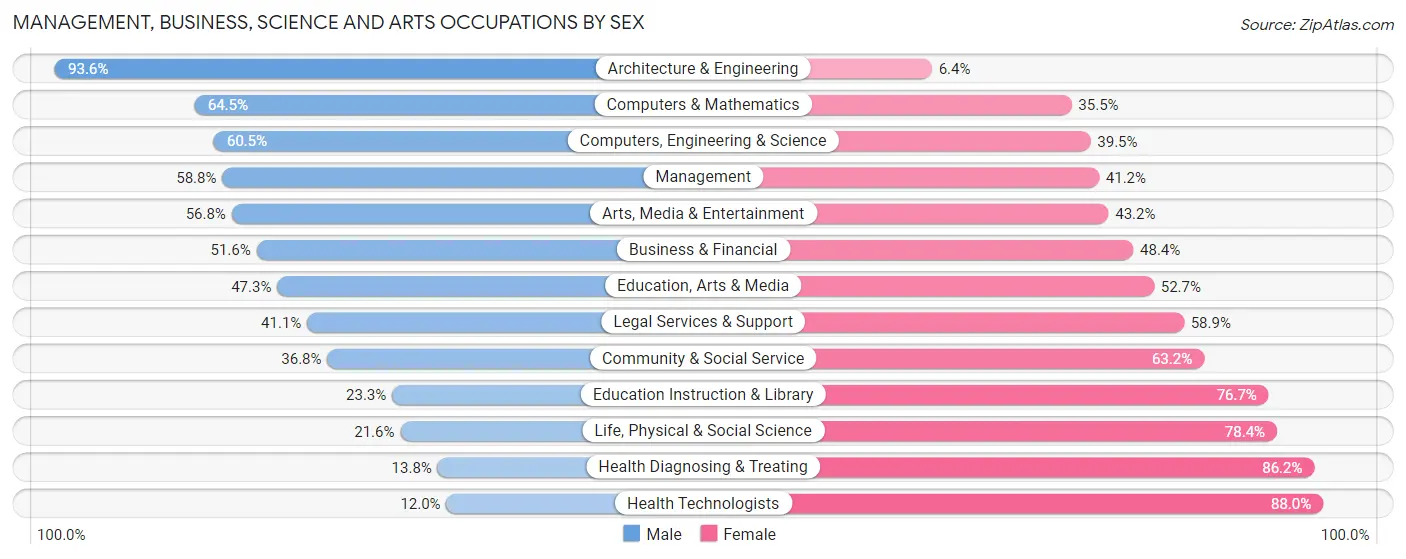
Management, Business, Science and Arts Occupations by Sex
Within the Management, Business, Science and Arts occupations in Tucker, the most male-oriented occupations are Architecture & Engineering (93.6%), Computers & Mathematics (64.5%), and Computers, Engineering & Science (60.5%), while the most female-oriented occupations are Health Technologists (88.0%), Health Diagnosing & Treating (86.2%), and Life, Physical & Social Science (78.4%).
| Occupation | Male | Female |
| Management | 1,043 (58.8%) | 732 (41.2%) |
| Business & Financial | 770 (51.6%) | 722 (48.4%) |
| Computers, Engineering & Science | 1,046 (60.5%) | 682 (39.5%) |
| Computers & Mathematics | 603 (64.5%) | 332 (35.5%) |
| Architecture & Engineering | 353 (93.6%) | 24 (6.4%) |
| Life, Physical & Social Science | 90 (21.6%) | 326 (78.4%) |
| Community & Social Service | 1,113 (36.8%) | 1,908 (63.2%) |
| Education, Arts & Media | 263 (47.3%) | 293 (52.7%) |
| Legal Services & Support | 186 (41.1%) | 267 (58.9%) |
| Education Instruction & Library | 334 (23.3%) | 1,097 (76.7%) |
| Arts, Media & Entertainment | 330 (56.8%) | 251 (43.2%) |
| Health Diagnosing & Treating | 160 (13.8%) | 997 (86.2%) |
| Health Technologists | 105 (12.0%) | 770 (88.0%) |
| Total (Category) | 4,132 (45.1%) | 5,041 (54.9%) |
| Total (Overall) | 9,222 (50.3%) | 9,116 (49.7%) |
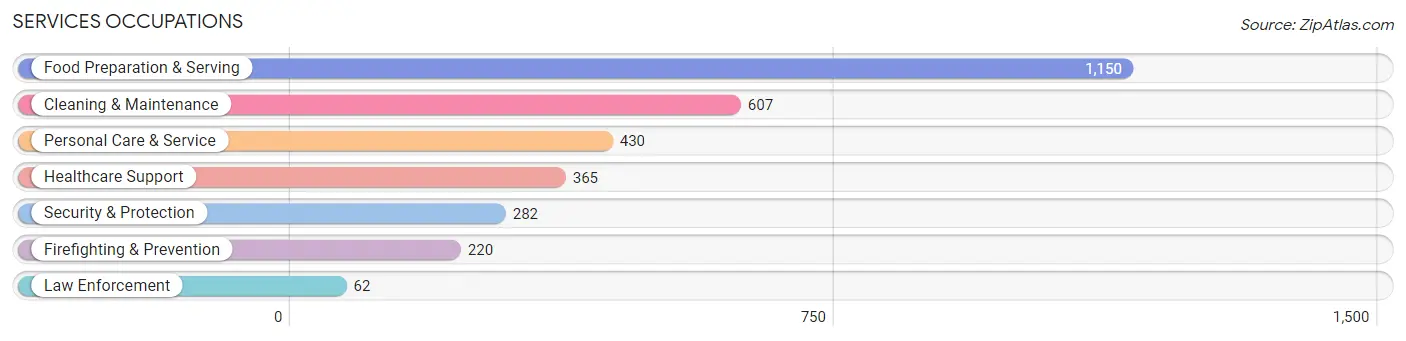
Services Occupations
The most common Services occupations in Tucker are Food Preparation & Serving (1,150 | 6.3%), Cleaning & Maintenance (607 | 3.3%), Personal Care & Service (430 | 2.3%), Healthcare Support (365 | 2.0%), and Security & Protection (282 | 1.5%).
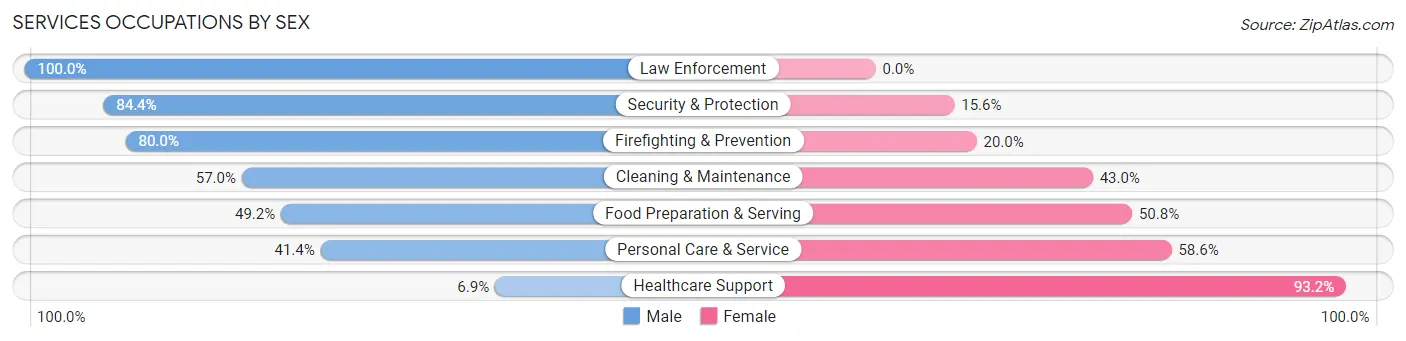
Services Occupations by Sex
Within the Services occupations in Tucker, the most male-oriented occupations are Law Enforcement (100.0%), Security & Protection (84.4%), and Firefighting & Prevention (80.0%), while the most female-oriented occupations are Healthcare Support (93.1%), Personal Care & Service (58.6%), and Food Preparation & Serving (50.8%).
| Occupation | Male | Female |
| Healthcare Support | 25 (6.9%) | 340 (93.1%) |
| Security & Protection | 238 (84.4%) | 44 (15.6%) |
| Firefighting & Prevention | 176 (80.0%) | 44 (20.0%) |
| Law Enforcement | 62 (100.0%) | 0 (0.0%) |
| Food Preparation & Serving | 566 (49.2%) | 584 (50.8%) |
| Cleaning & Maintenance | 346 (57.0%) | 261 (43.0%) |
| Personal Care & Service | 178 (41.4%) | 252 (58.6%) |
| Total (Category) | 1,353 (47.7%) | 1,481 (52.3%) |
| Total (Overall) | 9,222 (50.3%) | 9,116 (49.7%) |
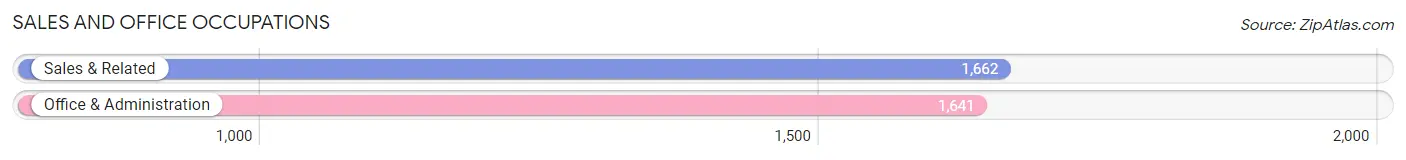
Sales and Office Occupations
The most common Sales and Office occupations in Tucker are Sales & Related (1,662 | 9.1%), and Office & Administration (1,641 | 8.9%).
Sales and Office Occupations by Sex
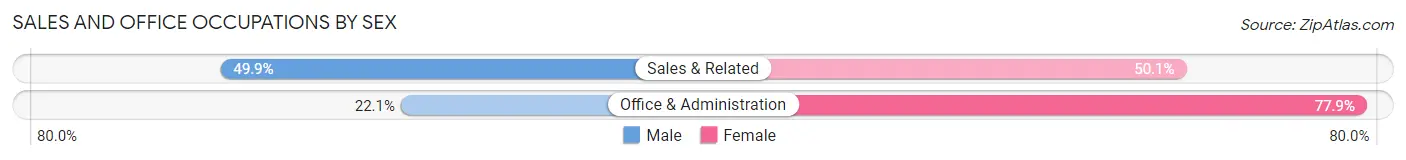
| Occupation | Male | Female |
| Sales & Related | 829 (49.9%) | 833 (50.1%) |
| Office & Administration | 363 (22.1%) | 1,278 (77.9%) |
| Total (Category) | 1,192 (36.1%) | 2,111 (63.9%) |
| Total (Overall) | 9,222 (50.3%) | 9,116 (49.7%) |
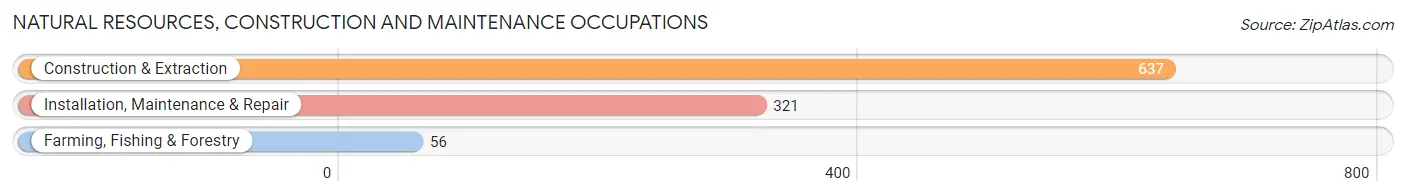
Natural Resources, Construction and Maintenance Occupations
The most common Natural Resources, Construction and Maintenance occupations in Tucker are Construction & Extraction (637 | 3.5%), Installation, Maintenance & Repair (321 | 1.8%), and Farming, Fishing & Forestry (56 | 0.3%).
Natural Resources, Construction and Maintenance Occupations by Sex
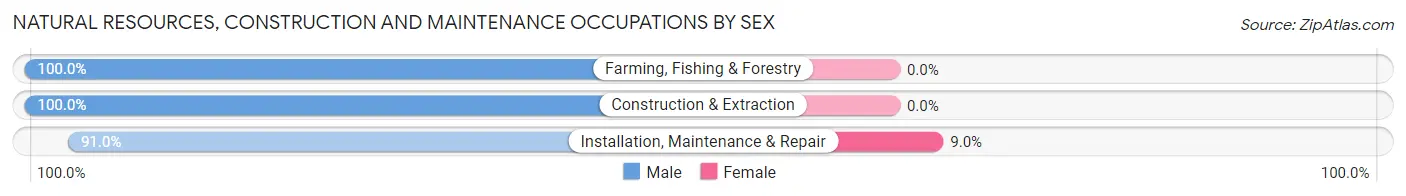
| Occupation | Male | Female |
| Farming, Fishing & Forestry | 56 (100.0%) | 0 (0.0%) |
| Construction & Extraction | 637 (100.0%) | 0 (0.0%) |
| Installation, Maintenance & Repair | 292 (91.0%) | 29 (9.0%) |
| Total (Category) | 985 (97.1%) | 29 (2.9%) |
| Total (Overall) | 9,222 (50.3%) | 9,116 (49.7%) |
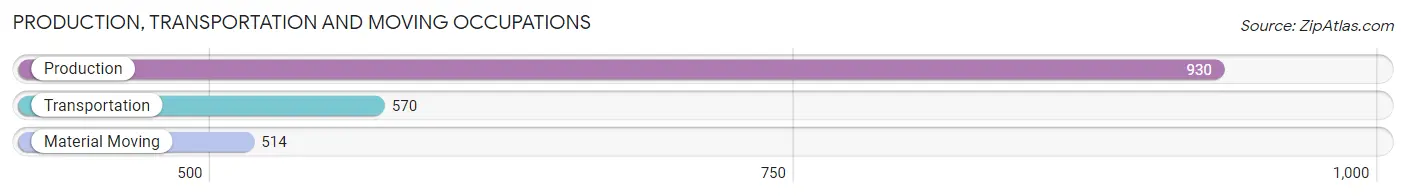
Production, Transportation and Moving Occupations
The most common Production, Transportation and Moving occupations in Tucker are Production (930 | 5.1%), Transportation (570 | 3.1%), and Material Moving (514 | 2.8%).
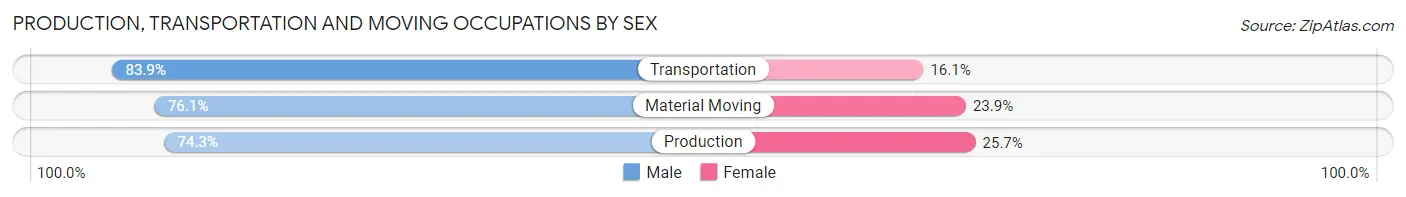
Production, Transportation and Moving Occupations by Sex
| Occupation | Male | Female |
| Production | 691 (74.3%) | 239 (25.7%) |
| Transportation | 478 (83.9%) | 92 (16.1%) |
| Material Moving | 391 (76.1%) | 123 (23.9%) |
| Total (Category) | 1,560 (77.5%) | 454 (22.5%) |
| Total (Overall) | 9,222 (50.3%) | 9,116 (49.7%) |
Employment Industries by Sex in Tucker
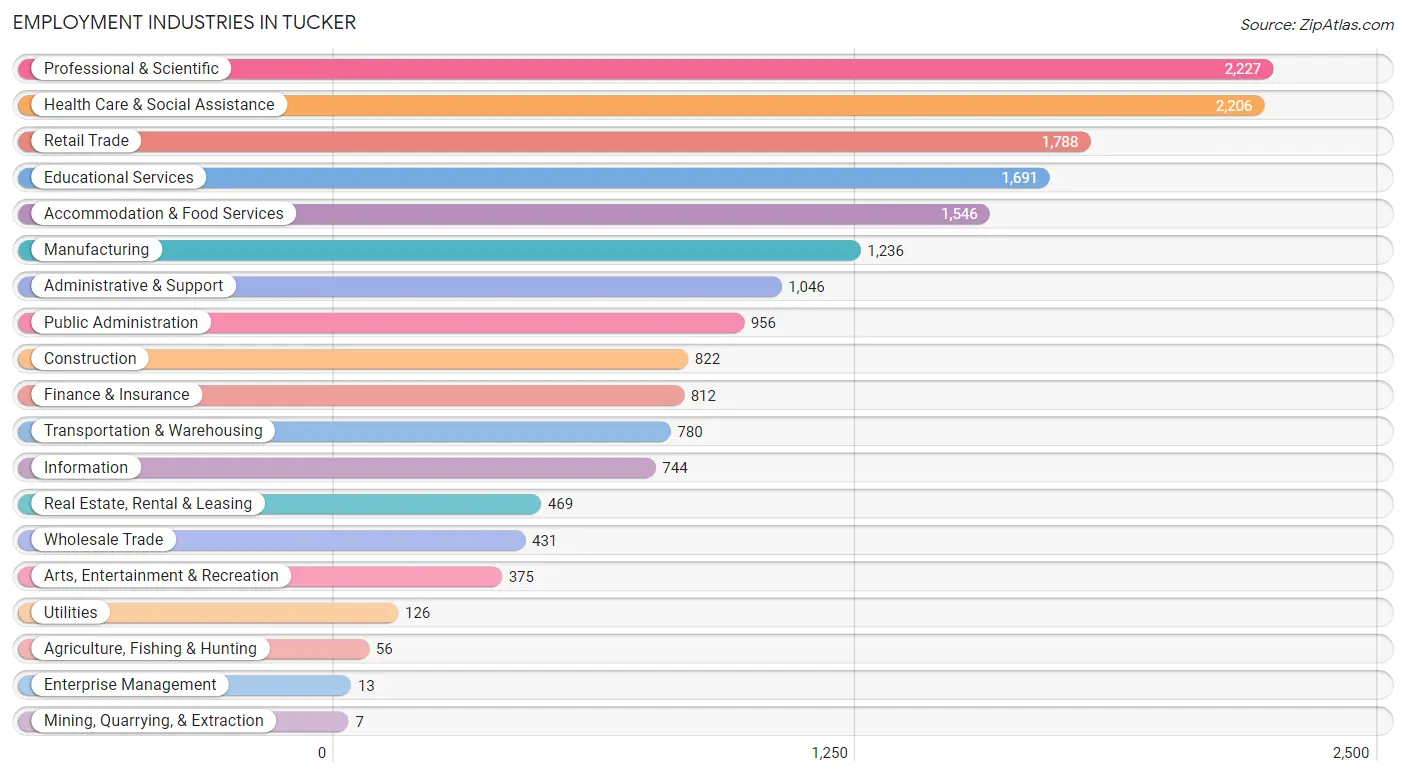
Employment Industries in Tucker
The major employment industries in Tucker include Professional & Scientific (2,227 | 12.1%), Health Care & Social Assistance (2,206 | 12.0%), Retail Trade (1,788 | 9.8%), Educational Services (1,691 | 9.2%), and Accommodation & Food Services (1,546 | 8.4%).
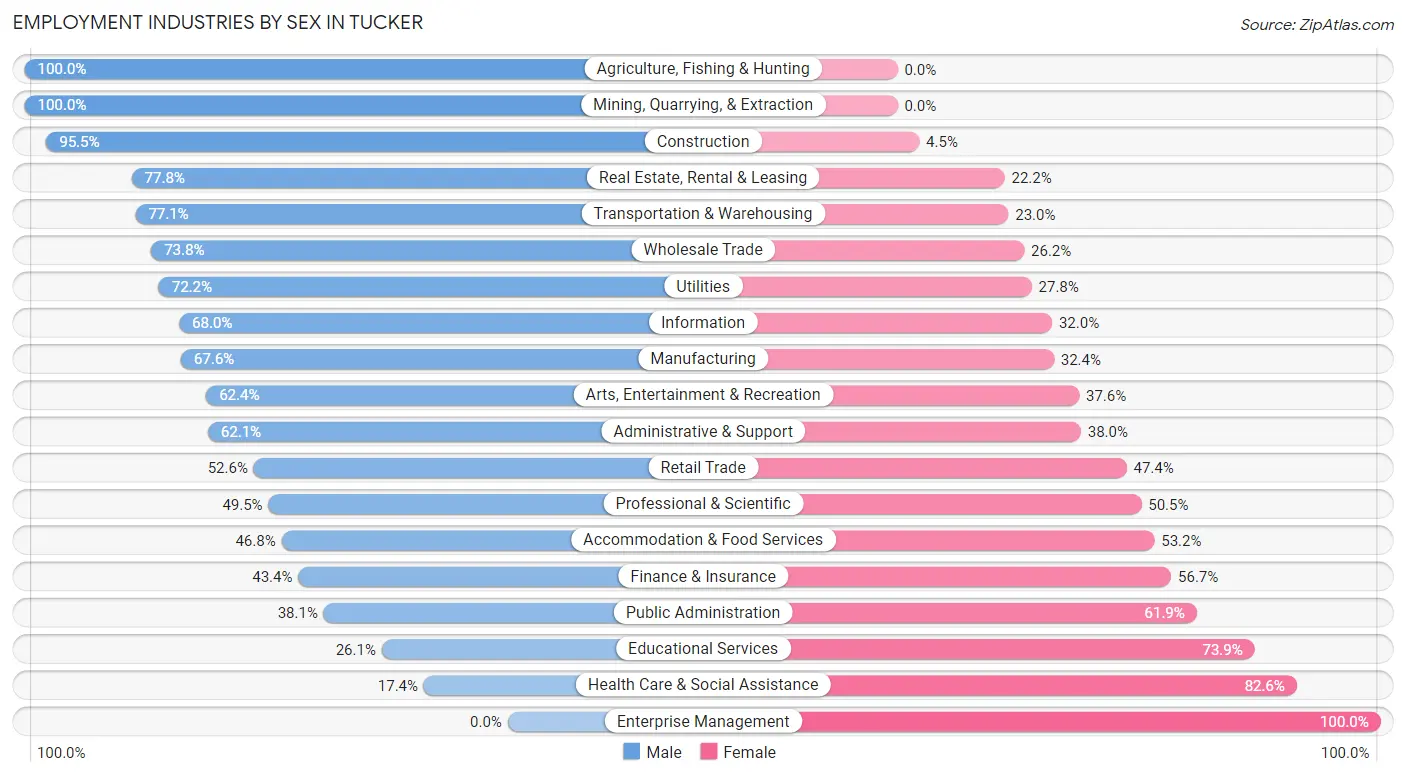
Employment Industries by Sex in Tucker
The Tucker industries that see more men than women are Agriculture, Fishing & Hunting (100.0%), Mining, Quarrying, & Extraction (100.0%), and Construction (95.5%), whereas the industries that tend to have a higher number of women are Enterprise Management (100.0%), Health Care & Social Assistance (82.6%), and Educational Services (73.9%).
| Industry | Male | Female |
| Agriculture, Fishing & Hunting | 56 (100.0%) | 0 (0.0%) |
| Mining, Quarrying, & Extraction | 7 (100.0%) | 0 (0.0%) |
| Construction | 785 (95.5%) | 37 (4.5%) |
| Manufacturing | 836 (67.6%) | 400 (32.4%) |
| Wholesale Trade | 318 (73.8%) | 113 (26.2%) |
| Retail Trade | 940 (52.6%) | 848 (47.4%) |
| Transportation & Warehousing | 601 (77.0%) | 179 (23.0%) |
| Utilities | 91 (72.2%) | 35 (27.8%) |
| Information | 506 (68.0%) | 238 (32.0%) |
| Finance & Insurance | 352 (43.3%) | 460 (56.7%) |
| Real Estate, Rental & Leasing | 365 (77.8%) | 104 (22.2%) |
| Professional & Scientific | 1,103 (49.5%) | 1,124 (50.5%) |
| Enterprise Management | 0 (0.0%) | 13 (100.0%) |
| Administrative & Support | 649 (62.1%) | 397 (38.0%) |
| Educational Services | 441 (26.1%) | 1,250 (73.9%) |
| Health Care & Social Assistance | 383 (17.4%) | 1,823 (82.6%) |
| Arts, Entertainment & Recreation | 234 (62.4%) | 141 (37.6%) |
| Accommodation & Food Services | 724 (46.8%) | 822 (53.2%) |
| Public Administration | 364 (38.1%) | 592 (61.9%) |
| Total | 9,222 (50.3%) | 9,116 (49.7%) |
Education in Tucker
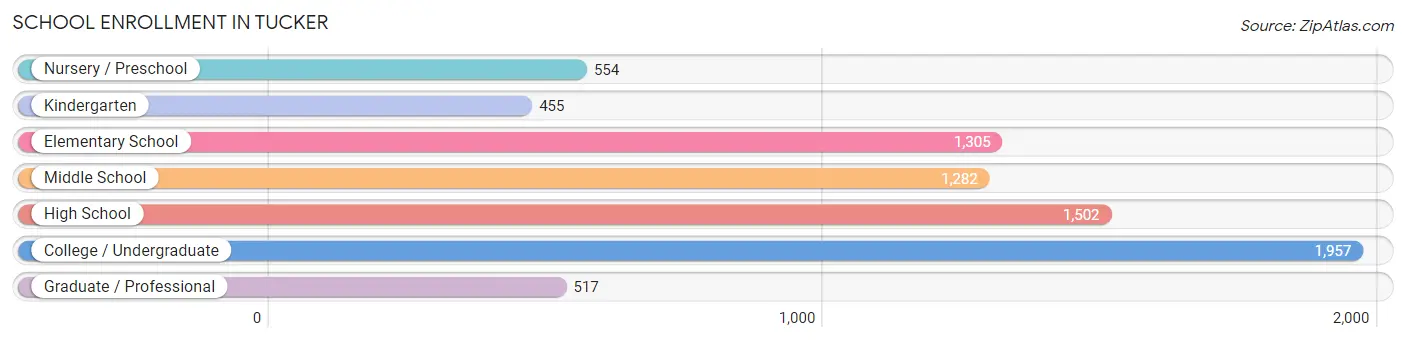
School Enrollment in Tucker
The most common levels of schooling among the 7,572 students in Tucker are college / undergraduate (1,957 | 25.9%), high school (1,502 | 19.8%), and elementary school (1,305 | 17.2%).
| School Level | # Students | % Students |
| Nursery / Preschool | 554 | 7.3% |
| Kindergarten | 455 | 6.0% |
| Elementary School | 1,305 | 17.2% |
| Middle School | 1,282 | 16.9% |
| High School | 1,502 | 19.8% |
| College / Undergraduate | 1,957 | 25.9% |
| Graduate / Professional | 517 | 6.8% |
| Total | 7,572 | 100.0% |
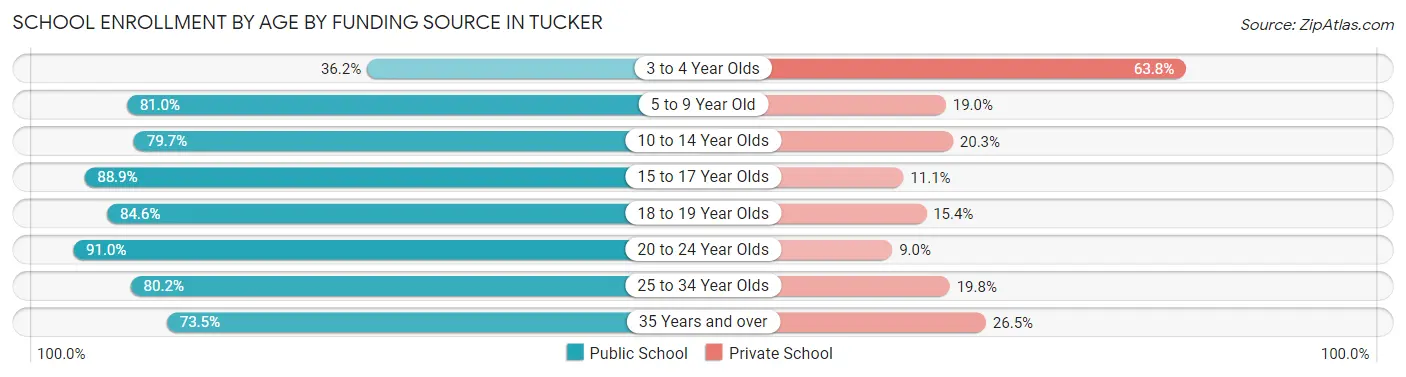
School Enrollment by Age by Funding Source in Tucker
Out of a total of 7,572 students who are enrolled in schools in Tucker, 1,545 (20.4%) attend a private institution, while the remaining 6,027 (79.6%) are enrolled in public schools. The age group of 3 to 4 year olds has the highest likelihood of being enrolled in private schools, with 257 (63.8% in the age bracket) enrolled. Conversely, the age group of 20 to 24 year olds has the lowest likelihood of being enrolled in a private school, with 714 (91.0% in the age bracket) attending a public institution.
| Age Bracket | Public School | Private School |
| 3 to 4 Year Olds | 146 (36.2%) | 257 (63.8%) |
| 5 to 9 Year Old | 1,409 (81.0%) | 331 (19.0%) |
| 10 to 14 Year Olds | 1,426 (79.7%) | 364 (20.3%) |
| 15 to 17 Year Olds | 950 (88.9%) | 119 (11.1%) |
| 18 to 19 Year Olds | 347 (84.6%) | 63 (15.4%) |
| 20 to 24 Year Olds | 714 (91.0%) | 71 (9.0%) |
| 25 to 34 Year Olds | 337 (80.2%) | 83 (19.8%) |
| 35 Years and over | 702 (73.5%) | 253 (26.5%) |
| Total | 6,027 (79.6%) | 1,545 (20.4%) |
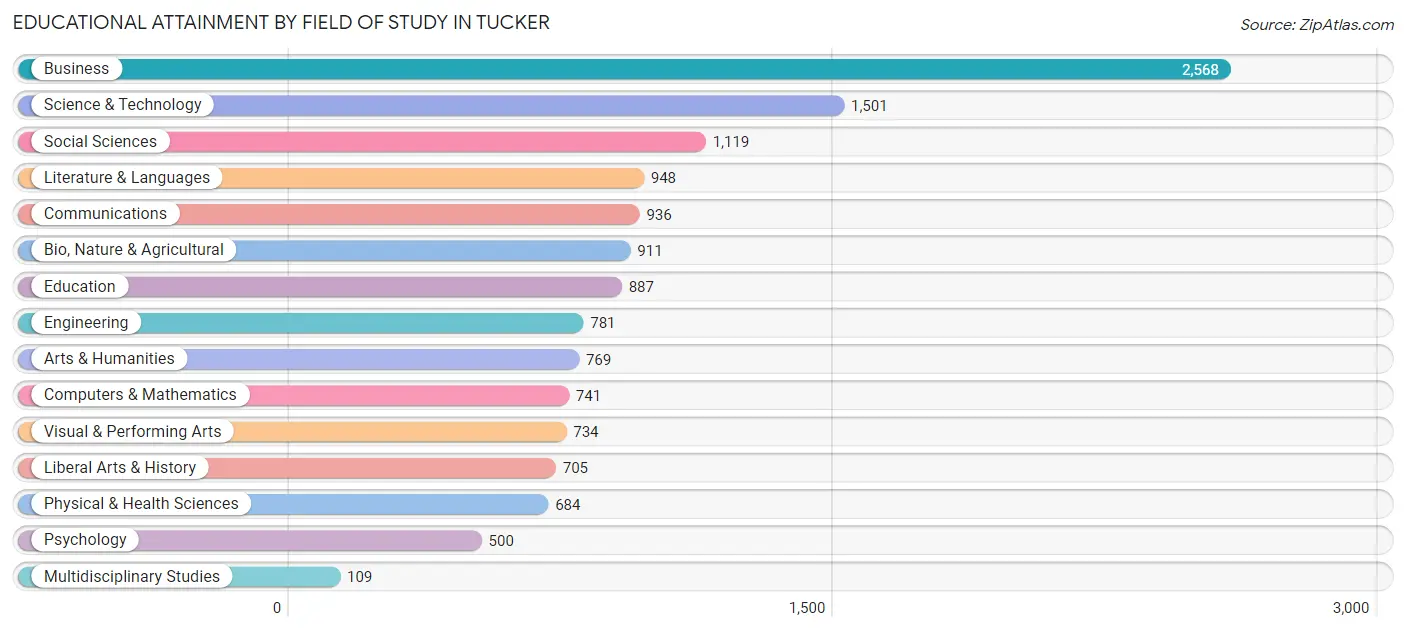
Educational Attainment by Field of Study in Tucker
Business (2,568 | 18.5%), science & technology (1,501 | 10.8%), social sciences (1,119 | 8.1%), literature & languages (948 | 6.8%), and communications (936 | 6.7%) are the most common fields of study among 13,893 individuals in Tucker who have obtained a bachelor's degree or higher.
| Field of Study | # Graduates | % Graduates |
| Computers & Mathematics | 741 | 5.3% |
| Bio, Nature & Agricultural | 911 | 6.6% |
| Physical & Health Sciences | 684 | 4.9% |
| Psychology | 500 | 3.6% |
| Social Sciences | 1,119 | 8.1% |
| Engineering | 781 | 5.6% |
| Multidisciplinary Studies | 109 | 0.8% |
| Science & Technology | 1,501 | 10.8% |
| Business | 2,568 | 18.5% |
| Education | 887 | 6.4% |
| Literature & Languages | 948 | 6.8% |
| Liberal Arts & History | 705 | 5.1% |
| Visual & Performing Arts | 734 | 5.3% |
| Communications | 936 | 6.7% |
| Arts & Humanities | 769 | 5.5% |
| Total | 13,893 | 100.0% |
Transportation & Commute in Tucker
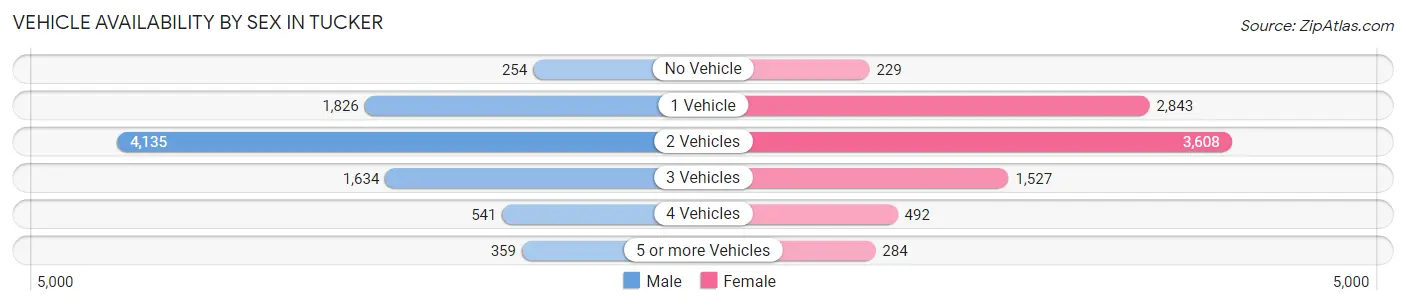
Vehicle Availability by Sex in Tucker
The most prevalent vehicle ownership categories in Tucker are males with 2 vehicles (4,135, accounting for 47.3%) and females with 2 vehicles (3,608, making up 46.0%).
| Vehicles Available | Male | Female |
| No Vehicle | 254 (2.9%) | 229 (2.5%) |
| 1 Vehicle | 1,826 (20.9%) | 2,843 (31.7%) |
| 2 Vehicles | 4,135 (47.3%) | 3,608 (40.2%) |
| 3 Vehicles | 1,634 (18.7%) | 1,527 (17.0%) |
| 4 Vehicles | 541 (6.2%) | 492 (5.5%) |
| 5 or more Vehicles | 359 (4.1%) | 284 (3.2%) |
| Total | 8,749 (100.0%) | 8,983 (100.0%) |
Commute Time in Tucker
The most frequently occuring commute durations in Tucker are 30 to 34 minutes (2,657 commuters, 18.5%), 20 to 24 minutes (2,009 commuters, 14.0%), and 45 to 59 minutes (1,862 commuters, 13.0%).
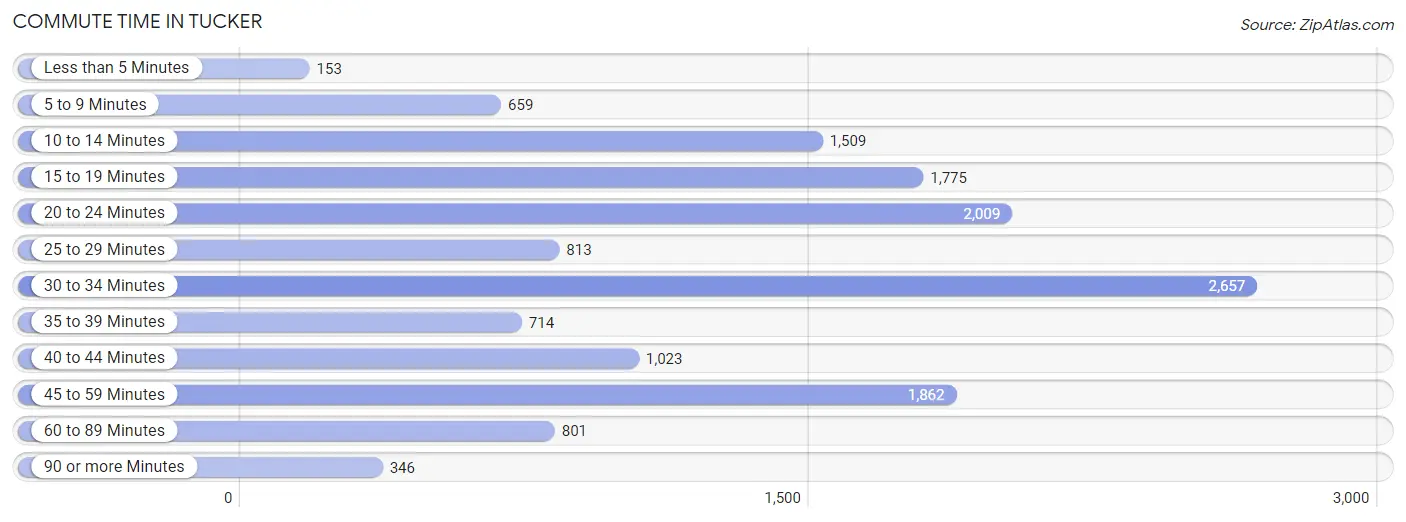
| Commute Time | # Commuters | % Commuters |
| Less than 5 Minutes | 153 | 1.1% |
| 5 to 9 Minutes | 659 | 4.6% |
| 10 to 14 Minutes | 1,509 | 10.5% |
| 15 to 19 Minutes | 1,775 | 12.4% |
| 20 to 24 Minutes | 2,009 | 14.0% |
| 25 to 29 Minutes | 813 | 5.7% |
| 30 to 34 Minutes | 2,657 | 18.5% |
| 35 to 39 Minutes | 714 | 5.0% |
| 40 to 44 Minutes | 1,023 | 7.1% |
| 45 to 59 Minutes | 1,862 | 13.0% |
| 60 to 89 Minutes | 801 | 5.6% |
| 90 or more Minutes | 346 | 2.4% |
Commute Time by Sex in Tucker
The most common commute times in Tucker are 30 to 34 minutes (1,273 commuters, 17.7%) for males and 30 to 34 minutes (1,384 commuters, 19.5%) for females.
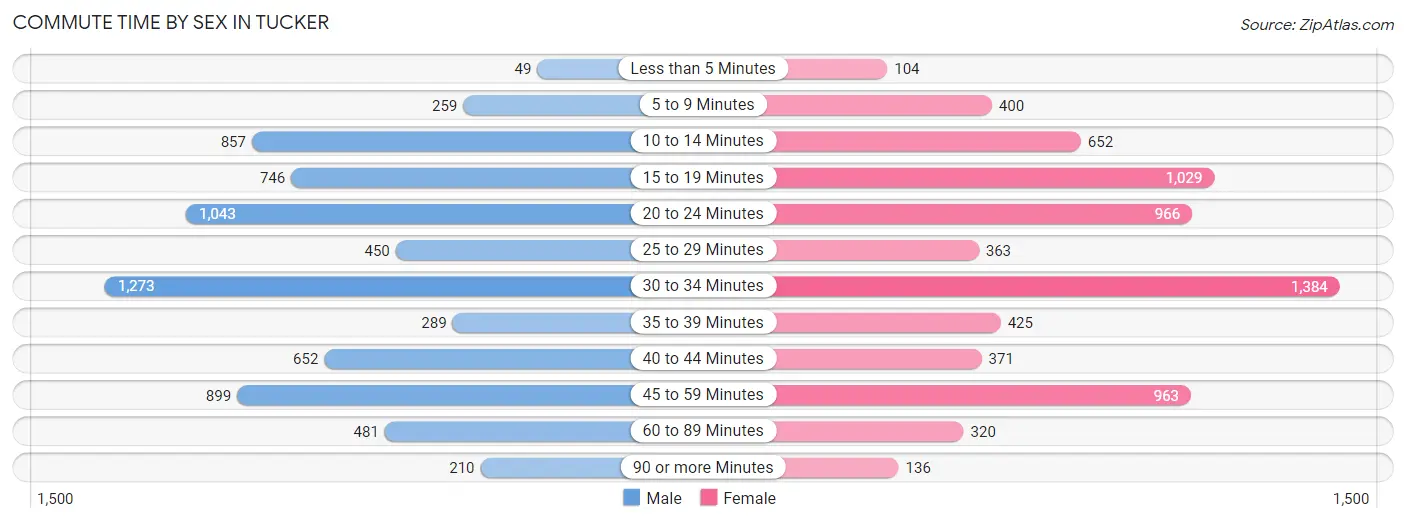
| Commute Time | Male | Female |
| Less than 5 Minutes | 49 (0.7%) | 104 (1.5%) |
| 5 to 9 Minutes | 259 (3.6%) | 400 (5.6%) |
| 10 to 14 Minutes | 857 (11.9%) | 652 (9.2%) |
| 15 to 19 Minutes | 746 (10.3%) | 1,029 (14.5%) |
| 20 to 24 Minutes | 1,043 (14.5%) | 966 (13.6%) |
| 25 to 29 Minutes | 450 (6.2%) | 363 (5.1%) |
| 30 to 34 Minutes | 1,273 (17.7%) | 1,384 (19.5%) |
| 35 to 39 Minutes | 289 (4.0%) | 425 (6.0%) |
| 40 to 44 Minutes | 652 (9.0%) | 371 (5.2%) |
| 45 to 59 Minutes | 899 (12.5%) | 963 (13.5%) |
| 60 to 89 Minutes | 481 (6.7%) | 320 (4.5%) |
| 90 or more Minutes | 210 (2.9%) | 136 (1.9%) |
Time of Departure to Work by Sex in Tucker
The most frequent times of departure to work in Tucker are 8:00 AM to 8:29 AM (1,214, 16.8%) for males and 7:00 AM to 7:29 AM (1,083, 15.2%) for females.
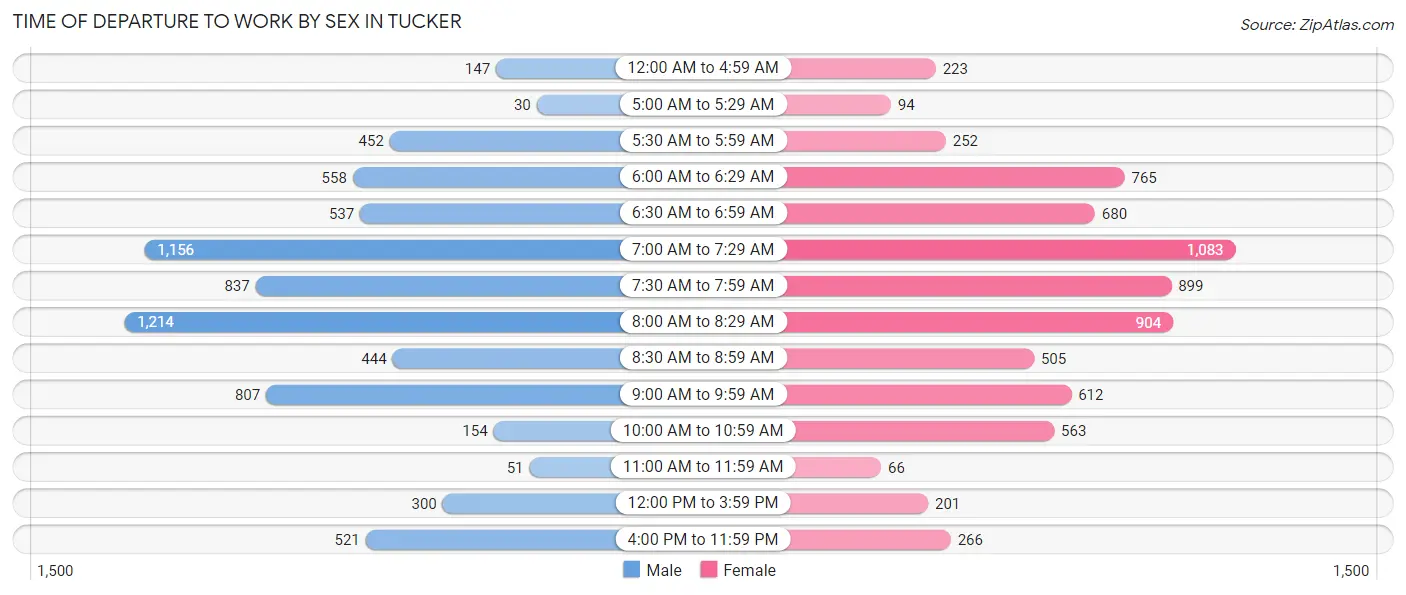
| Time of Departure | Male | Female |
| 12:00 AM to 4:59 AM | 147 (2.0%) | 223 (3.1%) |
| 5:00 AM to 5:29 AM | 30 (0.4%) | 94 (1.3%) |
| 5:30 AM to 5:59 AM | 452 (6.3%) | 252 (3.5%) |
| 6:00 AM to 6:29 AM | 558 (7.7%) | 765 (10.7%) |
| 6:30 AM to 6:59 AM | 537 (7.4%) | 680 (9.6%) |
| 7:00 AM to 7:29 AM | 1,156 (16.0%) | 1,083 (15.2%) |
| 7:30 AM to 7:59 AM | 837 (11.6%) | 899 (12.6%) |
| 8:00 AM to 8:29 AM | 1,214 (16.8%) | 904 (12.7%) |
| 8:30 AM to 8:59 AM | 444 (6.2%) | 505 (7.1%) |
| 9:00 AM to 9:59 AM | 807 (11.2%) | 612 (8.6%) |
| 10:00 AM to 10:59 AM | 154 (2.1%) | 563 (7.9%) |
| 11:00 AM to 11:59 AM | 51 (0.7%) | 66 (0.9%) |
| 12:00 PM to 3:59 PM | 300 (4.2%) | 201 (2.8%) |
| 4:00 PM to 11:59 PM | 521 (7.2%) | 266 (3.7%) |
| Total | 7,208 (100.0%) | 7,113 (100.0%) |
Housing Occupancy in Tucker
Occupancy by Ownership in Tucker
Of the total 14,906 dwellings in Tucker, owner-occupied units account for 9,620 (64.5%), while renter-occupied units make up 5,286 (35.5%).
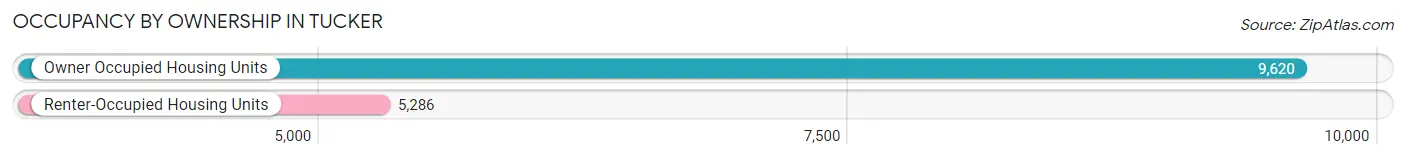
| Occupancy | # Housing Units | % Housing Units |
| Owner Occupied Housing Units | 9,620 | 64.5% |
| Renter-Occupied Housing Units | 5,286 | 35.5% |
| Total Occupied Housing Units | 14,906 | 100.0% |
Occupancy by Household Size in Tucker
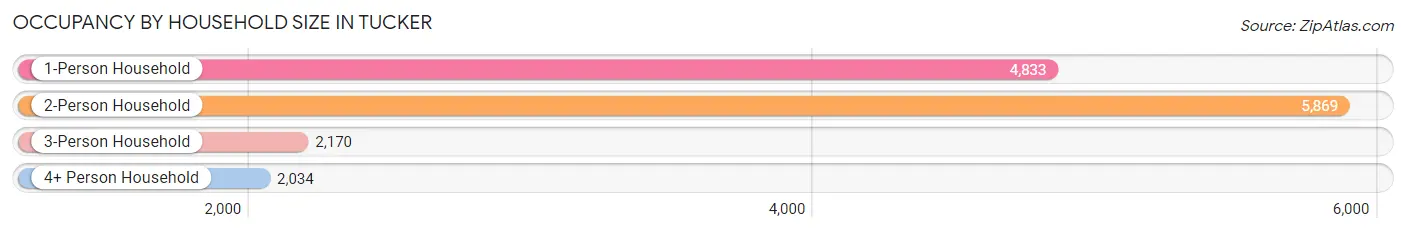
| Household Size | # Housing Units | % Housing Units |
| 1-Person Household | 4,833 | 32.4% |
| 2-Person Household | 5,869 | 39.4% |
| 3-Person Household | 2,170 | 14.6% |
| 4+ Person Household | 2,034 | 13.7% |
| Total Housing Units | 14,906 | 100.0% |
Occupancy by Ownership by Household Size in Tucker
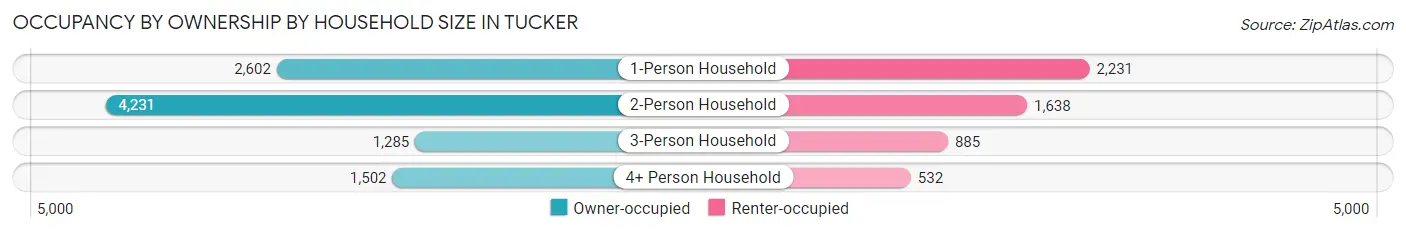
| Household Size | Owner-occupied | Renter-occupied |
| 1-Person Household | 2,602 (53.8%) | 2,231 (46.2%) |
| 2-Person Household | 4,231 (72.1%) | 1,638 (27.9%) |
| 3-Person Household | 1,285 (59.2%) | 885 (40.8%) |
| 4+ Person Household | 1,502 (73.8%) | 532 (26.2%) |
| Total Housing Units | 9,620 (64.5%) | 5,286 (35.5%) |
Occupancy by Educational Attainment in Tucker
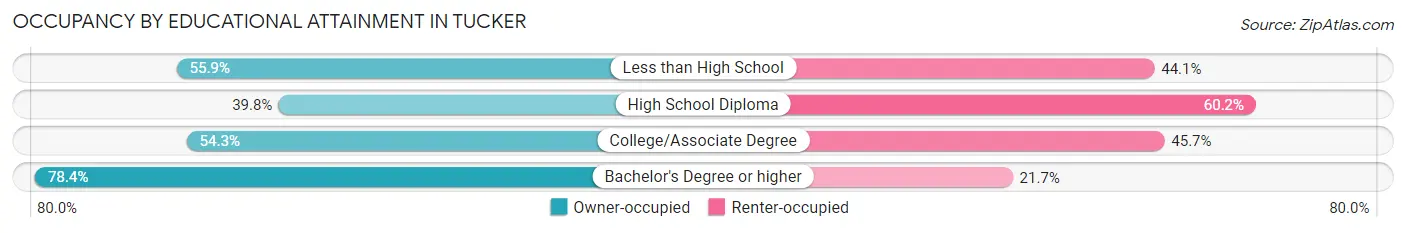
| Household Size | Owner-occupied | Renter-occupied |
| Less than High School | 442 (55.9%) | 349 (44.1%) |
| High School Diploma | 909 (39.8%) | 1,376 (60.2%) |
| College/Associate Degree | 2,255 (54.3%) | 1,899 (45.7%) |
| Bachelor's Degree or higher | 6,014 (78.3%) | 1,662 (21.6%) |
Occupancy by Age of Householder in Tucker
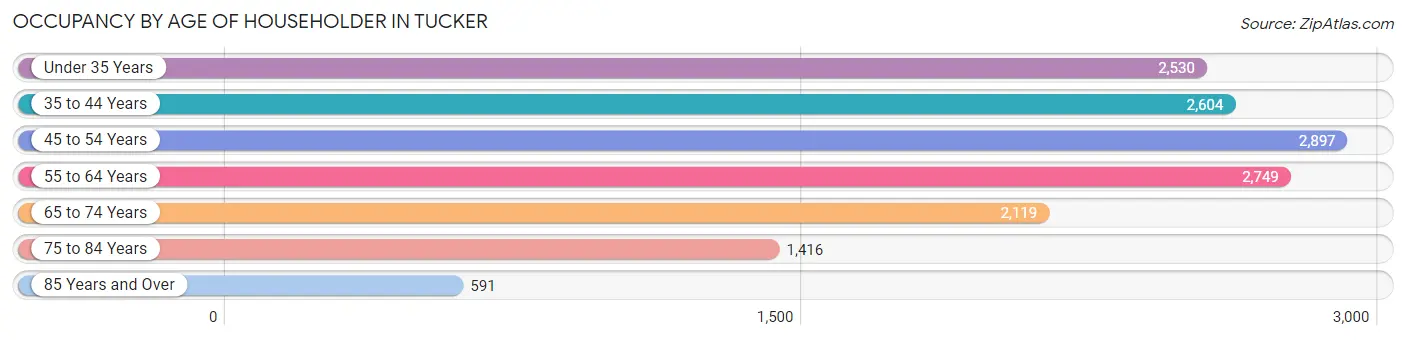
| Age Bracket | # Households | % Households |
| Under 35 Years | 2,530 | 17.0% |
| 35 to 44 Years | 2,604 | 17.5% |
| 45 to 54 Years | 2,897 | 19.4% |
| 55 to 64 Years | 2,749 | 18.4% |
| 65 to 74 Years | 2,119 | 14.2% |
| 75 to 84 Years | 1,416 | 9.5% |
| 85 Years and Over | 591 | 4.0% |
| Total | 14,906 | 100.0% |
Housing Finances in Tucker
Median Income by Occupancy in Tucker
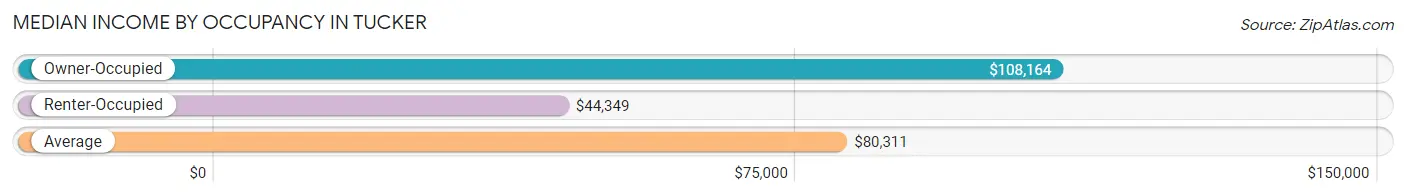
| Occupancy Type | # Households | Median Income |
| Owner-Occupied | 9,620 (64.5%) | $108,164 |
| Renter-Occupied | 5,286 (35.5%) | $44,349 |
| Average | 14,906 (100.0%) | $80,311 |
Occupancy by Householder Income Bracket in Tucker
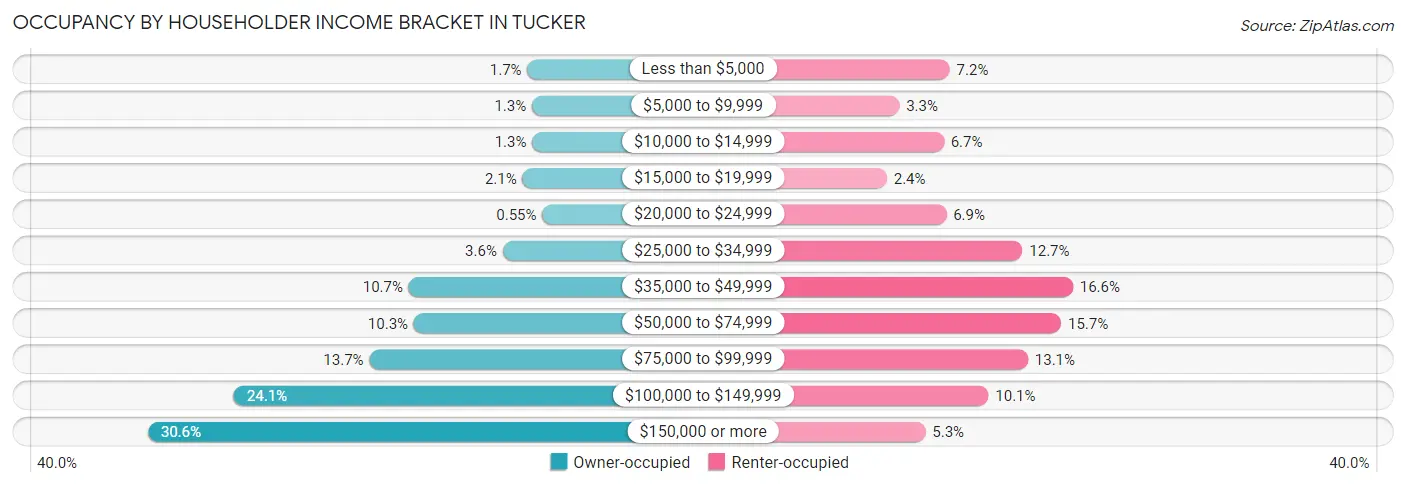
| Income Bracket | Owner-occupied | Renter-occupied |
| Less than $5,000 | 163 (1.7%) | 379 (7.2%) |
| $5,000 to $9,999 | 129 (1.3%) | 176 (3.3%) |
| $10,000 to $14,999 | 127 (1.3%) | 355 (6.7%) |
| $15,000 to $19,999 | 198 (2.1%) | 126 (2.4%) |
| $20,000 to $24,999 | 53 (0.5%) | 365 (6.9%) |
| $25,000 to $34,999 | 343 (3.6%) | 672 (12.7%) |
| $35,000 to $49,999 | 1,032 (10.7%) | 875 (16.6%) |
| $50,000 to $74,999 | 995 (10.3%) | 828 (15.7%) |
| $75,000 to $99,999 | 1,321 (13.7%) | 694 (13.1%) |
| $100,000 to $149,999 | 2,314 (24.0%) | 535 (10.1%) |
| $150,000 or more | 2,945 (30.6%) | 281 (5.3%) |
| Total | 9,620 (100.0%) | 5,286 (100.0%) |
Monthly Housing Cost Tiers in Tucker
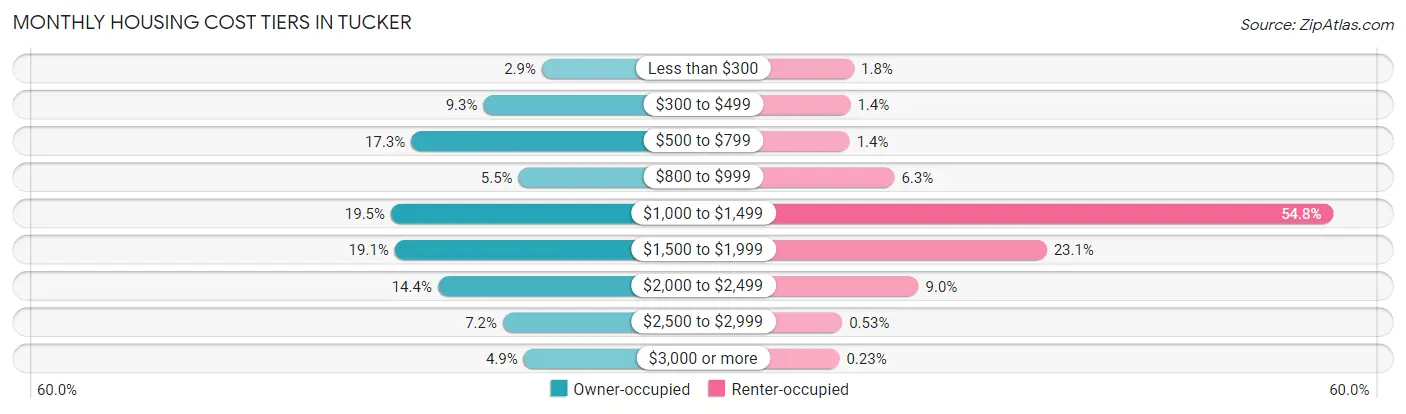
| Monthly Cost | Owner-occupied | Renter-occupied |
| Less than $300 | 275 (2.9%) | 97 (1.8%) |
| $300 to $499 | 898 (9.3%) | 76 (1.4%) |
| $500 to $799 | 1,664 (17.3%) | 72 (1.4%) |
| $800 to $999 | 524 (5.4%) | 333 (6.3%) |
| $1,000 to $1,499 | 1,880 (19.5%) | 2,895 (54.8%) |
| $1,500 to $1,999 | 1,839 (19.1%) | 1,222 (23.1%) |
| $2,000 to $2,499 | 1,381 (14.4%) | 474 (9.0%) |
| $2,500 to $2,999 | 690 (7.2%) | 28 (0.5%) |
| $3,000 or more | 469 (4.9%) | 12 (0.2%) |
| Total | 9,620 (100.0%) | 5,286 (100.0%) |
Physical Housing Characteristics in Tucker
Housing Structures in Tucker
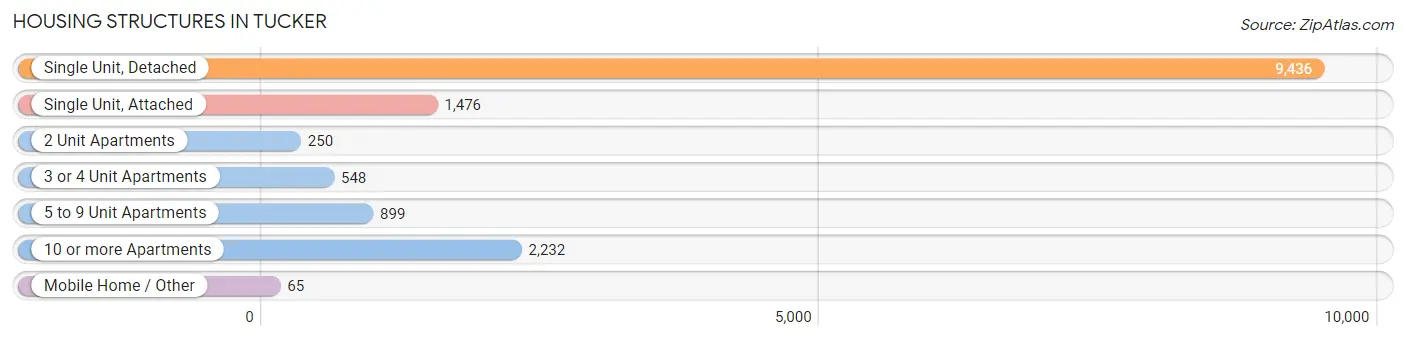
| Structure Type | # Housing Units | % Housing Units |
| Single Unit, Detached | 9,436 | 63.3% |
| Single Unit, Attached | 1,476 | 9.9% |
| 2 Unit Apartments | 250 | 1.7% |
| 3 or 4 Unit Apartments | 548 | 3.7% |
| 5 to 9 Unit Apartments | 899 | 6.0% |
| 10 or more Apartments | 2,232 | 15.0% |
| Mobile Home / Other | 65 | 0.4% |
| Total | 14,906 | 100.0% |
Housing Structures by Occupancy in Tucker
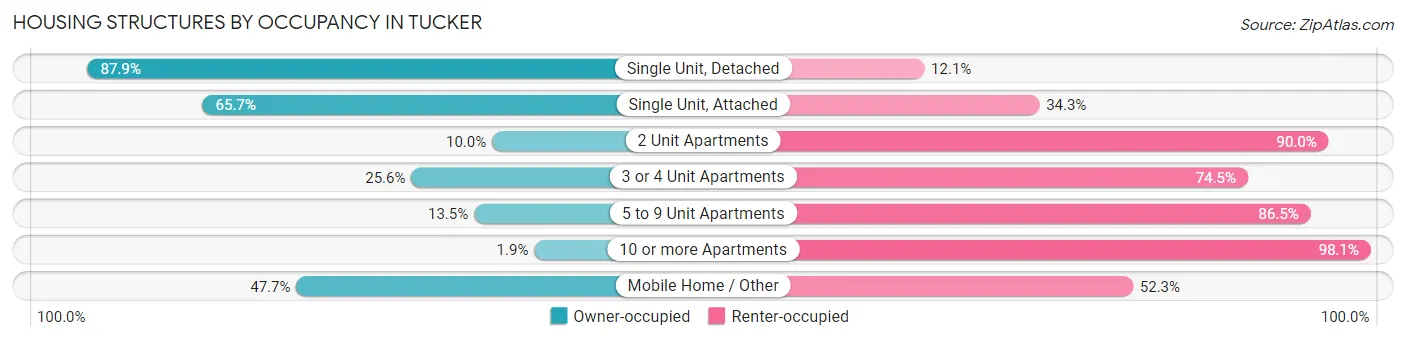
| Structure Type | Owner-occupied | Renter-occupied |
| Single Unit, Detached | 8,291 (87.9%) | 1,145 (12.1%) |
| Single Unit, Attached | 970 (65.7%) | 506 (34.3%) |
| 2 Unit Apartments | 25 (10.0%) | 225 (90.0%) |
| 3 or 4 Unit Apartments | 140 (25.6%) | 408 (74.5%) |
| 5 to 9 Unit Apartments | 121 (13.5%) | 778 (86.5%) |
| 10 or more Apartments | 42 (1.9%) | 2,190 (98.1%) |
| Mobile Home / Other | 31 (47.7%) | 34 (52.3%) |
| Total | 9,620 (64.5%) | 5,286 (35.5%) |
Housing Structures by Number of Rooms in Tucker
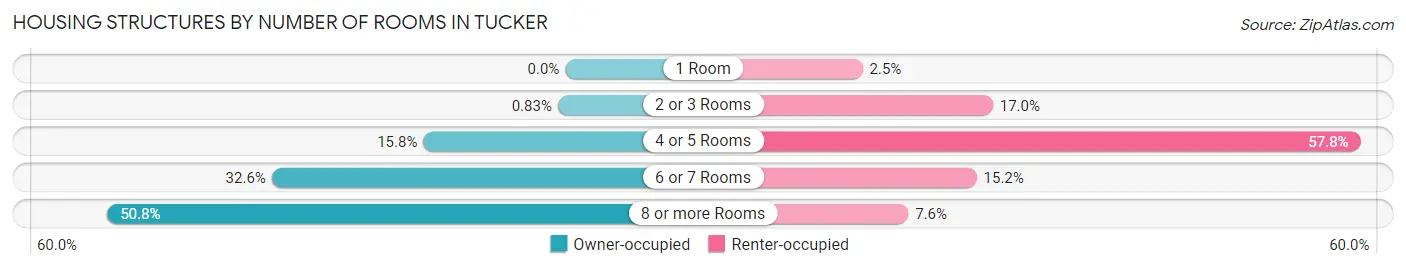
| Number of Rooms | Owner-occupied | Renter-occupied |
| 1 Room | 0 (0.0%) | 133 (2.5%) |
| 2 or 3 Rooms | 80 (0.8%) | 897 (17.0%) |
| 4 or 5 Rooms | 1,516 (15.8%) | 3,053 (57.8%) |
| 6 or 7 Rooms | 3,134 (32.6%) | 802 (15.2%) |
| 8 or more Rooms | 4,890 (50.8%) | 401 (7.6%) |
| Total | 9,620 (100.0%) | 5,286 (100.0%) |
Housing Structure by Heating Type in Tucker
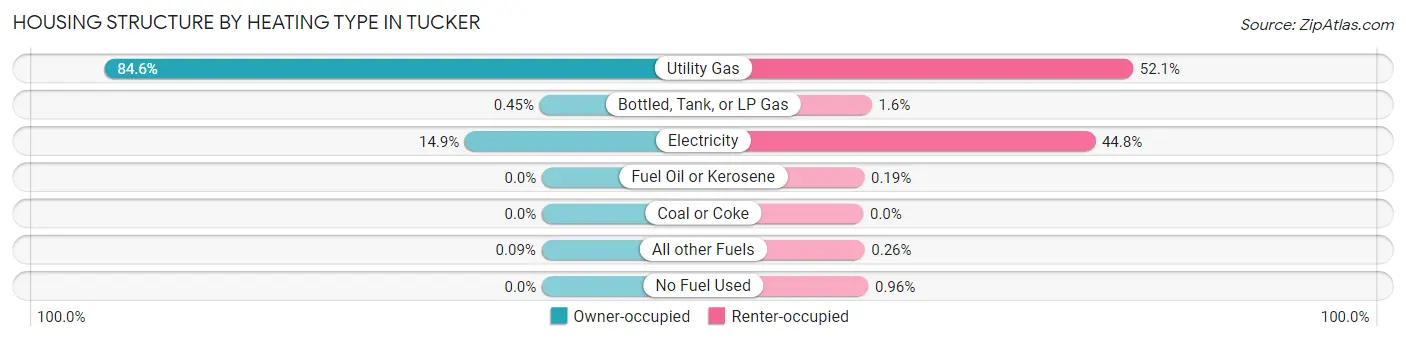
| Heating Type | Owner-occupied | Renter-occupied |
| Utility Gas | 8,136 (84.6%) | 2,756 (52.1%) |
| Bottled, Tank, or LP Gas | 43 (0.4%) | 86 (1.6%) |
| Electricity | 1,432 (14.9%) | 2,369 (44.8%) |
| Fuel Oil or Kerosene | 0 (0.0%) | 10 (0.2%) |
| Coal or Coke | 0 (0.0%) | 0 (0.0%) |
| All other Fuels | 9 (0.1%) | 14 (0.3%) |
| No Fuel Used | 0 (0.0%) | 51 (1.0%) |
| Total | 9,620 (100.0%) | 5,286 (100.0%) |
Household Vehicle Usage in Tucker
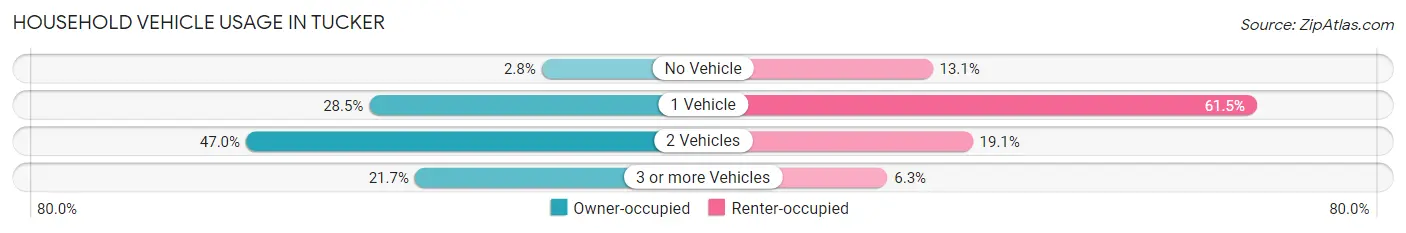
| Vehicles per Household | Owner-occupied | Renter-occupied |
| No Vehicle | 268 (2.8%) | 692 (13.1%) |
| 1 Vehicle | 2,745 (28.5%) | 3,251 (61.5%) |
| 2 Vehicles | 4,517 (46.9%) | 1,008 (19.1%) |
| 3 or more Vehicles | 2,090 (21.7%) | 335 (6.3%) |
| Total | 9,620 (100.0%) | 5,286 (100.0%) |
Real Estate & Mortgages in Tucker
Real Estate and Mortgage Overview in Tucker
| Characteristic | Without Mortgage | With Mortgage |
| Housing Units | 3,510 | 6,110 |
| Median Property Value | $333,900 | $329,500 |
| Median Household Income | $90,084 | $2,127 |
| Monthly Housing Costs | $662 | $469 |
| Real Estate Taxes | $2,677 | $130 |
Property Value by Mortgage Status in Tucker
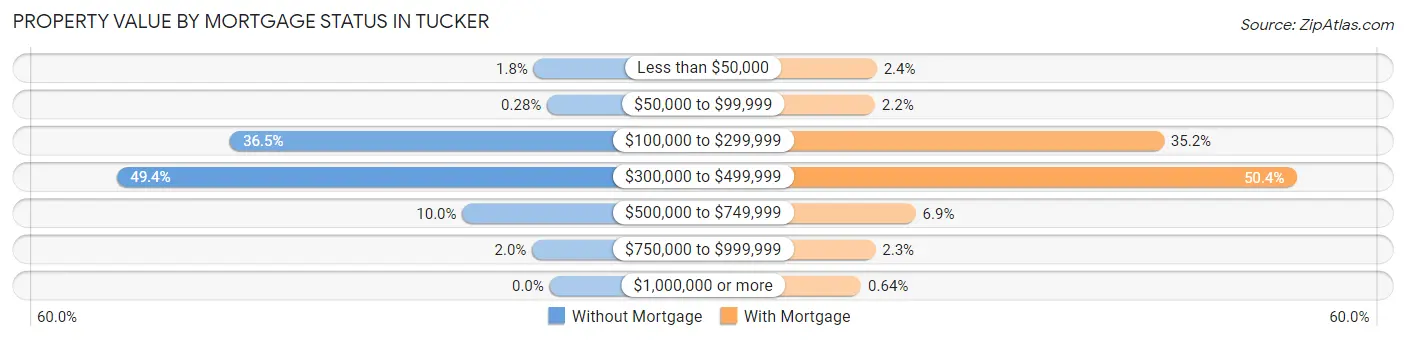
| Property Value | Without Mortgage | With Mortgage |
| Less than $50,000 | 64 (1.8%) | 148 (2.4%) |
| $50,000 to $99,999 | 10 (0.3%) | 135 (2.2%) |
| $100,000 to $299,999 | 1,282 (36.5%) | 2,153 (35.2%) |
| $300,000 to $499,999 | 1,734 (49.4%) | 3,077 (50.4%) |
| $500,000 to $749,999 | 350 (10.0%) | 420 (6.9%) |
| $750,000 to $999,999 | 70 (2.0%) | 138 (2.3%) |
| $1,000,000 or more | 0 (0.0%) | 39 (0.6%) |
| Total | 3,510 (100.0%) | 6,110 (100.0%) |
Household Income by Mortgage Status in Tucker
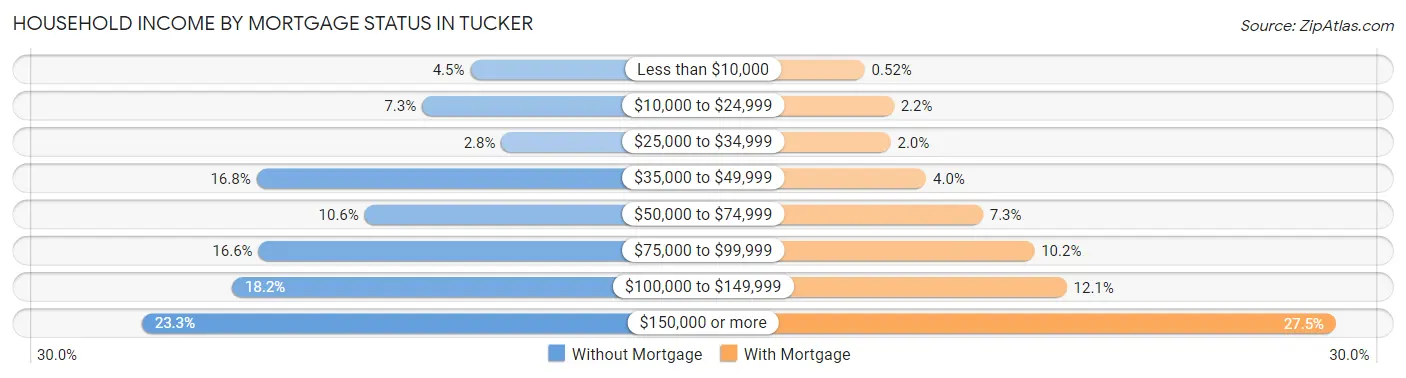
| Household Income | Without Mortgage | With Mortgage |
| Less than $10,000 | 159 (4.5%) | 32 (0.5%) |
| $10,000 to $24,999 | 256 (7.3%) | 133 (2.2%) |
| $25,000 to $34,999 | 97 (2.8%) | 122 (2.0%) |
| $35,000 to $49,999 | 588 (16.8%) | 246 (4.0%) |
| $50,000 to $74,999 | 371 (10.6%) | 444 (7.3%) |
| $75,000 to $99,999 | 584 (16.6%) | 624 (10.2%) |
| $100,000 to $149,999 | 637 (18.1%) | 737 (12.1%) |
| $150,000 or more | 818 (23.3%) | 1,677 (27.5%) |
| Total | 3,510 (100.0%) | 6,110 (100.0%) |
Property Value to Household Income Ratio in Tucker
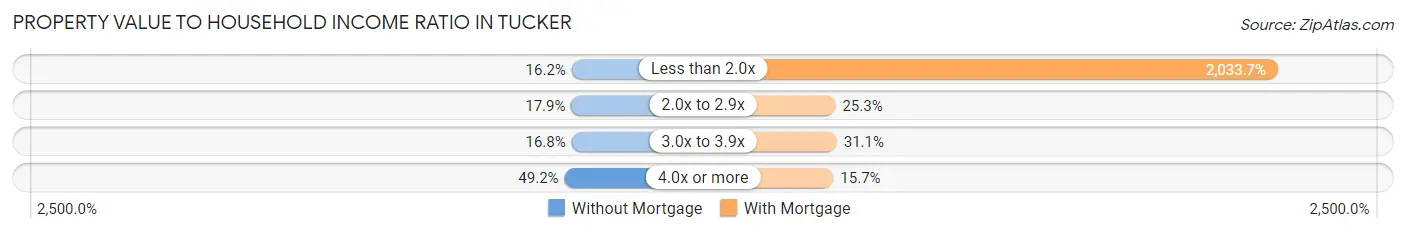
| Value-to-Income Ratio | Without Mortgage | With Mortgage |
| Less than 2.0x | 568 (16.2%) | 124,261 (2,033.7%) |
| 2.0x to 2.9x | 628 (17.9%) | 1,548 (25.3%) |
| 3.0x to 3.9x | 589 (16.8%) | 1,901 (31.1%) |
| 4.0x or more | 1,725 (49.1%) | 962 (15.7%) |
| Total | 3,510 (100.0%) | 6,110 (100.0%) |
Real Estate Taxes by Mortgage Status in Tucker
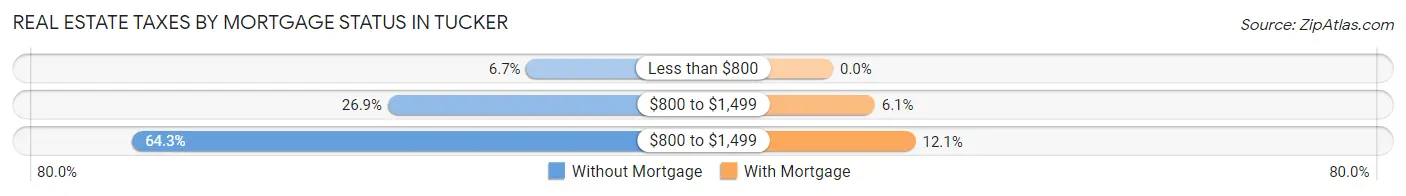
| Property Taxes | Without Mortgage | With Mortgage |
| Less than $800 | 234 (6.7%) | 0 (0.0%) |
| $800 to $1,499 | 945 (26.9%) | 373 (6.1%) |
| $800 to $1,499 | 2,256 (64.3%) | 736 (12.0%) |
| Total | 3,510 (100.0%) | 6,110 (100.0%) |
Health & Disability in Tucker
Health Insurance Coverage by Age in Tucker
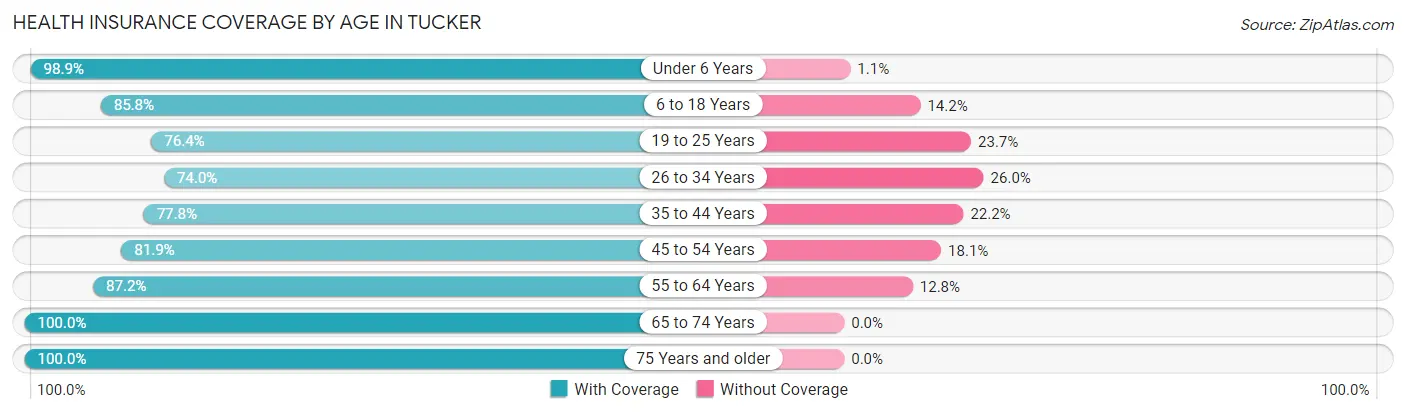
| Age Bracket | With Coverage | Without Coverage |
| Under 6 Years | 2,782 (98.9%) | 32 (1.1%) |
| 6 to 18 Years | 3,977 (85.8%) | 659 (14.2%) |
| 19 to 25 Years | 1,992 (76.3%) | 617 (23.6%) |
| 26 to 34 Years | 3,116 (74.0%) | 1,094 (26.0%) |
| 35 to 44 Years | 3,657 (77.8%) | 1,045 (22.2%) |
| 45 to 54 Years | 4,960 (81.9%) | 1,093 (18.1%) |
| 55 to 64 Years | 4,152 (87.2%) | 609 (12.8%) |
| 65 to 74 Years | 3,584 (100.0%) | 0 (0.0%) |
| 75 Years and older | 3,180 (100.0%) | 0 (0.0%) |
| Total | 31,400 (85.9%) | 5,149 (14.1%) |
Health Insurance Coverage by Citizenship Status in Tucker
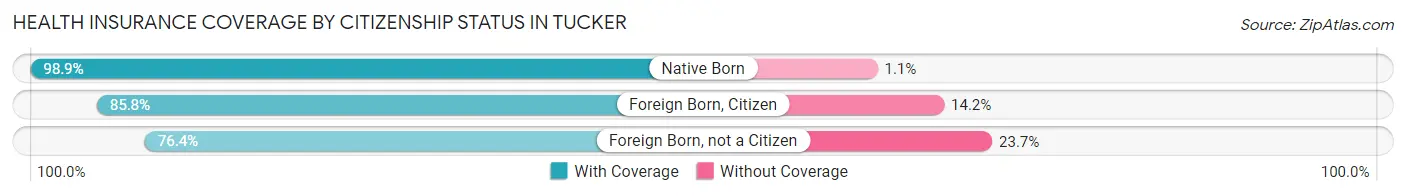
| Citizenship Status | With Coverage | Without Coverage |
| Native Born | 2,782 (98.9%) | 32 (1.1%) |
| Foreign Born, Citizen | 3,977 (85.8%) | 659 (14.2%) |
| Foreign Born, not a Citizen | 1,992 (76.3%) | 617 (23.6%) |
Health Insurance Coverage by Household Income in Tucker
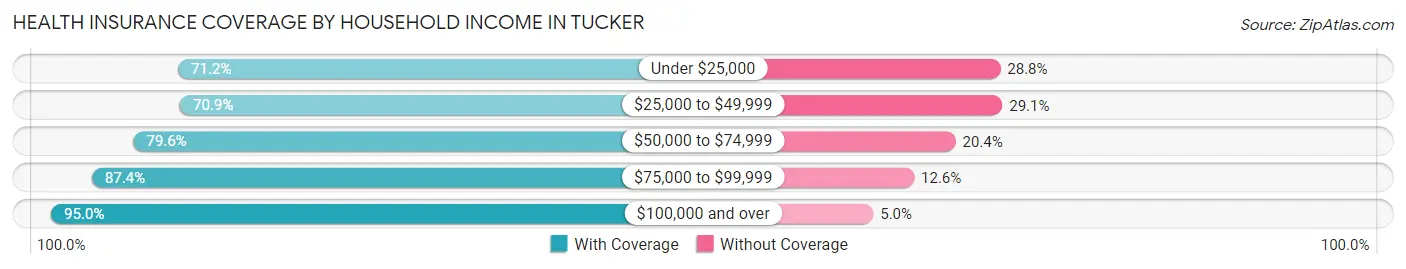
| Household Income | With Coverage | Without Coverage |
| Under $25,000 | 2,647 (71.2%) | 1,069 (28.8%) |
| $25,000 to $49,999 | 3,961 (70.9%) | 1,628 (29.1%) |
| $50,000 to $74,999 | 3,838 (79.6%) | 983 (20.4%) |
| $75,000 to $99,999 | 3,867 (87.4%) | 558 (12.6%) |
| $100,000 and over | 17,050 (95.0%) | 889 (5.0%) |
Public vs Private Health Insurance Coverage by Age in Tucker
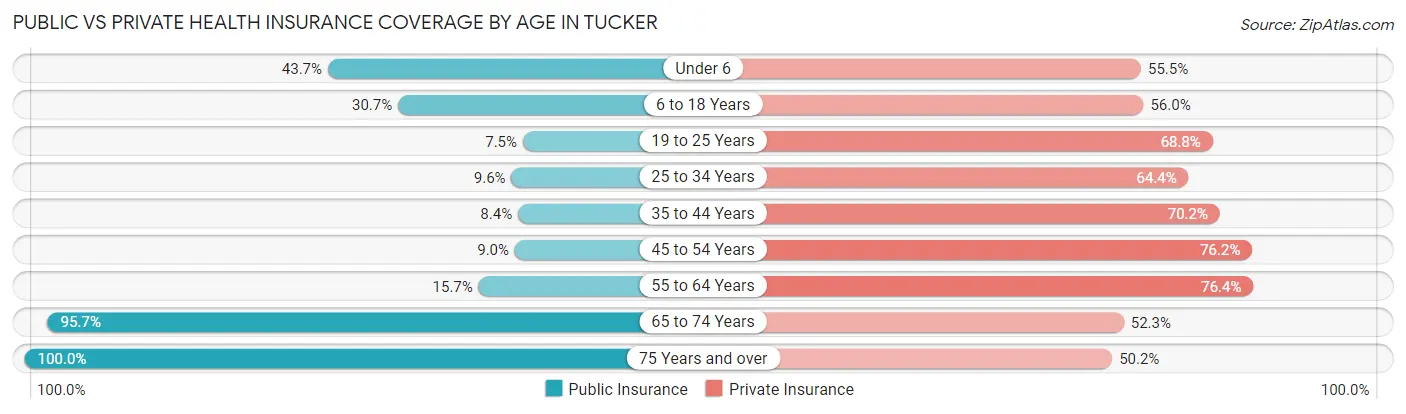
| Age Bracket | Public Insurance | Private Insurance |
| Under 6 | 1,230 (43.7%) | 1,563 (55.5%) |
| 6 to 18 Years | 1,423 (30.7%) | 2,596 (56.0%) |
| 19 to 25 Years | 196 (7.5%) | 1,796 (68.8%) |
| 25 to 34 Years | 406 (9.6%) | 2,710 (64.4%) |
| 35 to 44 Years | 396 (8.4%) | 3,299 (70.2%) |
| 45 to 54 Years | 545 (9.0%) | 4,611 (76.2%) |
| 55 to 64 Years | 749 (15.7%) | 3,636 (76.4%) |
| 65 to 74 Years | 3,431 (95.7%) | 1,876 (52.3%) |
| 75 Years and over | 3,180 (100.0%) | 1,596 (50.2%) |
| Total | 11,556 (31.6%) | 23,683 (64.8%) |
Disability Status by Sex by Age in Tucker
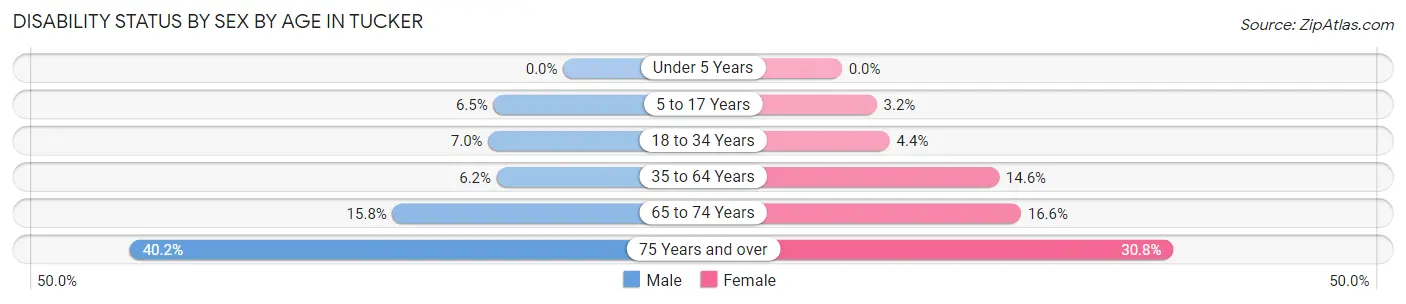
| Age Bracket | Male | Female |
| Under 5 Years | 0 (0.0%) | 0 (0.0%) |
| 5 to 17 Years | 186 (6.5%) | 60 (3.2%) |
| 18 to 34 Years | 261 (7.0%) | 153 (4.4%) |
| 35 to 64 Years | 444 (6.2%) | 1,213 (14.6%) |
| 65 to 74 Years | 253 (15.8%) | 330 (16.6%) |
| 75 Years and over | 466 (40.2%) | 622 (30.8%) |
Disability Class by Sex by Age in Tucker
Disability Class: Hearing Difficulty
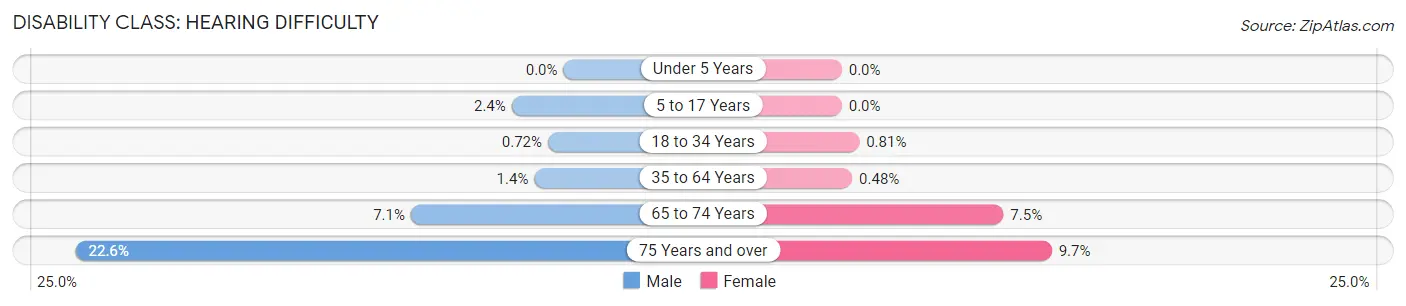
| Age Bracket | Male | Female |
| Under 5 Years | 0 (0.0%) | 0 (0.0%) |
| 5 to 17 Years | 69 (2.4%) | 0 (0.0%) |
| 18 to 34 Years | 27 (0.7%) | 28 (0.8%) |
| 35 to 64 Years | 97 (1.3%) | 40 (0.5%) |
| 65 to 74 Years | 113 (7.1%) | 149 (7.5%) |
| 75 Years and over | 262 (22.6%) | 197 (9.7%) |
Disability Class: Vision Difficulty
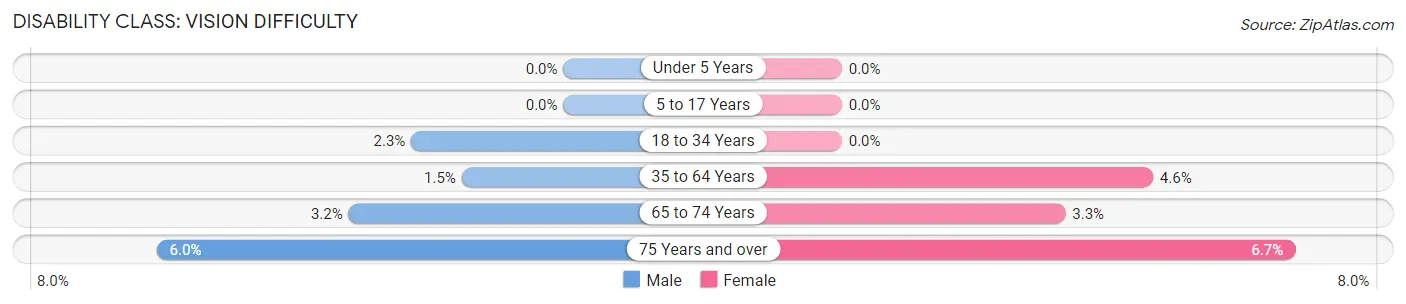
| Age Bracket | Male | Female |
| Under 5 Years | 0 (0.0%) | 0 (0.0%) |
| 5 to 17 Years | 0 (0.0%) | 0 (0.0%) |
| 18 to 34 Years | 85 (2.3%) | 0 (0.0%) |
| 35 to 64 Years | 109 (1.5%) | 384 (4.6%) |
| 65 to 74 Years | 51 (3.2%) | 66 (3.3%) |
| 75 Years and over | 70 (6.0%) | 136 (6.7%) |
Disability Class: Cognitive Difficulty
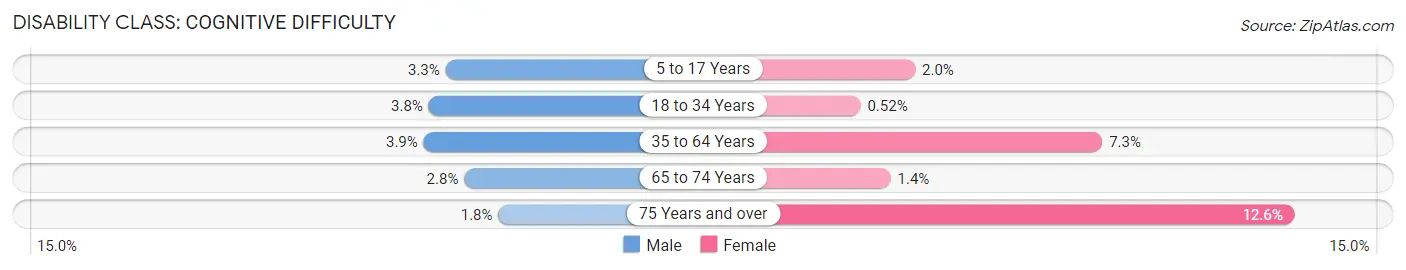
| Age Bracket | Male | Female |
| 5 to 17 Years | 94 (3.3%) | 38 (2.0%) |
| 18 to 34 Years | 141 (3.7%) | 18 (0.5%) |
| 35 to 64 Years | 280 (3.9%) | 603 (7.2%) |
| 65 to 74 Years | 44 (2.8%) | 27 (1.4%) |
| 75 Years and over | 21 (1.8%) | 255 (12.6%) |
Disability Class: Ambulatory Difficulty
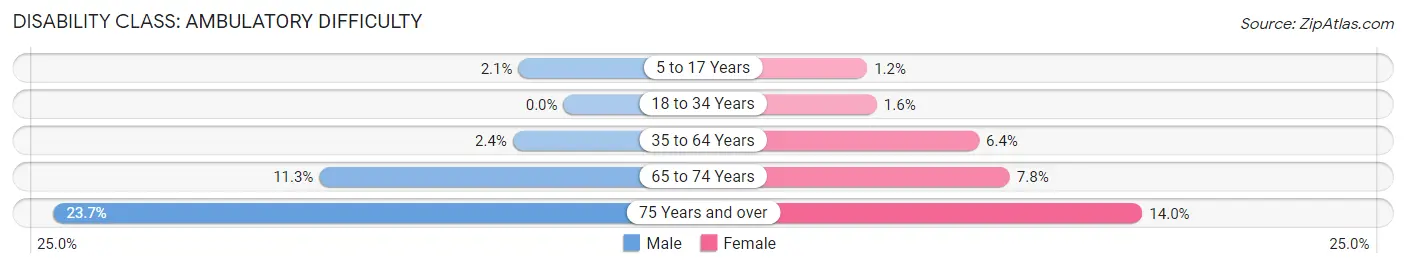
| Age Bracket | Male | Female |
| 5 to 17 Years | 60 (2.1%) | 22 (1.2%) |
| 18 to 34 Years | 0 (0.0%) | 56 (1.6%) |
| 35 to 64 Years | 169 (2.4%) | 530 (6.4%) |
| 65 to 74 Years | 181 (11.3%) | 155 (7.8%) |
| 75 Years and over | 274 (23.7%) | 282 (14.0%) |
Disability Class: Self-Care Difficulty
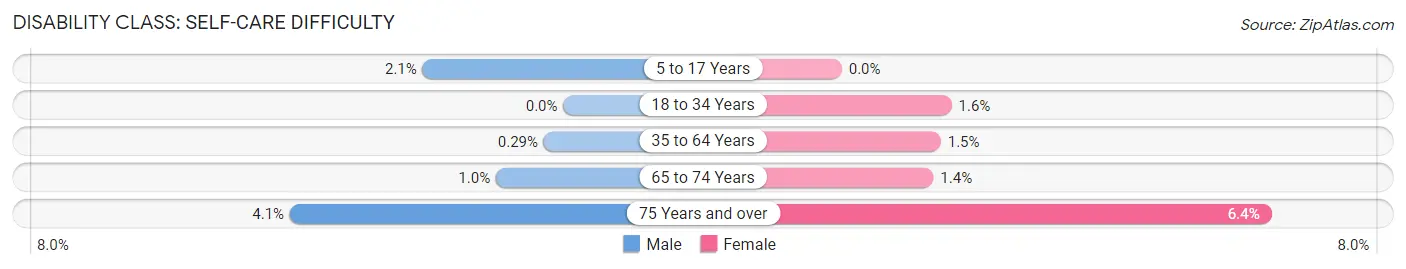
| Age Bracket | Male | Female |
| 5 to 17 Years | 60 (2.1%) | 0 (0.0%) |
| 18 to 34 Years | 0 (0.0%) | 56 (1.6%) |
| 35 to 64 Years | 21 (0.3%) | 122 (1.5%) |
| 65 to 74 Years | 16 (1.0%) | 27 (1.4%) |
| 75 Years and over | 47 (4.1%) | 129 (6.4%) |
Technology Access in Tucker
Computing Device Access in Tucker
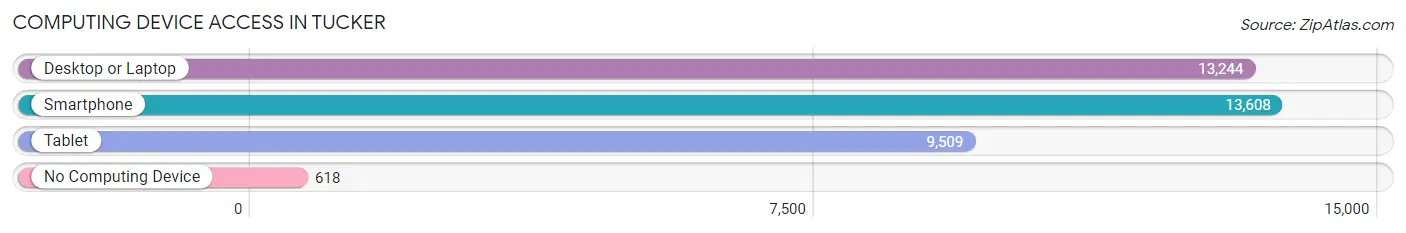
| Device Type | # Households | % Households |
| Desktop or Laptop | 13,244 | 88.8% |
| Smartphone | 13,608 | 91.3% |
| Tablet | 9,509 | 63.8% |
| No Computing Device | 618 | 4.2% |
| Total | 14,906 | 100.0% |
Internet Access in Tucker
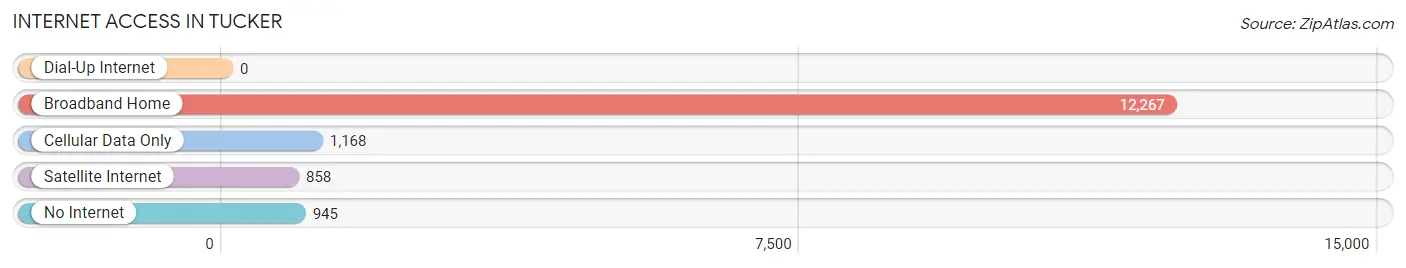
| Internet Type | # Households | % Households |
| Dial-Up Internet | 0 | 0.0% |
| Broadband Home | 12,267 | 82.3% |
| Cellular Data Only | 1,168 | 7.8% |
| Satellite Internet | 858 | 5.8% |
| No Internet | 945 | 6.3% |
| Total | 14,906 | 100.0% |
Tucker Summary
Tucker, Georgia is a small city located in the northern part of DeKalb County, just outside of Atlanta. It is a suburb of the city and is home to a population of just over 27,000 people. The city was founded in 1892 and was named after a prominent local family.
History
Tucker was founded in 1892 by a group of settlers from the nearby city of Decatur. The settlers were looking for a place to build a new town and chose the area that is now Tucker. The town was named after the Tucker family, who were prominent in the area. The first post office was established in 1894 and the town was officially incorporated in 1915.
Tucker was a rural farming community for much of its early history. The town was home to several small farms and businesses, including a cotton gin, a grist mill, and a sawmill. The town also had a few stores and a hotel.
In the 1950s, the city began to experience rapid growth as Atlanta's suburbs began to expand. The city was annexed by the city of Atlanta in 1971, and the population continued to grow. In the late 1990s, the city was reincorporated as an independent city.
Geography
Tucker is located in the northern part of DeKalb County, just outside of Atlanta. The city is situated on the edge of the Atlanta metropolitan area and is bordered by the cities of Doraville, Chamblee, and Stone Mountain. The city covers an area of 4.2 square miles and has an elevation of 1,000 feet.
The city is located in the Piedmont region of Georgia and is characterized by rolling hills and forests. The city is home to several parks, including Tucker Park, which is located in the center of the city. The city is also home to several lakes, including Lake Tucker, which is located in the northern part of the city.
Economy
Tucker is a primarily residential city, but it is also home to several businesses and industries. The city is home to several corporate headquarters, including the headquarters of the Home Depot, which is located in the city. The city is also home to several manufacturing companies, including the Tucker Manufacturing Company, which produces automotive parts.
The city is also home to several retail stores, including the Tucker Mall, which is located in the center of the city. The city is also home to several restaurants, bars, and other entertainment venues.
Demographics
As of the 2010 census, the population of Tucker was 27,581. The population is primarily white (71.3%), followed by African American (20.2%), Asian (3.7%), and Hispanic (2.7%). The median household income is $60,945 and the median home value is $182,000.
The city is served by the DeKalb County School System, which includes several elementary, middle, and high schools. The city is also home to several private schools, including the Tucker Christian Academy and the Tucker Montessori School.
Conclusion
Tucker, Georgia is a small city located in the northern part of DeKalb County, just outside of Atlanta. It is a suburb of the city and is home to a population of just over 27,000 people. The city was founded in 1892 and was named after a prominent local family. The city is primarily residential, but it is also home to several businesses and industries. The population is primarily white, followed by African American, Asian, and Hispanic. The city is served by the DeKalb County School System and is home to several private schools.
Common Questions
What is Per Capita Income in Tucker?
Per Capita income in Tucker is $43,811.
What is the Median Family Income in Tucker?
Median Family Income in Tucker is $101,912.
What is the Median Household income in Tucker?
Median Household Income in Tucker is $80,311.
What is Income or Wage Gap in Tucker?
Income or Wage Gap in Tucker is 10.7%.
Women in Tucker earn 89.3 cents for every dollar earned by a man.
What is Inequality or Gini Index in Tucker?
Inequality or Gini Index in Tucker is 0.45.
What is the Total Population of Tucker?
Total Population of Tucker is 36,994.
What is the Total Male Population of Tucker?
Total Male Population of Tucker is 17,918.
What is the Total Female Population of Tucker?
Total Female Population of Tucker is 19,076.
What is the Ratio of Males per 100 Females in Tucker?
There are 93.93 Males per 100 Females in Tucker.
What is the Ratio of Females per 100 Males in Tucker?
There are 106.46 Females per 100 Males in Tucker.
What is the Median Population Age in Tucker?
Median Population Age in Tucker is 43.8 Years.
What is the Average Family Size in Tucker
Average Family Size in Tucker is 3.2 People.
What is the Average Household Size in Tucker
Average Household Size in Tucker is 2.5 People.
How Large is the Labor Force in Tucker?
There are 19,502 People in the Labor Forcein in Tucker.
What is the Percentage of People in the Labor Force in Tucker?
63.1% of People are in the Labor Force in Tucker.
What is the Unemployment Rate in Tucker?
Unemployment Rate in Tucker is 6.0%.