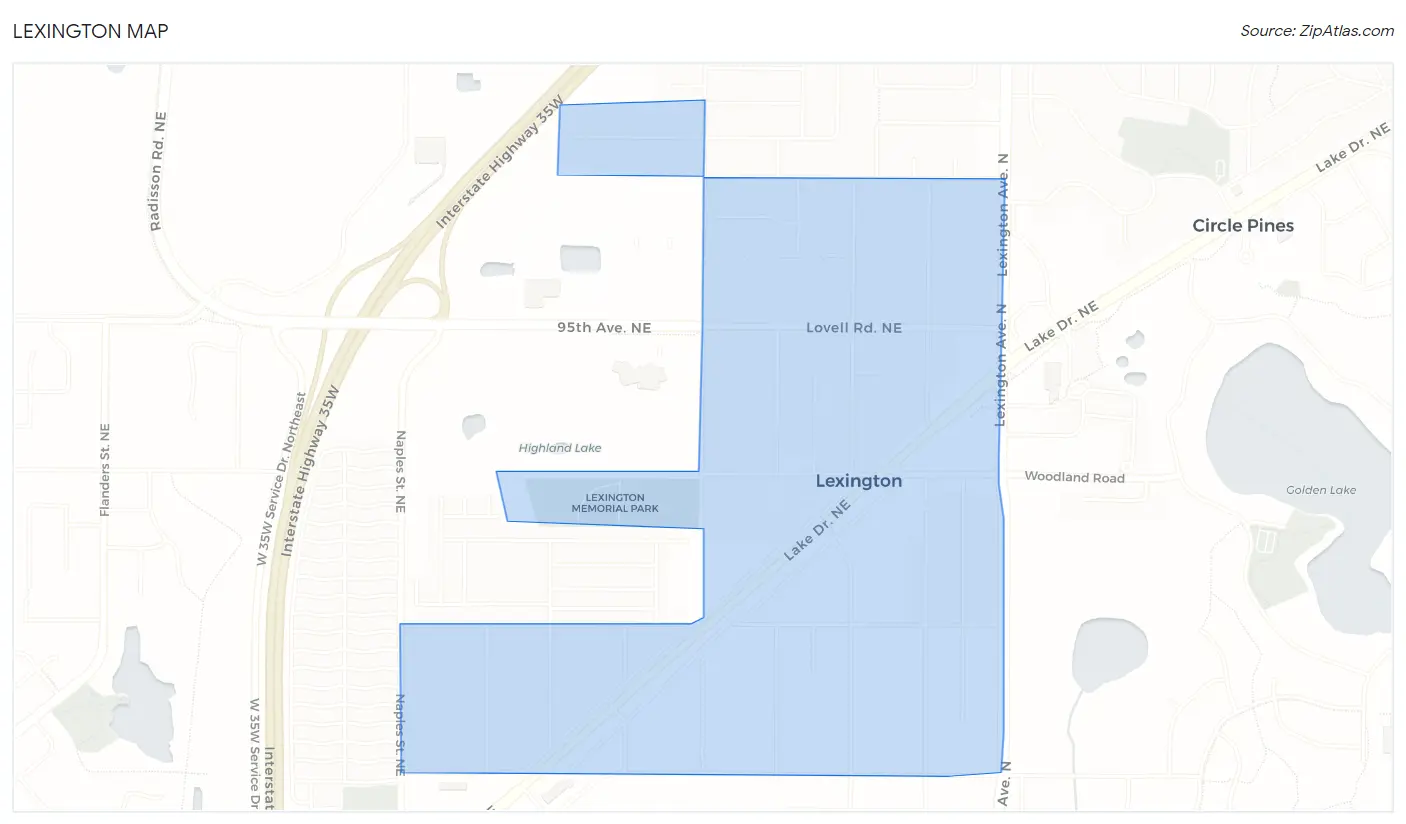
Lexington, MN Map & Demographics
Lexington Map
Lexington Overview
$34,957
PER CAPITA INCOME
$76,890
AVG FAMILY INCOME
$76,047
AVG HOUSEHOLD INCOME
15.0%
WAGE / INCOME GAP [ % ]
85.0¢/ $1
WAGE / INCOME GAP [ $ ]
0.36
INEQUALITY / GINI INDEX
2,448
TOTAL POPULATION
1,255
MALE POPULATION
1,193
FEMALE POPULATION
105.20
MALES / 100 FEMALES
95.06
FEMALES / 100 MALES
38.2
MEDIAN AGE
2.8
AVG FAMILY SIZE
2.5
AVG HOUSEHOLD SIZE
1,540
LABOR FORCE [ PEOPLE ]
77.6%
PERCENT IN LABOR FORCE
5.7%
UNEMPLOYMENT RATE
Income in Lexington
Income Overview in Lexington
Per Capita Income in Lexington is $34,957, while median incomes of families and households are $76,890 and $76,047 respectively.
| Characteristic | Number | Measure |
| Per Capita Income | 2,448 | $34,957 |
| Median Family Income | 687 | $76,890 |
| Mean Family Income | 687 | $89,423 |
| Median Household Income | 994 | $76,047 |
| Mean Household Income | 994 | $85,198 |
| Income Deficit | 687 | $0 |
| Wage / Income Gap (%) | 2,448 | 14.95% |
| Wage / Income Gap ($) | 2,448 | 85.05¢ per $1 |
| Gini / Inequality Index | 2,448 | 0.36 |
Earnings by Sex in Lexington
Average Earnings in Lexington are $40,957, $43,359 for men and $36,875 for women, a difference of 14.9%.
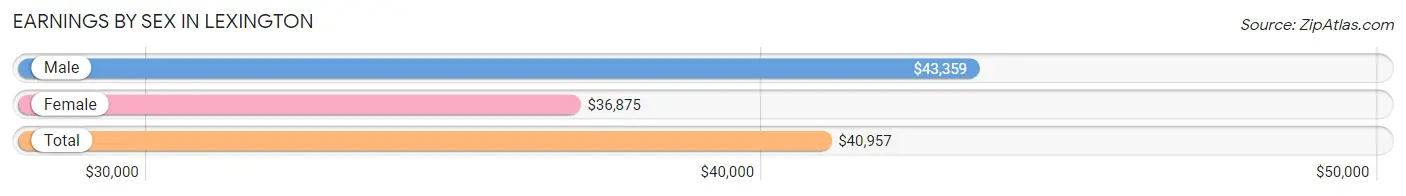
| Sex | Number | Average Earnings |
| Male | 898 (56.6%) | $43,359 |
| Female | 688 (43.4%) | $36,875 |
| Total | 1,586 (100.0%) | $40,957 |
Earnings by Sex by Income Bracket in Lexington
The most common earnings brackets in Lexington are $75,000 to $99,999 for men (169 | 18.8%) and $55,000 to $64,999 for women (79 | 11.5%).
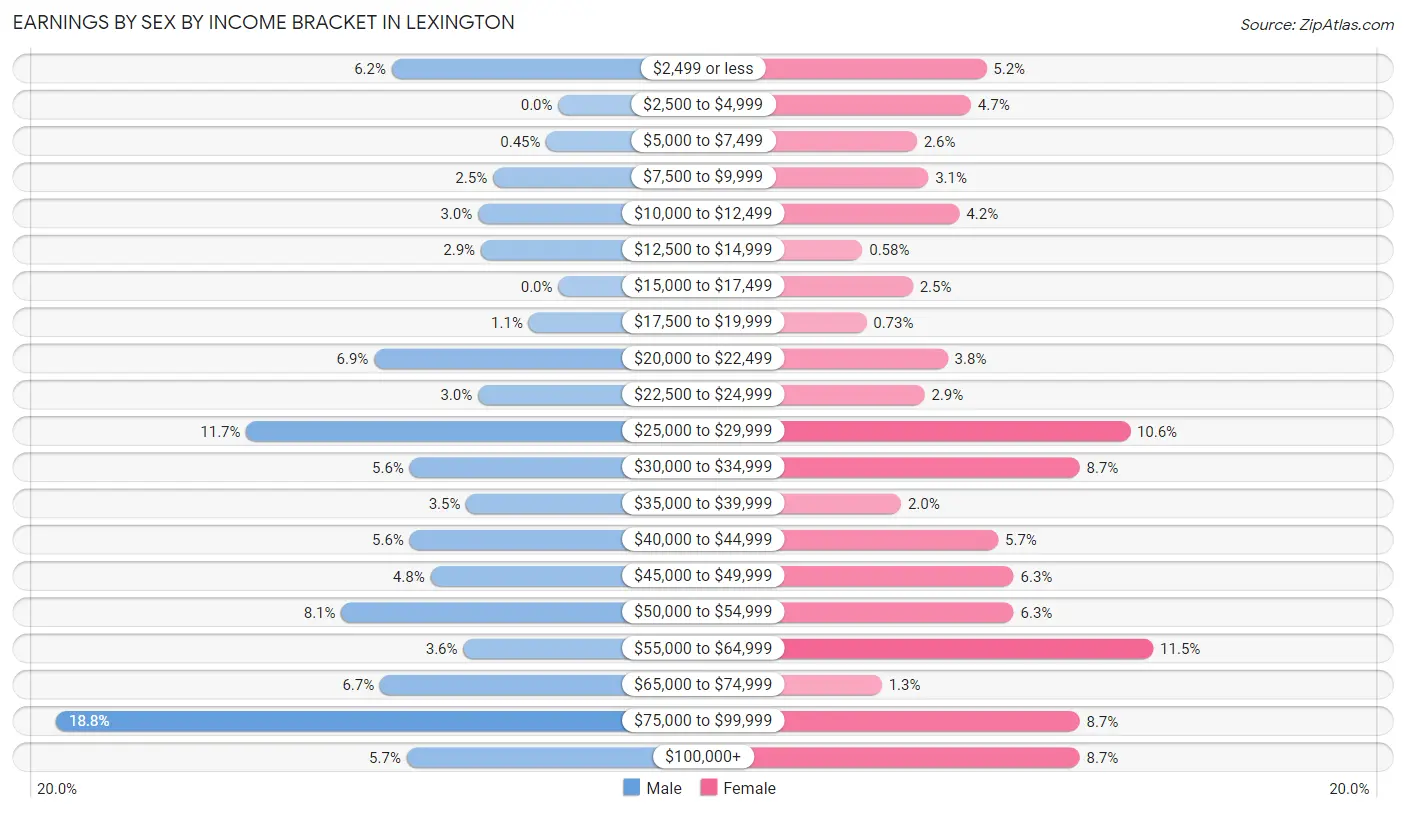
| Income | Male | Female |
| $2,499 or less | 56 (6.2%) | 36 (5.2%) |
| $2,500 to $4,999 | 0 (0.0%) | 32 (4.6%) |
| $5,000 to $7,499 | 4 (0.4%) | 18 (2.6%) |
| $7,500 to $9,999 | 22 (2.5%) | 21 (3.0%) |
| $10,000 to $12,499 | 27 (3.0%) | 29 (4.2%) |
| $12,500 to $14,999 | 26 (2.9%) | 4 (0.6%) |
| $15,000 to $17,499 | 0 (0.0%) | 17 (2.5%) |
| $17,500 to $19,999 | 10 (1.1%) | 5 (0.7%) |
| $20,000 to $22,499 | 62 (6.9%) | 26 (3.8%) |
| $22,500 to $24,999 | 27 (3.0%) | 20 (2.9%) |
| $25,000 to $29,999 | 105 (11.7%) | 73 (10.6%) |
| $30,000 to $34,999 | 50 (5.6%) | 60 (8.7%) |
| $35,000 to $39,999 | 31 (3.5%) | 14 (2.0%) |
| $40,000 to $44,999 | 50 (5.6%) | 39 (5.7%) |
| $45,000 to $49,999 | 43 (4.8%) | 43 (6.2%) |
| $50,000 to $54,999 | 73 (8.1%) | 43 (6.2%) |
| $55,000 to $64,999 | 32 (3.6%) | 79 (11.5%) |
| $65,000 to $74,999 | 60 (6.7%) | 9 (1.3%) |
| $75,000 to $99,999 | 169 (18.8%) | 60 (8.7%) |
| $100,000+ | 51 (5.7%) | 60 (8.7%) |
| Total | 898 (100.0%) | 688 (100.0%) |
Earnings by Sex by Educational Attainment in Lexington
Average earnings in Lexington are $48,533 for men and $45,759 for women, a difference of 5.7%. Men with an educational attainment of bachelor's degree enjoy the highest average annual earnings of $76,250, while those with less than high school education earn the least with $24,545. Women with an educational attainment of graduate degree earn the most with the average annual earnings of $86,875, while those with less than high school education have the smallest earnings of $32,132.
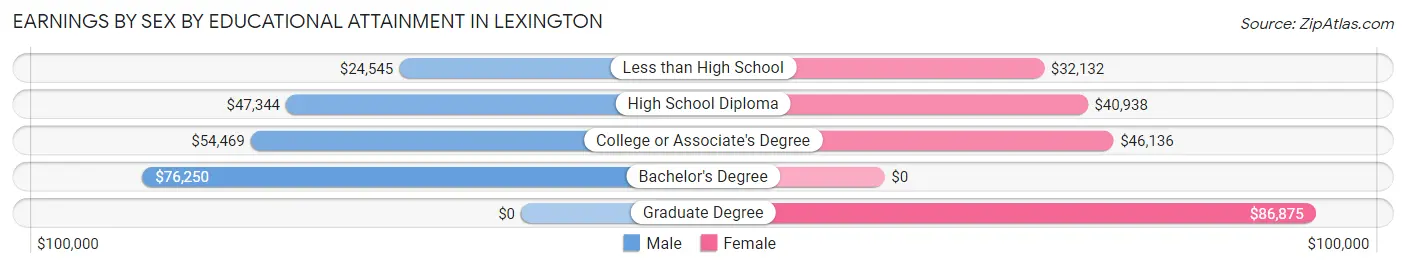
| Educational Attainment | Male Income | Female Income |
| Less than High School | $24,545 | $32,132 |
| High School Diploma | $47,344 | $40,938 |
| College or Associate's Degree | $54,469 | $46,136 |
| Bachelor's Degree | $76,250 | $0 |
| Graduate Degree | - | - |
| Total | $48,533 | $45,759 |
Family Income in Lexington
Family Income Brackets in Lexington
According to the Lexington family income data, there are 208 families falling into the $100,000 to $149,999 income range, which is the most common income bracket and makes up 30.3% of all families. Conversely, the less than $10,000 income bracket is the least frequent group with only 10 families (1.5%) belonging to this category.
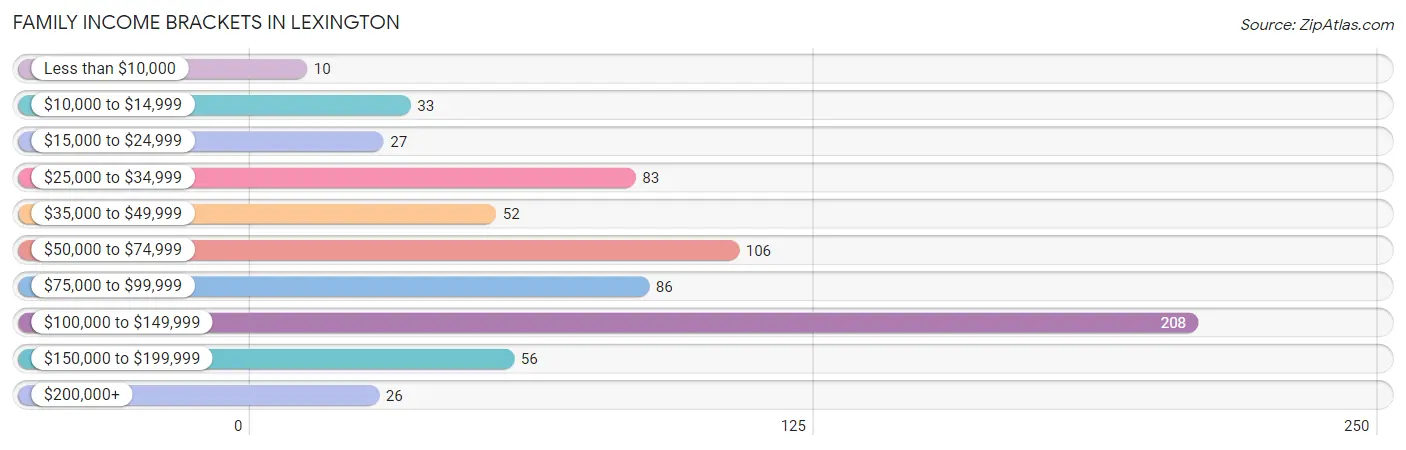
| Income Bracket | # Families | % Families |
| Less than $10,000 | 10 | 1.5% |
| $10,000 to $14,999 | 33 | 4.8% |
| $15,000 to $24,999 | 27 | 3.9% |
| $25,000 to $34,999 | 83 | 12.1% |
| $35,000 to $49,999 | 52 | 7.6% |
| $50,000 to $74,999 | 106 | 15.4% |
| $75,000 to $99,999 | 86 | 12.5% |
| $100,000 to $149,999 | 208 | 30.3% |
| $150,000 to $199,999 | 56 | 8.2% |
| $200,000+ | 26 | 3.8% |
Family Income by Famaliy Size in Lexington
4-person families (89 | 13.0%) account for the highest median family income in Lexington with $107,750 per family, while 2-person families (412 | 60.0%) have the highest median income of $38,393 per family member.
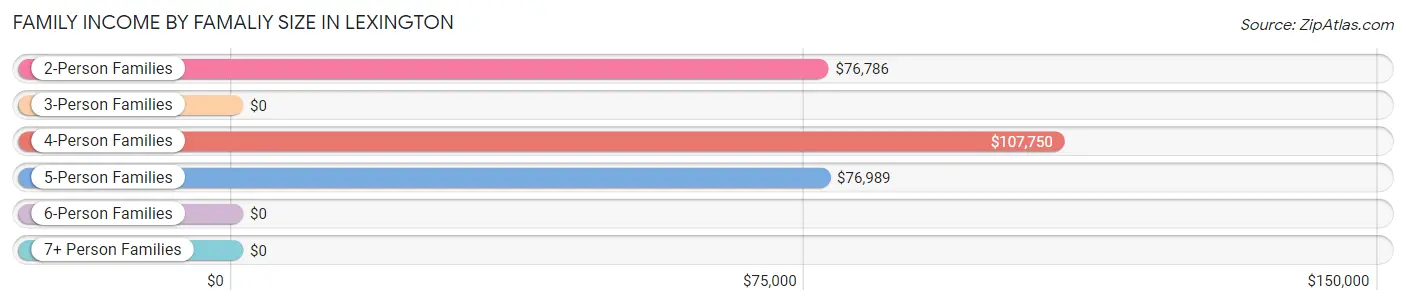
| Income Bracket | # Families | Median Income |
| 2-Person Families | 412 (60.0%) | $76,786 |
| 3-Person Families | 129 (18.8%) | $0 |
| 4-Person Families | 89 (13.0%) | $107,750 |
| 5-Person Families | 43 (6.3%) | $76,989 |
| 6-Person Families | 0 (0.0%) | $0 |
| 7+ Person Families | 14 (2.0%) | $0 |
| Total | 687 (100.0%) | $76,890 |
Family Income by Number of Earners in Lexington
The median family income in Lexington is $76,890, with families comprising 3+ earners (75) having the highest median family income of $122,417, while families with no earners (38) have the lowest median family income of $11,184, accounting for 10.9% and 5.5% of families, respectively.
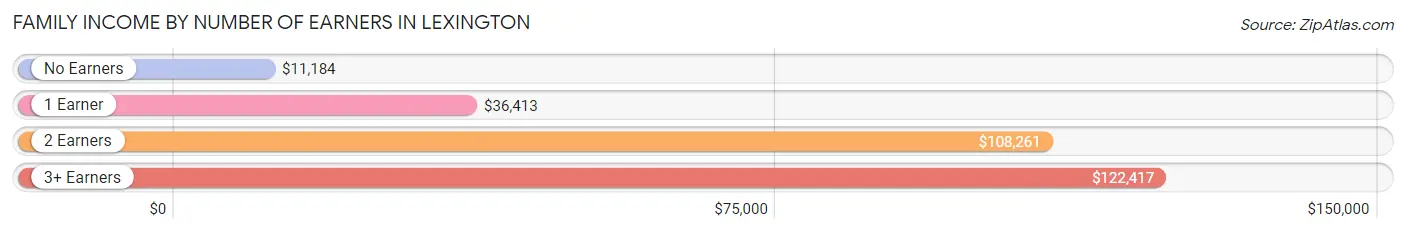
| Number of Earners | # Families | Median Income |
| No Earners | 38 (5.5%) | $11,184 |
| 1 Earner | 210 (30.6%) | $36,413 |
| 2 Earners | 364 (53.0%) | $108,261 |
| 3+ Earners | 75 (10.9%) | $122,417 |
| Total | 687 (100.0%) | $76,890 |
Household Income in Lexington
Household Income Brackets in Lexington
With 224 households falling in the category, the $100,000 to $149,999 income range is the most frequent in Lexington, accounting for 22.5% of all households. In contrast, only 11 households (1.1%) fall into the less than $10,000 income bracket, making it the least populous group.
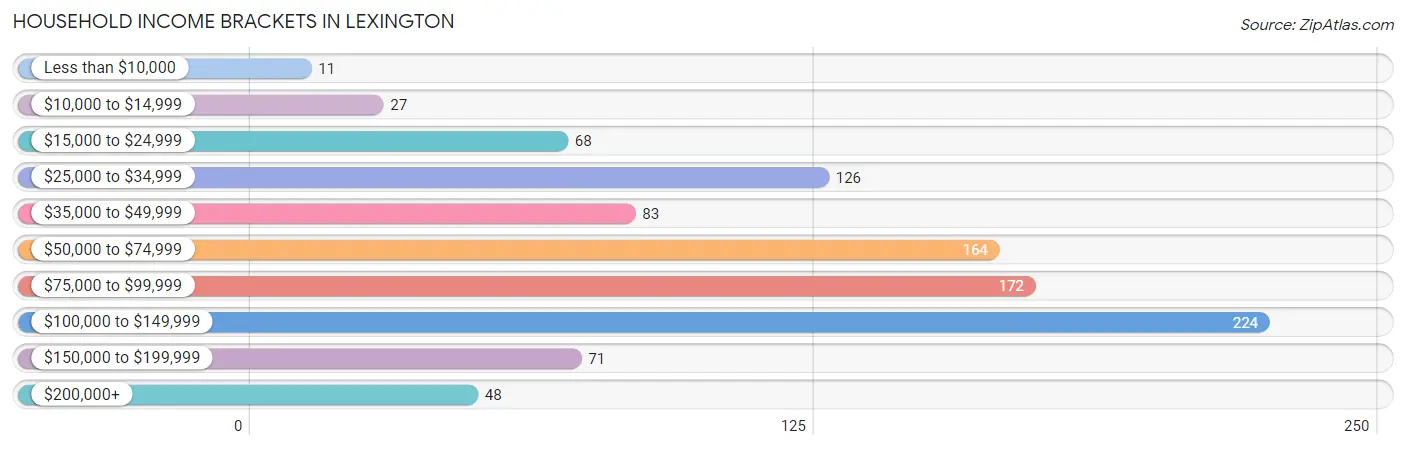
| Income Bracket | # Households | % Households |
| Less than $10,000 | 11 | 1.1% |
| $10,000 to $14,999 | 27 | 2.7% |
| $15,000 to $24,999 | 68 | 6.8% |
| $25,000 to $34,999 | 126 | 12.7% |
| $35,000 to $49,999 | 83 | 8.4% |
| $50,000 to $74,999 | 164 | 16.5% |
| $75,000 to $99,999 | 172 | 17.3% |
| $100,000 to $149,999 | 224 | 22.5% |
| $150,000 to $199,999 | 71 | 7.1% |
| $200,000+ | 48 | 4.8% |
Household Income by Householder Age in Lexington
The median household income in Lexington is $76,047, with the highest median household income of $100,227 found in the 45 to 64 years age bracket for the primary householder. A total of 462 households (46.5%) fall into this category. Meanwhile, the 15 to 24 years age bracket for the primary householder has the lowest median household income of $52,500, with 96 households (9.7%) in this group.
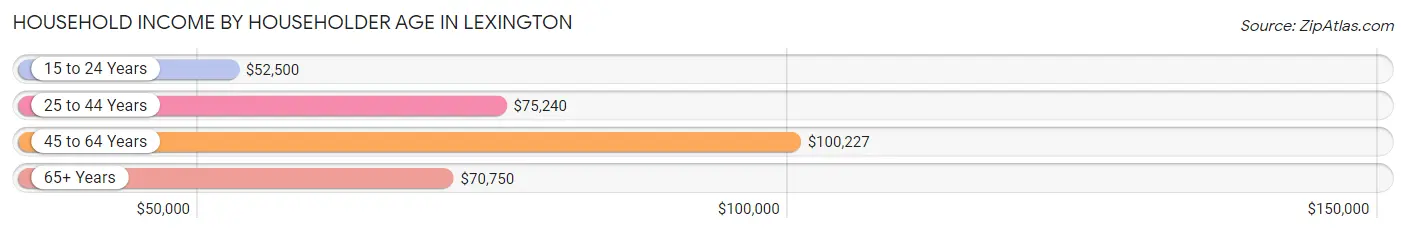
| Income Bracket | # Households | Median Income |
| 15 to 24 Years | 96 (9.7%) | $52,500 |
| 25 to 44 Years | 305 (30.7%) | $75,240 |
| 45 to 64 Years | 462 (46.5%) | $100,227 |
| 65+ Years | 131 (13.2%) | $70,750 |
| Total | 994 (100.0%) | $76,047 |
Poverty in Lexington
Income Below Poverty by Sex and Age in Lexington
With 11.9% poverty level for males and 13.3% for females among the residents of Lexington, 16 and 17 year old males and 16 and 17 year old females are the most vulnerable to poverty, with 20 males (46.5%) and 12 females (75.0%) in their respective age groups living below the poverty level.
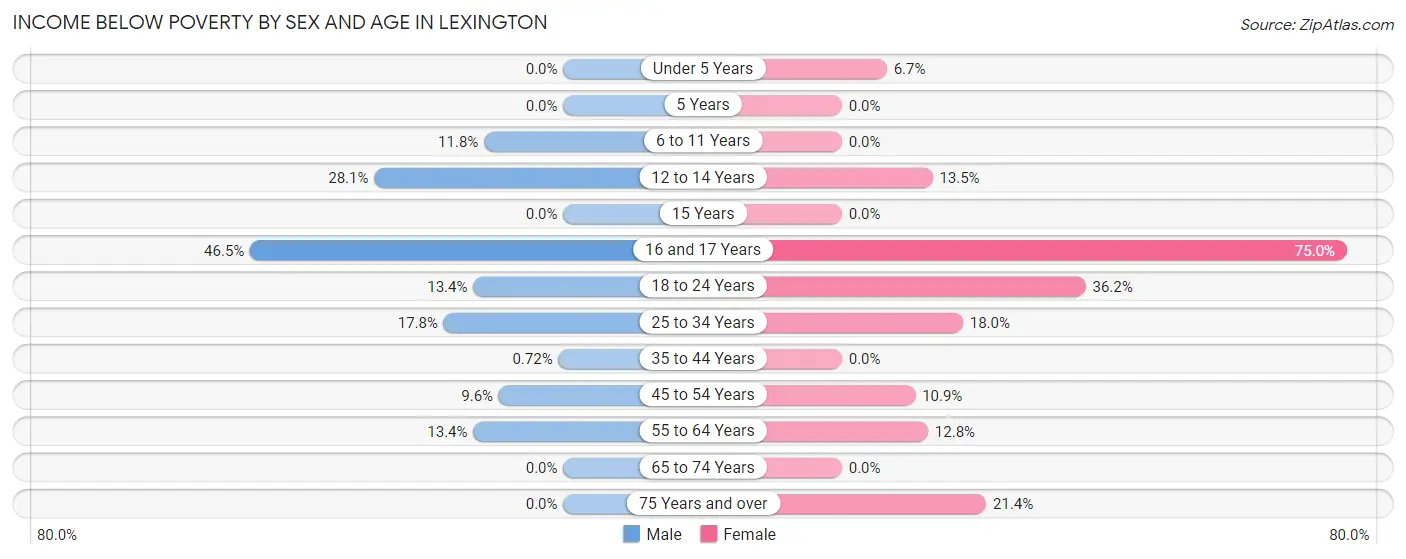
| Age Bracket | Male | Female |
| Under 5 Years | 0 (0.0%) | 7 (6.7%) |
| 5 Years | 0 (0.0%) | 0 (0.0%) |
| 6 to 11 Years | 6 (11.8%) | 0 (0.0%) |
| 12 to 14 Years | 16 (28.1%) | 7 (13.5%) |
| 15 Years | 0 (0.0%) | 0 (0.0%) |
| 16 and 17 Years | 20 (46.5%) | 12 (75.0%) |
| 18 to 24 Years | 23 (13.4%) | 59 (36.2%) |
| 25 to 34 Years | 30 (17.7%) | 23 (18.0%) |
| 35 to 44 Years | 1 (0.7%) | 0 (0.0%) |
| 45 to 54 Years | 18 (9.6%) | 17 (10.9%) |
| 55 to 64 Years | 35 (13.4%) | 28 (12.8%) |
| 65 to 74 Years | 0 (0.0%) | 0 (0.0%) |
| 75 Years and over | 0 (0.0%) | 6 (21.4%) |
| Total | 149 (11.9%) | 159 (13.3%) |
Income Above Poverty by Sex and Age in Lexington
According to the poverty statistics in Lexington, males aged under 5 years and females aged 5 years are the age groups that are most secure financially, with 100.0% of males and 100.0% of females in these age groups living above the poverty line.
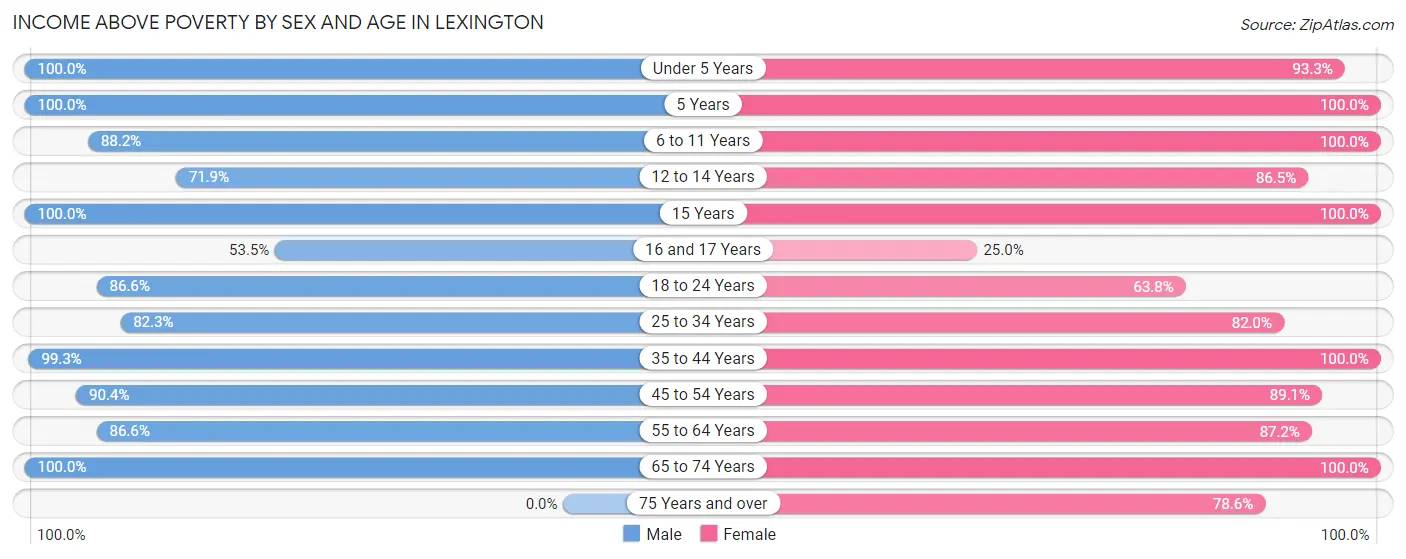
| Age Bracket | Male | Female |
| Under 5 Years | 11 (100.0%) | 98 (93.3%) |
| 5 Years | 43 (100.0%) | 36 (100.0%) |
| 6 to 11 Years | 45 (88.2%) | 84 (100.0%) |
| 12 to 14 Years | 41 (71.9%) | 45 (86.5%) |
| 15 Years | 19 (100.0%) | 6 (100.0%) |
| 16 and 17 Years | 23 (53.5%) | 4 (25.0%) |
| 18 to 24 Years | 149 (86.6%) | 104 (63.8%) |
| 25 to 34 Years | 139 (82.3%) | 105 (82.0%) |
| 35 to 44 Years | 137 (99.3%) | 162 (100.0%) |
| 45 to 54 Years | 170 (90.4%) | 139 (89.1%) |
| 55 to 64 Years | 227 (86.6%) | 191 (87.2%) |
| 65 to 74 Years | 102 (100.0%) | 38 (100.0%) |
| 75 Years and over | 0 (0.0%) | 22 (78.6%) |
| Total | 1,106 (88.1%) | 1,034 (86.7%) |
Income Below Poverty Among Married-Couple Families in Lexington
The poverty statistics for married-couple families in Lexington show that 3.8% or 16 of the total 421 families live below the poverty line. Families with 1 or 2 children have the highest poverty rate of 4.5%, comprising of 4 families. On the other hand, families with 3 or 4 children have the lowest poverty rate of 0.0%, which includes 0 families.
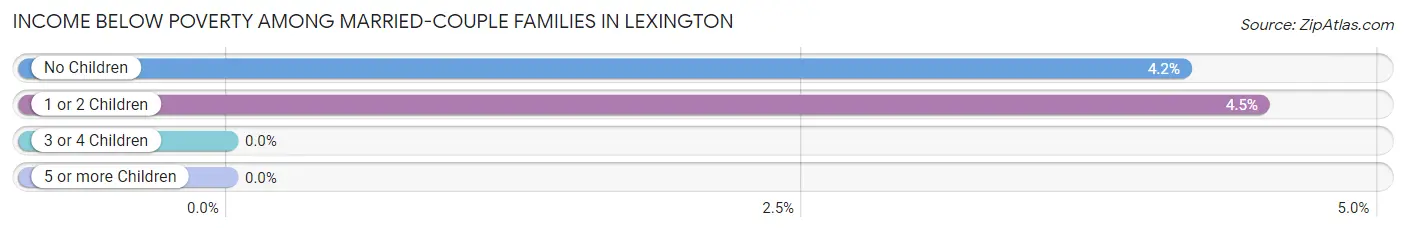
| Children | Above Poverty | Below Poverty |
| No Children | 277 (95.9%) | 12 (4.2%) |
| 1 or 2 Children | 85 (95.5%) | 4 (4.5%) |
| 3 or 4 Children | 40 (100.0%) | 0 (0.0%) |
| 5 or more Children | 3 (100.0%) | 0 (0.0%) |
| Total | 405 (96.2%) | 16 (3.8%) |
Income Below Poverty Among Single-Parent Households in Lexington
According to the poverty data in Lexington, 11.7% or 14 single-father households and 26.0% or 38 single-mother households are living below the poverty line. Among single-father households, those with 3 or 4 children have the highest poverty rate, with 8 households (100.0%) experiencing poverty. Likewise, among single-mother households, those with no children have the highest poverty rate, with 16 households (34.0%) falling below the poverty line.
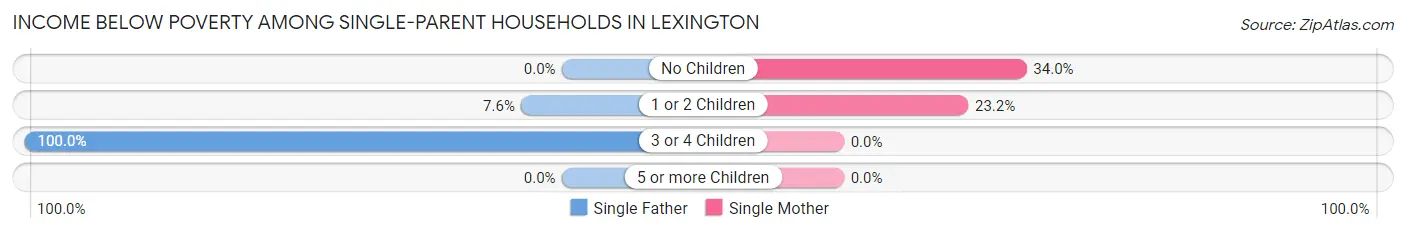
| Children | Single Father | Single Mother |
| No Children | 0 (0.0%) | 16 (34.0%) |
| 1 or 2 Children | 6 (7.6%) | 22 (23.2%) |
| 3 or 4 Children | 8 (100.0%) | 0 (0.0%) |
| 5 or more Children | 0 (0.0%) | 0 (0.0%) |
| Total | 14 (11.7%) | 38 (26.0%) |
Income Below Poverty Among Married-Couple vs Single-Parent Households in Lexington
The poverty data for Lexington shows that 16 of the married-couple family households (3.8%) and 52 of the single-parent households (19.6%) are living below the poverty level. Within the married-couple family households, those with 1 or 2 children have the highest poverty rate, with 4 households (4.5%) falling below the poverty line. Among the single-parent households, those with 3 or 4 children have the highest poverty rate, with 8 household (66.7%) living below poverty.
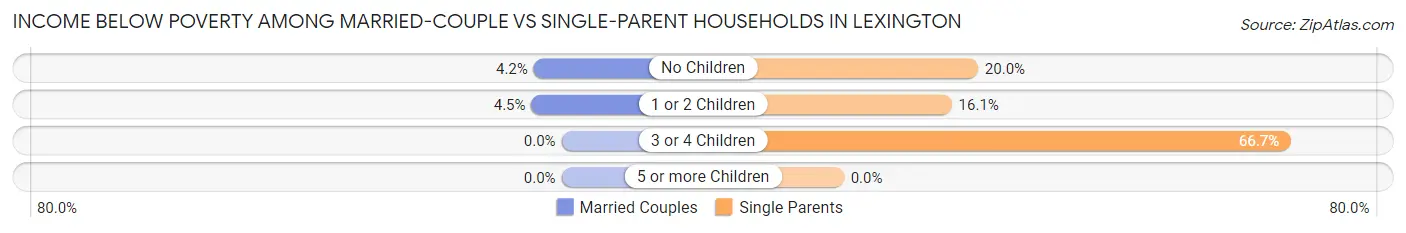
| Children | Married-Couple Families | Single-Parent Households |
| No Children | 12 (4.2%) | 16 (20.0%) |
| 1 or 2 Children | 4 (4.5%) | 28 (16.1%) |
| 3 or 4 Children | 0 (0.0%) | 8 (66.7%) |
| 5 or more Children | 0 (0.0%) | 0 (0.0%) |
| Total | 16 (3.8%) | 52 (19.6%) |
Race in Lexington
The most populous races in Lexington are White / Caucasian (1,907 | 77.9%), Black / African American (246 | 10.1%), and Two or more Races (134 | 5.5%).
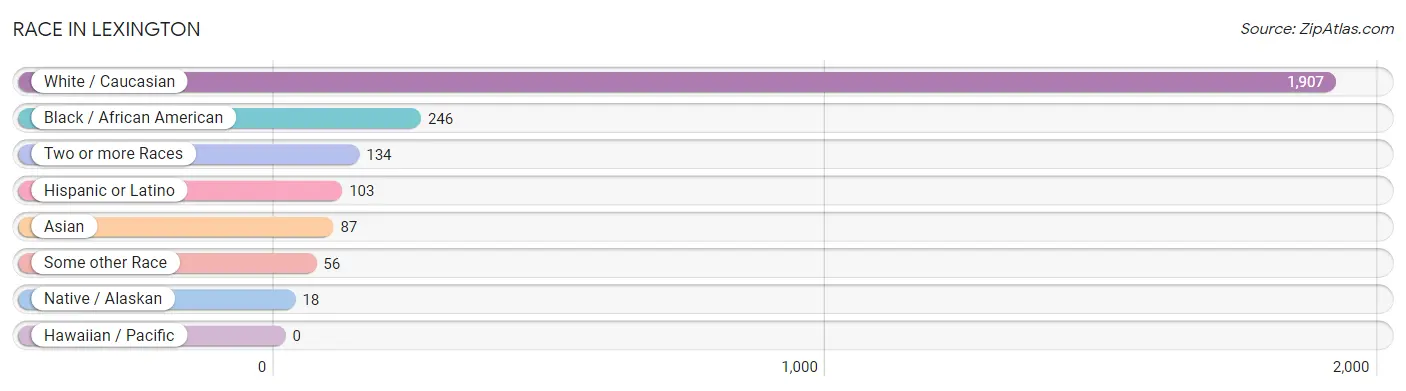
| Race | # Population | % Population |
| Asian | 87 | 3.5% |
| Black / African American | 246 | 10.1% |
| Hawaiian / Pacific | 0 | 0.0% |
| Hispanic or Latino | 103 | 4.2% |
| Native / Alaskan | 18 | 0.7% |
| White / Caucasian | 1,907 | 77.9% |
| Two or more Races | 134 | 5.5% |
| Some other Race | 56 | 2.3% |
| Total | 2,448 | 100.0% |
Ancestry in Lexington
The most populous ancestries reported in Lexington are German (770 | 31.5%), Norwegian (357 | 14.6%), Irish (266 | 10.9%), Swedish (191 | 7.8%), and Subsaharan African (161 | 6.6%), together accounting for 71.3% of all Lexington residents.
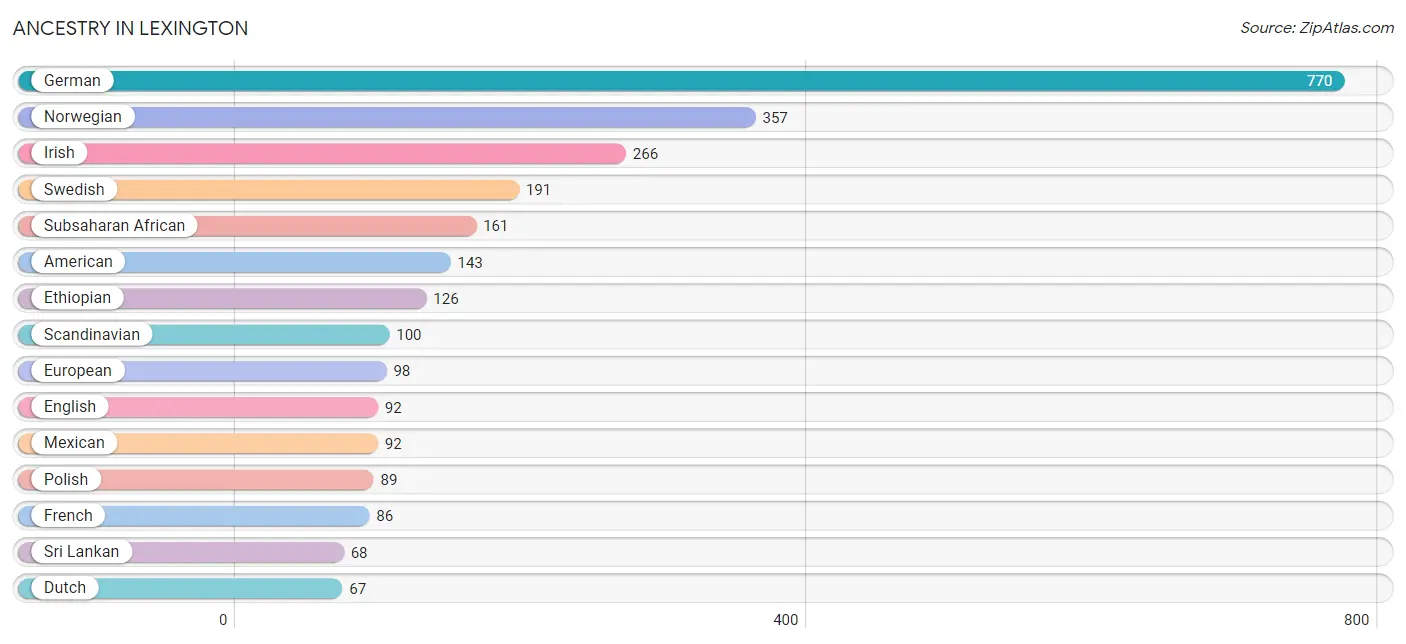
| Ancestry | # Population | % Population |
| African | 19 | 0.8% |
| American | 143 | 5.8% |
| Arab | 21 | 0.9% |
| Australian | 6 | 0.3% |
| Canadian | 6 | 0.3% |
| Central American | 11 | 0.4% |
| Central American Indian | 11 | 0.4% |
| Cherokee | 29 | 1.2% |
| Chippewa | 1 | 0.0% |
| Czech | 16 | 0.6% |
| Czechoslovakian | 7 | 0.3% |
| Danish | 37 | 1.5% |
| Dutch | 67 | 2.7% |
| English | 92 | 3.8% |
| Ethiopian | 126 | 5.1% |
| European | 98 | 4.0% |
| Finnish | 18 | 0.7% |
| French | 86 | 3.5% |
| French Canadian | 53 | 2.2% |
| German | 770 | 31.5% |
| Hungarian | 6 | 0.3% |
| Indian (Asian) | 4 | 0.2% |
| Irish | 266 | 10.9% |
| Italian | 53 | 2.2% |
| Jordanian | 12 | 0.5% |
| Kenyan | 16 | 0.6% |
| Korean | 1 | 0.0% |
| Laotian | 10 | 0.4% |
| Lebanese | 9 | 0.4% |
| Mexican | 92 | 3.8% |
| Mexican American Indian | 6 | 0.3% |
| Norwegian | 357 | 14.6% |
| Panamanian | 11 | 0.4% |
| Polish | 89 | 3.6% |
| Russian | 9 | 0.4% |
| Scandinavian | 100 | 4.1% |
| Scotch-Irish | 50 | 2.0% |
| Scottish | 20 | 0.8% |
| Serbian | 4 | 0.2% |
| Sri Lankan | 68 | 2.8% |
| Subsaharan African | 161 | 6.6% |
| Swedish | 191 | 7.8% |
| Swiss | 7 | 0.3% |
| Thai | 5 | 0.2% |
| Ukrainian | 6 | 0.3% |
| Welsh | 5 | 0.2% | View All 46 Rows |
Immigrants in Lexington
The most numerous immigrant groups reported in Lexington came from Africa (114 | 4.7%), Eastern Africa (114 | 4.7%), Asia (62 | 2.5%), Kenya (62 | 2.5%), and Ethiopia (52 | 2.1%), together accounting for 16.5% of all Lexington residents.
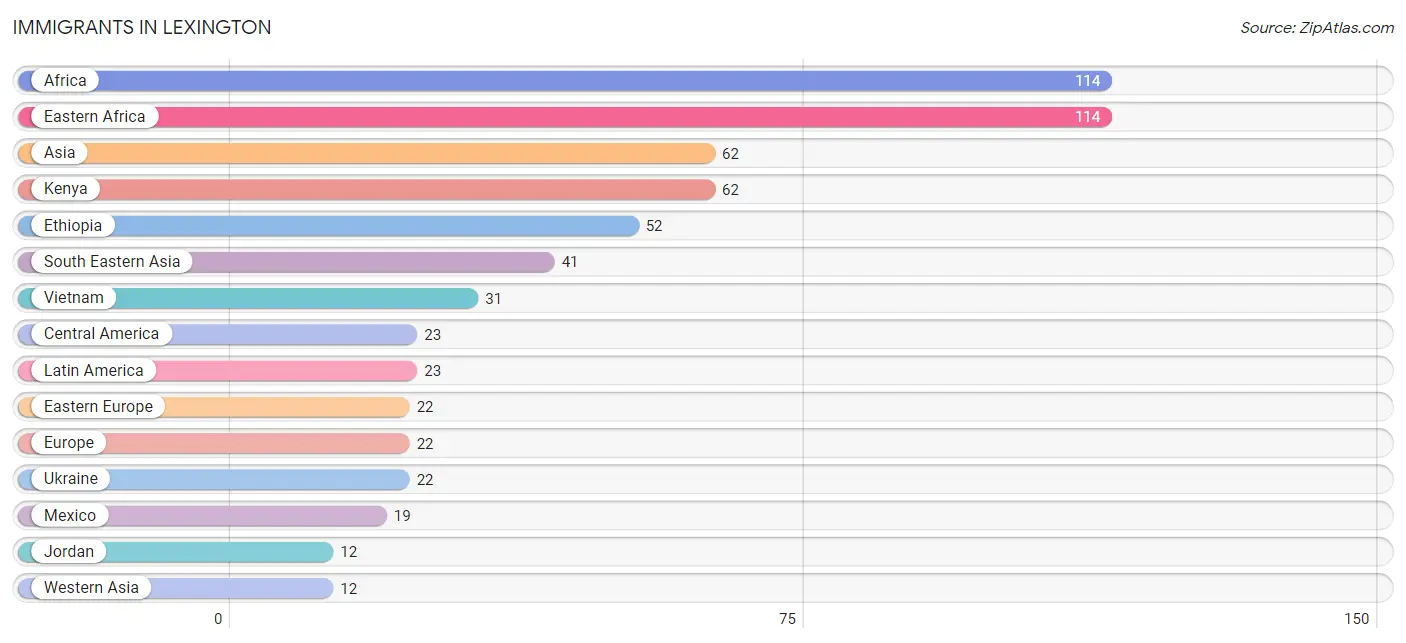
| Immigration Origin | # Population | % Population |
| Africa | 114 | 4.7% |
| Asia | 62 | 2.5% |
| Australia | 6 | 0.3% |
| Canada | 6 | 0.3% |
| Central America | 23 | 0.9% |
| China | 4 | 0.2% |
| Eastern Africa | 114 | 4.7% |
| Eastern Asia | 4 | 0.2% |
| Eastern Europe | 22 | 0.9% |
| Ethiopia | 52 | 2.1% |
| Europe | 22 | 0.9% |
| India | 5 | 0.2% |
| Jordan | 12 | 0.5% |
| Kenya | 62 | 2.5% |
| Latin America | 23 | 0.9% |
| Mexico | 19 | 0.8% |
| Oceania | 6 | 0.3% |
| Panama | 4 | 0.2% |
| Singapore | 10 | 0.4% |
| South Central Asia | 5 | 0.2% |
| South Eastern Asia | 41 | 1.7% |
| Ukraine | 22 | 0.9% |
| Vietnam | 31 | 1.3% |
| Western Asia | 12 | 0.5% | View All 24 Rows |
Sex and Age in Lexington
Sex and Age in Lexington
The most populous age groups in Lexington are 55 to 59 Years (156 | 12.4%) for men and 20 to 24 Years (159 | 13.3%) for women.
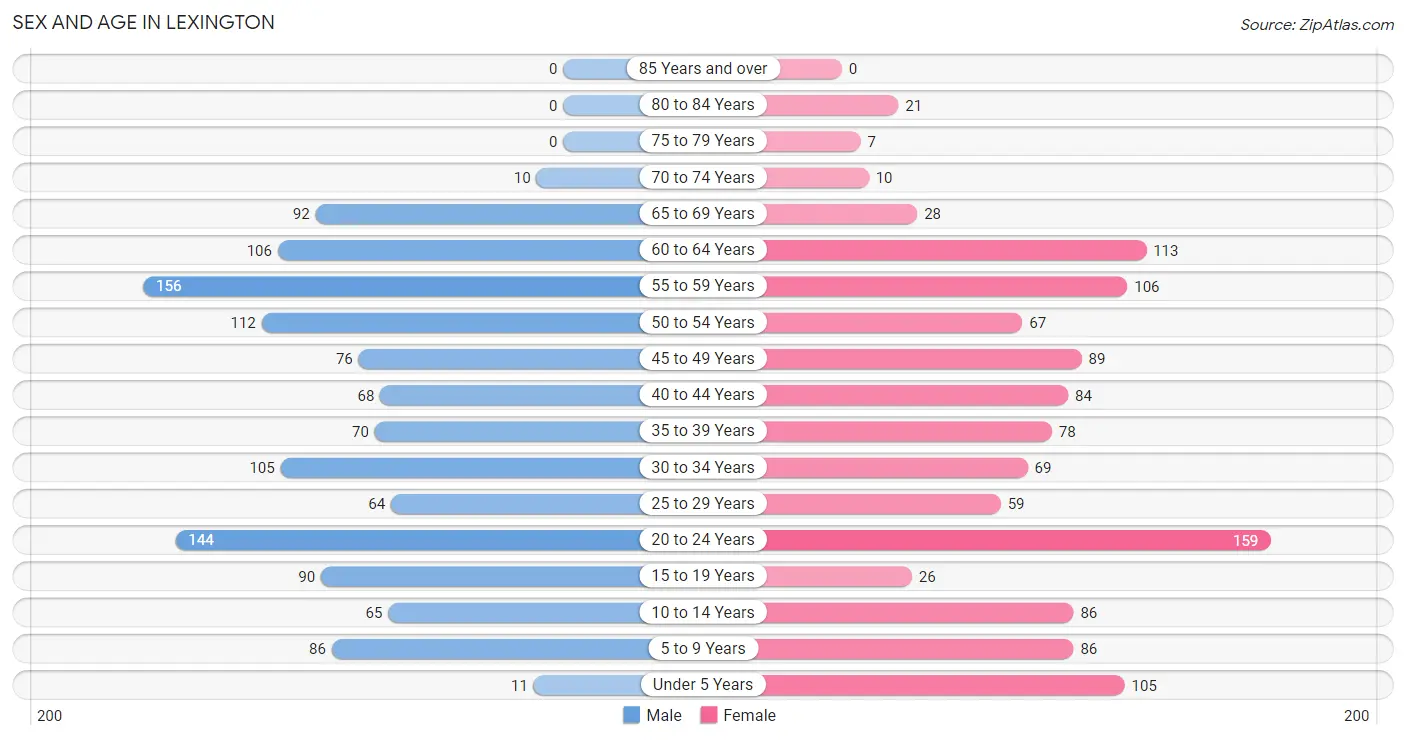
| Age Bracket | Male | Female |
| Under 5 Years | 11 (0.9%) | 105 (8.8%) |
| 5 to 9 Years | 86 (6.9%) | 86 (7.2%) |
| 10 to 14 Years | 65 (5.2%) | 86 (7.2%) |
| 15 to 19 Years | 90 (7.2%) | 26 (2.2%) |
| 20 to 24 Years | 144 (11.5%) | 159 (13.3%) |
| 25 to 29 Years | 64 (5.1%) | 59 (5.0%) |
| 30 to 34 Years | 105 (8.4%) | 69 (5.8%) |
| 35 to 39 Years | 70 (5.6%) | 78 (6.5%) |
| 40 to 44 Years | 68 (5.4%) | 84 (7.0%) |
| 45 to 49 Years | 76 (6.1%) | 89 (7.5%) |
| 50 to 54 Years | 112 (8.9%) | 67 (5.6%) |
| 55 to 59 Years | 156 (12.4%) | 106 (8.9%) |
| 60 to 64 Years | 106 (8.5%) | 113 (9.5%) |
| 65 to 69 Years | 92 (7.3%) | 28 (2.4%) |
| 70 to 74 Years | 10 (0.8%) | 10 (0.8%) |
| 75 to 79 Years | 0 (0.0%) | 7 (0.6%) |
| 80 to 84 Years | 0 (0.0%) | 21 (1.8%) |
| 85 Years and over | 0 (0.0%) | 0 (0.0%) |
| Total | 1,255 (100.0%) | 1,193 (100.0%) |
Families and Households in Lexington
Median Family Size in Lexington
The median family size in Lexington is 2.83 persons per family, with married-couple families (421 | 61.3%) accounting for the largest median family size of 2.97 persons per family. On the other hand, single male/father families (120 | 17.5%) represent the smallest median family size with 2.38 persons per family.
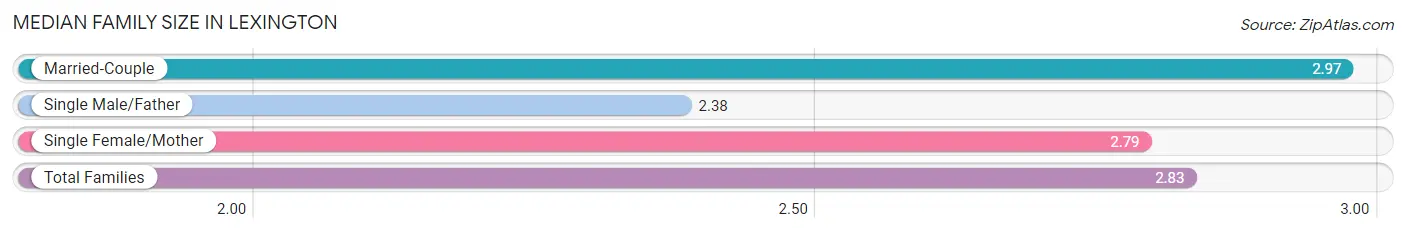
| Family Type | # Families | Family Size |
| Married-Couple | 421 (61.3%) | 2.97 |
| Single Male/Father | 120 (17.5%) | 2.38 |
| Single Female/Mother | 146 (21.2%) | 2.79 |
| Total Families | 687 (100.0%) | 2.83 |
Median Household Size in Lexington
The median household size in Lexington is 2.46 persons per household, with single female/mother households (146 | 14.7%) accounting for the largest median household size of 3.14 persons per household. non-family households (307 | 30.9%) represent the smallest median household size with 1.24 persons per household.
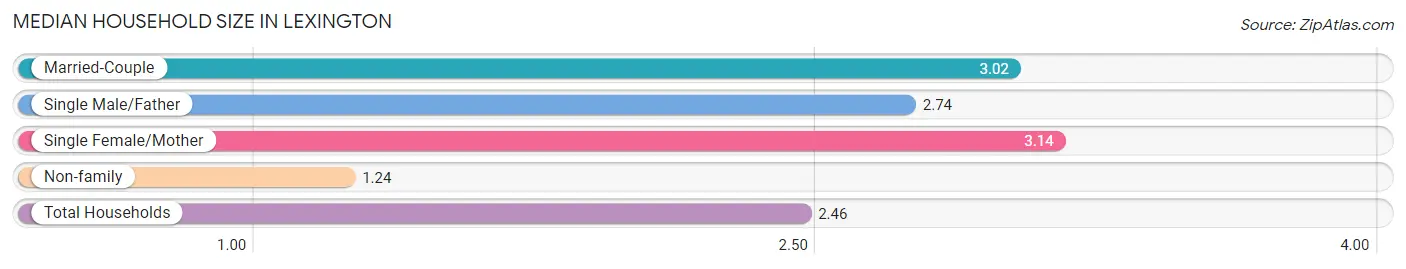
| Household Type | # Households | Household Size |
| Married-Couple | 421 (42.3%) | 3.02 |
| Single Male/Father | 120 (12.1%) | 2.74 |
| Single Female/Mother | 146 (14.7%) | 3.14 |
| Non-family | 307 (30.9%) | 1.24 |
| Total Households | 994 (100.0%) | 2.46 |
Household Size by Marriage Status in Lexington
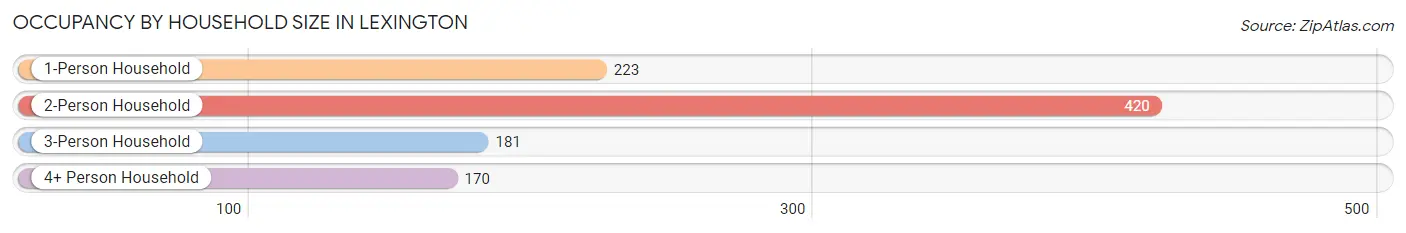
Out of a total of 994 households in Lexington, 687 (69.1%) are family households, while 307 (30.9%) are nonfamily households. The most numerous type of family households are 2-person households, comprising 336, and the most common type of nonfamily households are 1-person households, comprising 223.
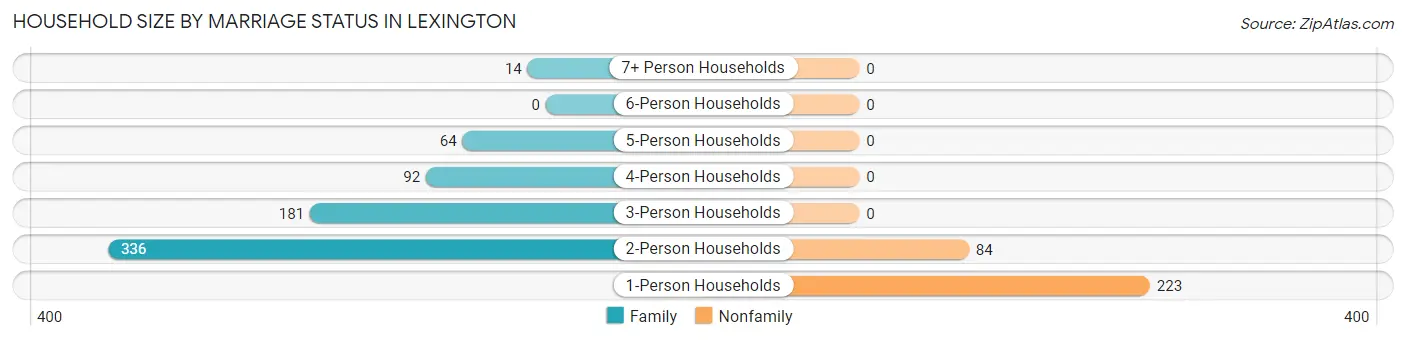
| Household Size | Family Households | Nonfamily Households |
| 1-Person Households | - | 223 (22.4%) |
| 2-Person Households | 336 (33.8%) | 84 (8.5%) |
| 3-Person Households | 181 (18.2%) | 0 (0.0%) |
| 4-Person Households | 92 (9.3%) | 0 (0.0%) |
| 5-Person Households | 64 (6.4%) | 0 (0.0%) |
| 6-Person Households | 0 (0.0%) | 0 (0.0%) |
| 7+ Person Households | 14 (1.4%) | 0 (0.0%) |
| Total | 687 (69.1%) | 307 (30.9%) |
Female Fertility in Lexington
Fertility by Age in Lexington
Average fertility rate in Lexington is 12.0 births per 1,000 women. Women in the age bracket of 20 to 34 years have the highest fertility rate with 24.0 births per 1,000 women. Women in the age bracket of 20 to 34 years acount for 100.0% of all women with births.
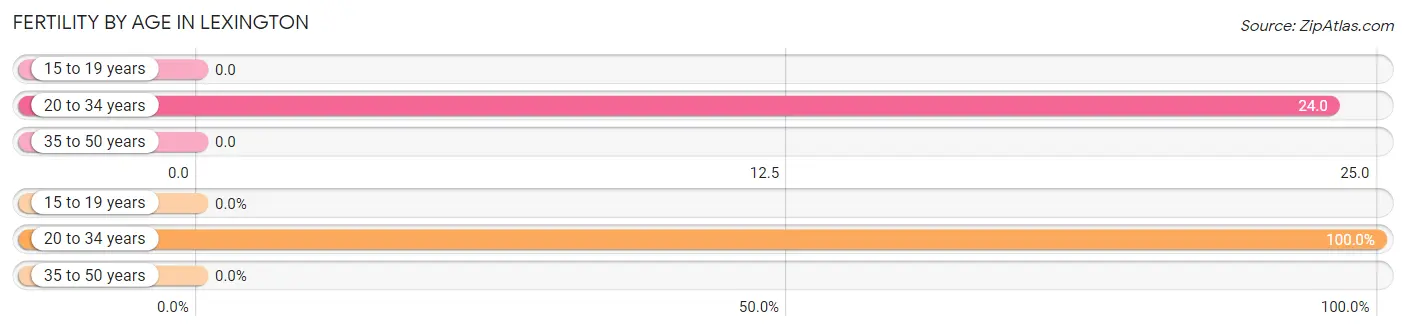
| Age Bracket | Women with Births | Births / 1,000 Women |
| 15 to 19 years | 0 (0.0%) | 0.0 |
| 20 to 34 years | 7 (100.0%) | 24.0 |
| 35 to 50 years | 0 (0.0%) | 0.0 |
| Total | 7 (100.0%) | 12.0 |
Fertility by Age by Marriage Status in Lexington
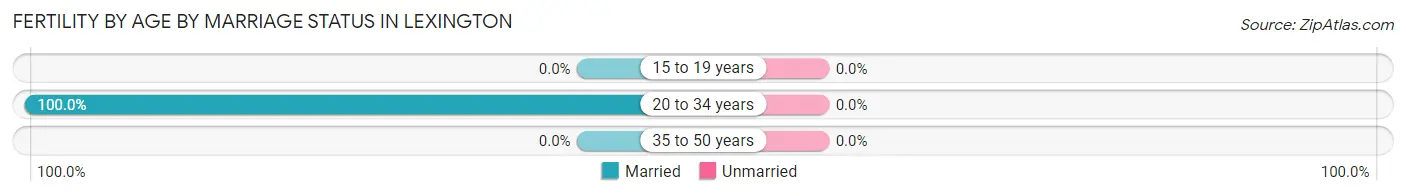
| Age Bracket | Married | Unmarried |
| 15 to 19 years | 0 (0.0%) | 0 (0.0%) |
| 20 to 34 years | 7 (100.0%) | 0 (0.0%) |
| 35 to 50 years | 0 (0.0%) | 0 (0.0%) |
| Total | 7 (100.0%) | 0 (0.0%) |
Fertility by Education in Lexington
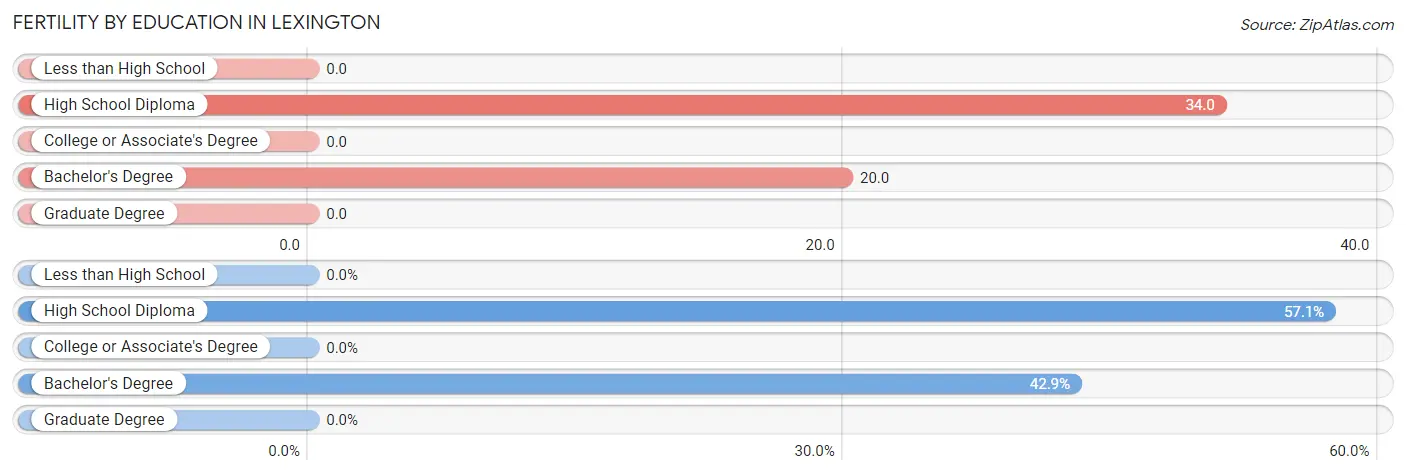
| Educational Attainment | Women with Births | Births / 1,000 Women |
| Less than High School | 0 (0.0%) | 0.0 |
| High School Diploma | 4 (57.1%) | 34.0 |
| College or Associate's Degree | 0 (0.0%) | 0.0 |
| Bachelor's Degree | 3 (42.9%) | 20.0 |
| Graduate Degree | 0 (0.0%) | 0.0 |
| Total | 7 (100.0%) | 12.0 |
Fertility by Education by Marriage Status in Lexington
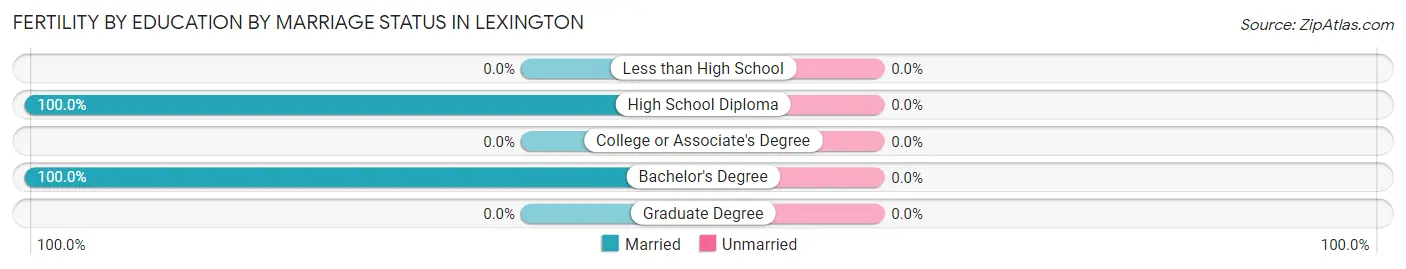
| Educational Attainment | Married | Unmarried |
| Less than High School | 0 (0.0%) | 0 (0.0%) |
| High School Diploma | 4 (100.0%) | 0 (0.0%) |
| College or Associate's Degree | 0 (0.0%) | 0 (0.0%) |
| Bachelor's Degree | 3 (100.0%) | 0 (0.0%) |
| Graduate Degree | 0 (0.0%) | 0 (0.0%) |
| Total | 7 (100.0%) | 0 (0.0%) |
Employment Characteristics in Lexington
Employment by Class of Employer in Lexington
Among the 1,411 employed individuals in Lexington, private company employees (1,026 | 72.7%), not-for-profit organizations (118 | 8.4%), and self-employed (not incorporated) (104 | 7.4%) make up the most common classes of employment.
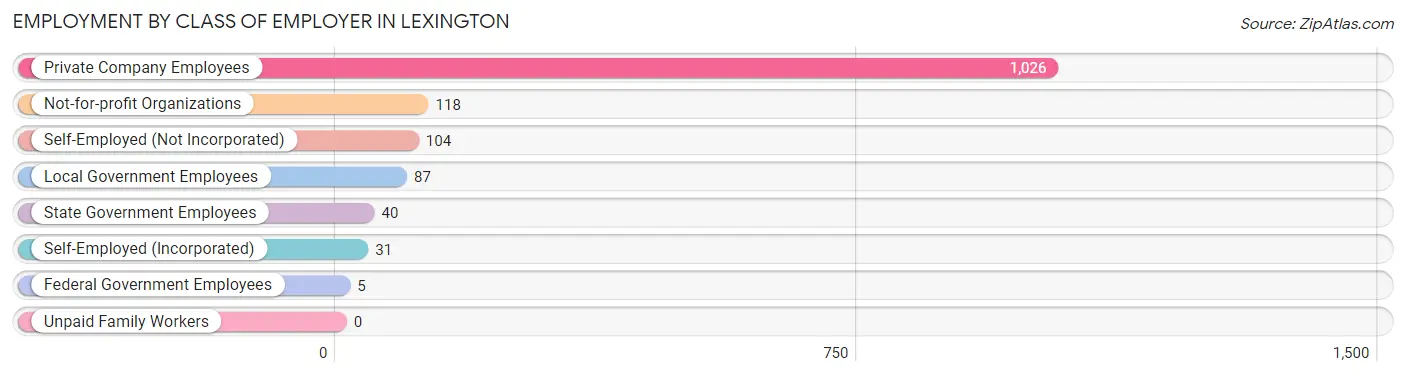
| Employer Class | # Employees | % Employees |
| Private Company Employees | 1,026 | 72.7% |
| Self-Employed (Incorporated) | 31 | 2.2% |
| Self-Employed (Not Incorporated) | 104 | 7.4% |
| Not-for-profit Organizations | 118 | 8.4% |
| Local Government Employees | 87 | 6.2% |
| State Government Employees | 40 | 2.8% |
| Federal Government Employees | 5 | 0.4% |
| Unpaid Family Workers | 0 | 0.0% |
| Total | 1,411 | 100.0% |
Employment Status by Age in Lexington
According to the labor force statistics for Lexington, out of the total population over 16 years of age (1,984), 77.6% or 1,540 individuals are in the labor force, with 5.7% or 88 of them unemployed. The age group with the highest labor force participation rate is 45 to 54 years, with 96.2% or 331 individuals in the labor force. Within the labor force, the 16 to 19 years age range has the highest percentage of unemployed individuals, with 25.8% or 16 of them being unemployed.
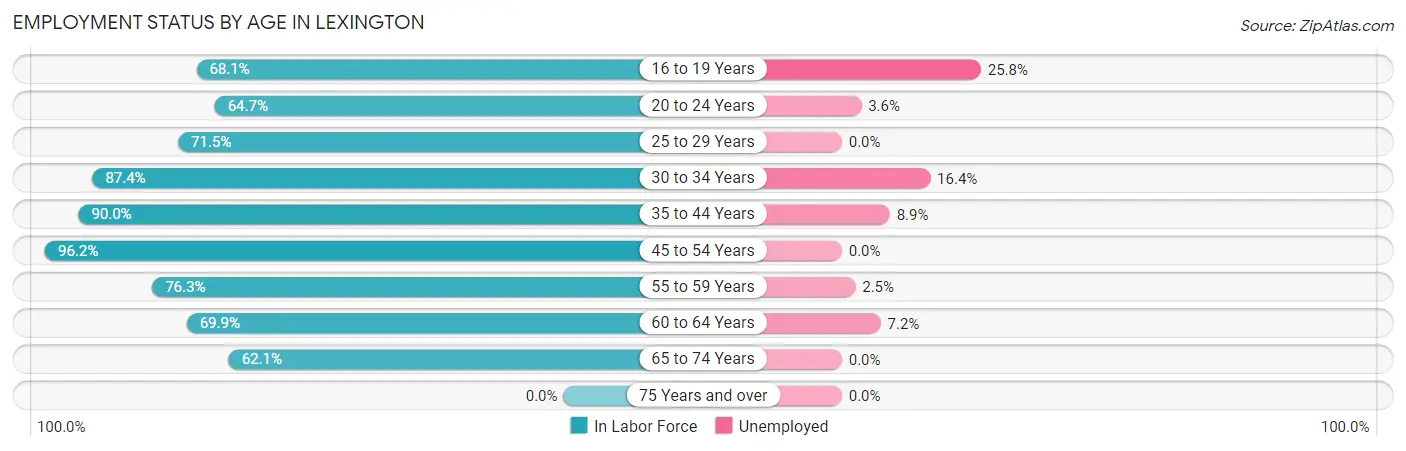
| Age Bracket | In Labor Force | Unemployed |
| 16 to 19 Years | 62 (68.1%) | 16 (25.8%) |
| 20 to 24 Years | 196 (64.7%) | 7 (3.6%) |
| 25 to 29 Years | 88 (71.5%) | 0 (0.0%) |
| 30 to 34 Years | 152 (87.4%) | 25 (16.4%) |
| 35 to 44 Years | 270 (90.0%) | 24 (8.9%) |
| 45 to 54 Years | 331 (96.2%) | 0 (0.0%) |
| 55 to 59 Years | 200 (76.3%) | 5 (2.5%) |
| 60 to 64 Years | 153 (69.9%) | 11 (7.2%) |
| 65 to 74 Years | 87 (62.1%) | 0 (0.0%) |
| 75 Years and over | 0 (0.0%) | 0 (0.0%) |
| Total | 1,540 (77.6%) | 88 (5.7%) |
Employment Status by Educational Attainment in Lexington
According to labor force statistics for Lexington, 84.0% of individuals (1,194) out of the total population between 25 and 64 years of age (1,422) are in the labor force, with 5.4% or 64 of them being unemployed. The group with the highest labor force participation rate are those with the educational attainment of college / associate degree, with 91.0% or 466 individuals in the labor force. Within the labor force, individuals with less than high school education have the highest percentage of unemployment, with 17.8% or 38 of them being unemployed.
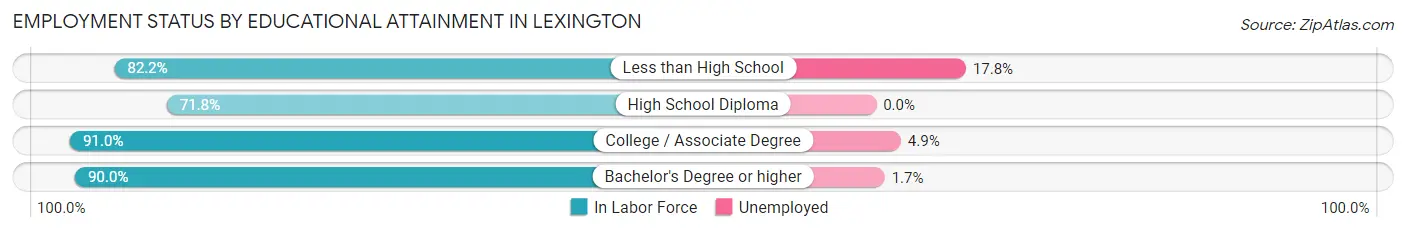
| Educational Attainment | In Labor Force | Unemployed |
| Less than High School | 213 (82.2%) | 46 (17.8%) |
| High School Diploma | 280 (71.8%) | 0 (0.0%) |
| College / Associate Degree | 466 (91.0%) | 25 (4.9%) |
| Bachelor's Degree or higher | 235 (90.0%) | 4 (1.7%) |
| Total | 1,194 (84.0%) | 77 (5.4%) |
Employment Occupations by Sex in Lexington
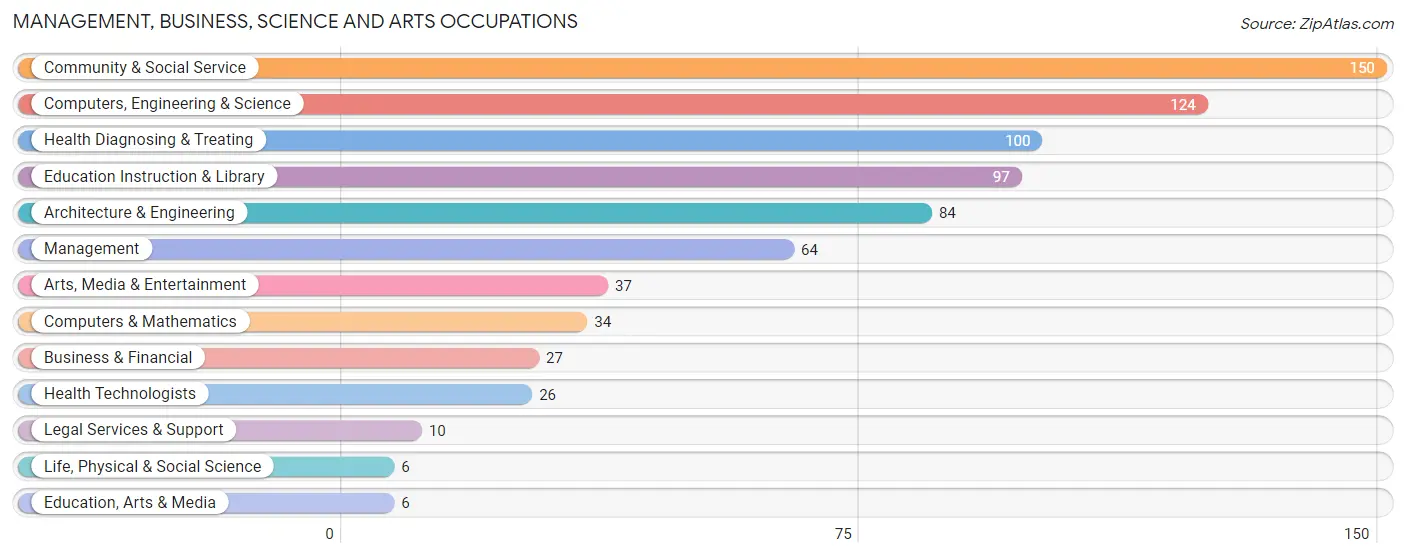
Management, Business, Science and Arts Occupations
The most common Management, Business, Science and Arts occupations in Lexington are Community & Social Service (150 | 10.3%), Computers, Engineering & Science (124 | 8.6%), Health Diagnosing & Treating (100 | 6.9%), Education Instruction & Library (97 | 6.7%), and Architecture & Engineering (84 | 5.8%).
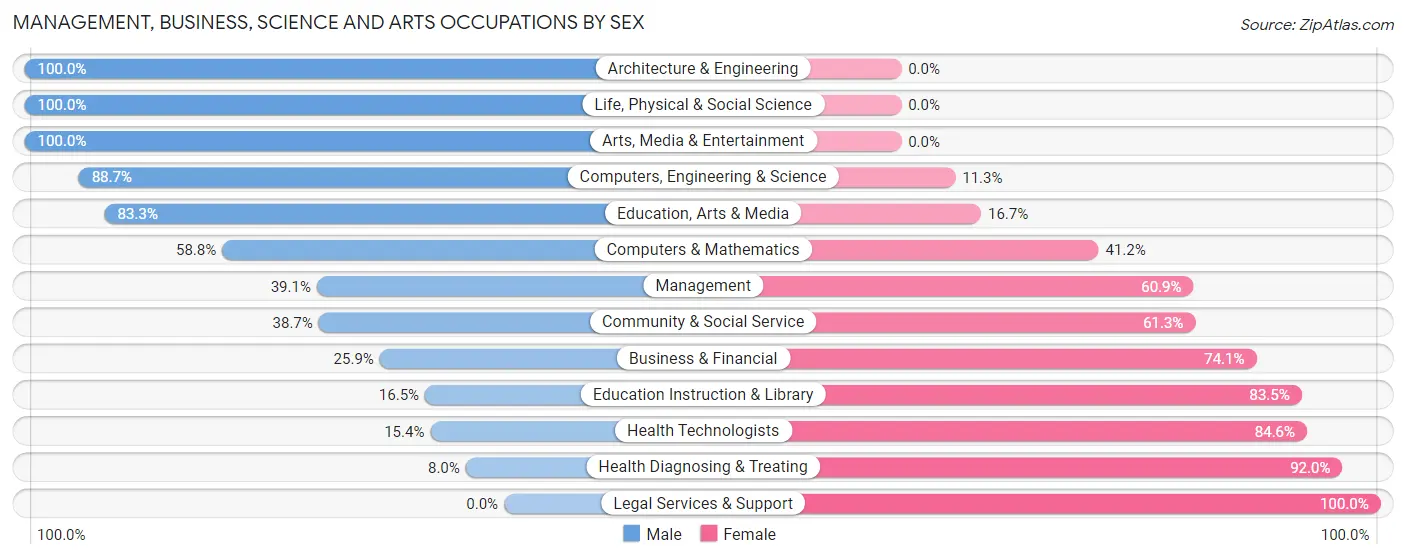
Management, Business, Science and Arts Occupations by Sex
Within the Management, Business, Science and Arts occupations in Lexington, the most male-oriented occupations are Architecture & Engineering (100.0%), Life, Physical & Social Science (100.0%), and Arts, Media & Entertainment (100.0%), while the most female-oriented occupations are Legal Services & Support (100.0%), Health Diagnosing & Treating (92.0%), and Health Technologists (84.6%).
| Occupation | Male | Female |
| Management | 25 (39.1%) | 39 (60.9%) |
| Business & Financial | 7 (25.9%) | 20 (74.1%) |
| Computers, Engineering & Science | 110 (88.7%) | 14 (11.3%) |
| Computers & Mathematics | 20 (58.8%) | 14 (41.2%) |
| Architecture & Engineering | 84 (100.0%) | 0 (0.0%) |
| Life, Physical & Social Science | 6 (100.0%) | 0 (0.0%) |
| Community & Social Service | 58 (38.7%) | 92 (61.3%) |
| Education, Arts & Media | 5 (83.3%) | 1 (16.7%) |
| Legal Services & Support | 0 (0.0%) | 10 (100.0%) |
| Education Instruction & Library | 16 (16.5%) | 81 (83.5%) |
| Arts, Media & Entertainment | 37 (100.0%) | 0 (0.0%) |
| Health Diagnosing & Treating | 8 (8.0%) | 92 (92.0%) |
| Health Technologists | 4 (15.4%) | 22 (84.6%) |
| Total (Category) | 208 (44.7%) | 257 (55.3%) |
| Total (Overall) | 808 (55.7%) | 643 (44.3%) |
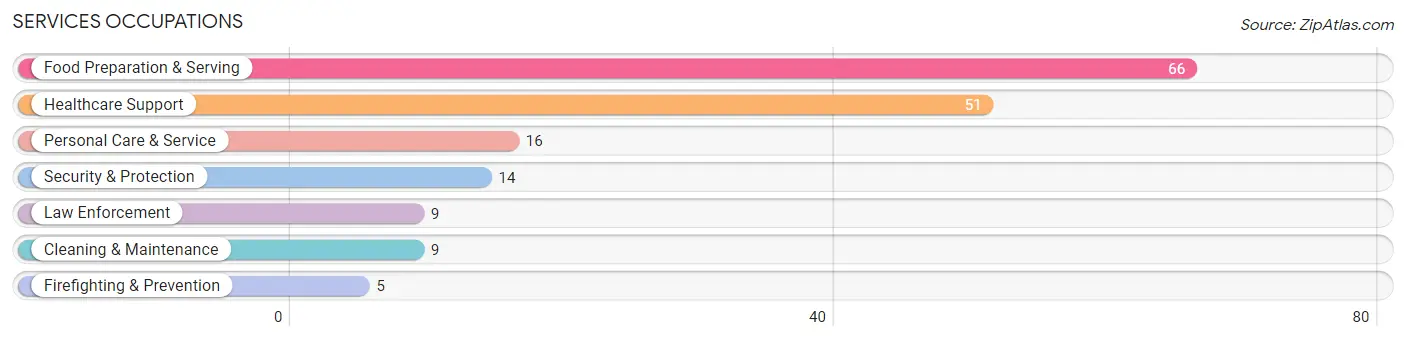
Services Occupations
The most common Services occupations in Lexington are Food Preparation & Serving (66 | 4.5%), Healthcare Support (51 | 3.5%), Personal Care & Service (16 | 1.1%), Security & Protection (14 | 1.0%), and Law Enforcement (9 | 0.6%).
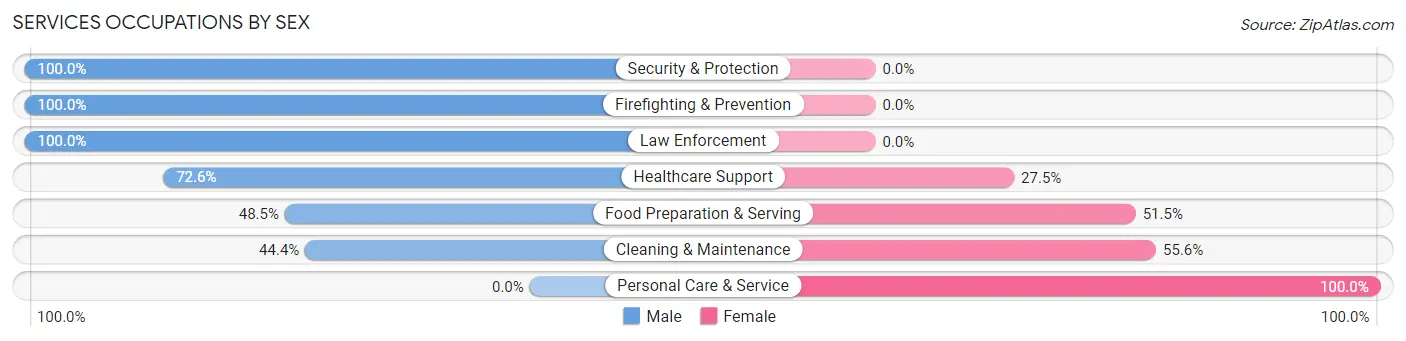
Services Occupations by Sex
Within the Services occupations in Lexington, the most male-oriented occupations are Security & Protection (100.0%), Firefighting & Prevention (100.0%), and Law Enforcement (100.0%), while the most female-oriented occupations are Personal Care & Service (100.0%), Cleaning & Maintenance (55.6%), and Food Preparation & Serving (51.5%).
| Occupation | Male | Female |
| Healthcare Support | 37 (72.6%) | 14 (27.5%) |
| Security & Protection | 14 (100.0%) | 0 (0.0%) |
| Firefighting & Prevention | 5 (100.0%) | 0 (0.0%) |
| Law Enforcement | 9 (100.0%) | 0 (0.0%) |
| Food Preparation & Serving | 32 (48.5%) | 34 (51.5%) |
| Cleaning & Maintenance | 4 (44.4%) | 5 (55.6%) |
| Personal Care & Service | 0 (0.0%) | 16 (100.0%) |
| Total (Category) | 87 (55.8%) | 69 (44.2%) |
| Total (Overall) | 808 (55.7%) | 643 (44.3%) |
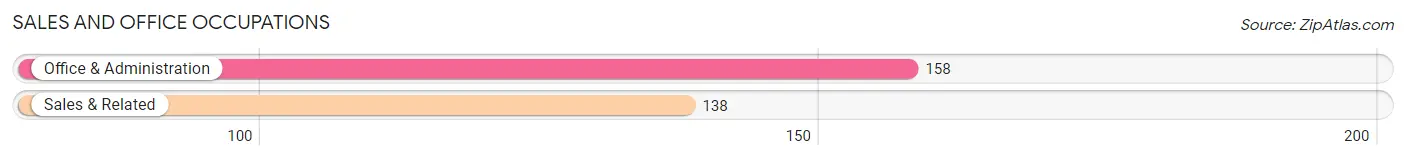
Sales and Office Occupations
The most common Sales and Office occupations in Lexington are Office & Administration (158 | 10.9%), and Sales & Related (138 | 9.5%).
Sales and Office Occupations by Sex
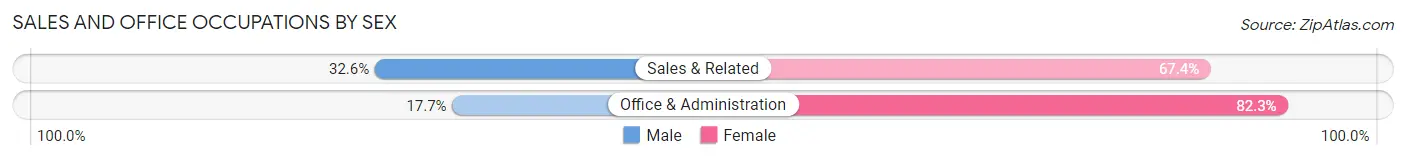
| Occupation | Male | Female |
| Sales & Related | 45 (32.6%) | 93 (67.4%) |
| Office & Administration | 28 (17.7%) | 130 (82.3%) |
| Total (Category) | 73 (24.7%) | 223 (75.3%) |
| Total (Overall) | 808 (55.7%) | 643 (44.3%) |
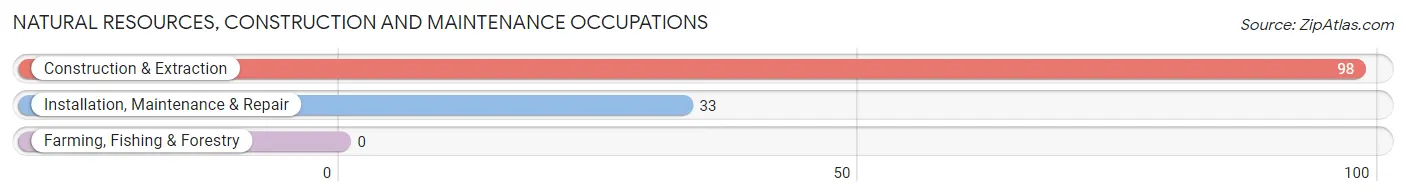
Natural Resources, Construction and Maintenance Occupations
The most common Natural Resources, Construction and Maintenance occupations in Lexington are Construction & Extraction (98 | 6.8%), and Installation, Maintenance & Repair (33 | 2.3%).
Natural Resources, Construction and Maintenance Occupations by Sex
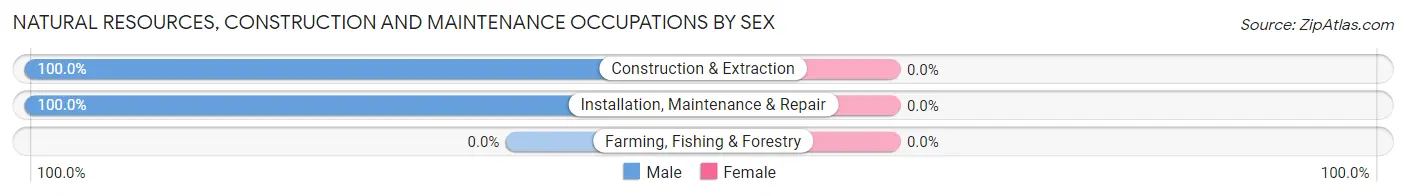
| Occupation | Male | Female |
| Farming, Fishing & Forestry | 0 (0.0%) | 0 (0.0%) |
| Construction & Extraction | 98 (100.0%) | 0 (0.0%) |
| Installation, Maintenance & Repair | 33 (100.0%) | 0 (0.0%) |
| Total (Category) | 131 (100.0%) | 0 (0.0%) |
| Total (Overall) | 808 (55.7%) | 643 (44.3%) |
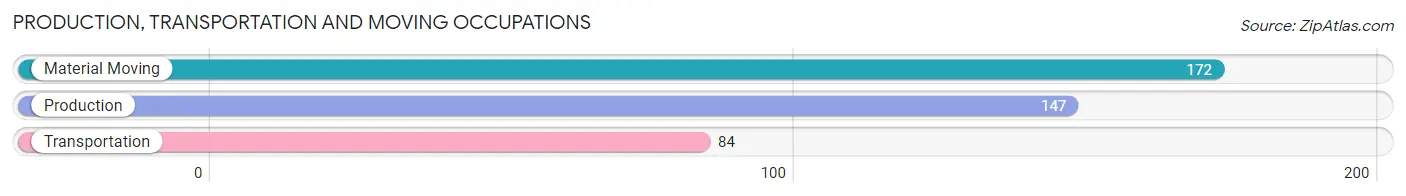
Production, Transportation and Moving Occupations
The most common Production, Transportation and Moving occupations in Lexington are Material Moving (172 | 11.8%), Production (147 | 10.1%), and Transportation (84 | 5.8%).
Production, Transportation and Moving Occupations by Sex
| Occupation | Male | Female |
| Production | 112 (76.2%) | 35 (23.8%) |
| Transportation | 70 (83.3%) | 14 (16.7%) |
| Material Moving | 127 (73.8%) | 45 (26.2%) |
| Total (Category) | 309 (76.7%) | 94 (23.3%) |
| Total (Overall) | 808 (55.7%) | 643 (44.3%) |
Employment Industries by Sex in Lexington
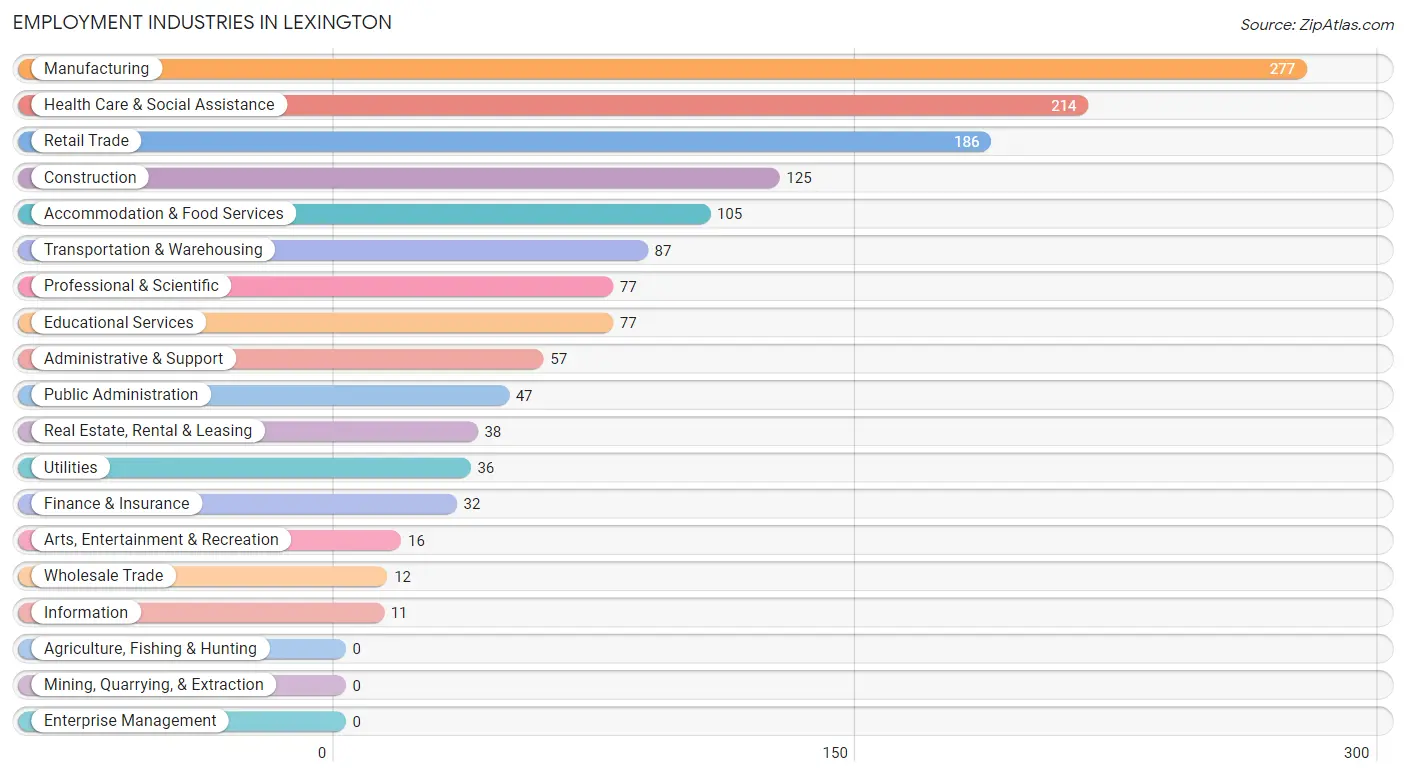
Employment Industries in Lexington
The major employment industries in Lexington include Manufacturing (277 | 19.1%), Health Care & Social Assistance (214 | 14.7%), Retail Trade (186 | 12.8%), Construction (125 | 8.6%), and Accommodation & Food Services (105 | 7.2%).
Employment Industries by Sex in Lexington
The Lexington industries that see more men than women are Construction (100.0%), Transportation & Warehousing (100.0%), and Utilities (100.0%), whereas the industries that tend to have a higher number of women are Real Estate, Rental & Leasing (100.0%), Arts, Entertainment & Recreation (100.0%), and Finance & Insurance (84.4%).
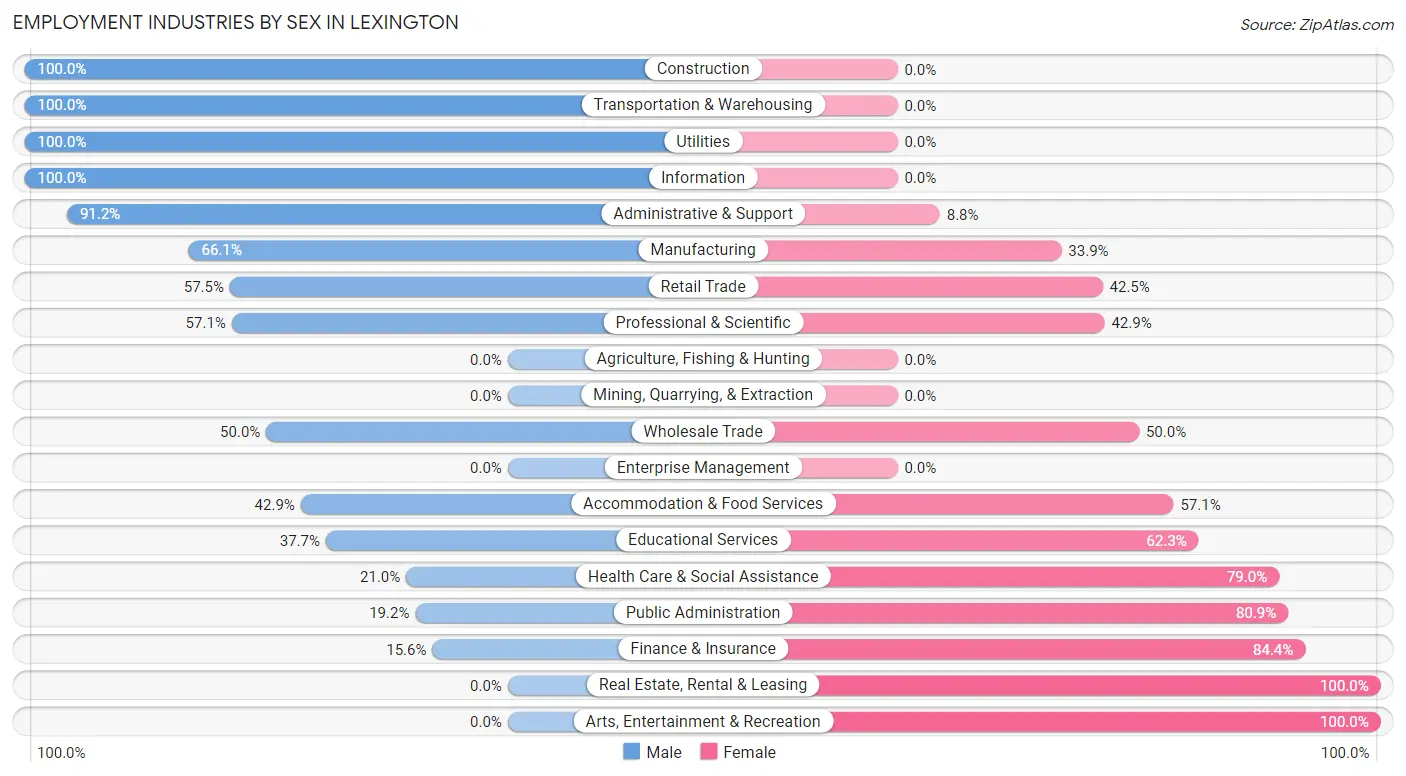
| Industry | Male | Female |
| Agriculture, Fishing & Hunting | 0 (0.0%) | 0 (0.0%) |
| Mining, Quarrying, & Extraction | 0 (0.0%) | 0 (0.0%) |
| Construction | 125 (100.0%) | 0 (0.0%) |
| Manufacturing | 183 (66.1%) | 94 (33.9%) |
| Wholesale Trade | 6 (50.0%) | 6 (50.0%) |
| Retail Trade | 107 (57.5%) | 79 (42.5%) |
| Transportation & Warehousing | 87 (100.0%) | 0 (0.0%) |
| Utilities | 36 (100.0%) | 0 (0.0%) |
| Information | 11 (100.0%) | 0 (0.0%) |
| Finance & Insurance | 5 (15.6%) | 27 (84.4%) |
| Real Estate, Rental & Leasing | 0 (0.0%) | 38 (100.0%) |
| Professional & Scientific | 44 (57.1%) | 33 (42.9%) |
| Enterprise Management | 0 (0.0%) | 0 (0.0%) |
| Administrative & Support | 52 (91.2%) | 5 (8.8%) |
| Educational Services | 29 (37.7%) | 48 (62.3%) |
| Health Care & Social Assistance | 45 (21.0%) | 169 (79.0%) |
| Arts, Entertainment & Recreation | 0 (0.0%) | 16 (100.0%) |
| Accommodation & Food Services | 45 (42.9%) | 60 (57.1%) |
| Public Administration | 9 (19.2%) | 38 (80.8%) |
| Total | 808 (55.7%) | 643 (44.3%) |
Education in Lexington
School Enrollment in Lexington
The most common levels of schooling among the 510 students in Lexington are college / undergraduate (126 | 24.7%), middle school (110 | 21.6%), and high school (107 | 21.0%).
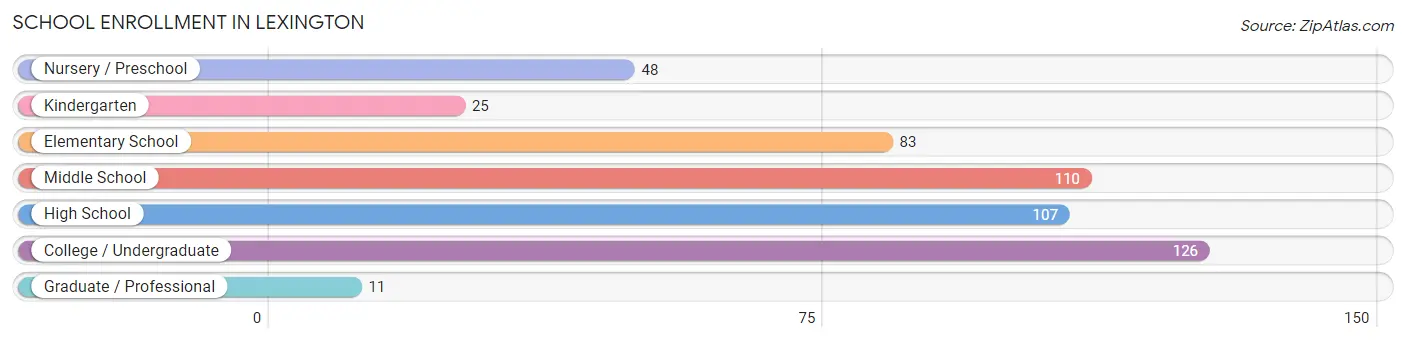
| School Level | # Students | % Students |
| Nursery / Preschool | 48 | 9.4% |
| Kindergarten | 25 | 4.9% |
| Elementary School | 83 | 16.3% |
| Middle School | 110 | 21.6% |
| High School | 107 | 21.0% |
| College / Undergraduate | 126 | 24.7% |
| Graduate / Professional | 11 | 2.2% |
| Total | 510 | 100.0% |
School Enrollment by Age by Funding Source in Lexington
Out of a total of 510 students who are enrolled in schools in Lexington, 72 (14.1%) attend a private institution, while the remaining 438 (85.9%) are enrolled in public schools. The age group of 18 to 19 year olds has the highest likelihood of being enrolled in private schools, with 7 (63.6% in the age bracket) enrolled. Conversely, the age group of 3 to 4 year olds has the lowest likelihood of being enrolled in a private school, with 5 (100.0% in the age bracket) attending a public institution.
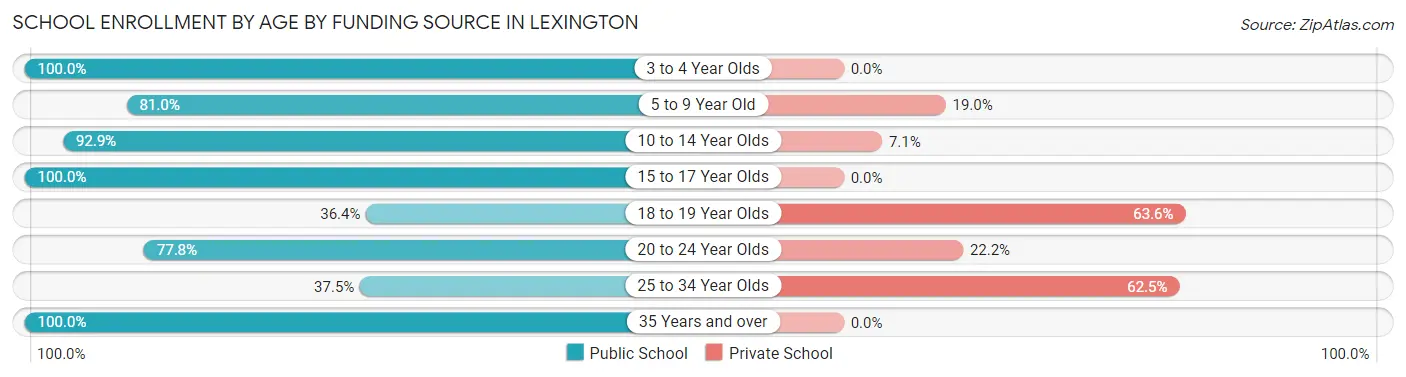
| Age Bracket | Public School | Private School |
| 3 to 4 Year Olds | 5 (100.0%) | 0 (0.0%) |
| 5 to 9 Year Old | 111 (81.0%) | 26 (19.0%) |
| 10 to 14 Year Olds | 130 (92.9%) | 10 (7.1%) |
| 15 to 17 Year Olds | 84 (100.0%) | 0 (0.0%) |
| 18 to 19 Year Olds | 4 (36.4%) | 7 (63.6%) |
| 20 to 24 Year Olds | 84 (77.8%) | 24 (22.2%) |
| 25 to 34 Year Olds | 3 (37.5%) | 5 (62.5%) |
| 35 Years and over | 17 (100.0%) | 0 (0.0%) |
| Total | 438 (85.9%) | 72 (14.1%) |
Educational Attainment by Field of Study in Lexington
Business (58 | 17.5%), education (57 | 17.2%), visual & performing arts (45 | 13.6%), social sciences (32 | 9.7%), and engineering (30 | 9.1%) are the most common fields of study among 331 individuals in Lexington who have obtained a bachelor's degree or higher.
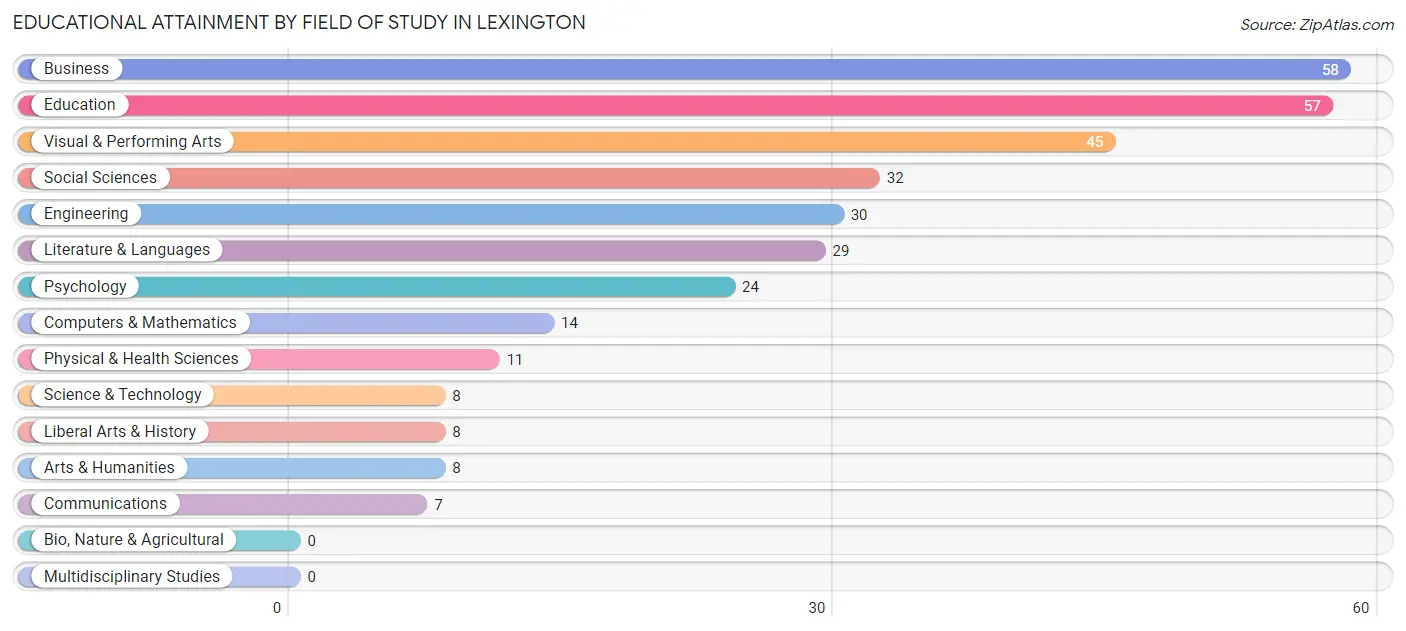
| Field of Study | # Graduates | % Graduates |
| Computers & Mathematics | 14 | 4.2% |
| Bio, Nature & Agricultural | 0 | 0.0% |
| Physical & Health Sciences | 11 | 3.3% |
| Psychology | 24 | 7.2% |
| Social Sciences | 32 | 9.7% |
| Engineering | 30 | 9.1% |
| Multidisciplinary Studies | 0 | 0.0% |
| Science & Technology | 8 | 2.4% |
| Business | 58 | 17.5% |
| Education | 57 | 17.2% |
| Literature & Languages | 29 | 8.8% |
| Liberal Arts & History | 8 | 2.4% |
| Visual & Performing Arts | 45 | 13.6% |
| Communications | 7 | 2.1% |
| Arts & Humanities | 8 | 2.4% |
| Total | 331 | 100.0% |
Transportation & Commute in Lexington
Vehicle Availability by Sex in Lexington
The most prevalent vehicle ownership categories in Lexington are males with 2 vehicles (335, accounting for 43.4%) and females with 2 vehicles (309, making up 52.6%).
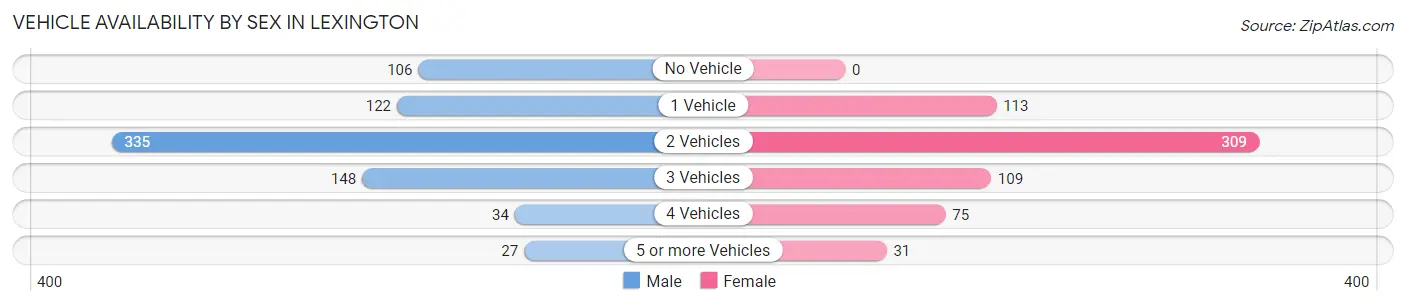
| Vehicles Available | Male | Female |
| No Vehicle | 106 (13.7%) | 0 (0.0%) |
| 1 Vehicle | 122 (15.8%) | 113 (17.7%) |
| 2 Vehicles | 335 (43.4%) | 309 (48.5%) |
| 3 Vehicles | 148 (19.2%) | 109 (17.1%) |
| 4 Vehicles | 34 (4.4%) | 75 (11.8%) |
| 5 or more Vehicles | 27 (3.5%) | 31 (4.9%) |
| Total | 772 (100.0%) | 637 (100.0%) |
Commute Time in Lexington
The most frequently occuring commute durations in Lexington are 10 to 14 minutes (280 commuters, 21.6%), 15 to 19 minutes (223 commuters, 17.2%), and 20 to 24 minutes (198 commuters, 15.2%).
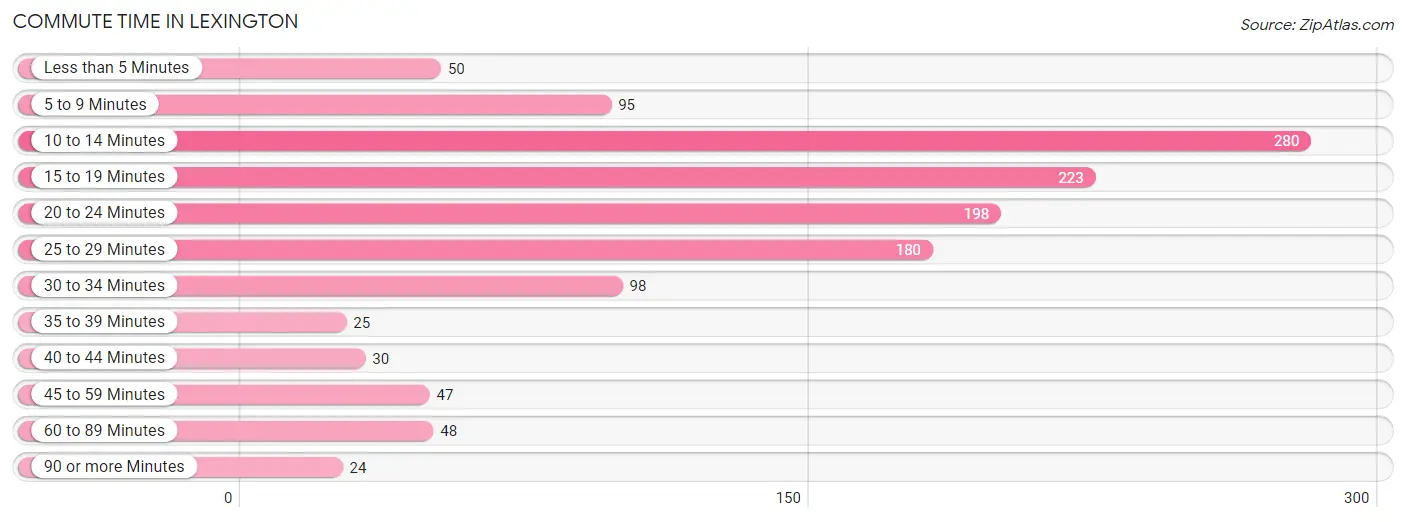
| Commute Time | # Commuters | % Commuters |
| Less than 5 Minutes | 50 | 3.8% |
| 5 to 9 Minutes | 95 | 7.3% |
| 10 to 14 Minutes | 280 | 21.6% |
| 15 to 19 Minutes | 223 | 17.2% |
| 20 to 24 Minutes | 198 | 15.2% |
| 25 to 29 Minutes | 180 | 13.9% |
| 30 to 34 Minutes | 98 | 7.5% |
| 35 to 39 Minutes | 25 | 1.9% |
| 40 to 44 Minutes | 30 | 2.3% |
| 45 to 59 Minutes | 47 | 3.6% |
| 60 to 89 Minutes | 48 | 3.7% |
| 90 or more Minutes | 24 | 1.8% |
Commute Time by Sex in Lexington
The most common commute times in Lexington are 20 to 24 minutes (153 commuters, 21.2%) for males and 10 to 14 minutes (184 commuters, 32.0%) for females.
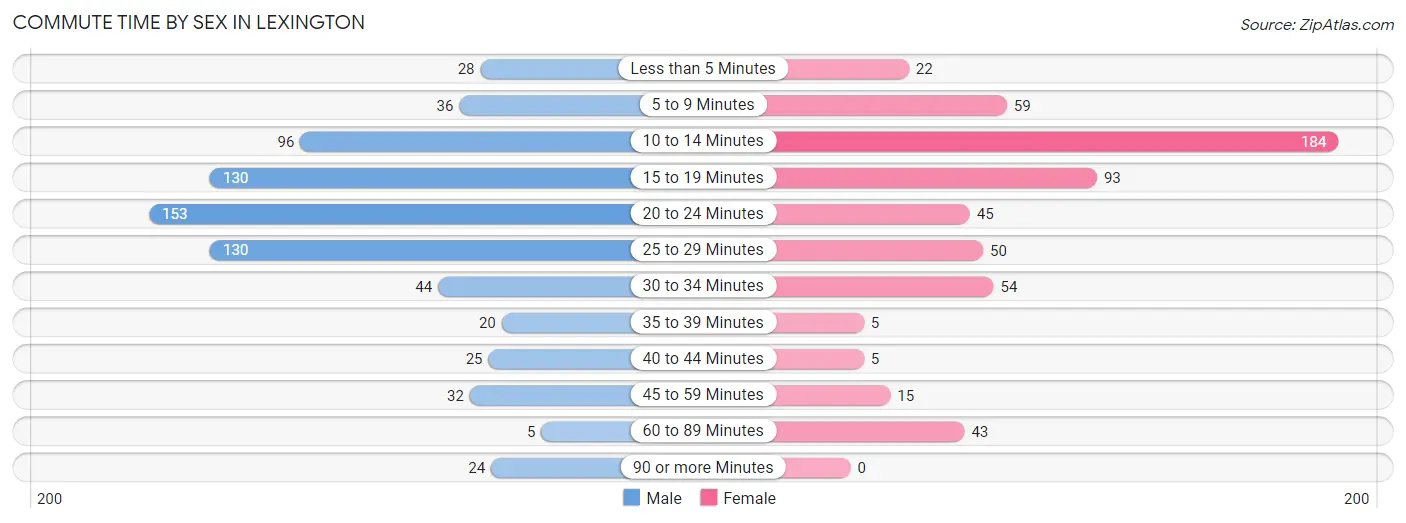
| Commute Time | Male | Female |
| Less than 5 Minutes | 28 (3.9%) | 22 (3.8%) |
| 5 to 9 Minutes | 36 (5.0%) | 59 (10.3%) |
| 10 to 14 Minutes | 96 (13.3%) | 184 (32.0%) |
| 15 to 19 Minutes | 130 (18.0%) | 93 (16.2%) |
| 20 to 24 Minutes | 153 (21.2%) | 45 (7.8%) |
| 25 to 29 Minutes | 130 (18.0%) | 50 (8.7%) |
| 30 to 34 Minutes | 44 (6.1%) | 54 (9.4%) |
| 35 to 39 Minutes | 20 (2.8%) | 5 (0.9%) |
| 40 to 44 Minutes | 25 (3.5%) | 5 (0.9%) |
| 45 to 59 Minutes | 32 (4.4%) | 15 (2.6%) |
| 60 to 89 Minutes | 5 (0.7%) | 43 (7.5%) |
| 90 or more Minutes | 24 (3.3%) | 0 (0.0%) |
Time of Departure to Work by Sex in Lexington
The most frequent times of departure to work in Lexington are 6:00 AM to 6:29 AM (125, 17.3%) for males and 9:00 AM to 9:59 AM (100, 17.4%) for females.
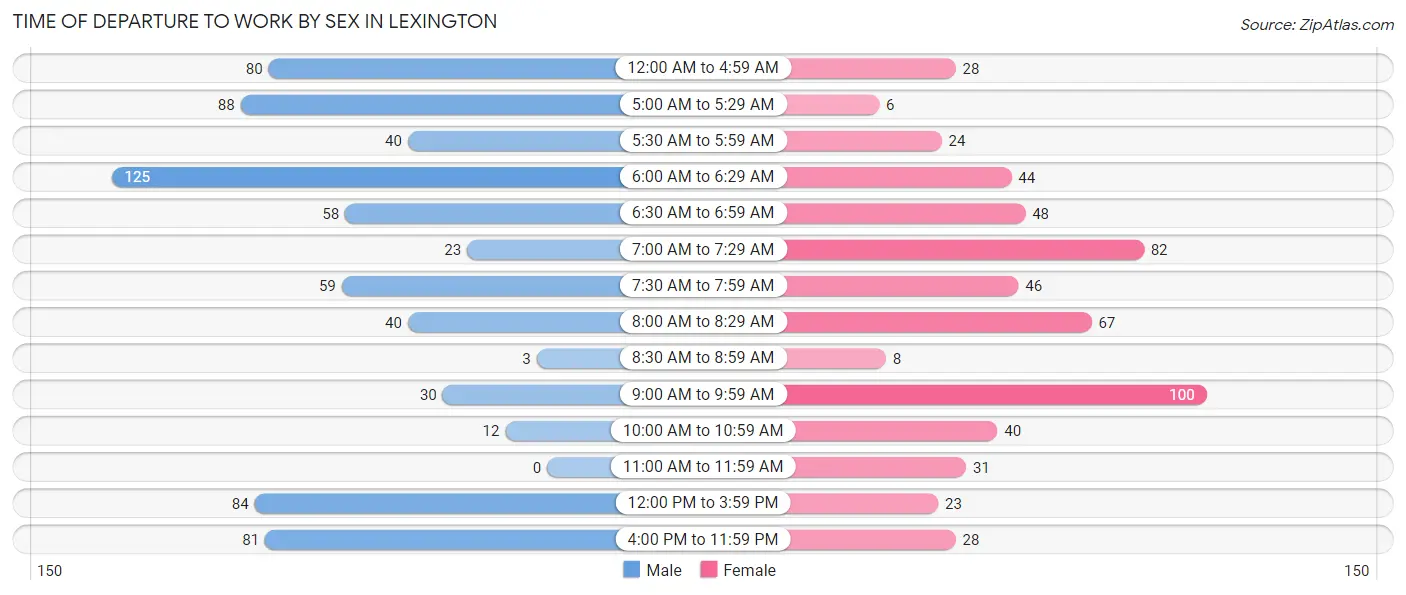
| Time of Departure | Male | Female |
| 12:00 AM to 4:59 AM | 80 (11.1%) | 28 (4.9%) |
| 5:00 AM to 5:29 AM | 88 (12.2%) | 6 (1.0%) |
| 5:30 AM to 5:59 AM | 40 (5.5%) | 24 (4.2%) |
| 6:00 AM to 6:29 AM | 125 (17.3%) | 44 (7.6%) |
| 6:30 AM to 6:59 AM | 58 (8.0%) | 48 (8.4%) |
| 7:00 AM to 7:29 AM | 23 (3.2%) | 82 (14.3%) |
| 7:30 AM to 7:59 AM | 59 (8.2%) | 46 (8.0%) |
| 8:00 AM to 8:29 AM | 40 (5.5%) | 67 (11.7%) |
| 8:30 AM to 8:59 AM | 3 (0.4%) | 8 (1.4%) |
| 9:00 AM to 9:59 AM | 30 (4.2%) | 100 (17.4%) |
| 10:00 AM to 10:59 AM | 12 (1.7%) | 40 (7.0%) |
| 11:00 AM to 11:59 AM | 0 (0.0%) | 31 (5.4%) |
| 12:00 PM to 3:59 PM | 84 (11.6%) | 23 (4.0%) |
| 4:00 PM to 11:59 PM | 81 (11.2%) | 28 (4.9%) |
| Total | 723 (100.0%) | 575 (100.0%) |
Housing Occupancy in Lexington
Occupancy by Ownership in Lexington
Of the total 994 dwellings in Lexington, owner-occupied units account for 600 (60.4%), while renter-occupied units make up 394 (39.6%).
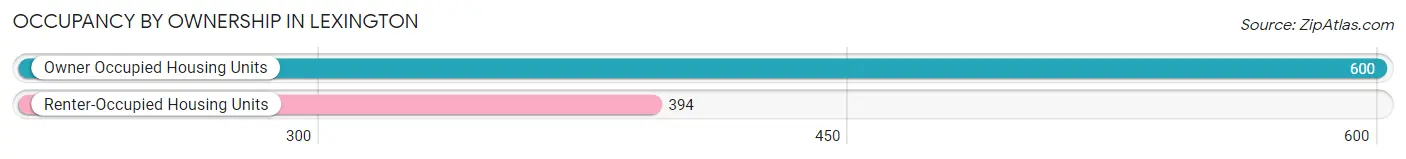
| Occupancy | # Housing Units | % Housing Units |
| Owner Occupied Housing Units | 600 | 60.4% |
| Renter-Occupied Housing Units | 394 | 39.6% |
| Total Occupied Housing Units | 994 | 100.0% |
Occupancy by Household Size in Lexington
| Household Size | # Housing Units | % Housing Units |
| 1-Person Household | 223 | 22.4% |
| 2-Person Household | 420 | 42.2% |
| 3-Person Household | 181 | 18.2% |
| 4+ Person Household | 170 | 17.1% |
| Total Housing Units | 994 | 100.0% |
Occupancy by Ownership by Household Size in Lexington
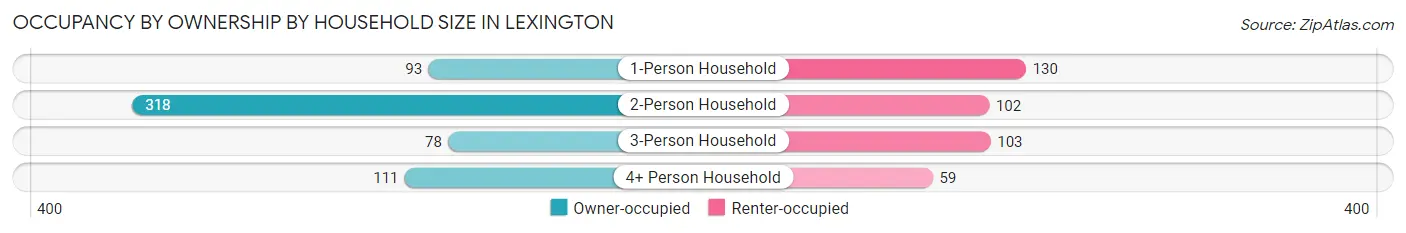
| Household Size | Owner-occupied | Renter-occupied |
| 1-Person Household | 93 (41.7%) | 130 (58.3%) |
| 2-Person Household | 318 (75.7%) | 102 (24.3%) |
| 3-Person Household | 78 (43.1%) | 103 (56.9%) |
| 4+ Person Household | 111 (65.3%) | 59 (34.7%) |
| Total Housing Units | 600 (60.4%) | 394 (39.6%) |
Occupancy by Educational Attainment in Lexington
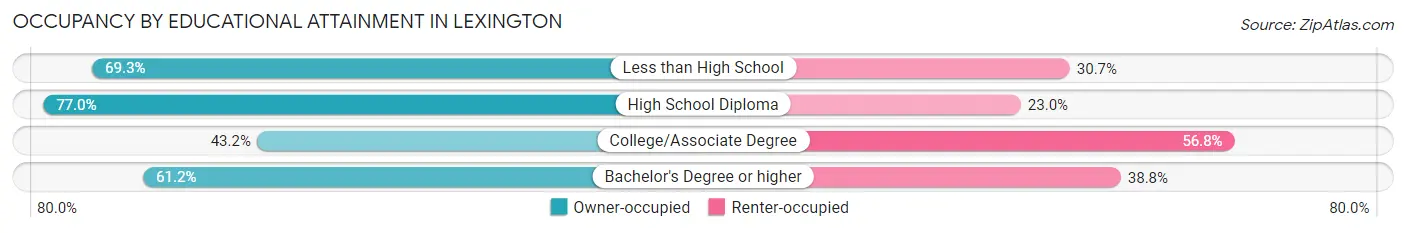
| Household Size | Owner-occupied | Renter-occupied |
| Less than High School | 106 (69.3%) | 47 (30.7%) |
| High School Diploma | 208 (77.0%) | 62 (23.0%) |
| College/Associate Degree | 152 (43.2%) | 200 (56.8%) |
| Bachelor's Degree or higher | 134 (61.2%) | 85 (38.8%) |
Occupancy by Age of Householder in Lexington
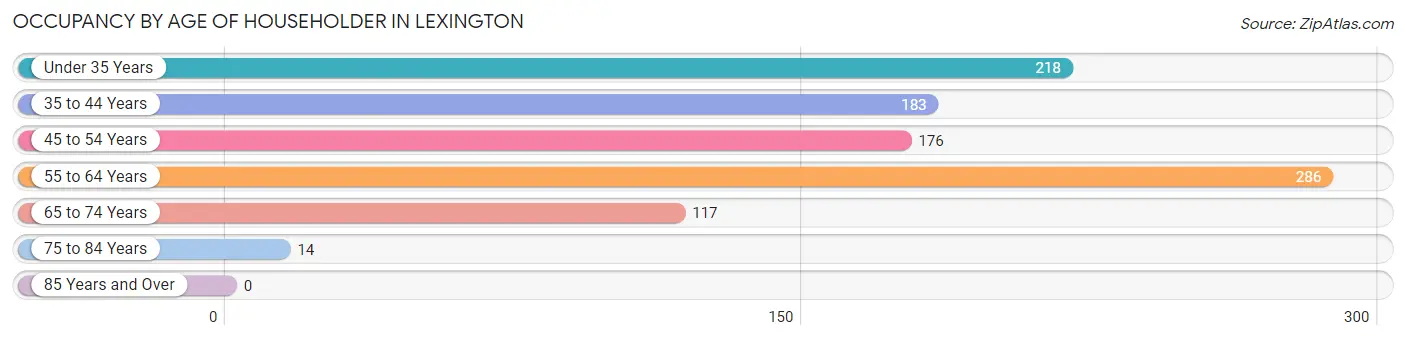
| Age Bracket | # Households | % Households |
| Under 35 Years | 218 | 21.9% |
| 35 to 44 Years | 183 | 18.4% |
| 45 to 54 Years | 176 | 17.7% |
| 55 to 64 Years | 286 | 28.8% |
| 65 to 74 Years | 117 | 11.8% |
| 75 to 84 Years | 14 | 1.4% |
| 85 Years and Over | 0 | 0.0% |
| Total | 994 | 100.0% |
Housing Finances in Lexington
Median Income by Occupancy in Lexington
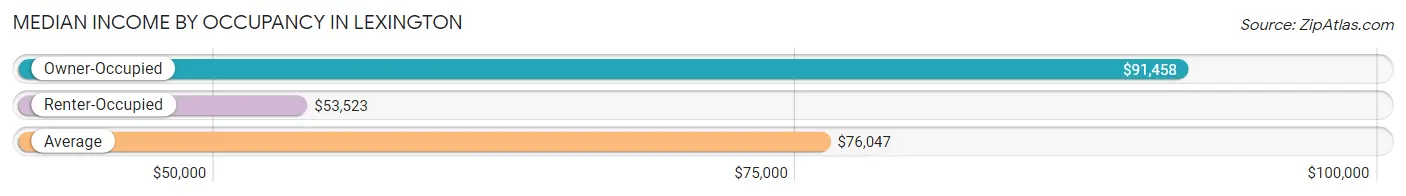
| Occupancy Type | # Households | Median Income |
| Owner-Occupied | 600 (60.4%) | $91,458 |
| Renter-Occupied | 394 (39.6%) | $53,523 |
| Average | 994 (100.0%) | $76,047 |
Occupancy by Householder Income Bracket in Lexington
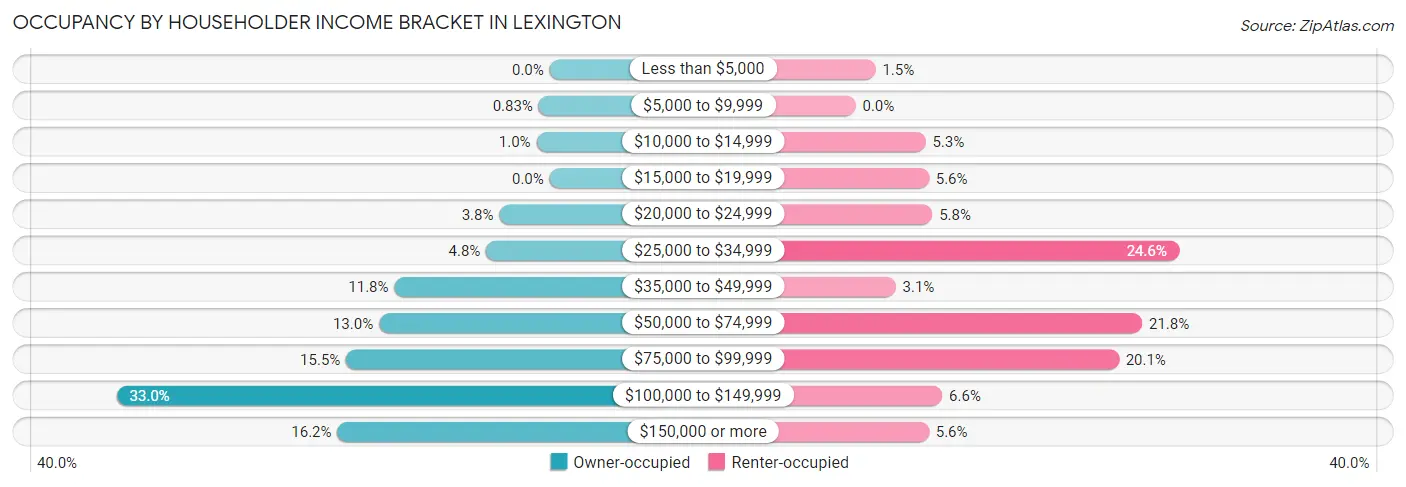
| Income Bracket | Owner-occupied | Renter-occupied |
| Less than $5,000 | 0 (0.0%) | 6 (1.5%) |
| $5,000 to $9,999 | 5 (0.8%) | 0 (0.0%) |
| $10,000 to $14,999 | 6 (1.0%) | 21 (5.3%) |
| $15,000 to $19,999 | 0 (0.0%) | 22 (5.6%) |
| $20,000 to $24,999 | 23 (3.8%) | 23 (5.8%) |
| $25,000 to $34,999 | 29 (4.8%) | 97 (24.6%) |
| $35,000 to $49,999 | 71 (11.8%) | 12 (3.0%) |
| $50,000 to $74,999 | 78 (13.0%) | 86 (21.8%) |
| $75,000 to $99,999 | 93 (15.5%) | 79 (20.1%) |
| $100,000 to $149,999 | 198 (33.0%) | 26 (6.6%) |
| $150,000 or more | 97 (16.2%) | 22 (5.6%) |
| Total | 600 (100.0%) | 394 (100.0%) |
Monthly Housing Cost Tiers in Lexington
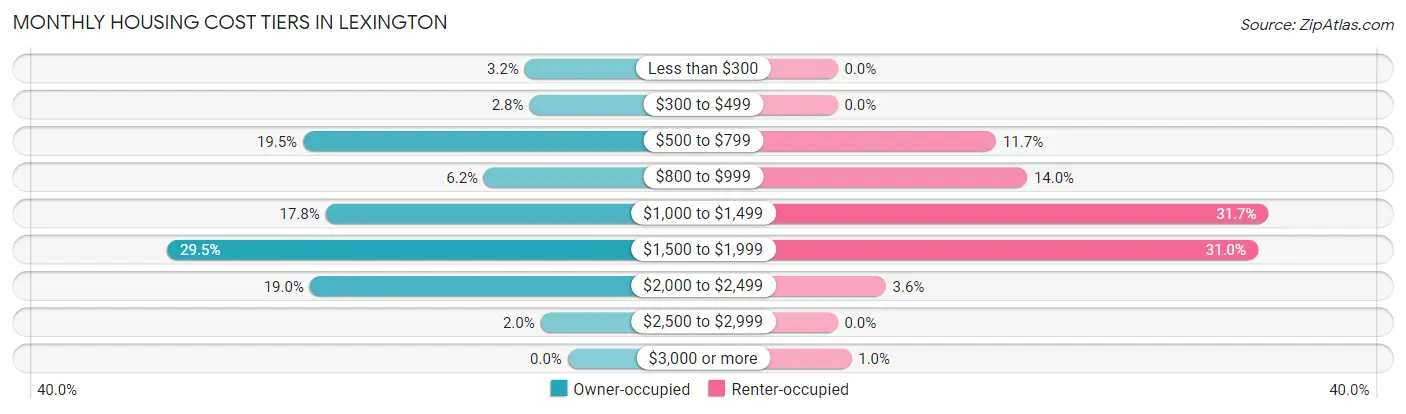
| Monthly Cost | Owner-occupied | Renter-occupied |
| Less than $300 | 19 (3.2%) | 0 (0.0%) |
| $300 to $499 | 17 (2.8%) | 0 (0.0%) |
| $500 to $799 | 117 (19.5%) | 46 (11.7%) |
| $800 to $999 | 37 (6.2%) | 55 (14.0%) |
| $1,000 to $1,499 | 107 (17.8%) | 125 (31.7%) |
| $1,500 to $1,999 | 177 (29.5%) | 122 (31.0%) |
| $2,000 to $2,499 | 114 (19.0%) | 14 (3.5%) |
| $2,500 to $2,999 | 12 (2.0%) | 0 (0.0%) |
| $3,000 or more | 0 (0.0%) | 4 (1.0%) |
| Total | 600 (100.0%) | 394 (100.0%) |
Physical Housing Characteristics in Lexington
Housing Structures in Lexington
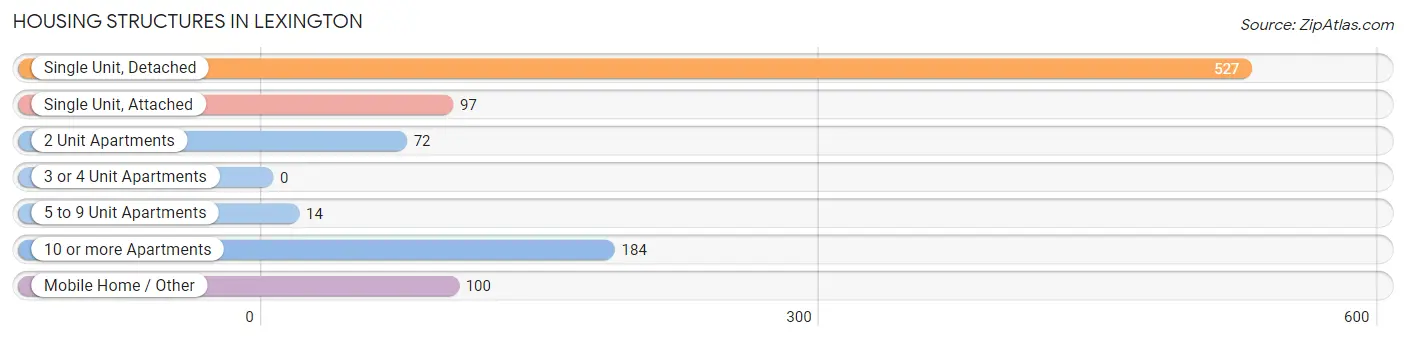
| Structure Type | # Housing Units | % Housing Units |
| Single Unit, Detached | 527 | 53.0% |
| Single Unit, Attached | 97 | 9.8% |
| 2 Unit Apartments | 72 | 7.2% |
| 3 or 4 Unit Apartments | 0 | 0.0% |
| 5 to 9 Unit Apartments | 14 | 1.4% |
| 10 or more Apartments | 184 | 18.5% |
| Mobile Home / Other | 100 | 10.1% |
| Total | 994 | 100.0% |
Housing Structures by Occupancy in Lexington
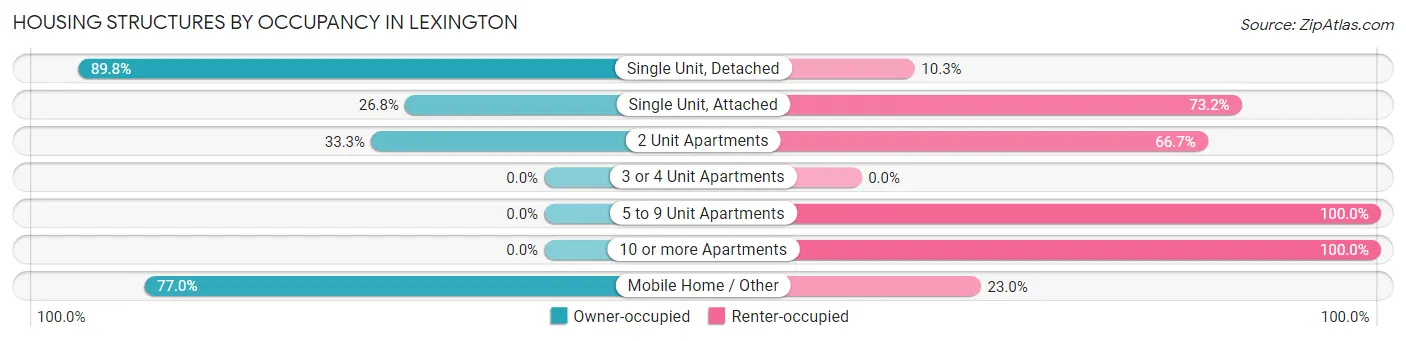
| Structure Type | Owner-occupied | Renter-occupied |
| Single Unit, Detached | 473 (89.7%) | 54 (10.2%) |
| Single Unit, Attached | 26 (26.8%) | 71 (73.2%) |
| 2 Unit Apartments | 24 (33.3%) | 48 (66.7%) |
| 3 or 4 Unit Apartments | 0 (0.0%) | 0 (0.0%) |
| 5 to 9 Unit Apartments | 0 (0.0%) | 14 (100.0%) |
| 10 or more Apartments | 0 (0.0%) | 184 (100.0%) |
| Mobile Home / Other | 77 (77.0%) | 23 (23.0%) |
| Total | 600 (60.4%) | 394 (39.6%) |
Housing Structures by Number of Rooms in Lexington
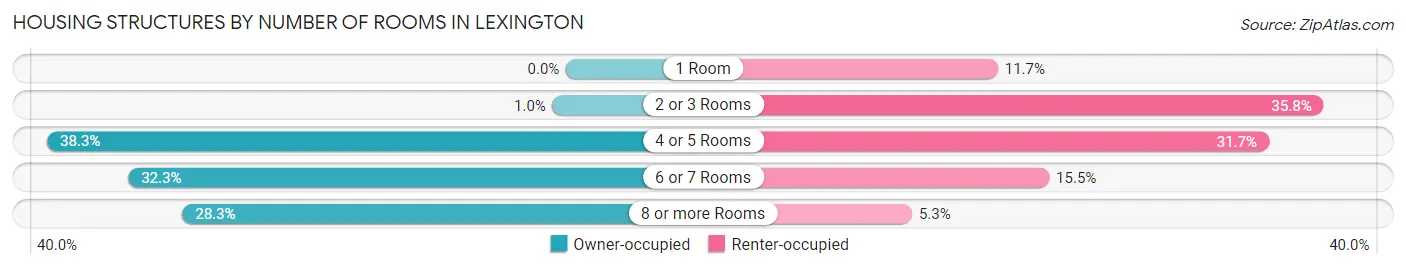
| Number of Rooms | Owner-occupied | Renter-occupied |
| 1 Room | 0 (0.0%) | 46 (11.7%) |
| 2 or 3 Rooms | 6 (1.0%) | 141 (35.8%) |
| 4 or 5 Rooms | 230 (38.3%) | 125 (31.7%) |
| 6 or 7 Rooms | 194 (32.3%) | 61 (15.5%) |
| 8 or more Rooms | 170 (28.3%) | 21 (5.3%) |
| Total | 600 (100.0%) | 394 (100.0%) |
Housing Structure by Heating Type in Lexington
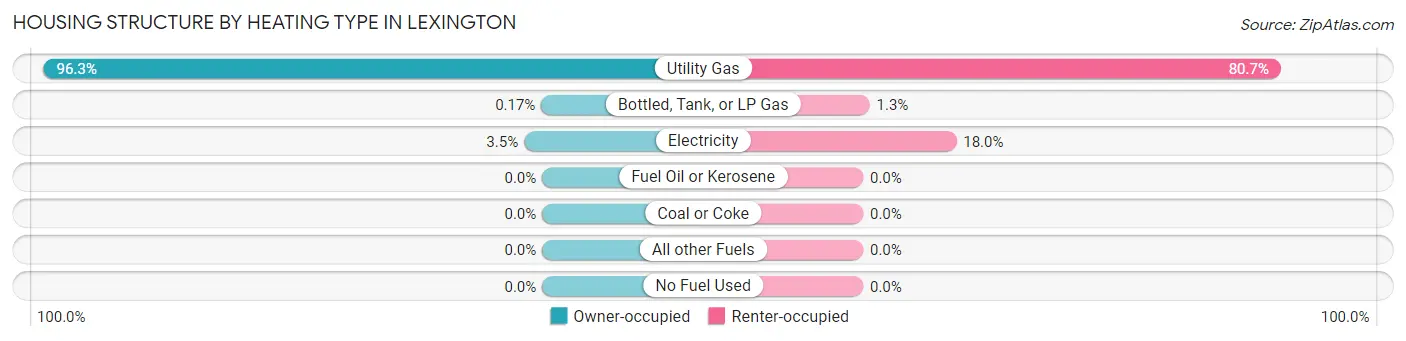
| Heating Type | Owner-occupied | Renter-occupied |
| Utility Gas | 578 (96.3%) | 318 (80.7%) |
| Bottled, Tank, or LP Gas | 1 (0.2%) | 5 (1.3%) |
| Electricity | 21 (3.5%) | 71 (18.0%) |
| Fuel Oil or Kerosene | 0 (0.0%) | 0 (0.0%) |
| Coal or Coke | 0 (0.0%) | 0 (0.0%) |
| All other Fuels | 0 (0.0%) | 0 (0.0%) |
| No Fuel Used | 0 (0.0%) | 0 (0.0%) |
| Total | 600 (100.0%) | 394 (100.0%) |
Household Vehicle Usage in Lexington
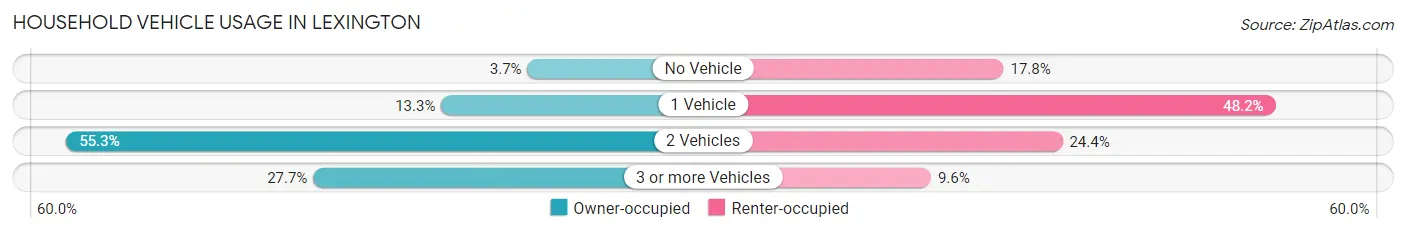
| Vehicles per Household | Owner-occupied | Renter-occupied |
| No Vehicle | 22 (3.7%) | 70 (17.8%) |
| 1 Vehicle | 80 (13.3%) | 190 (48.2%) |
| 2 Vehicles | 332 (55.3%) | 96 (24.4%) |
| 3 or more Vehicles | 166 (27.7%) | 38 (9.6%) |
| Total | 600 (100.0%) | 394 (100.0%) |
Real Estate & Mortgages in Lexington
Real Estate and Mortgage Overview in Lexington
| Characteristic | Without Mortgage | With Mortgage |
| Housing Units | 183 | 417 |
| Median Property Value | $253,800 | $265,800 |
| Median Household Income | $66,406 | $69 |
| Monthly Housing Costs | $665 | $0 |
| Real Estate Taxes | $3,280 | $7 |
Property Value by Mortgage Status in Lexington
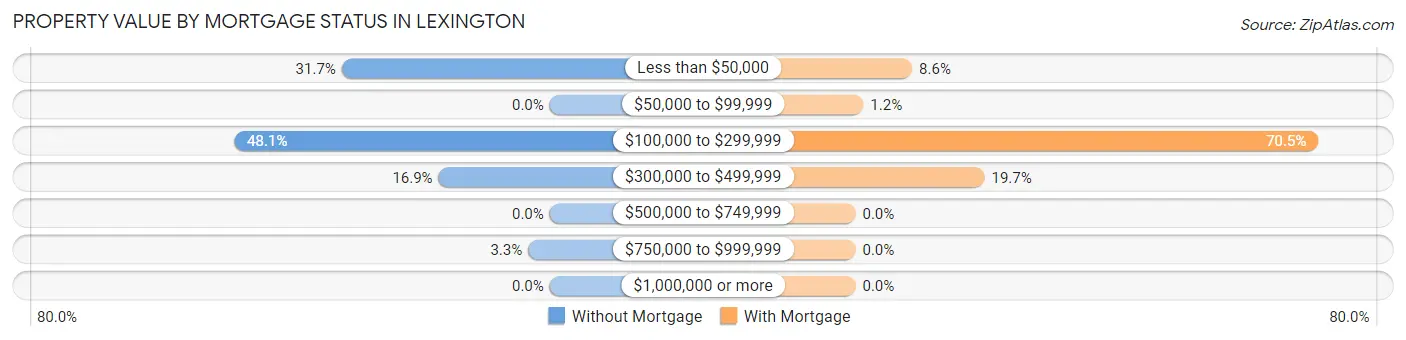
| Property Value | Without Mortgage | With Mortgage |
| Less than $50,000 | 58 (31.7%) | 36 (8.6%) |
| $50,000 to $99,999 | 0 (0.0%) | 5 (1.2%) |
| $100,000 to $299,999 | 88 (48.1%) | 294 (70.5%) |
| $300,000 to $499,999 | 31 (16.9%) | 82 (19.7%) |
| $500,000 to $749,999 | 0 (0.0%) | 0 (0.0%) |
| $750,000 to $999,999 | 6 (3.3%) | 0 (0.0%) |
| $1,000,000 or more | 0 (0.0%) | 0 (0.0%) |
| Total | 183 (100.0%) | 417 (100.0%) |
Household Income by Mortgage Status in Lexington
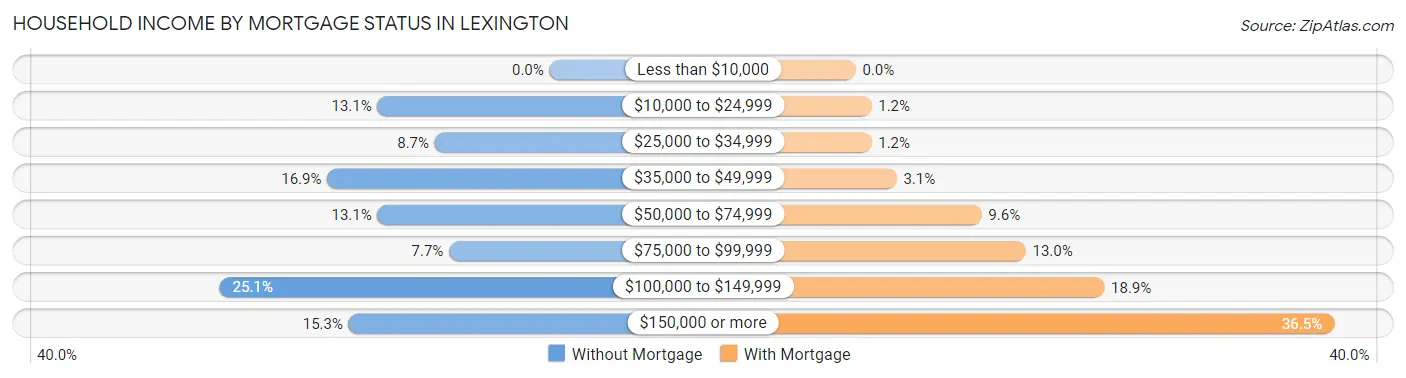
| Household Income | Without Mortgage | With Mortgage |
| Less than $10,000 | 0 (0.0%) | 0 (0.0%) |
| $10,000 to $24,999 | 24 (13.1%) | 5 (1.2%) |
| $25,000 to $34,999 | 16 (8.7%) | 5 (1.2%) |
| $35,000 to $49,999 | 31 (16.9%) | 13 (3.1%) |
| $50,000 to $74,999 | 24 (13.1%) | 40 (9.6%) |
| $75,000 to $99,999 | 14 (7.6%) | 54 (13.0%) |
| $100,000 to $149,999 | 46 (25.1%) | 79 (18.9%) |
| $150,000 or more | 28 (15.3%) | 152 (36.4%) |
| Total | 183 (100.0%) | 417 (100.0%) |
Property Value to Household Income Ratio in Lexington
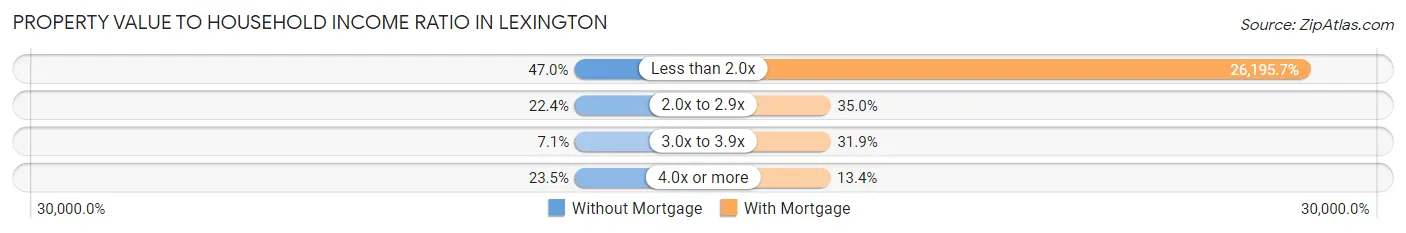
| Value-to-Income Ratio | Without Mortgage | With Mortgage |
| Less than 2.0x | 86 (47.0%) | 109,236 (26,195.7%) |
| 2.0x to 2.9x | 41 (22.4%) | 146 (35.0%) |
| 3.0x to 3.9x | 13 (7.1%) | 133 (31.9%) |
| 4.0x or more | 43 (23.5%) | 56 (13.4%) |
| Total | 183 (100.0%) | 417 (100.0%) |
Real Estate Taxes by Mortgage Status in Lexington
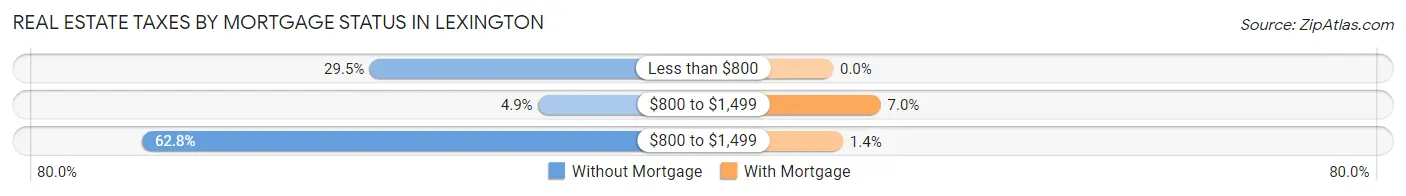
| Property Taxes | Without Mortgage | With Mortgage |
| Less than $800 | 54 (29.5%) | 0 (0.0%) |
| $800 to $1,499 | 9 (4.9%) | 29 (7.0%) |
| $800 to $1,499 | 115 (62.8%) | 6 (1.4%) |
| Total | 183 (100.0%) | 417 (100.0%) |
Health & Disability in Lexington
Health Insurance Coverage by Age in Lexington
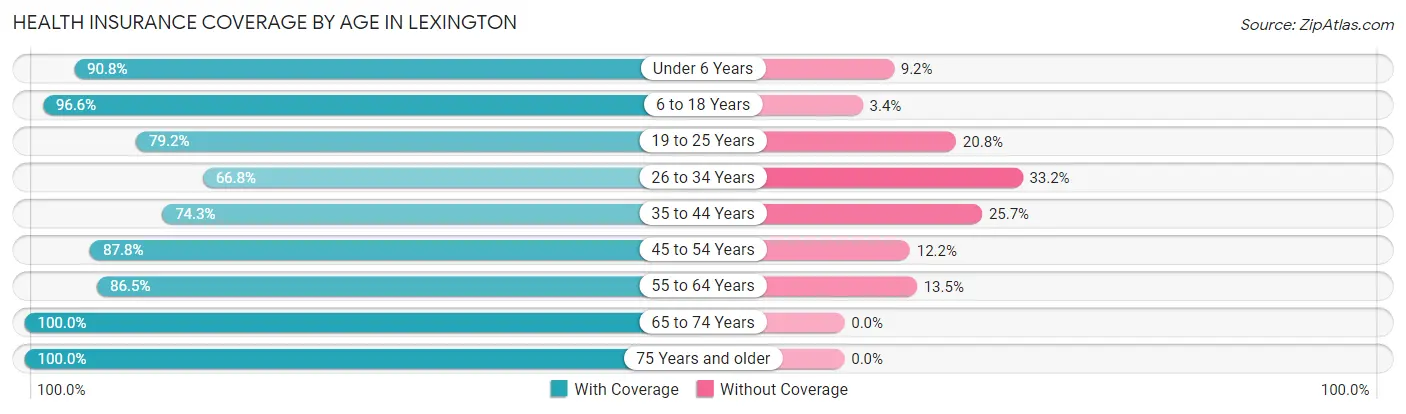
| Age Bracket | With Coverage | Without Coverage |
| Under 6 Years | 177 (90.8%) | 18 (9.2%) |
| 6 to 18 Years | 340 (96.6%) | 12 (3.4%) |
| 19 to 25 Years | 255 (79.2%) | 67 (20.8%) |
| 26 to 34 Years | 191 (66.8%) | 95 (33.2%) |
| 35 to 44 Years | 223 (74.3%) | 77 (25.7%) |
| 45 to 54 Years | 302 (87.8%) | 42 (12.2%) |
| 55 to 64 Years | 416 (86.5%) | 65 (13.5%) |
| 65 to 74 Years | 140 (100.0%) | 0 (0.0%) |
| 75 Years and older | 28 (100.0%) | 0 (0.0%) |
| Total | 2,072 (84.6%) | 376 (15.4%) |
Health Insurance Coverage by Citizenship Status in Lexington
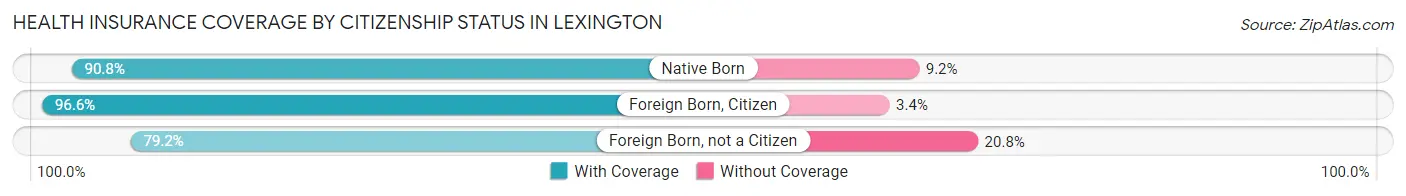
| Citizenship Status | With Coverage | Without Coverage |
| Native Born | 177 (90.8%) | 18 (9.2%) |
| Foreign Born, Citizen | 340 (96.6%) | 12 (3.4%) |
| Foreign Born, not a Citizen | 255 (79.2%) | 67 (20.8%) |
Health Insurance Coverage by Household Income in Lexington
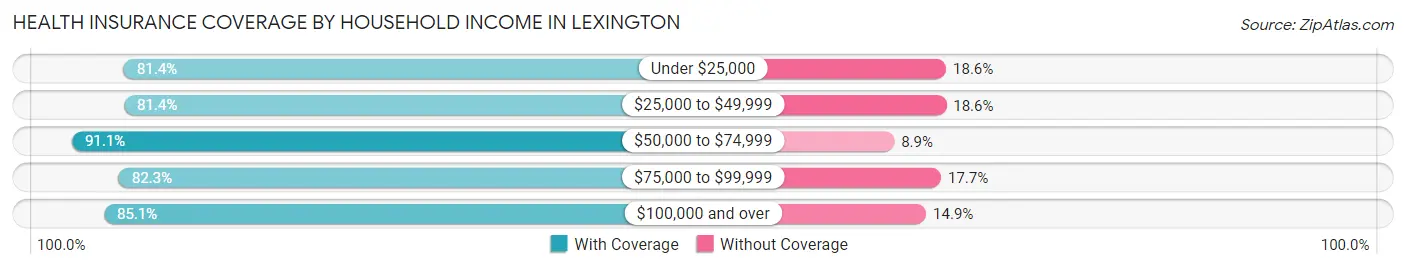
| Household Income | With Coverage | Without Coverage |
| Under $25,000 | 188 (81.4%) | 43 (18.6%) |
| $25,000 to $49,999 | 336 (81.4%) | 77 (18.6%) |
| $50,000 to $74,999 | 390 (91.1%) | 38 (8.9%) |
| $75,000 to $99,999 | 387 (82.3%) | 83 (17.7%) |
| $100,000 and over | 767 (85.1%) | 134 (14.9%) |
Public vs Private Health Insurance Coverage by Age in Lexington
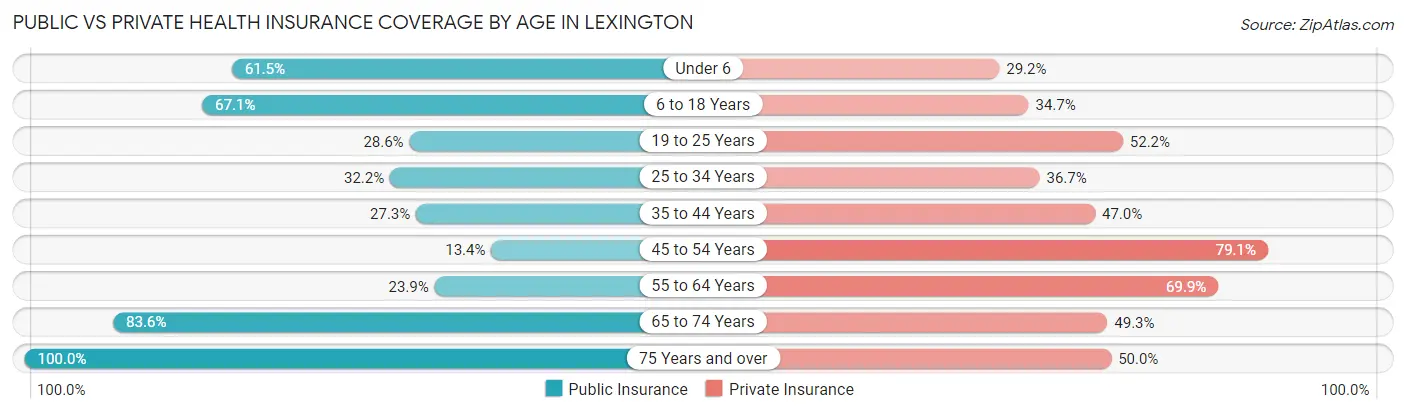
| Age Bracket | Public Insurance | Private Insurance |
| Under 6 | 120 (61.5%) | 57 (29.2%) |
| 6 to 18 Years | 236 (67.0%) | 122 (34.7%) |
| 19 to 25 Years | 92 (28.6%) | 168 (52.2%) |
| 25 to 34 Years | 92 (32.2%) | 105 (36.7%) |
| 35 to 44 Years | 82 (27.3%) | 141 (47.0%) |
| 45 to 54 Years | 46 (13.4%) | 272 (79.1%) |
| 55 to 64 Years | 115 (23.9%) | 336 (69.9%) |
| 65 to 74 Years | 117 (83.6%) | 69 (49.3%) |
| 75 Years and over | 28 (100.0%) | 14 (50.0%) |
| Total | 928 (37.9%) | 1,284 (52.4%) |
Disability Status by Sex by Age in Lexington
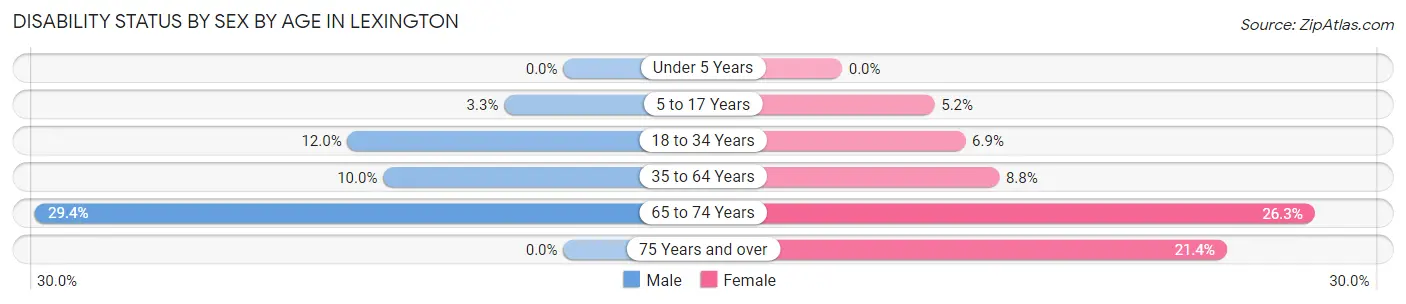
| Age Bracket | Male | Female |
| Under 5 Years | 0 (0.0%) | 0 (0.0%) |
| 5 to 17 Years | 7 (3.3%) | 10 (5.1%) |
| 18 to 34 Years | 41 (12.0%) | 20 (6.9%) |
| 35 to 64 Years | 59 (10.0%) | 47 (8.7%) |
| 65 to 74 Years | 30 (29.4%) | 10 (26.3%) |
| 75 Years and over | 0 (0.0%) | 6 (21.4%) |
Disability Class by Sex by Age in Lexington
Disability Class: Hearing Difficulty
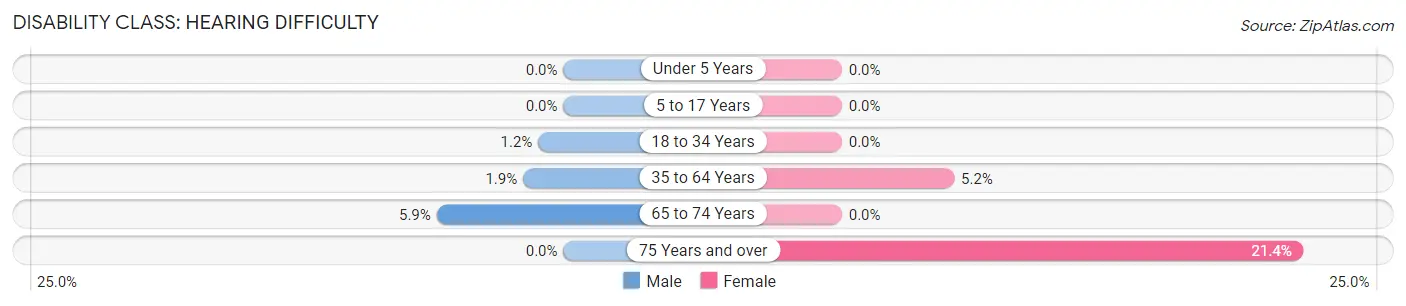
| Age Bracket | Male | Female |
| Under 5 Years | 0 (0.0%) | 0 (0.0%) |
| 5 to 17 Years | 0 (0.0%) | 0 (0.0%) |
| 18 to 34 Years | 4 (1.2%) | 0 (0.0%) |
| 35 to 64 Years | 11 (1.9%) | 28 (5.2%) |
| 65 to 74 Years | 6 (5.9%) | 0 (0.0%) |
| 75 Years and over | 0 (0.0%) | 6 (21.4%) |
Disability Class: Vision Difficulty
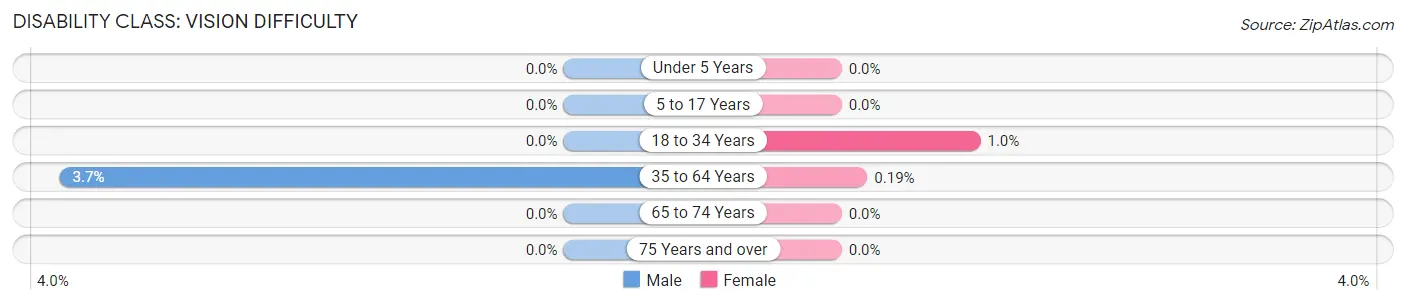
| Age Bracket | Male | Female |
| Under 5 Years | 0 (0.0%) | 0 (0.0%) |
| 5 to 17 Years | 0 (0.0%) | 0 (0.0%) |
| 18 to 34 Years | 0 (0.0%) | 3 (1.0%) |
| 35 to 64 Years | 22 (3.7%) | 1 (0.2%) |
| 65 to 74 Years | 0 (0.0%) | 0 (0.0%) |
| 75 Years and over | 0 (0.0%) | 0 (0.0%) |
Disability Class: Cognitive Difficulty
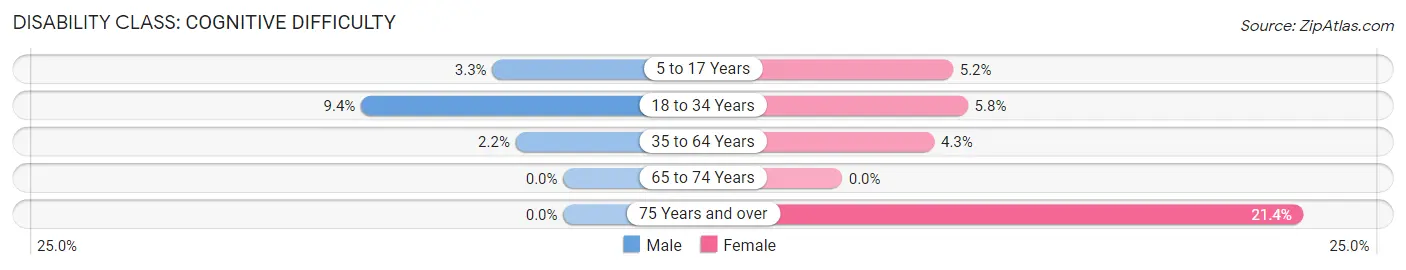
| Age Bracket | Male | Female |
| 5 to 17 Years | 7 (3.3%) | 10 (5.1%) |
| 18 to 34 Years | 32 (9.4%) | 17 (5.8%) |
| 35 to 64 Years | 13 (2.2%) | 23 (4.3%) |
| 65 to 74 Years | 0 (0.0%) | 0 (0.0%) |
| 75 Years and over | 0 (0.0%) | 6 (21.4%) |
Disability Class: Ambulatory Difficulty
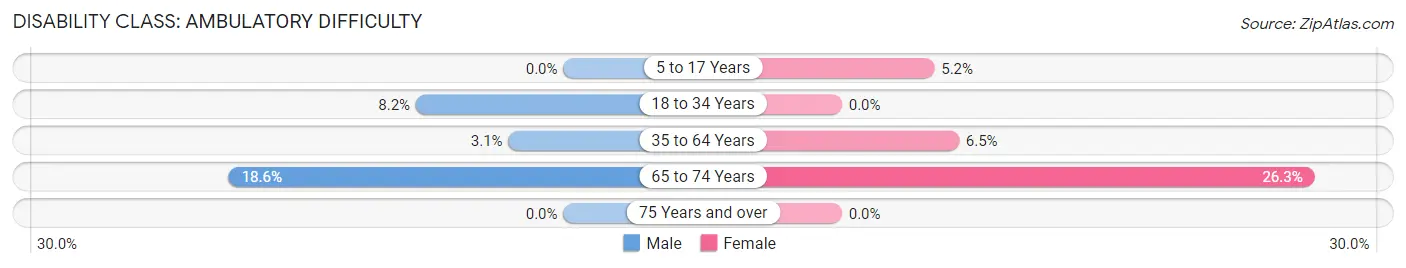
| Age Bracket | Male | Female |
| 5 to 17 Years | 0 (0.0%) | 10 (5.1%) |
| 18 to 34 Years | 28 (8.2%) | 0 (0.0%) |
| 35 to 64 Years | 18 (3.1%) | 35 (6.5%) |
| 65 to 74 Years | 19 (18.6%) | 10 (26.3%) |
| 75 Years and over | 0 (0.0%) | 0 (0.0%) |
Disability Class: Self-Care Difficulty
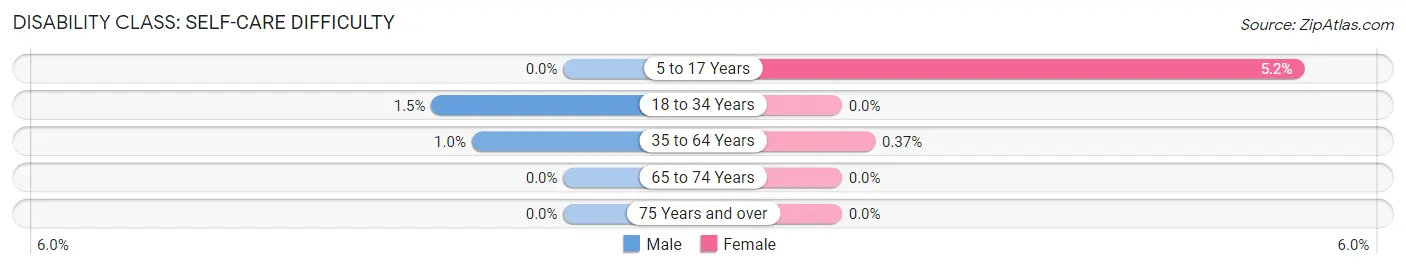
| Age Bracket | Male | Female |
| 5 to 17 Years | 0 (0.0%) | 10 (5.1%) |
| 18 to 34 Years | 5 (1.5%) | 0 (0.0%) |
| 35 to 64 Years | 6 (1.0%) | 2 (0.4%) |
| 65 to 74 Years | 0 (0.0%) | 0 (0.0%) |
| 75 Years and over | 0 (0.0%) | 0 (0.0%) |
Technology Access in Lexington
Computing Device Access in Lexington
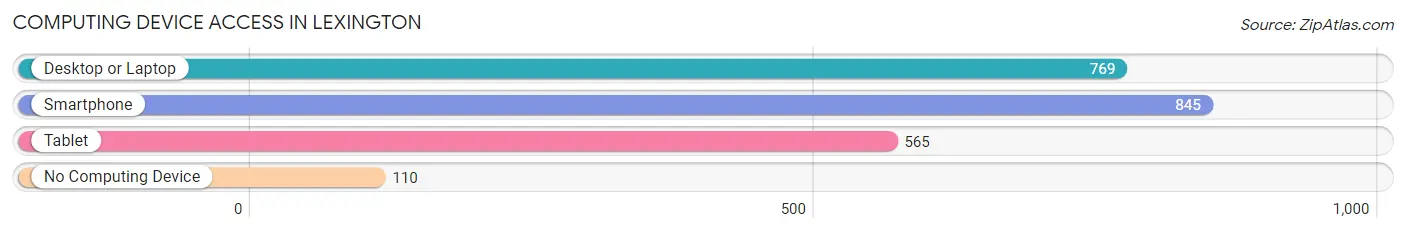
| Device Type | # Households | % Households |
| Desktop or Laptop | 769 | 77.4% |
| Smartphone | 845 | 85.0% |
| Tablet | 565 | 56.8% |
| No Computing Device | 110 | 11.1% |
| Total | 994 | 100.0% |
Internet Access in Lexington
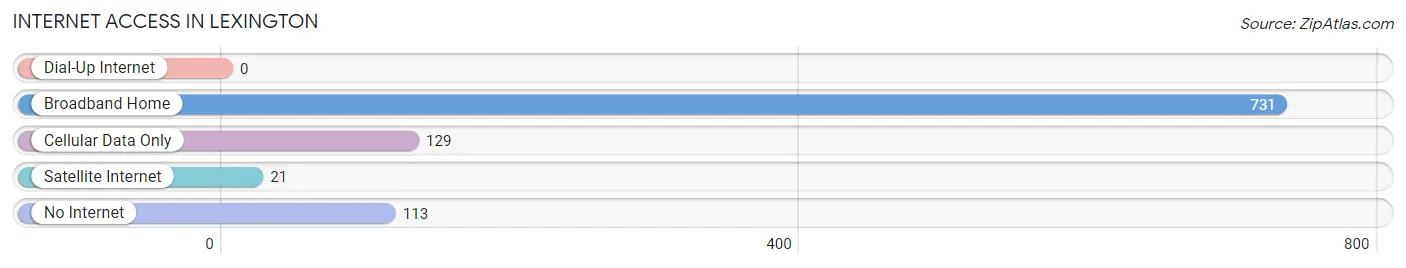
| Internet Type | # Households | % Households |
| Dial-Up Internet | 0 | 0.0% |
| Broadband Home | 731 | 73.5% |
| Cellular Data Only | 129 | 13.0% |
| Satellite Internet | 21 | 2.1% |
| No Internet | 113 | 11.4% |
| Total | 994 | 100.0% |
Lexington Summary
Lexington is a small city located in the state of Minnesota, in the United States of America. It is situated in the southeastern corner of the state, in the county of Freeborn. The city has a population of approximately 1,500 people, and is part of the Albert Lea metropolitan area.
Geography
Lexington is located in the southeastern corner of Minnesota, in Freeborn County. It is situated on the western shore of Albert Lea Lake, and is bordered by the cities of Albert Lea, Alden, and Hartland. The city is located at an elevation of 1,072 feet above sea level, and has a total area of 0.9 square miles. The terrain of the area is mostly flat, with some rolling hills.
History
The area that is now Lexington was first settled in the late 1800s, when a group of Swedish immigrants arrived in the area. The city was officially incorporated in 1891, and was named after the Battle of Lexington, which took place during the American Revolutionary War. The city grew slowly over the years, and by the early 1900s, it had become a thriving agricultural community.
Economy
The economy of Lexington is largely based on agriculture. The city is home to several large farms, which produce a variety of crops, including corn, soybeans, and wheat. The city also has a number of small businesses, including restaurants, retail stores, and service providers.
Demographics
As of the 2010 census, the population of Lexington was 1,500 people. The racial makeup of the city was 97.3% White, 0.7% African American, 0.3% Native American, 0.3% Asian, and 1.3% from other races. The median household income in the city was $45,000, and the median age was 37 years.
Conclusion
Lexington is a small city located in the southeastern corner of Minnesota. It has a population of approximately 1,500 people, and is part of the Albert Lea metropolitan area. The economy of the city is largely based on agriculture, and the city is home to several large farms. The racial makeup of the city is mostly White, with a small percentage of African American, Native American, and Asian residents. The median household income in the city is $45,000, and the median age is 37 years.
Common Questions
What is Per Capita Income in Lexington?
Per Capita income in Lexington is $34,957.
What is the Median Family Income in Lexington?
Median Family Income in Lexington is $76,890.
What is the Median Household income in Lexington?
Median Household Income in Lexington is $76,047.
What is Income or Wage Gap in Lexington?
Income or Wage Gap in Lexington is 15.0%.
Women in Lexington earn 85.0 cents for every dollar earned by a man.
What is Inequality or Gini Index in Lexington?
Inequality or Gini Index in Lexington is 0.36.
What is the Total Population of Lexington?
Total Population of Lexington is 2,448.
What is the Total Male Population of Lexington?
Total Male Population of Lexington is 1,255.
What is the Total Female Population of Lexington?
Total Female Population of Lexington is 1,193.
What is the Ratio of Males per 100 Females in Lexington?
There are 105.20 Males per 100 Females in Lexington.
What is the Ratio of Females per 100 Males in Lexington?
There are 95.06 Females per 100 Males in Lexington.
What is the Median Population Age in Lexington?
Median Population Age in Lexington is 38.2 Years.
What is the Average Family Size in Lexington
Average Family Size in Lexington is 2.8 People.
What is the Average Household Size in Lexington
Average Household Size in Lexington is 2.5 People.
How Large is the Labor Force in Lexington?
There are 1,540 People in the Labor Forcein in Lexington.
What is the Percentage of People in the Labor Force in Lexington?
77.6% of People are in the Labor Force in Lexington.
What is the Unemployment Rate in Lexington?
Unemployment Rate in Lexington is 5.7%.