Creekside, KY Map & Demographics
Creekside Map
Creekside Overview
$49,464
PER CAPITA INCOME
$126,346
AVG FAMILY INCOME
$125,481
AVG HOUSEHOLD INCOME
29.5%
WAGE / INCOME GAP [ % ]
70.5¢/ $1
WAGE / INCOME GAP [ $ ]
$15,133
FAMILY INCOME DEFICIT
0.30
INEQUALITY / GINI INDEX
364
TOTAL POPULATION
199
MALE POPULATION
165
FEMALE POPULATION
120.61
MALES / 100 FEMALES
82.91
FEMALES / 100 MALES
55.1
MEDIAN AGE
2.7
AVG FAMILY SIZE
2.5
AVG HOUSEHOLD SIZE
228
LABOR FORCE [ PEOPLE ]
72.6%
PERCENT IN LABOR FORCE
6.6%
UNEMPLOYMENT RATE
Creekside Area Codes
Income in Creekside
Income Overview in Creekside
Per Capita Income in Creekside is $49,464, while median incomes of families and households are $126,346 and $125,481 respectively.
| Characteristic | Number | Measure |
| Per Capita Income | 364 | $49,464 |
| Median Family Income | 120 | $126,346 |
| Mean Family Income | 120 | $133,845 |
| Median Household Income | 148 | $125,481 |
| Mean Household Income | 148 | $127,252 |
| Income Deficit | 120 | $15,133 |
| Wage / Income Gap (%) | 364 | 29.50% |
| Wage / Income Gap ($) | 364 | 70.50¢ per $1 |
| Gini / Inequality Index | 364 | 0.30 |
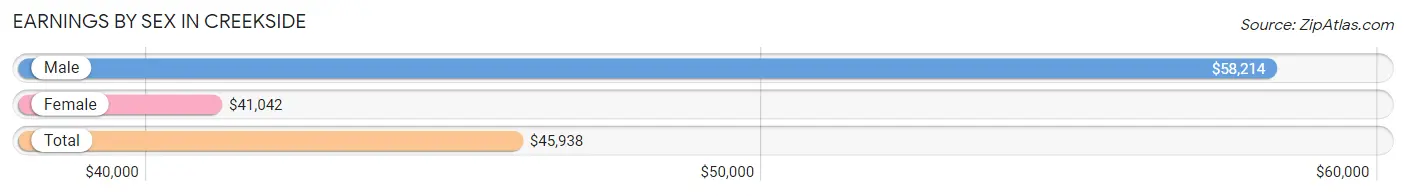
Earnings by Sex in Creekside
Average Earnings in Creekside are $45,938, $58,214 for men and $41,042 for women, a difference of 29.5%.
| Sex | Number | Average Earnings |
| Male | 146 (58.2%) | $58,214 |
| Female | 105 (41.8%) | $41,042 |
| Total | 251 (100.0%) | $45,938 |
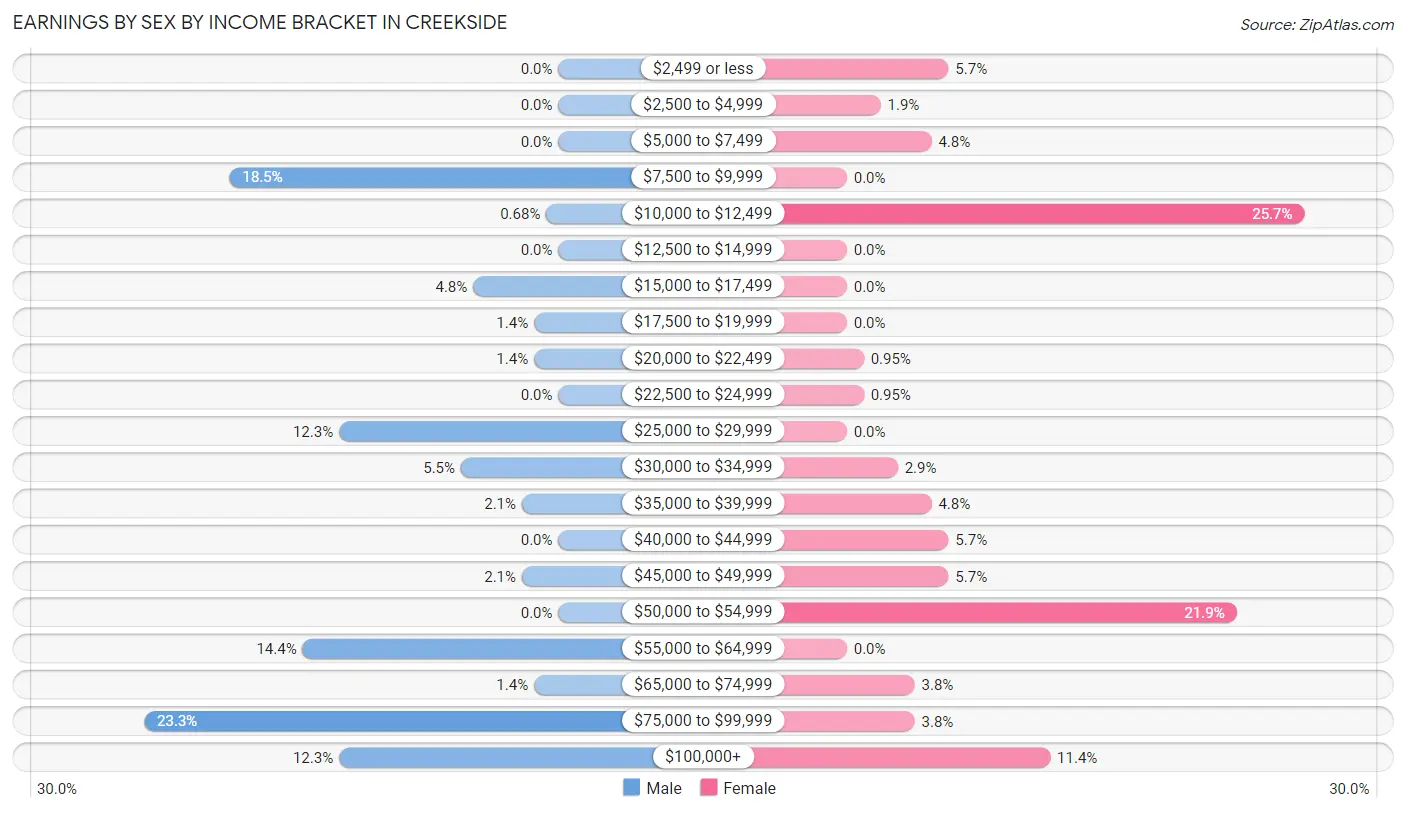
Earnings by Sex by Income Bracket in Creekside
The most common earnings brackets in Creekside are $75,000 to $99,999 for men (34 | 23.3%) and $10,000 to $12,499 for women (27 | 25.7%).
| Income | Male | Female |
| $2,499 or less | 0 (0.0%) | 6 (5.7%) |
| $2,500 to $4,999 | 0 (0.0%) | 2 (1.9%) |
| $5,000 to $7,499 | 0 (0.0%) | 5 (4.8%) |
| $7,500 to $9,999 | 27 (18.5%) | 0 (0.0%) |
| $10,000 to $12,499 | 1 (0.7%) | 27 (25.7%) |
| $12,500 to $14,999 | 0 (0.0%) | 0 (0.0%) |
| $15,000 to $17,499 | 7 (4.8%) | 0 (0.0%) |
| $17,500 to $19,999 | 2 (1.4%) | 0 (0.0%) |
| $20,000 to $22,499 | 2 (1.4%) | 1 (0.9%) |
| $22,500 to $24,999 | 0 (0.0%) | 1 (0.9%) |
| $25,000 to $29,999 | 18 (12.3%) | 0 (0.0%) |
| $30,000 to $34,999 | 8 (5.5%) | 3 (2.9%) |
| $35,000 to $39,999 | 3 (2.1%) | 5 (4.8%) |
| $40,000 to $44,999 | 0 (0.0%) | 6 (5.7%) |
| $45,000 to $49,999 | 3 (2.1%) | 6 (5.7%) |
| $50,000 to $54,999 | 0 (0.0%) | 23 (21.9%) |
| $55,000 to $64,999 | 21 (14.4%) | 0 (0.0%) |
| $65,000 to $74,999 | 2 (1.4%) | 4 (3.8%) |
| $75,000 to $99,999 | 34 (23.3%) | 4 (3.8%) |
| $100,000+ | 18 (12.3%) | 12 (11.4%) |
| Total | 146 (100.0%) | 105 (100.0%) |
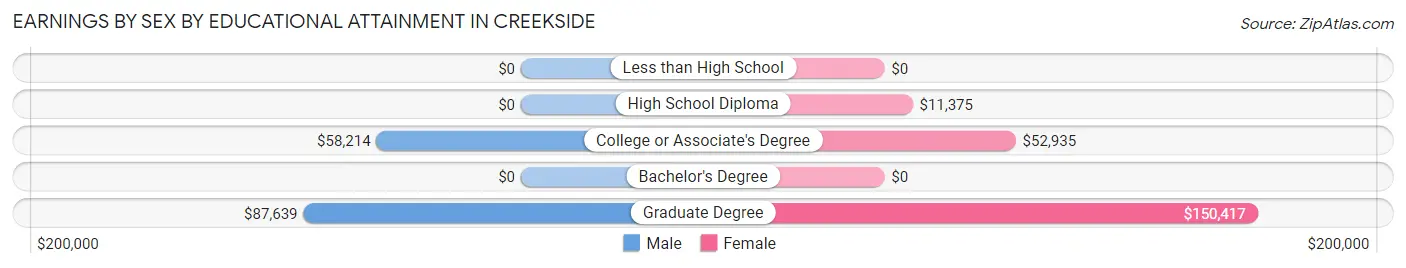
Earnings by Sex by Educational Attainment in Creekside
Average earnings in Creekside are $58,929 for men and $41,458 for women, a difference of 29.6%. Men with an educational attainment of graduate degree enjoy the highest average annual earnings of $87,639, while those with college or associate's degree education earn the least with $58,214. Women with an educational attainment of graduate degree earn the most with the average annual earnings of $150,417, while those with high school diploma education have the smallest earnings of $11,375.
| Educational Attainment | Male Income | Female Income |
| Less than High School | - | - |
| High School Diploma | - | - |
| College or Associate's Degree | $58,214 | $52,935 |
| Bachelor's Degree | - | - |
| Graduate Degree | $87,639 | $150,417 |
| Total | $58,929 | $41,458 |
Family Income in Creekside
Family Income Brackets in Creekside
According to the Creekside family income data, there are 48 families falling into the $100,000 to $149,999 income range, which is the most common income bracket and makes up 40.0% of all families.
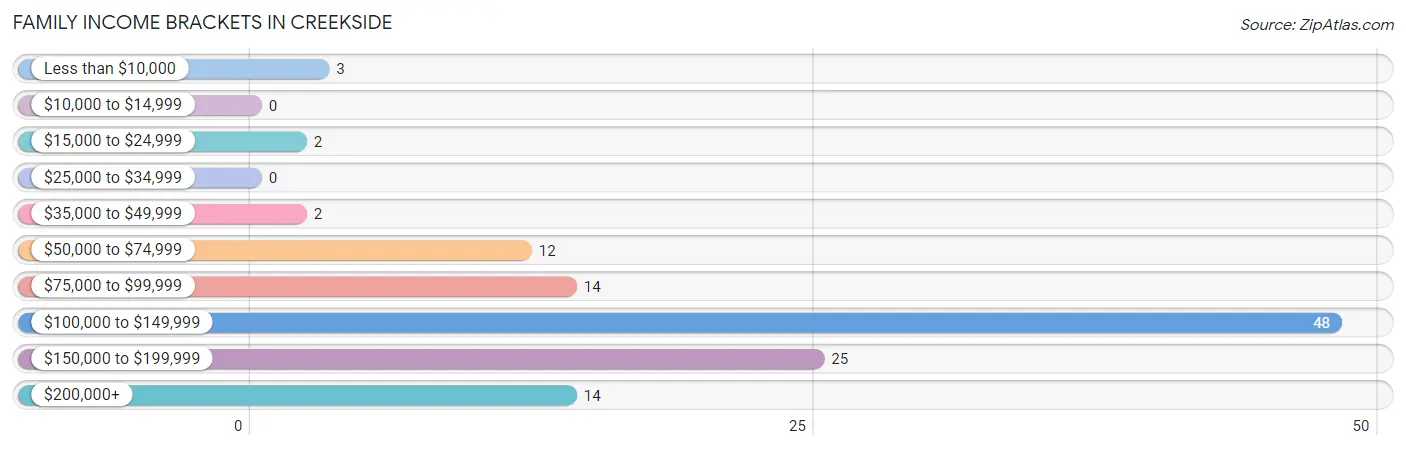
| Income Bracket | # Families | % Families |
| Less than $10,000 | 3 | 2.5% |
| $10,000 to $14,999 | 0 | 0.0% |
| $15,000 to $24,999 | 2 | 1.7% |
| $25,000 to $34,999 | 0 | 0.0% |
| $35,000 to $49,999 | 2 | 1.7% |
| $50,000 to $74,999 | 12 | 10.0% |
| $75,000 to $99,999 | 14 | 11.7% |
| $100,000 to $149,999 | 48 | 40.0% |
| $150,000 to $199,999 | 25 | 20.8% |
| $200,000+ | 14 | 11.7% |
Family Income by Famaliy Size in Creekside
4-person families (11 | 9.2%) account for the highest median family income in Creekside with $212,917 per family, while 2-person families (65 | 54.2%) have the highest median income of $57,430 per family member.
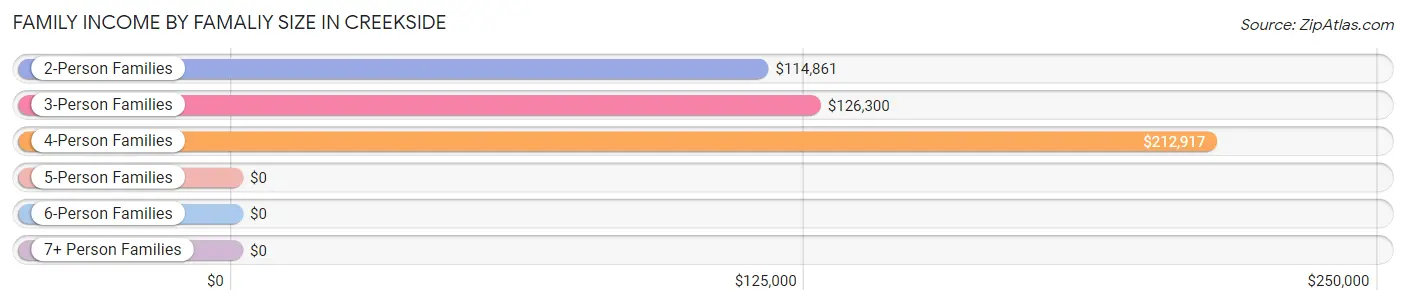
| Income Bracket | # Families | Median Income |
| 2-Person Families | 65 (54.2%) | $114,861 |
| 3-Person Families | 34 (28.3%) | $126,300 |
| 4-Person Families | 11 (9.2%) | $212,917 |
| 5-Person Families | 8 (6.7%) | $0 |
| 6-Person Families | 2 (1.7%) | $0 |
| 7+ Person Families | 0 (0.0%) | $0 |
| Total | 120 (100.0%) | $126,346 |
Family Income by Number of Earners in Creekside
The median family income in Creekside is $126,346, with families comprising 2 earners (69) having the highest median family income of $134,375, while families with 1 earner (10) have the lowest median family income of $73,750, accounting for 57.5% and 8.3% of families, respectively.
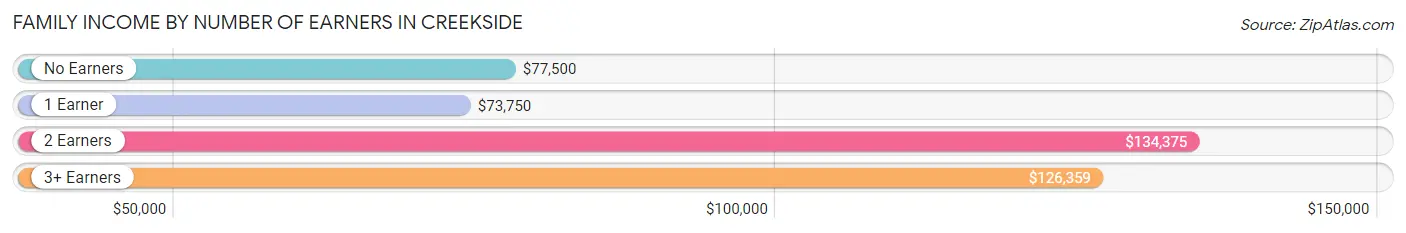
| Number of Earners | # Families | Median Income |
| No Earners | 14 (11.7%) | $77,500 |
| 1 Earner | 10 (8.3%) | $73,750 |
| 2 Earners | 69 (57.5%) | $134,375 |
| 3+ Earners | 27 (22.5%) | $126,359 |
| Total | 120 (100.0%) | $126,346 |
Household Income in Creekside
Household Income Brackets in Creekside
With 54 households falling in the category, the $100,000 to $149,999 income range is the most frequent in Creekside, accounting for 36.5% of all households.
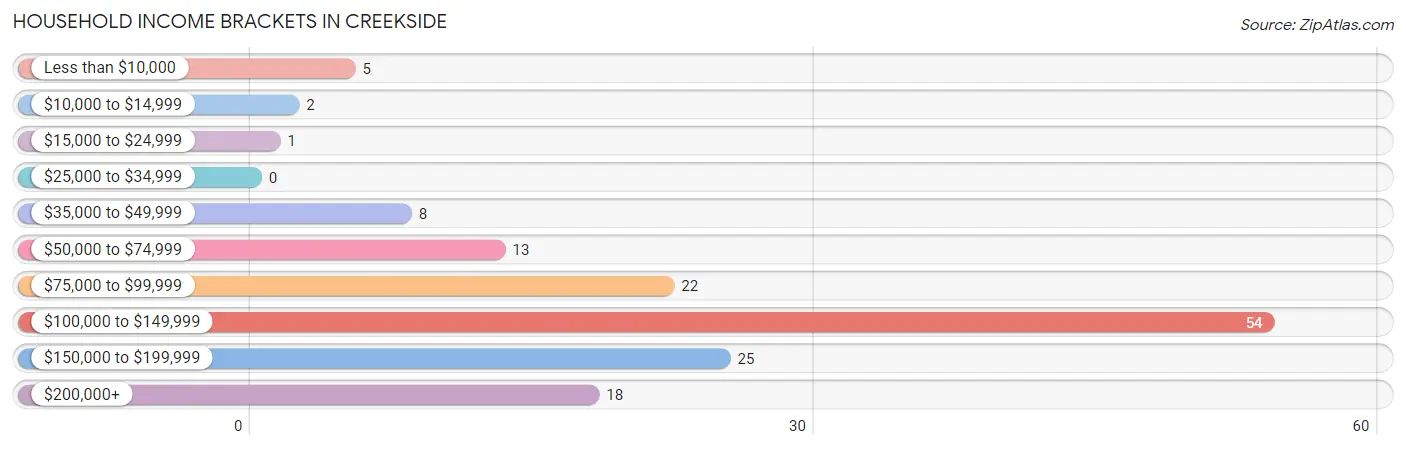
| Income Bracket | # Households | % Households |
| Less than $10,000 | 5 | 3.4% |
| $10,000 to $14,999 | 2 | 1.4% |
| $15,000 to $24,999 | 1 | 0.7% |
| $25,000 to $34,999 | 0 | 0.0% |
| $35,000 to $49,999 | 8 | 5.4% |
| $50,000 to $74,999 | 13 | 8.8% |
| $75,000 to $99,999 | 22 | 14.9% |
| $100,000 to $149,999 | 54 | 36.5% |
| $150,000 to $199,999 | 25 | 16.9% |
| $200,000+ | 18 | 12.2% |
Household Income by Householder Age in Creekside
The median household income in Creekside is $125,481, with the highest median household income of $126,467 found in the 45 to 64 years age bracket for the primary householder. A total of 67 households (45.3%) fall into this category. Meanwhile, the 15 to 24 years age bracket for the primary householder has the lowest median household income of $0, with 1 households (0.7%) in this group.
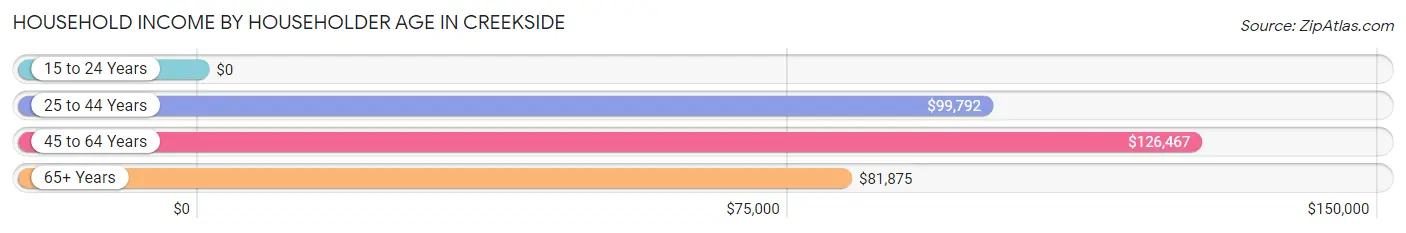
| Income Bracket | # Households | Median Income |
| 15 to 24 Years | 1 (0.7%) | $0 |
| 25 to 44 Years | 27 (18.2%) | $99,792 |
| 45 to 64 Years | 67 (45.3%) | $126,467 |
| 65+ Years | 53 (35.8%) | $81,875 |
| Total | 148 (100.0%) | $125,481 |
Poverty in Creekside
Income Below Poverty by Sex and Age in Creekside
With 2.0% poverty level for males and 5.4% for females among the residents of Creekside, 75 year old and over males and 18 to 24 year old females are the most vulnerable to poverty, with 2 males (16.7%) and 2 females (66.7%) in their respective age groups living below the poverty level.
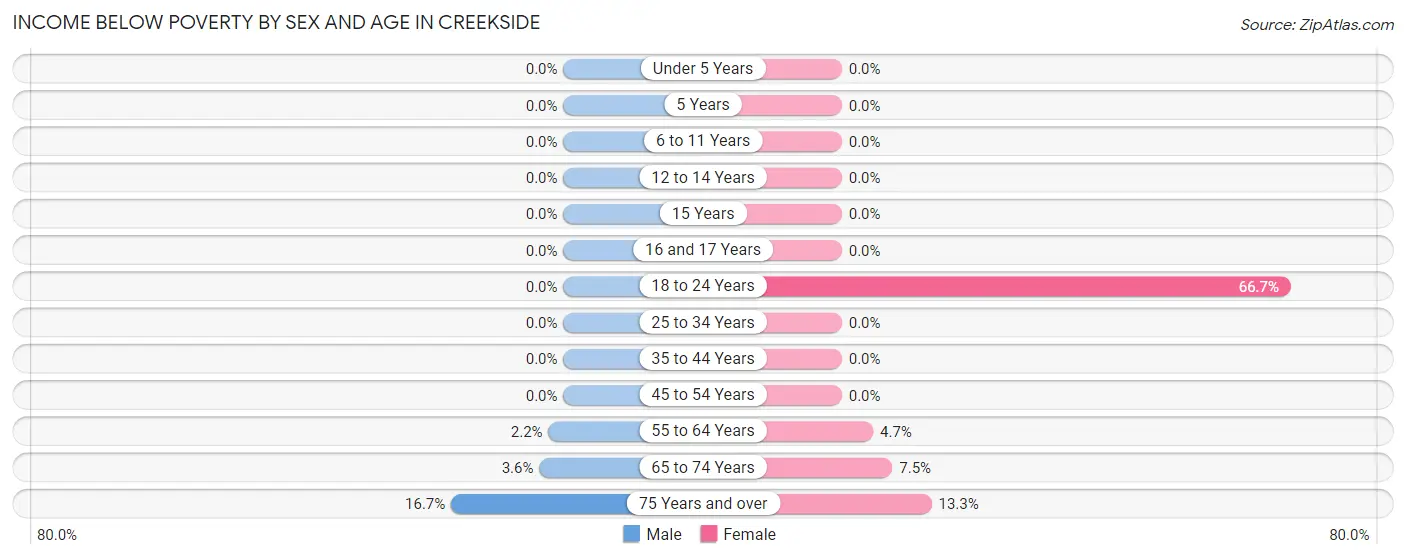
| Age Bracket | Male | Female |
| Under 5 Years | 0 (0.0%) | 0 (0.0%) |
| 5 Years | 0 (0.0%) | 0 (0.0%) |
| 6 to 11 Years | 0 (0.0%) | 0 (0.0%) |
| 12 to 14 Years | 0 (0.0%) | 0 (0.0%) |
| 15 Years | 0 (0.0%) | 0 (0.0%) |
| 16 and 17 Years | 0 (0.0%) | 0 (0.0%) |
| 18 to 24 Years | 0 (0.0%) | 2 (66.7%) |
| 25 to 34 Years | 0 (0.0%) | 0 (0.0%) |
| 35 to 44 Years | 0 (0.0%) | 0 (0.0%) |
| 45 to 54 Years | 0 (0.0%) | 0 (0.0%) |
| 55 to 64 Years | 1 (2.2%) | 2 (4.6%) |
| 65 to 74 Years | 1 (3.6%) | 3 (7.5%) |
| 75 Years and over | 2 (16.7%) | 2 (13.3%) |
| Total | 4 (2.0%) | 9 (5.4%) |
Income Above Poverty by Sex and Age in Creekside
According to the poverty statistics in Creekside, males aged under 5 years and females aged under 5 years are the age groups that are most secure financially, with 100.0% of males and 100.0% of females in these age groups living above the poverty line.
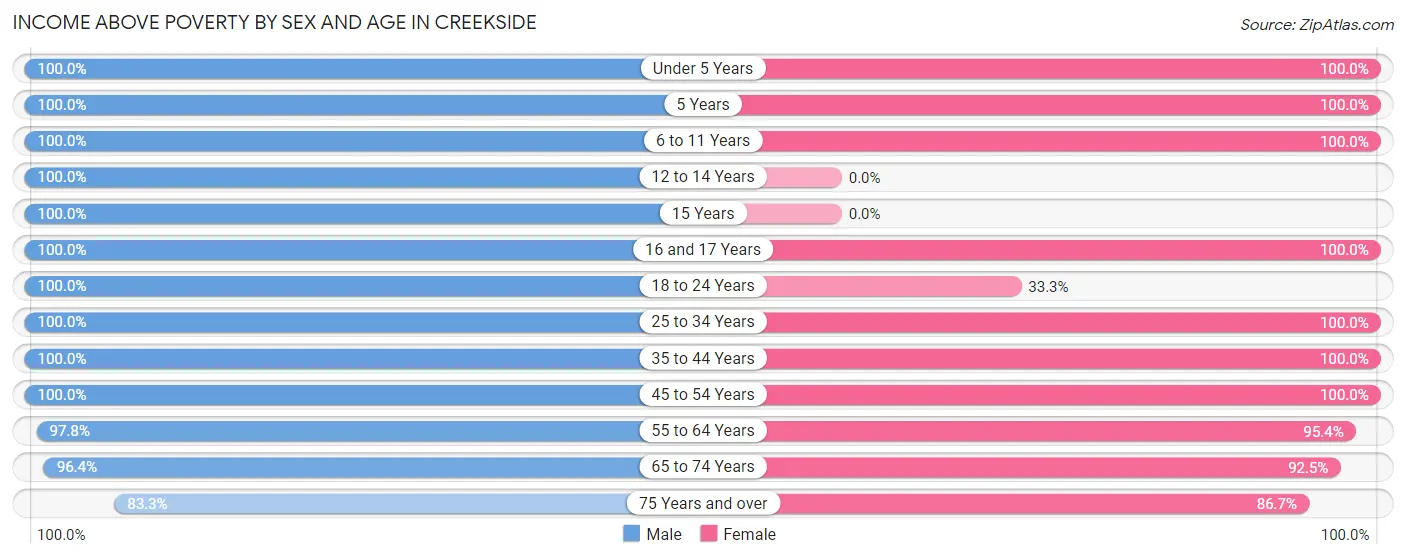
| Age Bracket | Male | Female |
| Under 5 Years | 9 (100.0%) | 7 (100.0%) |
| 5 Years | 4 (100.0%) | 3 (100.0%) |
| 6 to 11 Years | 7 (100.0%) | 13 (100.0%) |
| 12 to 14 Years | 3 (100.0%) | 0 (0.0%) |
| 15 Years | 4 (100.0%) | 0 (0.0%) |
| 16 and 17 Years | 6 (100.0%) | 2 (100.0%) |
| 18 to 24 Years | 3 (100.0%) | 1 (33.3%) |
| 25 to 34 Years | 24 (100.0%) | 18 (100.0%) |
| 35 to 44 Years | 45 (100.0%) | 13 (100.0%) |
| 45 to 54 Years | 9 (100.0%) | 8 (100.0%) |
| 55 to 64 Years | 44 (97.8%) | 41 (95.4%) |
| 65 to 74 Years | 27 (96.4%) | 37 (92.5%) |
| 75 Years and over | 10 (83.3%) | 13 (86.7%) |
| Total | 195 (98.0%) | 156 (94.6%) |
Income Below Poverty Among Married-Couple Families in Creekside
The poverty statistics for married-couple families in Creekside show that 3.1% or 3 of the total 98 families live below the poverty line. Families with no children have the highest poverty rate of 4.2%, comprising of 3 families. On the other hand, families with 1 or 2 children have the lowest poverty rate of 0.0%, which includes 0 families.
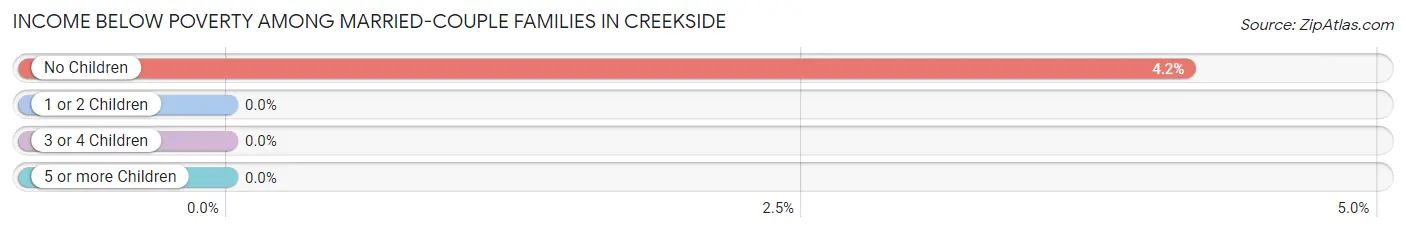
| Children | Above Poverty | Below Poverty |
| No Children | 69 (95.8%) | 3 (4.2%) |
| 1 or 2 Children | 16 (100.0%) | 0 (0.0%) |
| 3 or 4 Children | 10 (100.0%) | 0 (0.0%) |
| 5 or more Children | 0 (0.0%) | 0 (0.0%) |
| Total | 95 (96.9%) | 3 (3.1%) |
Income Below Poverty Among Single-Parent Households in Creekside
| Children | Single Father | Single Mother |
| No Children | 0 (0.0%) | 0 (0.0%) |
| 1 or 2 Children | 0 (0.0%) | 0 (0.0%) |
| 3 or 4 Children | 0 (0.0%) | 0 (0.0%) |
| 5 or more Children | 0 (0.0%) | 0 (0.0%) |
| Total | 0 (0.0%) | 0 (0.0%) |
Income Below Poverty Among Married-Couple vs Single-Parent Households in Creekside
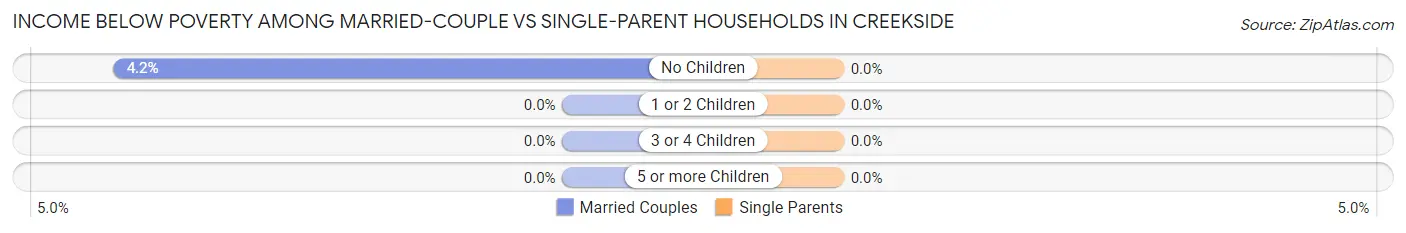
| Children | Married-Couple Families | Single-Parent Households |
| No Children | 3 (4.2%) | 0 (0.0%) |
| 1 or 2 Children | 0 (0.0%) | 0 (0.0%) |
| 3 or 4 Children | 0 (0.0%) | 0 (0.0%) |
| 5 or more Children | 0 (0.0%) | 0 (0.0%) |
| Total | 3 (3.1%) | 0 (0.0%) |
Race in Creekside
The most populous races in Creekside are White / Caucasian (320 | 87.9%), Black / African American (20 | 5.5%), and Two or more Races (11 | 3.0%).
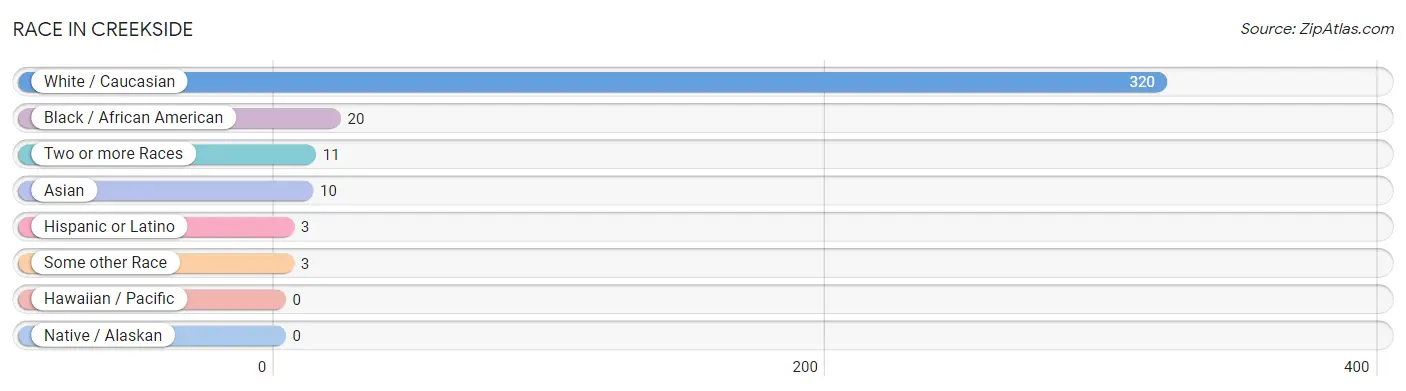
| Race | # Population | % Population |
| Asian | 10 | 2.8% |
| Black / African American | 20 | 5.5% |
| Hawaiian / Pacific | 0 | 0.0% |
| Hispanic or Latino | 3 | 0.8% |
| Native / Alaskan | 0 | 0.0% |
| White / Caucasian | 320 | 87.9% |
| Two or more Races | 11 | 3.0% |
| Some other Race | 3 | 0.8% |
| Total | 364 | 100.0% |
Ancestry in Creekside
The most populous ancestries reported in Creekside are Irish (105 | 28.8%), German (95 | 26.1%), English (69 | 19.0%), Thai (18 | 5.0%), and Ethiopian (15 | 4.1%), together accounting for 83.0% of all Creekside residents.
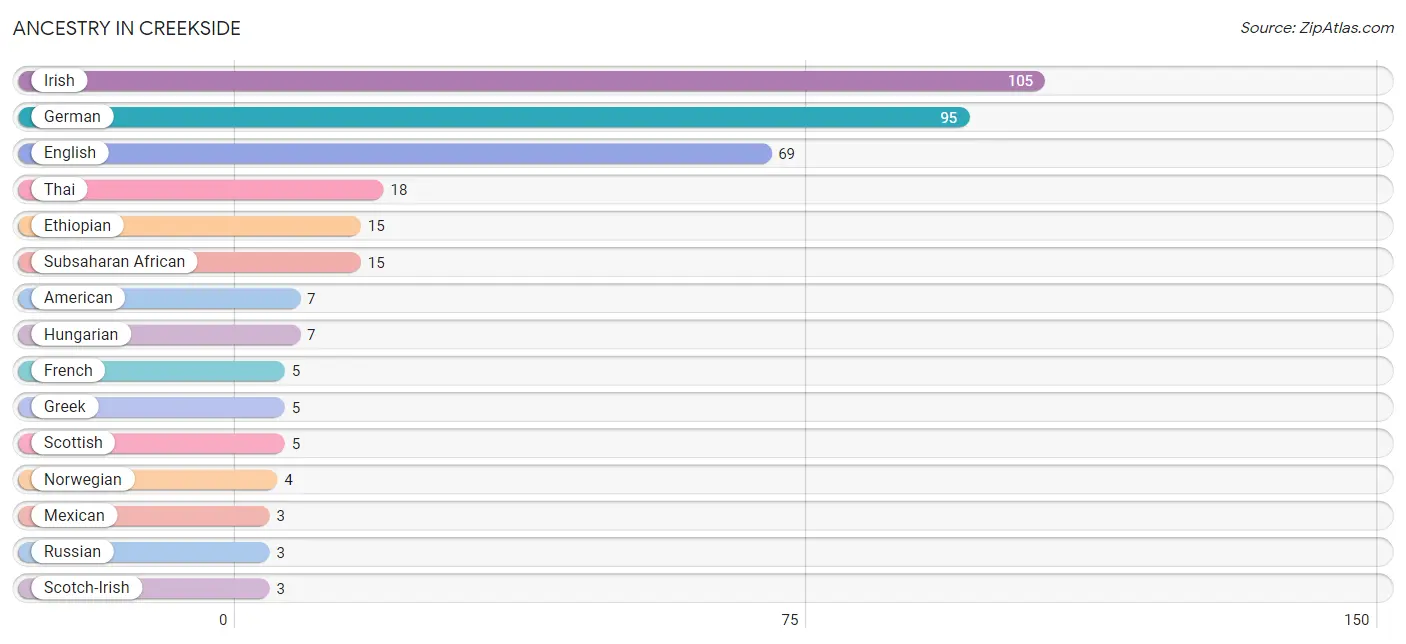
| Ancestry | # Population | % Population |
| American | 7 | 1.9% |
| Arab | 1 | 0.3% |
| Bhutanese | 1 | 0.3% |
| British | 1 | 0.3% |
| Dutch | 1 | 0.3% |
| Eastern European | 2 | 0.5% |
| English | 69 | 19.0% |
| Ethiopian | 15 | 4.1% |
| French | 5 | 1.4% |
| French Canadian | 1 | 0.3% |
| German | 95 | 26.1% |
| Greek | 5 | 1.4% |
| Hungarian | 7 | 1.9% |
| Irish | 105 | 28.8% |
| Italian | 1 | 0.3% |
| Lebanese | 1 | 0.3% |
| Mexican | 3 | 0.8% |
| Northern European | 1 | 0.3% |
| Norwegian | 4 | 1.1% |
| Pakistani | 2 | 0.5% |
| Russian | 3 | 0.8% |
| Scotch-Irish | 3 | 0.8% |
| Scottish | 5 | 1.4% |
| Subsaharan African | 15 | 4.1% |
| Swedish | 1 | 0.3% |
| Thai | 18 | 5.0% |
| Welsh | 1 | 0.3% |
| West Indian | 2 | 0.5% | View All 28 Rows |
Immigrants in Creekside
The most numerous immigrant groups reported in Creekside came from Africa (9 | 2.5%), Asia (8 | 2.2%), Eastern Africa (8 | 2.2%), Eritrea (8 | 2.2%), and Eastern Asia (5 | 1.4%), together accounting for 10.4% of all Creekside residents.
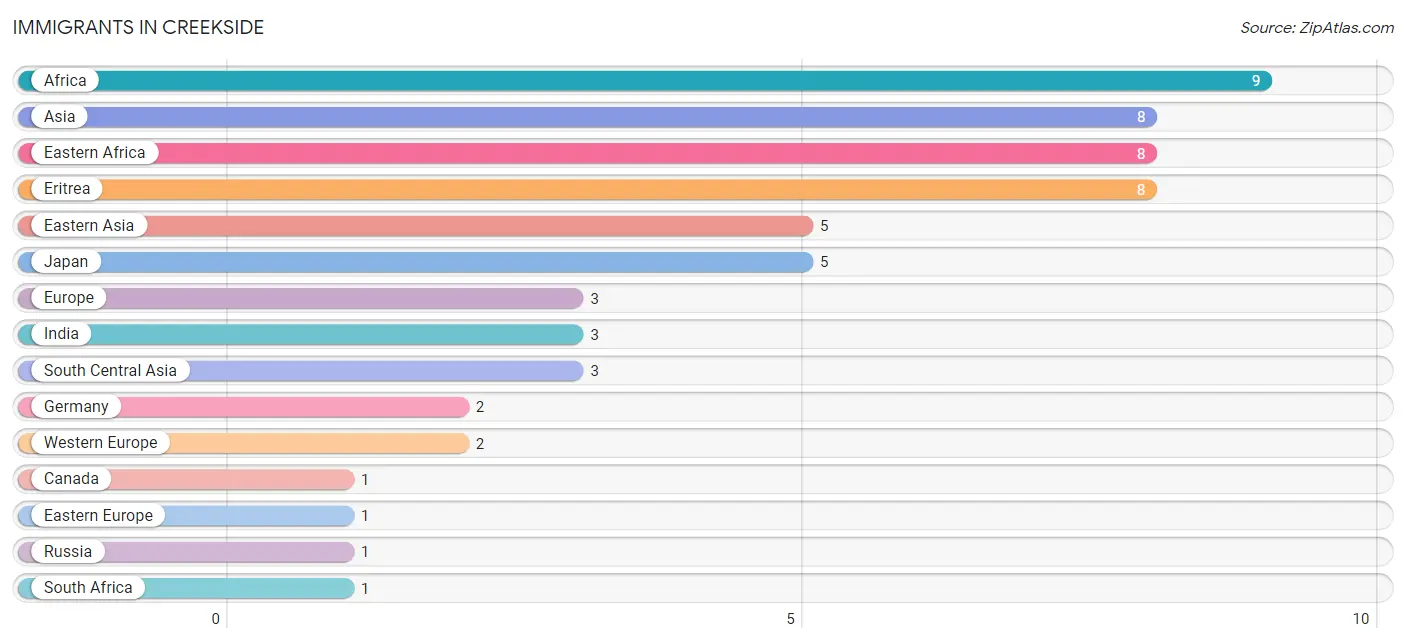
| Immigration Origin | # Population | % Population |
| Africa | 9 | 2.5% |
| Asia | 8 | 2.2% |
| Canada | 1 | 0.3% |
| Eastern Africa | 8 | 2.2% |
| Eastern Asia | 5 | 1.4% |
| Eastern Europe | 1 | 0.3% |
| Eritrea | 8 | 2.2% |
| Europe | 3 | 0.8% |
| Germany | 2 | 0.5% |
| India | 3 | 0.8% |
| Japan | 5 | 1.4% |
| Russia | 1 | 0.3% |
| South Africa | 1 | 0.3% |
| South Central Asia | 3 | 0.8% |
| Western Europe | 2 | 0.5% | View All 15 Rows |
Sex and Age in Creekside
Sex and Age in Creekside
The most populous age groups in Creekside are 60 to 64 Years (33 | 16.6%) for men and 60 to 64 Years (34 | 20.6%) for women.
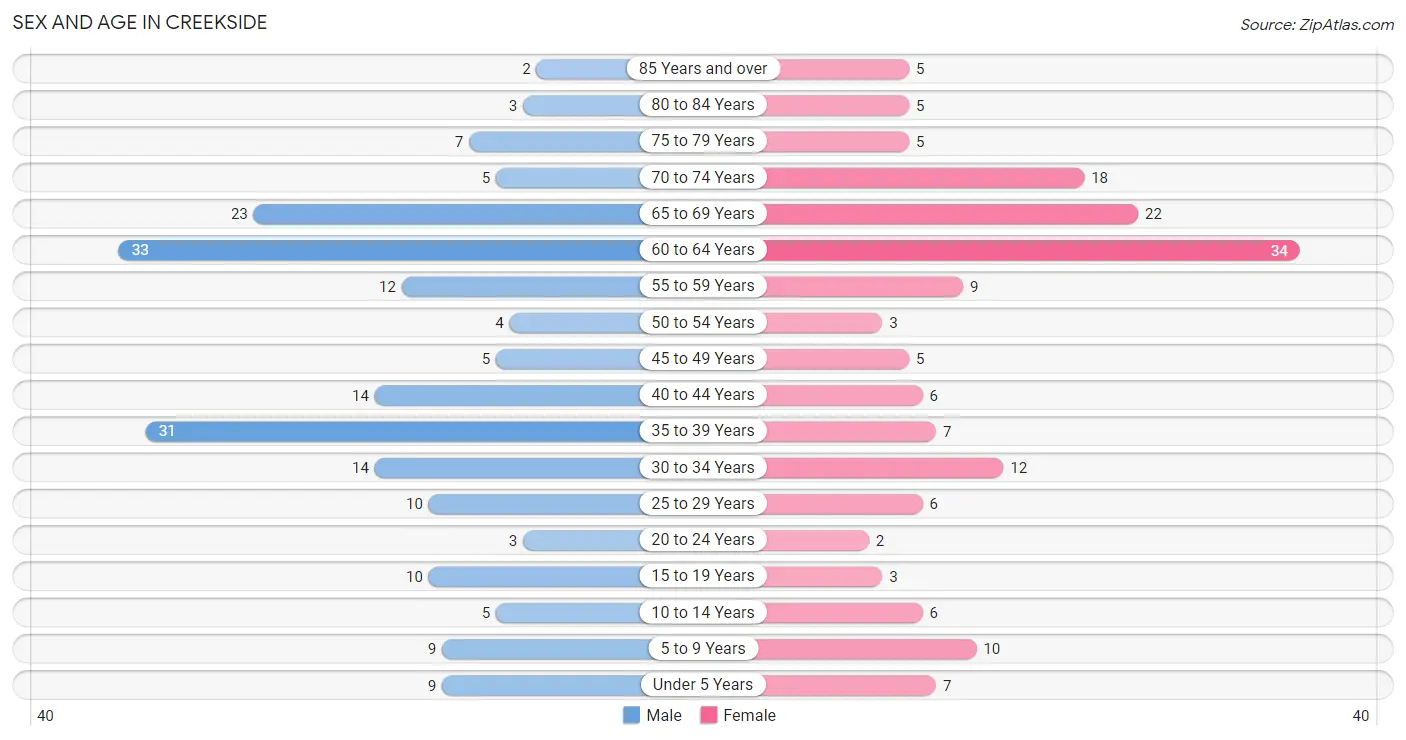
| Age Bracket | Male | Female |
| Under 5 Years | 9 (4.5%) | 7 (4.2%) |
| 5 to 9 Years | 9 (4.5%) | 10 (6.1%) |
| 10 to 14 Years | 5 (2.5%) | 6 (3.6%) |
| 15 to 19 Years | 10 (5.0%) | 3 (1.8%) |
| 20 to 24 Years | 3 (1.5%) | 2 (1.2%) |
| 25 to 29 Years | 10 (5.0%) | 6 (3.6%) |
| 30 to 34 Years | 14 (7.0%) | 12 (7.3%) |
| 35 to 39 Years | 31 (15.6%) | 7 (4.2%) |
| 40 to 44 Years | 14 (7.0%) | 6 (3.6%) |
| 45 to 49 Years | 5 (2.5%) | 5 (3.0%) |
| 50 to 54 Years | 4 (2.0%) | 3 (1.8%) |
| 55 to 59 Years | 12 (6.0%) | 9 (5.4%) |
| 60 to 64 Years | 33 (16.6%) | 34 (20.6%) |
| 65 to 69 Years | 23 (11.6%) | 22 (13.3%) |
| 70 to 74 Years | 5 (2.5%) | 18 (10.9%) |
| 75 to 79 Years | 7 (3.5%) | 5 (3.0%) |
| 80 to 84 Years | 3 (1.5%) | 5 (3.0%) |
| 85 Years and over | 2 (1.0%) | 5 (3.0%) |
| Total | 199 (100.0%) | 165 (100.0%) |
Families and Households in Creekside
Median Family Size in Creekside
The median family size in Creekside is 2.74 persons per family, with married-couple families (98 | 81.7%) accounting for the largest median family size of 2.89 persons per family. On the other hand, single female/mother families (6 | 5.0%) represent the smallest median family size with 2.00 persons per family.
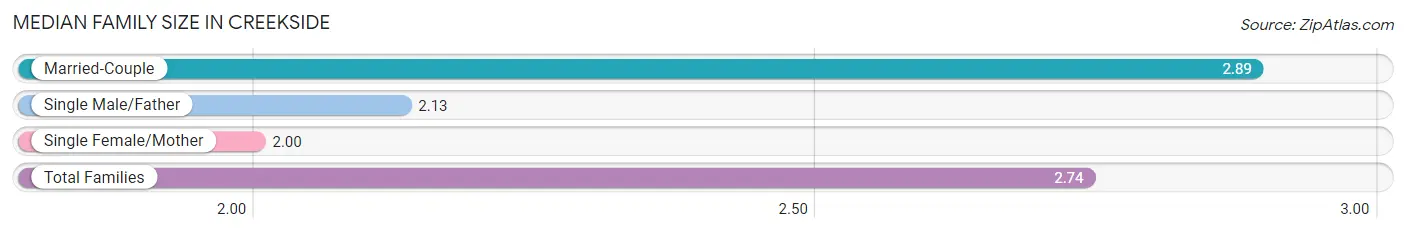
| Family Type | # Families | Family Size |
| Married-Couple | 98 (81.7%) | 2.89 |
| Single Male/Father | 16 (13.3%) | 2.13 |
| Single Female/Mother | 6 (5.0%) | 2.00 |
| Total Families | 120 (100.0%) | 2.74 |
Median Household Size in Creekside
The median household size in Creekside is 2.46 persons per household, with married-couple households (98 | 66.2%) accounting for the largest median household size of 2.89 persons per household. non-family households (28 | 18.9%) represent the smallest median household size with 1.11 persons per household.
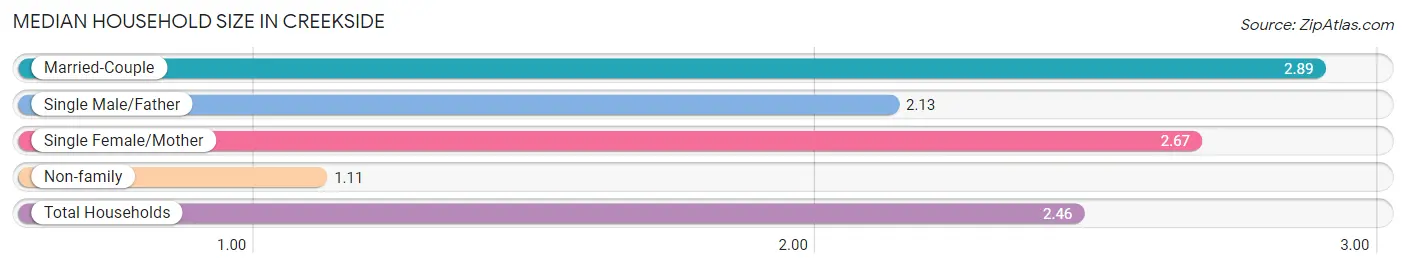
| Household Type | # Households | Household Size |
| Married-Couple | 98 (66.2%) | 2.89 |
| Single Male/Father | 16 (10.8%) | 2.13 |
| Single Female/Mother | 6 (4.1%) | 2.67 |
| Non-family | 28 (18.9%) | 1.11 |
| Total Households | 148 (100.0%) | 2.46 |
Household Size by Marriage Status in Creekside
Out of a total of 148 households in Creekside, 120 (81.1%) are family households, while 28 (18.9%) are nonfamily households. The most numerous type of family households are 2-person households, comprising 62, and the most common type of nonfamily households are 1-person households, comprising 26.
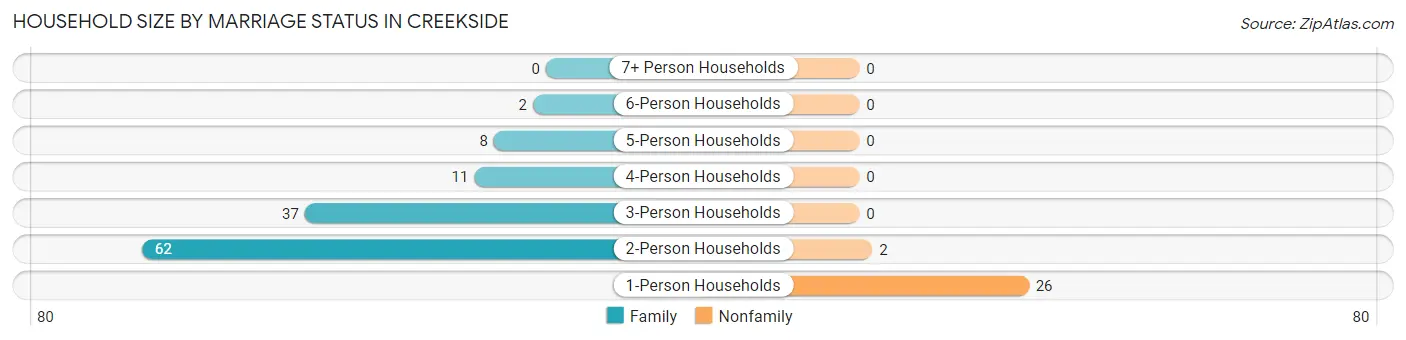
| Household Size | Family Households | Nonfamily Households |
| 1-Person Households | - | 26 (17.6%) |
| 2-Person Households | 62 (41.9%) | 2 (1.3%) |
| 3-Person Households | 37 (25.0%) | 0 (0.0%) |
| 4-Person Households | 11 (7.4%) | 0 (0.0%) |
| 5-Person Households | 8 (5.4%) | 0 (0.0%) |
| 6-Person Households | 2 (1.3%) | 0 (0.0%) |
| 7+ Person Households | 0 (0.0%) | 0 (0.0%) |
| Total | 120 (81.1%) | 28 (18.9%) |
Female Fertility in Creekside
Fertility by Age in Creekside
Average fertility rate in Creekside is 244.0 births per 1,000 women. Women in the age bracket of 35 to 50 years have the highest fertility rate with 333.0 births per 1,000 women. Women in the age bracket of 35 to 50 years acount for 60.0% of all women with births.
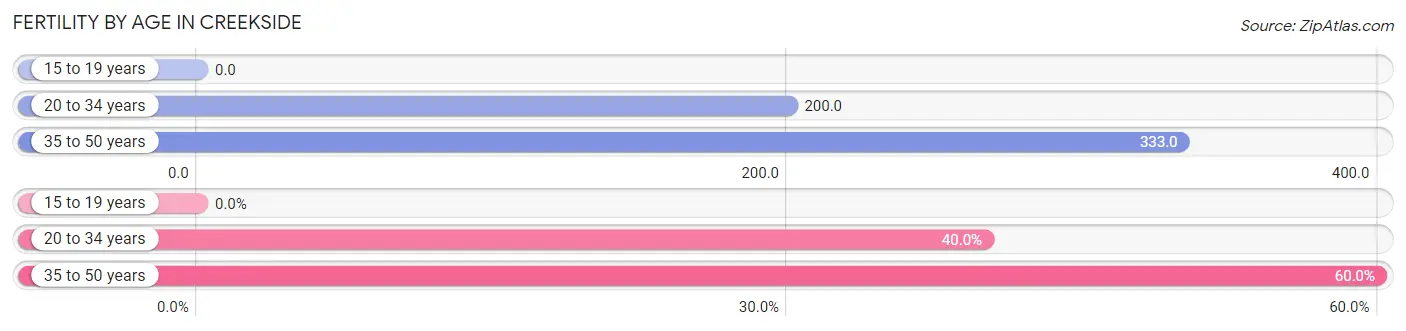
| Age Bracket | Women with Births | Births / 1,000 Women |
| 15 to 19 years | 0 (0.0%) | 0.0 |
| 20 to 34 years | 4 (40.0%) | 200.0 |
| 35 to 50 years | 6 (60.0%) | 333.0 |
| Total | 10 (100.0%) | 244.0 |
Fertility by Age by Marriage Status in Creekside
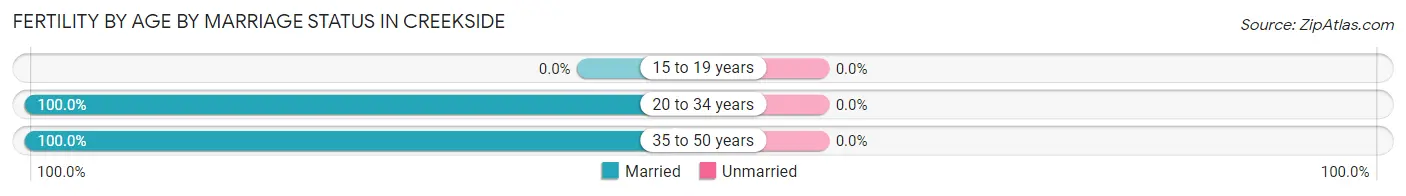
| Age Bracket | Married | Unmarried |
| 15 to 19 years | 0 (0.0%) | 0 (0.0%) |
| 20 to 34 years | 4 (100.0%) | 0 (0.0%) |
| 35 to 50 years | 6 (100.0%) | 0 (0.0%) |
| Total | 10 (100.0%) | 0 (0.0%) |
Fertility by Education in Creekside
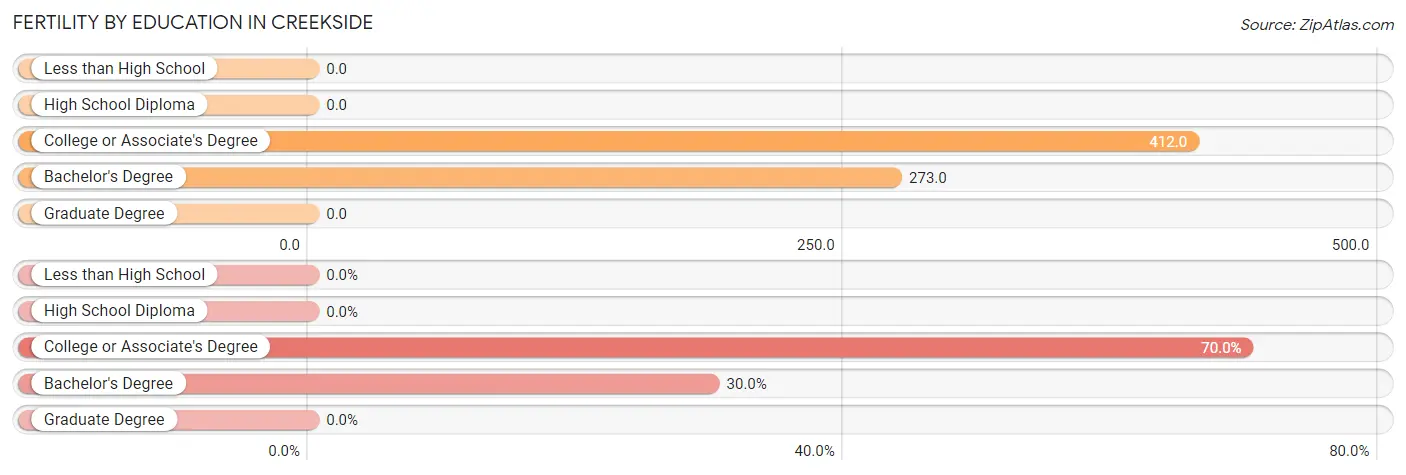
| Educational Attainment | Women with Births | Births / 1,000 Women |
| Less than High School | 0 (0.0%) | 0.0 |
| High School Diploma | 0 (0.0%) | 0.0 |
| College or Associate's Degree | 7 (70.0%) | 412.0 |
| Bachelor's Degree | 3 (30.0%) | 273.0 |
| Graduate Degree | 0 (0.0%) | 0.0 |
| Total | 10 (100.0%) | 244.0 |
Fertility by Education by Marriage Status in Creekside
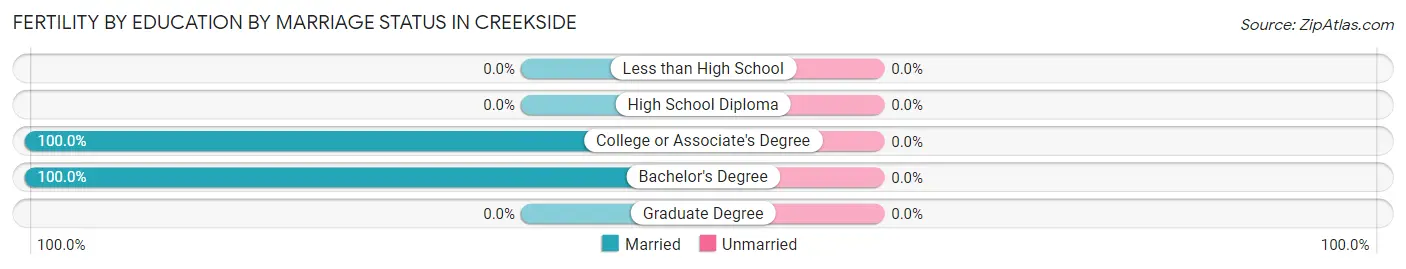
| Educational Attainment | Married | Unmarried |
| Less than High School | 0 (0.0%) | 0 (0.0%) |
| High School Diploma | 0 (0.0%) | 0 (0.0%) |
| College or Associate's Degree | 7 (100.0%) | 0 (0.0%) |
| Bachelor's Degree | 3 (100.0%) | 0 (0.0%) |
| Graduate Degree | 0 (0.0%) | 0 (0.0%) |
| Total | 10 (100.0%) | 0 (0.0%) |
Employment Characteristics in Creekside
Employment by Class of Employer in Creekside
Among the 191 employed individuals in Creekside, private company employees (121 | 63.3%), self-employed (not incorporated) (20 | 10.5%), and self-employed (incorporated) (17 | 8.9%) make up the most common classes of employment.
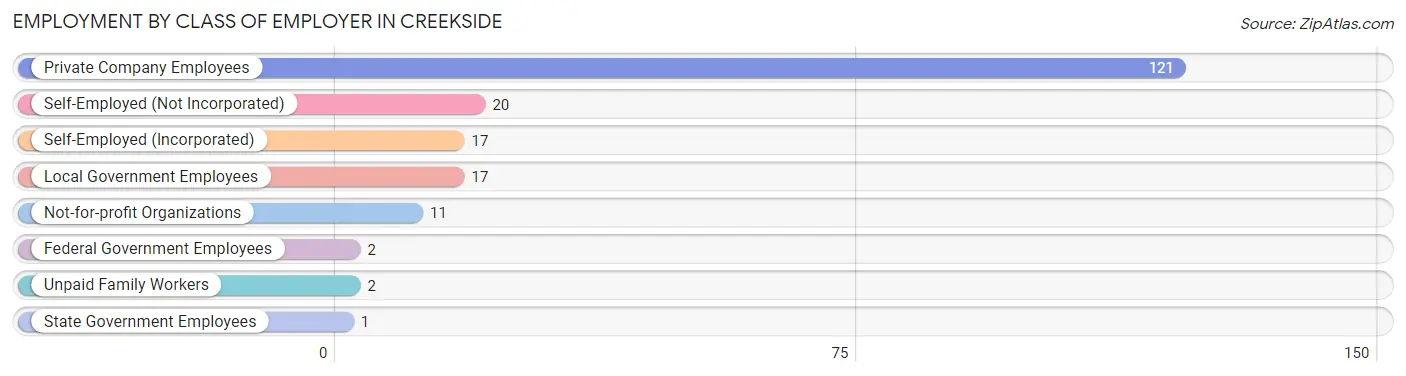
| Employer Class | # Employees | % Employees |
| Private Company Employees | 121 | 63.3% |
| Self-Employed (Incorporated) | 17 | 8.9% |
| Self-Employed (Not Incorporated) | 20 | 10.5% |
| Not-for-profit Organizations | 11 | 5.8% |
| Local Government Employees | 17 | 8.9% |
| State Government Employees | 1 | 0.5% |
| Federal Government Employees | 2 | 1.1% |
| Unpaid Family Workers | 2 | 1.1% |
| Total | 191 | 100.0% |
Employment Status by Age in Creekside
According to the labor force statistics for Creekside, out of the total population over 16 years of age (314), 72.6% or 228 individuals are in the labor force, with 6.6% or 15 of them unemployed. The age group with the highest labor force participation rate is 20 to 24 years, with 100.0% or 5 individuals in the labor force. Within the labor force, the 30 to 34 years age range has the highest percentage of unemployed individuals, with 34.6% or 9 of them being unemployed.
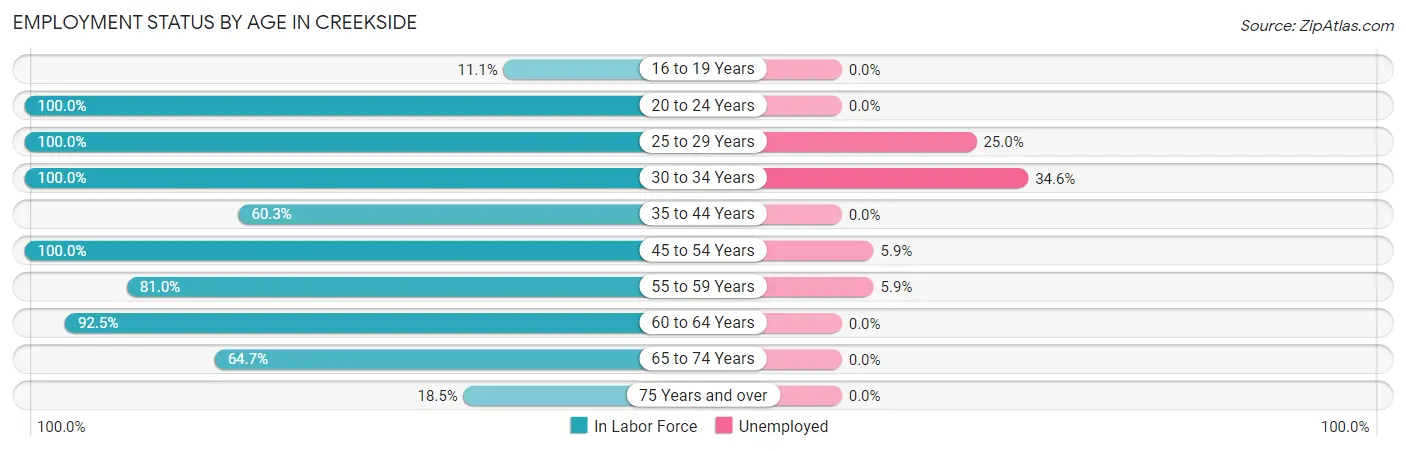
| Age Bracket | In Labor Force | Unemployed |
| 16 to 19 Years | 1 (11.1%) | 0 (0.0%) |
| 20 to 24 Years | 5 (100.0%) | 0 (0.0%) |
| 25 to 29 Years | 16 (100.0%) | 4 (25.0%) |
| 30 to 34 Years | 26 (100.0%) | 9 (34.6%) |
| 35 to 44 Years | 35 (60.3%) | 0 (0.0%) |
| 45 to 54 Years | 17 (100.0%) | 1 (5.9%) |
| 55 to 59 Years | 17 (81.0%) | 1 (5.9%) |
| 60 to 64 Years | 62 (92.5%) | 0 (0.0%) |
| 65 to 74 Years | 44 (64.7%) | 0 (0.0%) |
| 75 Years and over | 5 (18.5%) | 0 (0.0%) |
| Total | 228 (72.6%) | 15 (6.6%) |
Employment Status by Educational Attainment in Creekside
According to labor force statistics for Creekside, 84.4% of individuals (173) out of the total population between 25 and 64 years of age (205) are in the labor force, with 8.7% or 15 of them being unemployed. The group with the highest labor force participation rate are those with the educational attainment of less than high school, with 100.0% or 3 individuals in the labor force. Within the labor force, individuals with bachelor's degree or higher education have the highest percentage of unemployment, with 18.2% or 14 of them being unemployed.
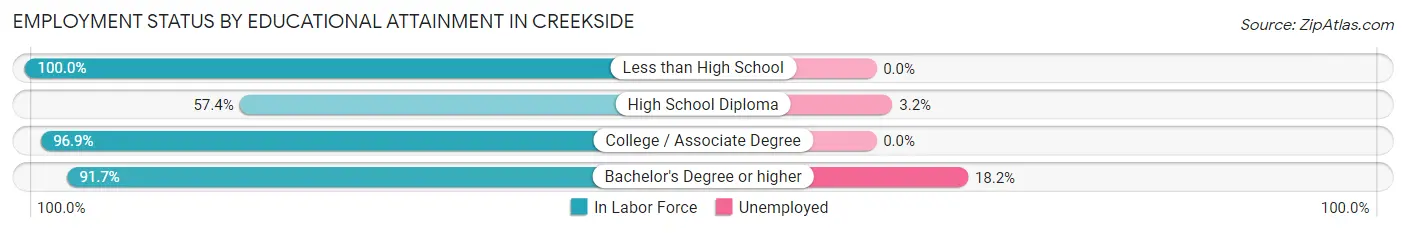
| Educational Attainment | In Labor Force | Unemployed |
| Less than High School | 3 (100.0%) | 0 (0.0%) |
| High School Diploma | 31 (57.4%) | 2 (3.2%) |
| College / Associate Degree | 62 (96.9%) | 0 (0.0%) |
| Bachelor's Degree or higher | 77 (91.7%) | 15 (18.2%) |
| Total | 173 (84.4%) | 18 (8.7%) |
Employment Occupations by Sex in Creekside
Management, Business, Science and Arts Occupations
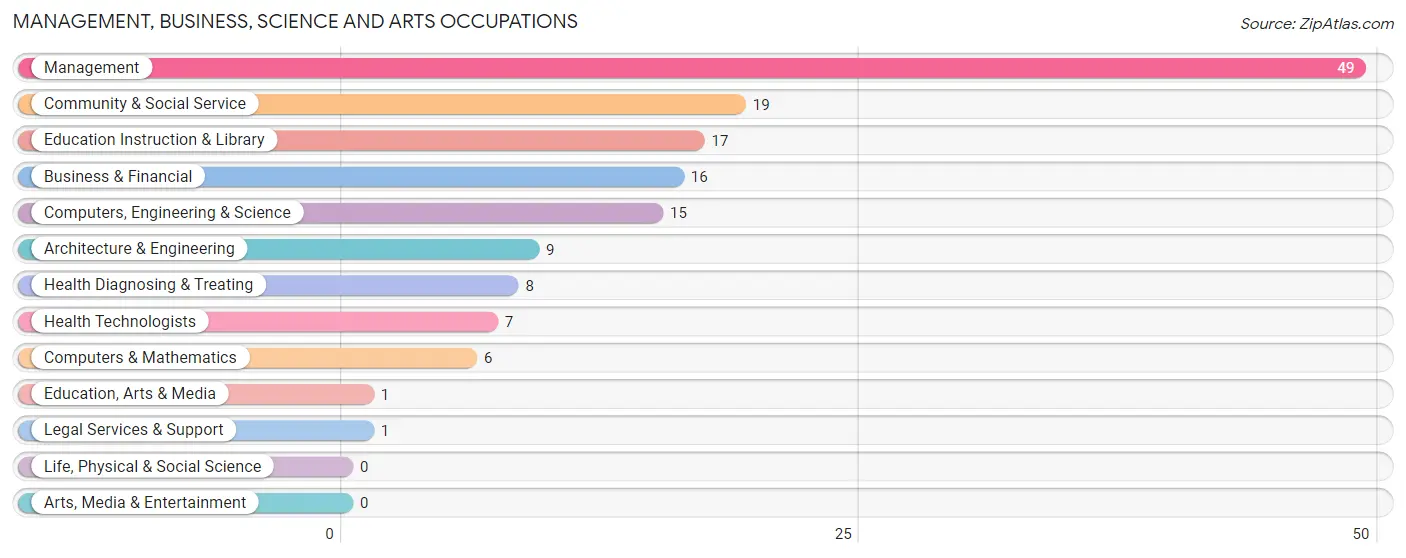
The most common Management, Business, Science and Arts occupations in Creekside are Management (49 | 23.0%), Community & Social Service (19 | 8.9%), Education Instruction & Library (17 | 8.0%), Business & Financial (16 | 7.5%), and Computers, Engineering & Science (15 | 7.0%).
Management, Business, Science and Arts Occupations by Sex
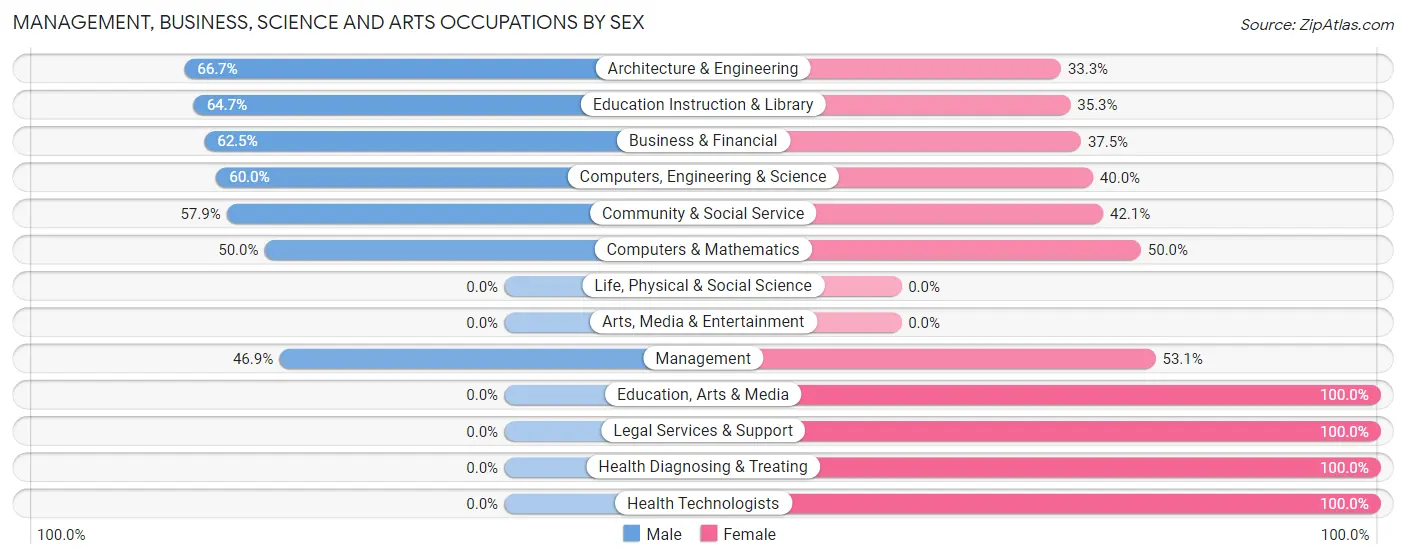
Within the Management, Business, Science and Arts occupations in Creekside, the most male-oriented occupations are Architecture & Engineering (66.7%), Education Instruction & Library (64.7%), and Business & Financial (62.5%), while the most female-oriented occupations are Education, Arts & Media (100.0%), Legal Services & Support (100.0%), and Health Diagnosing & Treating (100.0%).
| Occupation | Male | Female |
| Management | 23 (46.9%) | 26 (53.1%) |
| Business & Financial | 10 (62.5%) | 6 (37.5%) |
| Computers, Engineering & Science | 9 (60.0%) | 6 (40.0%) |
| Computers & Mathematics | 3 (50.0%) | 3 (50.0%) |
| Architecture & Engineering | 6 (66.7%) | 3 (33.3%) |
| Life, Physical & Social Science | 0 (0.0%) | 0 (0.0%) |
| Community & Social Service | 11 (57.9%) | 8 (42.1%) |
| Education, Arts & Media | 0 (0.0%) | 1 (100.0%) |
| Legal Services & Support | 0 (0.0%) | 1 (100.0%) |
| Education Instruction & Library | 11 (64.7%) | 6 (35.3%) |
| Arts, Media & Entertainment | 0 (0.0%) | 0 (0.0%) |
| Health Diagnosing & Treating | 0 (0.0%) | 8 (100.0%) |
| Health Technologists | 0 (0.0%) | 7 (100.0%) |
| Total (Category) | 53 (49.5%) | 54 (50.5%) |
| Total (Overall) | 108 (50.7%) | 105 (49.3%) |
Services Occupations
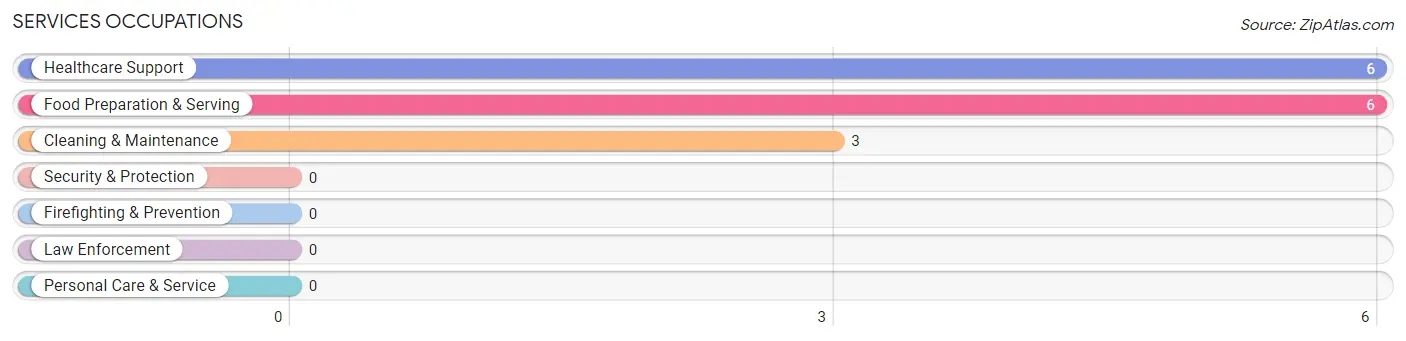
The most common Services occupations in Creekside are Healthcare Support (6 | 2.8%), Food Preparation & Serving (6 | 2.8%), and Cleaning & Maintenance (3 | 1.4%).
Services Occupations by Sex
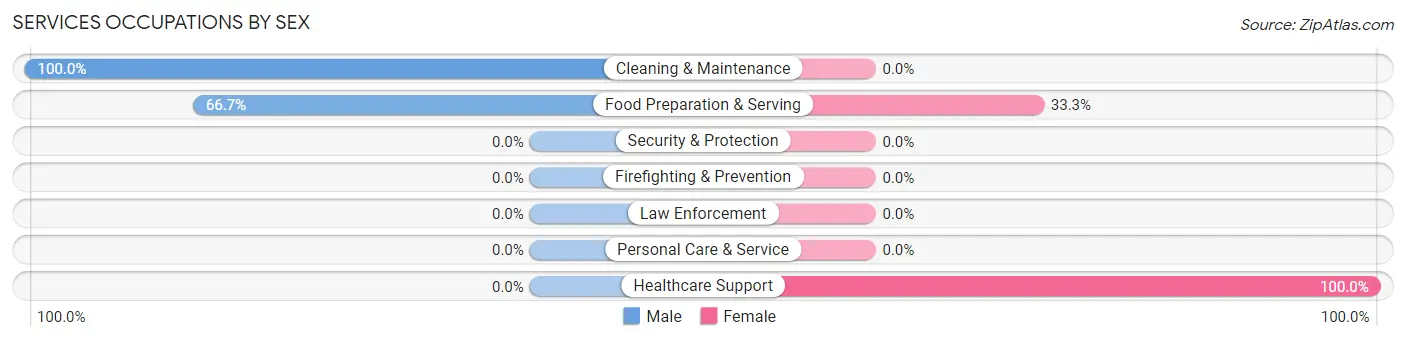
Within the Services occupations in Creekside, the most male-oriented occupations are Cleaning & Maintenance (100.0%), and Food Preparation & Serving (66.7%), while the most female-oriented occupations are Healthcare Support (100.0%), and Food Preparation & Serving (33.3%).
| Occupation | Male | Female |
| Healthcare Support | 0 (0.0%) | 6 (100.0%) |
| Security & Protection | 0 (0.0%) | 0 (0.0%) |
| Firefighting & Prevention | 0 (0.0%) | 0 (0.0%) |
| Law Enforcement | 0 (0.0%) | 0 (0.0%) |
| Food Preparation & Serving | 4 (66.7%) | 2 (33.3%) |
| Cleaning & Maintenance | 3 (100.0%) | 0 (0.0%) |
| Personal Care & Service | 0 (0.0%) | 0 (0.0%) |
| Total (Category) | 7 (46.7%) | 8 (53.3%) |
| Total (Overall) | 108 (50.7%) | 105 (49.3%) |
Sales and Office Occupations
The most common Sales and Office occupations in Creekside are Office & Administration (36 | 16.9%), and Sales & Related (17 | 8.0%).
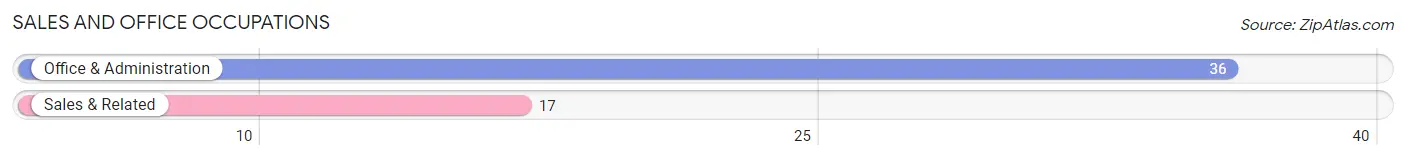
Sales and Office Occupations by Sex
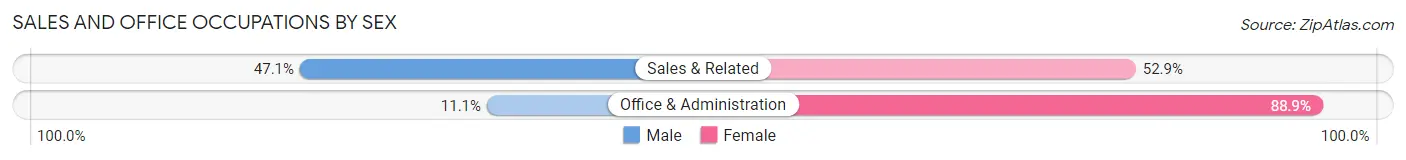
| Occupation | Male | Female |
| Sales & Related | 8 (47.1%) | 9 (52.9%) |
| Office & Administration | 4 (11.1%) | 32 (88.9%) |
| Total (Category) | 12 (22.6%) | 41 (77.4%) |
| Total (Overall) | 108 (50.7%) | 105 (49.3%) |
Natural Resources, Construction and Maintenance Occupations
The most common Natural Resources, Construction and Maintenance occupations in Creekside are Construction & Extraction (13 | 6.1%), and Installation, Maintenance & Repair (1 | 0.5%).
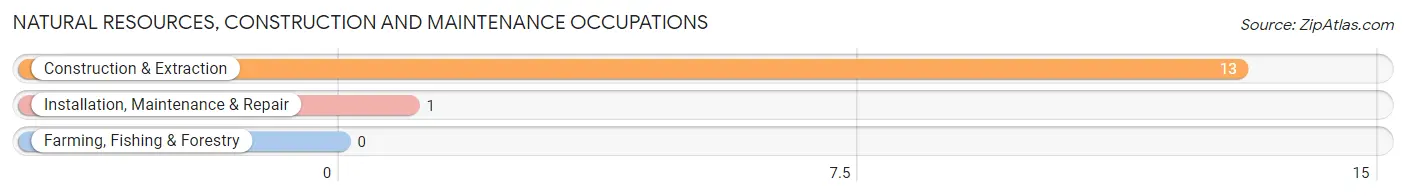
Natural Resources, Construction and Maintenance Occupations by Sex
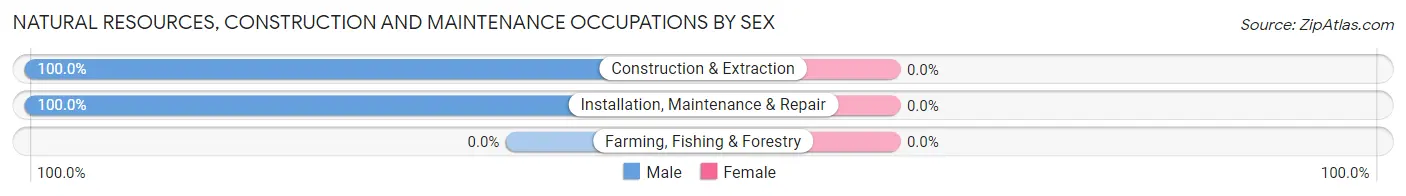
| Occupation | Male | Female |
| Farming, Fishing & Forestry | 0 (0.0%) | 0 (0.0%) |
| Construction & Extraction | 13 (100.0%) | 0 (0.0%) |
| Installation, Maintenance & Repair | 1 (100.0%) | 0 (0.0%) |
| Total (Category) | 14 (100.0%) | 0 (0.0%) |
| Total (Overall) | 108 (50.7%) | 105 (49.3%) |
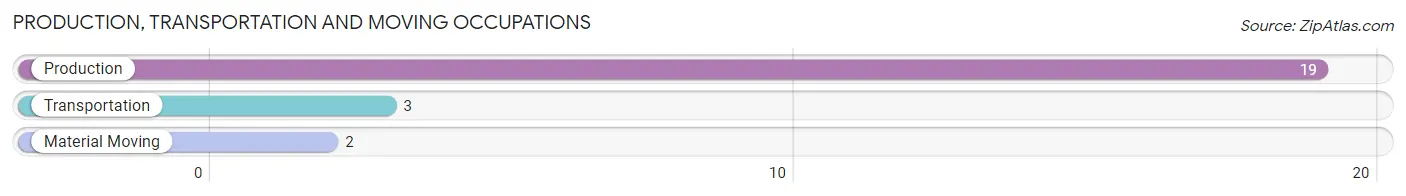
Production, Transportation and Moving Occupations
The most common Production, Transportation and Moving occupations in Creekside are Production (19 | 8.9%), Transportation (3 | 1.4%), and Material Moving (2 | 0.9%).
Production, Transportation and Moving Occupations by Sex
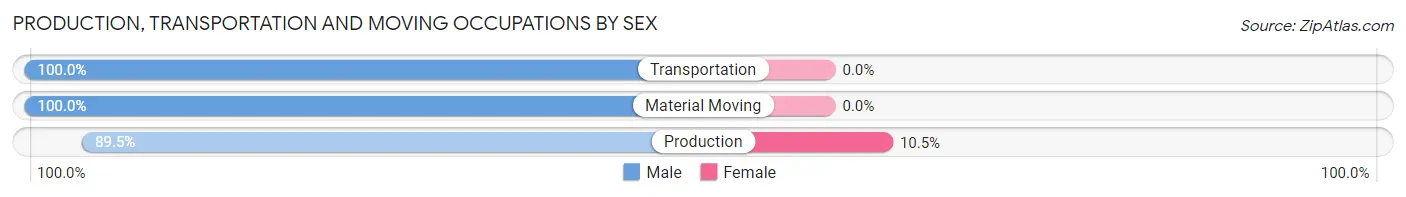
| Occupation | Male | Female |
| Production | 17 (89.5%) | 2 (10.5%) |
| Transportation | 3 (100.0%) | 0 (0.0%) |
| Material Moving | 2 (100.0%) | 0 (0.0%) |
| Total (Category) | 22 (91.7%) | 2 (8.3%) |
| Total (Overall) | 108 (50.7%) | 105 (49.3%) |
Employment Industries by Sex in Creekside
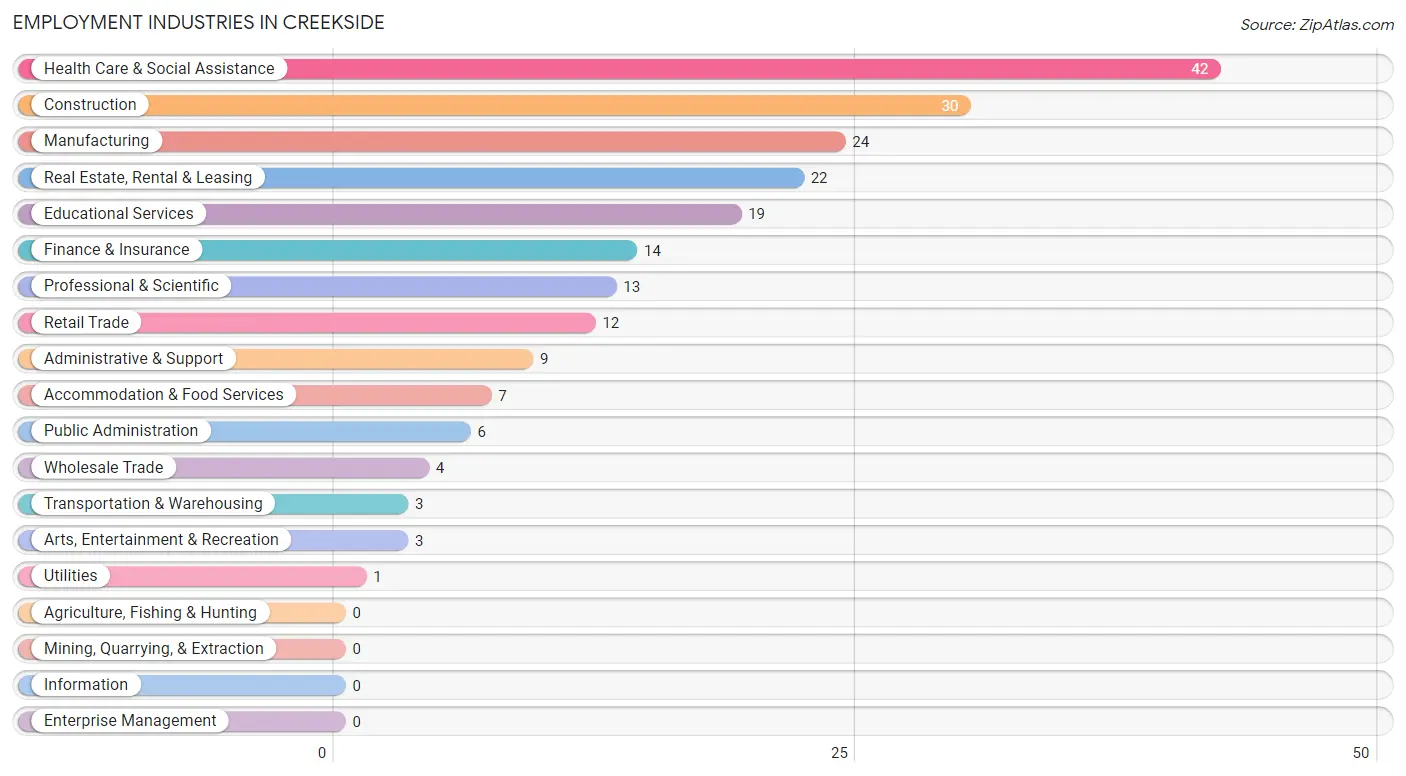
Employment Industries in Creekside
The major employment industries in Creekside include Health Care & Social Assistance (42 | 19.7%), Construction (30 | 14.1%), Manufacturing (24 | 11.3%), Real Estate, Rental & Leasing (22 | 10.3%), and Educational Services (19 | 8.9%).
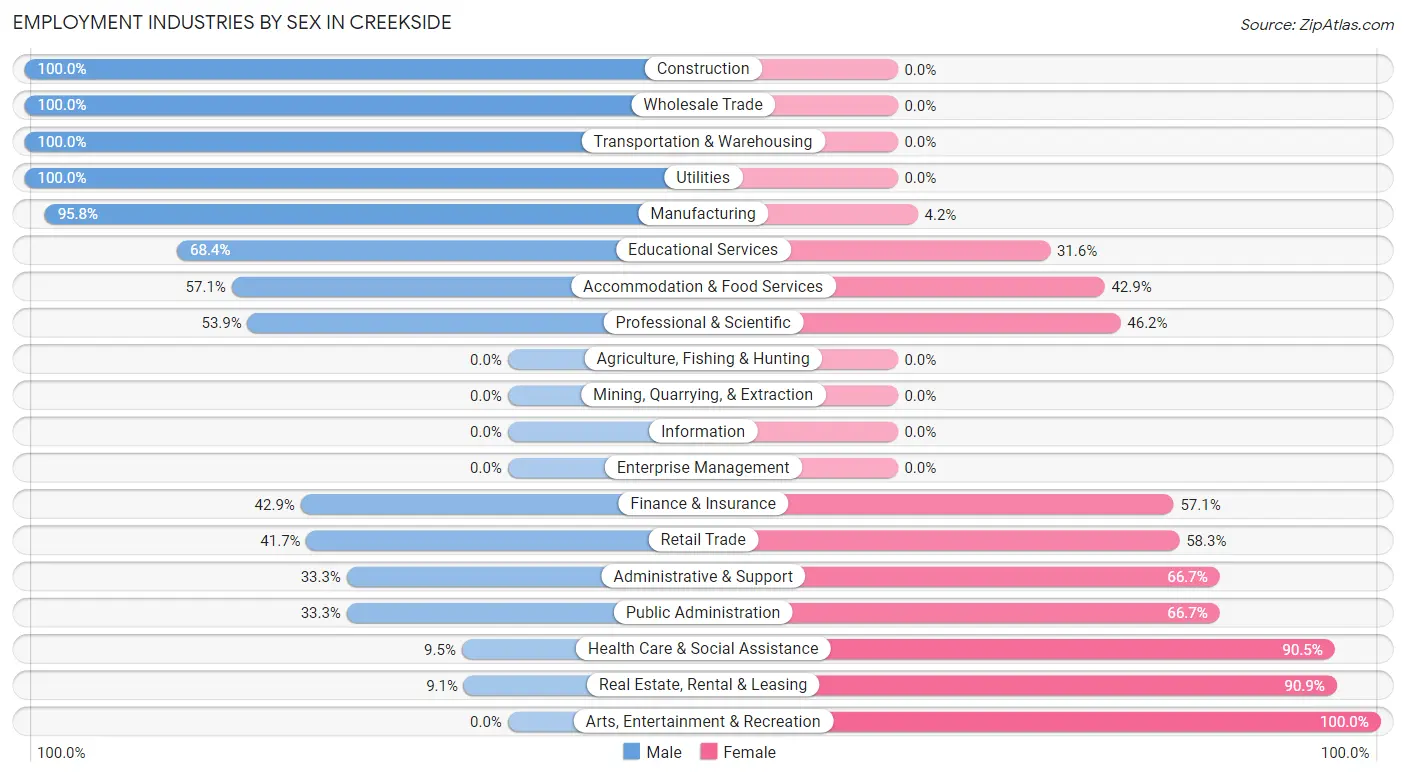
Employment Industries by Sex in Creekside
The Creekside industries that see more men than women are Construction (100.0%), Wholesale Trade (100.0%), and Transportation & Warehousing (100.0%), whereas the industries that tend to have a higher number of women are Arts, Entertainment & Recreation (100.0%), Real Estate, Rental & Leasing (90.9%), and Health Care & Social Assistance (90.5%).
| Industry | Male | Female |
| Agriculture, Fishing & Hunting | 0 (0.0%) | 0 (0.0%) |
| Mining, Quarrying, & Extraction | 0 (0.0%) | 0 (0.0%) |
| Construction | 30 (100.0%) | 0 (0.0%) |
| Manufacturing | 23 (95.8%) | 1 (4.2%) |
| Wholesale Trade | 4 (100.0%) | 0 (0.0%) |
| Retail Trade | 5 (41.7%) | 7 (58.3%) |
| Transportation & Warehousing | 3 (100.0%) | 0 (0.0%) |
| Utilities | 1 (100.0%) | 0 (0.0%) |
| Information | 0 (0.0%) | 0 (0.0%) |
| Finance & Insurance | 6 (42.9%) | 8 (57.1%) |
| Real Estate, Rental & Leasing | 2 (9.1%) | 20 (90.9%) |
| Professional & Scientific | 7 (53.8%) | 6 (46.2%) |
| Enterprise Management | 0 (0.0%) | 0 (0.0%) |
| Administrative & Support | 3 (33.3%) | 6 (66.7%) |
| Educational Services | 13 (68.4%) | 6 (31.6%) |
| Health Care & Social Assistance | 4 (9.5%) | 38 (90.5%) |
| Arts, Entertainment & Recreation | 0 (0.0%) | 3 (100.0%) |
| Accommodation & Food Services | 4 (57.1%) | 3 (42.9%) |
| Public Administration | 2 (33.3%) | 4 (66.7%) |
| Total | 108 (50.7%) | 105 (49.3%) |
Education in Creekside
School Enrollment in Creekside
The most common levels of schooling among the 58 students in Creekside are high school (13 | 22.4%), graduate / professional (13 | 22.4%), and elementary school (12 | 20.7%).
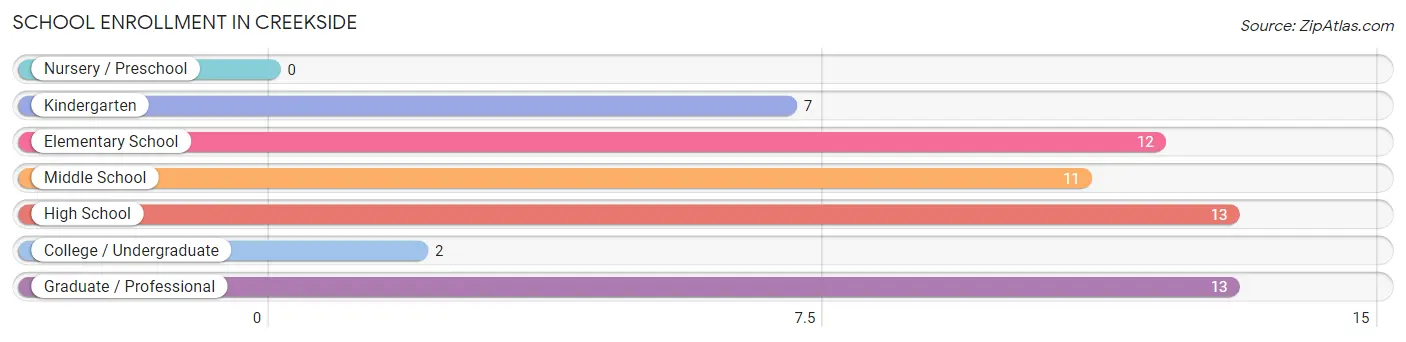
| School Level | # Students | % Students |
| Nursery / Preschool | 0 | 0.0% |
| Kindergarten | 7 | 12.1% |
| Elementary School | 12 | 20.7% |
| Middle School | 11 | 19.0% |
| High School | 13 | 22.4% |
| College / Undergraduate | 2 | 3.5% |
| Graduate / Professional | 13 | 22.4% |
| Total | 58 | 100.0% |
School Enrollment by Age by Funding Source in Creekside
Out of a total of 58 students who are enrolled in schools in Creekside, 14 (24.1%) attend a private institution, while the remaining 44 (75.9%) are enrolled in public schools. The age group of 25 to 34 year olds has the highest likelihood of being enrolled in private schools, with 10 (100.0% in the age bracket) enrolled. Conversely, the age group of 5 to 9 year old has the lowest likelihood of being enrolled in a private school, with 19 (100.0% in the age bracket) attending a public institution.
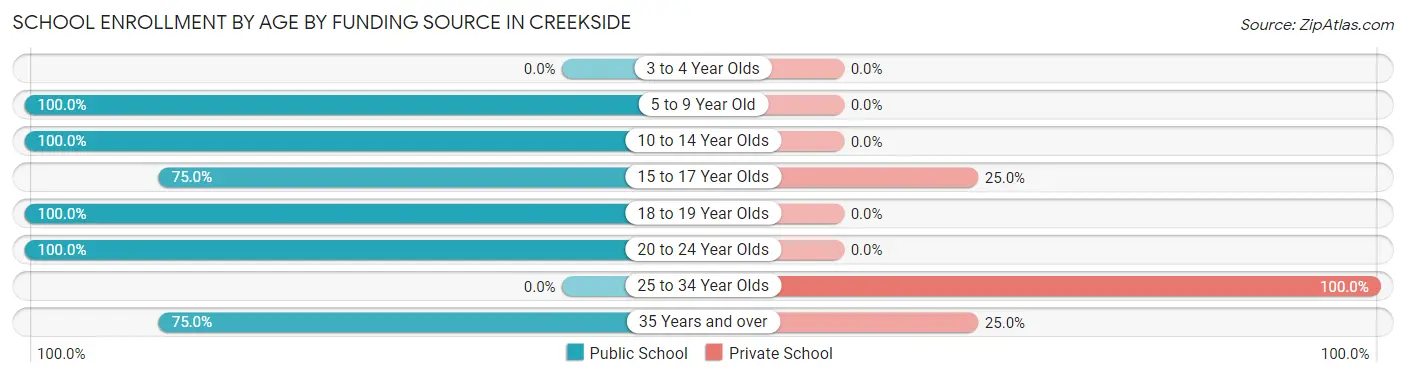
| Age Bracket | Public School | Private School |
| 3 to 4 Year Olds | 0 (0.0%) | 0 (0.0%) |
| 5 to 9 Year Old | 19 (100.0%) | 0 (0.0%) |
| 10 to 14 Year Olds | 11 (100.0%) | 0 (0.0%) |
| 15 to 17 Year Olds | 9 (75.0%) | 3 (25.0%) |
| 18 to 19 Year Olds | 1 (100.0%) | 0 (0.0%) |
| 20 to 24 Year Olds | 1 (100.0%) | 0 (0.0%) |
| 25 to 34 Year Olds | 0 (0.0%) | 10 (100.0%) |
| 35 Years and over | 3 (75.0%) | 1 (25.0%) |
| Total | 44 (75.9%) | 14 (24.1%) |
Educational Attainment by Field of Study in Creekside
Social sciences (22 | 18.6%), business (22 | 18.6%), education (15 | 12.7%), science & technology (14 | 11.9%), and liberal arts & history (10 | 8.5%) are the most common fields of study among 118 individuals in Creekside who have obtained a bachelor's degree or higher.
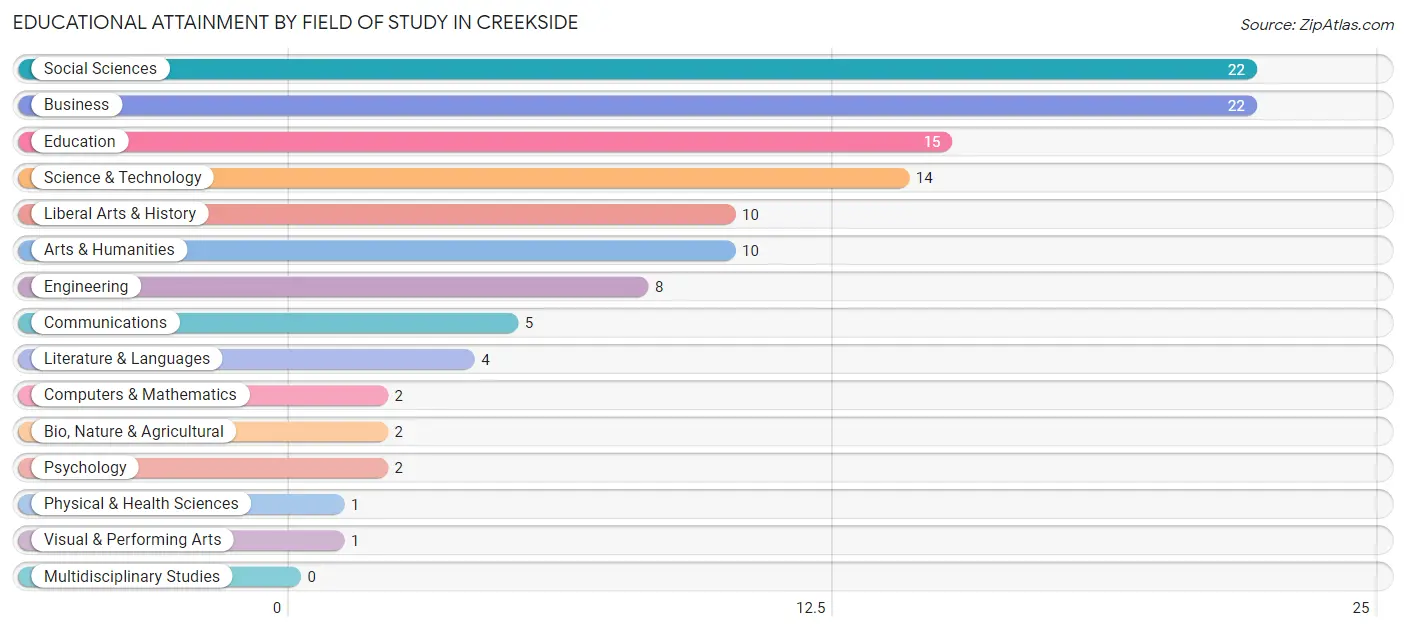
| Field of Study | # Graduates | % Graduates |
| Computers & Mathematics | 2 | 1.7% |
| Bio, Nature & Agricultural | 2 | 1.7% |
| Physical & Health Sciences | 1 | 0.9% |
| Psychology | 2 | 1.7% |
| Social Sciences | 22 | 18.6% |
| Engineering | 8 | 6.8% |
| Multidisciplinary Studies | 0 | 0.0% |
| Science & Technology | 14 | 11.9% |
| Business | 22 | 18.6% |
| Education | 15 | 12.7% |
| Literature & Languages | 4 | 3.4% |
| Liberal Arts & History | 10 | 8.5% |
| Visual & Performing Arts | 1 | 0.9% |
| Communications | 5 | 4.2% |
| Arts & Humanities | 10 | 8.5% |
| Total | 118 | 100.0% |
Transportation & Commute in Creekside
Vehicle Availability by Sex in Creekside
The most prevalent vehicle ownership categories in Creekside are males with 3 vehicles (52, accounting for 48.1%) and females with 3 vehicles (29, making up 62.6%).
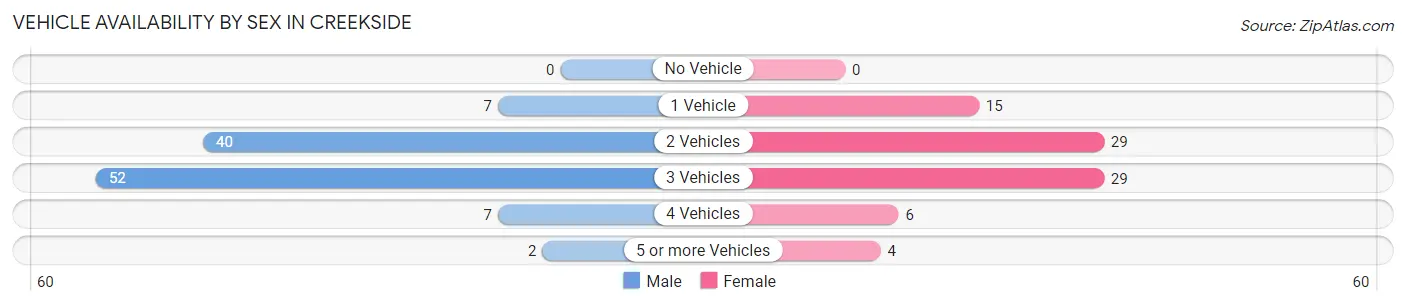
| Vehicles Available | Male | Female |
| No Vehicle | 0 (0.0%) | 0 (0.0%) |
| 1 Vehicle | 7 (6.5%) | 15 (18.1%) |
| 2 Vehicles | 40 (37.0%) | 29 (34.9%) |
| 3 Vehicles | 52 (48.1%) | 29 (34.9%) |
| 4 Vehicles | 7 (6.5%) | 6 (7.2%) |
| 5 or more Vehicles | 2 (1.8%) | 4 (4.8%) |
| Total | 108 (100.0%) | 83 (100.0%) |
Commute Time in Creekside
The most frequently occuring commute durations in Creekside are 20 to 24 minutes (42 commuters, 29.8%), 10 to 14 minutes (27 commuters, 19.2%), and 30 to 34 minutes (19 commuters, 13.5%).
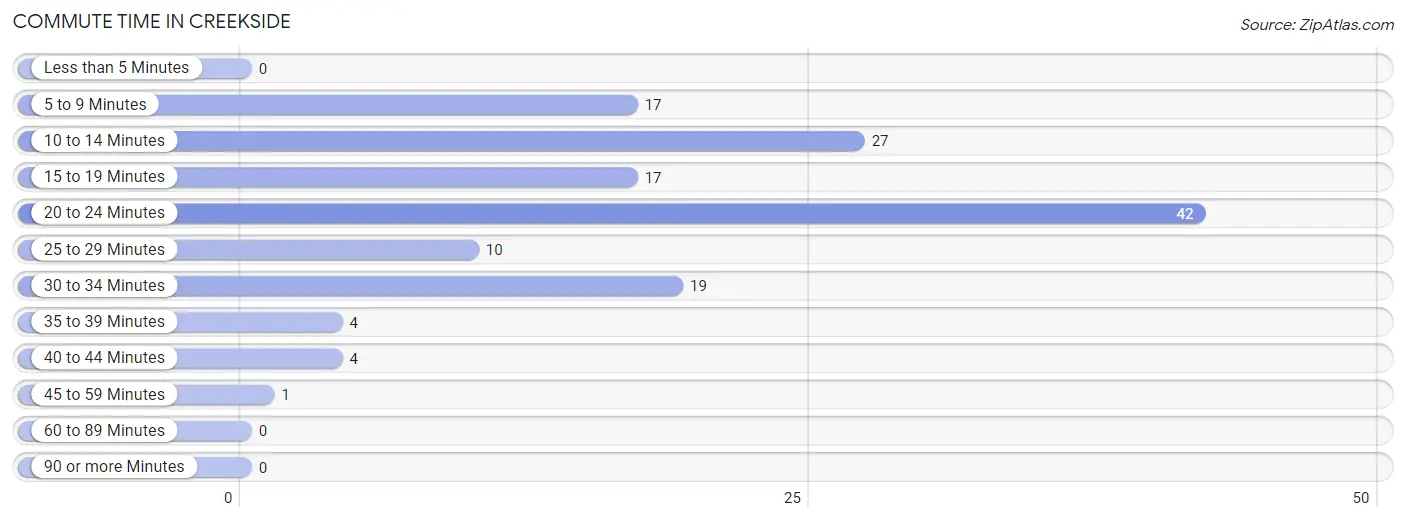
| Commute Time | # Commuters | % Commuters |
| Less than 5 Minutes | 0 | 0.0% |
| 5 to 9 Minutes | 17 | 12.1% |
| 10 to 14 Minutes | 27 | 19.2% |
| 15 to 19 Minutes | 17 | 12.1% |
| 20 to 24 Minutes | 42 | 29.8% |
| 25 to 29 Minutes | 10 | 7.1% |
| 30 to 34 Minutes | 19 | 13.5% |
| 35 to 39 Minutes | 4 | 2.8% |
| 40 to 44 Minutes | 4 | 2.8% |
| 45 to 59 Minutes | 1 | 0.7% |
| 60 to 89 Minutes | 0 | 0.0% |
| 90 or more Minutes | 0 | 0.0% |
Commute Time by Sex in Creekside
The most common commute times in Creekside are 20 to 24 minutes (30 commuters, 34.1%) for males and 10 to 14 minutes (15 commuters, 28.3%) for females.
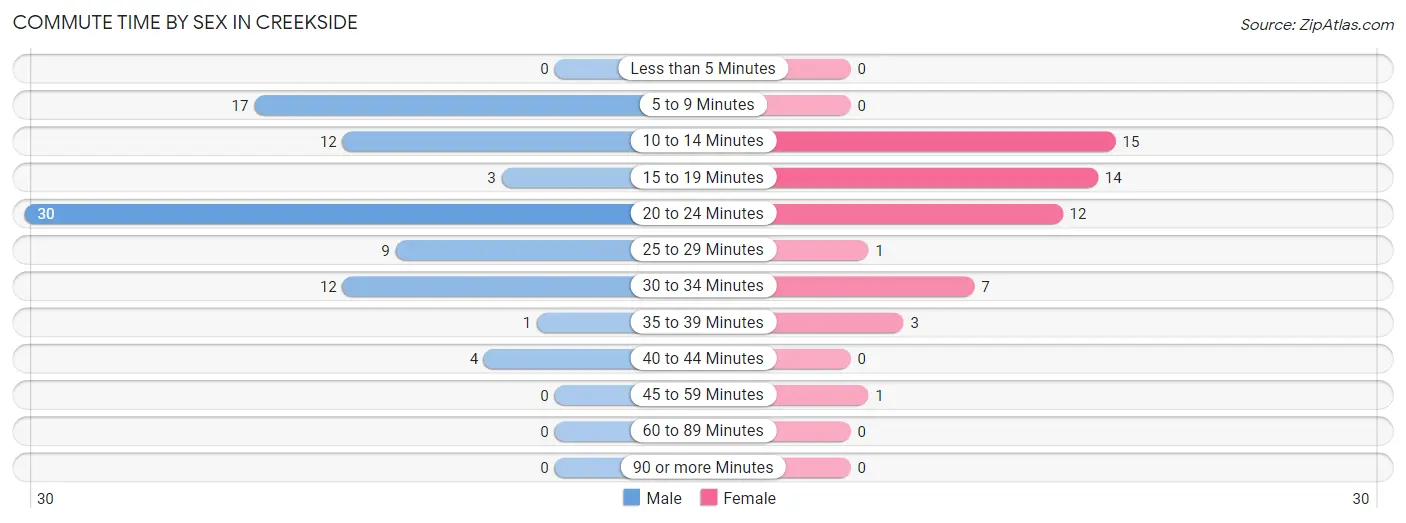
| Commute Time | Male | Female |
| Less than 5 Minutes | 0 (0.0%) | 0 (0.0%) |
| 5 to 9 Minutes | 17 (19.3%) | 0 (0.0%) |
| 10 to 14 Minutes | 12 (13.6%) | 15 (28.3%) |
| 15 to 19 Minutes | 3 (3.4%) | 14 (26.4%) |
| 20 to 24 Minutes | 30 (34.1%) | 12 (22.6%) |
| 25 to 29 Minutes | 9 (10.2%) | 1 (1.9%) |
| 30 to 34 Minutes | 12 (13.6%) | 7 (13.2%) |
| 35 to 39 Minutes | 1 (1.1%) | 3 (5.7%) |
| 40 to 44 Minutes | 4 (4.5%) | 0 (0.0%) |
| 45 to 59 Minutes | 0 (0.0%) | 1 (1.9%) |
| 60 to 89 Minutes | 0 (0.0%) | 0 (0.0%) |
| 90 or more Minutes | 0 (0.0%) | 0 (0.0%) |
Time of Departure to Work by Sex in Creekside
The most frequent times of departure to work in Creekside are 8:00 AM to 8:29 AM (26, 29.5%) for males and 7:00 AM to 7:29 AM (12, 22.6%) for females.
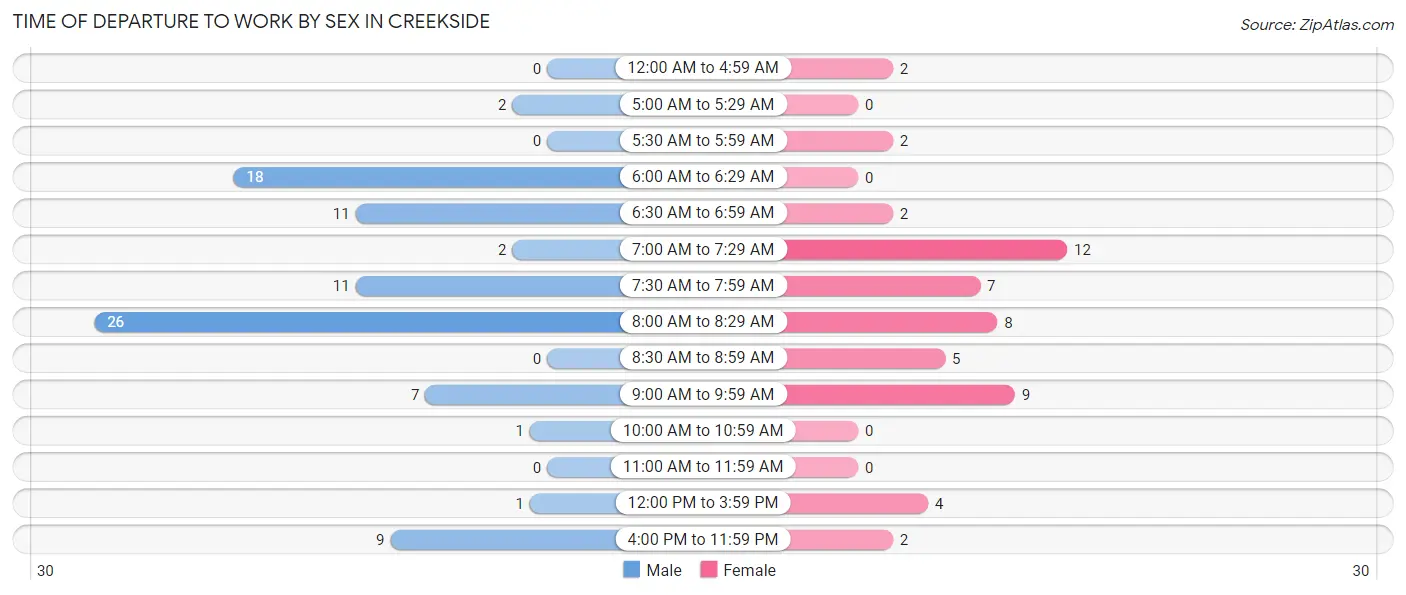
| Time of Departure | Male | Female |
| 12:00 AM to 4:59 AM | 0 (0.0%) | 2 (3.8%) |
| 5:00 AM to 5:29 AM | 2 (2.3%) | 0 (0.0%) |
| 5:30 AM to 5:59 AM | 0 (0.0%) | 2 (3.8%) |
| 6:00 AM to 6:29 AM | 18 (20.4%) | 0 (0.0%) |
| 6:30 AM to 6:59 AM | 11 (12.5%) | 2 (3.8%) |
| 7:00 AM to 7:29 AM | 2 (2.3%) | 12 (22.6%) |
| 7:30 AM to 7:59 AM | 11 (12.5%) | 7 (13.2%) |
| 8:00 AM to 8:29 AM | 26 (29.5%) | 8 (15.1%) |
| 8:30 AM to 8:59 AM | 0 (0.0%) | 5 (9.4%) |
| 9:00 AM to 9:59 AM | 7 (8.0%) | 9 (17.0%) |
| 10:00 AM to 10:59 AM | 1 (1.1%) | 0 (0.0%) |
| 11:00 AM to 11:59 AM | 0 (0.0%) | 0 (0.0%) |
| 12:00 PM to 3:59 PM | 1 (1.1%) | 4 (7.5%) |
| 4:00 PM to 11:59 PM | 9 (10.2%) | 2 (3.8%) |
| Total | 88 (100.0%) | 53 (100.0%) |
Housing Occupancy in Creekside
Occupancy by Ownership in Creekside
Of the total 148 dwellings in Creekside, owner-occupied units account for 147 (99.3%), while renter-occupied units make up 1 (0.7%).
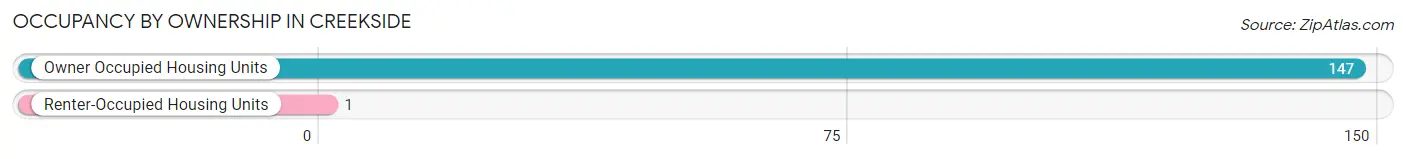
| Occupancy | # Housing Units | % Housing Units |
| Owner Occupied Housing Units | 147 | 99.3% |
| Renter-Occupied Housing Units | 1 | 0.7% |
| Total Occupied Housing Units | 148 | 100.0% |
Occupancy by Household Size in Creekside
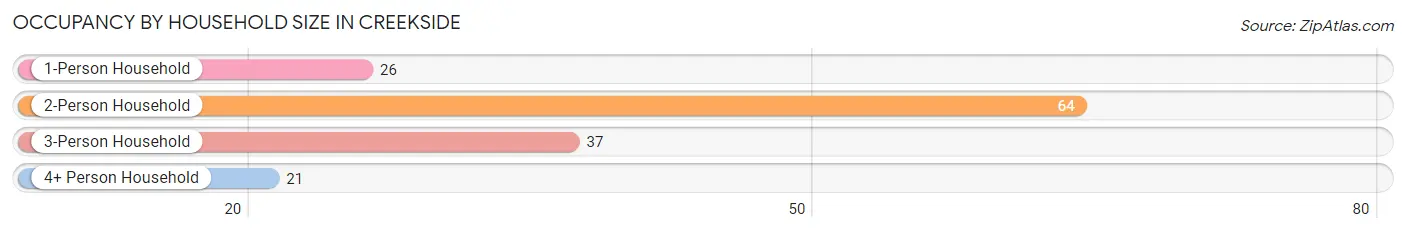
| Household Size | # Housing Units | % Housing Units |
| 1-Person Household | 26 | 17.6% |
| 2-Person Household | 64 | 43.2% |
| 3-Person Household | 37 | 25.0% |
| 4+ Person Household | 21 | 14.2% |
| Total Housing Units | 148 | 100.0% |
Occupancy by Ownership by Household Size in Creekside
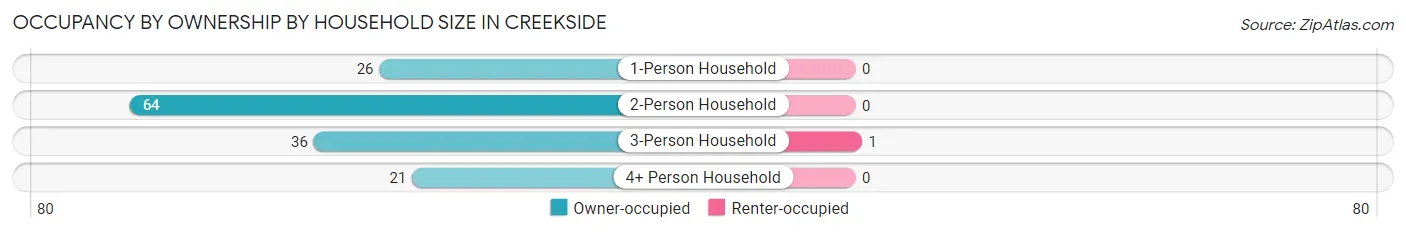
| Household Size | Owner-occupied | Renter-occupied |
| 1-Person Household | 26 (100.0%) | 0 (0.0%) |
| 2-Person Household | 64 (100.0%) | 0 (0.0%) |
| 3-Person Household | 36 (97.3%) | 1 (2.7%) |
| 4+ Person Household | 21 (100.0%) | 0 (0.0%) |
| Total Housing Units | 147 (99.3%) | 1 (0.7%) |
Occupancy by Educational Attainment in Creekside
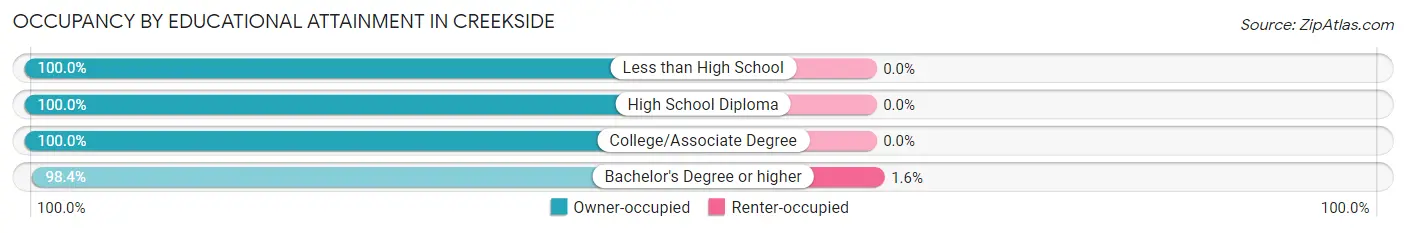
| Household Size | Owner-occupied | Renter-occupied |
| Less than High School | 1 (100.0%) | 0 (0.0%) |
| High School Diploma | 33 (100.0%) | 0 (0.0%) |
| College/Associate Degree | 51 (100.0%) | 0 (0.0%) |
| Bachelor's Degree or higher | 62 (98.4%) | 1 (1.6%) |
Occupancy by Age of Householder in Creekside
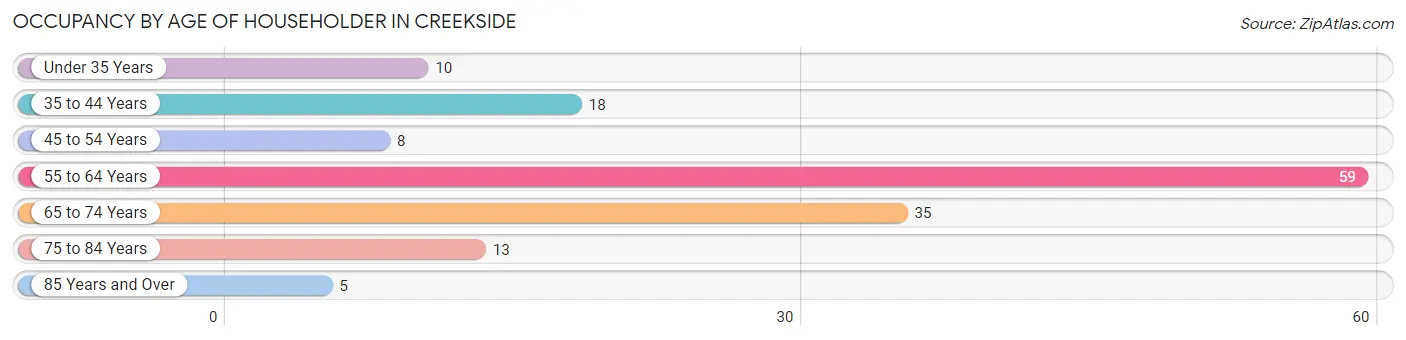
| Age Bracket | # Households | % Households |
| Under 35 Years | 10 | 6.8% |
| 35 to 44 Years | 18 | 12.2% |
| 45 to 54 Years | 8 | 5.4% |
| 55 to 64 Years | 59 | 39.9% |
| 65 to 74 Years | 35 | 23.6% |
| 75 to 84 Years | 13 | 8.8% |
| 85 Years and Over | 5 | 3.4% |
| Total | 148 | 100.0% |
Housing Finances in Creekside
Median Income by Occupancy in Creekside
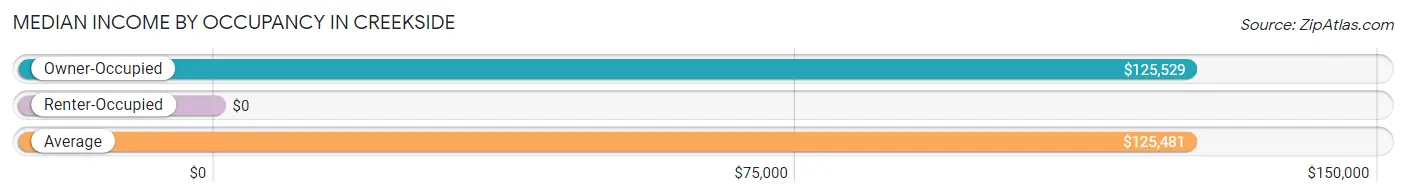
| Occupancy Type | # Households | Median Income |
| Owner-Occupied | 147 (99.3%) | $125,529 |
| Renter-Occupied | 1 (0.7%) | $0 |
| Average | 148 (100.0%) | $125,481 |
Occupancy by Householder Income Bracket in Creekside
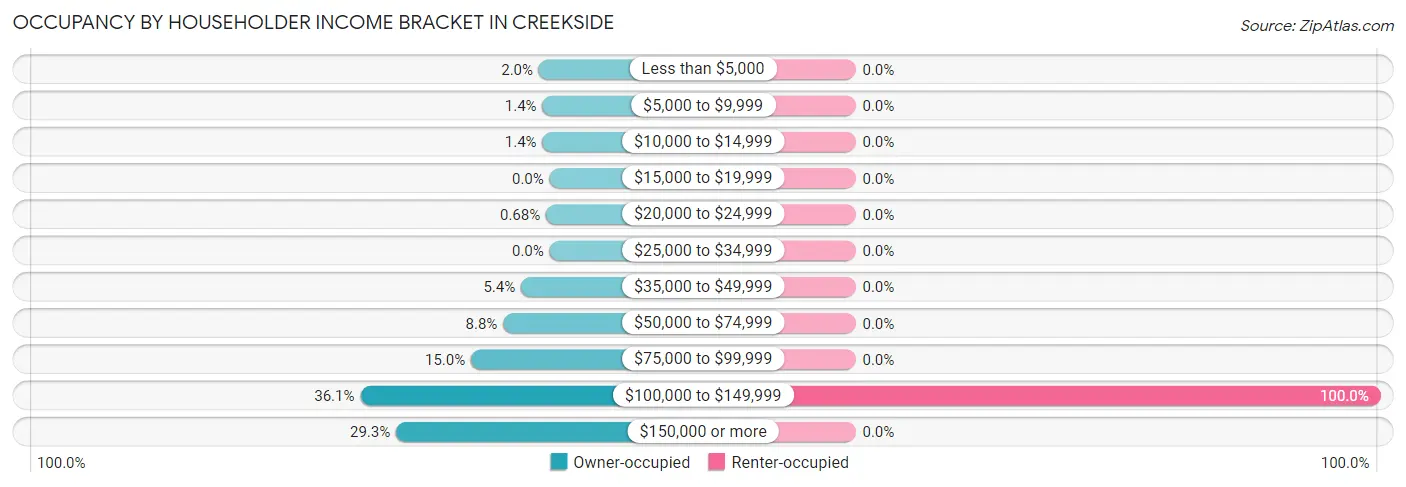
| Income Bracket | Owner-occupied | Renter-occupied |
| Less than $5,000 | 3 (2.0%) | 0 (0.0%) |
| $5,000 to $9,999 | 2 (1.4%) | 0 (0.0%) |
| $10,000 to $14,999 | 2 (1.4%) | 0 (0.0%) |
| $15,000 to $19,999 | 0 (0.0%) | 0 (0.0%) |
| $20,000 to $24,999 | 1 (0.7%) | 0 (0.0%) |
| $25,000 to $34,999 | 0 (0.0%) | 0 (0.0%) |
| $35,000 to $49,999 | 8 (5.4%) | 0 (0.0%) |
| $50,000 to $74,999 | 13 (8.8%) | 0 (0.0%) |
| $75,000 to $99,999 | 22 (15.0%) | 0 (0.0%) |
| $100,000 to $149,999 | 53 (36.0%) | 1 (100.0%) |
| $150,000 or more | 43 (29.2%) | 0 (0.0%) |
| Total | 147 (100.0%) | 1 (100.0%) |
Monthly Housing Cost Tiers in Creekside
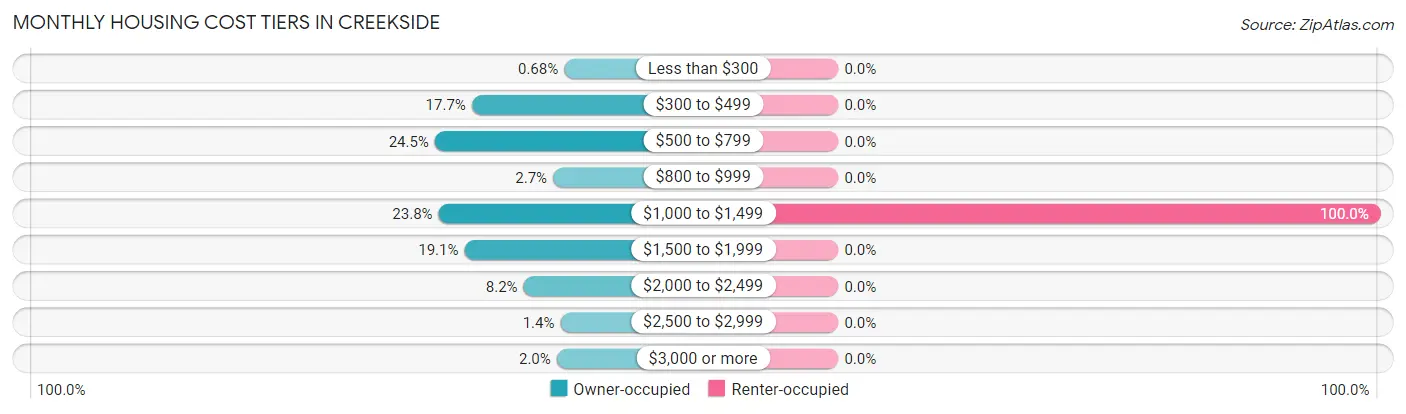
| Monthly Cost | Owner-occupied | Renter-occupied |
| Less than $300 | 1 (0.7%) | 0 (0.0%) |
| $300 to $499 | 26 (17.7%) | 0 (0.0%) |
| $500 to $799 | 36 (24.5%) | 0 (0.0%) |
| $800 to $999 | 4 (2.7%) | 0 (0.0%) |
| $1,000 to $1,499 | 35 (23.8%) | 1 (100.0%) |
| $1,500 to $1,999 | 28 (19.1%) | 0 (0.0%) |
| $2,000 to $2,499 | 12 (8.2%) | 0 (0.0%) |
| $2,500 to $2,999 | 2 (1.4%) | 0 (0.0%) |
| $3,000 or more | 3 (2.0%) | 0 (0.0%) |
| Total | 147 (100.0%) | 1 (100.0%) |
Physical Housing Characteristics in Creekside
Housing Structures in Creekside
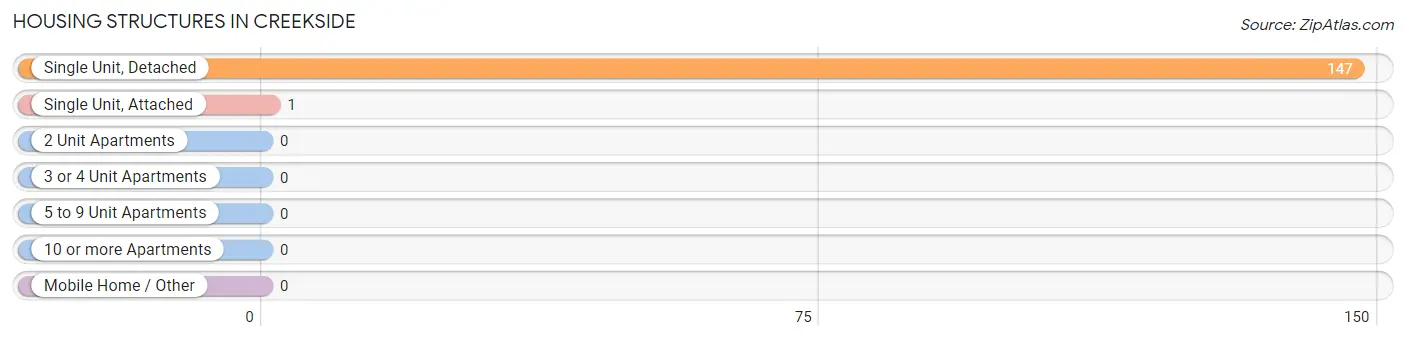
| Structure Type | # Housing Units | % Housing Units |
| Single Unit, Detached | 147 | 99.3% |
| Single Unit, Attached | 1 | 0.7% |
| 2 Unit Apartments | 0 | 0.0% |
| 3 or 4 Unit Apartments | 0 | 0.0% |
| 5 to 9 Unit Apartments | 0 | 0.0% |
| 10 or more Apartments | 0 | 0.0% |
| Mobile Home / Other | 0 | 0.0% |
| Total | 148 | 100.0% |
Housing Structures by Occupancy in Creekside
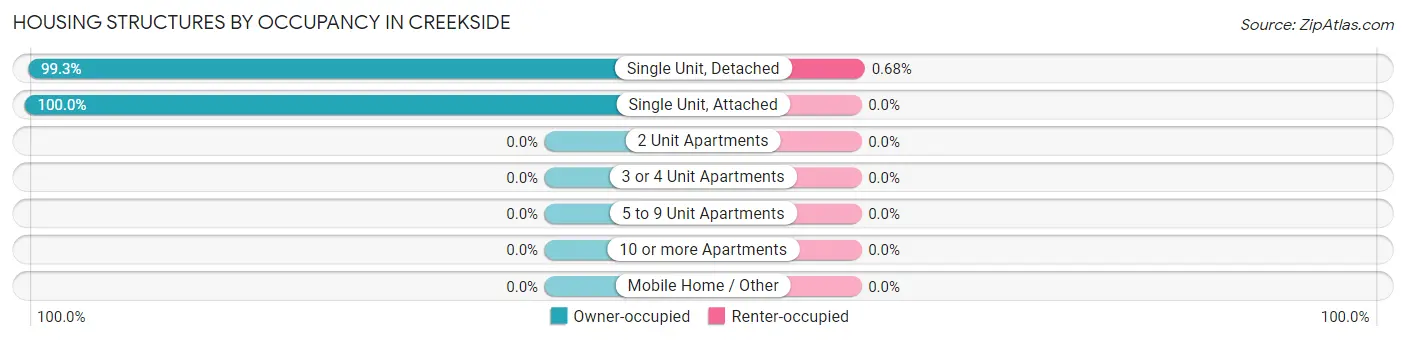
| Structure Type | Owner-occupied | Renter-occupied |
| Single Unit, Detached | 146 (99.3%) | 1 (0.7%) |
| Single Unit, Attached | 1 (100.0%) | 0 (0.0%) |
| 2 Unit Apartments | 0 (0.0%) | 0 (0.0%) |
| 3 or 4 Unit Apartments | 0 (0.0%) | 0 (0.0%) |
| 5 to 9 Unit Apartments | 0 (0.0%) | 0 (0.0%) |
| 10 or more Apartments | 0 (0.0%) | 0 (0.0%) |
| Mobile Home / Other | 0 (0.0%) | 0 (0.0%) |
| Total | 147 (99.3%) | 1 (0.7%) |
Housing Structures by Number of Rooms in Creekside
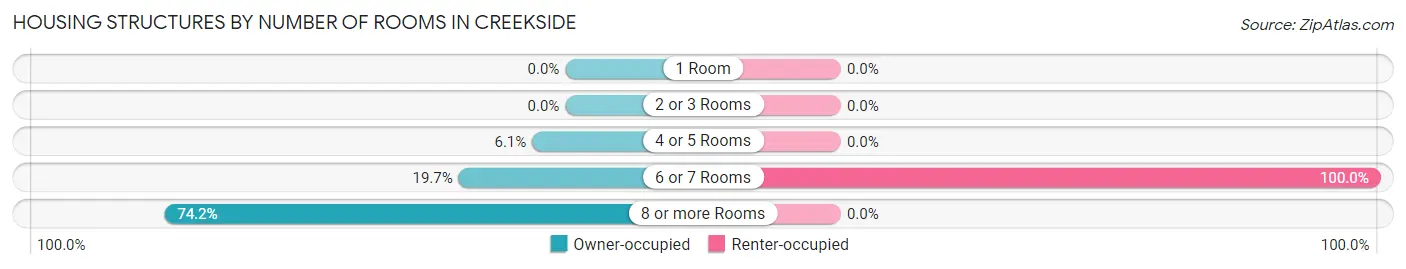
| Number of Rooms | Owner-occupied | Renter-occupied |
| 1 Room | 0 (0.0%) | 0 (0.0%) |
| 2 or 3 Rooms | 0 (0.0%) | 0 (0.0%) |
| 4 or 5 Rooms | 9 (6.1%) | 0 (0.0%) |
| 6 or 7 Rooms | 29 (19.7%) | 1 (100.0%) |
| 8 or more Rooms | 109 (74.2%) | 0 (0.0%) |
| Total | 147 (100.0%) | 1 (100.0%) |
Housing Structure by Heating Type in Creekside
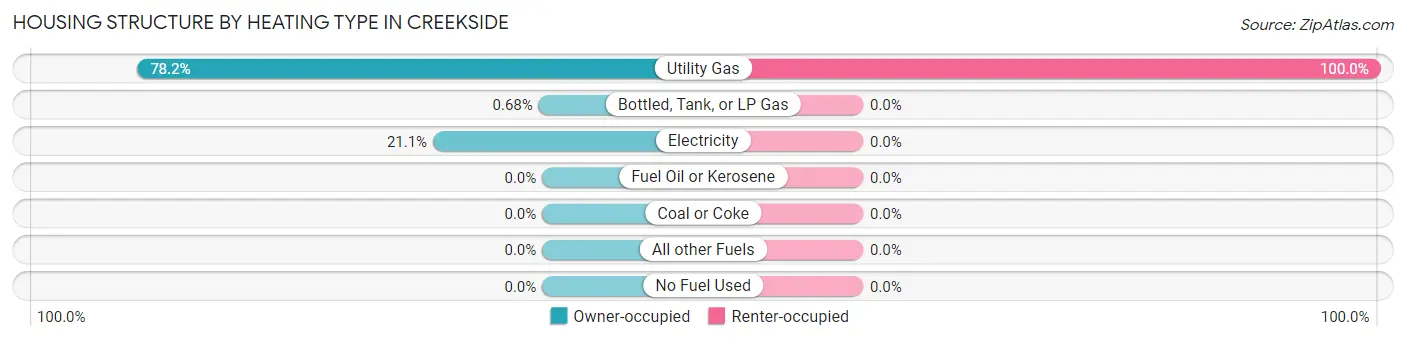
| Heating Type | Owner-occupied | Renter-occupied |
| Utility Gas | 115 (78.2%) | 1 (100.0%) |
| Bottled, Tank, or LP Gas | 1 (0.7%) | 0 (0.0%) |
| Electricity | 31 (21.1%) | 0 (0.0%) |
| Fuel Oil or Kerosene | 0 (0.0%) | 0 (0.0%) |
| Coal or Coke | 0 (0.0%) | 0 (0.0%) |
| All other Fuels | 0 (0.0%) | 0 (0.0%) |
| No Fuel Used | 0 (0.0%) | 0 (0.0%) |
| Total | 147 (100.0%) | 1 (100.0%) |
Household Vehicle Usage in Creekside
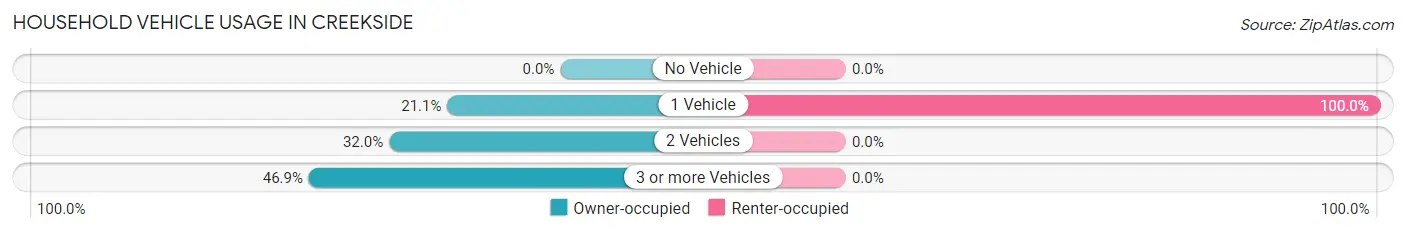
| Vehicles per Household | Owner-occupied | Renter-occupied |
| No Vehicle | 0 (0.0%) | 0 (0.0%) |
| 1 Vehicle | 31 (21.1%) | 1 (100.0%) |
| 2 Vehicles | 47 (32.0%) | 0 (0.0%) |
| 3 or more Vehicles | 69 (46.9%) | 0 (0.0%) |
| Total | 147 (100.0%) | 1 (100.0%) |
Real Estate & Mortgages in Creekside
Real Estate and Mortgage Overview in Creekside
| Characteristic | Without Mortgage | With Mortgage |
| Housing Units | 75 | 72 |
| Median Property Value | $285,800 | $300,000 |
| Median Household Income | $125,380 | $30 |
| Monthly Housing Costs | $581 | $3 |
| Real Estate Taxes | $2,640 | $4 |
Property Value by Mortgage Status in Creekside
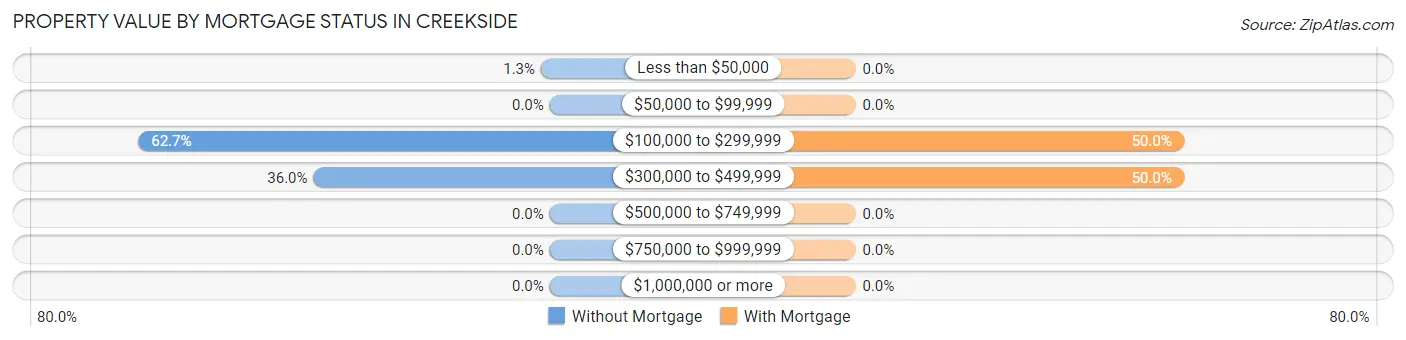
| Property Value | Without Mortgage | With Mortgage |
| Less than $50,000 | 1 (1.3%) | 0 (0.0%) |
| $50,000 to $99,999 | 0 (0.0%) | 0 (0.0%) |
| $100,000 to $299,999 | 47 (62.7%) | 36 (50.0%) |
| $300,000 to $499,999 | 27 (36.0%) | 36 (50.0%) |
| $500,000 to $749,999 | 0 (0.0%) | 0 (0.0%) |
| $750,000 to $999,999 | 0 (0.0%) | 0 (0.0%) |
| $1,000,000 or more | 0 (0.0%) | 0 (0.0%) |
| Total | 75 (100.0%) | 72 (100.0%) |
Household Income by Mortgage Status in Creekside
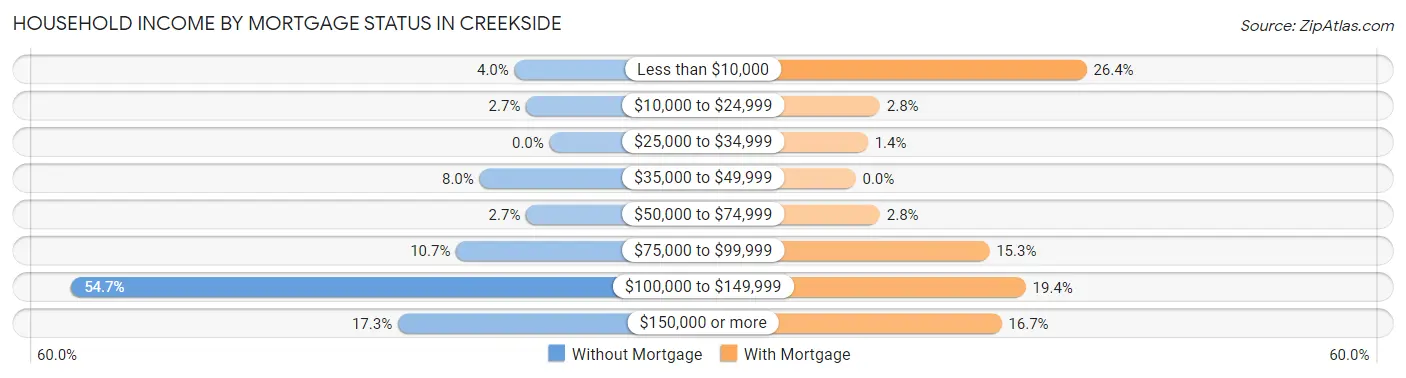
| Household Income | Without Mortgage | With Mortgage |
| Less than $10,000 | 3 (4.0%) | 19 (26.4%) |
| $10,000 to $24,999 | 2 (2.7%) | 2 (2.8%) |
| $25,000 to $34,999 | 0 (0.0%) | 1 (1.4%) |
| $35,000 to $49,999 | 6 (8.0%) | 0 (0.0%) |
| $50,000 to $74,999 | 2 (2.7%) | 2 (2.8%) |
| $75,000 to $99,999 | 8 (10.7%) | 11 (15.3%) |
| $100,000 to $149,999 | 41 (54.7%) | 14 (19.4%) |
| $150,000 or more | 13 (17.3%) | 12 (16.7%) |
| Total | 75 (100.0%) | 72 (100.0%) |
Property Value to Household Income Ratio in Creekside
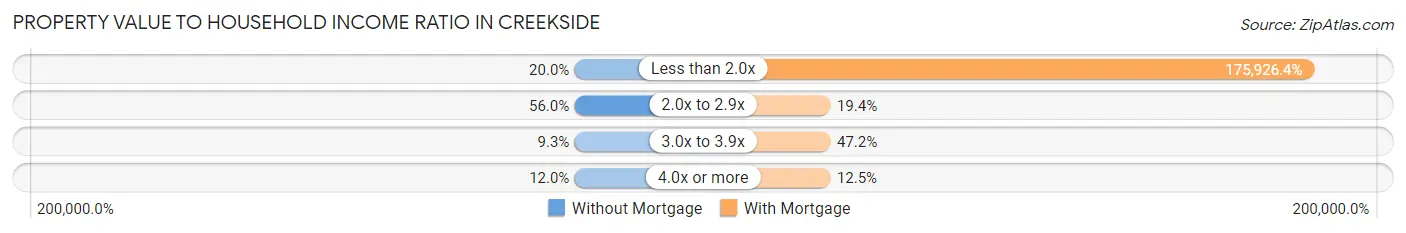
| Value-to-Income Ratio | Without Mortgage | With Mortgage |
| Less than 2.0x | 15 (20.0%) | 126,667 (175,926.4%) |
| 2.0x to 2.9x | 42 (56.0%) | 14 (19.4%) |
| 3.0x to 3.9x | 7 (9.3%) | 34 (47.2%) |
| 4.0x or more | 9 (12.0%) | 9 (12.5%) |
| Total | 75 (100.0%) | 72 (100.0%) |
Real Estate Taxes by Mortgage Status in Creekside
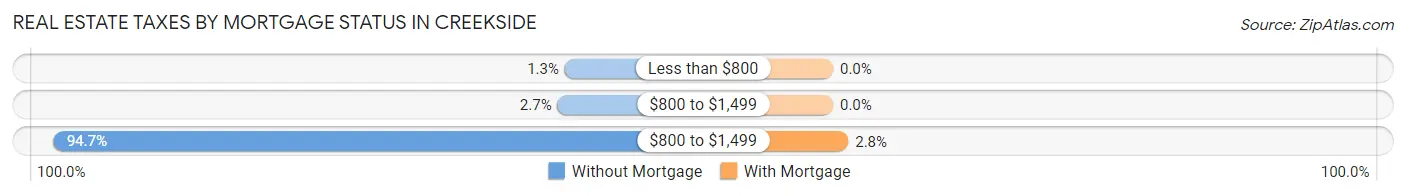
| Property Taxes | Without Mortgage | With Mortgage |
| Less than $800 | 1 (1.3%) | 0 (0.0%) |
| $800 to $1,499 | 2 (2.7%) | 0 (0.0%) |
| $800 to $1,499 | 71 (94.7%) | 2 (2.8%) |
| Total | 75 (100.0%) | 72 (100.0%) |
Health & Disability in Creekside
Health Insurance Coverage by Age in Creekside
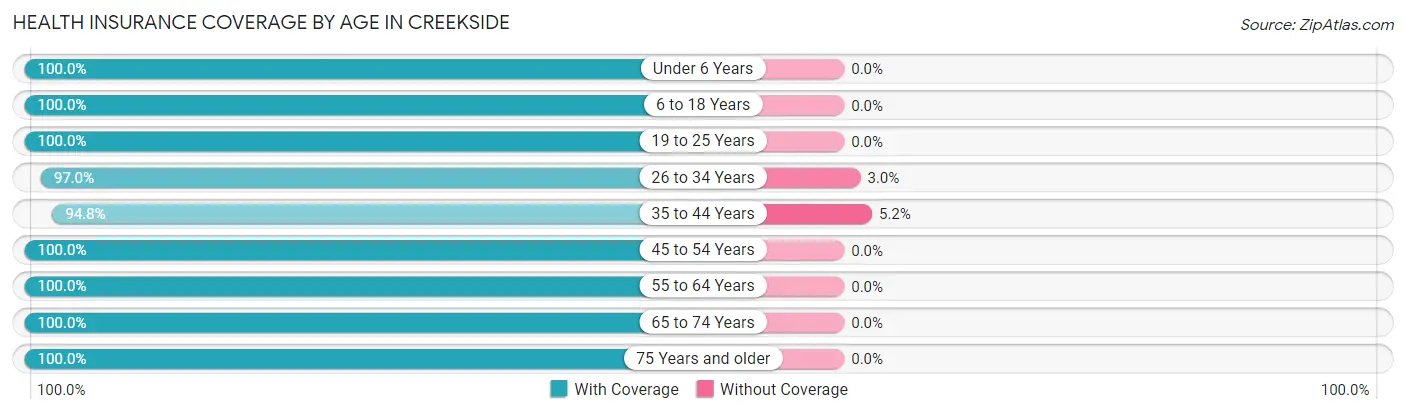
| Age Bracket | With Coverage | Without Coverage |
| Under 6 Years | 23 (100.0%) | 0 (0.0%) |
| 6 to 18 Years | 36 (100.0%) | 0 (0.0%) |
| 19 to 25 Years | 14 (100.0%) | 0 (0.0%) |
| 26 to 34 Years | 32 (97.0%) | 1 (3.0%) |
| 35 to 44 Years | 55 (94.8%) | 3 (5.2%) |
| 45 to 54 Years | 17 (100.0%) | 0 (0.0%) |
| 55 to 64 Years | 88 (100.0%) | 0 (0.0%) |
| 65 to 74 Years | 68 (100.0%) | 0 (0.0%) |
| 75 Years and older | 27 (100.0%) | 0 (0.0%) |
| Total | 360 (98.9%) | 4 (1.1%) |
Health Insurance Coverage by Citizenship Status in Creekside
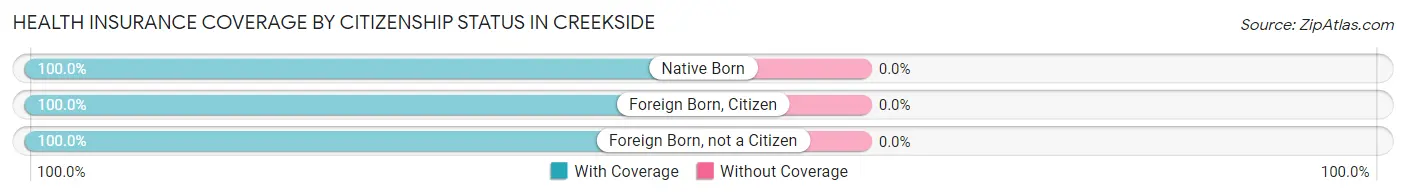
| Citizenship Status | With Coverage | Without Coverage |
| Native Born | 23 (100.0%) | 0 (0.0%) |
| Foreign Born, Citizen | 36 (100.0%) | 0 (0.0%) |
| Foreign Born, not a Citizen | 14 (100.0%) | 0 (0.0%) |
Health Insurance Coverage by Household Income in Creekside
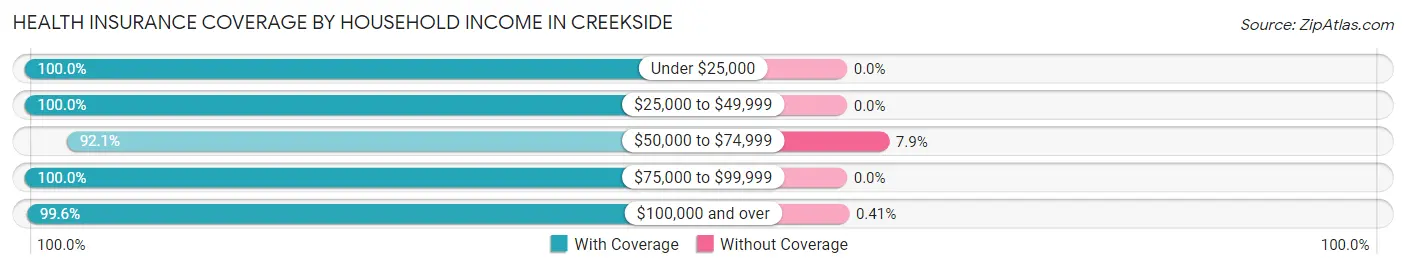
| Household Income | With Coverage | Without Coverage |
| Under $25,000 | 14 (100.0%) | 0 (0.0%) |
| $25,000 to $49,999 | 14 (100.0%) | 0 (0.0%) |
| $50,000 to $74,999 | 35 (92.1%) | 3 (7.9%) |
| $75,000 to $99,999 | 56 (100.0%) | 0 (0.0%) |
| $100,000 and over | 241 (99.6%) | 1 (0.4%) |
Public vs Private Health Insurance Coverage by Age in Creekside
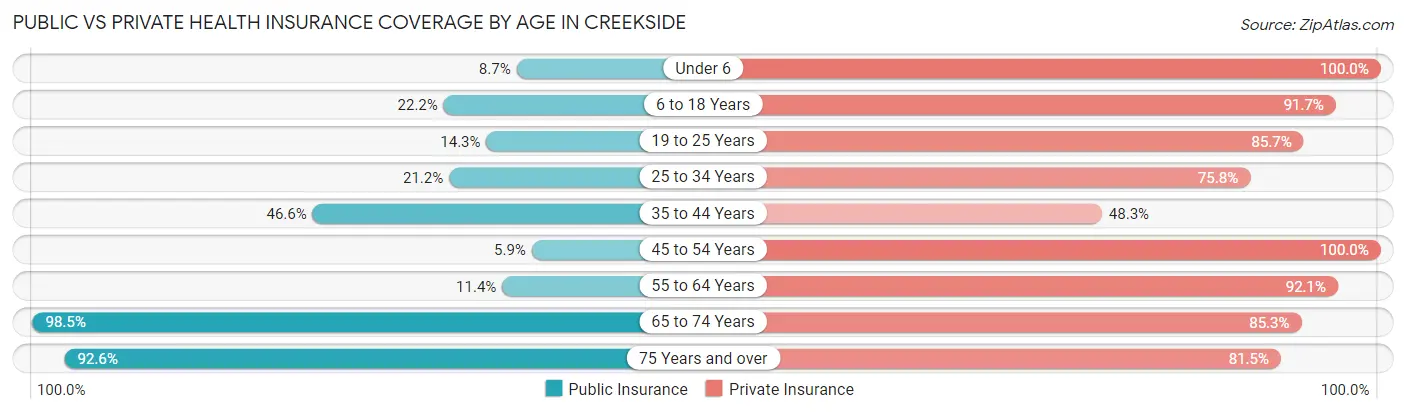
| Age Bracket | Public Insurance | Private Insurance |
| Under 6 | 2 (8.7%) | 23 (100.0%) |
| 6 to 18 Years | 8 (22.2%) | 33 (91.7%) |
| 19 to 25 Years | 2 (14.3%) | 12 (85.7%) |
| 25 to 34 Years | 7 (21.2%) | 25 (75.8%) |
| 35 to 44 Years | 27 (46.6%) | 28 (48.3%) |
| 45 to 54 Years | 1 (5.9%) | 17 (100.0%) |
| 55 to 64 Years | 10 (11.4%) | 81 (92.0%) |
| 65 to 74 Years | 67 (98.5%) | 58 (85.3%) |
| 75 Years and over | 25 (92.6%) | 22 (81.5%) |
| Total | 149 (40.9%) | 299 (82.1%) |
Disability Status by Sex by Age in Creekside
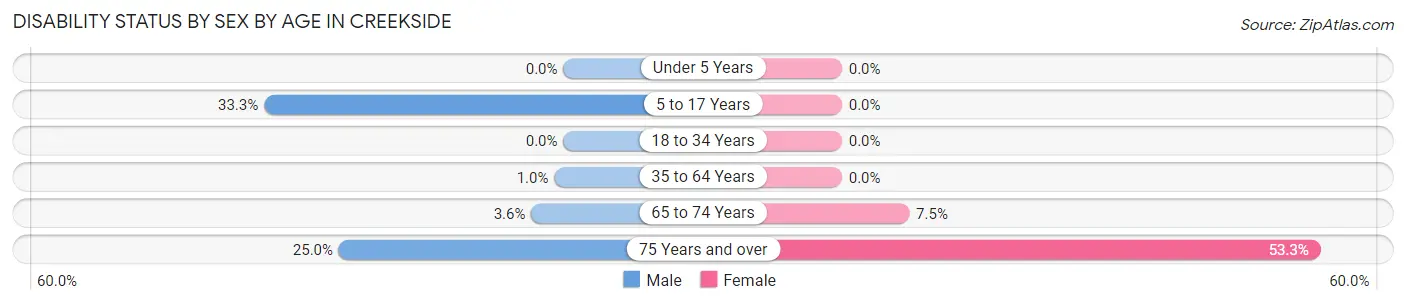
| Age Bracket | Male | Female |
| Under 5 Years | 0 (0.0%) | 0 (0.0%) |
| 5 to 17 Years | 8 (33.3%) | 0 (0.0%) |
| 18 to 34 Years | 0 (0.0%) | 0 (0.0%) |
| 35 to 64 Years | 1 (1.0%) | 0 (0.0%) |
| 65 to 74 Years | 1 (3.6%) | 3 (7.5%) |
| 75 Years and over | 3 (25.0%) | 8 (53.3%) |
Disability Class by Sex by Age in Creekside
Disability Class: Hearing Difficulty
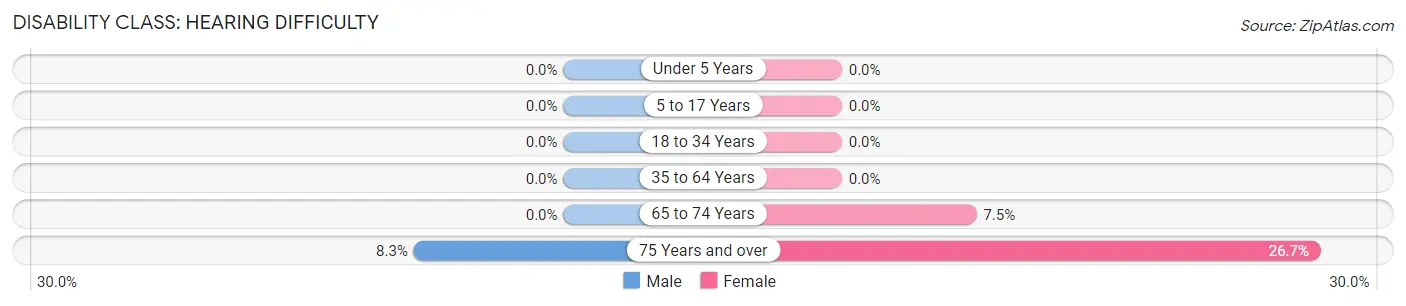
| Age Bracket | Male | Female |
| Under 5 Years | 0 (0.0%) | 0 (0.0%) |
| 5 to 17 Years | 0 (0.0%) | 0 (0.0%) |
| 18 to 34 Years | 0 (0.0%) | 0 (0.0%) |
| 35 to 64 Years | 0 (0.0%) | 0 (0.0%) |
| 65 to 74 Years | 0 (0.0%) | 3 (7.5%) |
| 75 Years and over | 1 (8.3%) | 4 (26.7%) |
Disability Class: Vision Difficulty
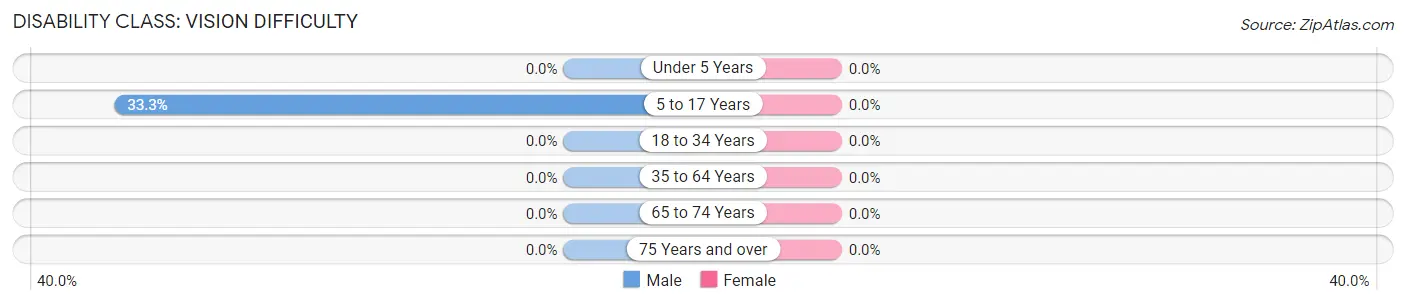
| Age Bracket | Male | Female |
| Under 5 Years | 0 (0.0%) | 0 (0.0%) |
| 5 to 17 Years | 8 (33.3%) | 0 (0.0%) |
| 18 to 34 Years | 0 (0.0%) | 0 (0.0%) |
| 35 to 64 Years | 0 (0.0%) | 0 (0.0%) |
| 65 to 74 Years | 0 (0.0%) | 0 (0.0%) |
| 75 Years and over | 0 (0.0%) | 0 (0.0%) |
Disability Class: Cognitive Difficulty
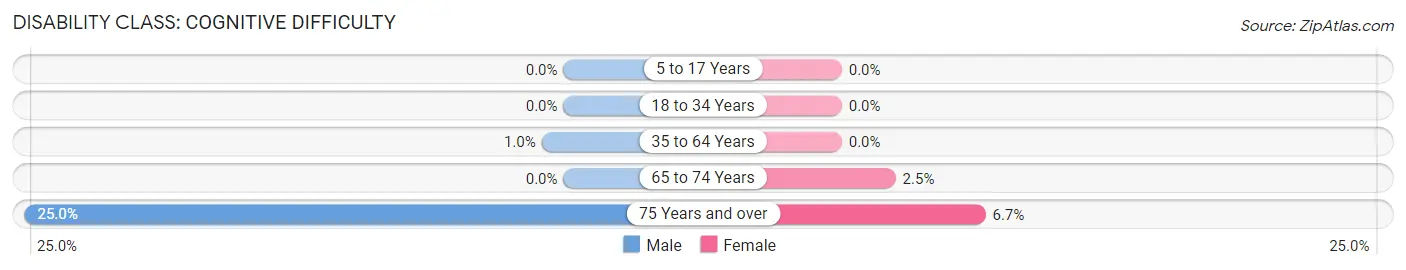
| Age Bracket | Male | Female |
| 5 to 17 Years | 0 (0.0%) | 0 (0.0%) |
| 18 to 34 Years | 0 (0.0%) | 0 (0.0%) |
| 35 to 64 Years | 1 (1.0%) | 0 (0.0%) |
| 65 to 74 Years | 0 (0.0%) | 1 (2.5%) |
| 75 Years and over | 3 (25.0%) | 1 (6.7%) |
Disability Class: Ambulatory Difficulty
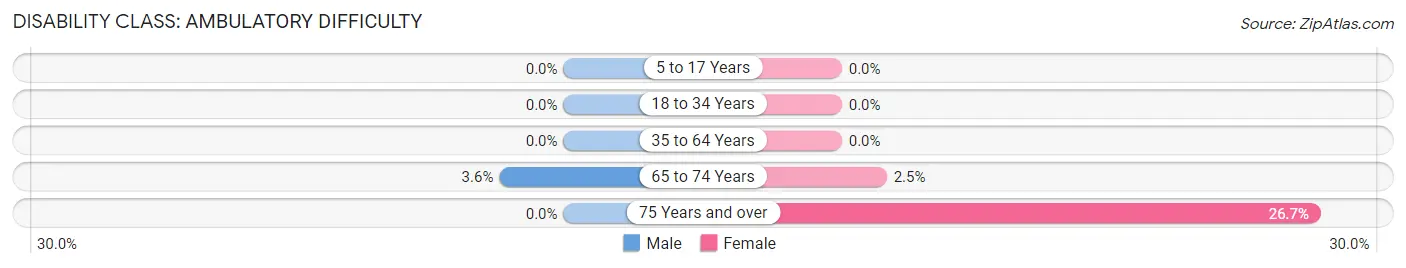
| Age Bracket | Male | Female |
| 5 to 17 Years | 0 (0.0%) | 0 (0.0%) |
| 18 to 34 Years | 0 (0.0%) | 0 (0.0%) |
| 35 to 64 Years | 0 (0.0%) | 0 (0.0%) |
| 65 to 74 Years | 1 (3.6%) | 1 (2.5%) |
| 75 Years and over | 0 (0.0%) | 4 (26.7%) |
Disability Class: Self-Care Difficulty
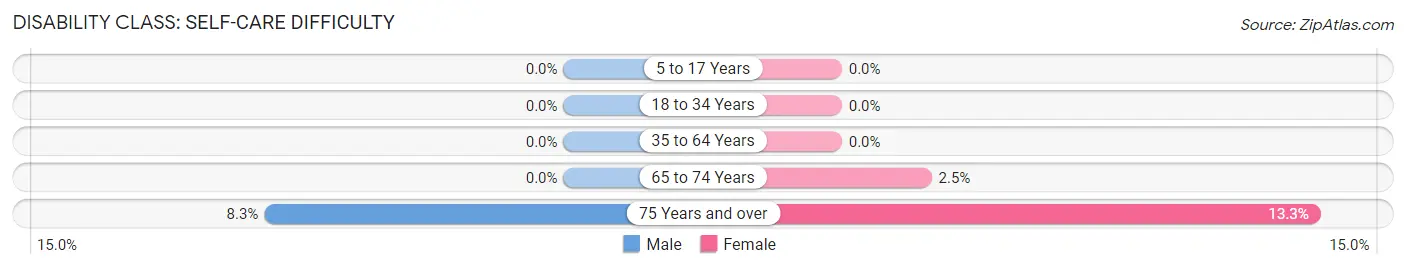
| Age Bracket | Male | Female |
| 5 to 17 Years | 0 (0.0%) | 0 (0.0%) |
| 18 to 34 Years | 0 (0.0%) | 0 (0.0%) |
| 35 to 64 Years | 0 (0.0%) | 0 (0.0%) |
| 65 to 74 Years | 0 (0.0%) | 1 (2.5%) |
| 75 Years and over | 1 (8.3%) | 2 (13.3%) |
Technology Access in Creekside
Computing Device Access in Creekside
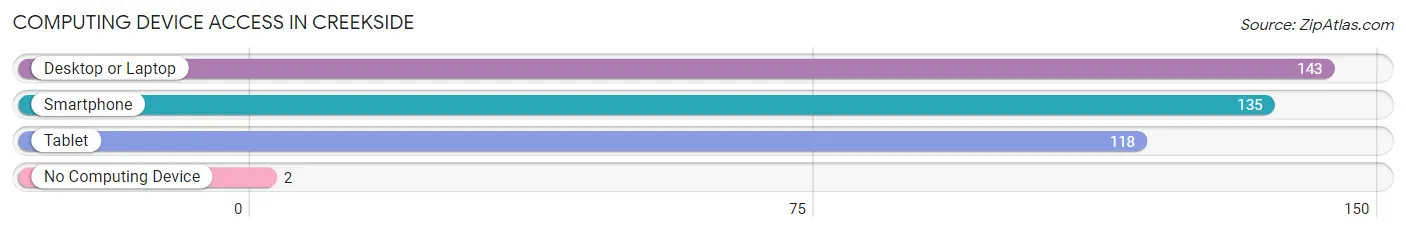
| Device Type | # Households | % Households |
| Desktop or Laptop | 143 | 96.6% |
| Smartphone | 135 | 91.2% |
| Tablet | 118 | 79.7% |
| No Computing Device | 2 | 1.3% |
| Total | 148 | 100.0% |
Internet Access in Creekside
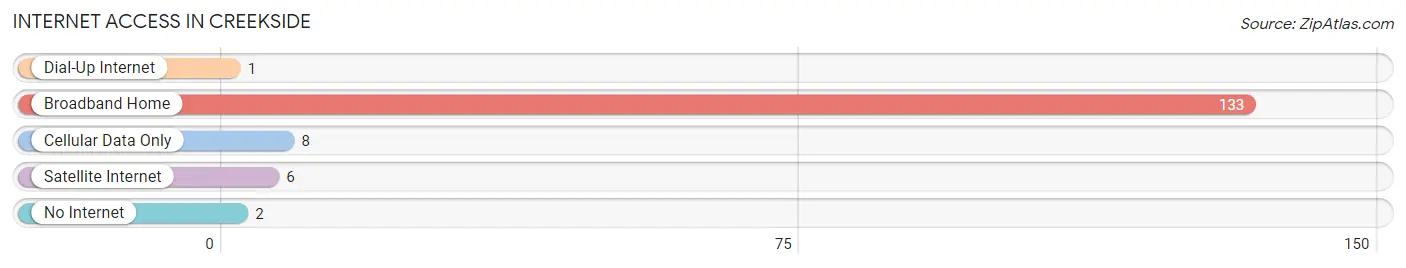
| Internet Type | # Households | % Households |
| Dial-Up Internet | 1 | 0.7% |
| Broadband Home | 133 | 89.9% |
| Cellular Data Only | 8 | 5.4% |
| Satellite Internet | 6 | 4.1% |
| No Internet | 2 | 1.3% |
| Total | 148 | 100.0% |
Creekside Summary
Creekside, Kentucky is a small town located in the southeastern part of the state. It is situated in the foothills of the Appalachian Mountains and is surrounded by rolling hills and lush forests. The town is home to a population of just over 1,000 people and is known for its rural charm and friendly atmosphere.
History
Creekside was first settled in the early 1800s by a group of settlers from Virginia. The town was originally known as “Creek’s End” and was located at the end of a creek that ran through the area. The town was officially incorporated in 1820 and was named after the creek.
In the late 1800s, the town began to grow and prosper as a result of the coal mining industry. The town was home to several coal mines and the population grew to over 1,000 people. The town also became a popular tourist destination due to its scenic beauty and proximity to the Appalachian Mountains.
Geography
Creekside is located in the southeastern part of Kentucky, in the foothills of the Appalachian Mountains. The town is situated on the banks of the Big Sandy River and is surrounded by rolling hills and lush forests. The town is located approximately 30 miles from the state capital of Frankfort and is within easy driving distance of Lexington and Louisville.
Economy
The economy of Creekside is largely based on agriculture and tourism. The town is home to several farms that produce a variety of crops, including corn, soybeans, and tobacco. The town is also home to several tourist attractions, including a historic covered bridge, a museum, and a golf course.
Demographics
As of the 2010 census, the population of Creekside was 1,072. The racial makeup of the town was 95.3% White, 1.2% African American, 0.3% Native American, 0.2% Asian, 0.1% Pacific Islander, and 2.9% from other races. The median household income was $31,250 and the median family income was $37,500. The per capita income was $17,845.
Conclusion
Creekside, Kentucky is a small town located in the southeastern part of the state. It is situated in the foothills of the Appalachian Mountains and is surrounded by rolling hills and lush forests. The town is home to a population of just over 1,000 people and is known for its rural charm and friendly atmosphere. The economy of Creekside is largely based on agriculture and tourism, and the town is home to several tourist attractions. The population of Creekside is predominantly White, with a small percentage of African American, Native American, Asian, and Pacific Islander residents.
Common Questions
What is Per Capita Income in Creekside?
Per Capita income in Creekside is $49,464.
What is the Median Family Income in Creekside?
Median Family Income in Creekside is $126,346.
What is the Median Household income in Creekside?
Median Household Income in Creekside is $125,481.
What is Income or Wage Gap in Creekside?
Income or Wage Gap in Creekside is 29.5%.
Women in Creekside earn 70.5 cents for every dollar earned by a man.
What is Family Income Deficit in Creekside?
Family Income Deficit in Creekside is $15,133.
Families that are below poverty line in Creekside earn $15,133 less on average than the poverty threshold level.
What is Inequality or Gini Index in Creekside?
Inequality or Gini Index in Creekside is 0.30.
What is the Total Population of Creekside?
Total Population of Creekside is 364.
What is the Total Male Population of Creekside?
Total Male Population of Creekside is 199.
What is the Total Female Population of Creekside?
Total Female Population of Creekside is 165.
What is the Ratio of Males per 100 Females in Creekside?
There are 120.61 Males per 100 Females in Creekside.
What is the Ratio of Females per 100 Males in Creekside?
There are 82.91 Females per 100 Males in Creekside.
What is the Median Population Age in Creekside?
Median Population Age in Creekside is 55.1 Years.
What is the Average Family Size in Creekside
Average Family Size in Creekside is 2.7 People.
What is the Average Household Size in Creekside
Average Household Size in Creekside is 2.5 People.
How Large is the Labor Force in Creekside?
There are 228 People in the Labor Forcein in Creekside.
What is the Percentage of People in the Labor Force in Creekside?
72.6% of People are in the Labor Force in Creekside.
What is the Unemployment Rate in Creekside?
Unemployment Rate in Creekside is 6.6%.