Hilltop, MN Map & Demographics
Hilltop Map
Hilltop Overview
$20,380
PER CAPITA INCOME
$52,846
AVG FAMILY INCOME
$46,188
AVG HOUSEHOLD INCOME
35.9%
WAGE / INCOME GAP [ % ]
64.1¢/ $1
WAGE / INCOME GAP [ $ ]
0.34
INEQUALITY / GINI INDEX
1,005
TOTAL POPULATION
591
MALE POPULATION
414
FEMALE POPULATION
142.75
MALES / 100 FEMALES
70.05
FEMALES / 100 MALES
32.3
MEDIAN AGE
3.0
AVG FAMILY SIZE
2.5
AVG HOUSEHOLD SIZE
585
LABOR FORCE [ PEOPLE ]
74.5%
PERCENT IN LABOR FORCE
17.6%
UNEMPLOYMENT RATE
Income in Hilltop
Income Overview in Hilltop
Per Capita Income in Hilltop is $20,380, while median incomes of families and households are $52,846 and $46,188 respectively.
| Characteristic | Number | Measure |
| Per Capita Income | 1,005 | $20,380 |
| Median Family Income | 259 | $52,846 |
| Mean Family Income | 259 | $53,422 |
| Median Household Income | 411 | $46,188 |
| Mean Household Income | 411 | $46,381 |
| Income Deficit | 259 | $0 |
| Wage / Income Gap (%) | 1,005 | 35.91% |
| Wage / Income Gap ($) | 1,005 | 64.09¢ per $1 |
| Gini / Inequality Index | 1,005 | 0.34 |
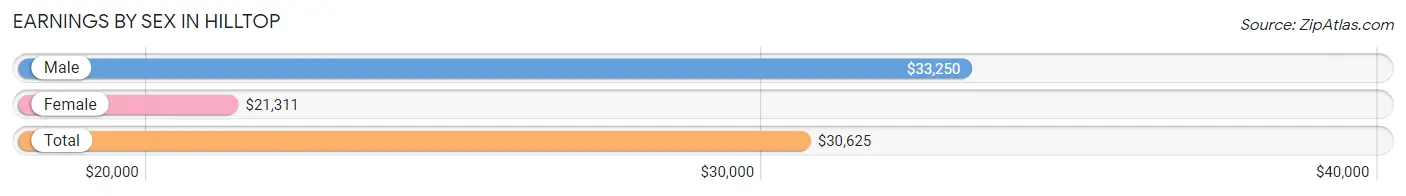
Earnings by Sex in Hilltop
Average Earnings in Hilltop are $30,625, $33,250 for men and $21,311 for women, a difference of 35.9%.
| Sex | Number | Average Earnings |
| Male | 358 (62.1%) | $33,250 |
| Female | 219 (38.0%) | $21,311 |
| Total | 577 (100.0%) | $30,625 |
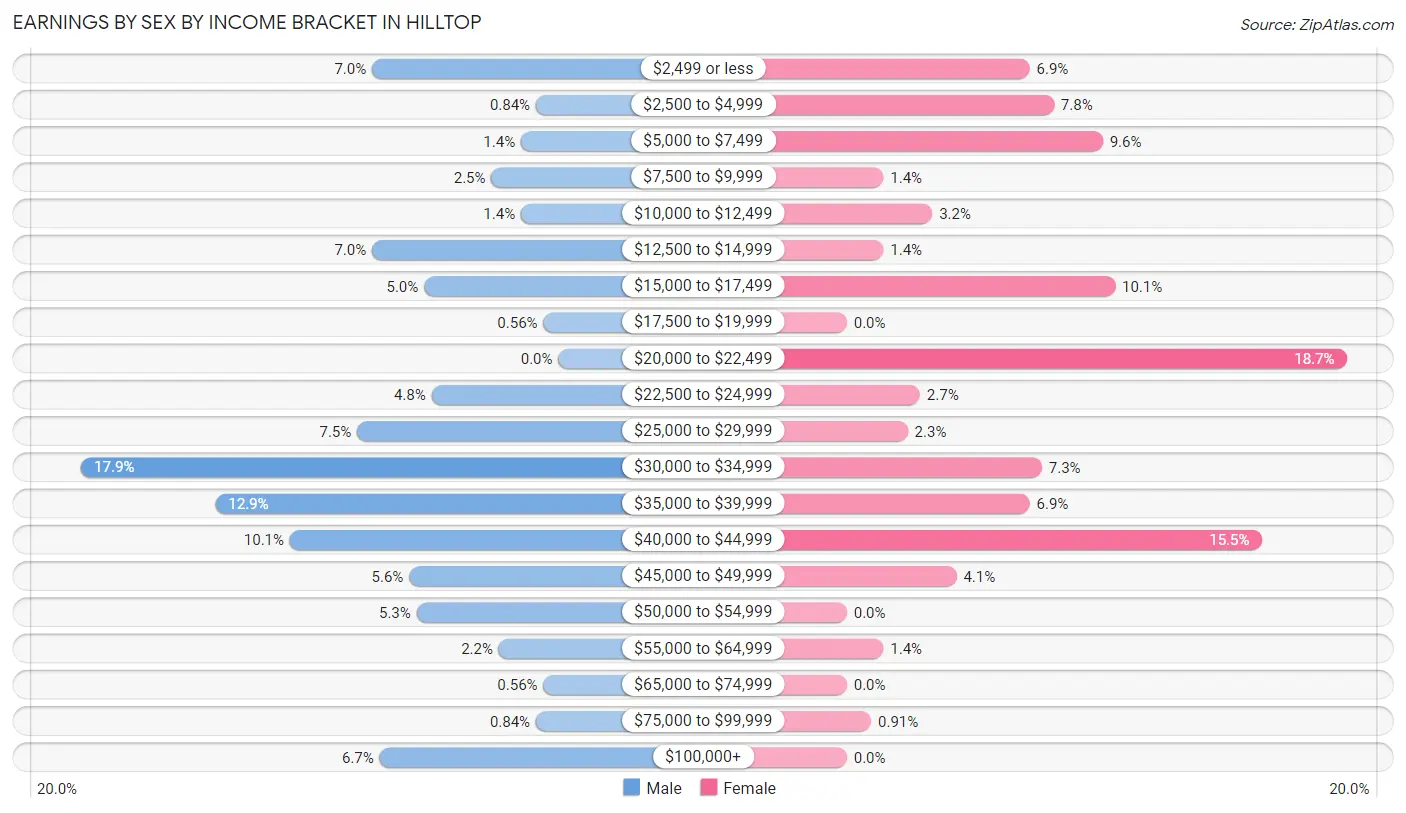
Earnings by Sex by Income Bracket in Hilltop
The most common earnings brackets in Hilltop are $30,000 to $34,999 for men (64 | 17.9%) and $20,000 to $22,499 for women (41 | 18.7%).
| Income | Male | Female |
| $2,499 or less | 25 (7.0%) | 15 (6.9%) |
| $2,500 to $4,999 | 3 (0.8%) | 17 (7.8%) |
| $5,000 to $7,499 | 5 (1.4%) | 21 (9.6%) |
| $7,500 to $9,999 | 9 (2.5%) | 3 (1.4%) |
| $10,000 to $12,499 | 5 (1.4%) | 7 (3.2%) |
| $12,500 to $14,999 | 25 (7.0%) | 3 (1.4%) |
| $15,000 to $17,499 | 18 (5.0%) | 22 (10.1%) |
| $17,500 to $19,999 | 2 (0.6%) | 0 (0.0%) |
| $20,000 to $22,499 | 0 (0.0%) | 41 (18.7%) |
| $22,500 to $24,999 | 17 (4.8%) | 6 (2.7%) |
| $25,000 to $29,999 | 27 (7.5%) | 5 (2.3%) |
| $30,000 to $34,999 | 64 (17.9%) | 16 (7.3%) |
| $35,000 to $39,999 | 46 (12.9%) | 15 (6.9%) |
| $40,000 to $44,999 | 36 (10.1%) | 34 (15.5%) |
| $45,000 to $49,999 | 20 (5.6%) | 9 (4.1%) |
| $50,000 to $54,999 | 19 (5.3%) | 0 (0.0%) |
| $55,000 to $64,999 | 8 (2.2%) | 3 (1.4%) |
| $65,000 to $74,999 | 2 (0.6%) | 0 (0.0%) |
| $75,000 to $99,999 | 3 (0.8%) | 2 (0.9%) |
| $100,000+ | 24 (6.7%) | 0 (0.0%) |
| Total | 358 (100.0%) | 219 (100.0%) |
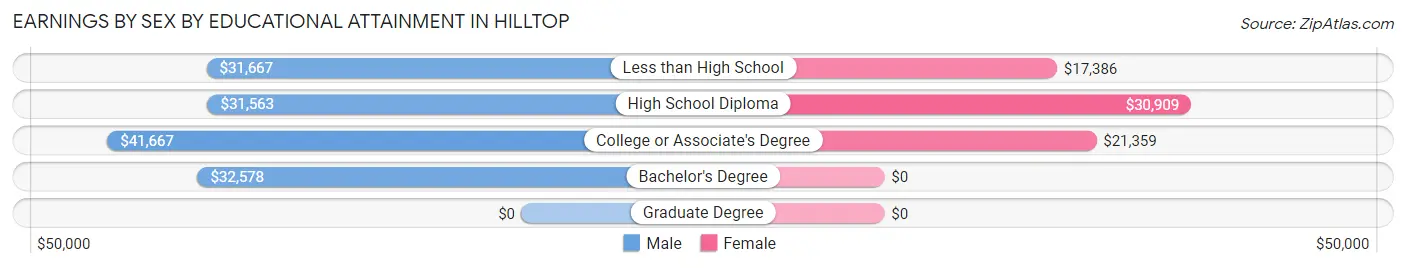
Earnings by Sex by Educational Attainment in Hilltop
Average earnings in Hilltop are $32,542 for men and $21,494 for women, a difference of 34.0%. Men with an educational attainment of college or associate's degree enjoy the highest average annual earnings of $41,667, while those with high school diploma education earn the least with $31,563. Women with an educational attainment of high school diploma earn the most with the average annual earnings of $30,909, while those with less than high school education have the smallest earnings of $17,386.
| Educational Attainment | Male Income | Female Income |
| Less than High School | $31,667 | $17,386 |
| High School Diploma | $31,563 | $30,909 |
| College or Associate's Degree | $41,667 | $21,359 |
| Bachelor's Degree | $32,578 | $0 |
| Graduate Degree | - | - |
| Total | $32,542 | $21,494 |
Family Income in Hilltop
Family Income Brackets in Hilltop
According to the Hilltop family income data, there are 116 families falling into the $50,000 to $74,999 income range, which is the most common income bracket and makes up 44.8% of all families.
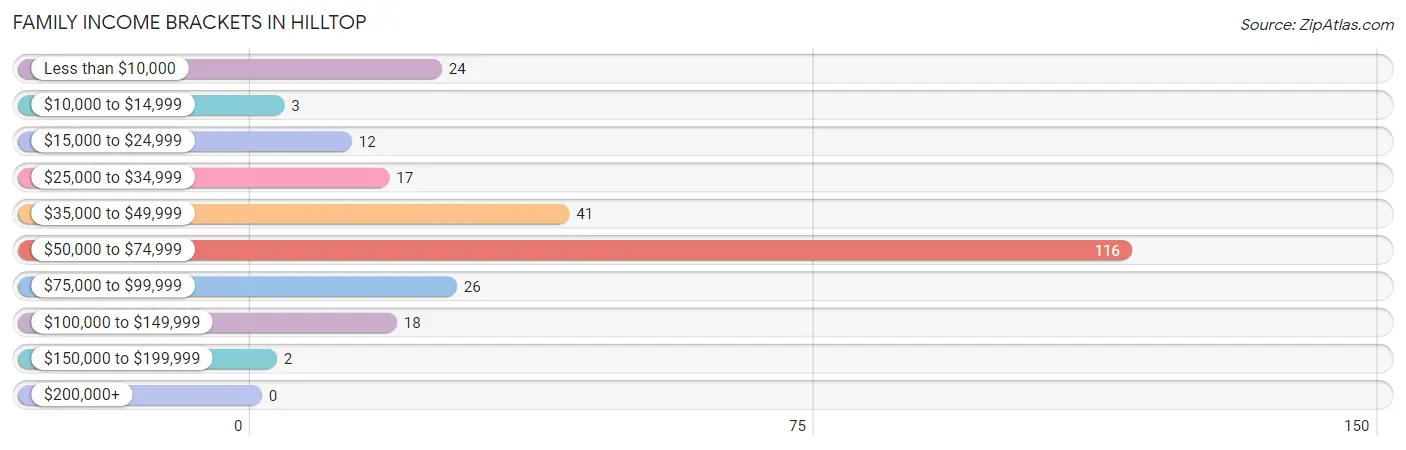
| Income Bracket | # Families | % Families |
| Less than $10,000 | 24 | 9.3% |
| $10,000 to $14,999 | 3 | 1.2% |
| $15,000 to $24,999 | 12 | 4.6% |
| $25,000 to $34,999 | 17 | 6.6% |
| $35,000 to $49,999 | 41 | 15.8% |
| $50,000 to $74,999 | 116 | 44.8% |
| $75,000 to $99,999 | 26 | 10.0% |
| $100,000 to $149,999 | 18 | 6.9% |
| $150,000 to $199,999 | 2 | 0.8% |
| $200,000+ | 0 | 0.0% |
Family Income by Famaliy Size in Hilltop
4-person families (54 | 20.8%) account for the highest median family income in Hilltop with $55,682 per family, while 2-person families (139 | 53.7%) have the highest median income of $26,489 per family member.
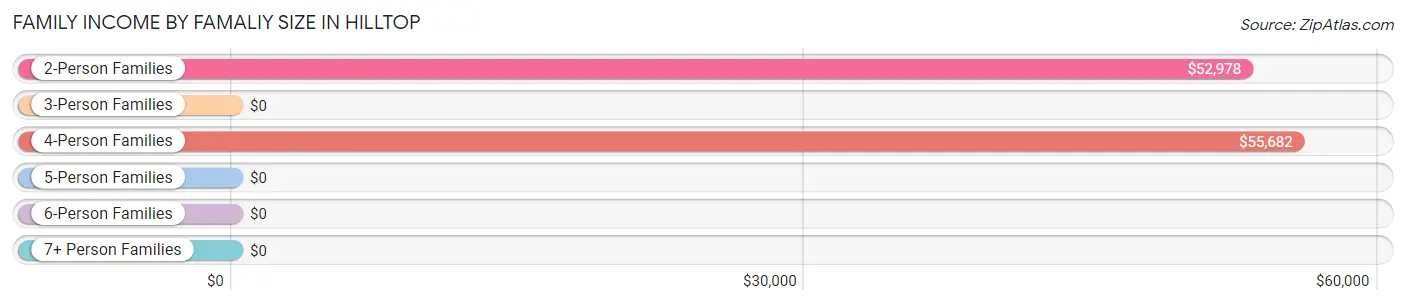
| Income Bracket | # Families | Median Income |
| 2-Person Families | 139 (53.7%) | $52,978 |
| 3-Person Families | 37 (14.3%) | $0 |
| 4-Person Families | 54 (20.8%) | $55,682 |
| 5-Person Families | 23 (8.9%) | $0 |
| 6-Person Families | 4 (1.5%) | $0 |
| 7+ Person Families | 2 (0.8%) | $0 |
| Total | 259 (100.0%) | $52,846 |
Family Income by Number of Earners in Hilltop
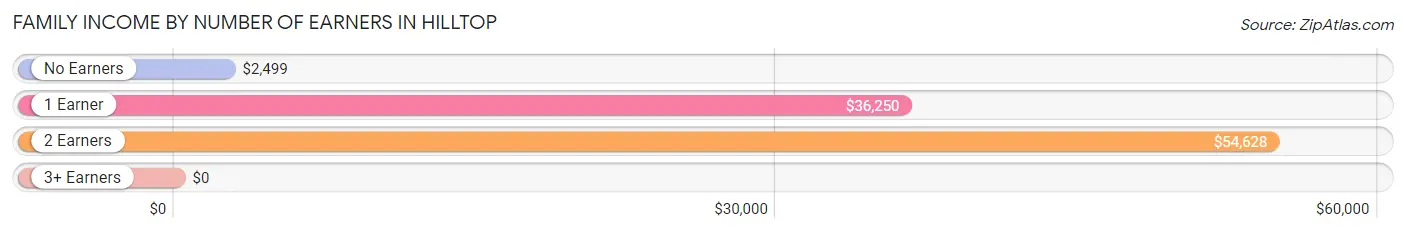
| Number of Earners | # Families | Median Income |
| No Earners | 14 (5.4%) | $2,499 |
| 1 Earner | 81 (31.3%) | $36,250 |
| 2 Earners | 154 (59.5%) | $54,628 |
| 3+ Earners | 10 (3.9%) | $0 |
| Total | 259 (100.0%) | $52,846 |
Household Income in Hilltop
Household Income Brackets in Hilltop
With 140 households falling in the category, the $50,000 to $74,999 income range is the most frequent in Hilltop, accounting for 34.1% of all households.
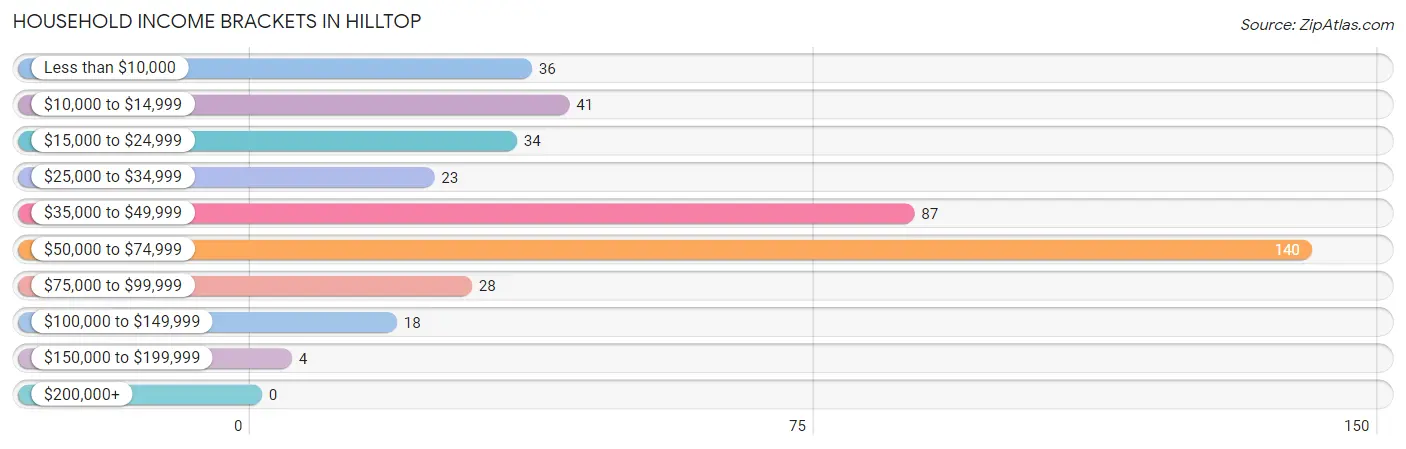
| Income Bracket | # Households | % Households |
| Less than $10,000 | 36 | 8.8% |
| $10,000 to $14,999 | 41 | 10.0% |
| $15,000 to $24,999 | 34 | 8.3% |
| $25,000 to $34,999 | 23 | 5.6% |
| $35,000 to $49,999 | 87 | 21.2% |
| $50,000 to $74,999 | 140 | 34.1% |
| $75,000 to $99,999 | 28 | 6.8% |
| $100,000 to $149,999 | 18 | 4.4% |
| $150,000 to $199,999 | 4 | 1.0% |
| $200,000+ | 0 | 0.0% |
Household Income by Householder Age in Hilltop
The median household income in Hilltop is $46,188, with the highest median household income of $53,026 found in the 25 to 44 years age bracket for the primary householder. A total of 174 households (42.3%) fall into this category. Meanwhile, the 65+ years age bracket for the primary householder has the lowest median household income of $33,750, with 61 households (14.8%) in this group.
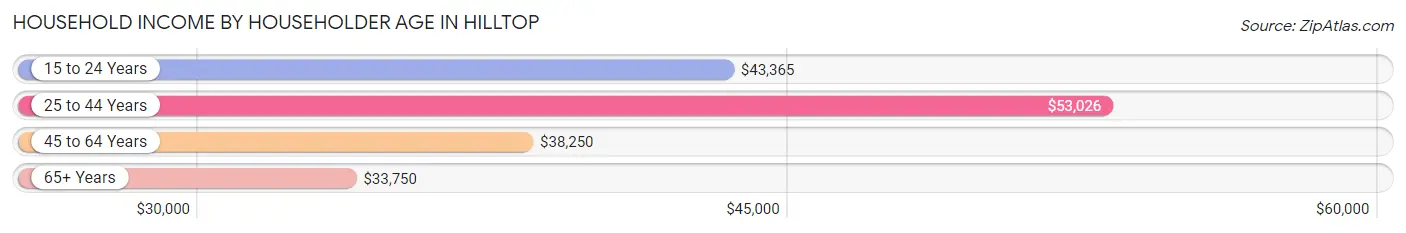
| Income Bracket | # Households | Median Income |
| 15 to 24 Years | 35 (8.5%) | $43,365 |
| 25 to 44 Years | 174 (42.3%) | $53,026 |
| 45 to 64 Years | 141 (34.3%) | $38,250 |
| 65+ Years | 61 (14.8%) | $33,750 |
| Total | 411 (100.0%) | $46,188 |
Poverty in Hilltop
Income Below Poverty by Sex and Age in Hilltop
With 16.4% poverty level for males and 24.9% for females among the residents of Hilltop, 75 year old and over males and 16 and 17 year old females are the most vulnerable to poverty, with 2 males (100.0%) and 2 females (100.0%) in their respective age groups living below the poverty level.
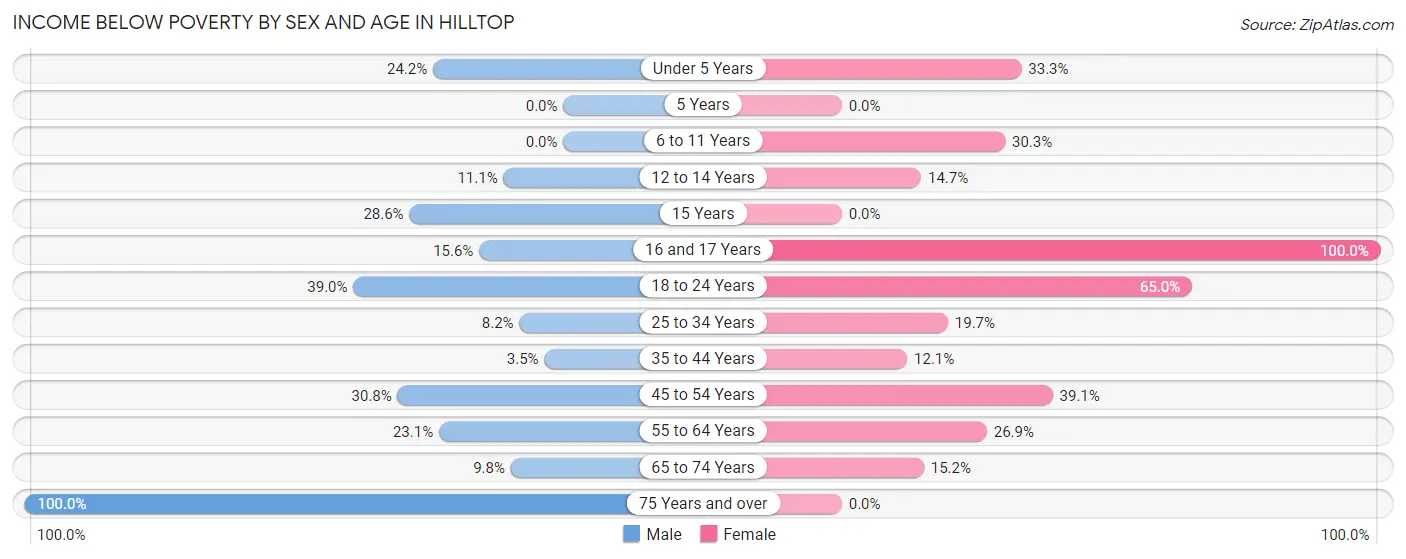
| Age Bracket | Male | Female |
| Under 5 Years | 15 (24.2%) | 12 (33.3%) |
| 5 Years | 0 (0.0%) | 0 (0.0%) |
| 6 to 11 Years | 0 (0.0%) | 10 (30.3%) |
| 12 to 14 Years | 1 (11.1%) | 5 (14.7%) |
| 15 Years | 2 (28.6%) | 0 (0.0%) |
| 16 and 17 Years | 5 (15.6%) | 2 (100.0%) |
| 18 to 24 Years | 23 (39.0%) | 13 (65.0%) |
| 25 to 34 Years | 8 (8.2%) | 25 (19.7%) |
| 35 to 44 Years | 4 (3.5%) | 4 (12.1%) |
| 45 to 54 Years | 12 (30.8%) | 18 (39.1%) |
| 55 to 64 Years | 21 (23.1%) | 7 (26.9%) |
| 65 to 74 Years | 4 (9.8%) | 7 (15.2%) |
| 75 Years and over | 2 (100.0%) | 0 (0.0%) |
| Total | 97 (16.4%) | 103 (24.9%) |
Income Above Poverty by Sex and Age in Hilltop
According to the poverty statistics in Hilltop, males aged 5 years and females aged 5 years are the age groups that are most secure financially, with 100.0% of males and 100.0% of females in these age groups living above the poverty line.
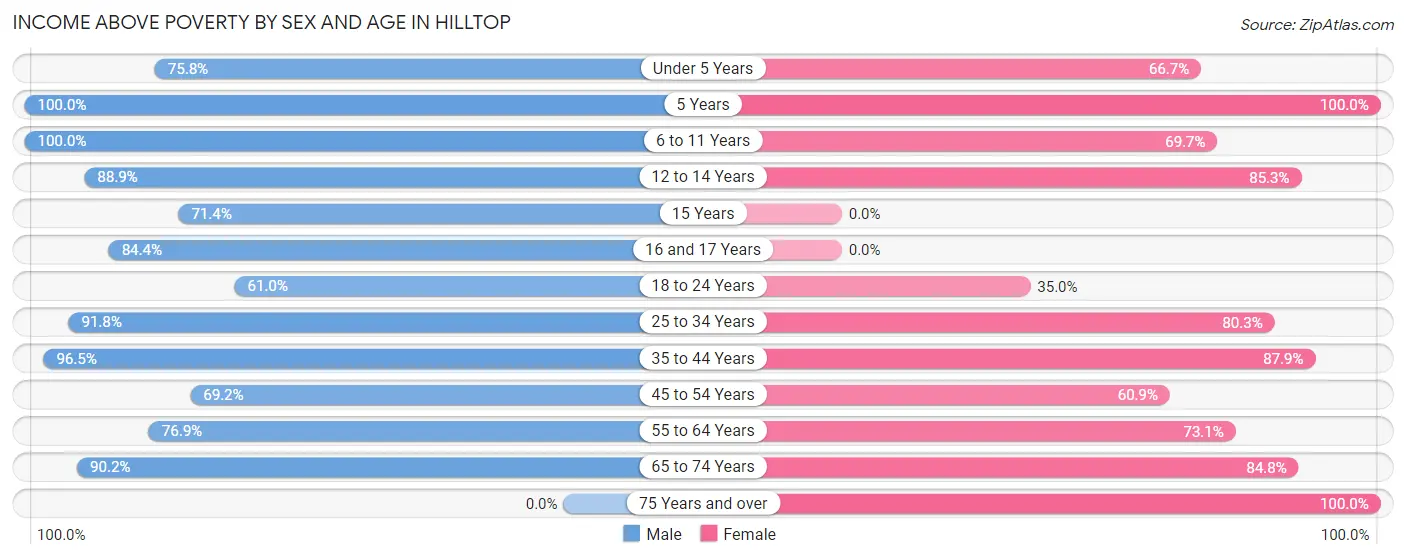
| Age Bracket | Male | Female |
| Under 5 Years | 47 (75.8%) | 24 (66.7%) |
| 5 Years | 8 (100.0%) | 2 (100.0%) |
| 6 to 11 Years | 29 (100.0%) | 23 (69.7%) |
| 12 to 14 Years | 8 (88.9%) | 29 (85.3%) |
| 15 Years | 5 (71.4%) | 0 (0.0%) |
| 16 and 17 Years | 27 (84.4%) | 0 (0.0%) |
| 18 to 24 Years | 36 (61.0%) | 7 (35.0%) |
| 25 to 34 Years | 90 (91.8%) | 102 (80.3%) |
| 35 to 44 Years | 110 (96.5%) | 29 (87.9%) |
| 45 to 54 Years | 27 (69.2%) | 28 (60.9%) |
| 55 to 64 Years | 70 (76.9%) | 19 (73.1%) |
| 65 to 74 Years | 37 (90.2%) | 39 (84.8%) |
| 75 Years and over | 0 (0.0%) | 9 (100.0%) |
| Total | 494 (83.6%) | 311 (75.1%) |
Income Below Poverty Among Married-Couple Families in Hilltop
The poverty statistics for married-couple families in Hilltop show that 10.7% or 15 of the total 140 families live below the poverty line. Families with 1 or 2 children have the highest poverty rate of 23.3%, comprising of 7 families. On the other hand, families with 3 or 4 children have the lowest poverty rate of 0.0%, which includes 0 families.
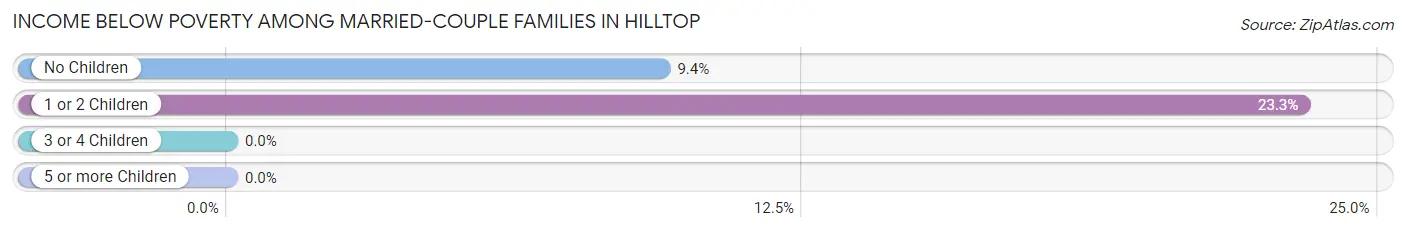
| Children | Above Poverty | Below Poverty |
| No Children | 77 (90.6%) | 8 (9.4%) |
| 1 or 2 Children | 23 (76.7%) | 7 (23.3%) |
| 3 or 4 Children | 25 (100.0%) | 0 (0.0%) |
| 5 or more Children | 0 (0.0%) | 0 (0.0%) |
| Total | 125 (89.3%) | 15 (10.7%) |
Income Below Poverty Among Single-Parent Households in Hilltop
According to the poverty data in Hilltop, 8.2% or 4 single-father households and 28.6% or 20 single-mother households are living below the poverty line. Among single-father households, those with 1 or 2 children have the highest poverty rate, with 4 households (17.4%) experiencing poverty. Likewise, among single-mother households, those with 3 or 4 children have the highest poverty rate, with 4 households (57.1%) falling below the poverty line.
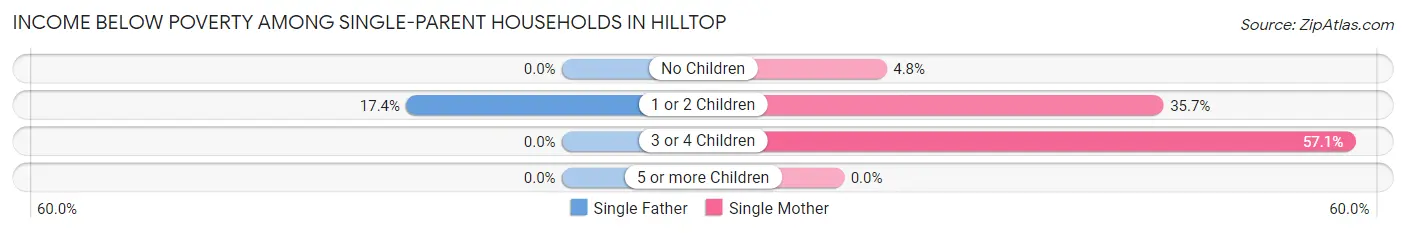
| Children | Single Father | Single Mother |
| No Children | 0 (0.0%) | 1 (4.8%) |
| 1 or 2 Children | 4 (17.4%) | 15 (35.7%) |
| 3 or 4 Children | 0 (0.0%) | 4 (57.1%) |
| 5 or more Children | 0 (0.0%) | 0 (0.0%) |
| Total | 4 (8.2%) | 20 (28.6%) |
Income Below Poverty Among Married-Couple vs Single-Parent Households in Hilltop
The poverty data for Hilltop shows that 15 of the married-couple family households (10.7%) and 24 of the single-parent households (20.2%) are living below the poverty level. Within the married-couple family households, those with 1 or 2 children have the highest poverty rate, with 7 households (23.3%) falling below the poverty line. Among the single-parent households, those with 3 or 4 children have the highest poverty rate, with 4 household (30.8%) living below poverty.
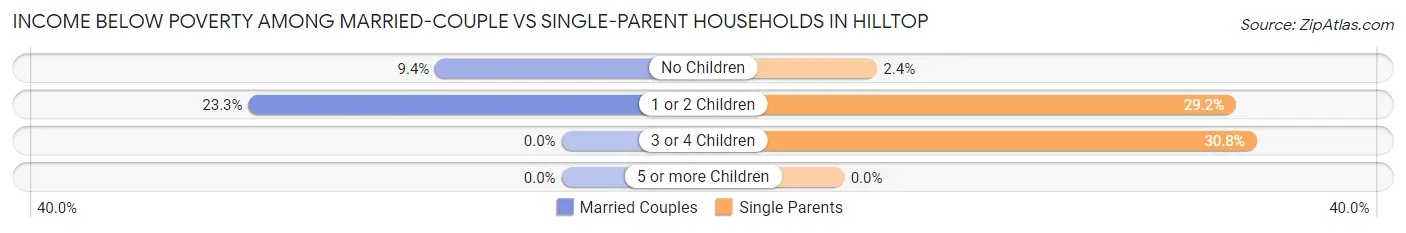
| Children | Married-Couple Families | Single-Parent Households |
| No Children | 8 (9.4%) | 1 (2.4%) |
| 1 or 2 Children | 7 (23.3%) | 19 (29.2%) |
| 3 or 4 Children | 0 (0.0%) | 4 (30.8%) |
| 5 or more Children | 0 (0.0%) | 0 (0.0%) |
| Total | 15 (10.7%) | 24 (20.2%) |
Race in Hilltop
The most populous races in Hilltop are Hispanic or Latino (405 | 40.3%), White / Caucasian (327 | 32.5%), and Some other Race (278 | 27.7%).
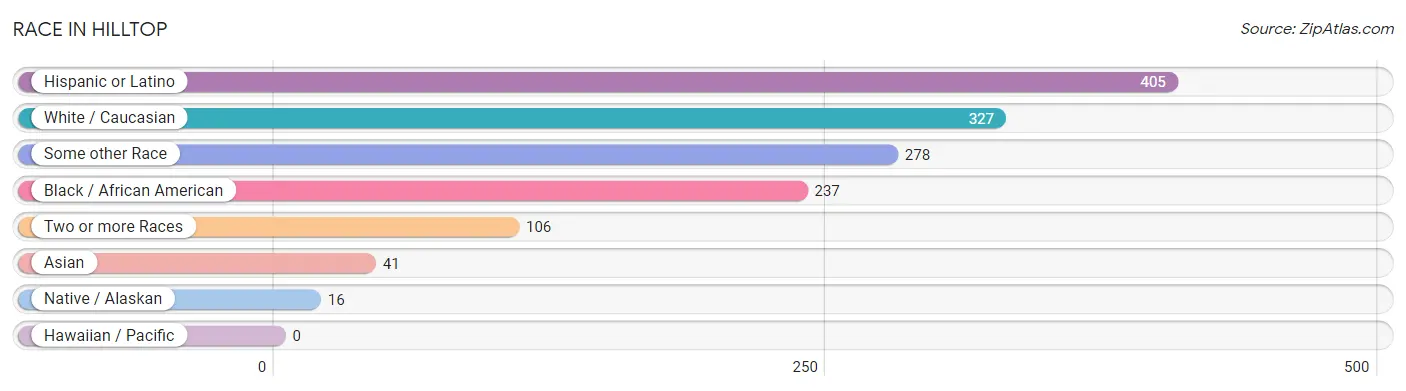
| Race | # Population | % Population |
| Asian | 41 | 4.1% |
| Black / African American | 237 | 23.6% |
| Hawaiian / Pacific | 0 | 0.0% |
| Hispanic or Latino | 405 | 40.3% |
| Native / Alaskan | 16 | 1.6% |
| White / Caucasian | 327 | 32.5% |
| Two or more Races | 106 | 10.5% |
| Some other Race | 278 | 27.7% |
| Total | 1,005 | 100.0% |
Ancestry in Hilltop
The most populous ancestries reported in Hilltop are South American (239 | 23.8%), Ecuadorian (232 | 23.1%), Subsaharan African (158 | 15.7%), Mexican (135 | 13.4%), and Somali (87 | 8.7%), together accounting for 84.7% of all Hilltop residents.
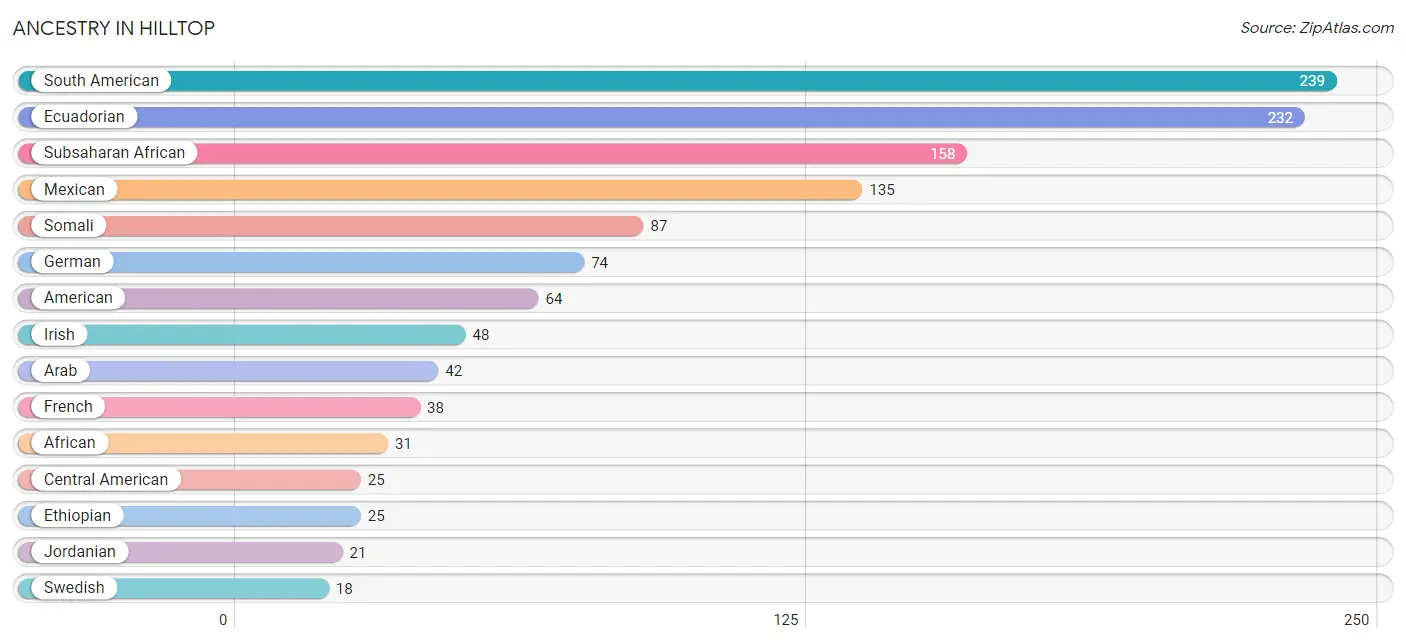
| Ancestry | # Population | % Population |
| African | 31 | 3.1% |
| American | 64 | 6.4% |
| Arab | 42 | 4.2% |
| Burmese | 6 | 0.6% |
| Carpatho Rusyn | 2 | 0.2% |
| Central American | 25 | 2.5% |
| Central American Indian | 3 | 0.3% |
| Colombian | 7 | 0.7% |
| Cuban | 3 | 0.3% |
| Czech | 9 | 0.9% |
| Dutch | 2 | 0.2% |
| Ecuadorian | 232 | 23.1% |
| Egyptian | 8 | 0.8% |
| English | 12 | 1.2% |
| Ethiopian | 25 | 2.5% |
| European | 6 | 0.6% |
| French | 38 | 3.8% |
| French Canadian | 4 | 0.4% |
| German | 74 | 7.4% |
| Guatemalan | 2 | 0.2% |
| Honduran | 6 | 0.6% |
| Hungarian | 2 | 0.2% |
| Irish | 48 | 4.8% |
| Italian | 2 | 0.2% |
| Jordanian | 21 | 2.1% |
| Malaysian | 8 | 0.8% |
| Mexican | 135 | 13.4% |
| Norwegian | 12 | 1.2% |
| Polish | 4 | 0.4% |
| Puerto Rican | 3 | 0.3% |
| Salvadoran | 17 | 1.7% |
| Scottish | 2 | 0.2% |
| Sioux | 3 | 0.3% |
| Somali | 87 | 8.7% |
| South American | 239 | 23.8% |
| Sri Lankan | 14 | 1.4% |
| Subsaharan African | 158 | 15.7% |
| Sudanese | 14 | 1.4% |
| Swedish | 18 | 1.8% |
| Thai | 8 | 0.8% |
| Turkish | 2 | 0.2% |
| Ukrainian | 2 | 0.2% | View All 42 Rows |
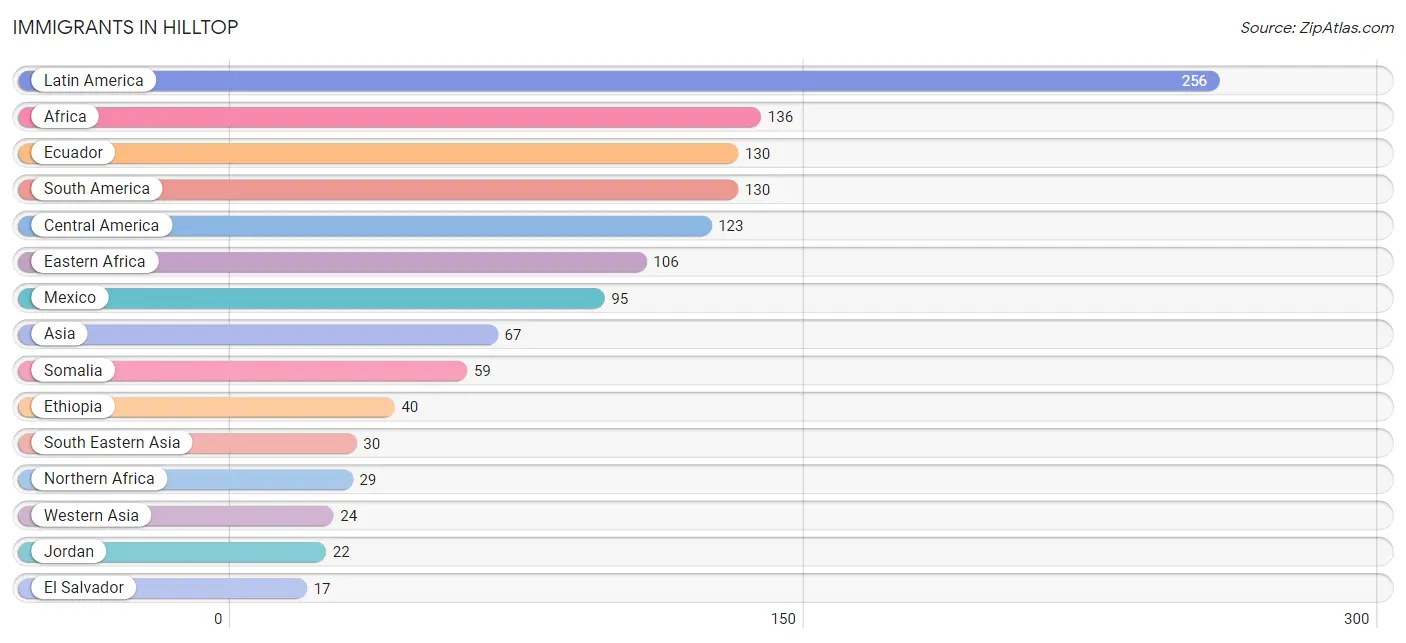
Immigrants in Hilltop
The most numerous immigrant groups reported in Hilltop came from Latin America (256 | 25.5%), Africa (136 | 13.5%), Ecuador (130 | 12.9%), South America (130 | 12.9%), and Central America (123 | 12.2%), together accounting for 77.1% of all Hilltop residents.
| Immigration Origin | # Population | % Population |
| Africa | 136 | 13.5% |
| Asia | 67 | 6.7% |
| Bangladesh | 5 | 0.5% |
| Cameroon | 1 | 0.1% |
| Caribbean | 3 | 0.3% |
| Central America | 123 | 12.2% |
| China | 5 | 0.5% |
| Cuba | 3 | 0.3% |
| Eastern Africa | 106 | 10.5% |
| Eastern Asia | 5 | 0.5% |
| Eastern Europe | 2 | 0.2% |
| Ecuador | 130 | 12.9% |
| Egypt | 8 | 0.8% |
| El Salvador | 17 | 1.7% |
| Ethiopia | 40 | 4.0% |
| Europe | 2 | 0.2% |
| Honduras | 11 | 1.1% |
| Jordan | 22 | 2.2% |
| Kenya | 7 | 0.7% |
| Laos | 16 | 1.6% |
| Latin America | 256 | 25.5% |
| Mexico | 95 | 9.5% |
| Middle Africa | 1 | 0.1% |
| Northern Africa | 29 | 2.9% |
| Pakistan | 3 | 0.3% |
| Romania | 2 | 0.2% |
| Somalia | 59 | 5.9% |
| South America | 130 | 12.9% |
| South Central Asia | 8 | 0.8% |
| South Eastern Asia | 30 | 3.0% |
| Sudan | 14 | 1.4% |
| Turkey | 2 | 0.2% |
| Vietnam | 14 | 1.4% |
| Western Asia | 24 | 2.4% | View All 34 Rows |
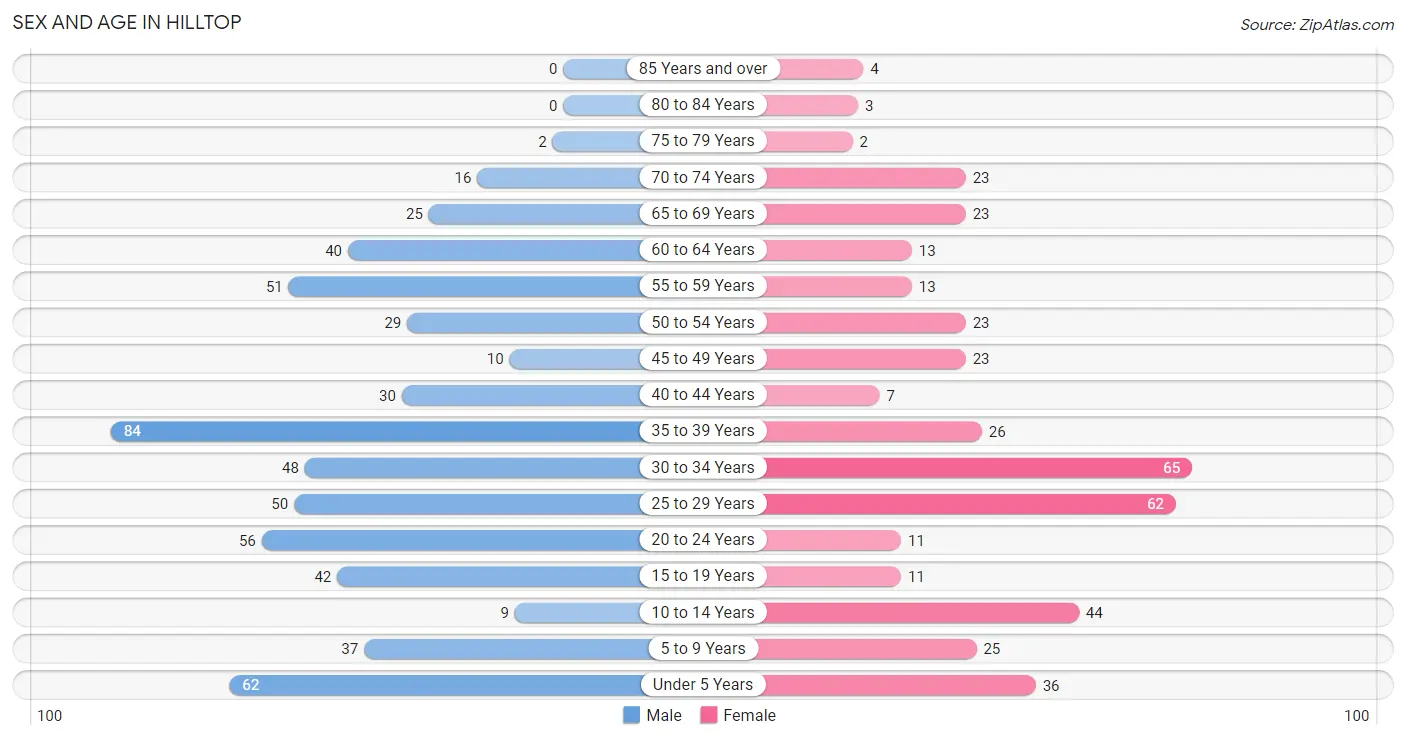
Sex and Age in Hilltop
Sex and Age in Hilltop
The most populous age groups in Hilltop are 35 to 39 Years (84 | 14.2%) for men and 30 to 34 Years (65 | 15.7%) for women.
| Age Bracket | Male | Female |
| Under 5 Years | 62 (10.5%) | 36 (8.7%) |
| 5 to 9 Years | 37 (6.3%) | 25 (6.0%) |
| 10 to 14 Years | 9 (1.5%) | 44 (10.6%) |
| 15 to 19 Years | 42 (7.1%) | 11 (2.7%) |
| 20 to 24 Years | 56 (9.5%) | 11 (2.7%) |
| 25 to 29 Years | 50 (8.5%) | 62 (15.0%) |
| 30 to 34 Years | 48 (8.1%) | 65 (15.7%) |
| 35 to 39 Years | 84 (14.2%) | 26 (6.3%) |
| 40 to 44 Years | 30 (5.1%) | 7 (1.7%) |
| 45 to 49 Years | 10 (1.7%) | 23 (5.6%) |
| 50 to 54 Years | 29 (4.9%) | 23 (5.6%) |
| 55 to 59 Years | 51 (8.6%) | 13 (3.1%) |
| 60 to 64 Years | 40 (6.8%) | 13 (3.1%) |
| 65 to 69 Years | 25 (4.2%) | 23 (5.6%) |
| 70 to 74 Years | 16 (2.7%) | 23 (5.6%) |
| 75 to 79 Years | 2 (0.3%) | 2 (0.5%) |
| 80 to 84 Years | 0 (0.0%) | 3 (0.7%) |
| 85 Years and over | 0 (0.0%) | 4 (1.0%) |
| Total | 591 (100.0%) | 414 (100.0%) |
Families and Households in Hilltop
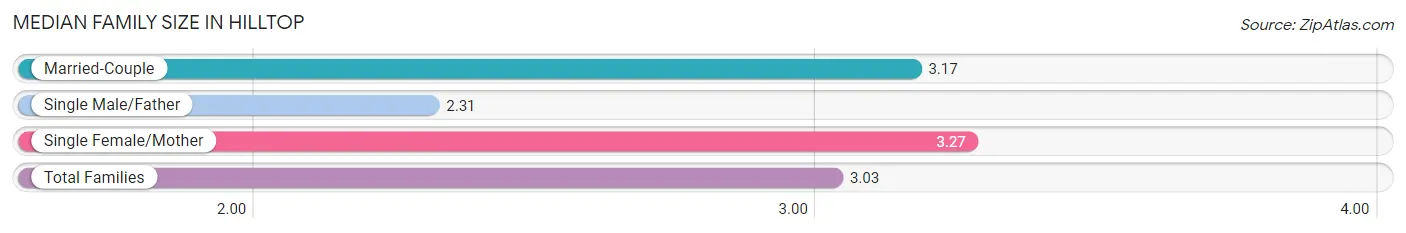
Median Family Size in Hilltop
The median family size in Hilltop is 3.03 persons per family, with single female/mother families (70 | 27.0%) accounting for the largest median family size of 3.27 persons per family. On the other hand, single male/father families (49 | 18.9%) represent the smallest median family size with 2.31 persons per family.
| Family Type | # Families | Family Size |
| Married-Couple | 140 (54.0%) | 3.17 |
| Single Male/Father | 49 (18.9%) | 2.31 |
| Single Female/Mother | 70 (27.0%) | 3.27 |
| Total Families | 259 (100.0%) | 3.03 |
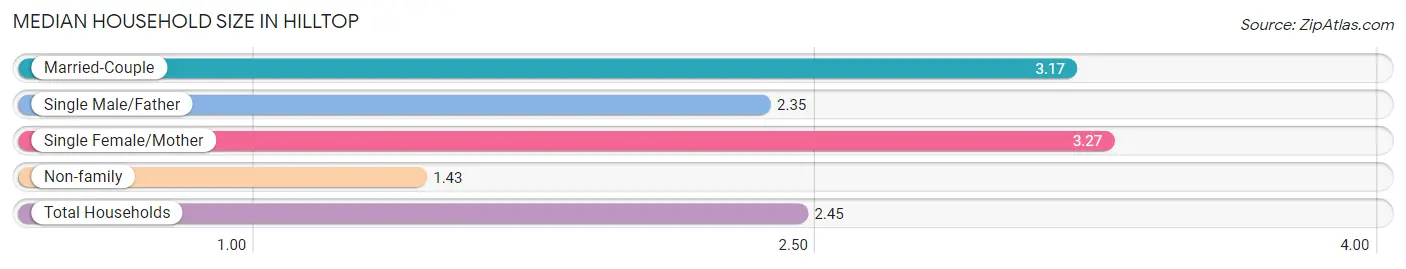
Median Household Size in Hilltop
The median household size in Hilltop is 2.45 persons per household, with single female/mother households (70 | 17.0%) accounting for the largest median household size of 3.27 persons per household. non-family households (152 | 37.0%) represent the smallest median household size with 1.43 persons per household.
| Household Type | # Households | Household Size |
| Married-Couple | 140 (34.1%) | 3.17 |
| Single Male/Father | 49 (11.9%) | 2.35 |
| Single Female/Mother | 70 (17.0%) | 3.27 |
| Non-family | 152 (37.0%) | 1.43 |
| Total Households | 411 (100.0%) | 2.45 |
Household Size by Marriage Status in Hilltop
Out of a total of 411 households in Hilltop, 259 (63.0%) are family households, while 152 (37.0%) are nonfamily households. The most numerous type of family households are 2-person households, comprising 139, and the most common type of nonfamily households are 1-person households, comprising 113.
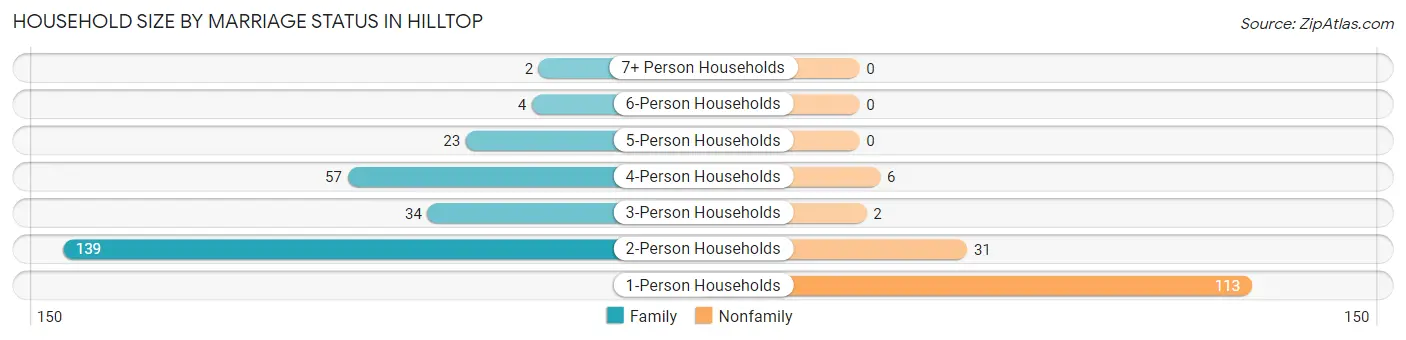
| Household Size | Family Households | Nonfamily Households |
| 1-Person Households | - | 113 (27.5%) |
| 2-Person Households | 139 (33.8%) | 31 (7.5%) |
| 3-Person Households | 34 (8.3%) | 2 (0.5%) |
| 4-Person Households | 57 (13.9%) | 6 (1.5%) |
| 5-Person Households | 23 (5.6%) | 0 (0.0%) |
| 6-Person Households | 4 (1.0%) | 0 (0.0%) |
| 7+ Person Households | 2 (0.5%) | 0 (0.0%) |
| Total | 259 (63.0%) | 152 (37.0%) |
Female Fertility in Hilltop
Fertility by Age in Hilltop
Average fertility rate in Hilltop is 92.0 births per 1,000 women. Women in the age bracket of 20 to 34 years have the highest fertility rate with 109.0 births per 1,000 women. Women in the age bracket of 20 to 34 years acount for 78.9% of all women with births.
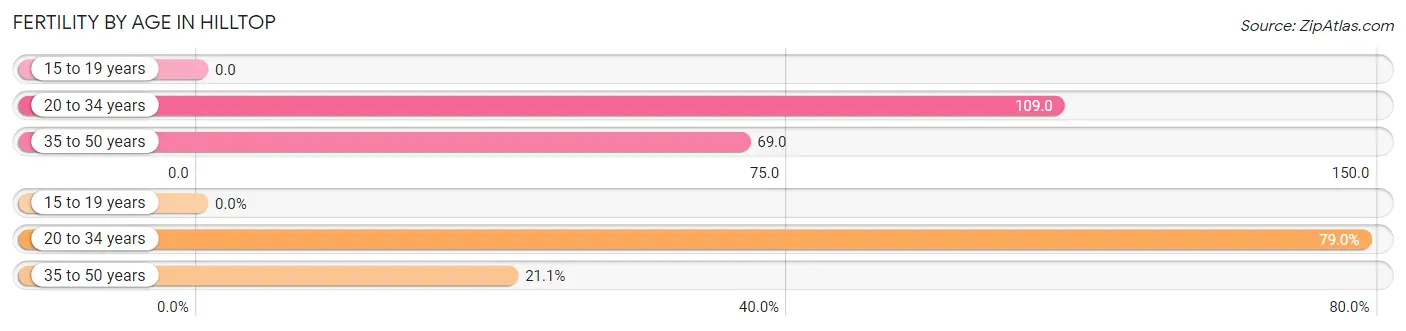
| Age Bracket | Women with Births | Births / 1,000 Women |
| 15 to 19 years | 0 (0.0%) | 0.0 |
| 20 to 34 years | 15 (78.9%) | 109.0 |
| 35 to 50 years | 4 (21.0%) | 69.0 |
| Total | 19 (100.0%) | 92.0 |
Fertility by Age by Marriage Status in Hilltop
63.2% of women with births (19) in Hilltop are married. The highest percentage of unmarried women with births falls into 20 to 34 years age bracket with 46.7% of them unmarried at the time of birth, while the lowest percentage of unmarried women with births belong to 35 to 50 years age bracket with 0.0% of them unmarried.
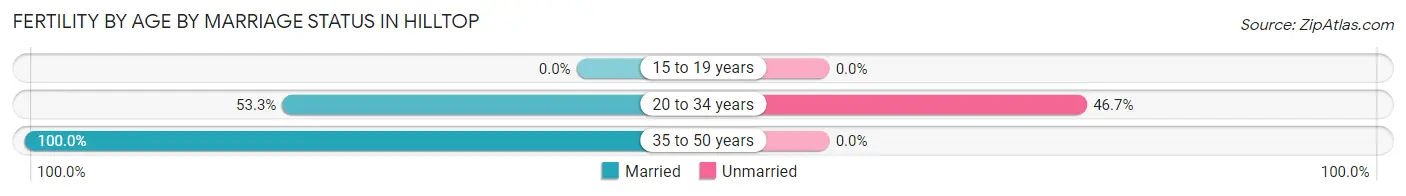
| Age Bracket | Married | Unmarried |
| 15 to 19 years | 0 (0.0%) | 0 (0.0%) |
| 20 to 34 years | 8 (53.3%) | 7 (46.7%) |
| 35 to 50 years | 4 (100.0%) | 0 (0.0%) |
| Total | 12 (63.2%) | 7 (36.8%) |
Fertility by Education in Hilltop
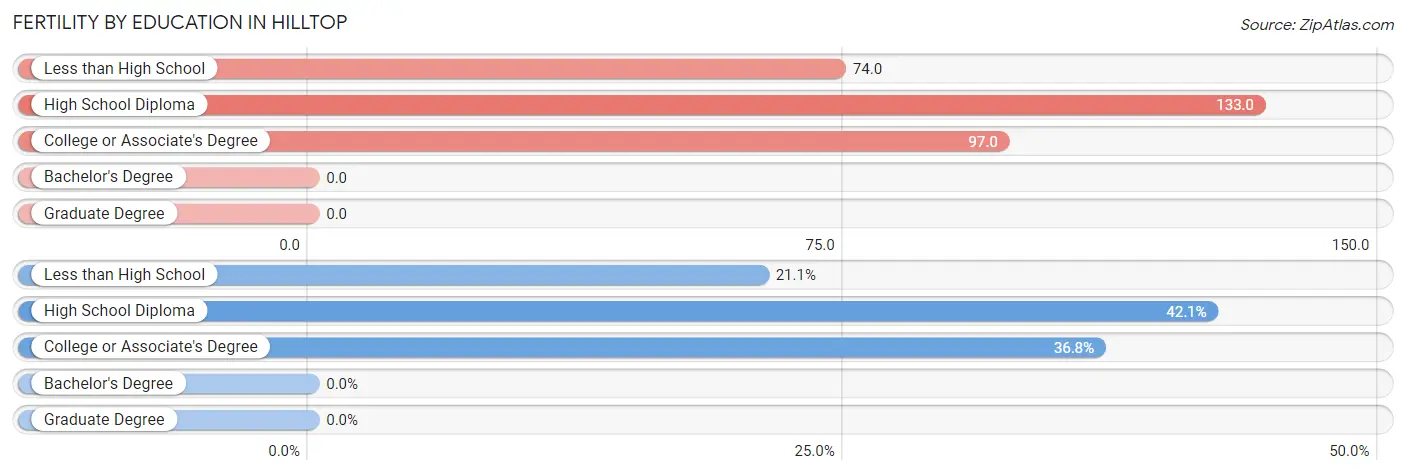
| Educational Attainment | Women with Births | Births / 1,000 Women |
| Less than High School | 4 (21.0%) | 74.0 |
| High School Diploma | 8 (42.1%) | 133.0 |
| College or Associate's Degree | 7 (36.8%) | 97.0 |
| Bachelor's Degree | 0 (0.0%) | 0.0 |
| Graduate Degree | 0 (0.0%) | 0.0 |
| Total | 19 (100.0%) | 92.0 |
Fertility by Education by Marriage Status in Hilltop
36.8% of women with births in Hilltop are unmarried. Women with the educational attainment of less than high school are most likely to be married with 100.0% of them married at childbirth, while women with the educational attainment of college or associate's degree are least likely to be married with 100.0% of them unmarried at childbirth.
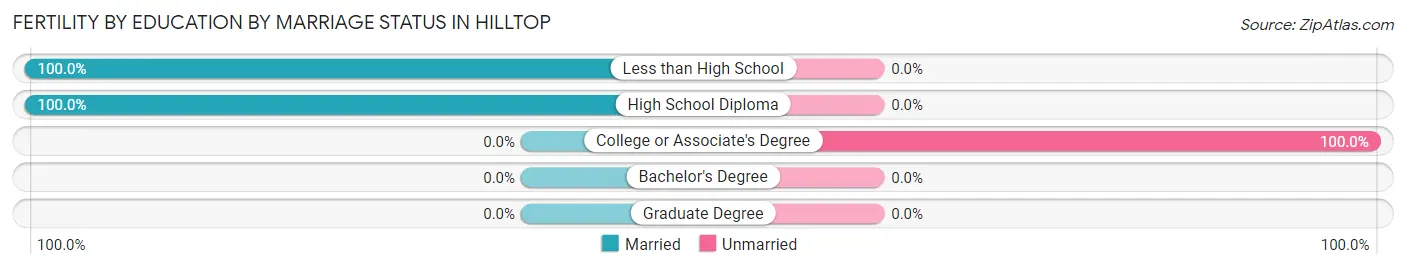
| Educational Attainment | Married | Unmarried |
| Less than High School | 4 (100.0%) | 0 (0.0%) |
| High School Diploma | 8 (100.0%) | 0 (0.0%) |
| College or Associate's Degree | 0 (0.0%) | 7 (100.0%) |
| Bachelor's Degree | 0 (0.0%) | 0 (0.0%) |
| Graduate Degree | 0 (0.0%) | 0 (0.0%) |
| Total | 12 (63.2%) | 7 (36.8%) |
Employment Characteristics in Hilltop
Employment by Class of Employer in Hilltop
Among the 471 employed individuals in Hilltop, private company employees (405 | 86.0%), not-for-profit organizations (23 | 4.9%), and self-employed (not incorporated) (14 | 3.0%) make up the most common classes of employment.
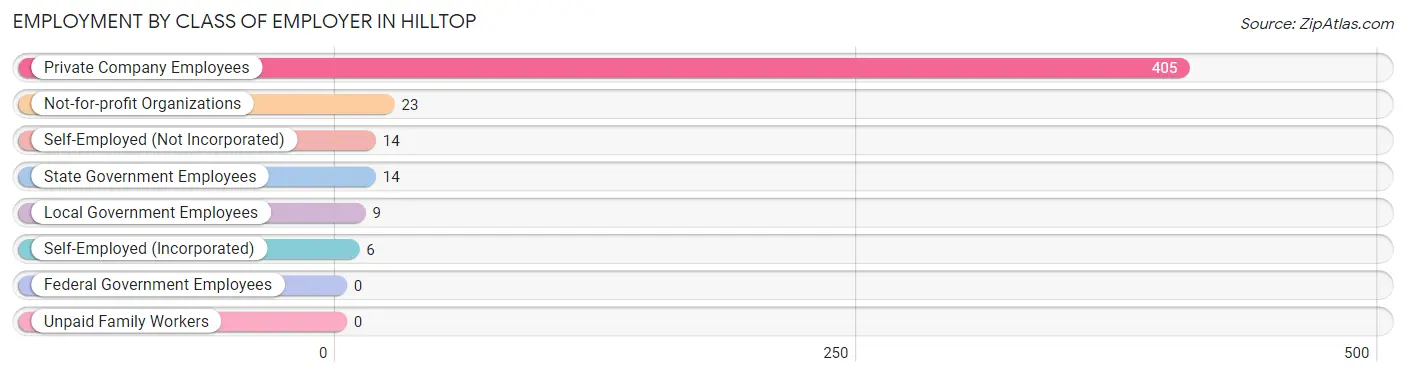
| Employer Class | # Employees | % Employees |
| Private Company Employees | 405 | 86.0% |
| Self-Employed (Incorporated) | 6 | 1.3% |
| Self-Employed (Not Incorporated) | 14 | 3.0% |
| Not-for-profit Organizations | 23 | 4.9% |
| Local Government Employees | 9 | 1.9% |
| State Government Employees | 14 | 3.0% |
| Federal Government Employees | 0 | 0.0% |
| Unpaid Family Workers | 0 | 0.0% |
| Total | 471 | 100.0% |
Employment Status by Age in Hilltop
According to the labor force statistics for Hilltop, out of the total population over 16 years of age (785), 74.5% or 585 individuals are in the labor force, with 17.6% or 103 of them unemployed. The age group with the highest labor force participation rate is 35 to 44 years, with 98.0% or 144 individuals in the labor force. Within the labor force, the 60 to 64 years age range has the highest percentage of unemployed individuals, with 60.0% or 3 of them being unemployed.
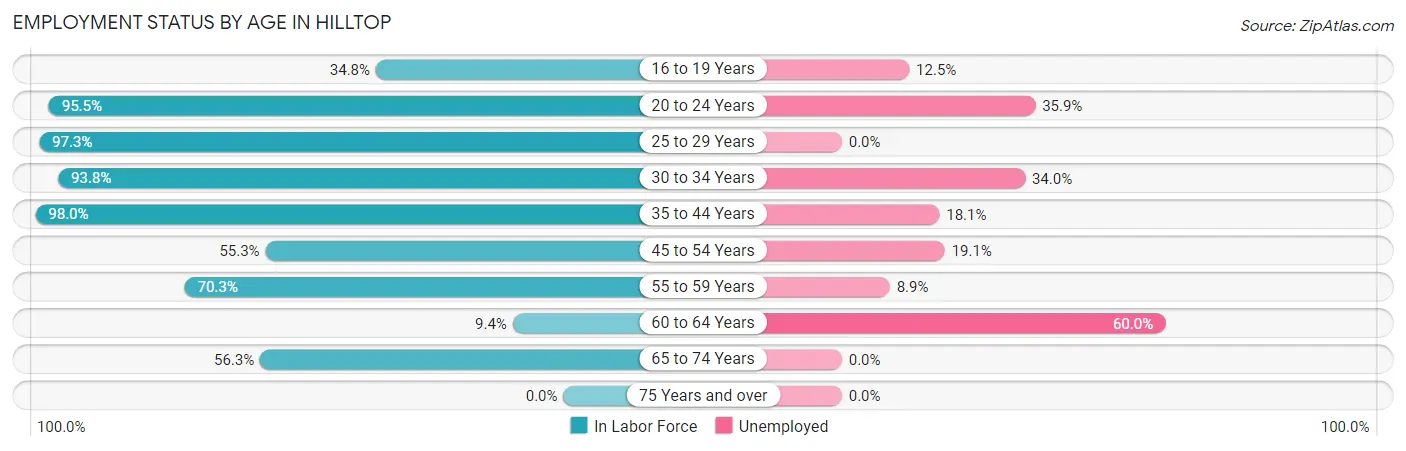
| Age Bracket | In Labor Force | Unemployed |
| 16 to 19 Years | 16 (34.8%) | 2 (12.5%) |
| 20 to 24 Years | 64 (95.5%) | 23 (35.9%) |
| 25 to 29 Years | 109 (97.3%) | 0 (0.0%) |
| 30 to 34 Years | 106 (93.8%) | 36 (34.0%) |
| 35 to 44 Years | 144 (98.0%) | 26 (18.1%) |
| 45 to 54 Years | 47 (55.3%) | 9 (19.1%) |
| 55 to 59 Years | 45 (70.3%) | 4 (8.9%) |
| 60 to 64 Years | 5 (9.4%) | 3 (60.0%) |
| 65 to 74 Years | 49 (56.3%) | 0 (0.0%) |
| 75 Years and over | 0 (0.0%) | 0 (0.0%) |
| Total | 585 (74.5%) | 103 (17.6%) |
Employment Status by Educational Attainment in Hilltop
According to labor force statistics for Hilltop, 79.4% of individuals (456) out of the total population between 25 and 64 years of age (574) are in the labor force, with 17.1% or 78 of them being unemployed. The group with the highest labor force participation rate are those with the educational attainment of high school diploma, with 91.3% or 179 individuals in the labor force. Within the labor force, individuals with high school diploma education have the highest percentage of unemployment, with 30.2% or 54 of them being unemployed.
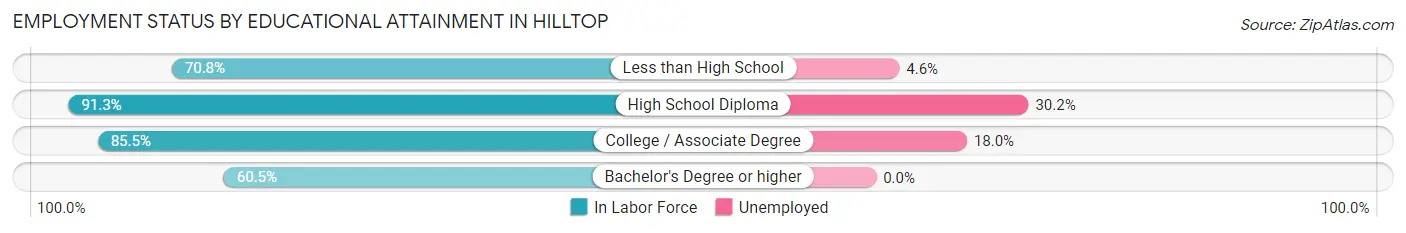
| Educational Attainment | In Labor Force | Unemployed |
| Less than High School | 131 (70.8%) | 9 (4.6%) |
| High School Diploma | 179 (91.3%) | 59 (30.2%) |
| College / Associate Degree | 100 (85.5%) | 21 (18.0%) |
| Bachelor's Degree or higher | 46 (60.5%) | 0 (0.0%) |
| Total | 456 (79.4%) | 98 (17.1%) |
Employment Occupations by Sex in Hilltop
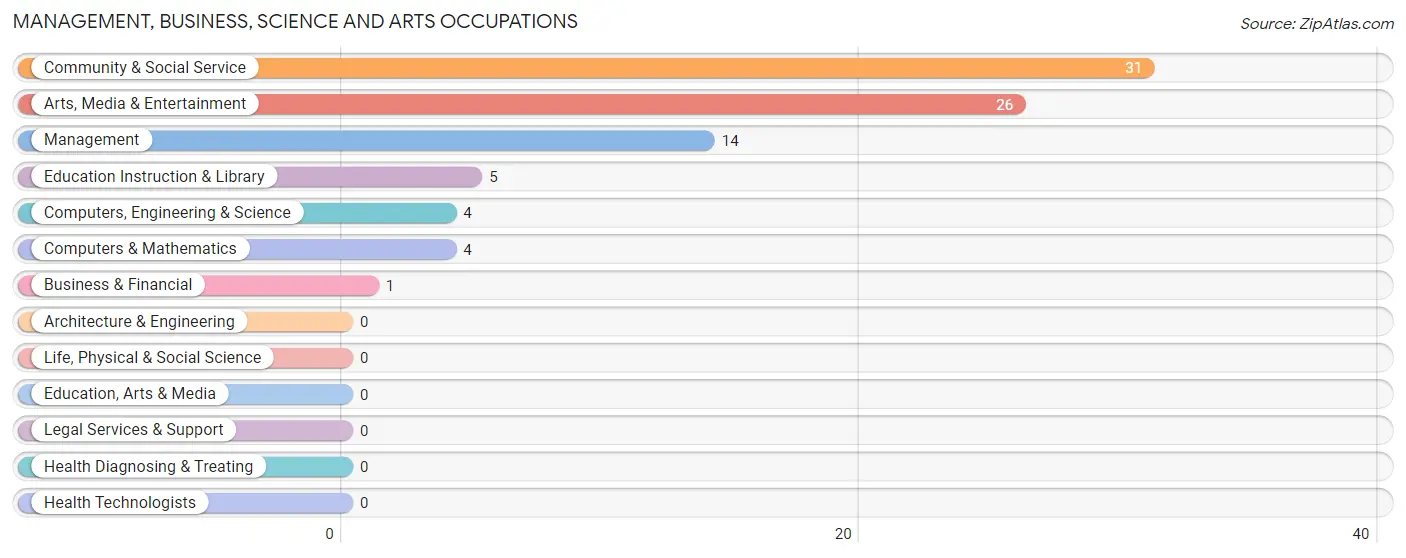
Management, Business, Science and Arts Occupations
The most common Management, Business, Science and Arts occupations in Hilltop are Community & Social Service (31 | 6.4%), Arts, Media & Entertainment (26 | 5.4%), Management (14 | 2.9%), Education Instruction & Library (5 | 1.0%), and Computers, Engineering & Science (4 | 0.8%).
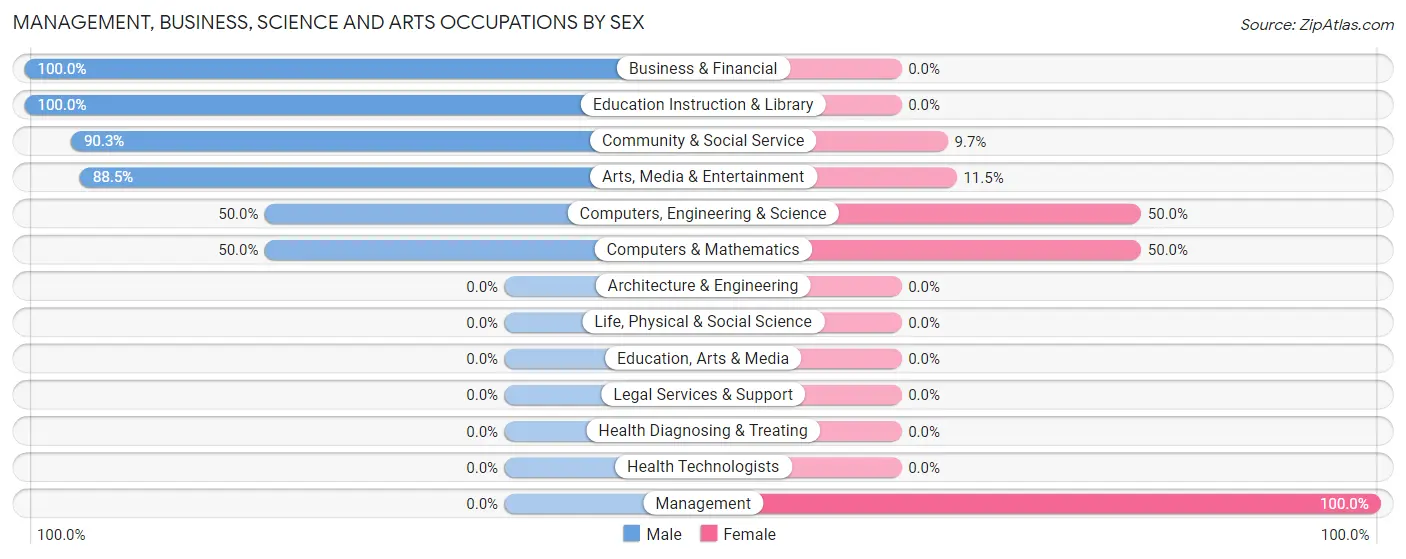
Management, Business, Science and Arts Occupations by Sex
Within the Management, Business, Science and Arts occupations in Hilltop, the most male-oriented occupations are Business & Financial (100.0%), Education Instruction & Library (100.0%), and Community & Social Service (90.3%), while the most female-oriented occupations are Management (100.0%), Computers, Engineering & Science (50.0%), and Computers & Mathematics (50.0%).
| Occupation | Male | Female |
| Management | 0 (0.0%) | 14 (100.0%) |
| Business & Financial | 1 (100.0%) | 0 (0.0%) |
| Computers, Engineering & Science | 2 (50.0%) | 2 (50.0%) |
| Computers & Mathematics | 2 (50.0%) | 2 (50.0%) |
| Architecture & Engineering | 0 (0.0%) | 0 (0.0%) |
| Life, Physical & Social Science | 0 (0.0%) | 0 (0.0%) |
| Community & Social Service | 28 (90.3%) | 3 (9.7%) |
| Education, Arts & Media | 0 (0.0%) | 0 (0.0%) |
| Legal Services & Support | 0 (0.0%) | 0 (0.0%) |
| Education Instruction & Library | 5 (100.0%) | 0 (0.0%) |
| Arts, Media & Entertainment | 23 (88.5%) | 3 (11.5%) |
| Health Diagnosing & Treating | 0 (0.0%) | 0 (0.0%) |
| Health Technologists | 0 (0.0%) | 0 (0.0%) |
| Total (Category) | 31 (62.0%) | 19 (38.0%) |
| Total (Overall) | 287 (59.5%) | 195 (40.5%) |
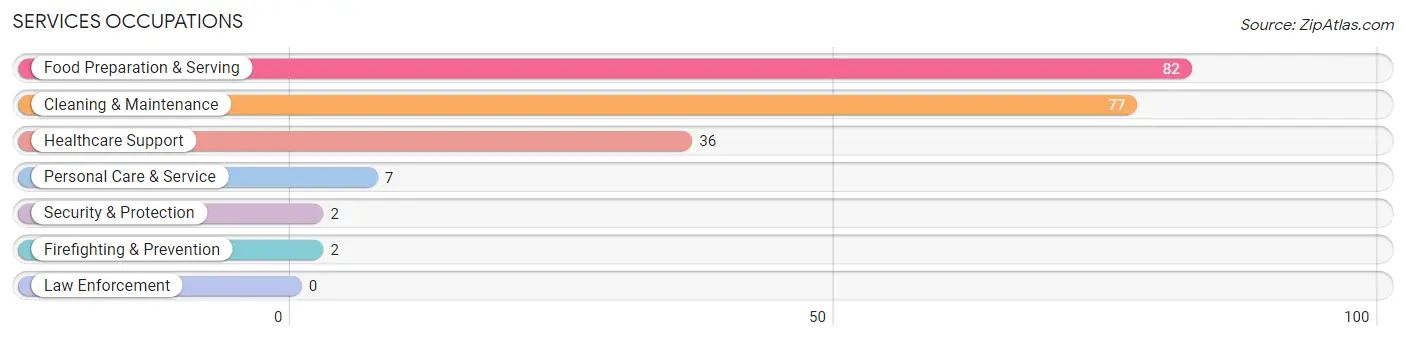
Services Occupations
The most common Services occupations in Hilltop are Food Preparation & Serving (82 | 17.0%), Cleaning & Maintenance (77 | 16.0%), Healthcare Support (36 | 7.5%), Personal Care & Service (7 | 1.5%), and Security & Protection (2 | 0.4%).
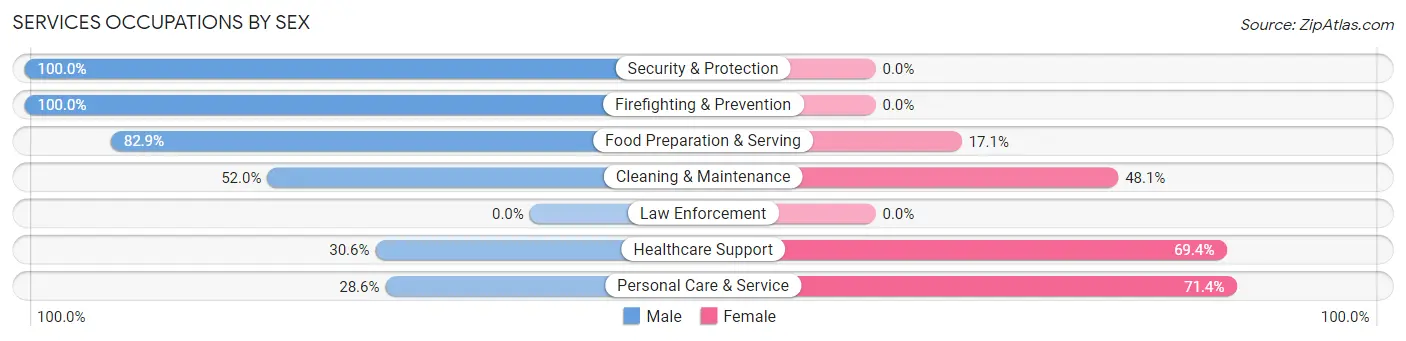
Services Occupations by Sex
Within the Services occupations in Hilltop, the most male-oriented occupations are Security & Protection (100.0%), Firefighting & Prevention (100.0%), and Food Preparation & Serving (82.9%), while the most female-oriented occupations are Personal Care & Service (71.4%), Healthcare Support (69.4%), and Cleaning & Maintenance (48.0%).
| Occupation | Male | Female |
| Healthcare Support | 11 (30.6%) | 25 (69.4%) |
| Security & Protection | 2 (100.0%) | 0 (0.0%) |
| Firefighting & Prevention | 2 (100.0%) | 0 (0.0%) |
| Law Enforcement | 0 (0.0%) | 0 (0.0%) |
| Food Preparation & Serving | 68 (82.9%) | 14 (17.1%) |
| Cleaning & Maintenance | 40 (51.9%) | 37 (48.0%) |
| Personal Care & Service | 2 (28.6%) | 5 (71.4%) |
| Total (Category) | 123 (60.3%) | 81 (39.7%) |
| Total (Overall) | 287 (59.5%) | 195 (40.5%) |
Sales and Office Occupations
The most common Sales and Office occupations in Hilltop are Sales & Related (49 | 10.2%), and Office & Administration (43 | 8.9%).
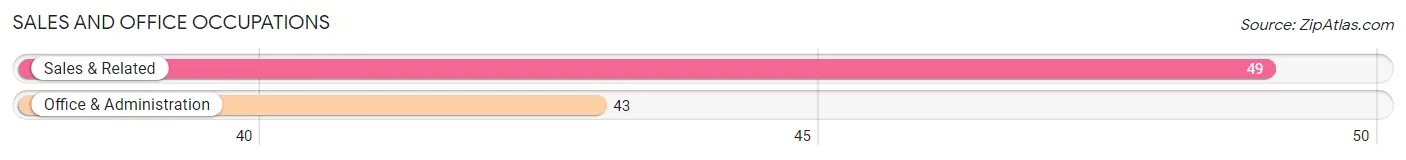
Sales and Office Occupations by Sex
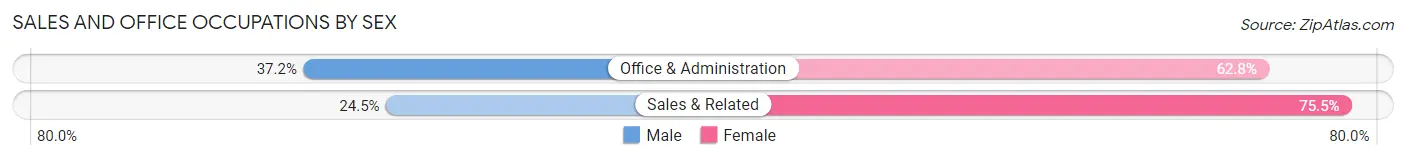
| Occupation | Male | Female |
| Sales & Related | 12 (24.5%) | 37 (75.5%) |
| Office & Administration | 16 (37.2%) | 27 (62.8%) |
| Total (Category) | 28 (30.4%) | 64 (69.6%) |
| Total (Overall) | 287 (59.5%) | 195 (40.5%) |
Natural Resources, Construction and Maintenance Occupations
The most common Natural Resources, Construction and Maintenance occupations in Hilltop are , and Construction & Extraction (42 | 8.7%).
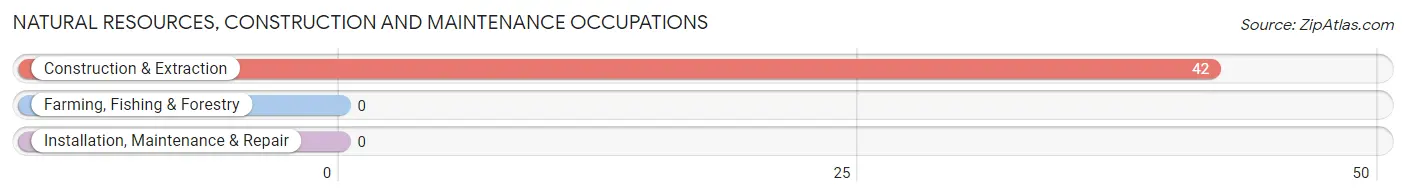
Natural Resources, Construction and Maintenance Occupations by Sex
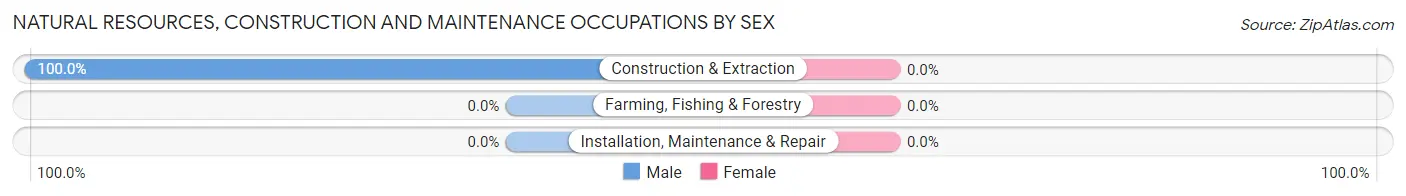
| Occupation | Male | Female |
| Farming, Fishing & Forestry | 0 (0.0%) | 0 (0.0%) |
| Construction & Extraction | 42 (100.0%) | 0 (0.0%) |
| Installation, Maintenance & Repair | 0 (0.0%) | 0 (0.0%) |
| Total (Category) | 42 (100.0%) | 0 (0.0%) |
| Total (Overall) | 287 (59.5%) | 195 (40.5%) |
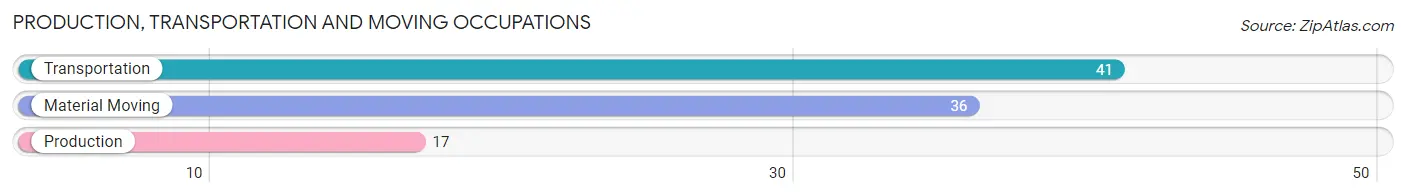
Production, Transportation and Moving Occupations
The most common Production, Transportation and Moving occupations in Hilltop are Transportation (41 | 8.5%), Material Moving (36 | 7.5%), and Production (17 | 3.5%).
Production, Transportation and Moving Occupations by Sex
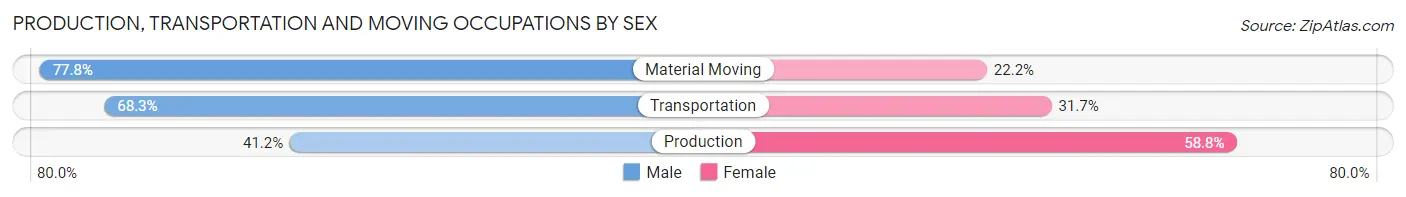
| Occupation | Male | Female |
| Production | 7 (41.2%) | 10 (58.8%) |
| Transportation | 28 (68.3%) | 13 (31.7%) |
| Material Moving | 28 (77.8%) | 8 (22.2%) |
| Total (Category) | 63 (67.0%) | 31 (33.0%) |
| Total (Overall) | 287 (59.5%) | 195 (40.5%) |
Employment Industries by Sex in Hilltop
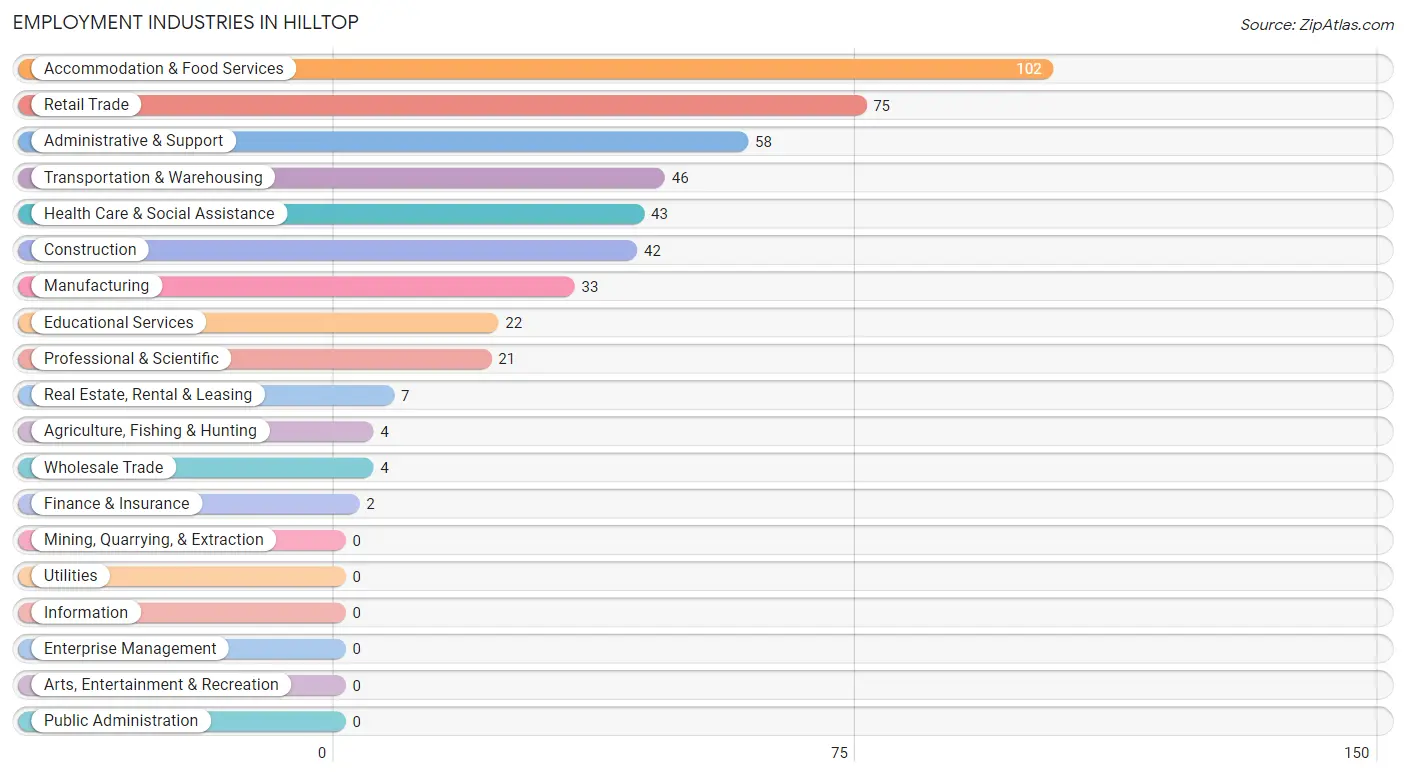
Employment Industries in Hilltop
The major employment industries in Hilltop include Accommodation & Food Services (102 | 21.2%), Retail Trade (75 | 15.6%), Administrative & Support (58 | 12.0%), Transportation & Warehousing (46 | 9.5%), and Health Care & Social Assistance (43 | 8.9%).
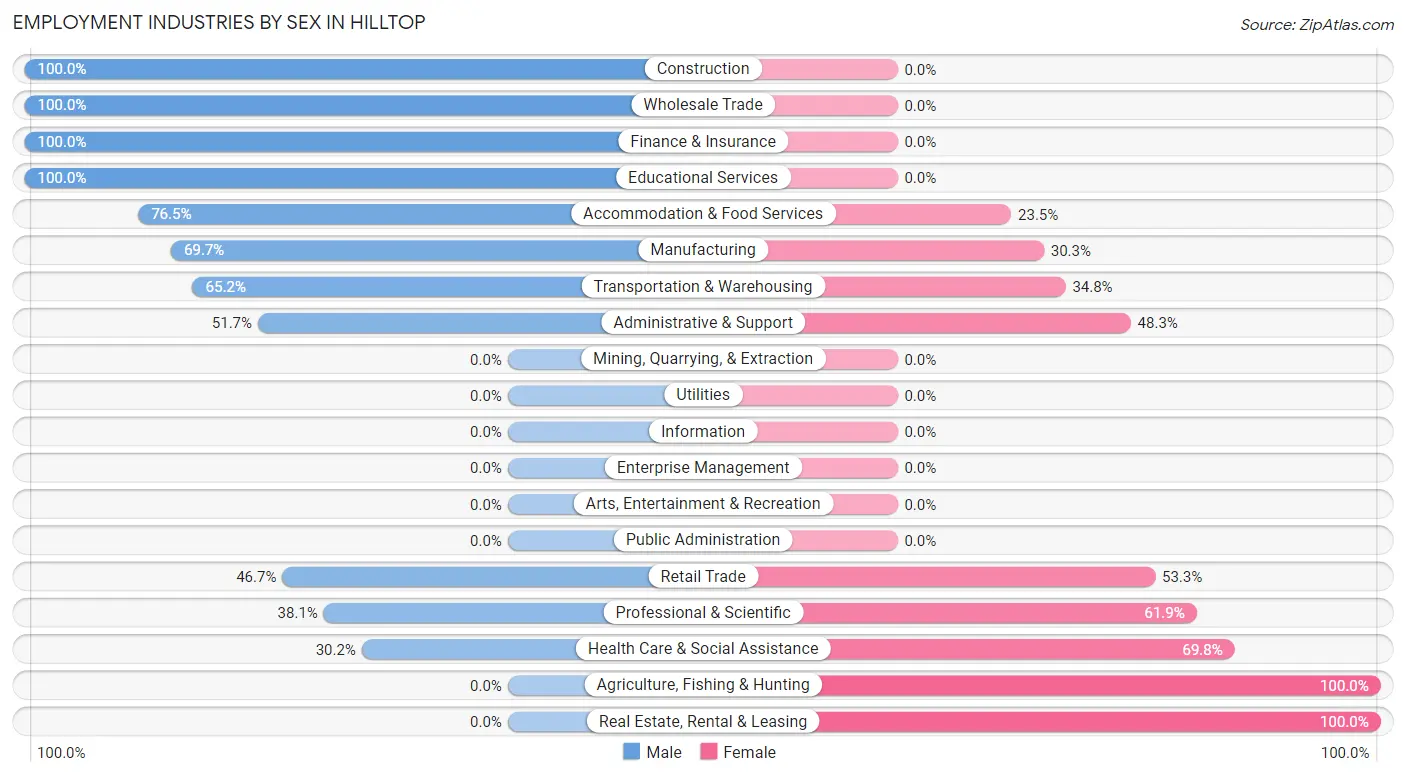
Employment Industries by Sex in Hilltop
The Hilltop industries that see more men than women are Construction (100.0%), Wholesale Trade (100.0%), and Finance & Insurance (100.0%), whereas the industries that tend to have a higher number of women are Agriculture, Fishing & Hunting (100.0%), Real Estate, Rental & Leasing (100.0%), and Health Care & Social Assistance (69.8%).
| Industry | Male | Female |
| Agriculture, Fishing & Hunting | 0 (0.0%) | 4 (100.0%) |
| Mining, Quarrying, & Extraction | 0 (0.0%) | 0 (0.0%) |
| Construction | 42 (100.0%) | 0 (0.0%) |
| Manufacturing | 23 (69.7%) | 10 (30.3%) |
| Wholesale Trade | 4 (100.0%) | 0 (0.0%) |
| Retail Trade | 35 (46.7%) | 40 (53.3%) |
| Transportation & Warehousing | 30 (65.2%) | 16 (34.8%) |
| Utilities | 0 (0.0%) | 0 (0.0%) |
| Information | 0 (0.0%) | 0 (0.0%) |
| Finance & Insurance | 2 (100.0%) | 0 (0.0%) |
| Real Estate, Rental & Leasing | 0 (0.0%) | 7 (100.0%) |
| Professional & Scientific | 8 (38.1%) | 13 (61.9%) |
| Enterprise Management | 0 (0.0%) | 0 (0.0%) |
| Administrative & Support | 30 (51.7%) | 28 (48.3%) |
| Educational Services | 22 (100.0%) | 0 (0.0%) |
| Health Care & Social Assistance | 13 (30.2%) | 30 (69.8%) |
| Arts, Entertainment & Recreation | 0 (0.0%) | 0 (0.0%) |
| Accommodation & Food Services | 78 (76.5%) | 24 (23.5%) |
| Public Administration | 0 (0.0%) | 0 (0.0%) |
| Total | 287 (59.5%) | 195 (40.5%) |
Education in Hilltop
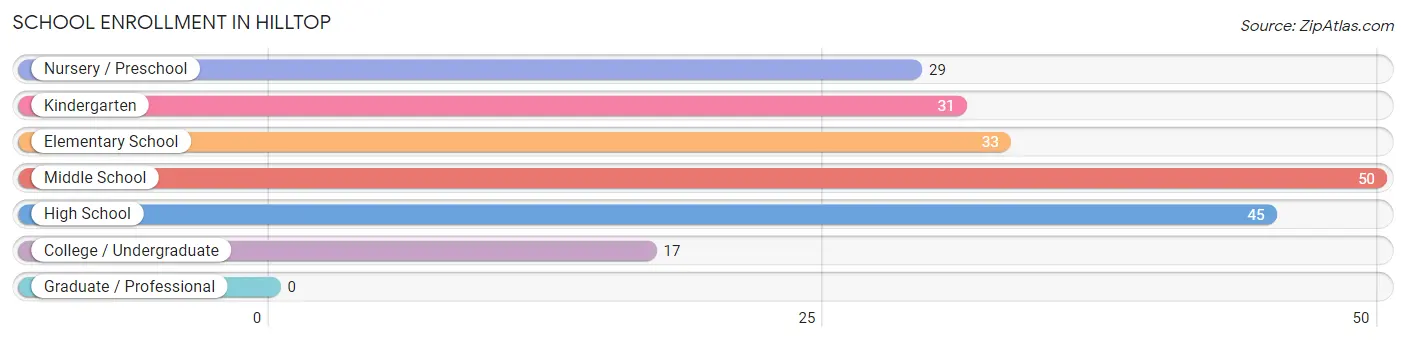
School Enrollment in Hilltop
The most common levels of schooling among the 205 students in Hilltop are middle school (50 | 24.4%), high school (45 | 22.0%), and elementary school (33 | 16.1%).
| School Level | # Students | % Students |
| Nursery / Preschool | 29 | 14.1% |
| Kindergarten | 31 | 15.1% |
| Elementary School | 33 | 16.1% |
| Middle School | 50 | 24.4% |
| High School | 45 | 22.0% |
| College / Undergraduate | 17 | 8.3% |
| Graduate / Professional | 0 | 0.0% |
| Total | 205 | 100.0% |
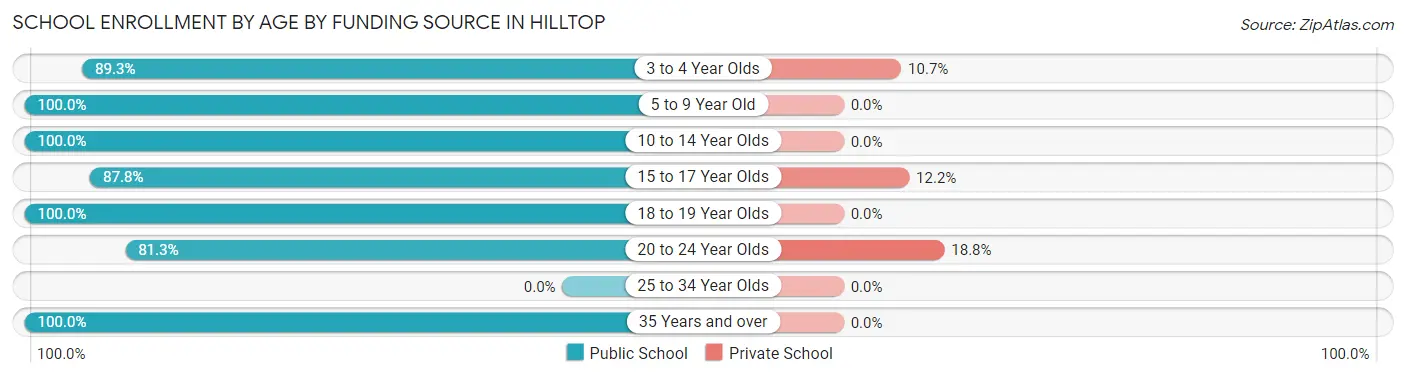
School Enrollment by Age by Funding Source in Hilltop
Out of a total of 205 students who are enrolled in schools in Hilltop, 11 (5.4%) attend a private institution, while the remaining 194 (94.6%) are enrolled in public schools. The age group of 20 to 24 year olds has the highest likelihood of being enrolled in private schools, with 3 (18.8% in the age bracket) enrolled. Conversely, the age group of 5 to 9 year old has the lowest likelihood of being enrolled in a private school, with 62 (100.0% in the age bracket) attending a public institution.
| Age Bracket | Public School | Private School |
| 3 to 4 Year Olds | 25 (89.3%) | 3 (10.7%) |
| 5 to 9 Year Old | 62 (100.0%) | 0 (0.0%) |
| 10 to 14 Year Olds | 53 (100.0%) | 0 (0.0%) |
| 15 to 17 Year Olds | 36 (87.8%) | 5 (12.2%) |
| 18 to 19 Year Olds | 3 (100.0%) | 0 (0.0%) |
| 20 to 24 Year Olds | 13 (81.2%) | 3 (18.8%) |
| 25 to 34 Year Olds | 0 (0.0%) | 0 (0.0%) |
| 35 Years and over | 2 (100.0%) | 0 (0.0%) |
| Total | 194 (94.6%) | 11 (5.4%) |
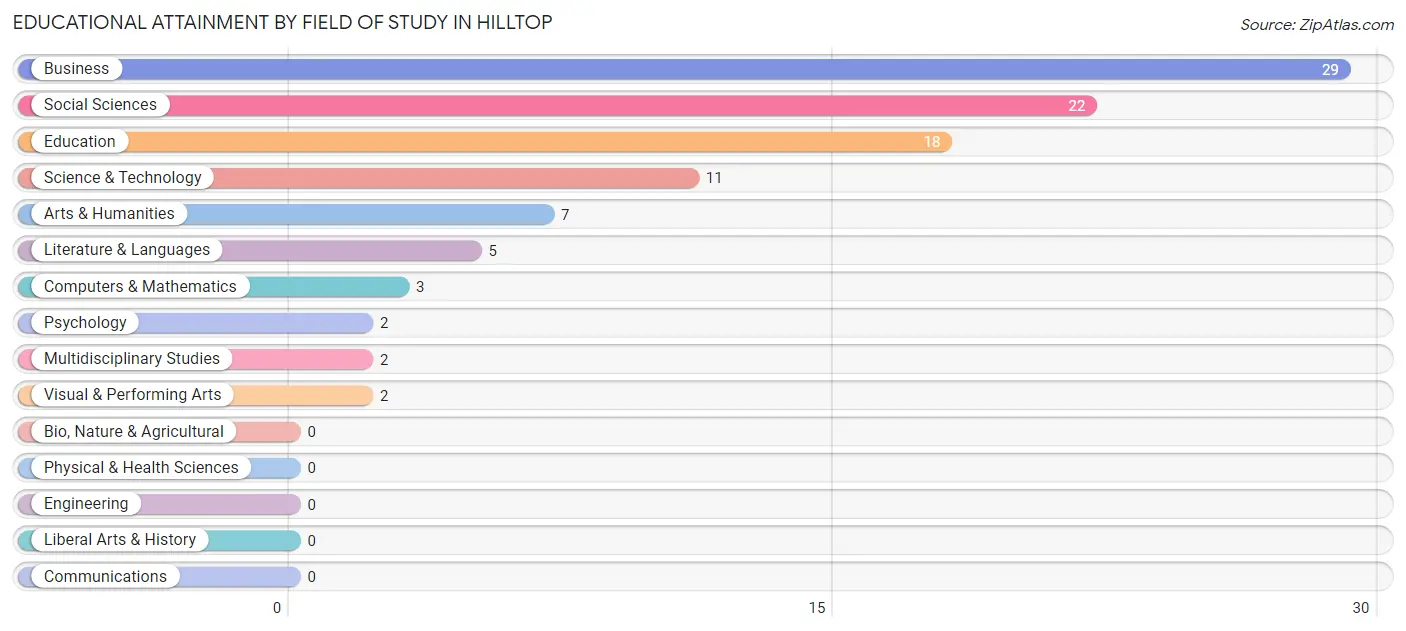
Educational Attainment by Field of Study in Hilltop
Business (29 | 28.7%), social sciences (22 | 21.8%), education (18 | 17.8%), science & technology (11 | 10.9%), and arts & humanities (7 | 6.9%) are the most common fields of study among 101 individuals in Hilltop who have obtained a bachelor's degree or higher.
| Field of Study | # Graduates | % Graduates |
| Computers & Mathematics | 3 | 3.0% |
| Bio, Nature & Agricultural | 0 | 0.0% |
| Physical & Health Sciences | 0 | 0.0% |
| Psychology | 2 | 2.0% |
| Social Sciences | 22 | 21.8% |
| Engineering | 0 | 0.0% |
| Multidisciplinary Studies | 2 | 2.0% |
| Science & Technology | 11 | 10.9% |
| Business | 29 | 28.7% |
| Education | 18 | 17.8% |
| Literature & Languages | 5 | 5.0% |
| Liberal Arts & History | 0 | 0.0% |
| Visual & Performing Arts | 2 | 2.0% |
| Communications | 0 | 0.0% |
| Arts & Humanities | 7 | 6.9% |
| Total | 101 | 100.0% |
Transportation & Commute in Hilltop
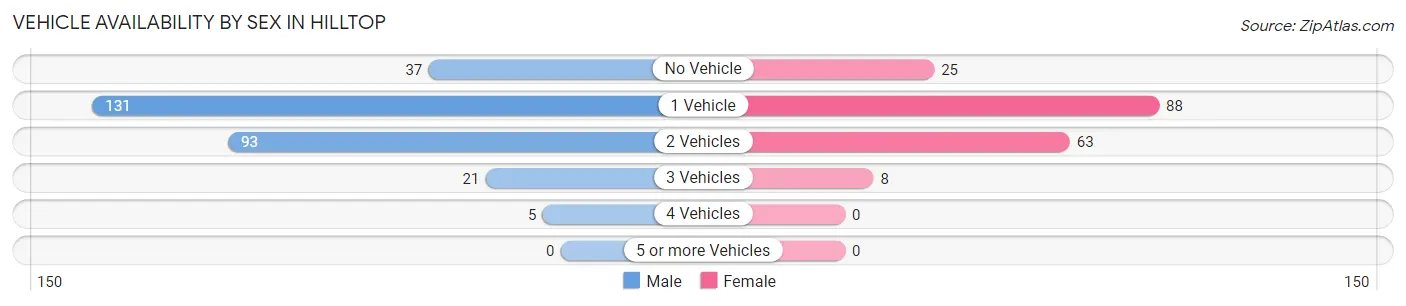
Vehicle Availability by Sex in Hilltop
The most prevalent vehicle ownership categories in Hilltop are males with 1 vehicle (131, accounting for 45.6%) and females with 1 vehicle (88, making up 71.2%).
| Vehicles Available | Male | Female |
| No Vehicle | 37 (12.9%) | 25 (13.6%) |
| 1 Vehicle | 131 (45.6%) | 88 (47.8%) |
| 2 Vehicles | 93 (32.4%) | 63 (34.2%) |
| 3 Vehicles | 21 (7.3%) | 8 (4.3%) |
| 4 Vehicles | 5 (1.7%) | 0 (0.0%) |
| 5 or more Vehicles | 0 (0.0%) | 0 (0.0%) |
| Total | 287 (100.0%) | 184 (100.0%) |
Commute Time in Hilltop
The most frequently occuring commute durations in Hilltop are 20 to 24 minutes (93 commuters, 20.3%), 10 to 14 minutes (64 commuters, 14.0%), and 40 to 44 minutes (60 commuters, 13.1%).
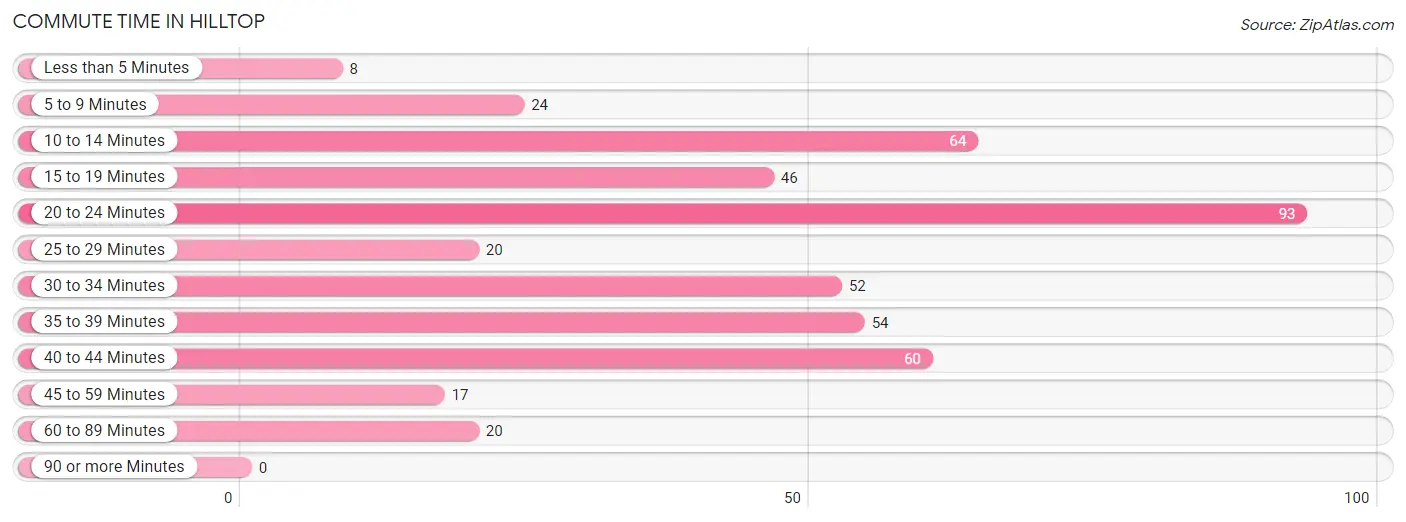
| Commute Time | # Commuters | % Commuters |
| Less than 5 Minutes | 8 | 1.8% |
| 5 to 9 Minutes | 24 | 5.2% |
| 10 to 14 Minutes | 64 | 14.0% |
| 15 to 19 Minutes | 46 | 10.0% |
| 20 to 24 Minutes | 93 | 20.3% |
| 25 to 29 Minutes | 20 | 4.4% |
| 30 to 34 Minutes | 52 | 11.4% |
| 35 to 39 Minutes | 54 | 11.8% |
| 40 to 44 Minutes | 60 | 13.1% |
| 45 to 59 Minutes | 17 | 3.7% |
| 60 to 89 Minutes | 20 | 4.4% |
| 90 or more Minutes | 0 | 0.0% |
Commute Time by Sex in Hilltop
The most common commute times in Hilltop are 20 to 24 minutes (60 commuters, 21.9%) for males and 10 to 14 minutes (34 commuters, 18.5%) for females.
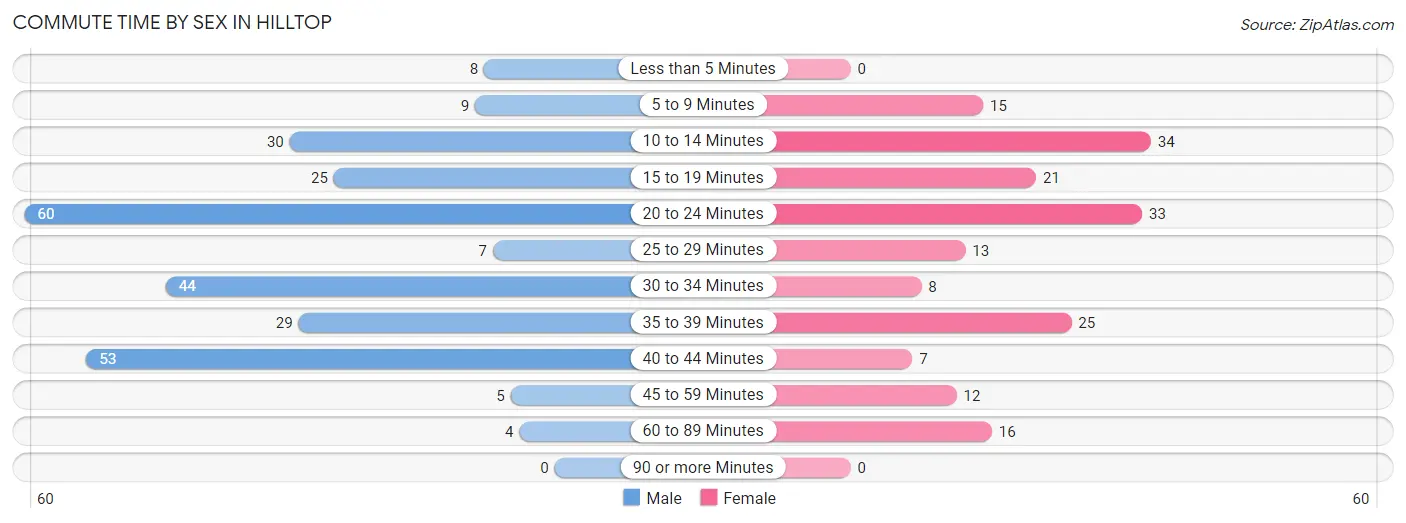
| Commute Time | Male | Female |
| Less than 5 Minutes | 8 (2.9%) | 0 (0.0%) |
| 5 to 9 Minutes | 9 (3.3%) | 15 (8.2%) |
| 10 to 14 Minutes | 30 (11.0%) | 34 (18.5%) |
| 15 to 19 Minutes | 25 (9.1%) | 21 (11.4%) |
| 20 to 24 Minutes | 60 (21.9%) | 33 (17.9%) |
| 25 to 29 Minutes | 7 (2.5%) | 13 (7.1%) |
| 30 to 34 Minutes | 44 (16.1%) | 8 (4.3%) |
| 35 to 39 Minutes | 29 (10.6%) | 25 (13.6%) |
| 40 to 44 Minutes | 53 (19.3%) | 7 (3.8%) |
| 45 to 59 Minutes | 5 (1.8%) | 12 (6.5%) |
| 60 to 89 Minutes | 4 (1.5%) | 16 (8.7%) |
| 90 or more Minutes | 0 (0.0%) | 0 (0.0%) |
Time of Departure to Work by Sex in Hilltop
The most frequent times of departure to work in Hilltop are 10:00 AM to 10:59 AM (43, 15.7%) for males and 12:00 PM to 3:59 PM (46, 25.0%) for females.
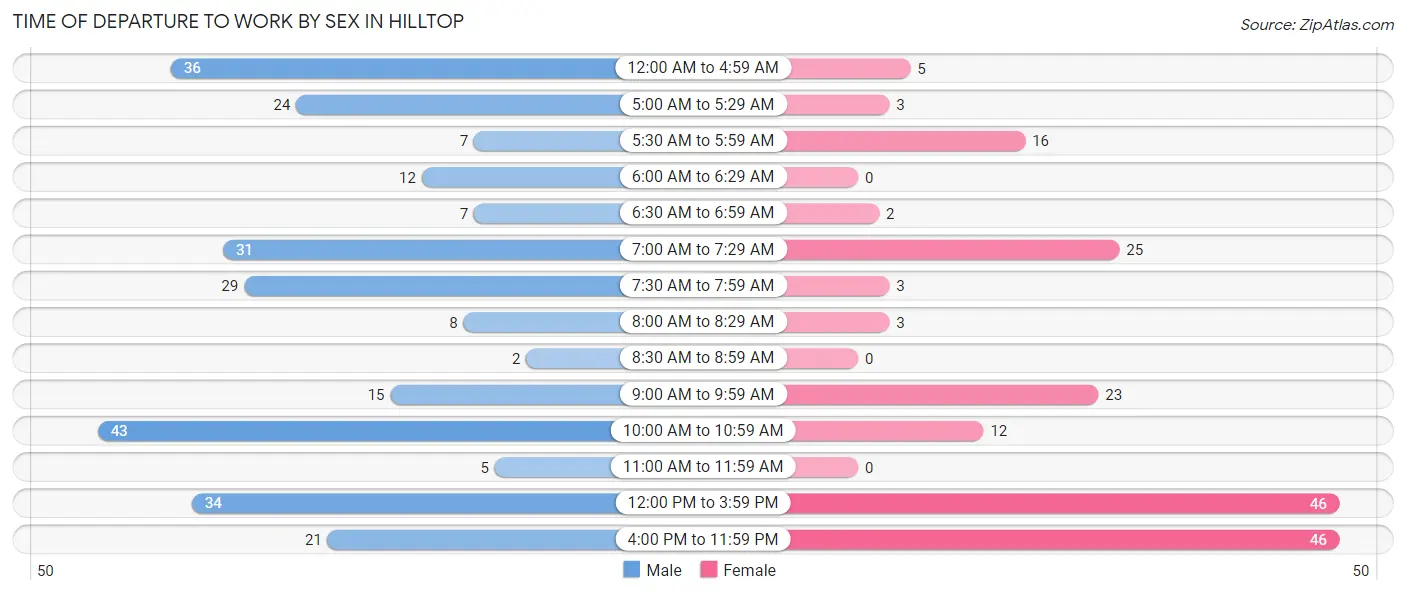
| Time of Departure | Male | Female |
| 12:00 AM to 4:59 AM | 36 (13.1%) | 5 (2.7%) |
| 5:00 AM to 5:29 AM | 24 (8.8%) | 3 (1.6%) |
| 5:30 AM to 5:59 AM | 7 (2.5%) | 16 (8.7%) |
| 6:00 AM to 6:29 AM | 12 (4.4%) | 0 (0.0%) |
| 6:30 AM to 6:59 AM | 7 (2.5%) | 2 (1.1%) |
| 7:00 AM to 7:29 AM | 31 (11.3%) | 25 (13.6%) |
| 7:30 AM to 7:59 AM | 29 (10.6%) | 3 (1.6%) |
| 8:00 AM to 8:29 AM | 8 (2.9%) | 3 (1.6%) |
| 8:30 AM to 8:59 AM | 2 (0.7%) | 0 (0.0%) |
| 9:00 AM to 9:59 AM | 15 (5.5%) | 23 (12.5%) |
| 10:00 AM to 10:59 AM | 43 (15.7%) | 12 (6.5%) |
| 11:00 AM to 11:59 AM | 5 (1.8%) | 0 (0.0%) |
| 12:00 PM to 3:59 PM | 34 (12.4%) | 46 (25.0%) |
| 4:00 PM to 11:59 PM | 21 (7.7%) | 46 (25.0%) |
| Total | 274 (100.0%) | 184 (100.0%) |
Housing Occupancy in Hilltop
Occupancy by Ownership in Hilltop
Of the total 411 dwellings in Hilltop, owner-occupied units account for 249 (60.6%), while renter-occupied units make up 162 (39.4%).
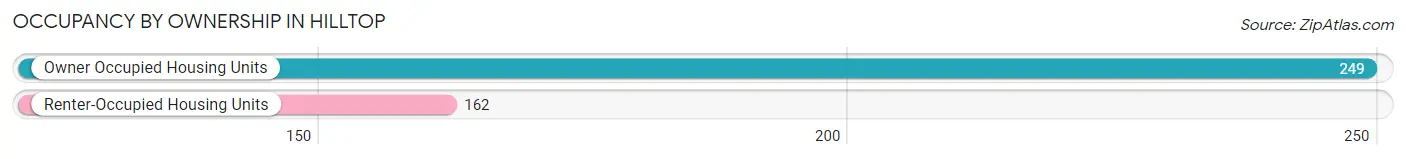
| Occupancy | # Housing Units | % Housing Units |
| Owner Occupied Housing Units | 249 | 60.6% |
| Renter-Occupied Housing Units | 162 | 39.4% |
| Total Occupied Housing Units | 411 | 100.0% |
Occupancy by Household Size in Hilltop
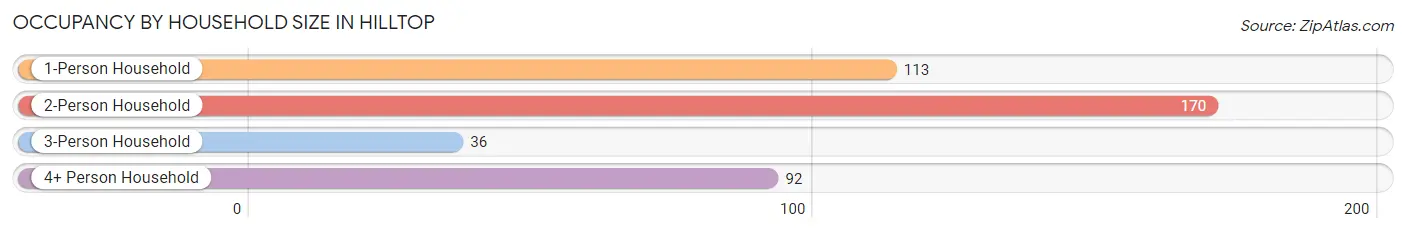
| Household Size | # Housing Units | % Housing Units |
| 1-Person Household | 113 | 27.5% |
| 2-Person Household | 170 | 41.4% |
| 3-Person Household | 36 | 8.8% |
| 4+ Person Household | 92 | 22.4% |
| Total Housing Units | 411 | 100.0% |
Occupancy by Ownership by Household Size in Hilltop
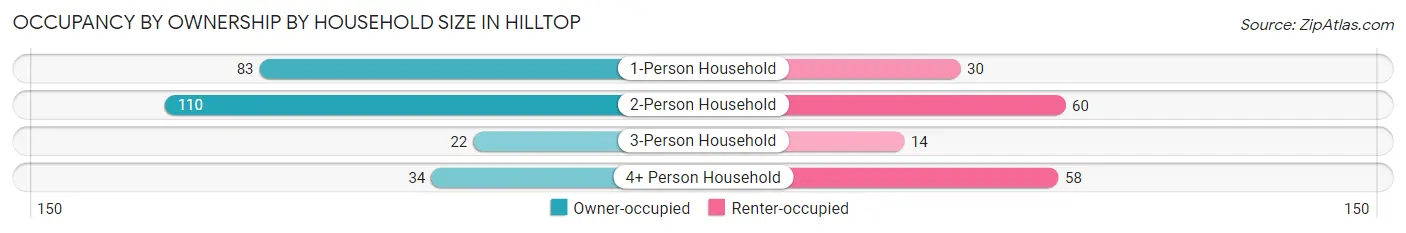
| Household Size | Owner-occupied | Renter-occupied |
| 1-Person Household | 83 (73.5%) | 30 (26.6%) |
| 2-Person Household | 110 (64.7%) | 60 (35.3%) |
| 3-Person Household | 22 (61.1%) | 14 (38.9%) |
| 4+ Person Household | 34 (37.0%) | 58 (63.0%) |
| Total Housing Units | 249 (60.6%) | 162 (39.4%) |
Occupancy by Educational Attainment in Hilltop
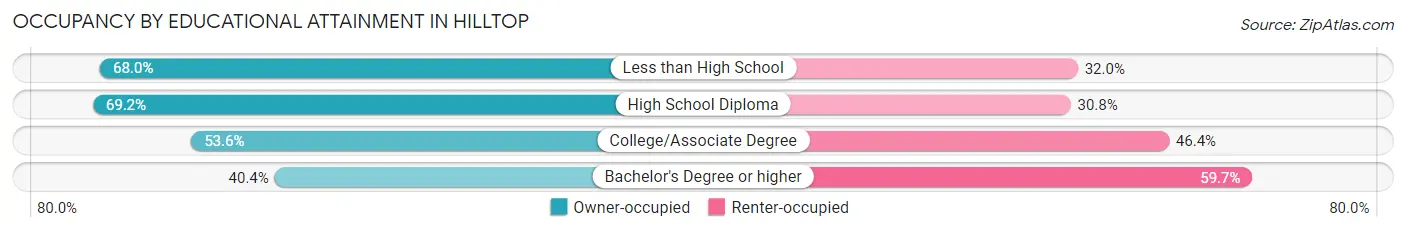
| Household Size | Owner-occupied | Renter-occupied |
| Less than High School | 83 (68.0%) | 39 (32.0%) |
| High School Diploma | 83 (69.2%) | 37 (30.8%) |
| College/Associate Degree | 60 (53.6%) | 52 (46.4%) |
| Bachelor's Degree or higher | 23 (40.4%) | 34 (59.7%) |
Occupancy by Age of Householder in Hilltop
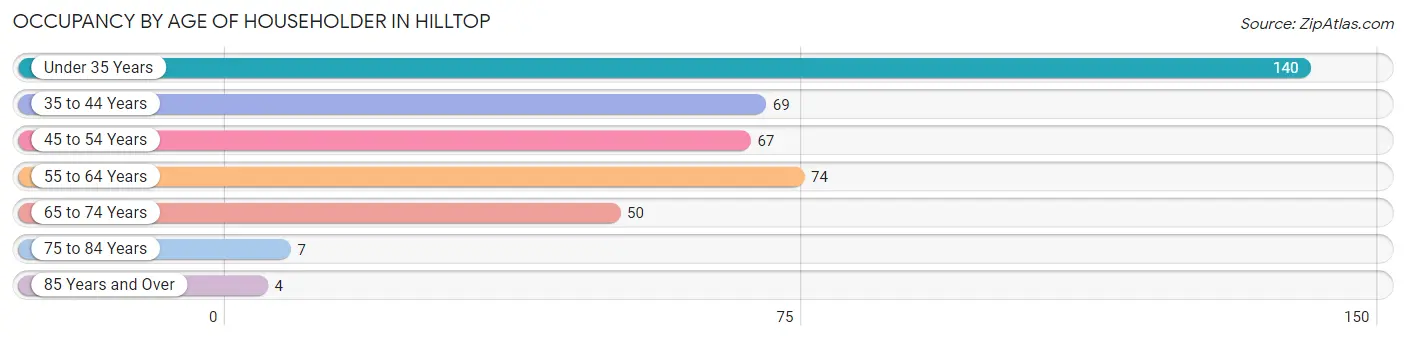
| Age Bracket | # Households | % Households |
| Under 35 Years | 140 | 34.1% |
| 35 to 44 Years | 69 | 16.8% |
| 45 to 54 Years | 67 | 16.3% |
| 55 to 64 Years | 74 | 18.0% |
| 65 to 74 Years | 50 | 12.2% |
| 75 to 84 Years | 7 | 1.7% |
| 85 Years and Over | 4 | 1.0% |
| Total | 411 | 100.0% |
Housing Finances in Hilltop
Median Income by Occupancy in Hilltop
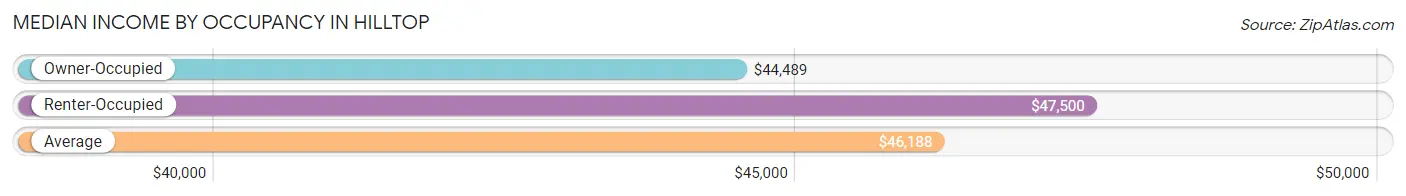
| Occupancy Type | # Households | Median Income |
| Owner-Occupied | 249 (60.6%) | $44,489 |
| Renter-Occupied | 162 (39.4%) | $47,500 |
| Average | 411 (100.0%) | $46,188 |
Occupancy by Householder Income Bracket in Hilltop
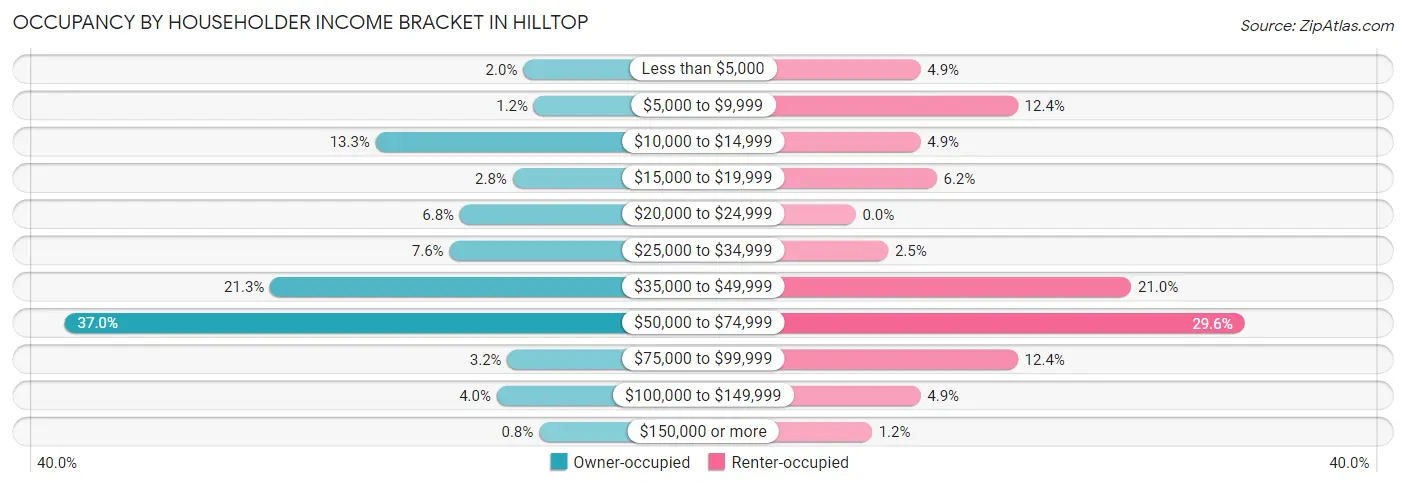
| Income Bracket | Owner-occupied | Renter-occupied |
| Less than $5,000 | 5 (2.0%) | 8 (4.9%) |
| $5,000 to $9,999 | 3 (1.2%) | 20 (12.3%) |
| $10,000 to $14,999 | 33 (13.3%) | 8 (4.9%) |
| $15,000 to $19,999 | 7 (2.8%) | 10 (6.2%) |
| $20,000 to $24,999 | 17 (6.8%) | 0 (0.0%) |
| $25,000 to $34,999 | 19 (7.6%) | 4 (2.5%) |
| $35,000 to $49,999 | 53 (21.3%) | 34 (21.0%) |
| $50,000 to $74,999 | 92 (36.9%) | 48 (29.6%) |
| $75,000 to $99,999 | 8 (3.2%) | 20 (12.3%) |
| $100,000 to $149,999 | 10 (4.0%) | 8 (4.9%) |
| $150,000 or more | 2 (0.8%) | 2 (1.2%) |
| Total | 249 (100.0%) | 162 (100.0%) |
Monthly Housing Cost Tiers in Hilltop
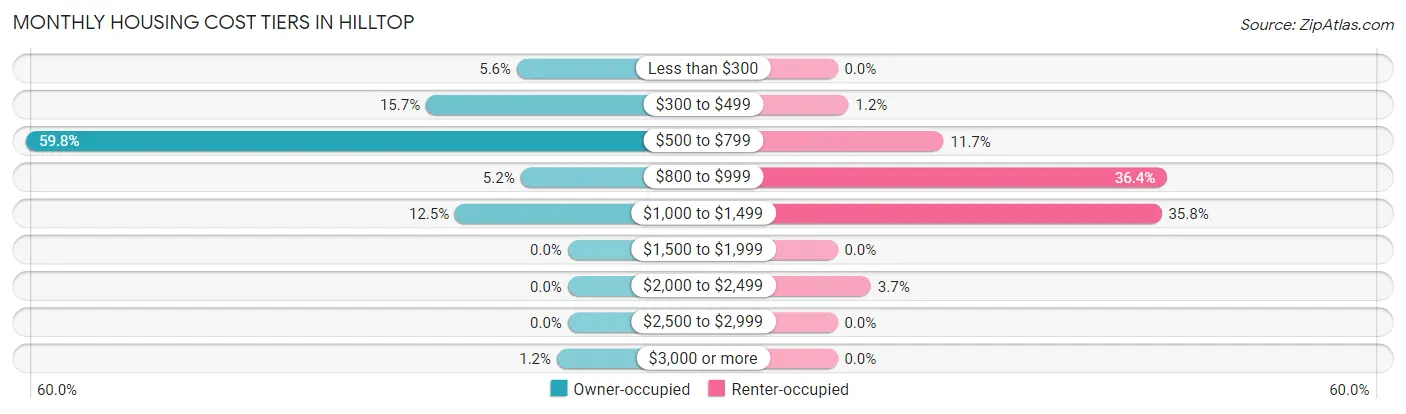
| Monthly Cost | Owner-occupied | Renter-occupied |
| Less than $300 | 14 (5.6%) | 0 (0.0%) |
| $300 to $499 | 39 (15.7%) | 2 (1.2%) |
| $500 to $799 | 149 (59.8%) | 19 (11.7%) |
| $800 to $999 | 13 (5.2%) | 59 (36.4%) |
| $1,000 to $1,499 | 31 (12.4%) | 58 (35.8%) |
| $1,500 to $1,999 | 0 (0.0%) | 0 (0.0%) |
| $2,000 to $2,499 | 0 (0.0%) | 6 (3.7%) |
| $2,500 to $2,999 | 0 (0.0%) | 0 (0.0%) |
| $3,000 or more | 3 (1.2%) | 0 (0.0%) |
| Total | 249 (100.0%) | 162 (100.0%) |
Physical Housing Characteristics in Hilltop
Housing Structures in Hilltop
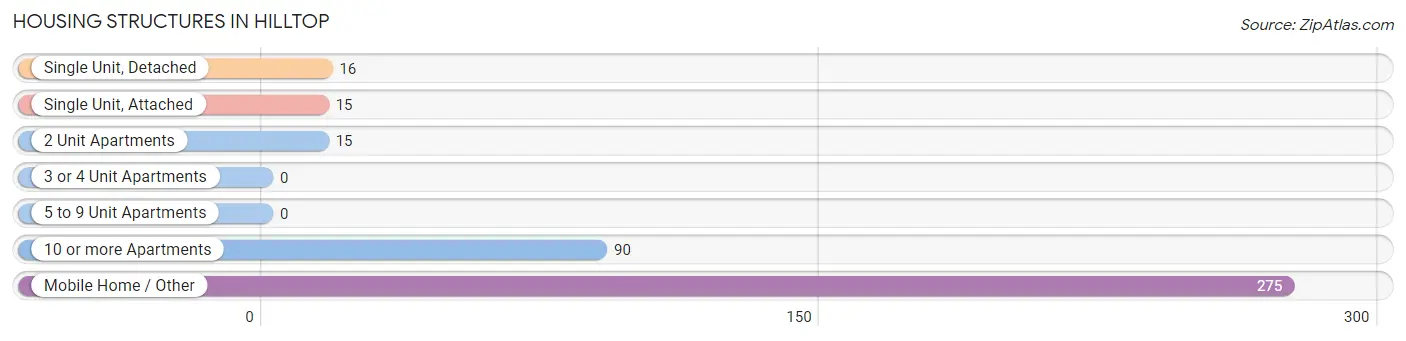
| Structure Type | # Housing Units | % Housing Units |
| Single Unit, Detached | 16 | 3.9% |
| Single Unit, Attached | 15 | 3.6% |
| 2 Unit Apartments | 15 | 3.6% |
| 3 or 4 Unit Apartments | 0 | 0.0% |
| 5 to 9 Unit Apartments | 0 | 0.0% |
| 10 or more Apartments | 90 | 21.9% |
| Mobile Home / Other | 275 | 66.9% |
| Total | 411 | 100.0% |
Housing Structures by Occupancy in Hilltop
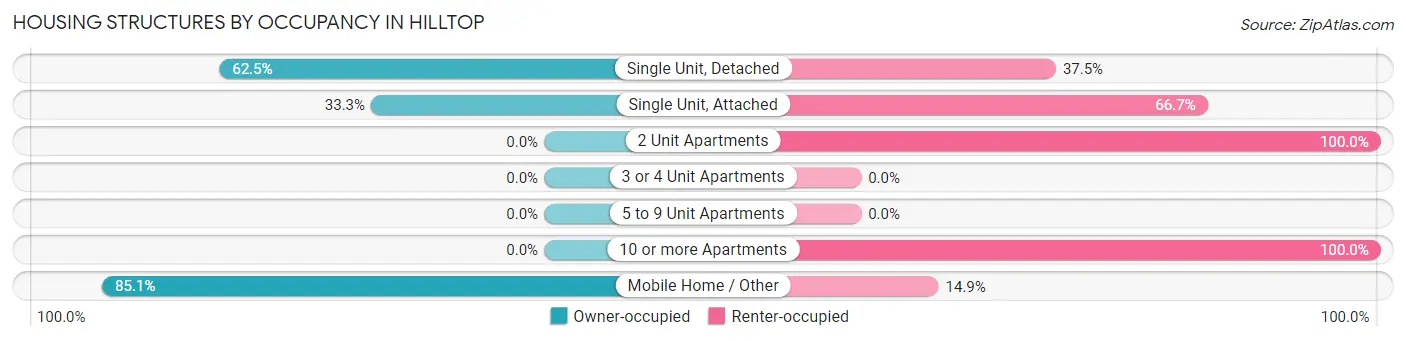
| Structure Type | Owner-occupied | Renter-occupied |
| Single Unit, Detached | 10 (62.5%) | 6 (37.5%) |
| Single Unit, Attached | 5 (33.3%) | 10 (66.7%) |
| 2 Unit Apartments | 0 (0.0%) | 15 (100.0%) |
| 3 or 4 Unit Apartments | 0 (0.0%) | 0 (0.0%) |
| 5 to 9 Unit Apartments | 0 (0.0%) | 0 (0.0%) |
| 10 or more Apartments | 0 (0.0%) | 90 (100.0%) |
| Mobile Home / Other | 234 (85.1%) | 41 (14.9%) |
| Total | 249 (60.6%) | 162 (39.4%) |
Housing Structures by Number of Rooms in Hilltop
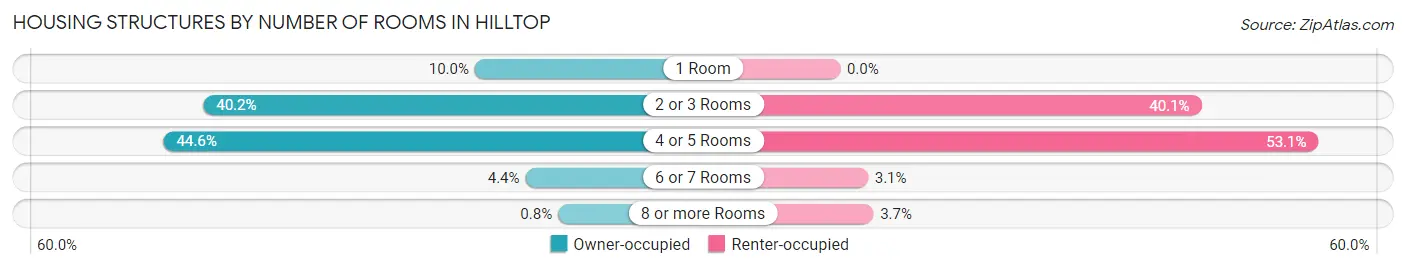
| Number of Rooms | Owner-occupied | Renter-occupied |
| 1 Room | 25 (10.0%) | 0 (0.0%) |
| 2 or 3 Rooms | 100 (40.2%) | 65 (40.1%) |
| 4 or 5 Rooms | 111 (44.6%) | 86 (53.1%) |
| 6 or 7 Rooms | 11 (4.4%) | 5 (3.1%) |
| 8 or more Rooms | 2 (0.8%) | 6 (3.7%) |
| Total | 249 (100.0%) | 162 (100.0%) |
Housing Structure by Heating Type in Hilltop
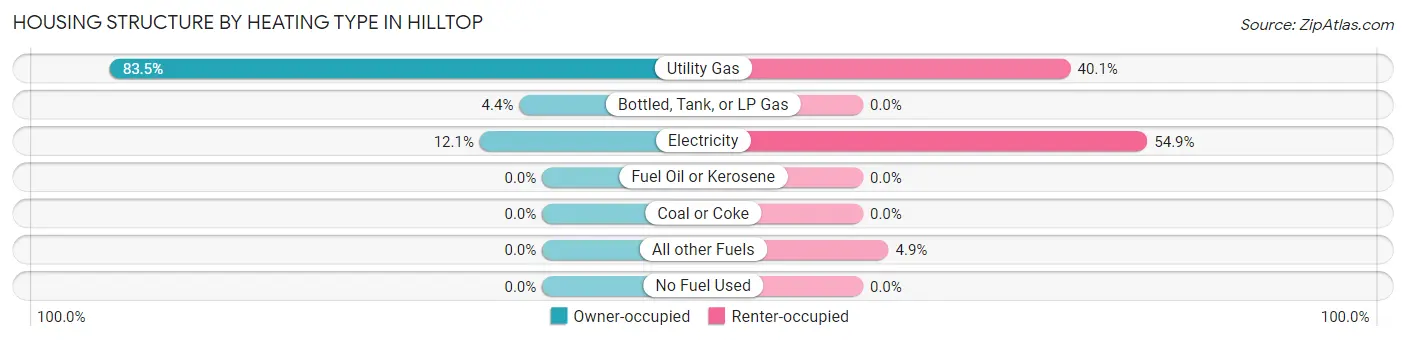
| Heating Type | Owner-occupied | Renter-occupied |
| Utility Gas | 208 (83.5%) | 65 (40.1%) |
| Bottled, Tank, or LP Gas | 11 (4.4%) | 0 (0.0%) |
| Electricity | 30 (12.0%) | 89 (54.9%) |
| Fuel Oil or Kerosene | 0 (0.0%) | 0 (0.0%) |
| Coal or Coke | 0 (0.0%) | 0 (0.0%) |
| All other Fuels | 0 (0.0%) | 8 (4.9%) |
| No Fuel Used | 0 (0.0%) | 0 (0.0%) |
| Total | 249 (100.0%) | 162 (100.0%) |
Household Vehicle Usage in Hilltop
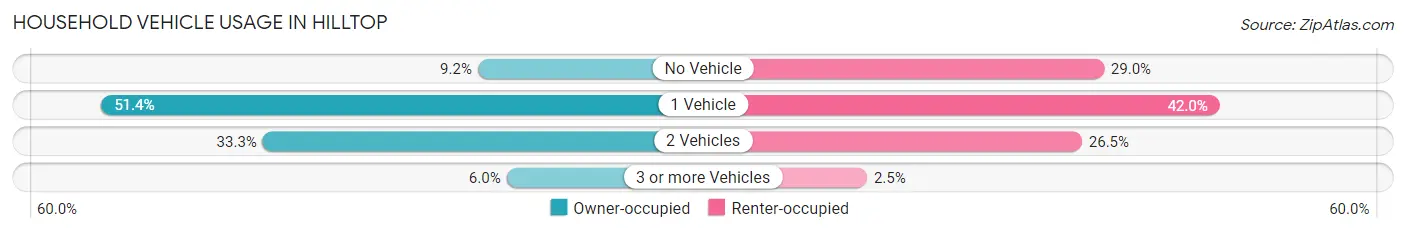
| Vehicles per Household | Owner-occupied | Renter-occupied |
| No Vehicle | 23 (9.2%) | 47 (29.0%) |
| 1 Vehicle | 128 (51.4%) | 68 (42.0%) |
| 2 Vehicles | 83 (33.3%) | 43 (26.5%) |
| 3 or more Vehicles | 15 (6.0%) | 4 (2.5%) |
| Total | 249 (100.0%) | 162 (100.0%) |
Real Estate & Mortgages in Hilltop
Real Estate and Mortgage Overview in Hilltop
| Characteristic | Without Mortgage | With Mortgage |
| Housing Units | 226 | 23 |
| Median Property Value | $22,200 | $0 |
| Median Household Income | $44,205 | $2 |
| Monthly Housing Costs | $631 | $0 |
| Real Estate Taxes | $199 | $0 |
Property Value by Mortgage Status in Hilltop
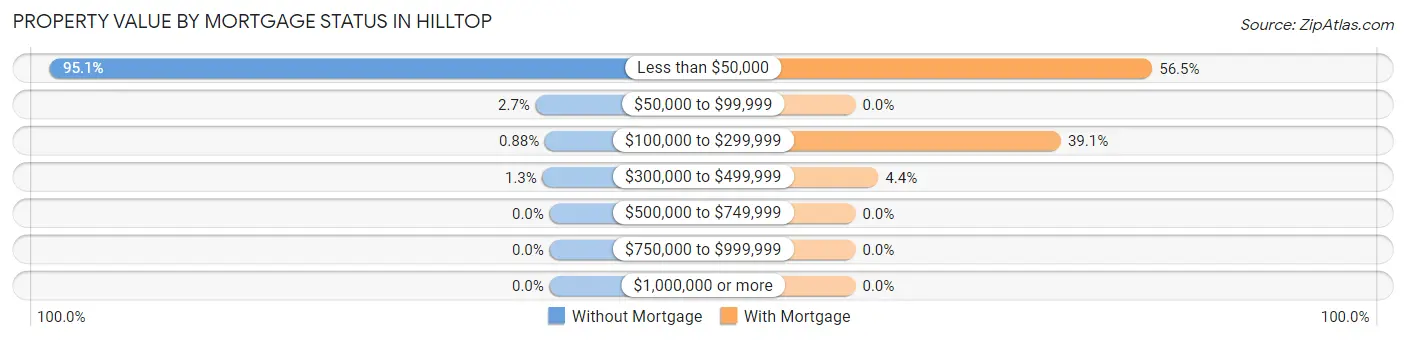
| Property Value | Without Mortgage | With Mortgage |
| Less than $50,000 | 215 (95.1%) | 13 (56.5%) |
| $50,000 to $99,999 | 6 (2.6%) | 0 (0.0%) |
| $100,000 to $299,999 | 2 (0.9%) | 9 (39.1%) |
| $300,000 to $499,999 | 3 (1.3%) | 1 (4.3%) |
| $500,000 to $749,999 | 0 (0.0%) | 0 (0.0%) |
| $750,000 to $999,999 | 0 (0.0%) | 0 (0.0%) |
| $1,000,000 or more | 0 (0.0%) | 0 (0.0%) |
| Total | 226 (100.0%) | 23 (100.0%) |
Household Income by Mortgage Status in Hilltop
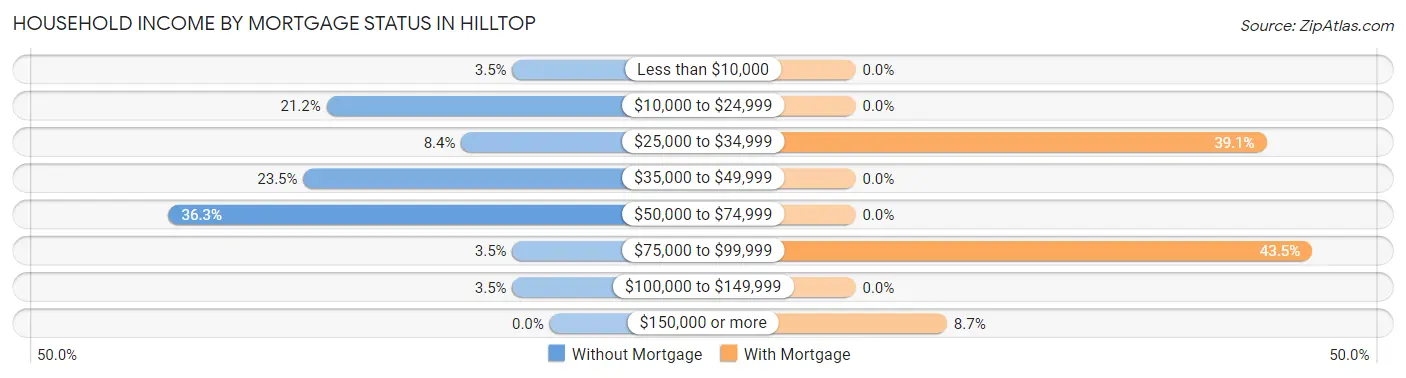
| Household Income | Without Mortgage | With Mortgage |
| Less than $10,000 | 8 (3.5%) | 0 (0.0%) |
| $10,000 to $24,999 | 48 (21.2%) | 0 (0.0%) |
| $25,000 to $34,999 | 19 (8.4%) | 9 (39.1%) |
| $35,000 to $49,999 | 53 (23.4%) | 0 (0.0%) |
| $50,000 to $74,999 | 82 (36.3%) | 0 (0.0%) |
| $75,000 to $99,999 | 8 (3.5%) | 10 (43.5%) |
| $100,000 to $149,999 | 8 (3.5%) | 0 (0.0%) |
| $150,000 or more | 0 (0.0%) | 2 (8.7%) |
| Total | 226 (100.0%) | 23 (100.0%) |
Property Value to Household Income Ratio in Hilltop
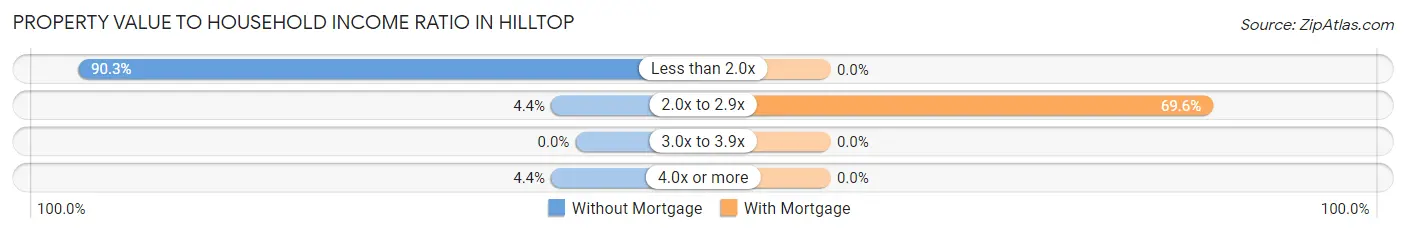
| Value-to-Income Ratio | Without Mortgage | With Mortgage |
| Less than 2.0x | 204 (90.3%) | 0 (0.0%) |
| 2.0x to 2.9x | 10 (4.4%) | 16 (69.6%) |
| 3.0x to 3.9x | 0 (0.0%) | 0 (0.0%) |
| 4.0x or more | 10 (4.4%) | 0 (0.0%) |
| Total | 226 (100.0%) | 23 (100.0%) |
Real Estate Taxes by Mortgage Status in Hilltop
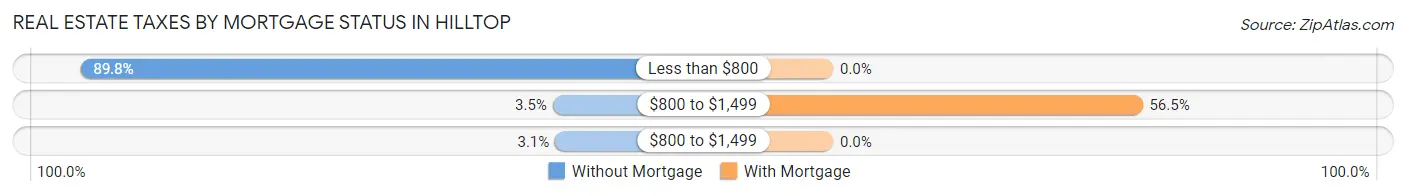
| Property Taxes | Without Mortgage | With Mortgage |
| Less than $800 | 203 (89.8%) | 0 (0.0%) |
| $800 to $1,499 | 8 (3.5%) | 13 (56.5%) |
| $800 to $1,499 | 7 (3.1%) | 0 (0.0%) |
| Total | 226 (100.0%) | 23 (100.0%) |
Health & Disability in Hilltop
Health Insurance Coverage by Age in Hilltop
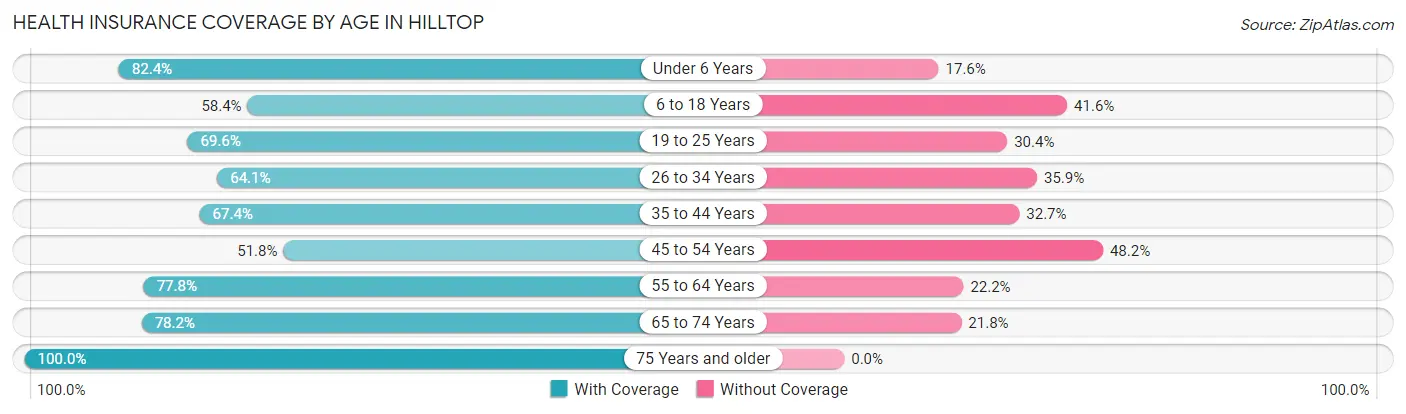
| Age Bracket | With Coverage | Without Coverage |
| Under 6 Years | 89 (82.4%) | 19 (17.6%) |
| 6 to 18 Years | 90 (58.4%) | 64 (41.6%) |
| 19 to 25 Years | 55 (69.6%) | 24 (30.4%) |
| 26 to 34 Years | 139 (64.1%) | 78 (35.9%) |
| 35 to 44 Years | 99 (67.3%) | 48 (32.7%) |
| 45 to 54 Years | 44 (51.8%) | 41 (48.2%) |
| 55 to 64 Years | 91 (77.8%) | 26 (22.2%) |
| 65 to 74 Years | 68 (78.2%) | 19 (21.8%) |
| 75 Years and older | 11 (100.0%) | 0 (0.0%) |
| Total | 686 (68.3%) | 319 (31.7%) |
Health Insurance Coverage by Citizenship Status in Hilltop
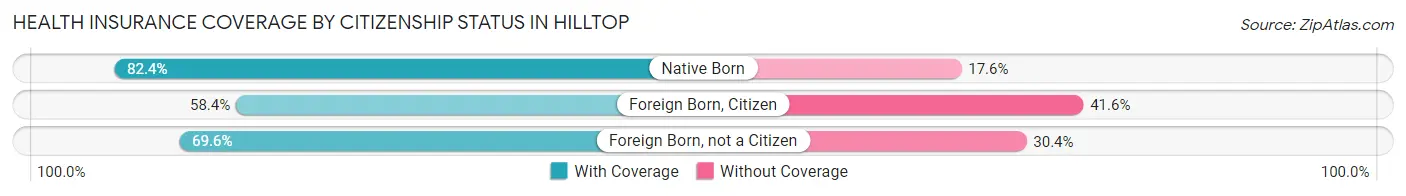
| Citizenship Status | With Coverage | Without Coverage |
| Native Born | 89 (82.4%) | 19 (17.6%) |
| Foreign Born, Citizen | 90 (58.4%) | 64 (41.6%) |
| Foreign Born, not a Citizen | 55 (69.6%) | 24 (30.4%) |
Health Insurance Coverage by Household Income in Hilltop
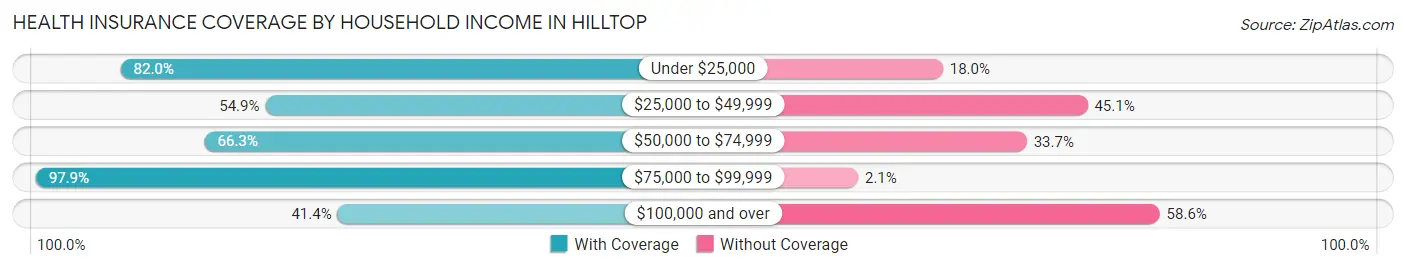
| Household Income | With Coverage | Without Coverage |
| Under $25,000 | 155 (82.0%) | 34 (18.0%) |
| $25,000 to $49,999 | 123 (54.9%) | 101 (45.1%) |
| $50,000 to $74,999 | 291 (66.3%) | 148 (33.7%) |
| $75,000 to $99,999 | 93 (97.9%) | 2 (2.1%) |
| $100,000 and over | 24 (41.4%) | 34 (58.6%) |
Public vs Private Health Insurance Coverage by Age in Hilltop
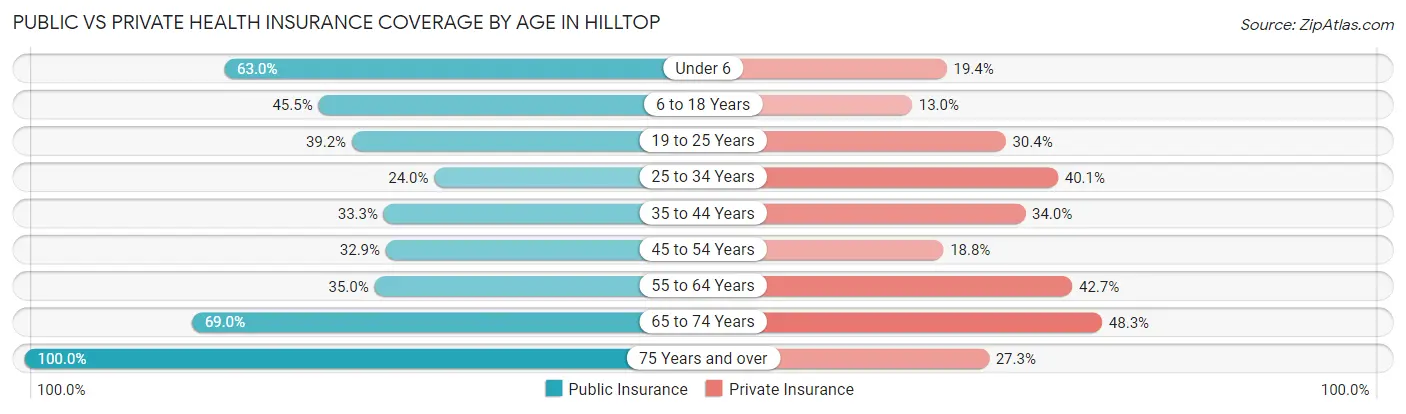
| Age Bracket | Public Insurance | Private Insurance |
| Under 6 | 68 (63.0%) | 21 (19.4%) |
| 6 to 18 Years | 70 (45.5%) | 20 (13.0%) |
| 19 to 25 Years | 31 (39.2%) | 24 (30.4%) |
| 25 to 34 Years | 52 (24.0%) | 87 (40.1%) |
| 35 to 44 Years | 49 (33.3%) | 50 (34.0%) |
| 45 to 54 Years | 28 (32.9%) | 16 (18.8%) |
| 55 to 64 Years | 41 (35.0%) | 50 (42.7%) |
| 65 to 74 Years | 60 (69.0%) | 42 (48.3%) |
| 75 Years and over | 11 (100.0%) | 3 (27.3%) |
| Total | 410 (40.8%) | 313 (31.1%) |
Disability Status by Sex by Age in Hilltop
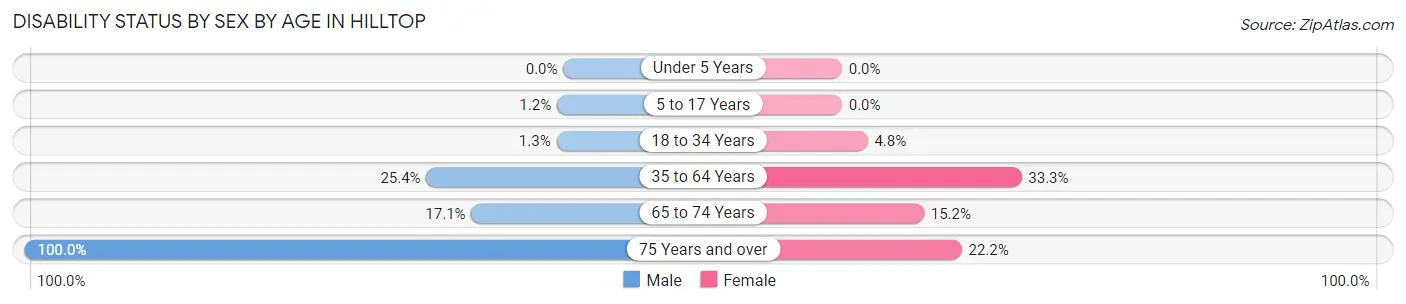
| Age Bracket | Male | Female |
| Under 5 Years | 0 (0.0%) | 0 (0.0%) |
| 5 to 17 Years | 1 (1.2%) | 0 (0.0%) |
| 18 to 34 Years | 2 (1.3%) | 7 (4.8%) |
| 35 to 64 Years | 62 (25.4%) | 35 (33.3%) |
| 65 to 74 Years | 7 (17.1%) | 7 (15.2%) |
| 75 Years and over | 2 (100.0%) | 2 (22.2%) |
Disability Class by Sex by Age in Hilltop
Disability Class: Hearing Difficulty
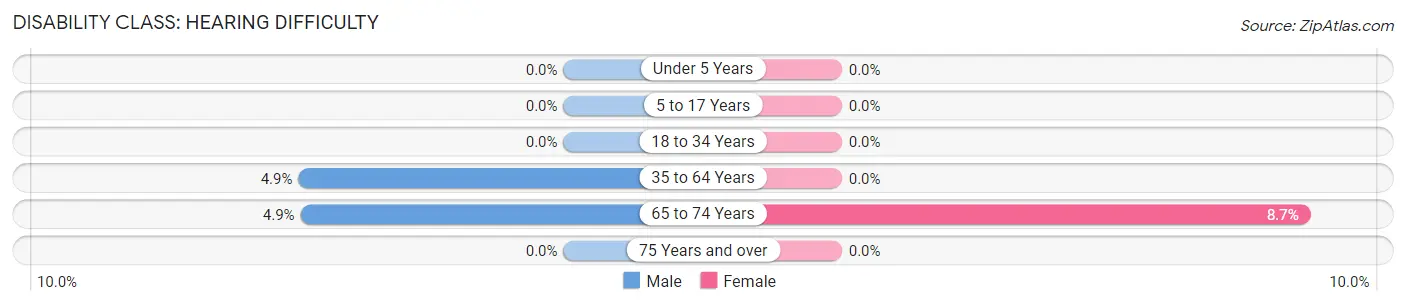
| Age Bracket | Male | Female |
| Under 5 Years | 0 (0.0%) | 0 (0.0%) |
| 5 to 17 Years | 0 (0.0%) | 0 (0.0%) |
| 18 to 34 Years | 0 (0.0%) | 0 (0.0%) |
| 35 to 64 Years | 12 (4.9%) | 0 (0.0%) |
| 65 to 74 Years | 2 (4.9%) | 4 (8.7%) |
| 75 Years and over | 0 (0.0%) | 0 (0.0%) |
Disability Class: Vision Difficulty
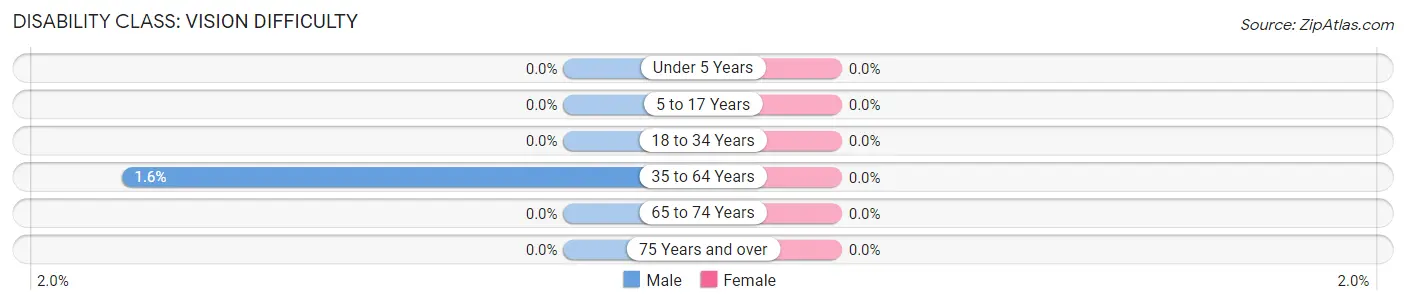
| Age Bracket | Male | Female |
| Under 5 Years | 0 (0.0%) | 0 (0.0%) |
| 5 to 17 Years | 0 (0.0%) | 0 (0.0%) |
| 18 to 34 Years | 0 (0.0%) | 0 (0.0%) |
| 35 to 64 Years | 4 (1.6%) | 0 (0.0%) |
| 65 to 74 Years | 0 (0.0%) | 0 (0.0%) |
| 75 Years and over | 0 (0.0%) | 0 (0.0%) |
Disability Class: Cognitive Difficulty
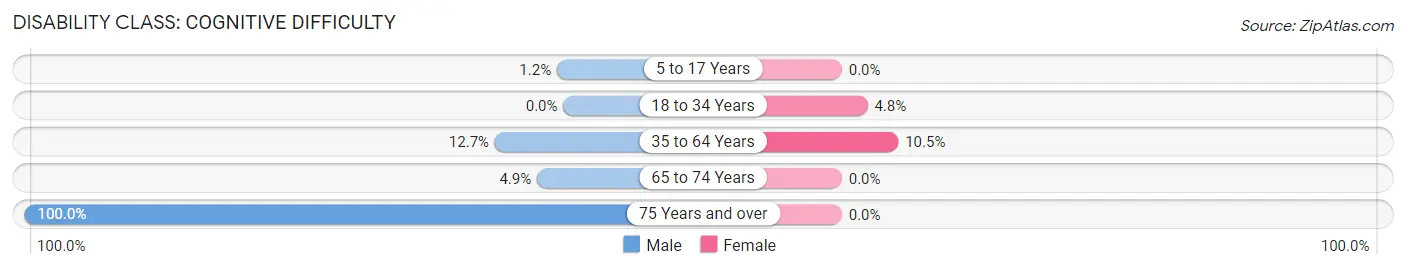
| Age Bracket | Male | Female |
| 5 to 17 Years | 1 (1.2%) | 0 (0.0%) |
| 18 to 34 Years | 0 (0.0%) | 7 (4.8%) |
| 35 to 64 Years | 31 (12.7%) | 11 (10.5%) |
| 65 to 74 Years | 2 (4.9%) | 0 (0.0%) |
| 75 Years and over | 2 (100.0%) | 0 (0.0%) |
Disability Class: Ambulatory Difficulty
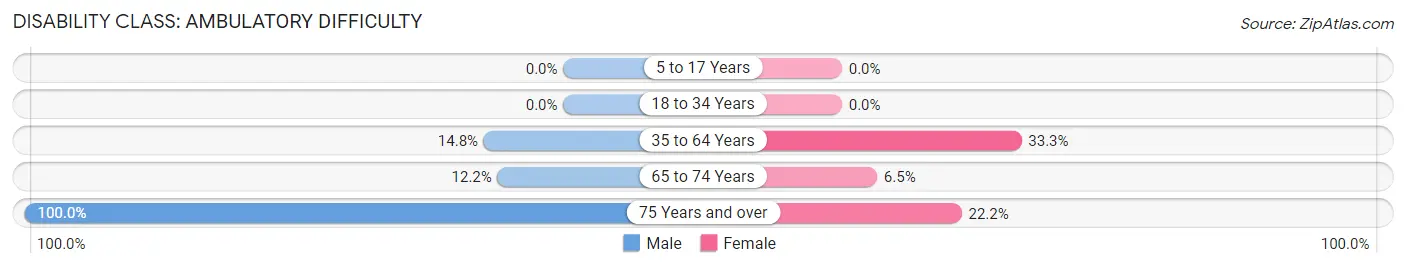
| Age Bracket | Male | Female |
| 5 to 17 Years | 0 (0.0%) | 0 (0.0%) |
| 18 to 34 Years | 0 (0.0%) | 0 (0.0%) |
| 35 to 64 Years | 36 (14.7%) | 35 (33.3%) |
| 65 to 74 Years | 5 (12.2%) | 3 (6.5%) |
| 75 Years and over | 2 (100.0%) | 2 (22.2%) |
Disability Class: Self-Care Difficulty
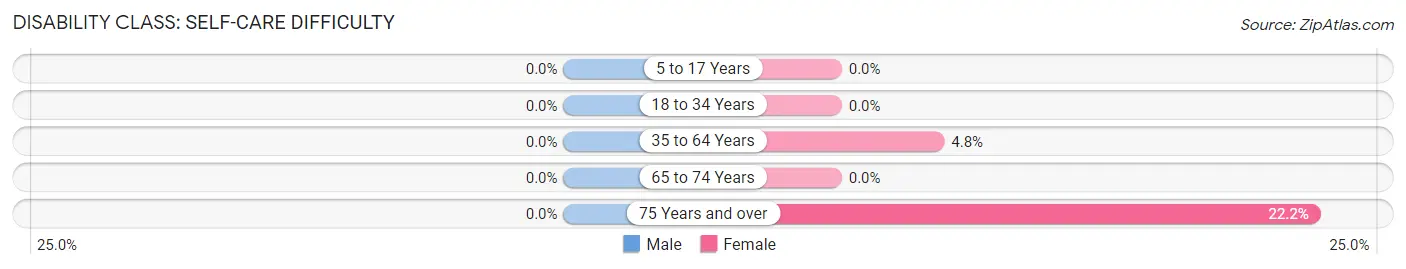
| Age Bracket | Male | Female |
| 5 to 17 Years | 0 (0.0%) | 0 (0.0%) |
| 18 to 34 Years | 0 (0.0%) | 0 (0.0%) |
| 35 to 64 Years | 0 (0.0%) | 5 (4.8%) |
| 65 to 74 Years | 0 (0.0%) | 0 (0.0%) |
| 75 Years and over | 0 (0.0%) | 2 (22.2%) |
Technology Access in Hilltop
Computing Device Access in Hilltop
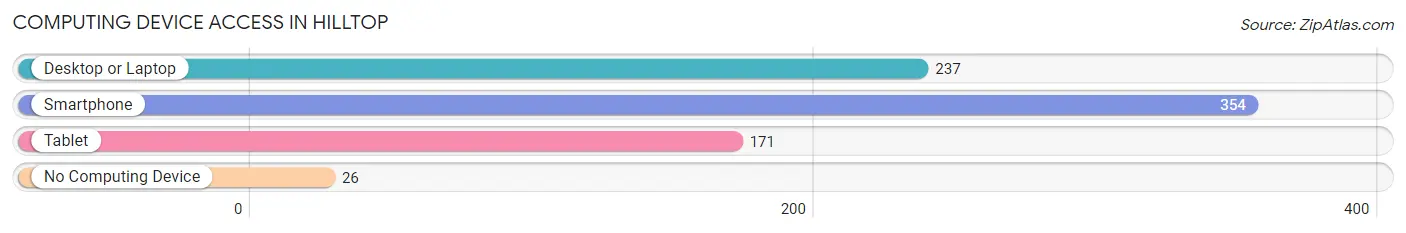
| Device Type | # Households | % Households |
| Desktop or Laptop | 237 | 57.7% |
| Smartphone | 354 | 86.1% |
| Tablet | 171 | 41.6% |
| No Computing Device | 26 | 6.3% |
| Total | 411 | 100.0% |
Internet Access in Hilltop
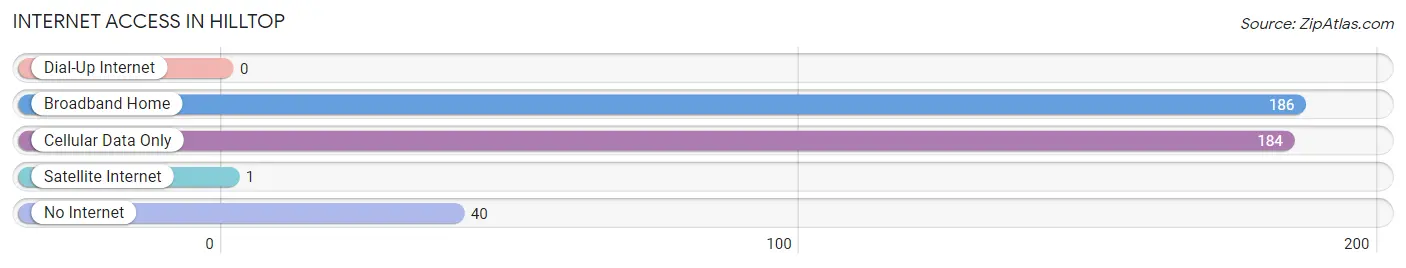
| Internet Type | # Households | % Households |
| Dial-Up Internet | 0 | 0.0% |
| Broadband Home | 186 | 45.3% |
| Cellular Data Only | 184 | 44.8% |
| Satellite Internet | 1 | 0.2% |
| No Internet | 40 | 9.7% |
| Total | 411 | 100.0% |
Hilltop Summary
Hilltop, Minnesota is a small town located in the southeastern corner of the state, near the border of Wisconsin. It is situated in the rolling hills of the Driftless Area, a region of the Upper Midwest that was not glaciated during the last ice age. The town is home to just over 500 people, and is known for its rural charm and friendly atmosphere.
History
The area that is now Hilltop was first settled in the late 1800s by German and Scandinavian immigrants. The town was originally called “Hillsboro”, but the name was changed to Hilltop in the early 1900s. The town was officially incorporated in 1908.
In the early days, Hilltop was a farming community, with many of the residents growing corn, wheat, and other crops. The town also had a few small businesses, including a general store, a blacksmith, and a sawmill.
In the 1950s, Hilltop began to experience a population boom, as many people moved to the area from larger cities in search of a more rural lifestyle. This influx of people led to the establishment of several new businesses, including a grocery store, a hardware store, and a gas station.
Geography
Hilltop is located in the southeastern corner of Minnesota, near the border of Wisconsin. The town is situated in the rolling hills of the Driftless Area, a region of the Upper Midwest that was not glaciated during the last ice age. The town is surrounded by lush forests and rolling hills, and is home to several small lakes and streams.
The town is located about 30 miles from the city of Rochester, and is about an hour and a half drive from the Twin Cities.
Economy
The economy of Hilltop is largely based on agriculture and tourism. The town is home to several small farms, which produce a variety of crops, including corn, wheat, and soybeans. The town also has a few small businesses, including a grocery store, a hardware store, and a gas station.
In recent years, Hilltop has become a popular destination for tourists, due to its rural charm and proximity to the Twin Cities. The town is home to several bed and breakfasts, as well as a few small restaurants and shops.
Demographics
As of the 2010 census, Hilltop had a population of 517 people. The town is predominantly white (96.2%), with a small minority population (3.8%). The median household income is $45,000, and the median age is 44.
Conclusion
Hilltop, Minnesota is a small town located in the southeastern corner of the state, near the border of Wisconsin. It is situated in the rolling hills of the Driftless Area, and is known for its rural charm and friendly atmosphere. The town’s economy is largely based on agriculture and tourism, and it is home to several small farms and businesses. Hilltop has a population of 517 people, and is predominantly white.
Common Questions
What is Per Capita Income in Hilltop?
Per Capita income in Hilltop is $20,380.
What is the Median Family Income in Hilltop?
Median Family Income in Hilltop is $52,846.
What is the Median Household income in Hilltop?
Median Household Income in Hilltop is $46,188.
What is Income or Wage Gap in Hilltop?
Income or Wage Gap in Hilltop is 35.9%.
Women in Hilltop earn 64.1 cents for every dollar earned by a man.
What is Inequality or Gini Index in Hilltop?
Inequality or Gini Index in Hilltop is 0.34.
What is the Total Population of Hilltop?
Total Population of Hilltop is 1,005.
What is the Total Male Population of Hilltop?
Total Male Population of Hilltop is 591.
What is the Total Female Population of Hilltop?
Total Female Population of Hilltop is 414.
What is the Ratio of Males per 100 Females in Hilltop?
There are 142.75 Males per 100 Females in Hilltop.
What is the Ratio of Females per 100 Males in Hilltop?
There are 70.05 Females per 100 Males in Hilltop.
What is the Median Population Age in Hilltop?
Median Population Age in Hilltop is 32.3 Years.
What is the Average Family Size in Hilltop
Average Family Size in Hilltop is 3.0 People.
What is the Average Household Size in Hilltop
Average Household Size in Hilltop is 2.5 People.
How Large is the Labor Force in Hilltop?
There are 585 People in the Labor Forcein in Hilltop.
What is the Percentage of People in the Labor Force in Hilltop?
74.5% of People are in the Labor Force in Hilltop.
What is the Unemployment Rate in Hilltop?
Unemployment Rate in Hilltop is 17.6%.