Rossville, MD Map & Demographics
Rossville Map
Rossville Overview
$41,963
PER CAPITA INCOME
$107,428
AVG FAMILY INCOME
$82,037
AVG HOUSEHOLD INCOME
32.8%
WAGE / INCOME GAP [ % ]
67.2¢/ $1
WAGE / INCOME GAP [ $ ]
$14,847
FAMILY INCOME DEFICIT
0.38
INEQUALITY / GINI INDEX
15,503
TOTAL POPULATION
7,368
MALE POPULATION
8,135
FEMALE POPULATION
90.57
MALES / 100 FEMALES
110.41
FEMALES / 100 MALES
37.8
MEDIAN AGE
3.1
AVG FAMILY SIZE
2.4
AVG HOUSEHOLD SIZE
9,588
LABOR FORCE [ PEOPLE ]
72.7%
PERCENT IN LABOR FORCE
3.7%
UNEMPLOYMENT RATE
Income in Rossville
Income Overview in Rossville
Per Capita Income in Rossville is $41,963, while median incomes of families and households are $107,428 and $82,037 respectively.
| Characteristic | Number | Measure |
| Per Capita Income | 15,503 | $41,963 |
| Median Family Income | 3,863 | $107,428 |
| Mean Family Income | 3,863 | $113,238 |
| Median Household Income | 6,372 | $82,037 |
| Mean Household Income | 6,372 | $97,380 |
| Income Deficit | 3,863 | $14,847 |
| Wage / Income Gap (%) | 15,503 | 32.78% |
| Wage / Income Gap ($) | 15,503 | 67.22¢ per $1 |
| Gini / Inequality Index | 15,503 | 0.38 |
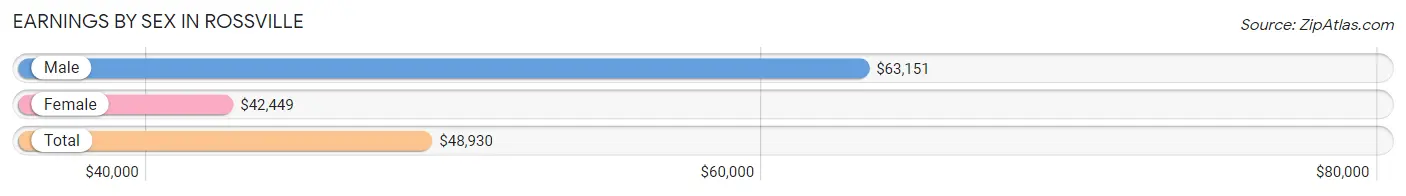
Earnings by Sex in Rossville
Average Earnings in Rossville are $48,930, $63,151 for men and $42,449 for women, a difference of 32.8%.
| Sex | Number | Average Earnings |
| Male | 5,024 (50.9%) | $63,151 |
| Female | 4,836 (49.0%) | $42,449 |
| Total | 9,860 (100.0%) | $48,930 |
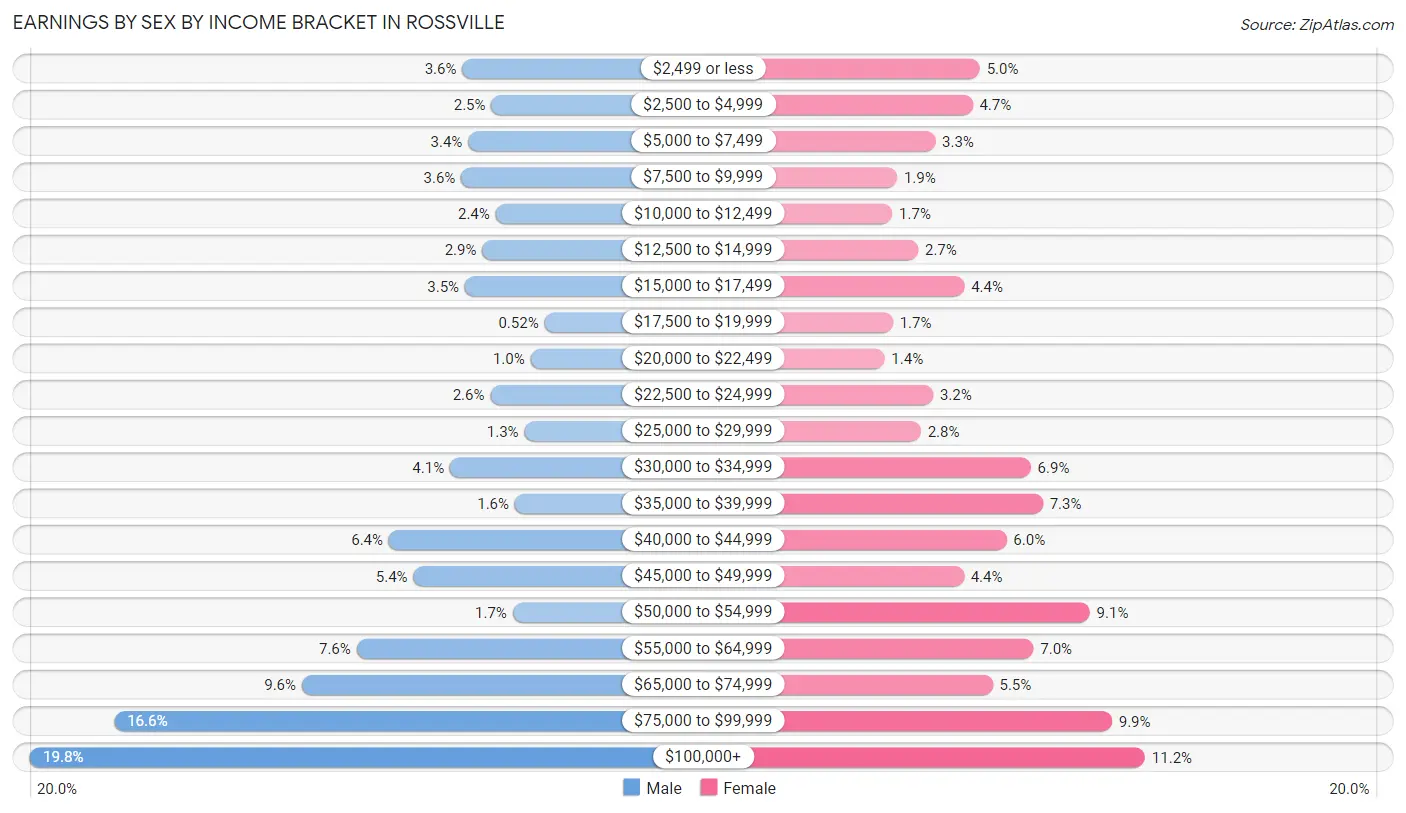
Earnings by Sex by Income Bracket in Rossville
The most common earnings brackets in Rossville are $100,000+ for men (994 | 19.8%) and $100,000+ for women (540 | 11.2%).
| Income | Male | Female |
| $2,499 or less | 181 (3.6%) | 241 (5.0%) |
| $2,500 to $4,999 | 126 (2.5%) | 228 (4.7%) |
| $5,000 to $7,499 | 170 (3.4%) | 160 (3.3%) |
| $7,500 to $9,999 | 183 (3.6%) | 91 (1.9%) |
| $10,000 to $12,499 | 118 (2.4%) | 82 (1.7%) |
| $12,500 to $14,999 | 143 (2.9%) | 129 (2.7%) |
| $15,000 to $17,499 | 176 (3.5%) | 213 (4.4%) |
| $17,500 to $19,999 | 26 (0.5%) | 83 (1.7%) |
| $20,000 to $22,499 | 52 (1.0%) | 68 (1.4%) |
| $22,500 to $24,999 | 128 (2.5%) | 156 (3.2%) |
| $25,000 to $29,999 | 64 (1.3%) | 134 (2.8%) |
| $30,000 to $34,999 | 204 (4.1%) | 333 (6.9%) |
| $35,000 to $39,999 | 82 (1.6%) | 355 (7.3%) |
| $40,000 to $44,999 | 319 (6.4%) | 289 (6.0%) |
| $45,000 to $49,999 | 273 (5.4%) | 212 (4.4%) |
| $50,000 to $54,999 | 86 (1.7%) | 440 (9.1%) |
| $55,000 to $64,999 | 380 (7.6%) | 338 (7.0%) |
| $65,000 to $74,999 | 483 (9.6%) | 264 (5.5%) |
| $75,000 to $99,999 | 836 (16.6%) | 480 (9.9%) |
| $100,000+ | 994 (19.8%) | 540 (11.2%) |
| Total | 5,024 (100.0%) | 4,836 (100.0%) |
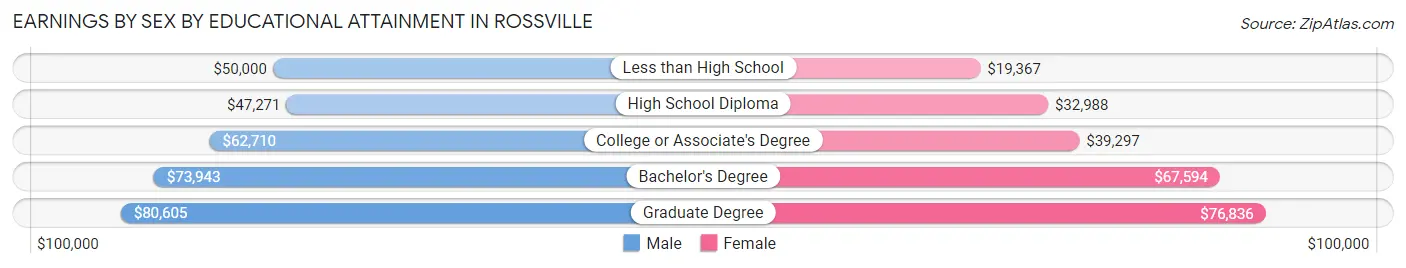
Earnings by Sex by Educational Attainment in Rossville
Average earnings in Rossville are $66,542 for men and $45,804 for women, a difference of 31.2%. Men with an educational attainment of graduate degree enjoy the highest average annual earnings of $80,605, while those with high school diploma education earn the least with $47,271. Women with an educational attainment of graduate degree earn the most with the average annual earnings of $76,836, while those with less than high school education have the smallest earnings of $19,367.
| Educational Attainment | Male Income | Female Income |
| Less than High School | $50,000 | $19,367 |
| High School Diploma | $47,271 | $32,988 |
| College or Associate's Degree | $62,710 | $39,297 |
| Bachelor's Degree | $73,943 | $67,594 |
| Graduate Degree | $80,605 | $76,836 |
| Total | $66,542 | $45,804 |
Family Income in Rossville
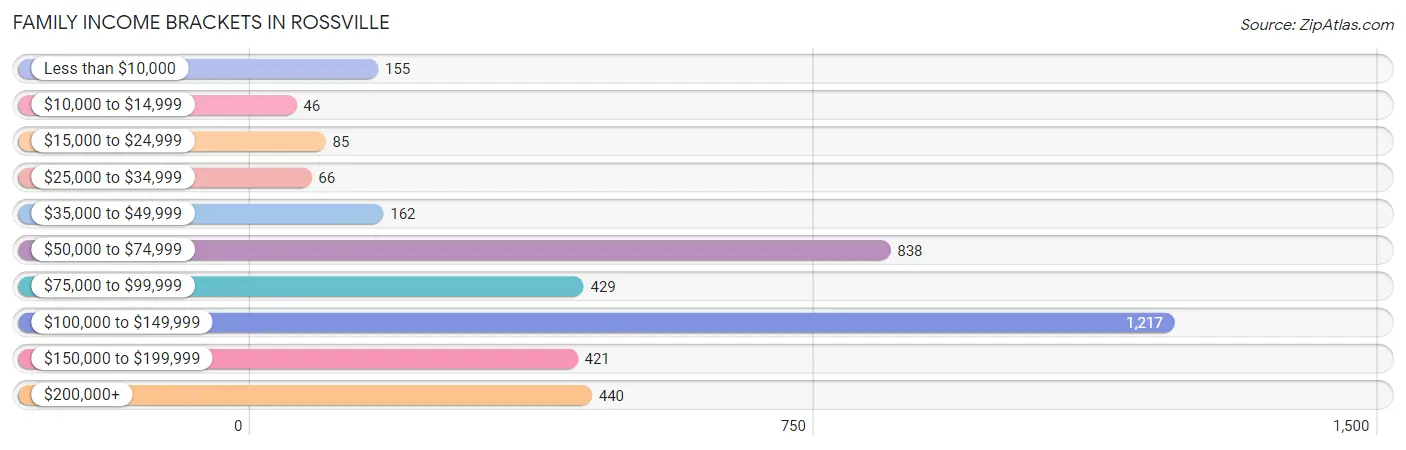
Family Income Brackets in Rossville
According to the Rossville family income data, there are 1,217 families falling into the $100,000 to $149,999 income range, which is the most common income bracket and makes up 31.5% of all families. Conversely, the $10,000 to $14,999 income bracket is the least frequent group with only 46 families (1.2%) belonging to this category.
| Income Bracket | # Families | % Families |
| Less than $10,000 | 155 | 4.0% |
| $10,000 to $14,999 | 46 | 1.2% |
| $15,000 to $24,999 | 85 | 2.2% |
| $25,000 to $34,999 | 66 | 1.7% |
| $35,000 to $49,999 | 162 | 4.2% |
| $50,000 to $74,999 | 838 | 21.7% |
| $75,000 to $99,999 | 429 | 11.1% |
| $100,000 to $149,999 | 1,217 | 31.5% |
| $150,000 to $199,999 | 421 | 10.9% |
| $200,000+ | 440 | 11.4% |
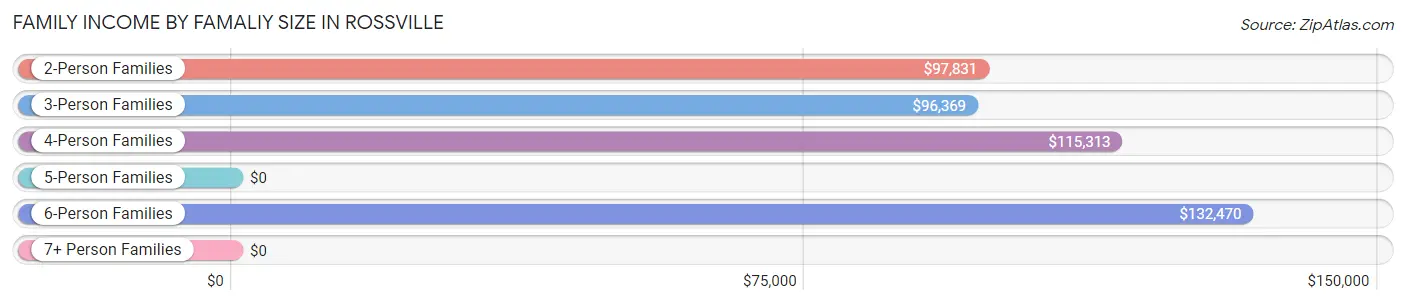
Family Income by Famaliy Size in Rossville
6-person families (166 | 4.3%) account for the highest median family income in Rossville with $132,470 per family, while 2-person families (2,013 | 52.1%) have the highest median income of $48,916 per family member.
| Income Bracket | # Families | Median Income |
| 2-Person Families | 2,013 (52.1%) | $97,831 |
| 3-Person Families | 849 (22.0%) | $96,369 |
| 4-Person Families | 606 (15.7%) | $115,313 |
| 5-Person Families | 202 (5.2%) | $0 |
| 6-Person Families | 166 (4.3%) | $132,470 |
| 7+ Person Families | 27 (0.7%) | $0 |
| Total | 3,863 (100.0%) | $107,428 |
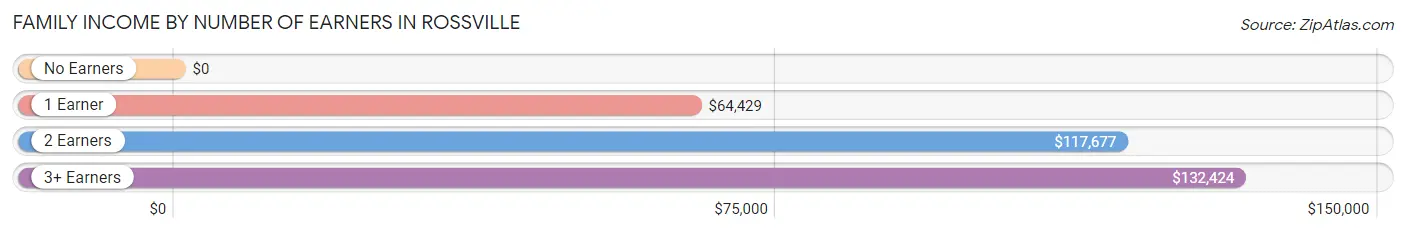
Family Income by Number of Earners in Rossville
| Number of Earners | # Families | Median Income |
| No Earners | 294 (7.6%) | $0 |
| 1 Earner | 1,120 (29.0%) | $64,429 |
| 2 Earners | 1,863 (48.2%) | $117,677 |
| 3+ Earners | 586 (15.2%) | $132,424 |
| Total | 3,863 (100.0%) | $107,428 |
Household Income in Rossville
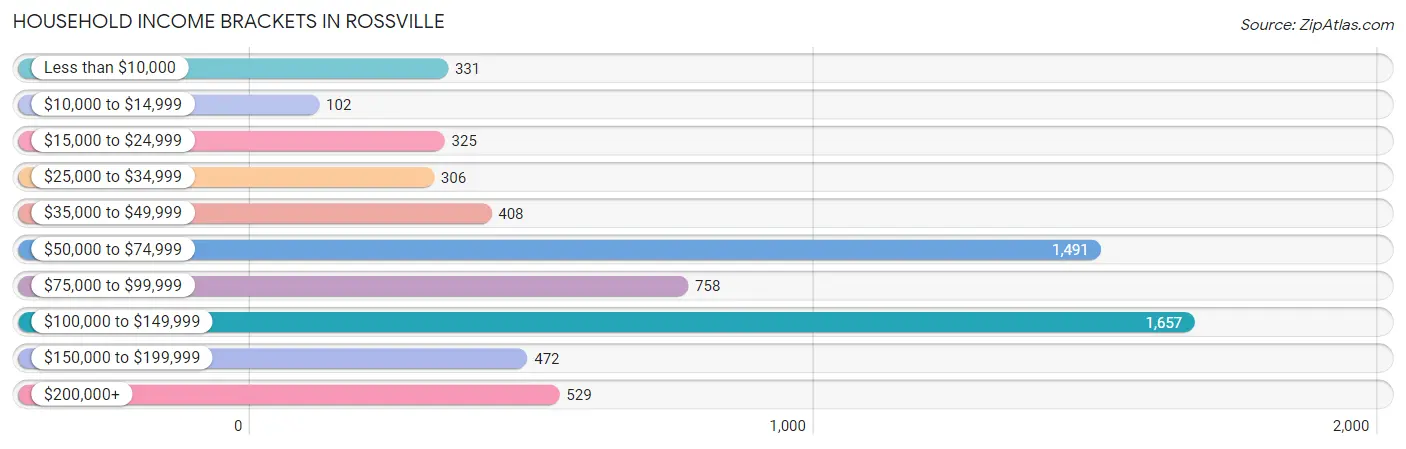
Household Income Brackets in Rossville
With 1,657 households falling in the category, the $100,000 to $149,999 income range is the most frequent in Rossville, accounting for 26.0% of all households. In contrast, only 102 households (1.6%) fall into the $10,000 to $14,999 income bracket, making it the least populous group.
| Income Bracket | # Households | % Households |
| Less than $10,000 | 331 | 5.2% |
| $10,000 to $14,999 | 102 | 1.6% |
| $15,000 to $24,999 | 325 | 5.1% |
| $25,000 to $34,999 | 306 | 4.8% |
| $35,000 to $49,999 | 408 | 6.4% |
| $50,000 to $74,999 | 1,491 | 23.4% |
| $75,000 to $99,999 | 758 | 11.9% |
| $100,000 to $149,999 | 1,657 | 26.0% |
| $150,000 to $199,999 | 472 | 7.4% |
| $200,000+ | 529 | 8.3% |
Household Income by Householder Age in Rossville
The median household income in Rossville is $82,037, with the highest median household income of $101,313 found in the 25 to 44 years age bracket for the primary householder. A total of 2,512 households (39.4%) fall into this category. Meanwhile, the 15 to 24 years age bracket for the primary householder has the lowest median household income of $0, with 482 households (7.6%) in this group.
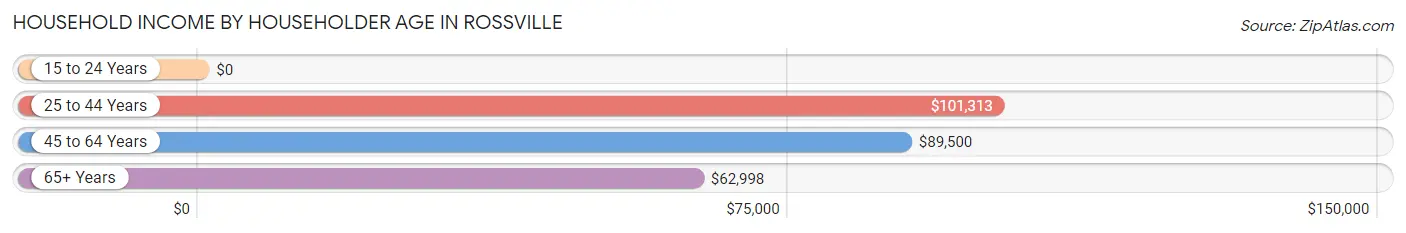
| Income Bracket | # Households | Median Income |
| 15 to 24 Years | 482 (7.6%) | $0 |
| 25 to 44 Years | 2,512 (39.4%) | $101,313 |
| 45 to 64 Years | 2,280 (35.8%) | $89,500 |
| 65+ Years | 1,098 (17.2%) | $62,998 |
| Total | 6,372 (100.0%) | $82,037 |
Poverty in Rossville
Income Below Poverty by Sex and Age in Rossville
With 7.5% poverty level for males and 10.3% for females among the residents of Rossville, under 5 year old males and 16 and 17 year old females are the most vulnerable to poverty, with 150 males (28.2%) and 40 females (69.0%) in their respective age groups living below the poverty level.
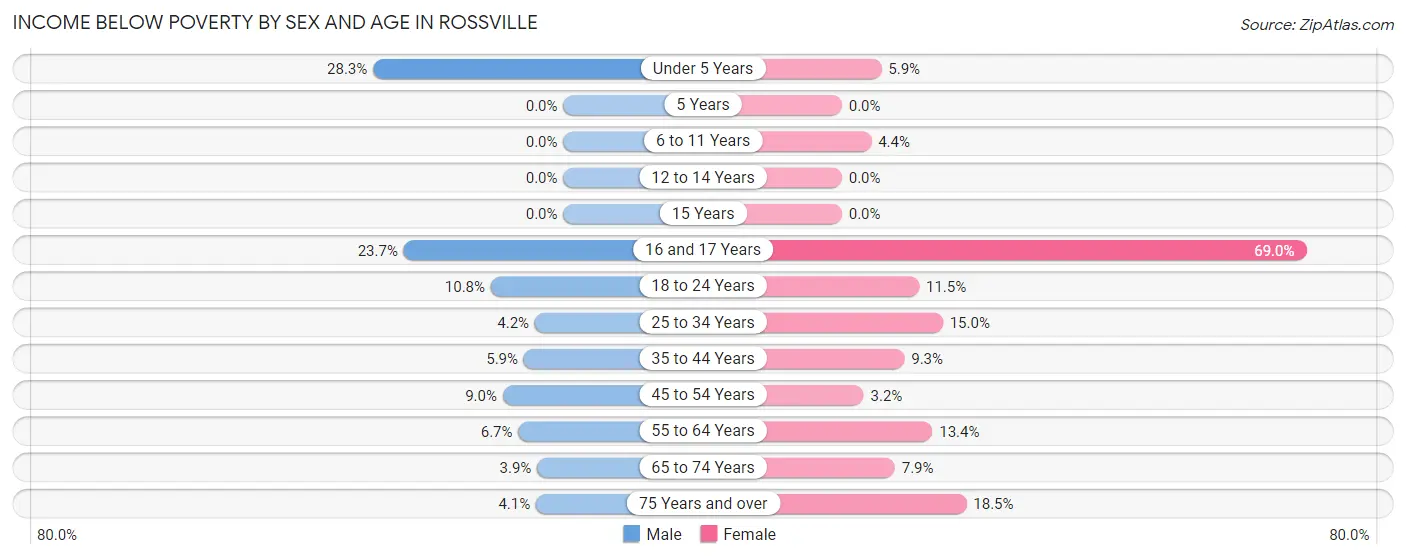
| Age Bracket | Male | Female |
| Under 5 Years | 150 (28.2%) | 27 (5.9%) |
| 5 Years | 0 (0.0%) | 0 (0.0%) |
| 6 to 11 Years | 0 (0.0%) | 22 (4.4%) |
| 12 to 14 Years | 0 (0.0%) | 0 (0.0%) |
| 15 Years | 0 (0.0%) | 0 (0.0%) |
| 16 and 17 Years | 32 (23.7%) | 40 (69.0%) |
| 18 to 24 Years | 64 (10.8%) | 88 (11.5%) |
| 25 to 34 Years | 67 (4.2%) | 230 (15.0%) |
| 35 to 44 Years | 83 (5.9%) | 97 (9.3%) |
| 45 to 54 Years | 58 (9.0%) | 37 (3.2%) |
| 55 to 64 Years | 53 (6.7%) | 150 (13.4%) |
| 65 to 74 Years | 26 (3.9%) | 64 (7.9%) |
| 75 Years and over | 12 (4.1%) | 64 (18.5%) |
| Total | 545 (7.5%) | 819 (10.3%) |
Income Above Poverty by Sex and Age in Rossville
According to the poverty statistics in Rossville, males aged 5 years and females aged 5 years are the age groups that are most secure financially, with 100.0% of males and 100.0% of females in these age groups living above the poverty line.
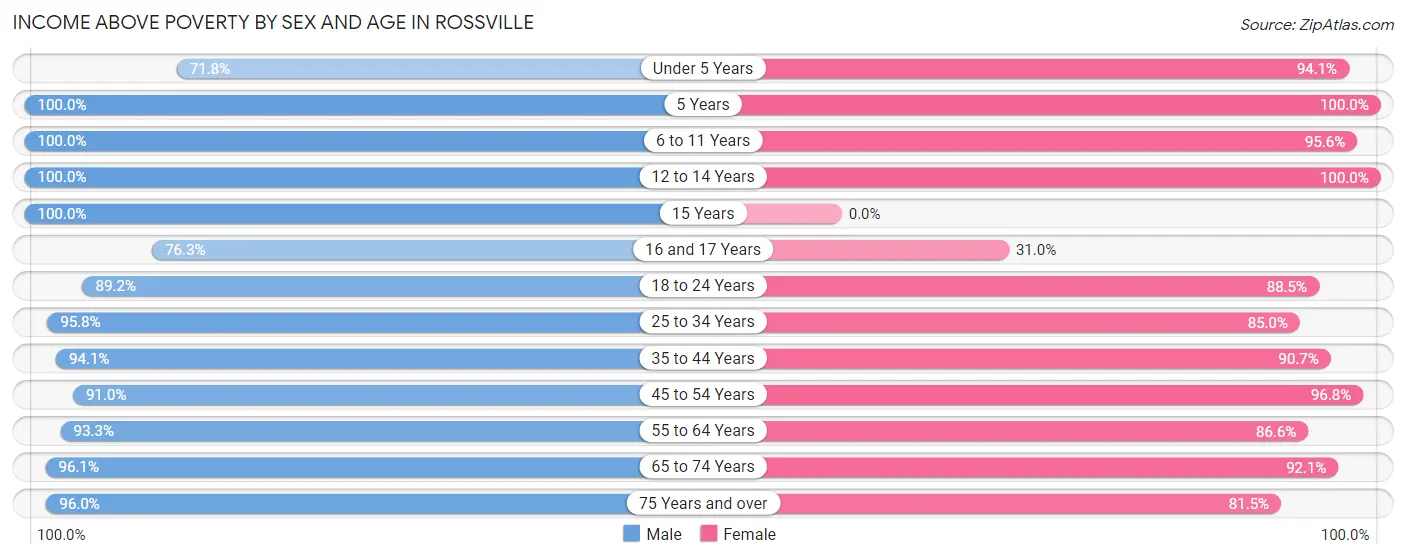
| Age Bracket | Male | Female |
| Under 5 Years | 381 (71.8%) | 433 (94.1%) |
| 5 Years | 89 (100.0%) | 121 (100.0%) |
| 6 to 11 Years | 344 (100.0%) | 482 (95.6%) |
| 12 to 14 Years | 195 (100.0%) | 67 (100.0%) |
| 15 Years | 4 (100.0%) | 0 (0.0%) |
| 16 and 17 Years | 103 (76.3%) | 18 (31.0%) |
| 18 to 24 Years | 531 (89.2%) | 679 (88.5%) |
| 25 to 34 Years | 1,521 (95.8%) | 1,304 (85.0%) |
| 35 to 44 Years | 1,334 (94.1%) | 948 (90.7%) |
| 45 to 54 Years | 587 (91.0%) | 1,105 (96.8%) |
| 55 to 64 Years | 741 (93.3%) | 966 (86.6%) |
| 65 to 74 Years | 642 (96.1%) | 749 (92.1%) |
| 75 Years and over | 284 (96.0%) | 282 (81.5%) |
| Total | 6,756 (92.5%) | 7,154 (89.7%) |
Income Below Poverty Among Married-Couple Families in Rossville
The poverty statistics for married-couple families in Rossville show that 2.6% or 60 of the total 2,311 families live below the poverty line. Families with 1 or 2 children have the highest poverty rate of 5.4%, comprising of 36 families. On the other hand, families with 3 or 4 children have the lowest poverty rate of 0.0%, which includes 0 families.
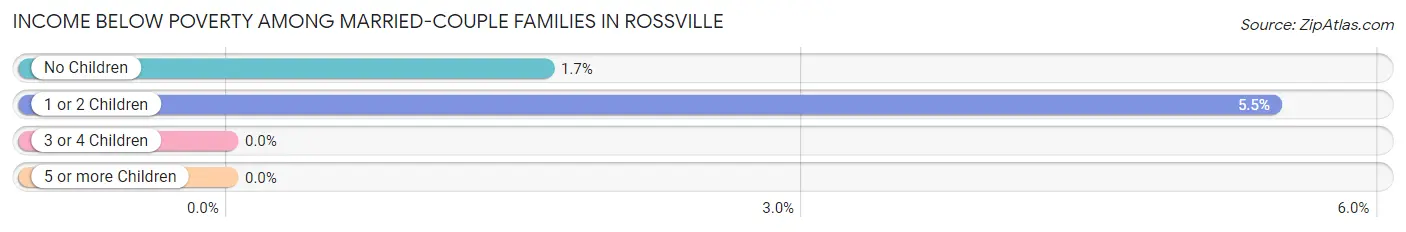
| Children | Above Poverty | Below Poverty |
| No Children | 1,427 (98.4%) | 24 (1.7%) |
| 1 or 2 Children | 624 (94.6%) | 36 (5.4%) |
| 3 or 4 Children | 200 (100.0%) | 0 (0.0%) |
| 5 or more Children | 0 (0.0%) | 0 (0.0%) |
| Total | 2,251 (97.4%) | 60 (2.6%) |
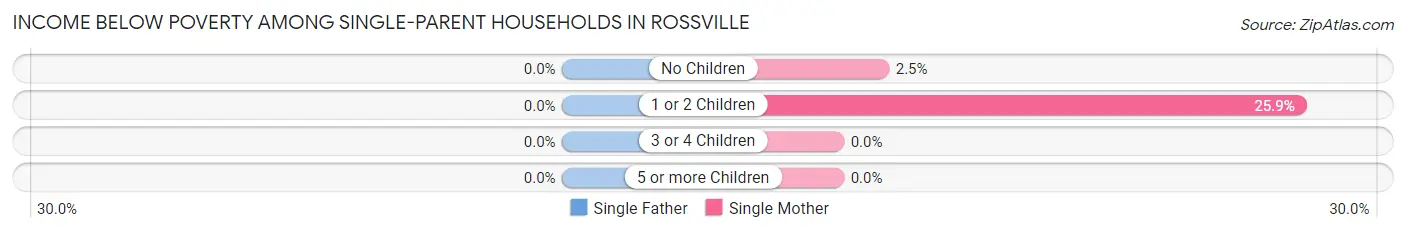
Income Below Poverty Among Single-Parent Households in Rossville
| Children | Single Father | Single Mother |
| No Children | 0 (0.0%) | 12 (2.5%) |
| 1 or 2 Children | 0 (0.0%) | 143 (25.9%) |
| 3 or 4 Children | 0 (0.0%) | 0 (0.0%) |
| 5 or more Children | 0 (0.0%) | 0 (0.0%) |
| Total | 0 (0.0%) | 155 (15.1%) |
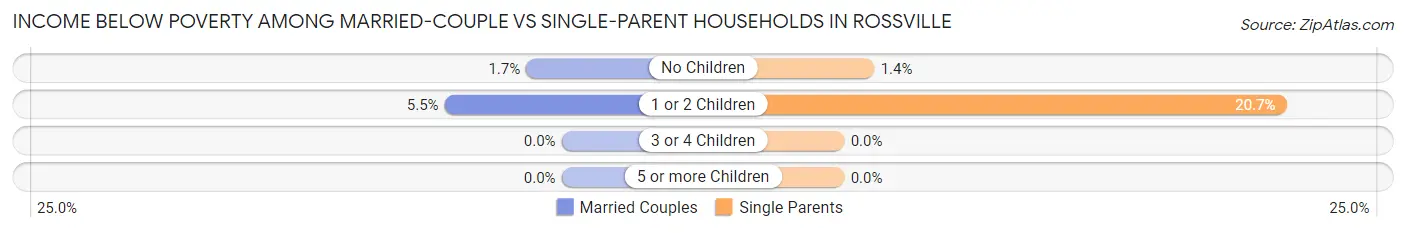
Income Below Poverty Among Married-Couple vs Single-Parent Households in Rossville
The poverty data for Rossville shows that 60 of the married-couple family households (2.6%) and 155 of the single-parent households (10.0%) are living below the poverty level. Within the married-couple family households, those with 1 or 2 children have the highest poverty rate, with 36 households (5.4%) falling below the poverty line. Among the single-parent households, those with 1 or 2 children have the highest poverty rate, with 143 household (20.7%) living below poverty.
| Children | Married-Couple Families | Single-Parent Households |
| No Children | 24 (1.7%) | 12 (1.4%) |
| 1 or 2 Children | 36 (5.4%) | 143 (20.7%) |
| 3 or 4 Children | 0 (0.0%) | 0 (0.0%) |
| 5 or more Children | 0 (0.0%) | 0 (0.0%) |
| Total | 60 (2.6%) | 155 (10.0%) |
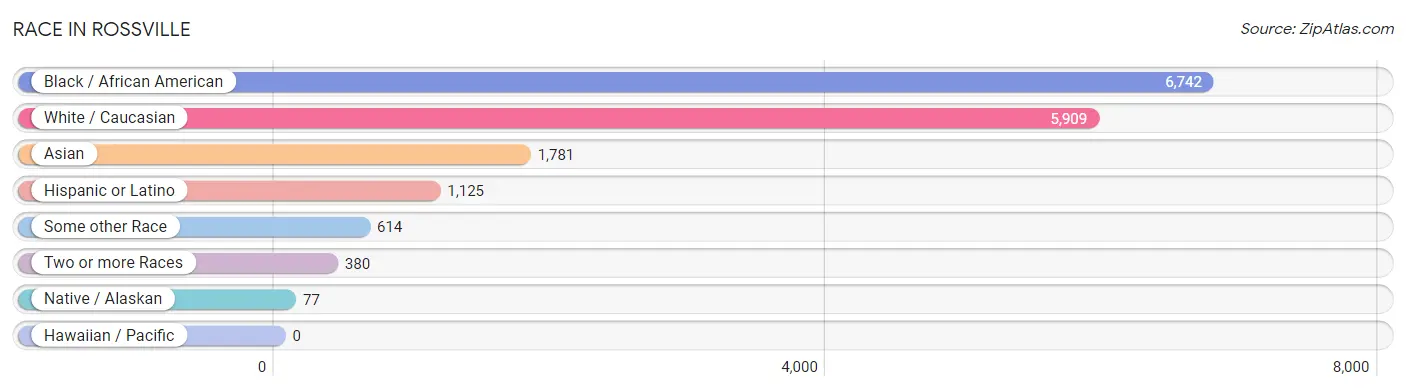
Race in Rossville
The most populous races in Rossville are Black / African American (6,742 | 43.5%), White / Caucasian (5,909 | 38.1%), and Asian (1,781 | 11.5%).
| Race | # Population | % Population |
| Asian | 1,781 | 11.5% |
| Black / African American | 6,742 | 43.5% |
| Hawaiian / Pacific | 0 | 0.0% |
| Hispanic or Latino | 1,125 | 7.3% |
| Native / Alaskan | 77 | 0.5% |
| White / Caucasian | 5,909 | 38.1% |
| Two or more Races | 380 | 2.5% |
| Some other Race | 614 | 4.0% |
| Total | 15,503 | 100.0% |
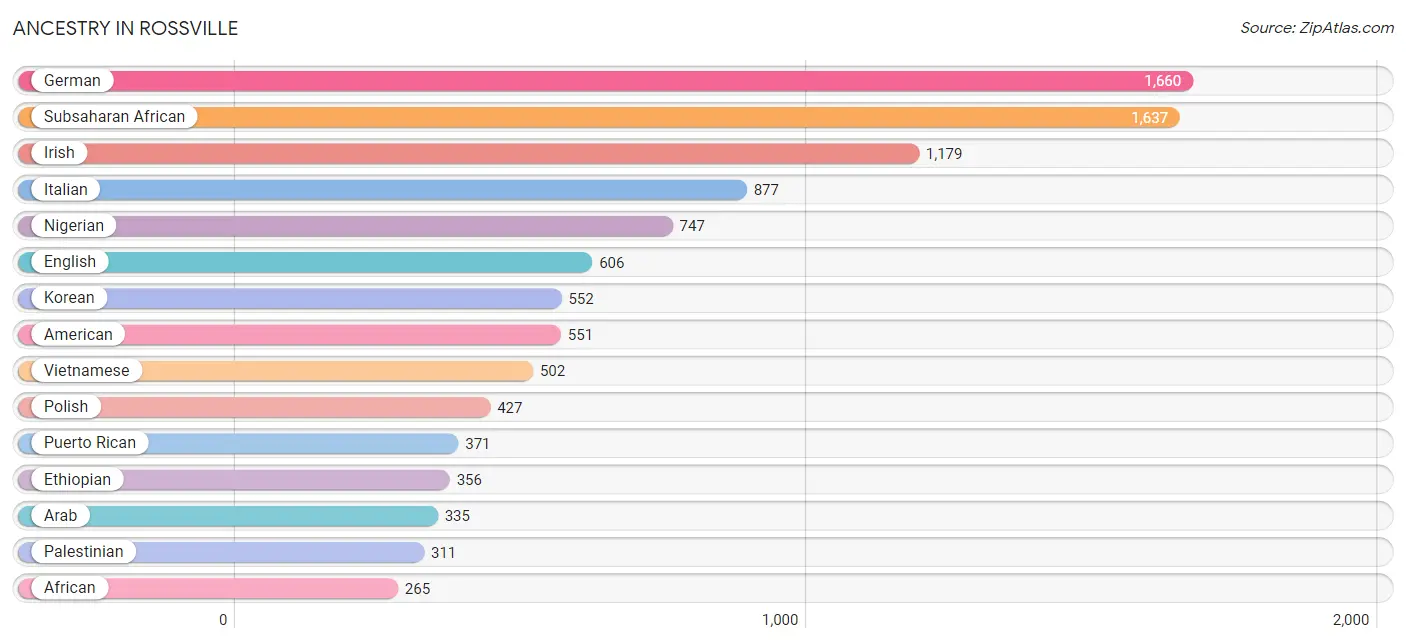
Ancestry in Rossville
The most populous ancestries reported in Rossville are German (1,660 | 10.7%), Subsaharan African (1,637 | 10.6%), Irish (1,179 | 7.6%), Italian (877 | 5.7%), and Nigerian (747 | 4.8%), together accounting for 39.4% of all Rossville residents.
| Ancestry | # Population | % Population |
| African | 265 | 1.7% |
| American | 551 | 3.5% |
| Arab | 335 | 2.2% |
| Armenian | 27 | 0.2% |
| Austrian | 4 | 0.0% |
| British | 103 | 0.7% |
| Burmese | 131 | 0.8% |
| Central American | 61 | 0.4% |
| Cherokee | 77 | 0.5% |
| Cuban | 58 | 0.4% |
| Czech | 4 | 0.0% |
| Dominican | 64 | 0.4% |
| Dutch | 81 | 0.5% |
| Eastern European | 18 | 0.1% |
| English | 606 | 3.9% |
| Ethiopian | 356 | 2.3% |
| European | 70 | 0.4% |
| French | 177 | 1.1% |
| German | 1,660 | 10.7% |
| Greek | 27 | 0.2% |
| Guatemalan | 27 | 0.2% |
| Hungarian | 40 | 0.3% |
| Indian (Asian) | 63 | 0.4% |
| Irish | 1,179 | 7.6% |
| Italian | 877 | 5.7% |
| Jamaican | 96 | 0.6% |
| Kenyan | 213 | 1.4% |
| Korean | 552 | 3.6% |
| Liberian | 40 | 0.3% |
| Mexican | 133 | 0.9% |
| Nigerian | 747 | 4.8% |
| Northern European | 13 | 0.1% |
| Norwegian | 22 | 0.1% |
| Pakistani | 116 | 0.7% |
| Palestinian | 311 | 2.0% |
| Polish | 427 | 2.8% |
| Puerto Rican | 371 | 2.4% |
| Russian | 76 | 0.5% |
| Salvadoran | 34 | 0.2% |
| Scotch-Irish | 26 | 0.2% |
| Scottish | 221 | 1.4% |
| South American | 163 | 1.1% |
| Sri Lankan | 24 | 0.2% |
| Subsaharan African | 1,637 | 10.6% |
| Swedish | 40 | 0.3% |
| Swiss | 11 | 0.1% |
| Syrian | 24 | 0.2% |
| Thai | 109 | 0.7% |
| Trinidadian and Tobagonian | 73 | 0.5% |
| Ukrainian | 76 | 0.5% |
| Venezuelan | 163 | 1.1% |
| Vietnamese | 502 | 3.2% |
| Welsh | 37 | 0.2% | View All 53 Rows |
Immigrants in Rossville
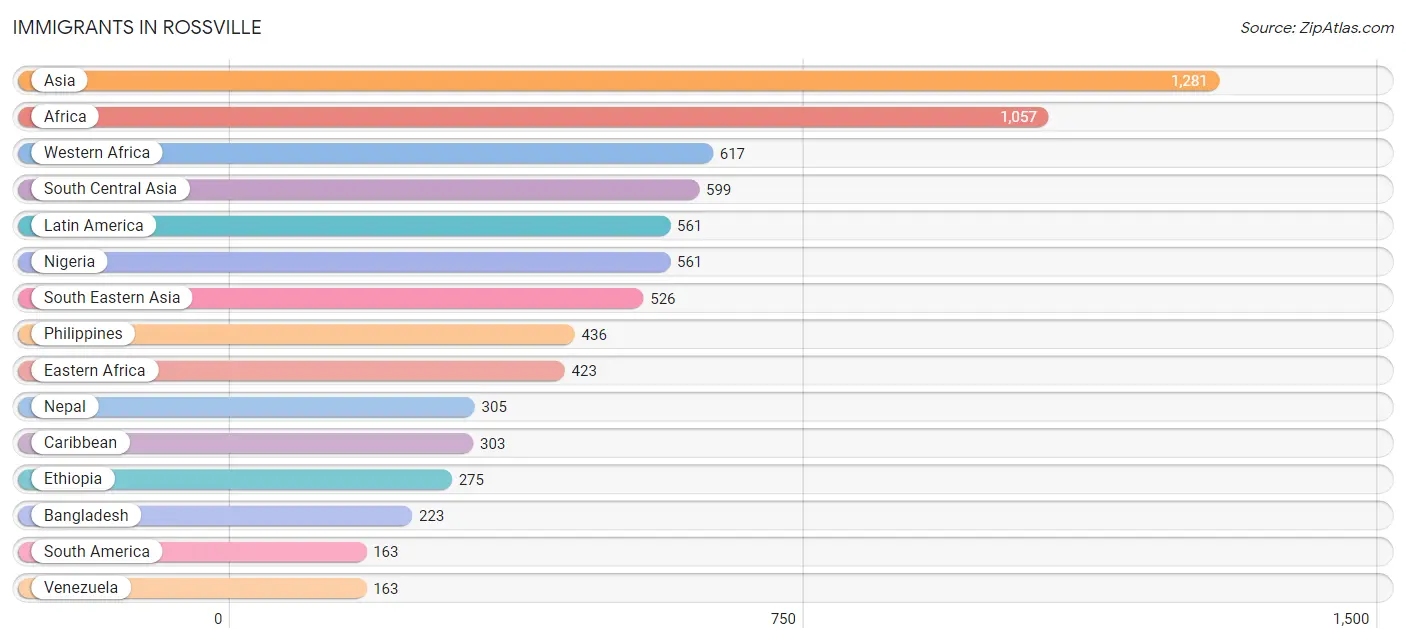
The most numerous immigrant groups reported in Rossville came from Asia (1,281 | 8.3%), Africa (1,057 | 6.8%), Western Africa (617 | 4.0%), South Central Asia (599 | 3.9%), and Latin America (561 | 3.6%), together accounting for 26.5% of all Rossville residents.
| Immigration Origin | # Population | % Population |
| Africa | 1,057 | 6.8% |
| Asia | 1,281 | 8.3% |
| Bangladesh | 223 | 1.4% |
| Cameroon | 17 | 0.1% |
| Canada | 23 | 0.2% |
| Caribbean | 303 | 1.9% |
| Central America | 95 | 0.6% |
| China | 28 | 0.2% |
| Dominican Republic | 64 | 0.4% |
| Eastern Africa | 423 | 2.7% |
| Eastern Asia | 133 | 0.9% |
| Eastern Europe | 53 | 0.3% |
| El Salvador | 10 | 0.1% |
| England | 24 | 0.2% |
| Ethiopia | 275 | 1.8% |
| Europe | 142 | 0.9% |
| Germany | 7 | 0.1% |
| Guatemala | 27 | 0.2% |
| Haiti | 89 | 0.6% |
| India | 53 | 0.3% |
| Iran | 18 | 0.1% |
| Jamaica | 48 | 0.3% |
| Kenya | 148 | 0.9% |
| Korea | 105 | 0.7% |
| Latin America | 561 | 3.6% |
| Liberia | 40 | 0.3% |
| Mexico | 58 | 0.4% |
| Middle Africa | 17 | 0.1% |
| Nepal | 305 | 2.0% |
| Nigeria | 561 | 3.6% |
| Northern Europe | 82 | 0.5% |
| Oceania | 26 | 0.2% |
| Philippines | 436 | 2.8% |
| Russia | 53 | 0.3% |
| South America | 163 | 1.1% |
| South Central Asia | 599 | 3.9% |
| South Eastern Asia | 526 | 3.4% |
| Thailand | 64 | 0.4% |
| Trinidad and Tobago | 14 | 0.1% |
| Venezuela | 163 | 1.1% |
| Vietnam | 26 | 0.2% |
| Western Africa | 617 | 4.0% |
| Western Asia | 23 | 0.2% |
| Western Europe | 7 | 0.1% | View All 44 Rows |
Sex and Age in Rossville
Sex and Age in Rossville
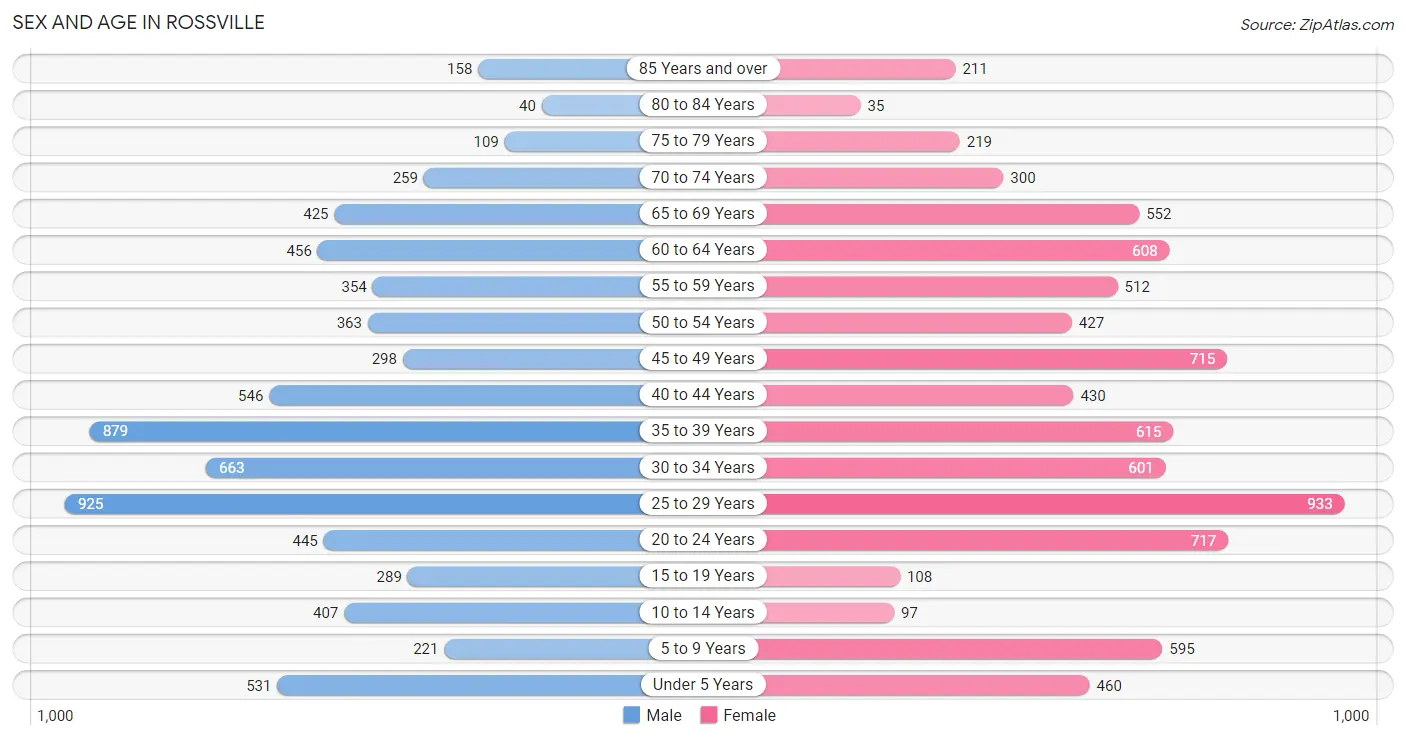
The most populous age groups in Rossville are 25 to 29 Years (925 | 12.6%) for men and 25 to 29 Years (933 | 11.5%) for women.
| Age Bracket | Male | Female |
| Under 5 Years | 531 (7.2%) | 460 (5.7%) |
| 5 to 9 Years | 221 (3.0%) | 595 (7.3%) |
| 10 to 14 Years | 407 (5.5%) | 97 (1.2%) |
| 15 to 19 Years | 289 (3.9%) | 108 (1.3%) |
| 20 to 24 Years | 445 (6.0%) | 717 (8.8%) |
| 25 to 29 Years | 925 (12.6%) | 933 (11.5%) |
| 30 to 34 Years | 663 (9.0%) | 601 (7.4%) |
| 35 to 39 Years | 879 (11.9%) | 615 (7.6%) |
| 40 to 44 Years | 546 (7.4%) | 430 (5.3%) |
| 45 to 49 Years | 298 (4.0%) | 715 (8.8%) |
| 50 to 54 Years | 363 (4.9%) | 427 (5.2%) |
| 55 to 59 Years | 354 (4.8%) | 512 (6.3%) |
| 60 to 64 Years | 456 (6.2%) | 608 (7.5%) |
| 65 to 69 Years | 425 (5.8%) | 552 (6.8%) |
| 70 to 74 Years | 259 (3.5%) | 300 (3.7%) |
| 75 to 79 Years | 109 (1.5%) | 219 (2.7%) |
| 80 to 84 Years | 40 (0.5%) | 35 (0.4%) |
| 85 Years and over | 158 (2.1%) | 211 (2.6%) |
| Total | 7,368 (100.0%) | 8,135 (100.0%) |
Families and Households in Rossville
Median Family Size in Rossville
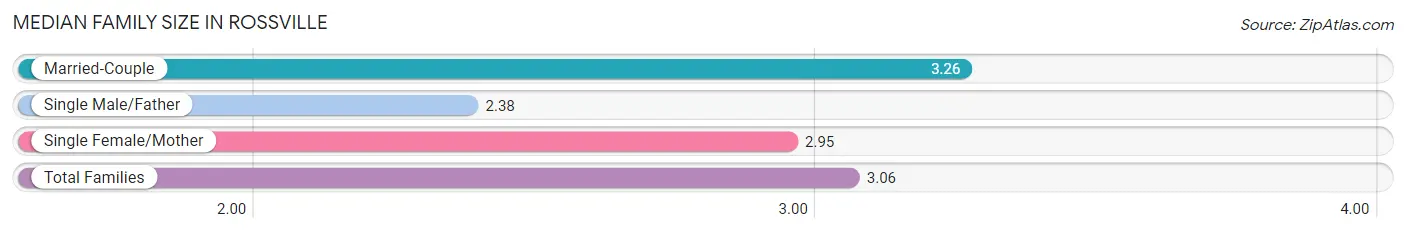
The median family size in Rossville is 3.06 persons per family, with married-couple families (2,311 | 59.8%) accounting for the largest median family size of 3.26 persons per family. On the other hand, single male/father families (523 | 13.5%) represent the smallest median family size with 2.38 persons per family.
| Family Type | # Families | Family Size |
| Married-Couple | 2,311 (59.8%) | 3.26 |
| Single Male/Father | 523 (13.5%) | 2.38 |
| Single Female/Mother | 1,029 (26.6%) | 2.95 |
| Total Families | 3,863 (100.0%) | 3.06 |
Median Household Size in Rossville
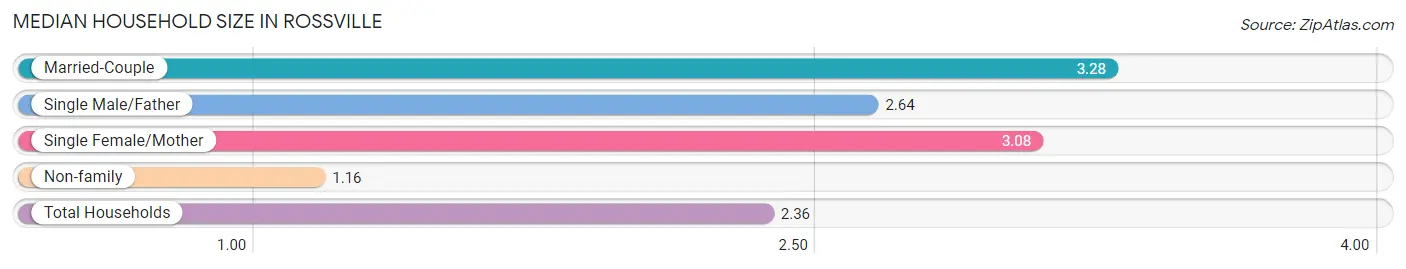
The median household size in Rossville is 2.36 persons per household, with married-couple households (2,311 | 36.3%) accounting for the largest median household size of 3.28 persons per household. non-family households (2,509 | 39.4%) represent the smallest median household size with 1.16 persons per household.
| Household Type | # Households | Household Size |
| Married-Couple | 2,311 (36.3%) | 3.28 |
| Single Male/Father | 523 (8.2%) | 2.64 |
| Single Female/Mother | 1,029 (16.2%) | 3.08 |
| Non-family | 2,509 (39.4%) | 1.16 |
| Total Households | 6,372 (100.0%) | 2.36 |
Household Size by Marriage Status in Rossville
Out of a total of 6,372 households in Rossville, 3,863 (60.6%) are family households, while 2,509 (39.4%) are nonfamily households. The most numerous type of family households are 2-person households, comprising 1,792, and the most common type of nonfamily households are 1-person households, comprising 2,128.
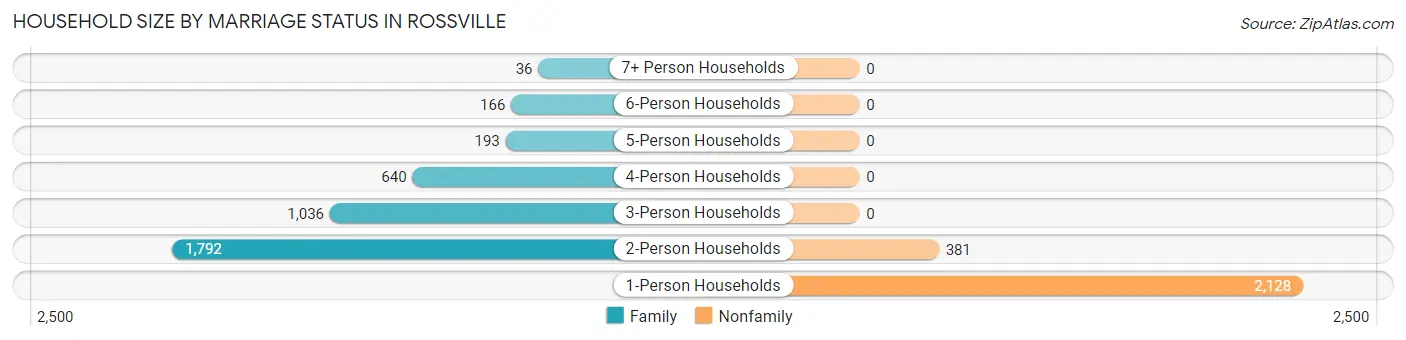
| Household Size | Family Households | Nonfamily Households |
| 1-Person Households | - | 2,128 (33.4%) |
| 2-Person Households | 1,792 (28.1%) | 381 (6.0%) |
| 3-Person Households | 1,036 (16.3%) | 0 (0.0%) |
| 4-Person Households | 640 (10.0%) | 0 (0.0%) |
| 5-Person Households | 193 (3.0%) | 0 (0.0%) |
| 6-Person Households | 166 (2.6%) | 0 (0.0%) |
| 7+ Person Households | 36 (0.6%) | 0 (0.0%) |
| Total | 3,863 (60.6%) | 2,509 (39.4%) |
Female Fertility in Rossville
Fertility by Age in Rossville
Average fertility rate in Rossville is 75.0 births per 1,000 women. Women in the age bracket of 20 to 34 years have the highest fertility rate with 123.0 births per 1,000 women. Women in the age bracket of 20 to 34 years acount for 87.7% of all women with births.
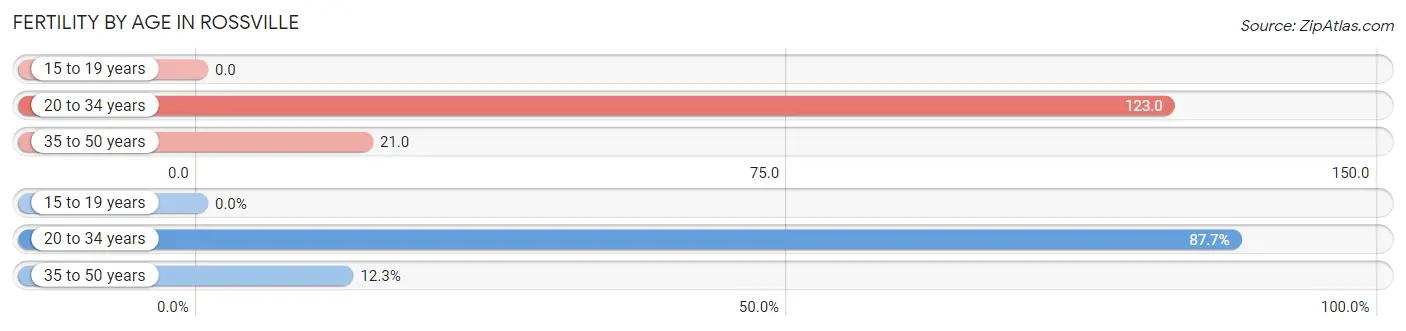
| Age Bracket | Women with Births | Births / 1,000 Women |
| 15 to 19 years | 0 (0.0%) | 0.0 |
| 20 to 34 years | 277 (87.7%) | 123.0 |
| 35 to 50 years | 39 (12.3%) | 21.0 |
| Total | 316 (100.0%) | 75.0 |
Fertility by Age by Marriage Status in Rossville
39.6% of women with births (316) in Rossville are married. The highest percentage of unmarried women with births falls into 20 to 34 years age bracket with 62.8% of them unmarried at the time of birth, while the lowest percentage of unmarried women with births belong to 35 to 50 years age bracket with 43.6% of them unmarried.
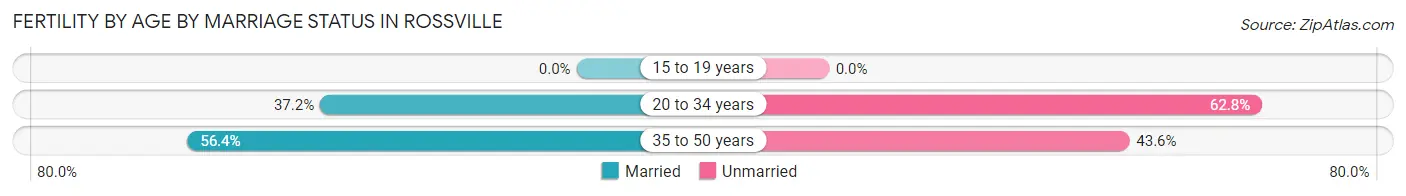
| Age Bracket | Married | Unmarried |
| 15 to 19 years | 0 (0.0%) | 0 (0.0%) |
| 20 to 34 years | 103 (37.2%) | 174 (62.8%) |
| 35 to 50 years | 22 (56.4%) | 17 (43.6%) |
| Total | 125 (39.6%) | 191 (60.4%) |
Fertility by Education in Rossville
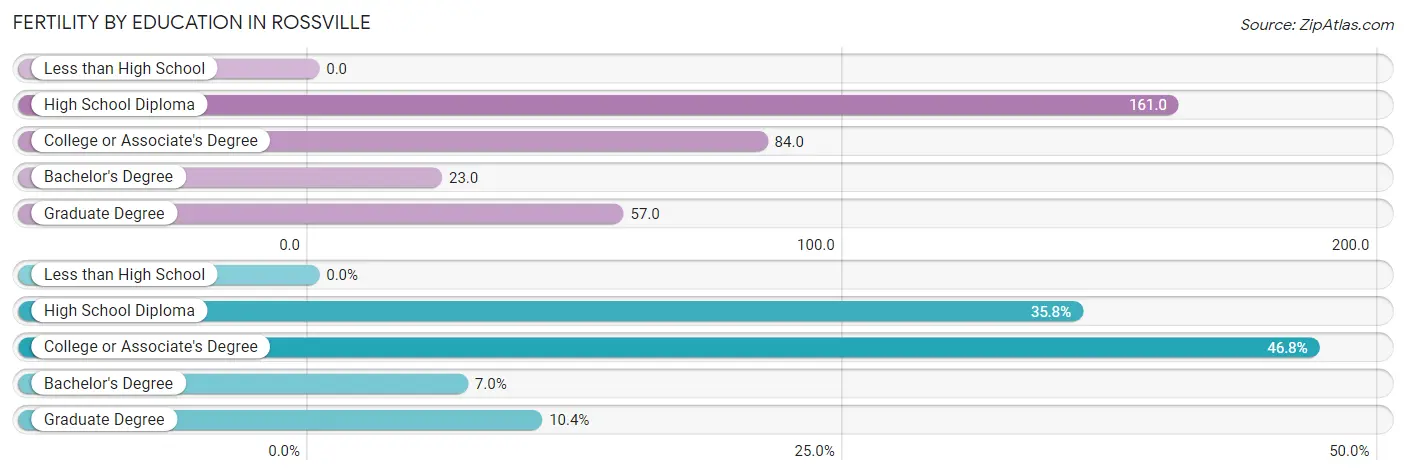
| Educational Attainment | Women with Births | Births / 1,000 Women |
| Less than High School | 0 (0.0%) | 0.0 |
| High School Diploma | 113 (35.8%) | 161.0 |
| College or Associate's Degree | 148 (46.8%) | 84.0 |
| Bachelor's Degree | 22 (7.0%) | 23.0 |
| Graduate Degree | 33 (10.4%) | 57.0 |
| Total | 316 (100.0%) | 75.0 |
Fertility by Education by Marriage Status in Rossville
60.4% of women with births in Rossville are unmarried. Women with the educational attainment of bachelor's degree are most likely to be married with 100.0% of them married at childbirth, while women with the educational attainment of high school diploma are least likely to be married with 76.1% of them unmarried at childbirth.
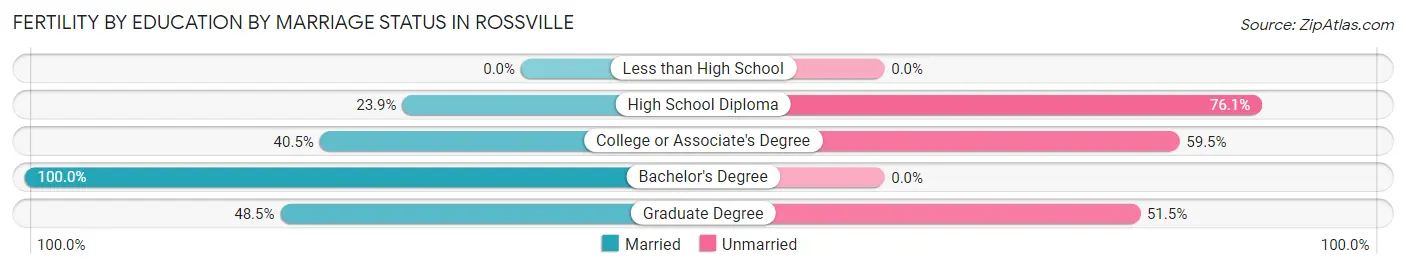
| Educational Attainment | Married | Unmarried |
| Less than High School | 0 (0.0%) | 0 (0.0%) |
| High School Diploma | 27 (23.9%) | 86 (76.1%) |
| College or Associate's Degree | 60 (40.5%) | 88 (59.5%) |
| Bachelor's Degree | 22 (100.0%) | 0 (0.0%) |
| Graduate Degree | 16 (48.5%) | 17 (51.5%) |
| Total | 125 (39.6%) | 191 (60.4%) |
Employment Characteristics in Rossville
Employment by Class of Employer in Rossville
Among the 9,081 employed individuals in Rossville, private company employees (5,717 | 63.0%), not-for-profit organizations (1,188 | 13.1%), and local government employees (823 | 9.1%) make up the most common classes of employment.
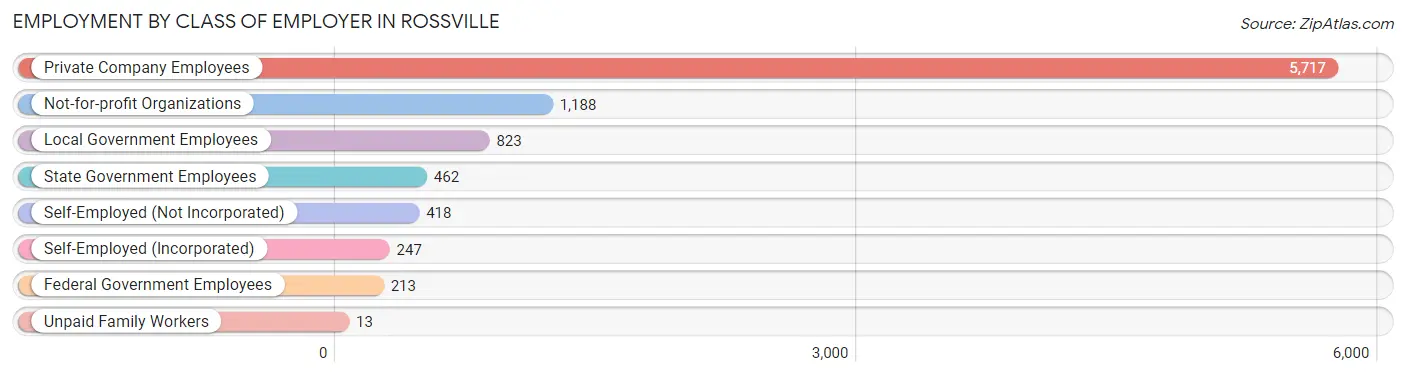
| Employer Class | # Employees | % Employees |
| Private Company Employees | 5,717 | 63.0% |
| Self-Employed (Incorporated) | 247 | 2.7% |
| Self-Employed (Not Incorporated) | 418 | 4.6% |
| Not-for-profit Organizations | 1,188 | 13.1% |
| Local Government Employees | 823 | 9.1% |
| State Government Employees | 462 | 5.1% |
| Federal Government Employees | 213 | 2.4% |
| Unpaid Family Workers | 13 | 0.1% |
| Total | 9,081 | 100.0% |
Employment Status by Age in Rossville
According to the labor force statistics for Rossville, out of the total population over 16 years of age (13,188), 72.7% or 9,588 individuals are in the labor force, with 3.7% or 355 of them unemployed. The age group with the highest labor force participation rate is 35 to 44 years, with 93.3% or 2,305 individuals in the labor force. Within the labor force, the 25 to 29 years age range has the highest percentage of unemployed individuals, with 7.7% or 132 of them being unemployed.
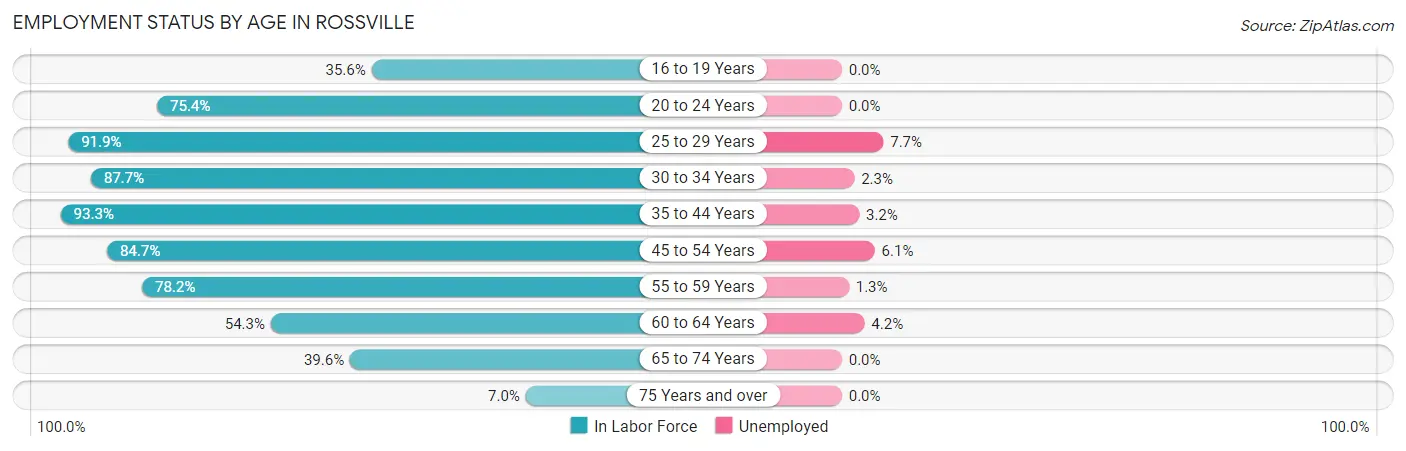
| Age Bracket | In Labor Force | Unemployed |
| 16 to 19 Years | 140 (35.6%) | 0 (0.0%) |
| 20 to 24 Years | 876 (75.4%) | 0 (0.0%) |
| 25 to 29 Years | 1,708 (91.9%) | 132 (7.7%) |
| 30 to 34 Years | 1,109 (87.7%) | 26 (2.3%) |
| 35 to 44 Years | 2,305 (93.3%) | 74 (3.2%) |
| 45 to 54 Years | 1,527 (84.7%) | 93 (6.1%) |
| 55 to 59 Years | 677 (78.2%) | 9 (1.3%) |
| 60 to 64 Years | 578 (54.3%) | 24 (4.2%) |
| 65 to 74 Years | 608 (39.6%) | 0 (0.0%) |
| 75 Years and over | 54 (7.0%) | 0 (0.0%) |
| Total | 9,588 (72.7%) | 355 (3.7%) |
Employment Status by Educational Attainment in Rossville
According to labor force statistics for Rossville, 84.8% of individuals (7,908) out of the total population between 25 and 64 years of age (9,325) are in the labor force, with 4.5% or 356 of them being unemployed. The group with the highest labor force participation rate are those with the educational attainment of bachelor's degree or higher, with 90.2% or 2,978 individuals in the labor force. Within the labor force, individuals with high school diploma education have the highest percentage of unemployment, with 7.0% or 154 of them being unemployed.
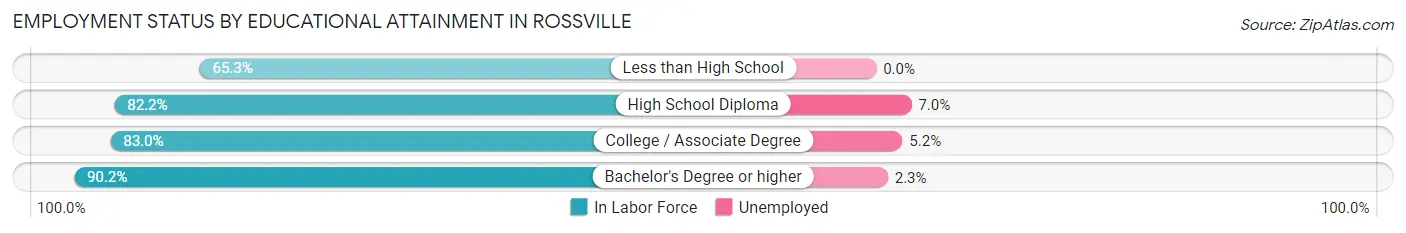
| Educational Attainment | In Labor Force | Unemployed |
| Less than High School | 196 (65.3%) | 0 (0.0%) |
| High School Diploma | 2,197 (82.2%) | 187 (7.0%) |
| College / Associate Degree | 2,532 (83.0%) | 159 (5.2%) |
| Bachelor's Degree or higher | 2,978 (90.2%) | 76 (2.3%) |
| Total | 7,908 (84.8%) | 420 (4.5%) |
Employment Occupations by Sex in Rossville
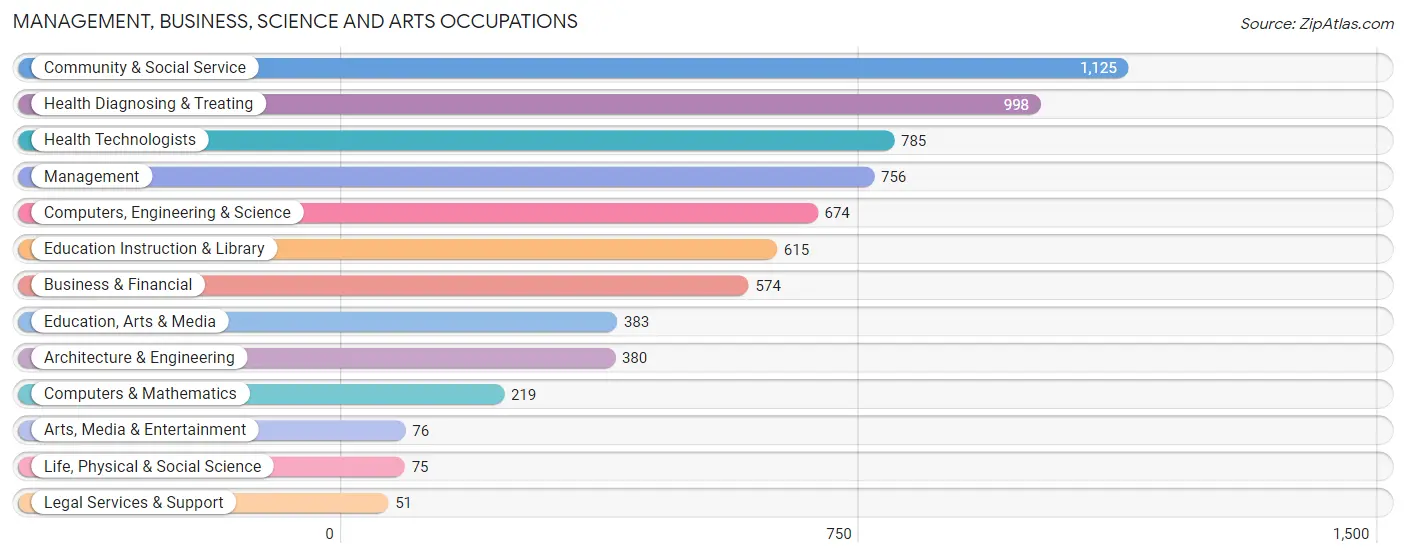
Management, Business, Science and Arts Occupations
The most common Management, Business, Science and Arts occupations in Rossville are Community & Social Service (1,125 | 12.2%), Health Diagnosing & Treating (998 | 10.8%), Health Technologists (785 | 8.5%), Management (756 | 8.2%), and Computers, Engineering & Science (674 | 7.3%).
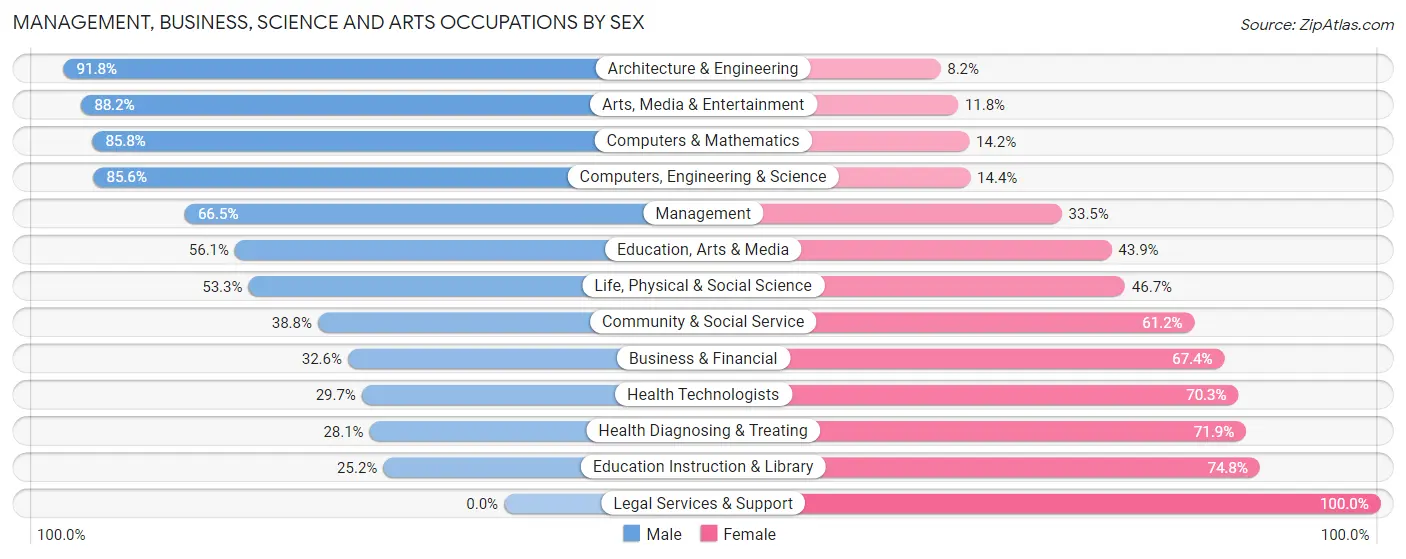
Management, Business, Science and Arts Occupations by Sex
Within the Management, Business, Science and Arts occupations in Rossville, the most male-oriented occupations are Architecture & Engineering (91.8%), Arts, Media & Entertainment (88.2%), and Computers & Mathematics (85.8%), while the most female-oriented occupations are Legal Services & Support (100.0%), Education Instruction & Library (74.8%), and Health Diagnosing & Treating (71.9%).
| Occupation | Male | Female |
| Management | 503 (66.5%) | 253 (33.5%) |
| Business & Financial | 187 (32.6%) | 387 (67.4%) |
| Computers, Engineering & Science | 577 (85.6%) | 97 (14.4%) |
| Computers & Mathematics | 188 (85.8%) | 31 (14.2%) |
| Architecture & Engineering | 349 (91.8%) | 31 (8.2%) |
| Life, Physical & Social Science | 40 (53.3%) | 35 (46.7%) |
| Community & Social Service | 437 (38.8%) | 688 (61.2%) |
| Education, Arts & Media | 215 (56.1%) | 168 (43.9%) |
| Legal Services & Support | 0 (0.0%) | 51 (100.0%) |
| Education Instruction & Library | 155 (25.2%) | 460 (74.8%) |
| Arts, Media & Entertainment | 67 (88.2%) | 9 (11.8%) |
| Health Diagnosing & Treating | 280 (28.1%) | 718 (71.9%) |
| Health Technologists | 233 (29.7%) | 552 (70.3%) |
| Total (Category) | 1,984 (48.1%) | 2,143 (51.9%) |
| Total (Overall) | 4,828 (52.5%) | 4,376 (47.5%) |
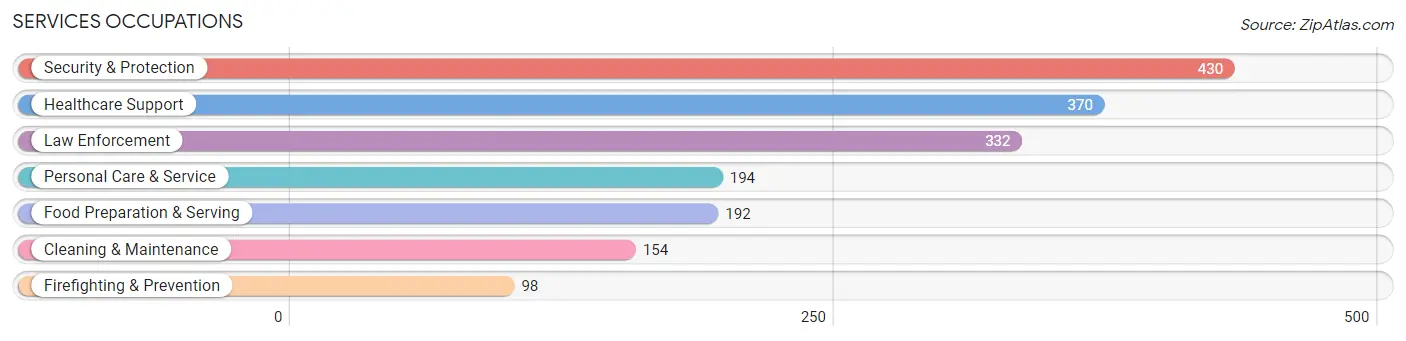
Services Occupations
The most common Services occupations in Rossville are Security & Protection (430 | 4.7%), Healthcare Support (370 | 4.0%), Law Enforcement (332 | 3.6%), Personal Care & Service (194 | 2.1%), and Food Preparation & Serving (192 | 2.1%).
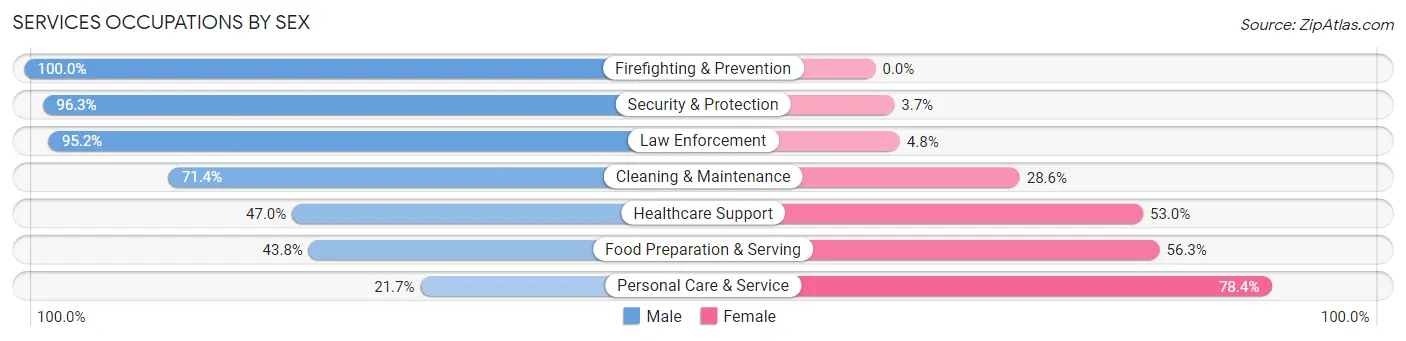
Services Occupations by Sex
Within the Services occupations in Rossville, the most male-oriented occupations are Firefighting & Prevention (100.0%), Security & Protection (96.3%), and Law Enforcement (95.2%), while the most female-oriented occupations are Personal Care & Service (78.3%), Food Preparation & Serving (56.2%), and Healthcare Support (53.0%).
| Occupation | Male | Female |
| Healthcare Support | 174 (47.0%) | 196 (53.0%) |
| Security & Protection | 414 (96.3%) | 16 (3.7%) |
| Firefighting & Prevention | 98 (100.0%) | 0 (0.0%) |
| Law Enforcement | 316 (95.2%) | 16 (4.8%) |
| Food Preparation & Serving | 84 (43.8%) | 108 (56.2%) |
| Cleaning & Maintenance | 110 (71.4%) | 44 (28.6%) |
| Personal Care & Service | 42 (21.6%) | 152 (78.3%) |
| Total (Category) | 824 (61.5%) | 516 (38.5%) |
| Total (Overall) | 4,828 (52.5%) | 4,376 (47.5%) |
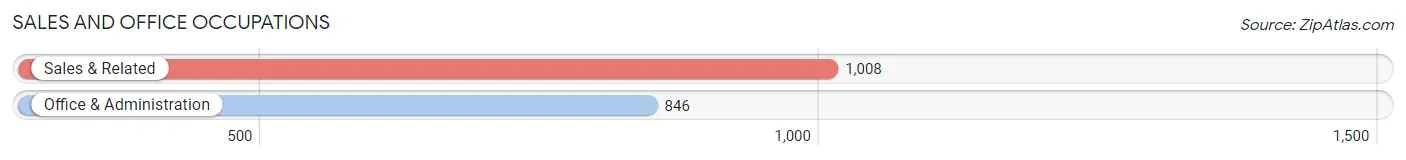
Sales and Office Occupations
The most common Sales and Office occupations in Rossville are Sales & Related (1,008 | 11.0%), and Office & Administration (846 | 9.2%).
Sales and Office Occupations by Sex
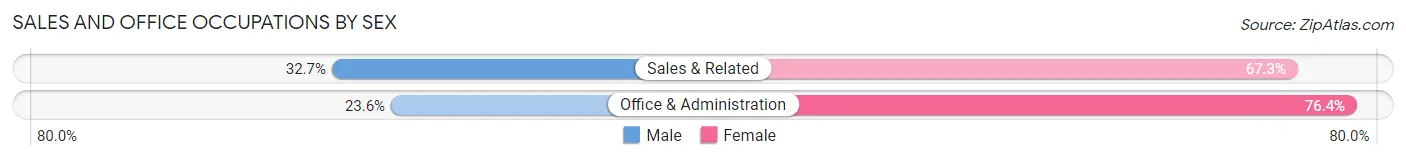
| Occupation | Male | Female |
| Sales & Related | 330 (32.7%) | 678 (67.3%) |
| Office & Administration | 200 (23.6%) | 646 (76.4%) |
| Total (Category) | 530 (28.6%) | 1,324 (71.4%) |
| Total (Overall) | 4,828 (52.5%) | 4,376 (47.5%) |
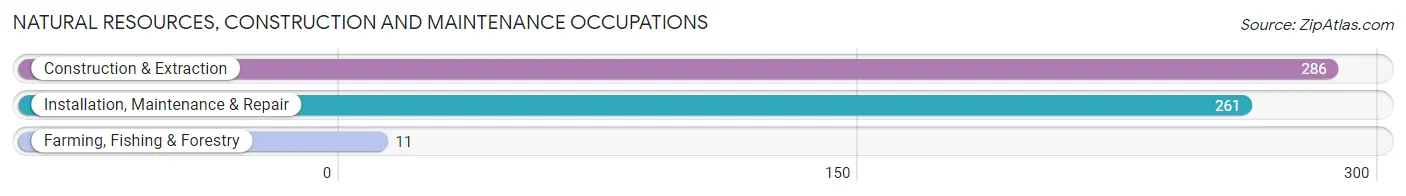
Natural Resources, Construction and Maintenance Occupations
The most common Natural Resources, Construction and Maintenance occupations in Rossville are Construction & Extraction (286 | 3.1%), Installation, Maintenance & Repair (261 | 2.8%), and Farming, Fishing & Forestry (11 | 0.1%).
Natural Resources, Construction and Maintenance Occupations by Sex
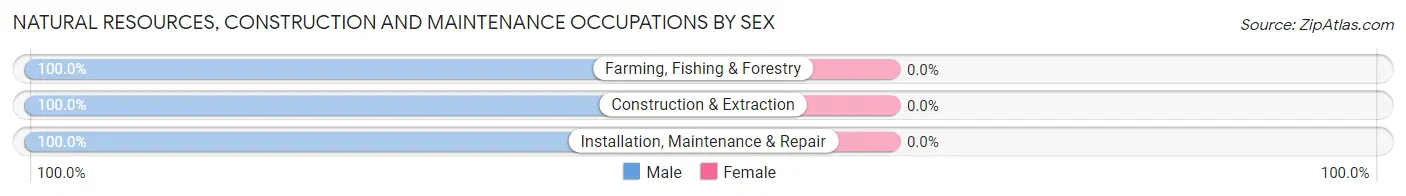
| Occupation | Male | Female |
| Farming, Fishing & Forestry | 11 (100.0%) | 0 (0.0%) |
| Construction & Extraction | 286 (100.0%) | 0 (0.0%) |
| Installation, Maintenance & Repair | 261 (100.0%) | 0 (0.0%) |
| Total (Category) | 558 (100.0%) | 0 (0.0%) |
| Total (Overall) | 4,828 (52.5%) | 4,376 (47.5%) |
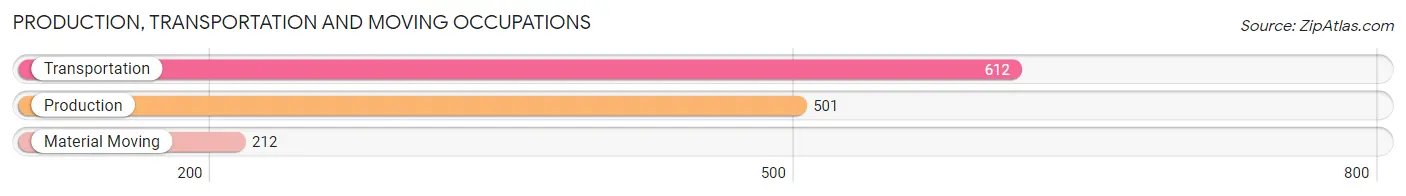
Production, Transportation and Moving Occupations
The most common Production, Transportation and Moving occupations in Rossville are Transportation (612 | 6.7%), Production (501 | 5.4%), and Material Moving (212 | 2.3%).
Production, Transportation and Moving Occupations by Sex
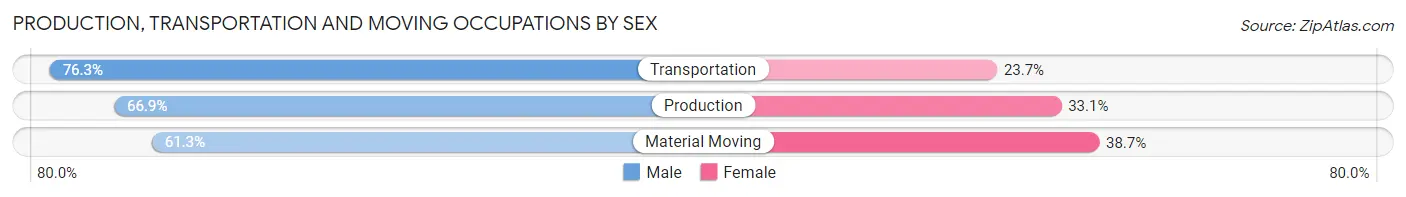
| Occupation | Male | Female |
| Production | 335 (66.9%) | 166 (33.1%) |
| Transportation | 467 (76.3%) | 145 (23.7%) |
| Material Moving | 130 (61.3%) | 82 (38.7%) |
| Total (Category) | 932 (70.3%) | 393 (29.7%) |
| Total (Overall) | 4,828 (52.5%) | 4,376 (47.5%) |
Employment Industries by Sex in Rossville
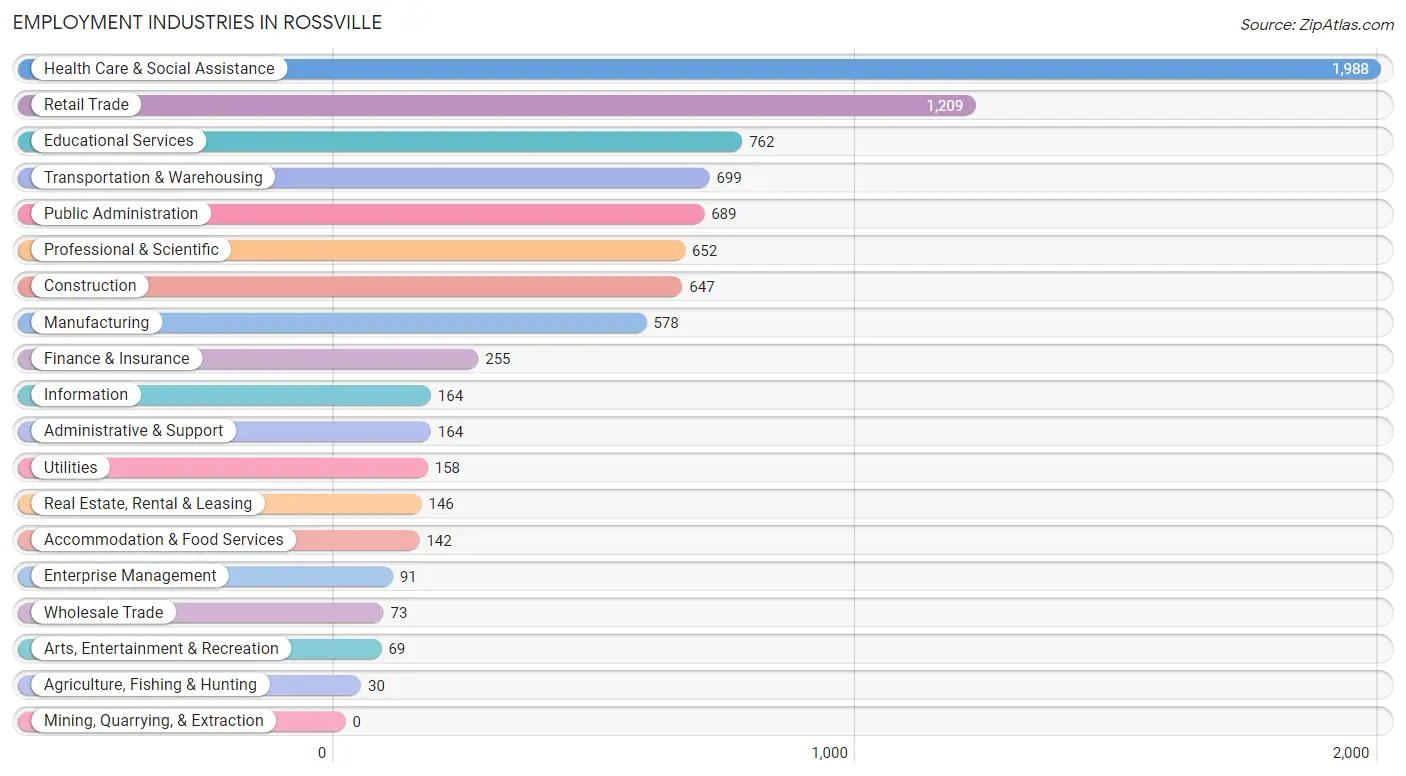
Employment Industries in Rossville
The major employment industries in Rossville include Health Care & Social Assistance (1,988 | 21.6%), Retail Trade (1,209 | 13.1%), Educational Services (762 | 8.3%), Transportation & Warehousing (699 | 7.6%), and Public Administration (689 | 7.5%).
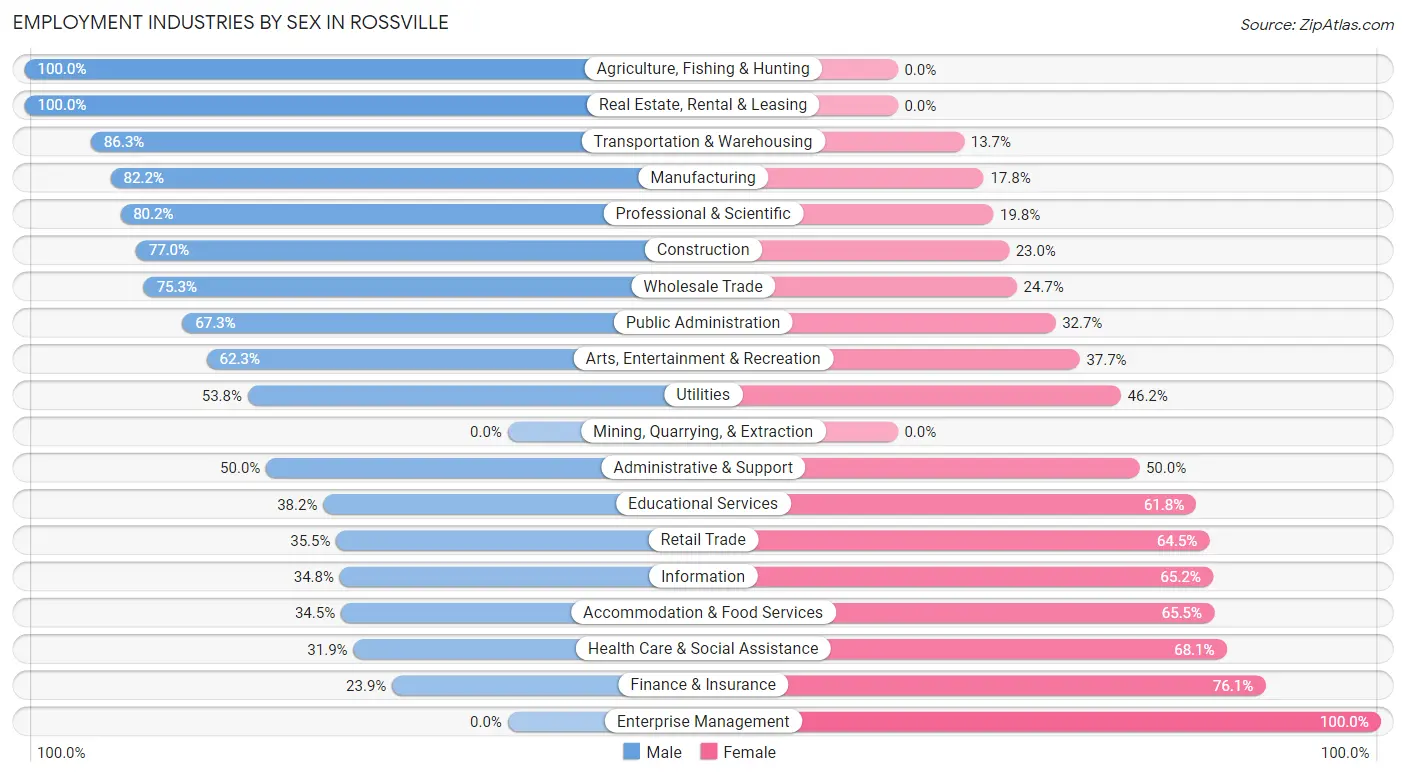
Employment Industries by Sex in Rossville
The Rossville industries that see more men than women are Agriculture, Fishing & Hunting (100.0%), Real Estate, Rental & Leasing (100.0%), and Transportation & Warehousing (86.3%), whereas the industries that tend to have a higher number of women are Enterprise Management (100.0%), Finance & Insurance (76.1%), and Health Care & Social Assistance (68.1%).
| Industry | Male | Female |
| Agriculture, Fishing & Hunting | 30 (100.0%) | 0 (0.0%) |
| Mining, Quarrying, & Extraction | 0 (0.0%) | 0 (0.0%) |
| Construction | 498 (77.0%) | 149 (23.0%) |
| Manufacturing | 475 (82.2%) | 103 (17.8%) |
| Wholesale Trade | 55 (75.3%) | 18 (24.7%) |
| Retail Trade | 429 (35.5%) | 780 (64.5%) |
| Transportation & Warehousing | 603 (86.3%) | 96 (13.7%) |
| Utilities | 85 (53.8%) | 73 (46.2%) |
| Information | 57 (34.8%) | 107 (65.2%) |
| Finance & Insurance | 61 (23.9%) | 194 (76.1%) |
| Real Estate, Rental & Leasing | 146 (100.0%) | 0 (0.0%) |
| Professional & Scientific | 523 (80.2%) | 129 (19.8%) |
| Enterprise Management | 0 (0.0%) | 91 (100.0%) |
| Administrative & Support | 82 (50.0%) | 82 (50.0%) |
| Educational Services | 291 (38.2%) | 471 (61.8%) |
| Health Care & Social Assistance | 635 (31.9%) | 1,353 (68.1%) |
| Arts, Entertainment & Recreation | 43 (62.3%) | 26 (37.7%) |
| Accommodation & Food Services | 49 (34.5%) | 93 (65.5%) |
| Public Administration | 464 (67.3%) | 225 (32.7%) |
| Total | 4,828 (52.5%) | 4,376 (47.5%) |
Education in Rossville
School Enrollment in Rossville
The most common levels of schooling among the 3,263 students in Rossville are college / undergraduate (1,206 | 37.0%), elementary school (725 | 22.2%), and high school (357 | 10.9%).
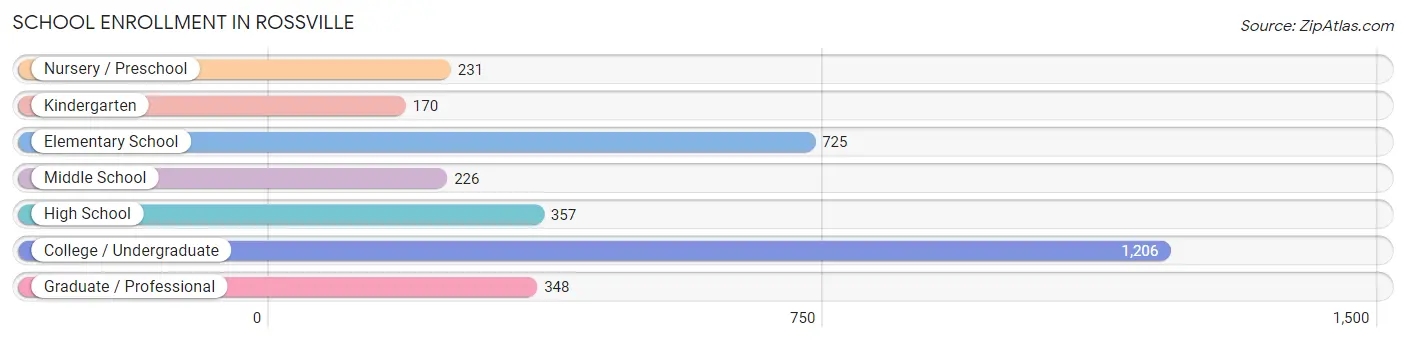
| School Level | # Students | % Students |
| Nursery / Preschool | 231 | 7.1% |
| Kindergarten | 170 | 5.2% |
| Elementary School | 725 | 22.2% |
| Middle School | 226 | 6.9% |
| High School | 357 | 10.9% |
| College / Undergraduate | 1,206 | 37.0% |
| Graduate / Professional | 348 | 10.7% |
| Total | 3,263 | 100.0% |
School Enrollment by Age by Funding Source in Rossville
Out of a total of 3,263 students who are enrolled in schools in Rossville, 936 (28.7%) attend a private institution, while the remaining 2,327 (71.3%) are enrolled in public schools. The age group of 3 to 4 year olds has the highest likelihood of being enrolled in private schools, with 131 (92.2% in the age bracket) enrolled. Conversely, the age group of 15 to 17 year olds has the lowest likelihood of being enrolled in a private school, with 169 (85.8% in the age bracket) attending a public institution.
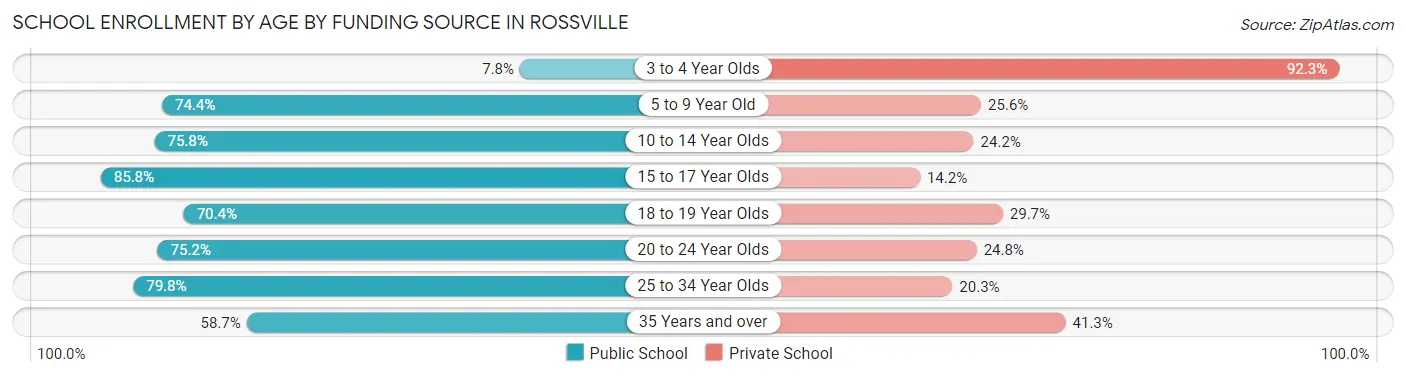
| Age Bracket | Public School | Private School |
| 3 to 4 Year Olds | 11 (7.7%) | 131 (92.2%) |
| 5 to 9 Year Old | 607 (74.4%) | 209 (25.6%) |
| 10 to 14 Year Olds | 382 (75.8%) | 122 (24.2%) |
| 15 to 17 Year Olds | 169 (85.8%) | 28 (14.2%) |
| 18 to 19 Year Olds | 121 (70.4%) | 51 (29.6%) |
| 20 to 24 Year Olds | 422 (75.2%) | 139 (24.8%) |
| 25 to 34 Year Olds | 386 (79.7%) | 98 (20.3%) |
| 35 Years and over | 227 (58.7%) | 160 (41.3%) |
| Total | 2,327 (71.3%) | 936 (28.7%) |
Educational Attainment by Field of Study in Rossville
Science & technology (584 | 15.0%), business (570 | 14.7%), education (474 | 12.2%), engineering (470 | 12.1%), and social sciences (427 | 11.0%) are the most common fields of study among 3,880 individuals in Rossville who have obtained a bachelor's degree or higher.
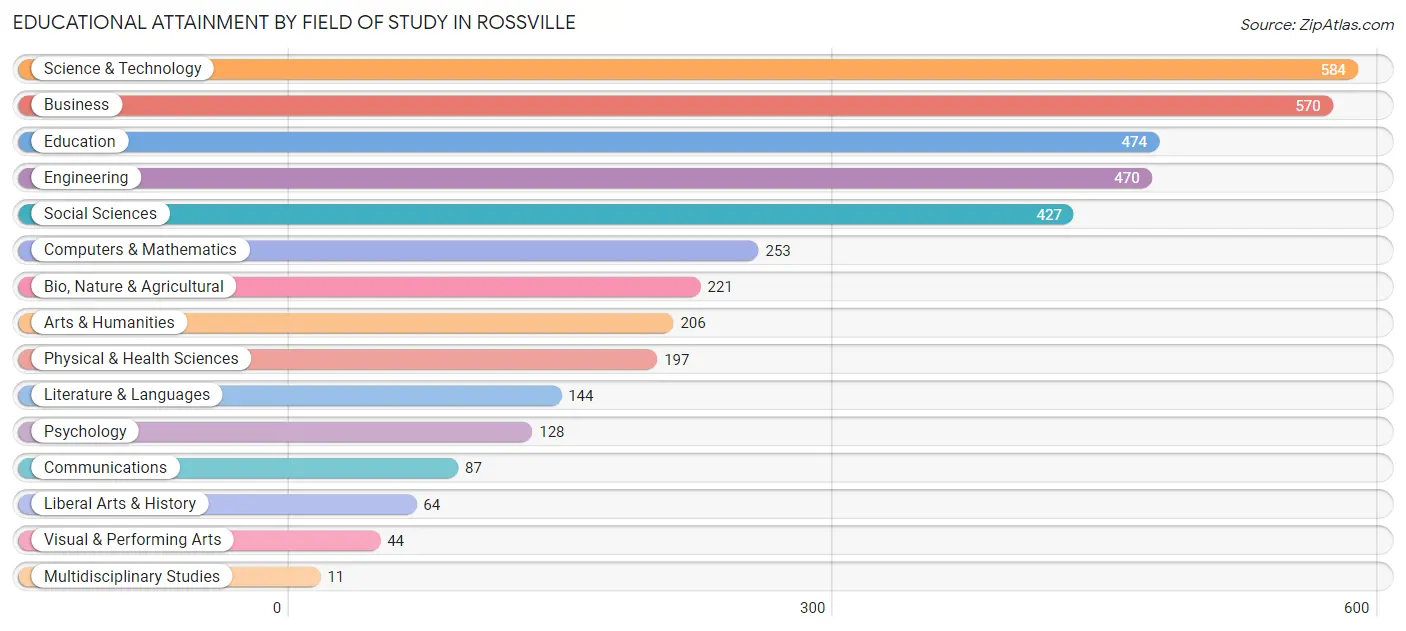
| Field of Study | # Graduates | % Graduates |
| Computers & Mathematics | 253 | 6.5% |
| Bio, Nature & Agricultural | 221 | 5.7% |
| Physical & Health Sciences | 197 | 5.1% |
| Psychology | 128 | 3.3% |
| Social Sciences | 427 | 11.0% |
| Engineering | 470 | 12.1% |
| Multidisciplinary Studies | 11 | 0.3% |
| Science & Technology | 584 | 15.0% |
| Business | 570 | 14.7% |
| Education | 474 | 12.2% |
| Literature & Languages | 144 | 3.7% |
| Liberal Arts & History | 64 | 1.7% |
| Visual & Performing Arts | 44 | 1.1% |
| Communications | 87 | 2.2% |
| Arts & Humanities | 206 | 5.3% |
| Total | 3,880 | 100.0% |
Transportation & Commute in Rossville
Vehicle Availability by Sex in Rossville
The most prevalent vehicle ownership categories in Rossville are males with 2 vehicles (2,385, accounting for 49.7%) and females with 2 vehicles (1,886, making up 56.1%).
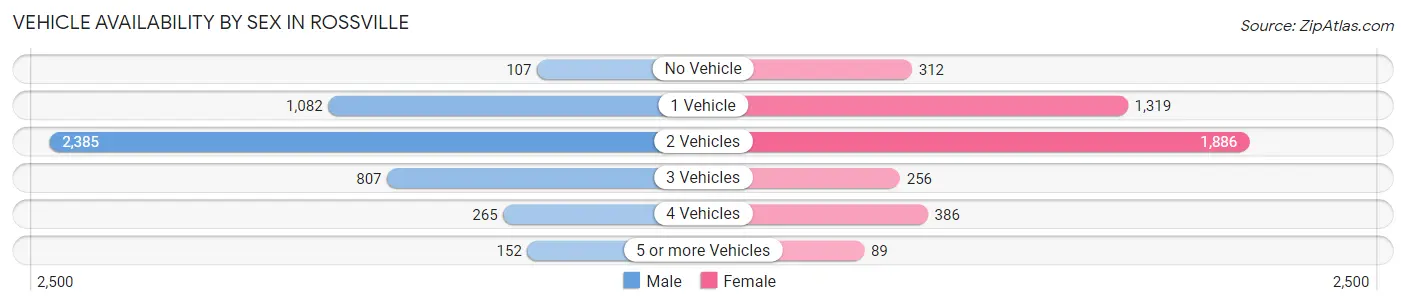
| Vehicles Available | Male | Female |
| No Vehicle | 107 (2.2%) | 312 (7.3%) |
| 1 Vehicle | 1,082 (22.6%) | 1,319 (31.0%) |
| 2 Vehicles | 2,385 (49.7%) | 1,886 (44.4%) |
| 3 Vehicles | 807 (16.8%) | 256 (6.0%) |
| 4 Vehicles | 265 (5.5%) | 386 (9.1%) |
| 5 or more Vehicles | 152 (3.2%) | 89 (2.1%) |
| Total | 4,798 (100.0%) | 4,248 (100.0%) |
Commute Time in Rossville
The most frequently occuring commute durations in Rossville are 30 to 34 minutes (1,542 commuters, 18.6%), 20 to 24 minutes (1,356 commuters, 16.4%), and 10 to 14 minutes (987 commuters, 11.9%).
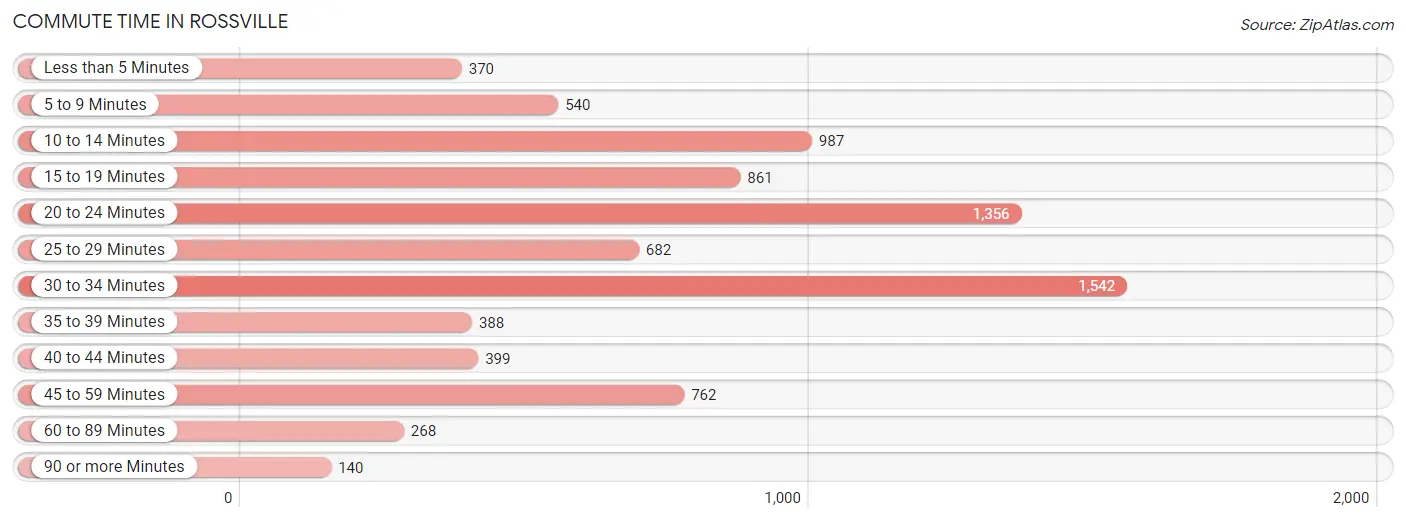
| Commute Time | # Commuters | % Commuters |
| Less than 5 Minutes | 370 | 4.5% |
| 5 to 9 Minutes | 540 | 6.5% |
| 10 to 14 Minutes | 987 | 11.9% |
| 15 to 19 Minutes | 861 | 10.4% |
| 20 to 24 Minutes | 1,356 | 16.4% |
| 25 to 29 Minutes | 682 | 8.2% |
| 30 to 34 Minutes | 1,542 | 18.6% |
| 35 to 39 Minutes | 388 | 4.7% |
| 40 to 44 Minutes | 399 | 4.8% |
| 45 to 59 Minutes | 762 | 9.2% |
| 60 to 89 Minutes | 268 | 3.2% |
| 90 or more Minutes | 140 | 1.7% |
Commute Time by Sex in Rossville
The most common commute times in Rossville are 30 to 34 minutes (1,034 commuters, 23.0%) for males and 20 to 24 minutes (822 commuters, 21.7%) for females.
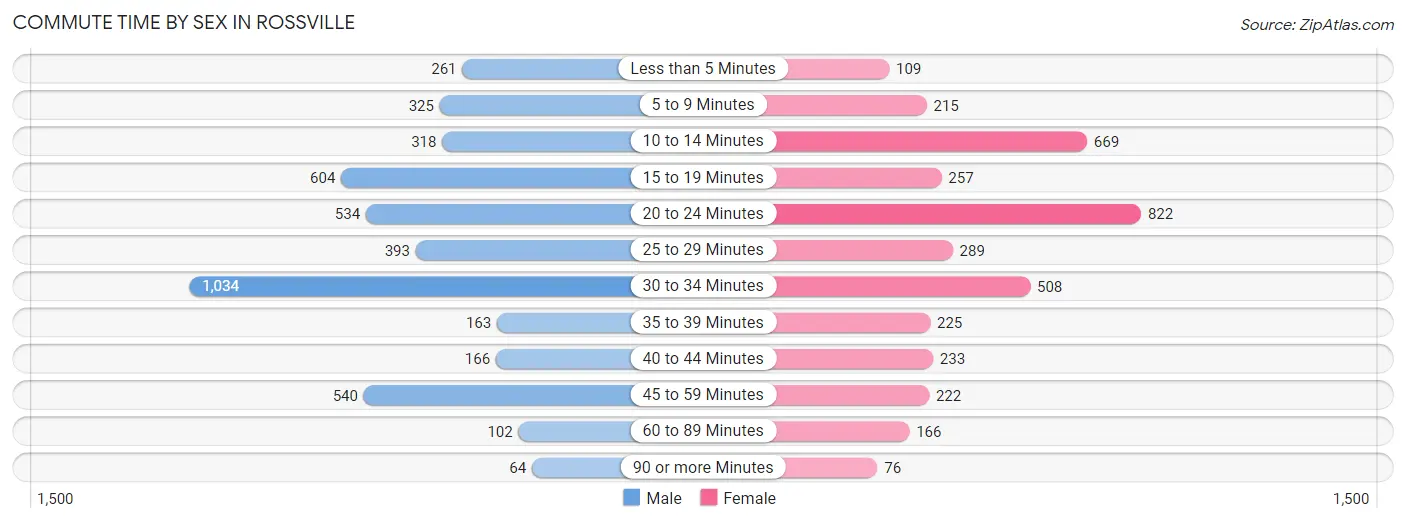
| Commute Time | Male | Female |
| Less than 5 Minutes | 261 (5.8%) | 109 (2.9%) |
| 5 to 9 Minutes | 325 (7.2%) | 215 (5.7%) |
| 10 to 14 Minutes | 318 (7.1%) | 669 (17.6%) |
| 15 to 19 Minutes | 604 (13.4%) | 257 (6.8%) |
| 20 to 24 Minutes | 534 (11.9%) | 822 (21.7%) |
| 25 to 29 Minutes | 393 (8.7%) | 289 (7.6%) |
| 30 to 34 Minutes | 1,034 (23.0%) | 508 (13.4%) |
| 35 to 39 Minutes | 163 (3.6%) | 225 (5.9%) |
| 40 to 44 Minutes | 166 (3.7%) | 233 (6.1%) |
| 45 to 59 Minutes | 540 (12.0%) | 222 (5.9%) |
| 60 to 89 Minutes | 102 (2.3%) | 166 (4.4%) |
| 90 or more Minutes | 64 (1.4%) | 76 (2.0%) |
Time of Departure to Work by Sex in Rossville
The most frequent times of departure to work in Rossville are 6:00 AM to 6:29 AM (648, 14.4%) for males and 7:00 AM to 7:29 AM (818, 21.6%) for females.
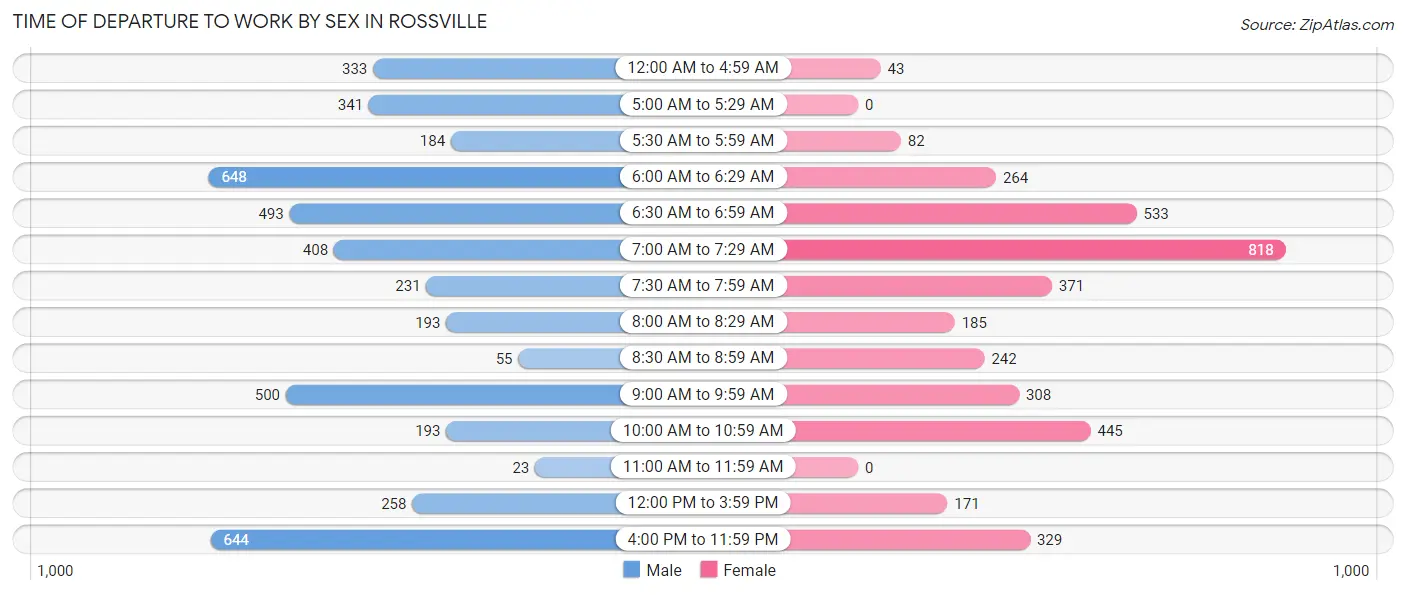
| Time of Departure | Male | Female |
| 12:00 AM to 4:59 AM | 333 (7.4%) | 43 (1.1%) |
| 5:00 AM to 5:29 AM | 341 (7.6%) | 0 (0.0%) |
| 5:30 AM to 5:59 AM | 184 (4.1%) | 82 (2.2%) |
| 6:00 AM to 6:29 AM | 648 (14.4%) | 264 (7.0%) |
| 6:30 AM to 6:59 AM | 493 (11.0%) | 533 (14.1%) |
| 7:00 AM to 7:29 AM | 408 (9.1%) | 818 (21.6%) |
| 7:30 AM to 7:59 AM | 231 (5.1%) | 371 (9.8%) |
| 8:00 AM to 8:29 AM | 193 (4.3%) | 185 (4.9%) |
| 8:30 AM to 8:59 AM | 55 (1.2%) | 242 (6.4%) |
| 9:00 AM to 9:59 AM | 500 (11.1%) | 308 (8.1%) |
| 10:00 AM to 10:59 AM | 193 (4.3%) | 445 (11.7%) |
| 11:00 AM to 11:59 AM | 23 (0.5%) | 0 (0.0%) |
| 12:00 PM to 3:59 PM | 258 (5.7%) | 171 (4.5%) |
| 4:00 PM to 11:59 PM | 644 (14.3%) | 329 (8.7%) |
| Total | 4,504 (100.0%) | 3,791 (100.0%) |
Housing Occupancy in Rossville
Occupancy by Ownership in Rossville
Of the total 6,372 dwellings in Rossville, owner-occupied units account for 3,391 (53.2%), while renter-occupied units make up 2,981 (46.8%).
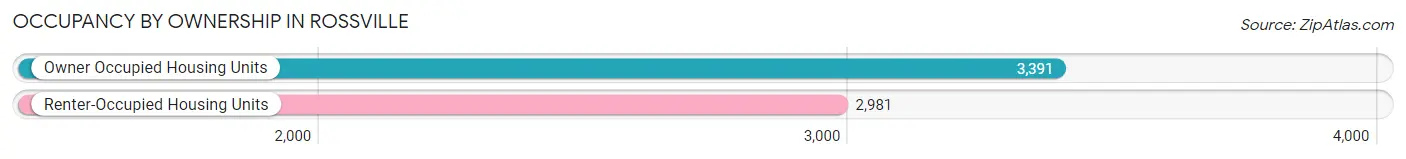
| Occupancy | # Housing Units | % Housing Units |
| Owner Occupied Housing Units | 3,391 | 53.2% |
| Renter-Occupied Housing Units | 2,981 | 46.8% |
| Total Occupied Housing Units | 6,372 | 100.0% |
Occupancy by Household Size in Rossville
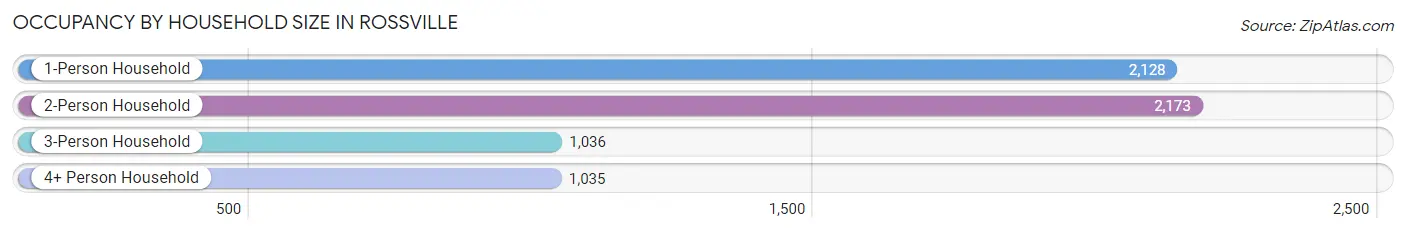
| Household Size | # Housing Units | % Housing Units |
| 1-Person Household | 2,128 | 33.4% |
| 2-Person Household | 2,173 | 34.1% |
| 3-Person Household | 1,036 | 16.3% |
| 4+ Person Household | 1,035 | 16.2% |
| Total Housing Units | 6,372 | 100.0% |
Occupancy by Ownership by Household Size in Rossville
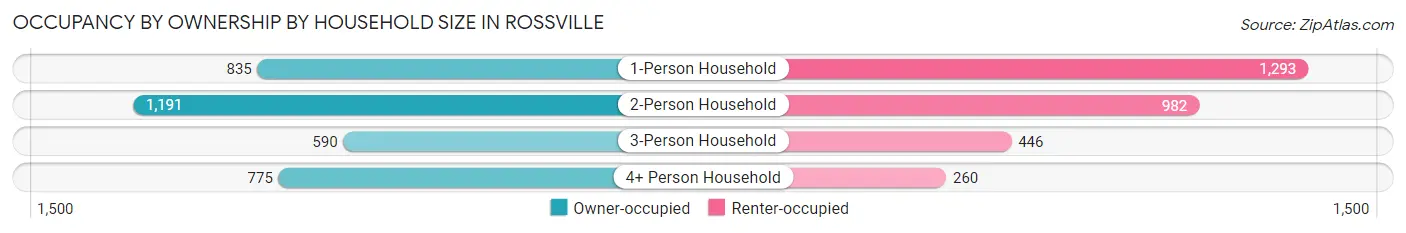
| Household Size | Owner-occupied | Renter-occupied |
| 1-Person Household | 835 (39.2%) | 1,293 (60.8%) |
| 2-Person Household | 1,191 (54.8%) | 982 (45.2%) |
| 3-Person Household | 590 (57.0%) | 446 (43.0%) |
| 4+ Person Household | 775 (74.9%) | 260 (25.1%) |
| Total Housing Units | 3,391 (53.2%) | 2,981 (46.8%) |
Occupancy by Educational Attainment in Rossville
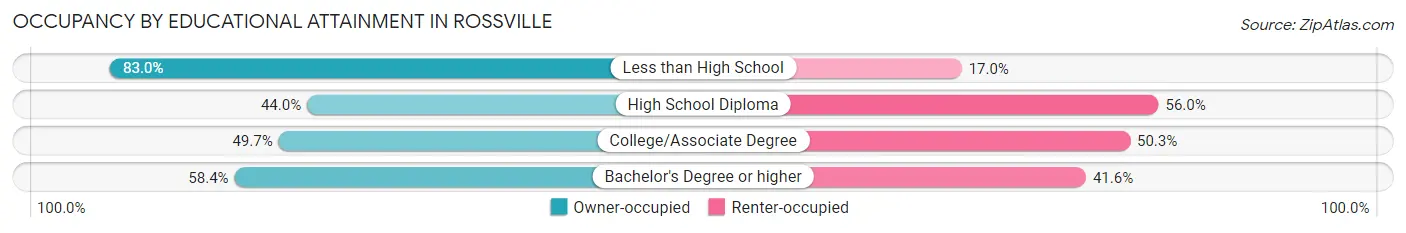
| Household Size | Owner-occupied | Renter-occupied |
| Less than High School | 191 (83.0%) | 39 (17.0%) |
| High School Diploma | 547 (44.0%) | 696 (56.0%) |
| College/Associate Degree | 1,183 (49.7%) | 1,199 (50.3%) |
| Bachelor's Degree or higher | 1,470 (58.4%) | 1,047 (41.6%) |
Occupancy by Age of Householder in Rossville
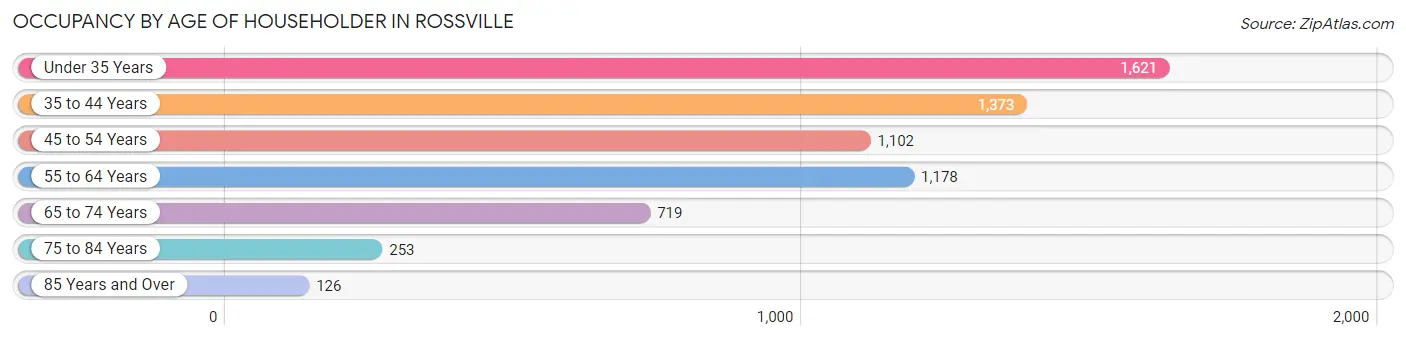
| Age Bracket | # Households | % Households |
| Under 35 Years | 1,621 | 25.4% |
| 35 to 44 Years | 1,373 | 21.5% |
| 45 to 54 Years | 1,102 | 17.3% |
| 55 to 64 Years | 1,178 | 18.5% |
| 65 to 74 Years | 719 | 11.3% |
| 75 to 84 Years | 253 | 4.0% |
| 85 Years and Over | 126 | 2.0% |
| Total | 6,372 | 100.0% |
Housing Finances in Rossville
Median Income by Occupancy in Rossville
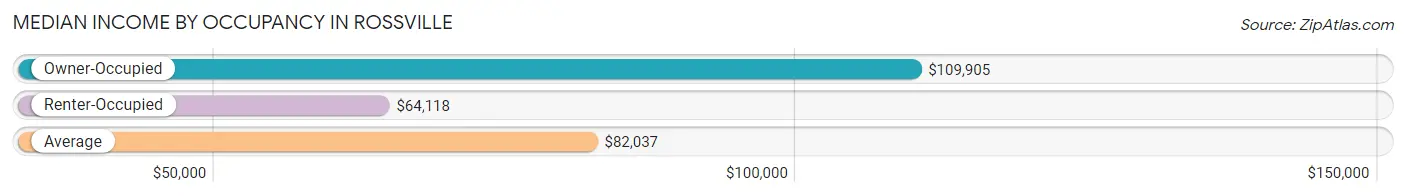
| Occupancy Type | # Households | Median Income |
| Owner-Occupied | 3,391 (53.2%) | $109,905 |
| Renter-Occupied | 2,981 (46.8%) | $64,118 |
| Average | 6,372 (100.0%) | $82,037 |
Occupancy by Householder Income Bracket in Rossville
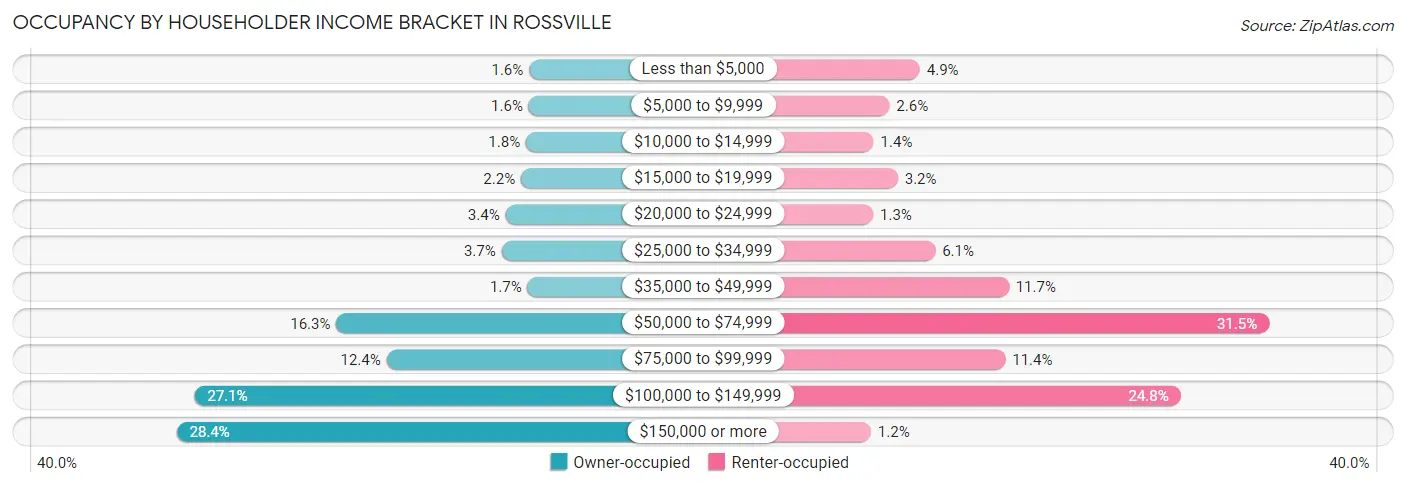
| Income Bracket | Owner-occupied | Renter-occupied |
| Less than $5,000 | 53 (1.6%) | 146 (4.9%) |
| $5,000 to $9,999 | 54 (1.6%) | 77 (2.6%) |
| $10,000 to $14,999 | 61 (1.8%) | 41 (1.4%) |
| $15,000 to $19,999 | 74 (2.2%) | 96 (3.2%) |
| $20,000 to $24,999 | 114 (3.4%) | 40 (1.3%) |
| $25,000 to $34,999 | 124 (3.7%) | 181 (6.1%) |
| $35,000 to $49,999 | 57 (1.7%) | 348 (11.7%) |
| $50,000 to $74,999 | 551 (16.3%) | 939 (31.5%) |
| $75,000 to $99,999 | 421 (12.4%) | 340 (11.4%) |
| $100,000 to $149,999 | 918 (27.1%) | 738 (24.8%) |
| $150,000 or more | 964 (28.4%) | 35 (1.2%) |
| Total | 3,391 (100.0%) | 2,981 (100.0%) |
Monthly Housing Cost Tiers in Rossville
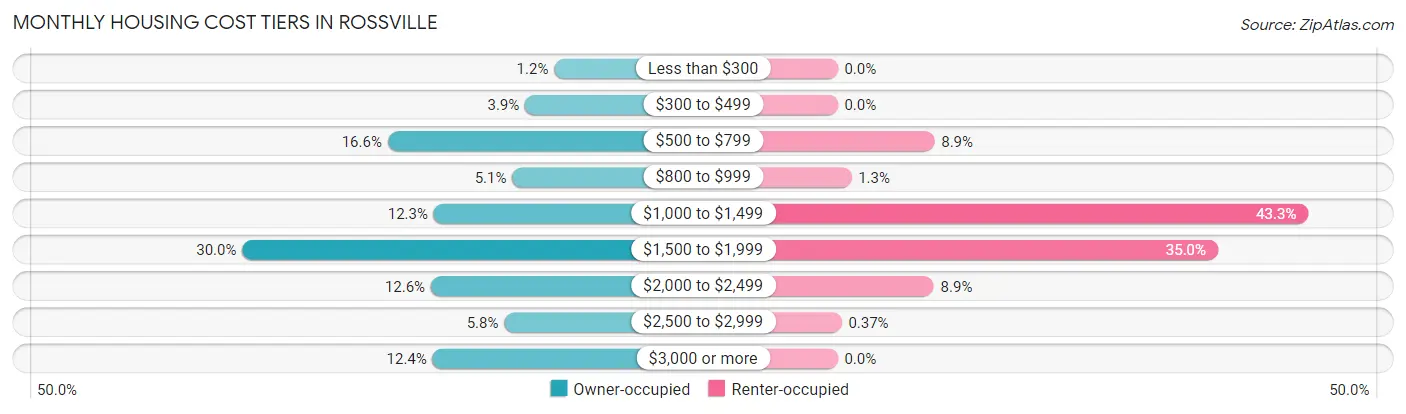
| Monthly Cost | Owner-occupied | Renter-occupied |
| Less than $300 | 42 (1.2%) | 0 (0.0%) |
| $300 to $499 | 133 (3.9%) | 0 (0.0%) |
| $500 to $799 | 562 (16.6%) | 266 (8.9%) |
| $800 to $999 | 173 (5.1%) | 38 (1.3%) |
| $1,000 to $1,499 | 418 (12.3%) | 1,292 (43.3%) |
| $1,500 to $1,999 | 1,016 (30.0%) | 1,044 (35.0%) |
| $2,000 to $2,499 | 427 (12.6%) | 264 (8.9%) |
| $2,500 to $2,999 | 198 (5.8%) | 11 (0.4%) |
| $3,000 or more | 422 (12.4%) | 0 (0.0%) |
| Total | 3,391 (100.0%) | 2,981 (100.0%) |
Physical Housing Characteristics in Rossville
Housing Structures in Rossville
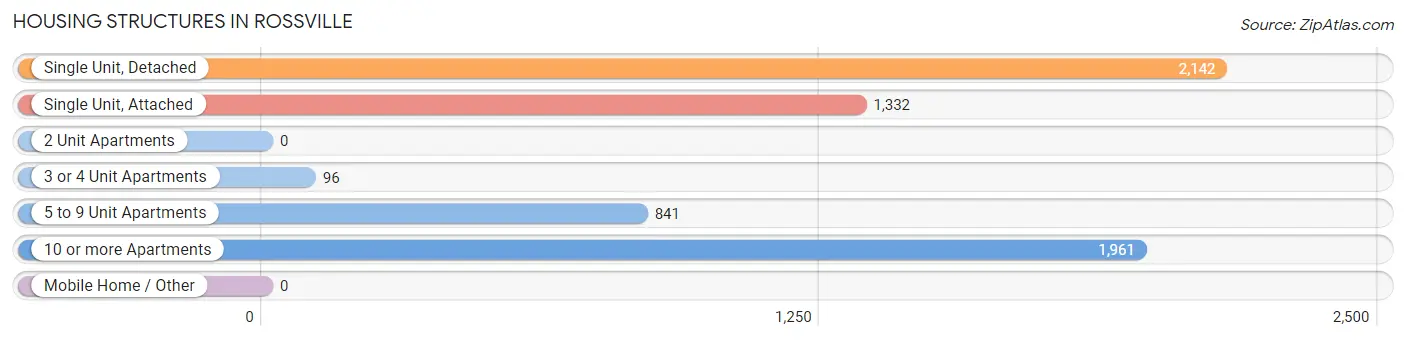
| Structure Type | # Housing Units | % Housing Units |
| Single Unit, Detached | 2,142 | 33.6% |
| Single Unit, Attached | 1,332 | 20.9% |
| 2 Unit Apartments | 0 | 0.0% |
| 3 or 4 Unit Apartments | 96 | 1.5% |
| 5 to 9 Unit Apartments | 841 | 13.2% |
| 10 or more Apartments | 1,961 | 30.8% |
| Mobile Home / Other | 0 | 0.0% |
| Total | 6,372 | 100.0% |
Housing Structures by Occupancy in Rossville
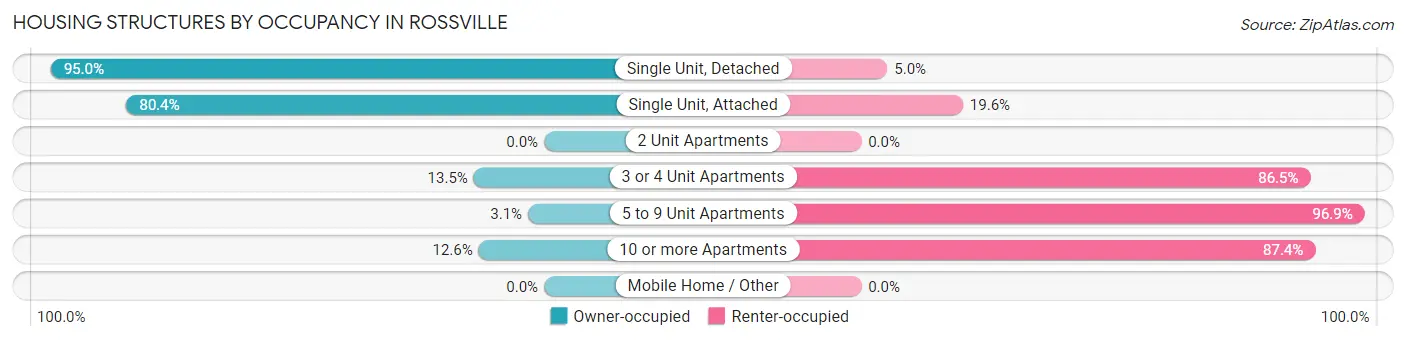
| Structure Type | Owner-occupied | Renter-occupied |
| Single Unit, Detached | 2,034 (95.0%) | 108 (5.0%) |
| Single Unit, Attached | 1,071 (80.4%) | 261 (19.6%) |
| 2 Unit Apartments | 0 (0.0%) | 0 (0.0%) |
| 3 or 4 Unit Apartments | 13 (13.5%) | 83 (86.5%) |
| 5 to 9 Unit Apartments | 26 (3.1%) | 815 (96.9%) |
| 10 or more Apartments | 247 (12.6%) | 1,714 (87.4%) |
| Mobile Home / Other | 0 (0.0%) | 0 (0.0%) |
| Total | 3,391 (53.2%) | 2,981 (46.8%) |
Housing Structures by Number of Rooms in Rossville
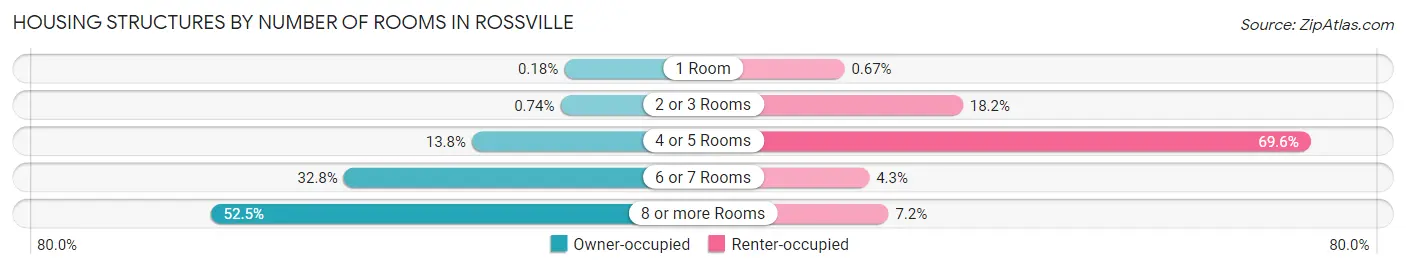
| Number of Rooms | Owner-occupied | Renter-occupied |
| 1 Room | 6 (0.2%) | 20 (0.7%) |
| 2 or 3 Rooms | 25 (0.7%) | 542 (18.2%) |
| 4 or 5 Rooms | 469 (13.8%) | 2,076 (69.6%) |
| 6 or 7 Rooms | 1,112 (32.8%) | 129 (4.3%) |
| 8 or more Rooms | 1,779 (52.5%) | 214 (7.2%) |
| Total | 3,391 (100.0%) | 2,981 (100.0%) |
Housing Structure by Heating Type in Rossville
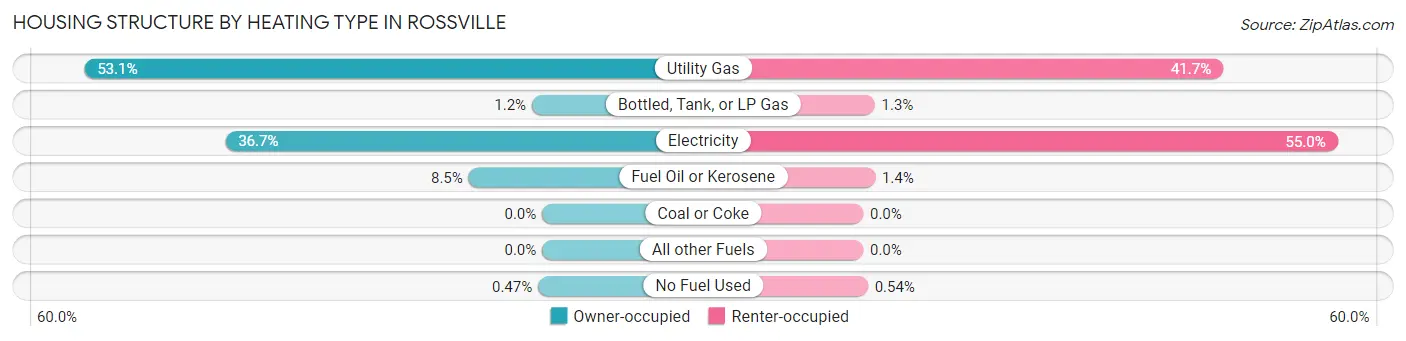
| Heating Type | Owner-occupied | Renter-occupied |
| Utility Gas | 1,800 (53.1%) | 1,244 (41.7%) |
| Bottled, Tank, or LP Gas | 40 (1.2%) | 40 (1.3%) |
| Electricity | 1,246 (36.7%) | 1,640 (55.0%) |
| Fuel Oil or Kerosene | 289 (8.5%) | 41 (1.4%) |
| Coal or Coke | 0 (0.0%) | 0 (0.0%) |
| All other Fuels | 0 (0.0%) | 0 (0.0%) |
| No Fuel Used | 16 (0.5%) | 16 (0.5%) |
| Total | 3,391 (100.0%) | 2,981 (100.0%) |
Household Vehicle Usage in Rossville
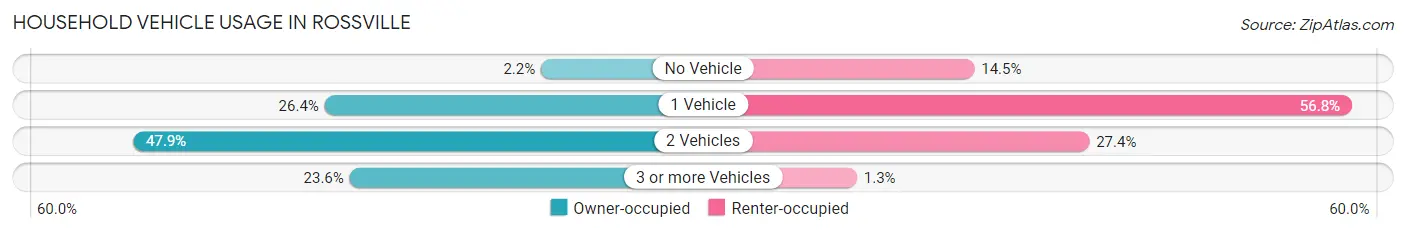
| Vehicles per Household | Owner-occupied | Renter-occupied |
| No Vehicle | 73 (2.1%) | 432 (14.5%) |
| 1 Vehicle | 895 (26.4%) | 1,693 (56.8%) |
| 2 Vehicles | 1,623 (47.9%) | 816 (27.4%) |
| 3 or more Vehicles | 800 (23.6%) | 40 (1.3%) |
| Total | 3,391 (100.0%) | 2,981 (100.0%) |
Real Estate & Mortgages in Rossville
Real Estate and Mortgage Overview in Rossville
| Characteristic | Without Mortgage | With Mortgage |
| Housing Units | 898 | 2,493 |
| Median Property Value | $285,400 | $274,700 |
| Median Household Income | $92,885 | $772 |
| Monthly Housing Costs | $731 | $422 |
| Real Estate Taxes | $3,278 | $64 |
Property Value by Mortgage Status in Rossville
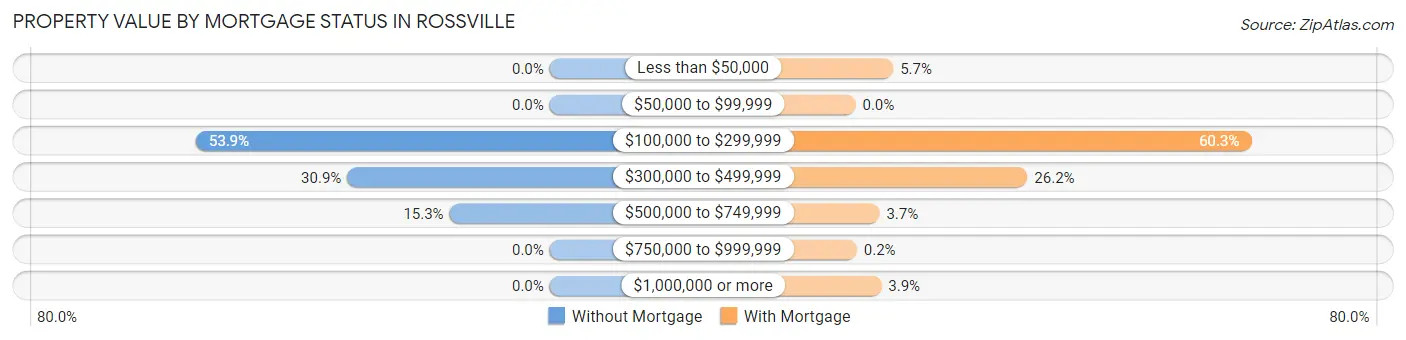
| Property Value | Without Mortgage | With Mortgage |
| Less than $50,000 | 0 (0.0%) | 143 (5.7%) |
| $50,000 to $99,999 | 0 (0.0%) | 0 (0.0%) |
| $100,000 to $299,999 | 484 (53.9%) | 1,503 (60.3%) |
| $300,000 to $499,999 | 277 (30.8%) | 653 (26.2%) |
| $500,000 to $749,999 | 137 (15.3%) | 91 (3.6%) |
| $750,000 to $999,999 | 0 (0.0%) | 5 (0.2%) |
| $1,000,000 or more | 0 (0.0%) | 98 (3.9%) |
| Total | 898 (100.0%) | 2,493 (100.0%) |
Household Income by Mortgage Status in Rossville
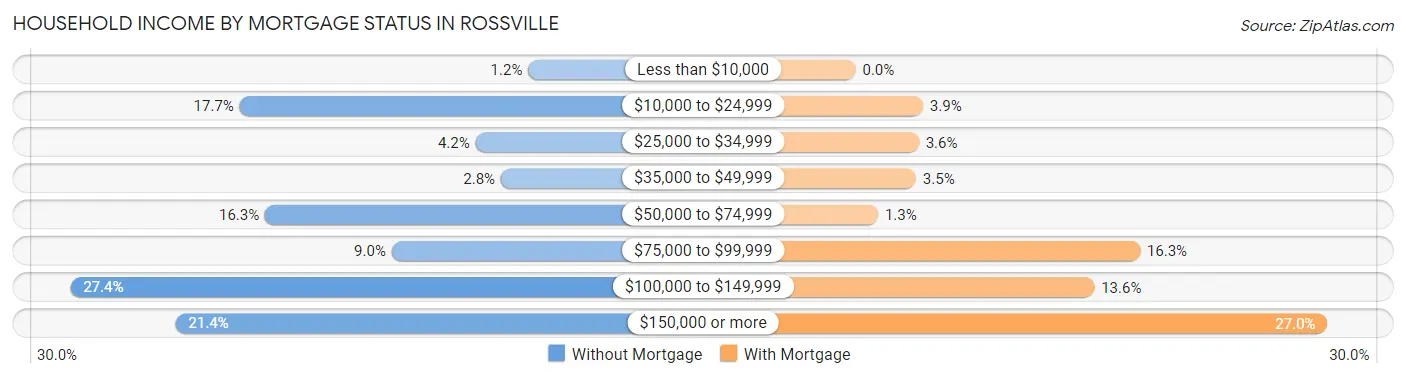
| Household Income | Without Mortgage | With Mortgage |
| Less than $10,000 | 11 (1.2%) | 0 (0.0%) |
| $10,000 to $24,999 | 159 (17.7%) | 96 (3.8%) |
| $25,000 to $34,999 | 38 (4.2%) | 90 (3.6%) |
| $35,000 to $49,999 | 25 (2.8%) | 86 (3.5%) |
| $50,000 to $74,999 | 146 (16.3%) | 32 (1.3%) |
| $75,000 to $99,999 | 81 (9.0%) | 405 (16.3%) |
| $100,000 to $149,999 | 246 (27.4%) | 340 (13.6%) |
| $150,000 or more | 192 (21.4%) | 672 (27.0%) |
| Total | 898 (100.0%) | 2,493 (100.0%) |
Property Value to Household Income Ratio in Rossville
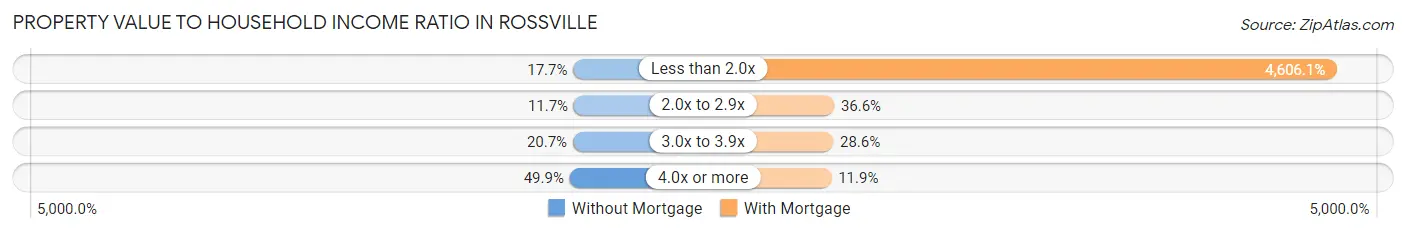
| Value-to-Income Ratio | Without Mortgage | With Mortgage |
| Less than 2.0x | 159 (17.7%) | 114,830 (4,606.1%) |
| 2.0x to 2.9x | 105 (11.7%) | 912 (36.6%) |
| 3.0x to 3.9x | 186 (20.7%) | 714 (28.6%) |
| 4.0x or more | 448 (49.9%) | 296 (11.9%) |
| Total | 898 (100.0%) | 2,493 (100.0%) |
Real Estate Taxes by Mortgage Status in Rossville
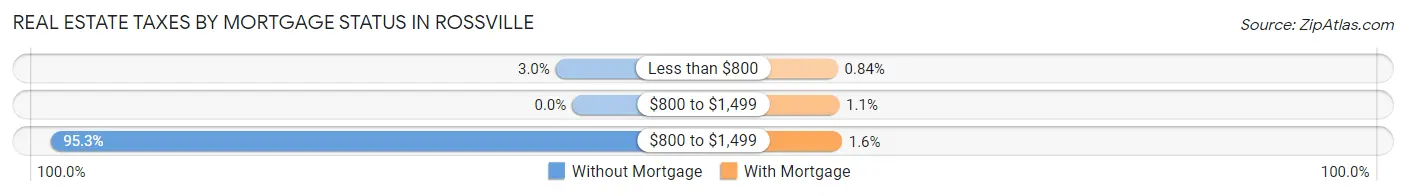
| Property Taxes | Without Mortgage | With Mortgage |
| Less than $800 | 27 (3.0%) | 21 (0.8%) |
| $800 to $1,499 | 0 (0.0%) | 28 (1.1%) |
| $800 to $1,499 | 856 (95.3%) | 40 (1.6%) |
| Total | 898 (100.0%) | 2,493 (100.0%) |
Health & Disability in Rossville
Health Insurance Coverage by Age in Rossville
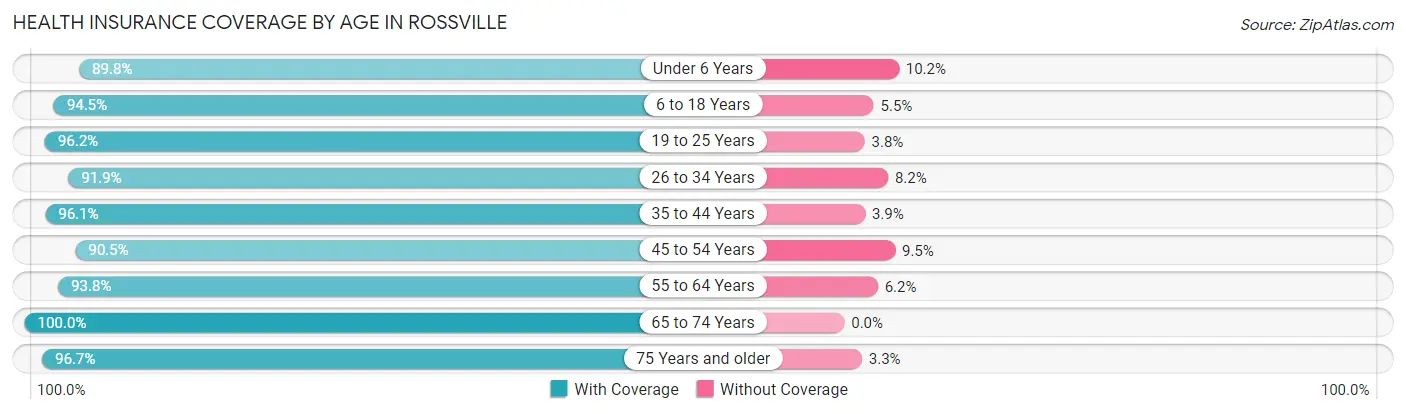
| Age Bracket | With Coverage | Without Coverage |
| Under 6 Years | 1,079 (89.8%) | 122 (10.2%) |
| 6 to 18 Years | 1,315 (94.5%) | 76 (5.5%) |
| 19 to 25 Years | 1,625 (96.2%) | 64 (3.8%) |
| 26 to 34 Years | 2,469 (91.8%) | 219 (8.2%) |
| 35 to 44 Years | 2,367 (96.1%) | 95 (3.9%) |
| 45 to 54 Years | 1,618 (90.5%) | 169 (9.5%) |
| 55 to 64 Years | 1,791 (93.8%) | 119 (6.2%) |
| 65 to 74 Years | 1,481 (100.0%) | 0 (0.0%) |
| 75 Years and older | 621 (96.7%) | 21 (3.3%) |
| Total | 14,366 (94.2%) | 885 (5.8%) |
Health Insurance Coverage by Citizenship Status in Rossville
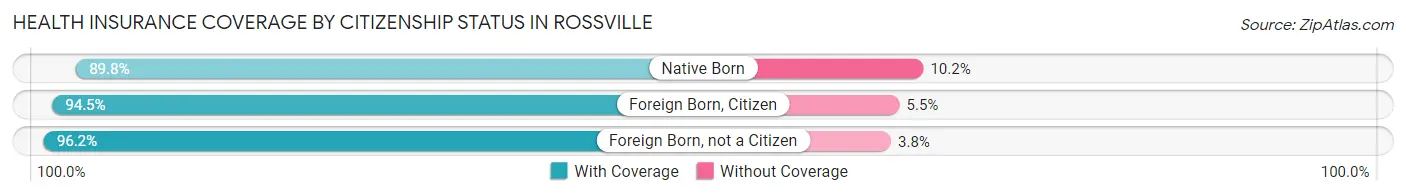
| Citizenship Status | With Coverage | Without Coverage |
| Native Born | 1,079 (89.8%) | 122 (10.2%) |
| Foreign Born, Citizen | 1,315 (94.5%) | 76 (5.5%) |
| Foreign Born, not a Citizen | 1,625 (96.2%) | 64 (3.8%) |
Health Insurance Coverage by Household Income in Rossville
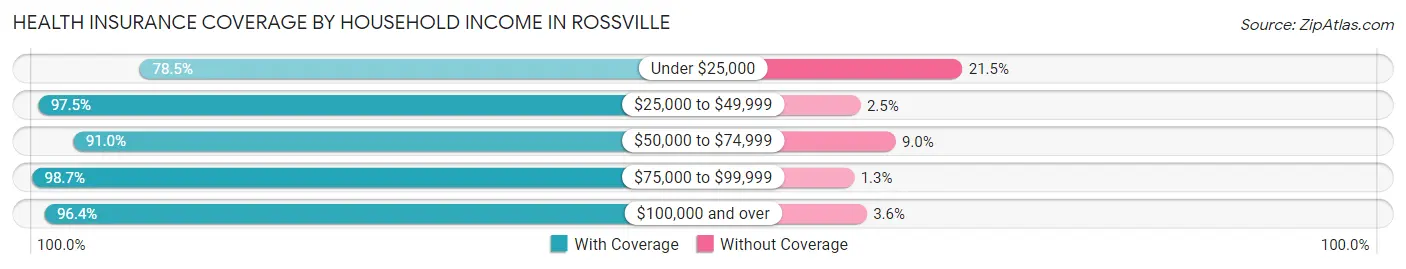
| Household Income | With Coverage | Without Coverage |
| Under $25,000 | 867 (78.5%) | 238 (21.5%) |
| $25,000 to $49,999 | 1,112 (97.5%) | 28 (2.5%) |
| $50,000 to $74,999 | 3,013 (91.0%) | 299 (9.0%) |
| $75,000 to $99,999 | 1,740 (98.7%) | 23 (1.3%) |
| $100,000 and over | 7,427 (96.4%) | 280 (3.6%) |
Public vs Private Health Insurance Coverage by Age in Rossville
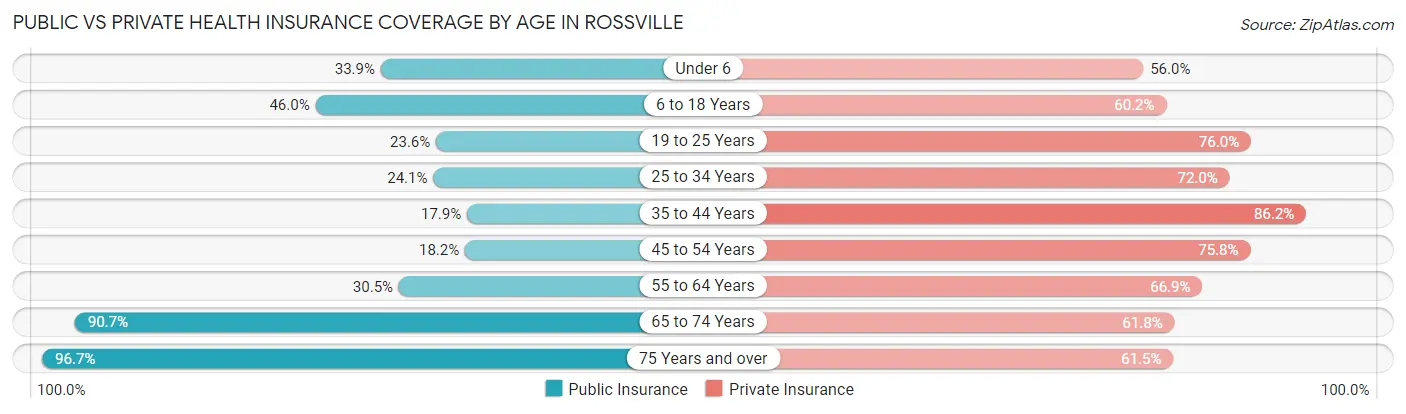
| Age Bracket | Public Insurance | Private Insurance |
| Under 6 | 407 (33.9%) | 672 (55.9%) |
| 6 to 18 Years | 640 (46.0%) | 838 (60.2%) |
| 19 to 25 Years | 399 (23.6%) | 1,283 (76.0%) |
| 25 to 34 Years | 649 (24.1%) | 1,935 (72.0%) |
| 35 to 44 Years | 440 (17.9%) | 2,122 (86.2%) |
| 45 to 54 Years | 326 (18.2%) | 1,355 (75.8%) |
| 55 to 64 Years | 583 (30.5%) | 1,278 (66.9%) |
| 65 to 74 Years | 1,343 (90.7%) | 915 (61.8%) |
| 75 Years and over | 621 (96.7%) | 395 (61.5%) |
| Total | 5,408 (35.5%) | 10,793 (70.8%) |
Disability Status by Sex by Age in Rossville
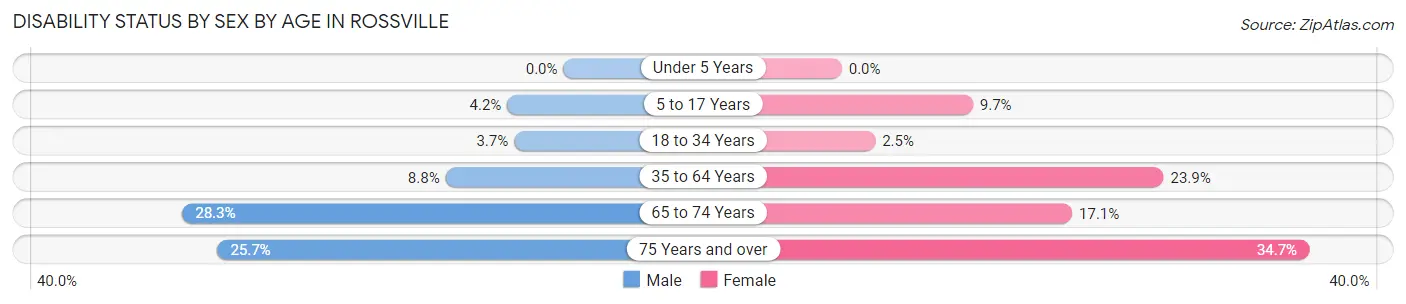
| Age Bracket | Male | Female |
| Under 5 Years | 0 (0.0%) | 0 (0.0%) |
| 5 to 17 Years | 32 (4.2%) | 73 (9.7%) |
| 18 to 34 Years | 79 (3.7%) | 57 (2.5%) |
| 35 to 64 Years | 250 (8.7%) | 789 (23.9%) |
| 65 to 74 Years | 189 (28.3%) | 139 (17.1%) |
| 75 Years and over | 76 (25.7%) | 120 (34.7%) |
Disability Class by Sex by Age in Rossville
Disability Class: Hearing Difficulty
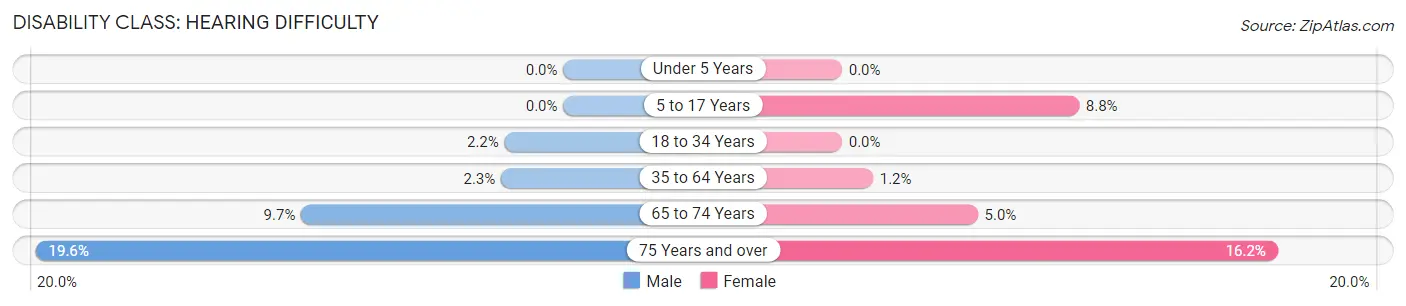
| Age Bracket | Male | Female |
| Under 5 Years | 0 (0.0%) | 0 (0.0%) |
| 5 to 17 Years | 0 (0.0%) | 66 (8.8%) |
| 18 to 34 Years | 47 (2.2%) | 0 (0.0%) |
| 35 to 64 Years | 66 (2.3%) | 38 (1.1%) |
| 65 to 74 Years | 65 (9.7%) | 41 (5.0%) |
| 75 Years and over | 58 (19.6%) | 56 (16.2%) |
Disability Class: Vision Difficulty
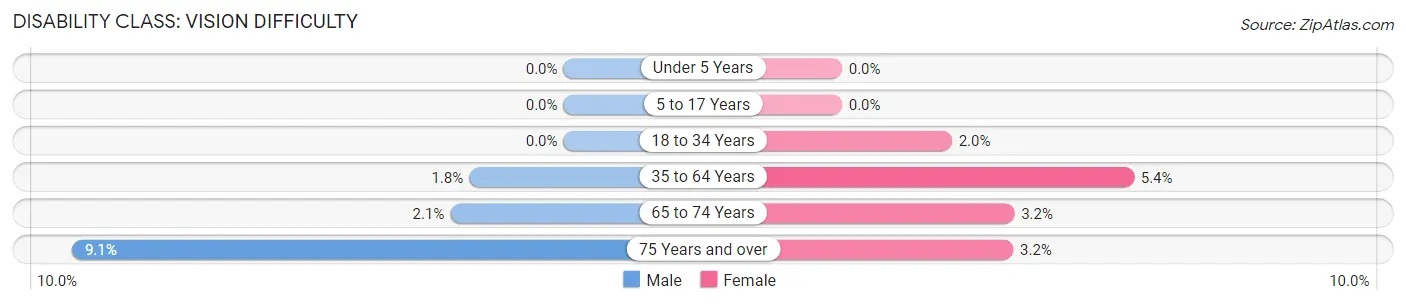
| Age Bracket | Male | Female |
| Under 5 Years | 0 (0.0%) | 0 (0.0%) |
| 5 to 17 Years | 0 (0.0%) | 0 (0.0%) |
| 18 to 34 Years | 0 (0.0%) | 47 (2.0%) |
| 35 to 64 Years | 50 (1.8%) | 179 (5.4%) |
| 65 to 74 Years | 14 (2.1%) | 26 (3.2%) |
| 75 Years and over | 27 (9.1%) | 11 (3.2%) |
Disability Class: Cognitive Difficulty
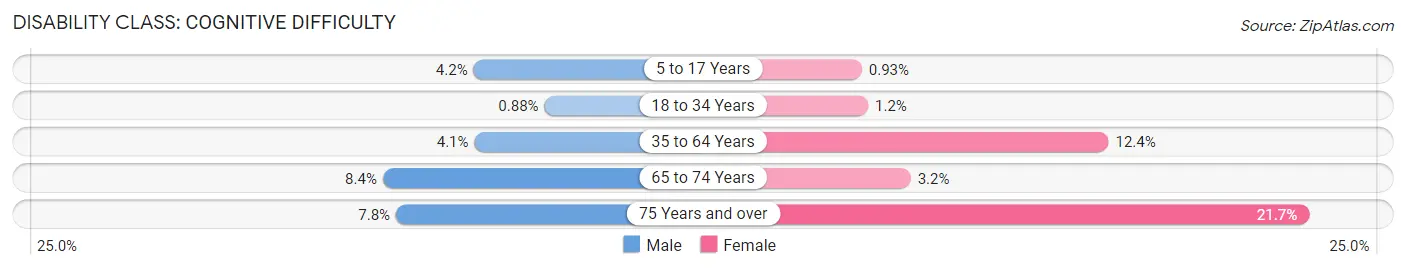
| Age Bracket | Male | Female |
| 5 to 17 Years | 32 (4.2%) | 7 (0.9%) |
| 18 to 34 Years | 19 (0.9%) | 28 (1.2%) |
| 35 to 64 Years | 118 (4.1%) | 409 (12.4%) |
| 65 to 74 Years | 56 (8.4%) | 26 (3.2%) |
| 75 Years and over | 23 (7.8%) | 75 (21.7%) |
Disability Class: Ambulatory Difficulty
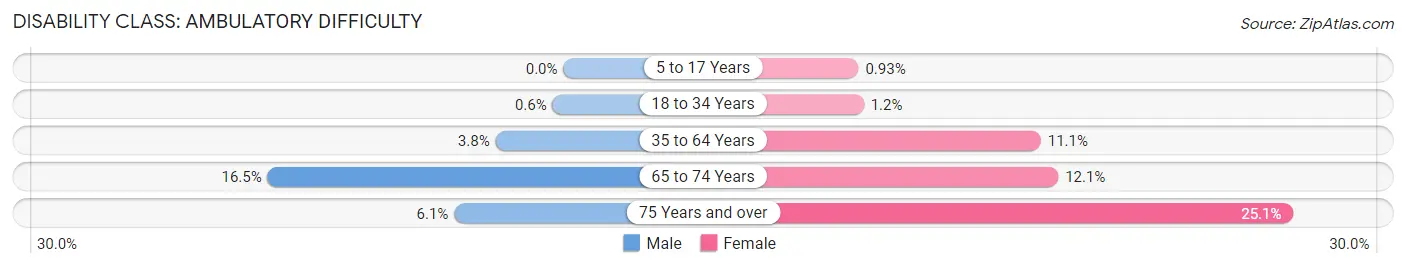
| Age Bracket | Male | Female |
| 5 to 17 Years | 0 (0.0%) | 7 (0.9%) |
| 18 to 34 Years | 13 (0.6%) | 28 (1.2%) |
| 35 to 64 Years | 108 (3.8%) | 366 (11.1%) |
| 65 to 74 Years | 110 (16.5%) | 98 (12.0%) |
| 75 Years and over | 18 (6.1%) | 87 (25.1%) |
Disability Class: Self-Care Difficulty
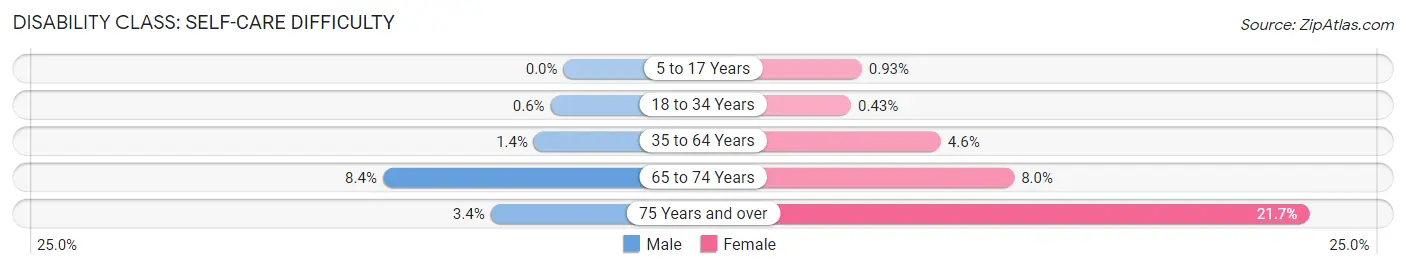
| Age Bracket | Male | Female |
| 5 to 17 Years | 0 (0.0%) | 7 (0.9%) |
| 18 to 34 Years | 13 (0.6%) | 10 (0.4%) |
| 35 to 64 Years | 39 (1.4%) | 152 (4.6%) |
| 65 to 74 Years | 56 (8.4%) | 65 (8.0%) |
| 75 Years and over | 10 (3.4%) | 75 (21.7%) |
Technology Access in Rossville
Computing Device Access in Rossville
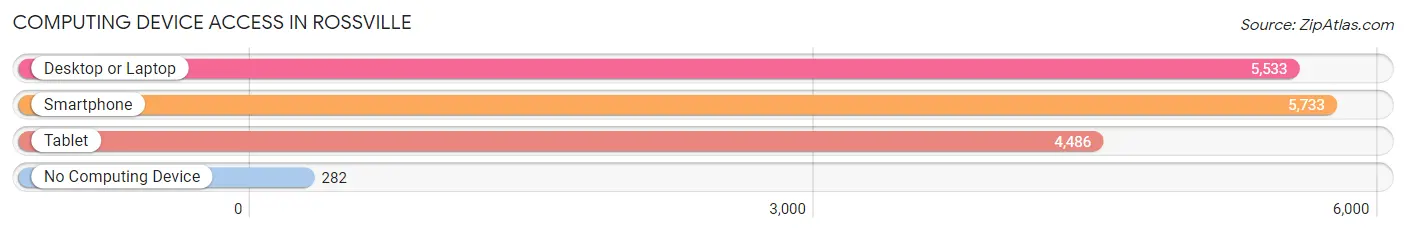
| Device Type | # Households | % Households |
| Desktop or Laptop | 5,533 | 86.8% |
| Smartphone | 5,733 | 90.0% |
| Tablet | 4,486 | 70.4% |
| No Computing Device | 282 | 4.4% |
| Total | 6,372 | 100.0% |
Internet Access in Rossville
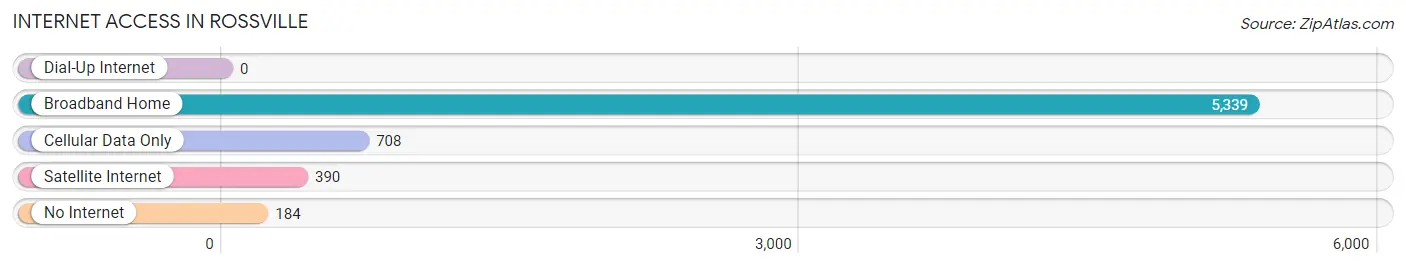
| Internet Type | # Households | % Households |
| Dial-Up Internet | 0 | 0.0% |
| Broadband Home | 5,339 | 83.8% |
| Cellular Data Only | 708 | 11.1% |
| Satellite Internet | 390 | 6.1% |
| No Internet | 184 | 2.9% |
| Total | 6,372 | 100.0% |
Rossville Summary
Rossville is a small unincorporated community located in Baltimore County, Maryland. It is situated in the southeastern corner of the county, just north of the city of Baltimore. The community is bordered by the Patapsco River to the east, the Baltimore Beltway to the south, and the city of Baltimore to the west. The population of Rossville was estimated to be 2,845 in 2019.
History
The area that is now Rossville was first settled in the late 1700s by German and English immigrants. The community was originally known as “Ross’s Village” after the family of William Ross, who owned a large tract of land in the area. The village was officially established in 1837 and was named after Ross’s son, John Ross.
The community grew steadily throughout the 19th century, and by the early 20th century, Rossville had become a thriving agricultural community. The area was known for its dairy farms, poultry farms, and orchards. The community also had a number of small businesses, including a general store, a blacksmith shop, and a post office.
In the 1950s, the area began to experience rapid growth as the city of Baltimore expanded outward. The population of Rossville increased significantly, and the community began to develop into a suburban neighborhood. In the 1970s, the area was annexed by the city of Baltimore, and Rossville officially became part of the city.
Geography
Rossville is located in the southeastern corner of Baltimore County, just north of the city of Baltimore. The community is bordered by the Patapsco River to the east, the Baltimore Beltway to the south, and the city of Baltimore to the west. The area is mostly flat, with some rolling hills in the northern part of the community.
The climate in Rossville is typical of the mid-Atlantic region, with hot, humid summers and cold, wet winters. The average annual temperature is around 55 degrees Fahrenheit, and the average annual precipitation is around 40 inches.
Economy
The economy of Rossville is largely based on the service industry. The community is home to a number of small businesses, including restaurants, retail stores, and professional services. The area also has a number of industrial and manufacturing businesses, including a steel mill and a paper mill.
The community is also home to a number of government offices, including the Baltimore County Police Department and the Baltimore County Fire Department.
Demographics
The population of Rossville was estimated to be 2,845 in 2019. The population is largely white (83.3%), with smaller percentages of African Americans (10.2%), Asians (3.2%), and Hispanics (2.7%). The median household income in the community is $60,945, and the median home value is $220,000.
The majority of the population (77.3%) is over the age of 18, and the median age is 43. The community is largely made up of married couples (54.2%), with smaller percentages of single-parent households (17.2%) and non-family households (28.6%).
Conclusion
Rossville is a small unincorporated community located in Baltimore County, Maryland. It is situated in the southeastern corner of the county, just north of the city of Baltimore. The community is bordered by the Patapsco River to the east, the Baltimore Beltway to the south, and the city of Baltimore to the west. The population of Rossville was estimated to be 2,845 in 2019.
The economy of Rossville is largely based on the service industry, and the population is largely white. The median household income in the community is $60,945, and the median home value is $220,000. The majority of the population is over the age of 18, and the median age is 43. Rossville is a thriving community with a rich history and a bright future.
Common Questions
What is Per Capita Income in Rossville?
Per Capita income in Rossville is $41,963.
What is the Median Family Income in Rossville?
Median Family Income in Rossville is $107,428.
What is the Median Household income in Rossville?
Median Household Income in Rossville is $82,037.
What is Income or Wage Gap in Rossville?
Income or Wage Gap in Rossville is 32.8%.
Women in Rossville earn 67.2 cents for every dollar earned by a man.
What is Family Income Deficit in Rossville?
Family Income Deficit in Rossville is $14,847.
Families that are below poverty line in Rossville earn $14,847 less on average than the poverty threshold level.
What is Inequality or Gini Index in Rossville?
Inequality or Gini Index in Rossville is 0.38.
What is the Total Population of Rossville?
Total Population of Rossville is 15,503.
What is the Total Male Population of Rossville?
Total Male Population of Rossville is 7,368.
What is the Total Female Population of Rossville?
Total Female Population of Rossville is 8,135.
What is the Ratio of Males per 100 Females in Rossville?
There are 90.57 Males per 100 Females in Rossville.
What is the Ratio of Females per 100 Males in Rossville?
There are 110.41 Females per 100 Males in Rossville.
What is the Median Population Age in Rossville?
Median Population Age in Rossville is 37.8 Years.
What is the Average Family Size in Rossville
Average Family Size in Rossville is 3.1 People.
What is the Average Household Size in Rossville
Average Household Size in Rossville is 2.4 People.
How Large is the Labor Force in Rossville?
There are 9,588 People in the Labor Forcein in Rossville.
What is the Percentage of People in the Labor Force in Rossville?
72.7% of People are in the Labor Force in Rossville.
What is the Unemployment Rate in Rossville?
Unemployment Rate in Rossville is 3.7%.