Baltimore Highlands, MD Map & Demographics
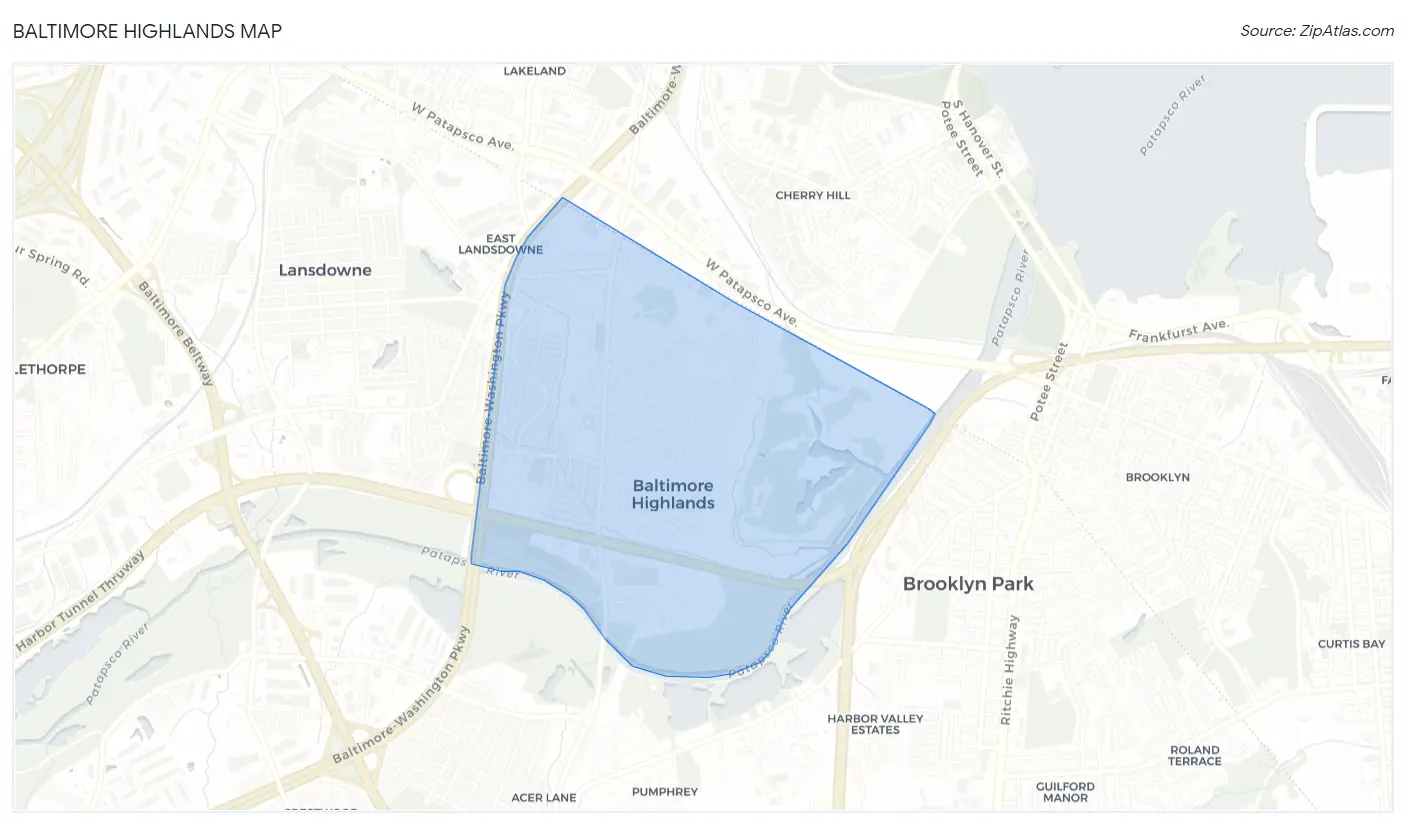
Baltimore Highlands Map
Baltimore Highlands Overview
$31,079
PER CAPITA INCOME
$72,589
AVG FAMILY INCOME
$56,367
AVG HOUSEHOLD INCOME
19.6%
WAGE / INCOME GAP [ % ]
80.4¢/ $1
WAGE / INCOME GAP [ $ ]
0.48
INEQUALITY / GINI INDEX
8,116
TOTAL POPULATION
4,167
MALE POPULATION
3,949
FEMALE POPULATION
105.52
MALES / 100 FEMALES
94.77
FEMALES / 100 MALES
35.9
MEDIAN AGE
3.4
AVG FAMILY SIZE
2.7
AVG HOUSEHOLD SIZE
4,053
LABOR FORCE [ PEOPLE ]
62.6%
PERCENT IN LABOR FORCE
6.0%
UNEMPLOYMENT RATE
Income in Baltimore Highlands
Income Overview in Baltimore Highlands
Per Capita Income in Baltimore Highlands is $31,079, while median incomes of families and households are $72,589 and $56,367 respectively.
| Characteristic | Number | Measure |
| Per Capita Income | 8,116 | $31,079 |
| Median Family Income | 1,971 | $72,589 |
| Mean Family Income | 1,971 | $96,122 |
| Median Household Income | 2,959 | $56,367 |
| Mean Household Income | 2,959 | $82,482 |
| Income Deficit | 1,971 | $0 |
| Wage / Income Gap (%) | 8,116 | 19.58% |
| Wage / Income Gap ($) | 8,116 | 80.42¢ per $1 |
| Gini / Inequality Index | 8,116 | 0.48 |
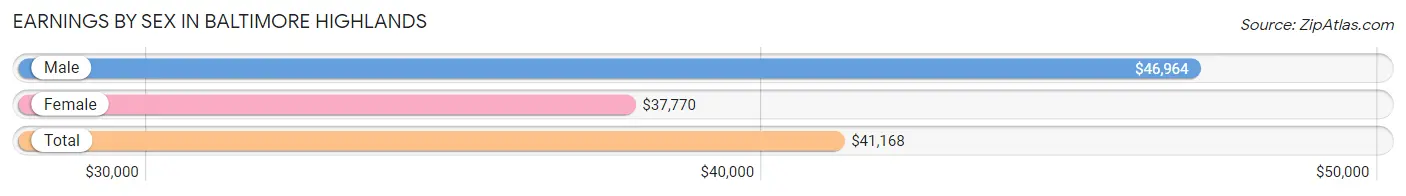
Earnings by Sex in Baltimore Highlands
Average Earnings in Baltimore Highlands are $41,168, $46,964 for men and $37,770 for women, a difference of 19.6%.
| Sex | Number | Average Earnings |
| Male | 2,316 (56.9%) | $46,964 |
| Female | 1,757 (43.1%) | $37,770 |
| Total | 4,073 (100.0%) | $41,168 |
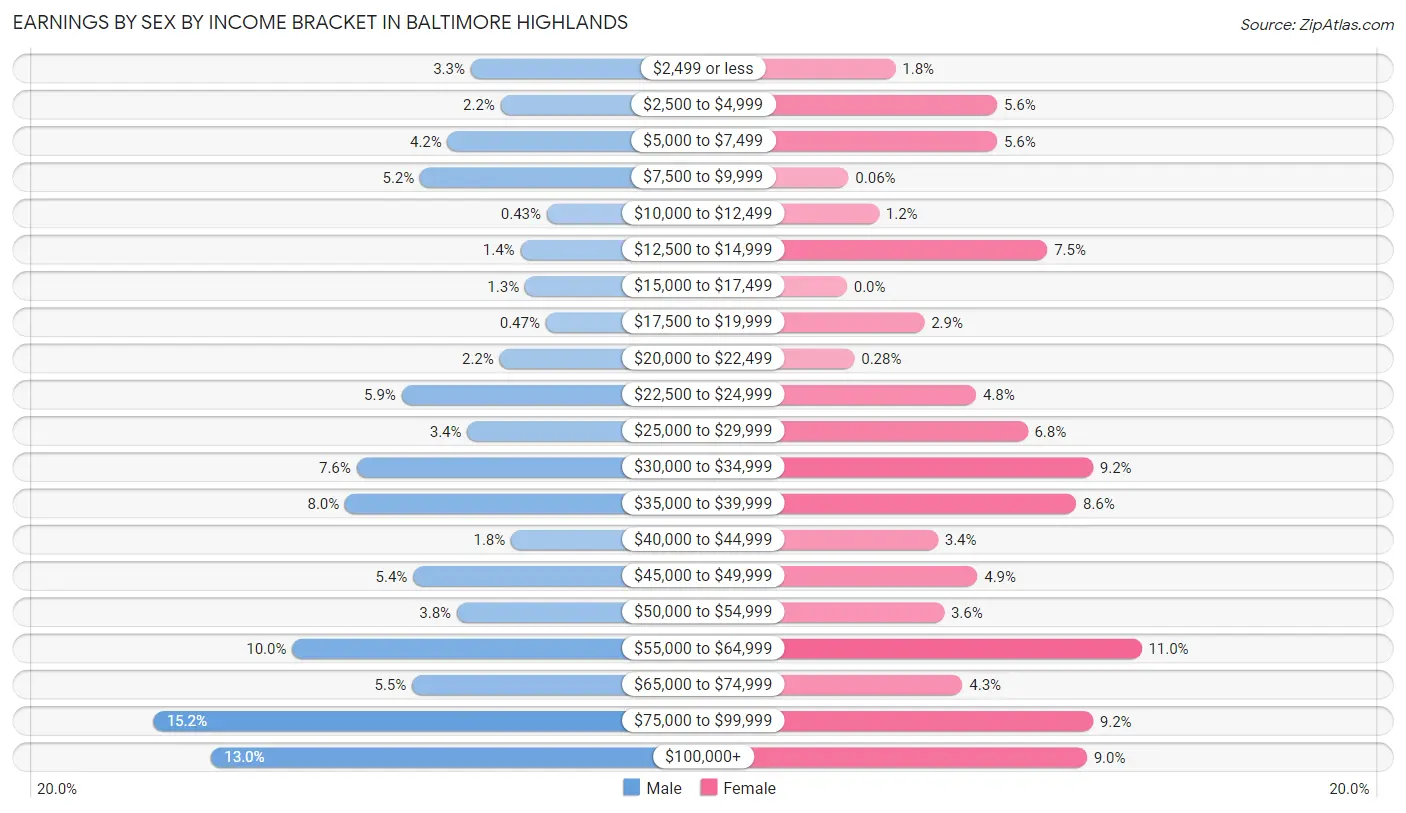
Earnings by Sex by Income Bracket in Baltimore Highlands
The most common earnings brackets in Baltimore Highlands are $75,000 to $99,999 for men (351 | 15.2%) and $55,000 to $64,999 for women (194 | 11.0%).
| Income | Male | Female |
| $2,499 or less | 76 (3.3%) | 32 (1.8%) |
| $2,500 to $4,999 | 50 (2.2%) | 99 (5.6%) |
| $5,000 to $7,499 | 96 (4.2%) | 99 (5.6%) |
| $7,500 to $9,999 | 120 (5.2%) | 1 (0.1%) |
| $10,000 to $12,499 | 10 (0.4%) | 21 (1.2%) |
| $12,500 to $14,999 | 33 (1.4%) | 132 (7.5%) |
| $15,000 to $17,499 | 29 (1.3%) | 0 (0.0%) |
| $17,500 to $19,999 | 11 (0.5%) | 51 (2.9%) |
| $20,000 to $22,499 | 51 (2.2%) | 5 (0.3%) |
| $22,500 to $24,999 | 136 (5.9%) | 85 (4.8%) |
| $25,000 to $29,999 | 79 (3.4%) | 119 (6.8%) |
| $30,000 to $34,999 | 175 (7.6%) | 162 (9.2%) |
| $35,000 to $39,999 | 185 (8.0%) | 151 (8.6%) |
| $40,000 to $44,999 | 41 (1.8%) | 60 (3.4%) |
| $45,000 to $49,999 | 126 (5.4%) | 86 (4.9%) |
| $50,000 to $54,999 | 88 (3.8%) | 64 (3.6%) |
| $55,000 to $64,999 | 231 (10.0%) | 194 (11.0%) |
| $65,000 to $74,999 | 127 (5.5%) | 76 (4.3%) |
| $75,000 to $99,999 | 351 (15.2%) | 162 (9.2%) |
| $100,000+ | 301 (13.0%) | 158 (9.0%) |
| Total | 2,316 (100.0%) | 1,757 (100.0%) |
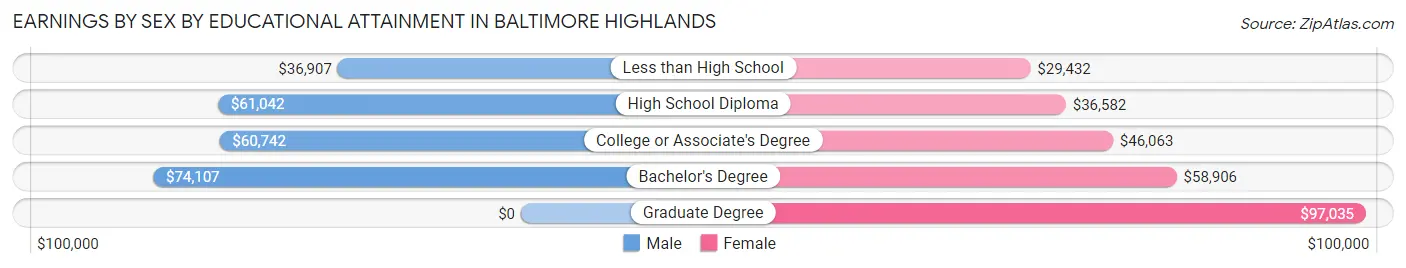
Earnings by Sex by Educational Attainment in Baltimore Highlands
Average earnings in Baltimore Highlands are $51,160 for men and $43,621 for women, a difference of 14.7%. Men with an educational attainment of bachelor's degree enjoy the highest average annual earnings of $74,107, while those with less than high school education earn the least with $36,907. Women with an educational attainment of graduate degree earn the most with the average annual earnings of $97,035, while those with less than high school education have the smallest earnings of $29,432.
| Educational Attainment | Male Income | Female Income |
| Less than High School | $36,907 | $29,432 |
| High School Diploma | $61,042 | $36,582 |
| College or Associate's Degree | $60,742 | $46,063 |
| Bachelor's Degree | $74,107 | $58,906 |
| Graduate Degree | - | - |
| Total | $51,160 | $43,621 |
Family Income in Baltimore Highlands
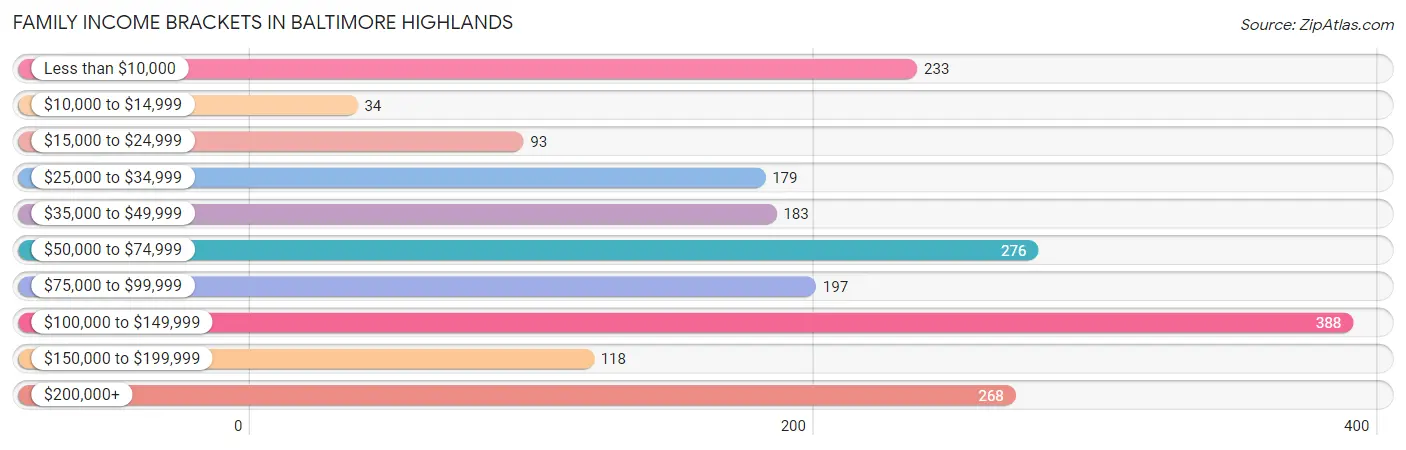
Family Income Brackets in Baltimore Highlands
According to the Baltimore Highlands family income data, there are 388 families falling into the $100,000 to $149,999 income range, which is the most common income bracket and makes up 19.7% of all families. Conversely, the $10,000 to $14,999 income bracket is the least frequent group with only 34 families (1.7%) belonging to this category.
| Income Bracket | # Families | % Families |
| Less than $10,000 | 233 | 11.8% |
| $10,000 to $14,999 | 34 | 1.7% |
| $15,000 to $24,999 | 93 | 4.7% |
| $25,000 to $34,999 | 179 | 9.1% |
| $35,000 to $49,999 | 183 | 9.3% |
| $50,000 to $74,999 | 276 | 14.0% |
| $75,000 to $99,999 | 197 | 10.0% |
| $100,000 to $149,999 | 388 | 19.7% |
| $150,000 to $199,999 | 118 | 6.0% |
| $200,000+ | 268 | 13.6% |
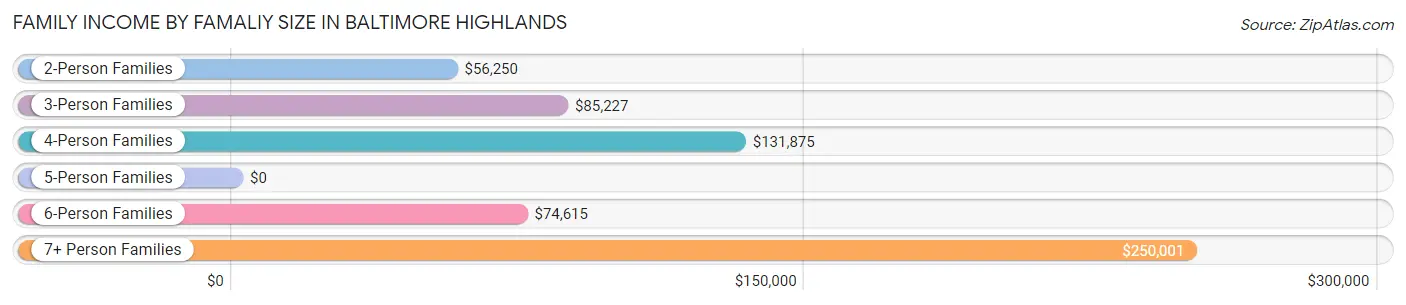
Family Income by Famaliy Size in Baltimore Highlands
7+ person families (54 | 2.7%) account for the highest median family income in Baltimore Highlands with $250,001 per family, while 7+ person families (54 | 2.7%) have the highest median income of $35,714 per family member.
| Income Bracket | # Families | Median Income |
| 2-Person Families | 836 (42.4%) | $56,250 |
| 3-Person Families | 478 (24.2%) | $85,227 |
| 4-Person Families | 236 (12.0%) | $131,875 |
| 5-Person Families | 235 (11.9%) | $0 |
| 6-Person Families | 132 (6.7%) | $74,615 |
| 7+ Person Families | 54 (2.7%) | $250,001 |
| Total | 1,971 (100.0%) | $72,589 |
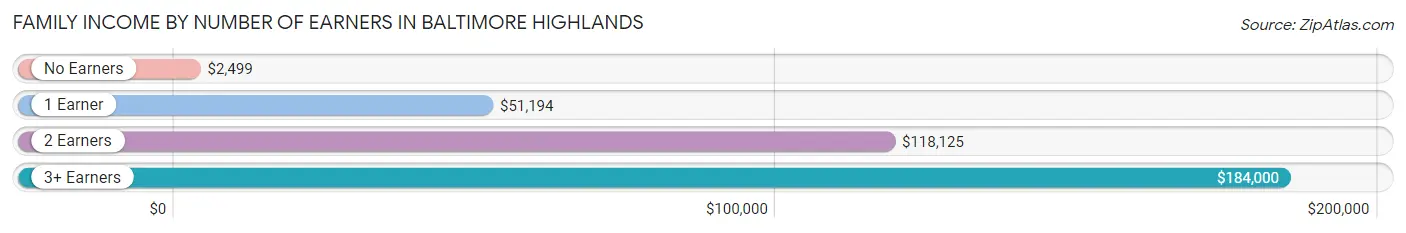
Family Income by Number of Earners in Baltimore Highlands
The median family income in Baltimore Highlands is $72,589, with families comprising 3+ earners (308) having the highest median family income of $184,000, while families with no earners (390) have the lowest median family income of $2,499, accounting for 15.6% and 19.8% of families, respectively.
| Number of Earners | # Families | Median Income |
| No Earners | 390 (19.8%) | $2,499 |
| 1 Earner | 614 (31.1%) | $51,194 |
| 2 Earners | 659 (33.4%) | $118,125 |
| 3+ Earners | 308 (15.6%) | $184,000 |
| Total | 1,971 (100.0%) | $72,589 |
Household Income in Baltimore Highlands
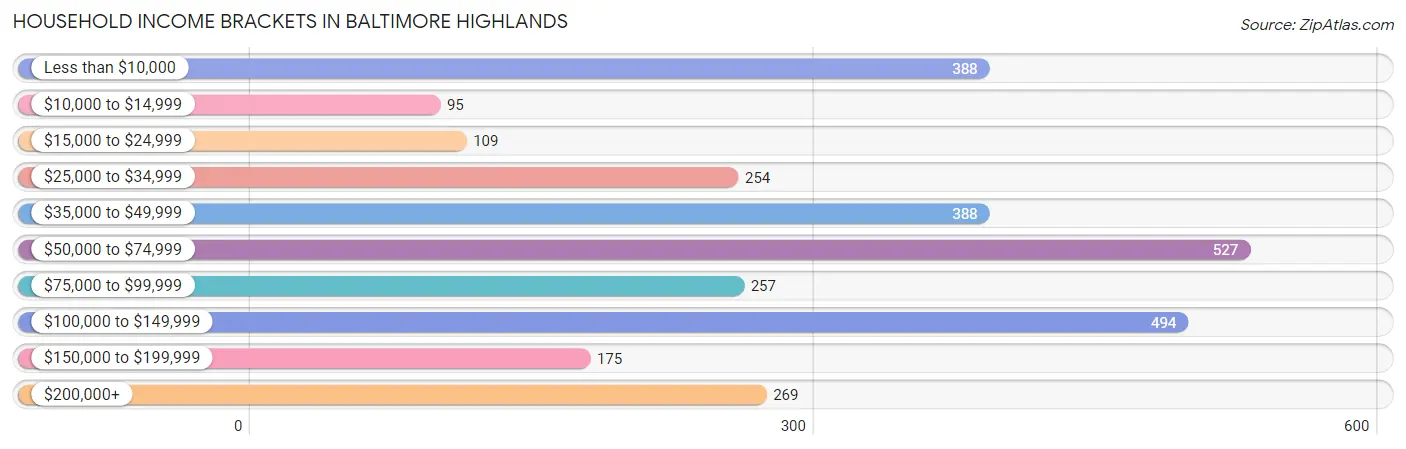
Household Income Brackets in Baltimore Highlands
With 527 households falling in the category, the $50,000 to $74,999 income range is the most frequent in Baltimore Highlands, accounting for 17.8% of all households. In contrast, only 95 households (3.2%) fall into the $10,000 to $14,999 income bracket, making it the least populous group.
| Income Bracket | # Households | % Households |
| Less than $10,000 | 388 | 13.1% |
| $10,000 to $14,999 | 95 | 3.2% |
| $15,000 to $24,999 | 109 | 3.7% |
| $25,000 to $34,999 | 254 | 8.6% |
| $35,000 to $49,999 | 388 | 13.1% |
| $50,000 to $74,999 | 527 | 17.8% |
| $75,000 to $99,999 | 257 | 8.7% |
| $100,000 to $149,999 | 494 | 16.7% |
| $150,000 to $199,999 | 175 | 5.9% |
| $200,000+ | 269 | 9.1% |
Household Income by Householder Age in Baltimore Highlands
The median household income in Baltimore Highlands is $56,367, with the highest median household income of $84,641 found in the 45 to 64 years age bracket for the primary householder. A total of 1,145 households (38.7%) fall into this category. Meanwhile, the 15 to 24 years age bracket for the primary householder has the lowest median household income of $0, with 55 households (1.9%) in this group.
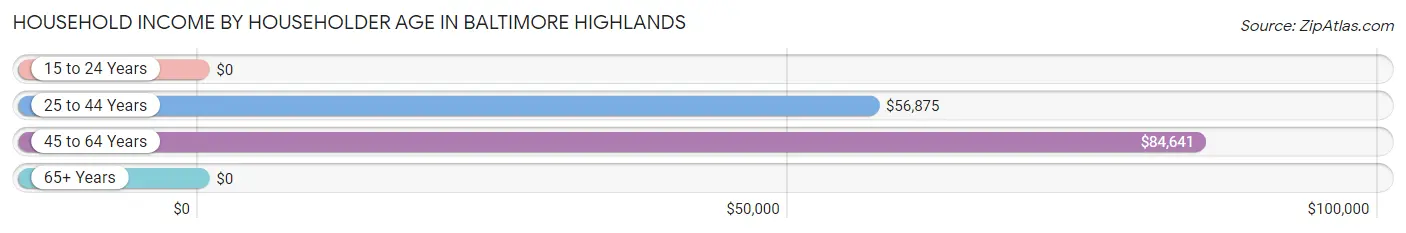
| Income Bracket | # Households | Median Income |
| 15 to 24 Years | 55 (1.9%) | $0 |
| 25 to 44 Years | 1,054 (35.6%) | $56,875 |
| 45 to 64 Years | 1,145 (38.7%) | $84,641 |
| 65+ Years | 705 (23.8%) | $0 |
| Total | 2,959 (100.0%) | $56,367 |
Poverty in Baltimore Highlands
Income Below Poverty by Sex and Age in Baltimore Highlands
With 19.6% poverty level for males and 25.0% for females among the residents of Baltimore Highlands, 65 to 74 year old males and 12 to 14 year old females are the most vulnerable to poverty, with 225 males (56.8%) and 58 females (79.4%) in their respective age groups living below the poverty level.
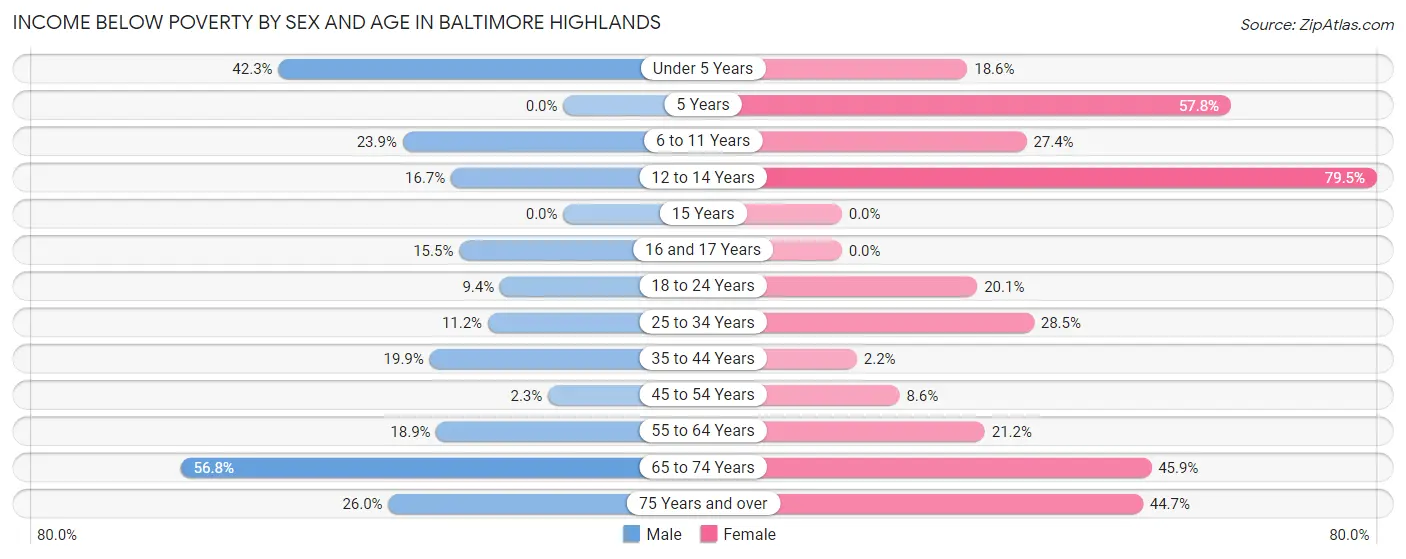
| Age Bracket | Male | Female |
| Under 5 Years | 110 (42.3%) | 55 (18.6%) |
| 5 Years | 0 (0.0%) | 52 (57.8%) |
| 6 to 11 Years | 57 (23.8%) | 82 (27.4%) |
| 12 to 14 Years | 37 (16.7%) | 58 (79.4%) |
| 15 Years | 0 (0.0%) | 0 (0.0%) |
| 16 and 17 Years | 15 (15.5%) | 0 (0.0%) |
| 18 to 24 Years | 30 (9.4%) | 75 (20.1%) |
| 25 to 34 Years | 94 (11.2%) | 191 (28.5%) |
| 35 to 44 Years | 87 (19.9%) | 10 (2.2%) |
| 45 to 54 Years | 12 (2.3%) | 35 (8.6%) |
| 55 to 64 Years | 102 (18.9%) | 99 (21.2%) |
| 65 to 74 Years | 225 (56.8%) | 232 (45.9%) |
| 75 Years and over | 47 (26.0%) | 97 (44.7%) |
| Total | 816 (19.6%) | 986 (25.0%) |
Income Above Poverty by Sex and Age in Baltimore Highlands
According to the poverty statistics in Baltimore Highlands, males aged 5 years and females aged 15 years are the age groups that are most secure financially, with 100.0% of males and 100.0% of females in these age groups living above the poverty line.
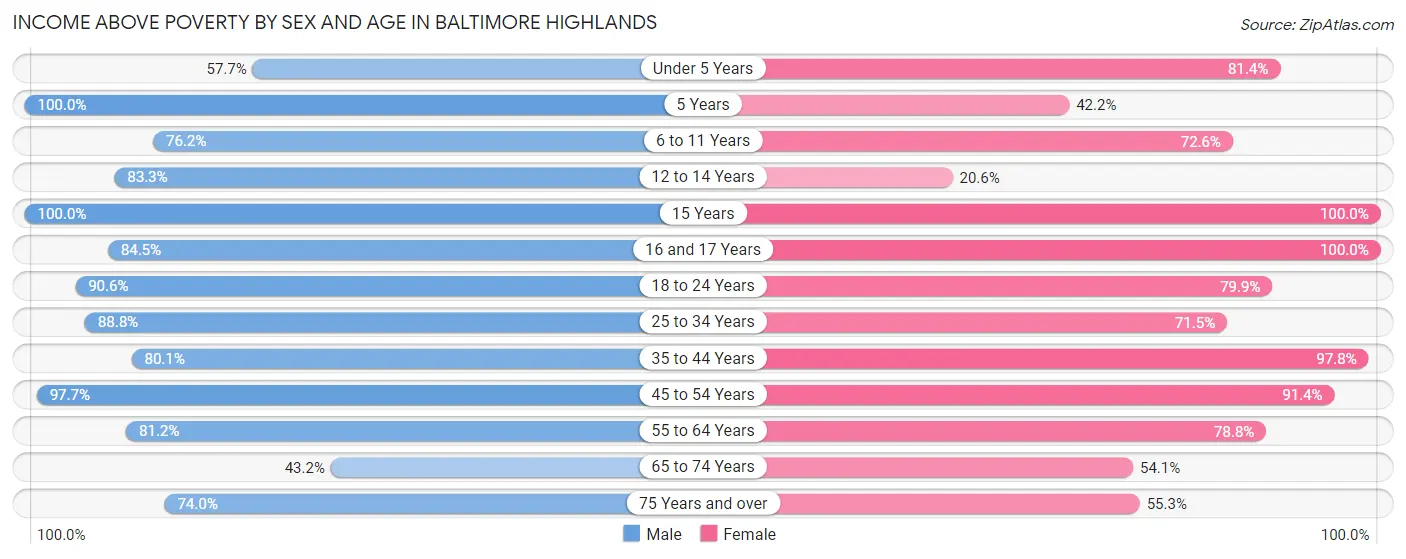
| Age Bracket | Male | Female |
| Under 5 Years | 150 (57.7%) | 240 (81.4%) |
| 5 Years | 58 (100.0%) | 38 (42.2%) |
| 6 to 11 Years | 182 (76.1%) | 217 (72.6%) |
| 12 to 14 Years | 185 (83.3%) | 15 (20.5%) |
| 15 Years | 47 (100.0%) | 58 (100.0%) |
| 16 and 17 Years | 82 (84.5%) | 47 (100.0%) |
| 18 to 24 Years | 289 (90.6%) | 298 (79.9%) |
| 25 to 34 Years | 745 (88.8%) | 479 (71.5%) |
| 35 to 44 Years | 351 (80.1%) | 437 (97.8%) |
| 45 to 54 Years | 518 (97.7%) | 374 (91.4%) |
| 55 to 64 Years | 439 (81.1%) | 367 (78.8%) |
| 65 to 74 Years | 171 (43.2%) | 273 (54.1%) |
| 75 Years and over | 134 (74.0%) | 120 (55.3%) |
| Total | 3,351 (80.4%) | 2,963 (75.0%) |
Income Below Poverty Among Married-Couple Families in Baltimore Highlands
The poverty statistics for married-couple families in Baltimore Highlands show that 23.1% or 310 of the total 1,342 families live below the poverty line. Families with 3 or 4 children have the highest poverty rate of 36.2%, comprising of 67 families. On the other hand, families with 1 or 2 children have the lowest poverty rate of 6.1%, which includes 23 families.
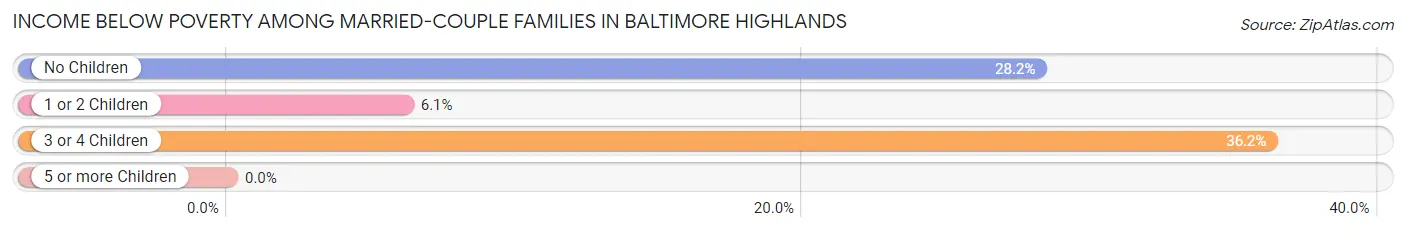
| Children | Above Poverty | Below Poverty |
| No Children | 561 (71.8%) | 220 (28.2%) |
| 1 or 2 Children | 353 (93.9%) | 23 (6.1%) |
| 3 or 4 Children | 118 (63.8%) | 67 (36.2%) |
| 5 or more Children | 0 (0.0%) | 0 (0.0%) |
| Total | 1,032 (76.9%) | 310 (23.1%) |
Income Below Poverty Among Single-Parent Households in Baltimore Highlands
According to the poverty data in Baltimore Highlands, 12.0% or 37 single-father households and 21.5% or 69 single-mother households are living below the poverty line. Among single-father households, those with 1 or 2 children have the highest poverty rate, with 30 households (22.4%) experiencing poverty. Likewise, among single-mother households, those with 1 or 2 children have the highest poverty rate, with 69 households (30.7%) falling below the poverty line.
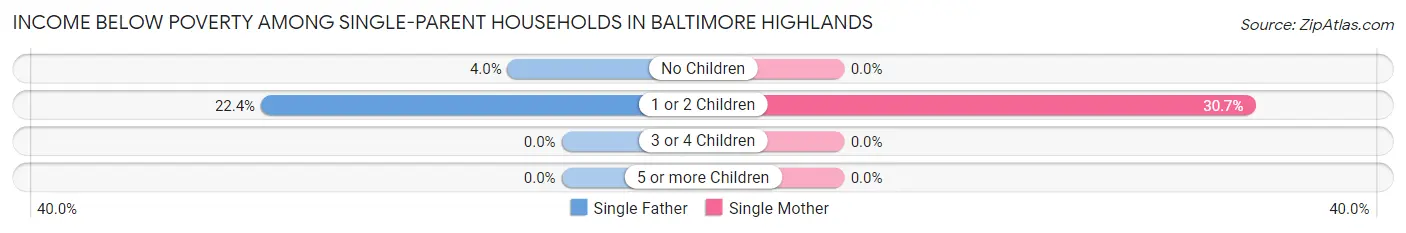
| Children | Single Father | Single Mother |
| No Children | 7 (4.0%) | 0 (0.0%) |
| 1 or 2 Children | 30 (22.4%) | 69 (30.7%) |
| 3 or 4 Children | 0 (0.0%) | 0 (0.0%) |
| 5 or more Children | 0 (0.0%) | 0 (0.0%) |
| Total | 37 (12.0%) | 69 (21.5%) |
Income Below Poverty Among Married-Couple vs Single-Parent Households in Baltimore Highlands
The poverty data for Baltimore Highlands shows that 310 of the married-couple family households (23.1%) and 106 of the single-parent households (16.9%) are living below the poverty level. Within the married-couple family households, those with 3 or 4 children have the highest poverty rate, with 67 households (36.2%) falling below the poverty line. Among the single-parent households, those with 1 or 2 children have the highest poverty rate, with 99 household (27.6%) living below poverty.
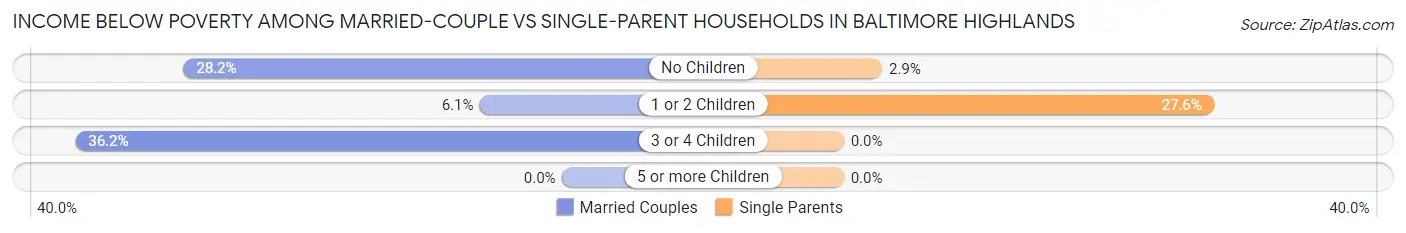
| Children | Married-Couple Families | Single-Parent Households |
| No Children | 220 (28.2%) | 7 (2.9%) |
| 1 or 2 Children | 23 (6.1%) | 99 (27.6%) |
| 3 or 4 Children | 67 (36.2%) | 0 (0.0%) |
| 5 or more Children | 0 (0.0%) | 0 (0.0%) |
| Total | 310 (23.1%) | 106 (16.9%) |
Race in Baltimore Highlands
The most populous races in Baltimore Highlands are White / Caucasian (4,025 | 49.6%), Black / African American (2,113 | 26.0%), and Some other Race (1,264 | 15.6%).
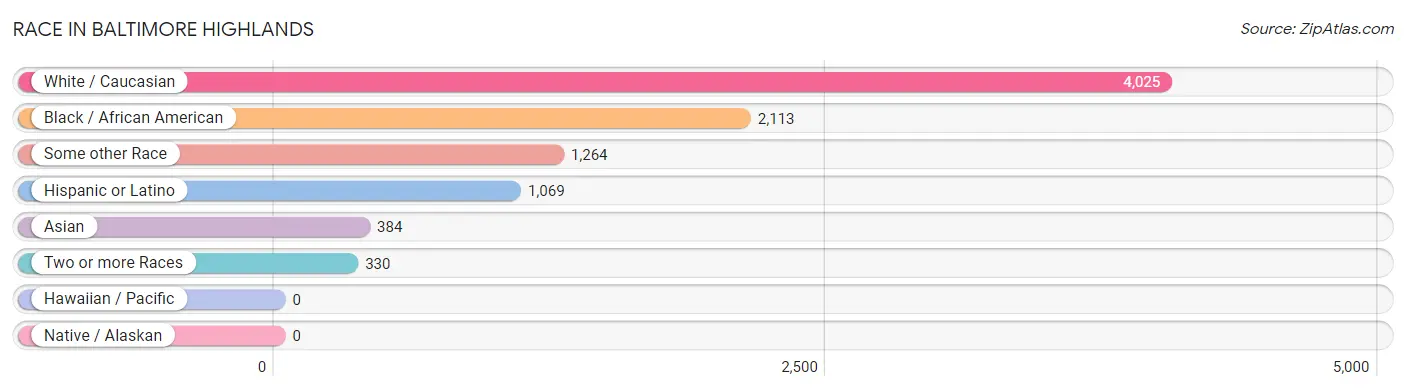
| Race | # Population | % Population |
| Asian | 384 | 4.7% |
| Black / African American | 2,113 | 26.0% |
| Hawaiian / Pacific | 0 | 0.0% |
| Hispanic or Latino | 1,069 | 13.2% |
| Native / Alaskan | 0 | 0.0% |
| White / Caucasian | 4,025 | 49.6% |
| Two or more Races | 330 | 4.1% |
| Some other Race | 1,264 | 15.6% |
| Total | 8,116 | 100.0% |
Ancestry in Baltimore Highlands
The most populous ancestries reported in Baltimore Highlands are German (916 | 11.3%), Irish (893 | 11.0%), Central American (529 | 6.5%), Italian (513 | 6.3%), and English (467 | 5.8%), together accounting for 40.9% of all Baltimore Highlands residents.
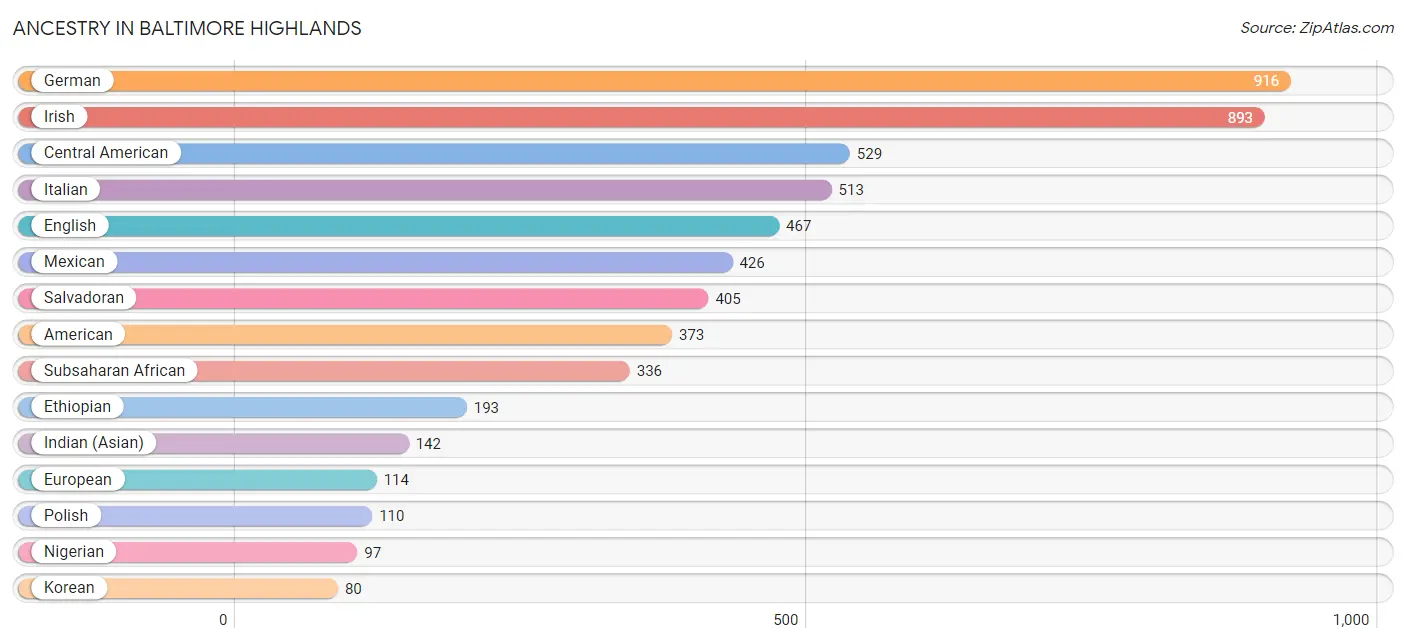
| Ancestry | # Population | % Population |
| American | 373 | 4.6% |
| British | 9 | 0.1% |
| Central American | 529 | 6.5% |
| Cherokee | 15 | 0.2% |
| Colombian | 5 | 0.1% |
| Dominican | 4 | 0.1% |
| Dutch | 14 | 0.2% |
| English | 467 | 5.8% |
| Estonian | 11 | 0.1% |
| Ethiopian | 193 | 2.4% |
| European | 114 | 1.4% |
| French | 70 | 0.9% |
| German | 916 | 11.3% |
| Greek | 9 | 0.1% |
| Guatemalan | 55 | 0.7% |
| Honduran | 10 | 0.1% |
| Indian (Asian) | 142 | 1.8% |
| Irish | 893 | 11.0% |
| Italian | 513 | 6.3% |
| Kenyan | 19 | 0.2% |
| Korean | 80 | 1.0% |
| Lithuanian | 20 | 0.3% |
| Mexican | 426 | 5.2% |
| Nigerian | 97 | 1.2% |
| Norwegian | 18 | 0.2% |
| Panamanian | 1 | 0.0% |
| Paraguayan | 4 | 0.1% |
| Peruvian | 5 | 0.1% |
| Polish | 110 | 1.4% |
| Puerto Rican | 35 | 0.4% |
| Puget Sound Salish | 22 | 0.3% |
| Salvadoran | 405 | 5.0% |
| Scotch-Irish | 11 | 0.1% |
| Scottish | 67 | 0.8% |
| Senegalese | 27 | 0.3% |
| South American | 14 | 0.2% |
| Subsaharan African | 336 | 4.1% |
| Swedish | 55 | 0.7% |
| Ukrainian | 14 | 0.2% |
| Welsh | 10 | 0.1% | View All 40 Rows |
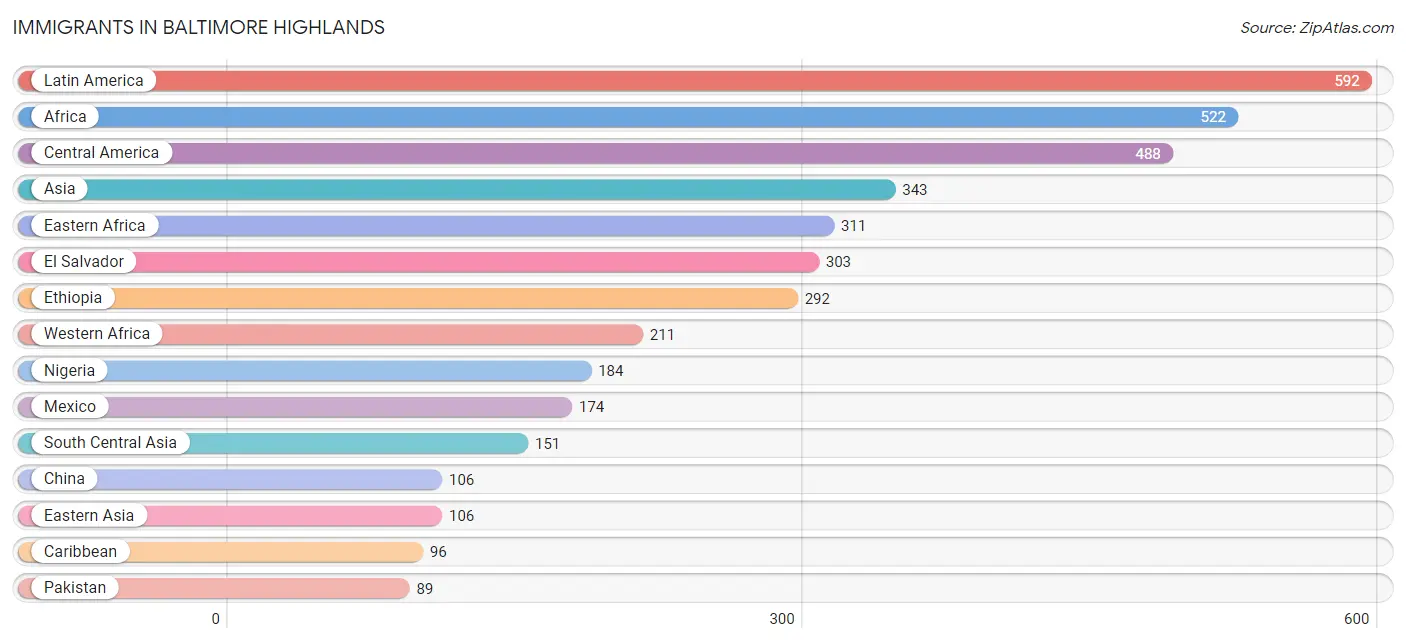
Immigrants in Baltimore Highlands
The most numerous immigrant groups reported in Baltimore Highlands came from Latin America (592 | 7.3%), Africa (522 | 6.4%), Central America (488 | 6.0%), Asia (343 | 4.2%), and Eastern Africa (311 | 3.8%), together accounting for 27.8% of all Baltimore Highlands residents.
| Immigration Origin | # Population | % Population |
| Afghanistan | 39 | 0.5% |
| Africa | 522 | 6.4% |
| Asia | 343 | 4.2% |
| Caribbean | 96 | 1.2% |
| Central America | 488 | 6.0% |
| China | 106 | 1.3% |
| Colombia | 5 | 0.1% |
| Dominican Republic | 4 | 0.1% |
| Eastern Africa | 311 | 3.8% |
| Eastern Asia | 106 | 1.3% |
| Eastern Europe | 11 | 0.1% |
| El Salvador | 303 | 3.7% |
| Ethiopia | 292 | 3.6% |
| Europe | 24 | 0.3% |
| Honduras | 10 | 0.1% |
| Hong Kong | 39 | 0.5% |
| Kenya | 19 | 0.2% |
| Latin America | 592 | 7.3% |
| Malaysia | 36 | 0.4% |
| Mexico | 174 | 2.1% |
| Nepal | 23 | 0.3% |
| Nigeria | 184 | 2.3% |
| Pakistan | 89 | 1.1% |
| Panama | 1 | 0.0% |
| Peru | 1 | 0.0% |
| Philippines | 50 | 0.6% |
| Senegal | 27 | 0.3% |
| South America | 8 | 0.1% |
| South Central Asia | 151 | 1.9% |
| South Eastern Asia | 86 | 1.1% |
| Southern Europe | 13 | 0.2% |
| Spain | 13 | 0.2% |
| Western Africa | 211 | 2.6% | View All 33 Rows |
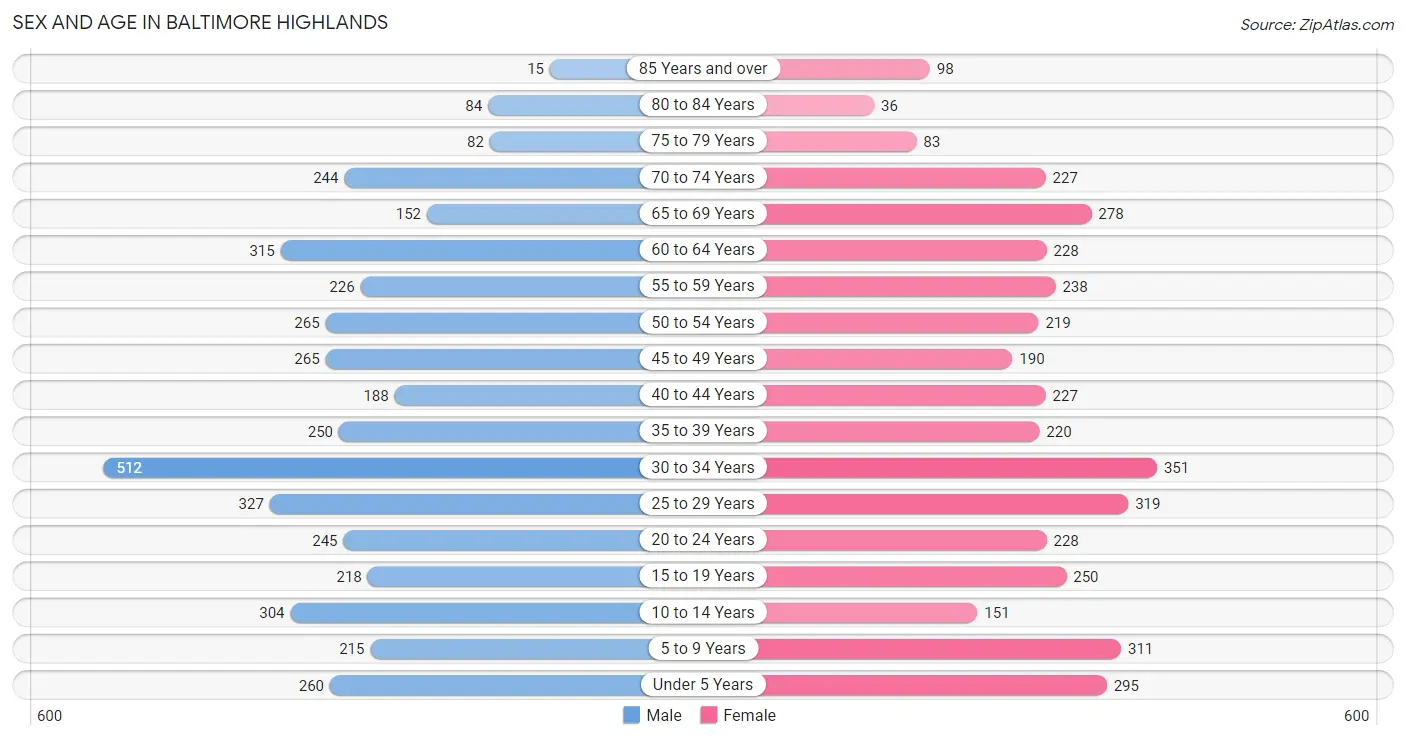
Sex and Age in Baltimore Highlands
Sex and Age in Baltimore Highlands
The most populous age groups in Baltimore Highlands are 30 to 34 Years (512 | 12.3%) for men and 30 to 34 Years (351 | 8.9%) for women.
| Age Bracket | Male | Female |
| Under 5 Years | 260 (6.2%) | 295 (7.5%) |
| 5 to 9 Years | 215 (5.2%) | 311 (7.9%) |
| 10 to 14 Years | 304 (7.3%) | 151 (3.8%) |
| 15 to 19 Years | 218 (5.2%) | 250 (6.3%) |
| 20 to 24 Years | 245 (5.9%) | 228 (5.8%) |
| 25 to 29 Years | 327 (7.9%) | 319 (8.1%) |
| 30 to 34 Years | 512 (12.3%) | 351 (8.9%) |
| 35 to 39 Years | 250 (6.0%) | 220 (5.6%) |
| 40 to 44 Years | 188 (4.5%) | 227 (5.8%) |
| 45 to 49 Years | 265 (6.4%) | 190 (4.8%) |
| 50 to 54 Years | 265 (6.4%) | 219 (5.6%) |
| 55 to 59 Years | 226 (5.4%) | 238 (6.0%) |
| 60 to 64 Years | 315 (7.6%) | 228 (5.8%) |
| 65 to 69 Years | 152 (3.6%) | 278 (7.0%) |
| 70 to 74 Years | 244 (5.9%) | 227 (5.8%) |
| 75 to 79 Years | 82 (2.0%) | 83 (2.1%) |
| 80 to 84 Years | 84 (2.0%) | 36 (0.9%) |
| 85 Years and over | 15 (0.4%) | 98 (2.5%) |
| Total | 4,167 (100.0%) | 3,949 (100.0%) |
Families and Households in Baltimore Highlands
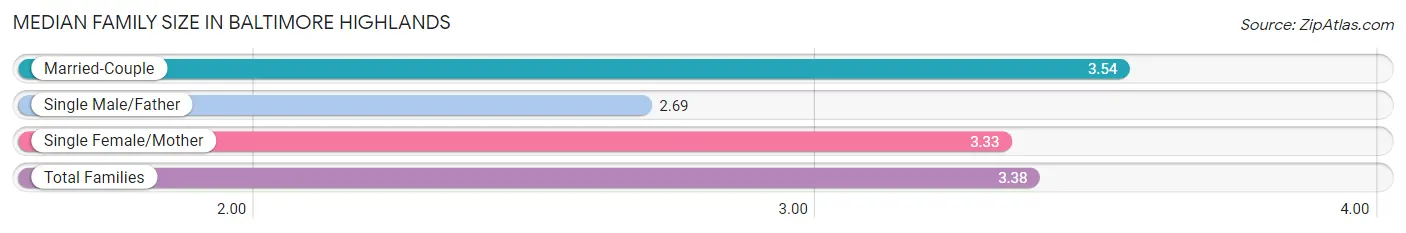
Median Family Size in Baltimore Highlands
The median family size in Baltimore Highlands is 3.38 persons per family, with married-couple families (1,342 | 68.1%) accounting for the largest median family size of 3.54 persons per family. On the other hand, single male/father families (308 | 15.6%) represent the smallest median family size with 2.69 persons per family.
| Family Type | # Families | Family Size |
| Married-Couple | 1,342 (68.1%) | 3.54 |
| Single Male/Father | 308 (15.6%) | 2.69 |
| Single Female/Mother | 321 (16.3%) | 3.33 |
| Total Families | 1,971 (100.0%) | 3.38 |
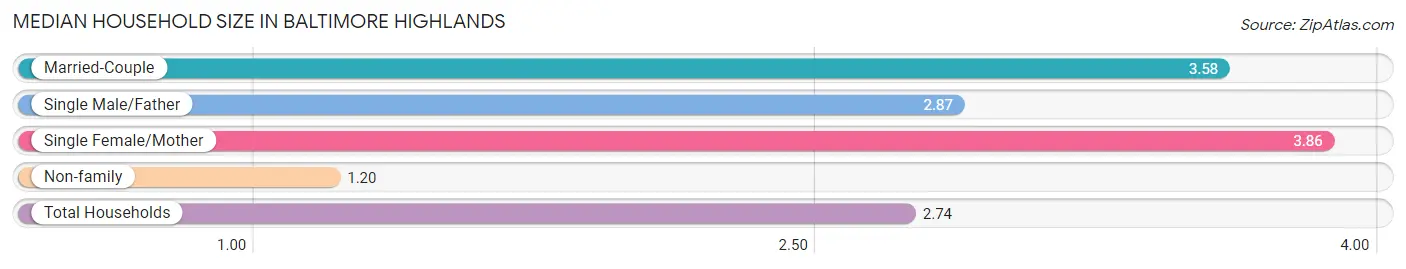
Median Household Size in Baltimore Highlands
The median household size in Baltimore Highlands is 2.74 persons per household, with single female/mother households (321 | 10.8%) accounting for the largest median household size of 3.86 persons per household. non-family households (988 | 33.4%) represent the smallest median household size with 1.20 persons per household.
| Household Type | # Households | Household Size |
| Married-Couple | 1,342 (45.4%) | 3.58 |
| Single Male/Father | 308 (10.4%) | 2.87 |
| Single Female/Mother | 321 (10.8%) | 3.86 |
| Non-family | 988 (33.4%) | 1.20 |
| Total Households | 2,959 (100.0%) | 2.74 |
Household Size by Marriage Status in Baltimore Highlands
Out of a total of 2,959 households in Baltimore Highlands, 1,971 (66.6%) are family households, while 988 (33.4%) are nonfamily households. The most numerous type of family households are 2-person households, comprising 730, and the most common type of nonfamily households are 1-person households, comprising 840.
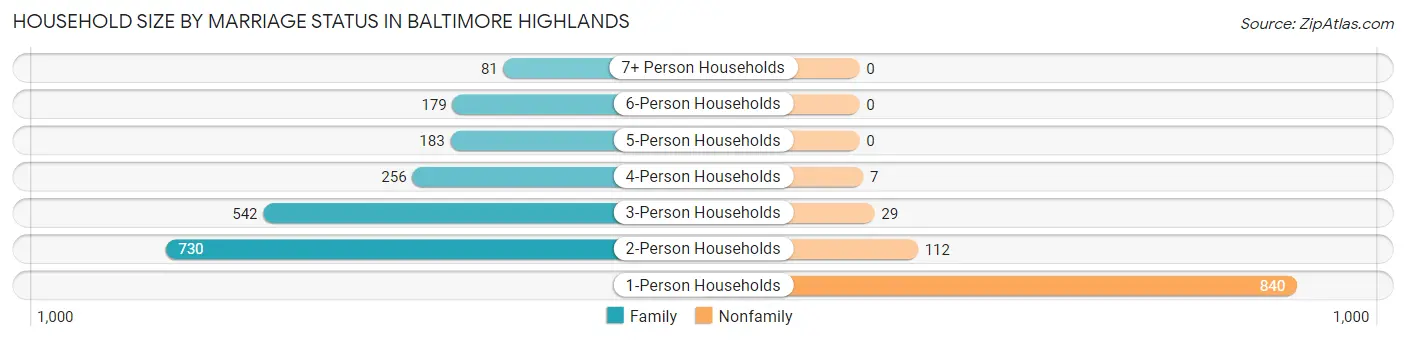
| Household Size | Family Households | Nonfamily Households |
| 1-Person Households | - | 840 (28.4%) |
| 2-Person Households | 730 (24.7%) | 112 (3.8%) |
| 3-Person Households | 542 (18.3%) | 29 (1.0%) |
| 4-Person Households | 256 (8.6%) | 7 (0.2%) |
| 5-Person Households | 183 (6.2%) | 0 (0.0%) |
| 6-Person Households | 179 (6.0%) | 0 (0.0%) |
| 7+ Person Households | 81 (2.7%) | 0 (0.0%) |
| Total | 1,971 (66.6%) | 988 (33.4%) |
Female Fertility in Baltimore Highlands
Fertility by Age in Baltimore Highlands
Average fertility rate in Baltimore Highlands is 72.0 births per 1,000 women. Women in the age bracket of 20 to 34 years have the highest fertility rate with 146.0 births per 1,000 women. Women in the age bracket of 20 to 34 years acount for 100.0% of all women with births.
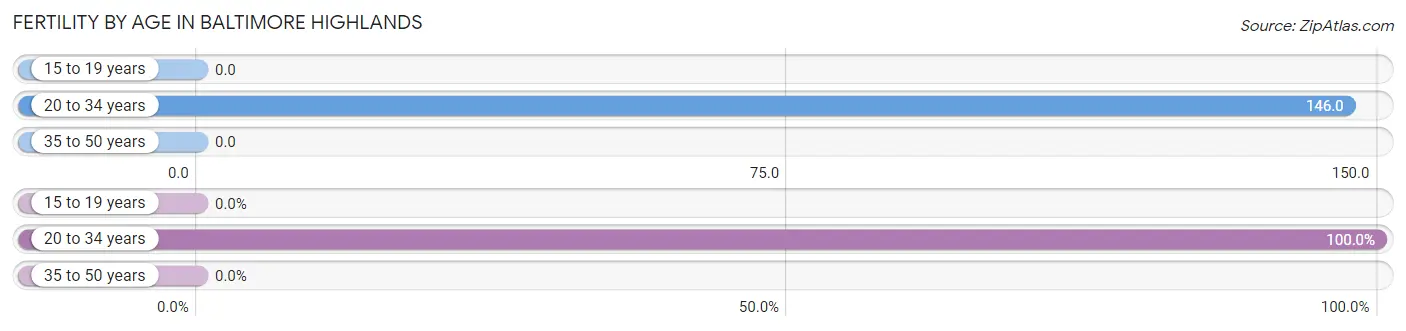
| Age Bracket | Women with Births | Births / 1,000 Women |
| 15 to 19 years | 0 (0.0%) | 0.0 |
| 20 to 34 years | 131 (100.0%) | 146.0 |
| 35 to 50 years | 0 (0.0%) | 0.0 |
| Total | 131 (100.0%) | 72.0 |
Fertility by Age by Marriage Status in Baltimore Highlands
90.1% of women with births (131) in Baltimore Highlands are married. The highest percentage of unmarried women with births falls into 20 to 34 years age bracket with 9.9% of them unmarried at the time of birth, while the lowest percentage of unmarried women with births belong to 20 to 34 years age bracket with 9.9% of them unmarried.
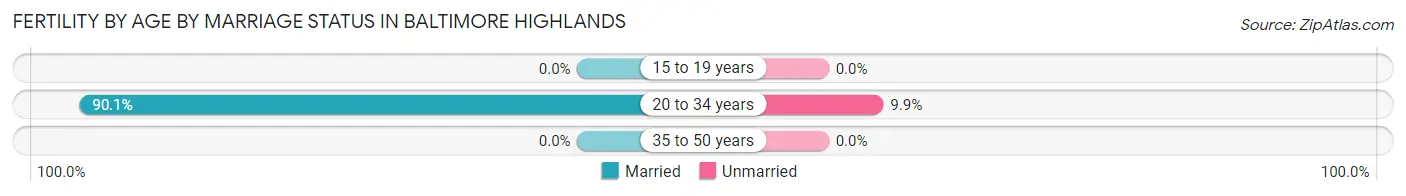
| Age Bracket | Married | Unmarried |
| 15 to 19 years | 0 (0.0%) | 0 (0.0%) |
| 20 to 34 years | 118 (90.1%) | 13 (9.9%) |
| 35 to 50 years | 0 (0.0%) | 0 (0.0%) |
| Total | 118 (90.1%) | 13 (9.9%) |
Fertility by Education in Baltimore Highlands
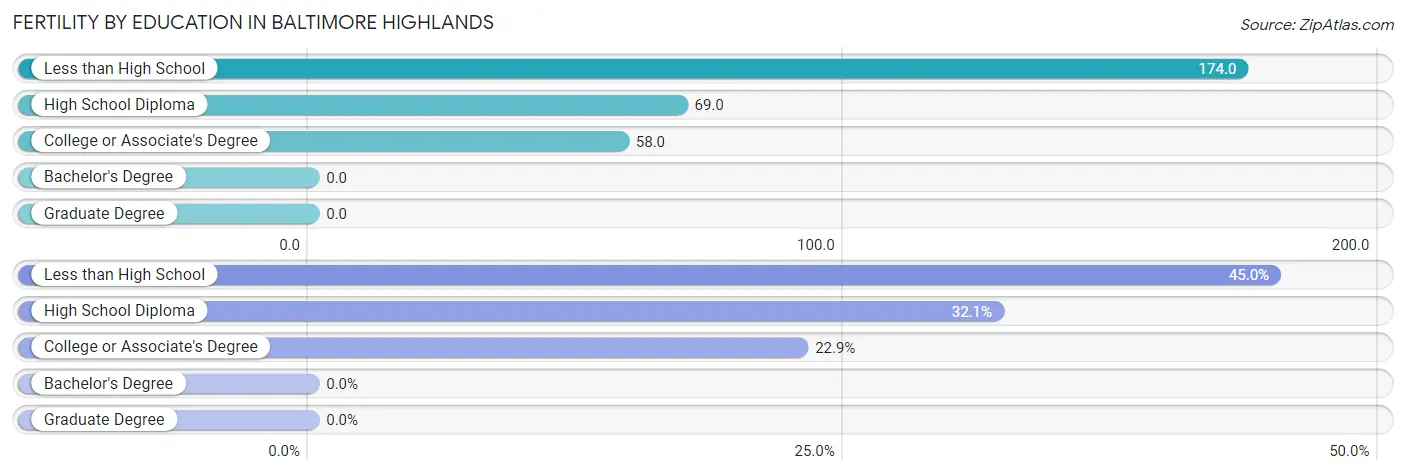
| Educational Attainment | Women with Births | Births / 1,000 Women |
| Less than High School | 59 (45.0%) | 174.0 |
| High School Diploma | 42 (32.1%) | 69.0 |
| College or Associate's Degree | 30 (22.9%) | 58.0 |
| Bachelor's Degree | 0 (0.0%) | 0.0 |
| Graduate Degree | 0 (0.0%) | 0.0 |
| Total | 131 (100.0%) | 72.0 |
Fertility by Education by Marriage Status in Baltimore Highlands
9.9% of women with births in Baltimore Highlands are unmarried. Women with the educational attainment of less than high school are most likely to be married with 100.0% of them married at childbirth, while women with the educational attainment of high school diploma are least likely to be married with 30.9% of them unmarried at childbirth.
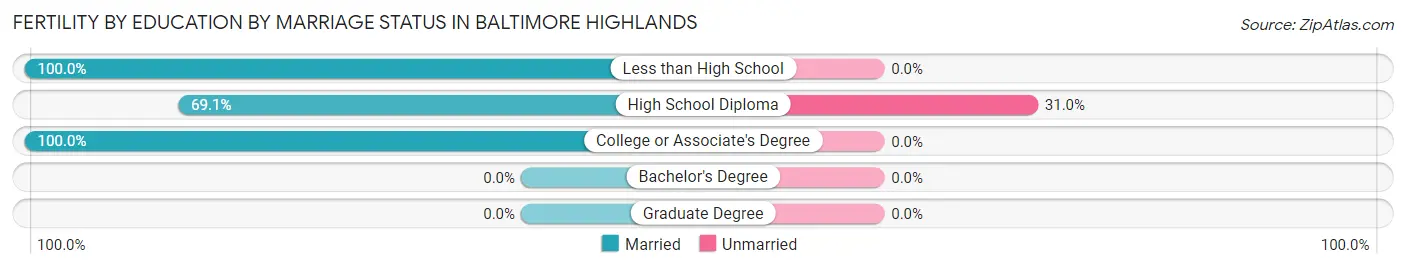
| Educational Attainment | Married | Unmarried |
| Less than High School | 59 (100.0%) | 0 (0.0%) |
| High School Diploma | 29 (69.1%) | 13 (30.9%) |
| College or Associate's Degree | 30 (100.0%) | 0 (0.0%) |
| Bachelor's Degree | 0 (0.0%) | 0 (0.0%) |
| Graduate Degree | 0 (0.0%) | 0 (0.0%) |
| Total | 118 (90.1%) | 13 (9.9%) |
Employment Characteristics in Baltimore Highlands
Employment by Class of Employer in Baltimore Highlands
Among the 3,776 employed individuals in Baltimore Highlands, private company employees (2,766 | 73.3%), federal government employees (268 | 7.1%), and state government employees (258 | 6.8%) make up the most common classes of employment.
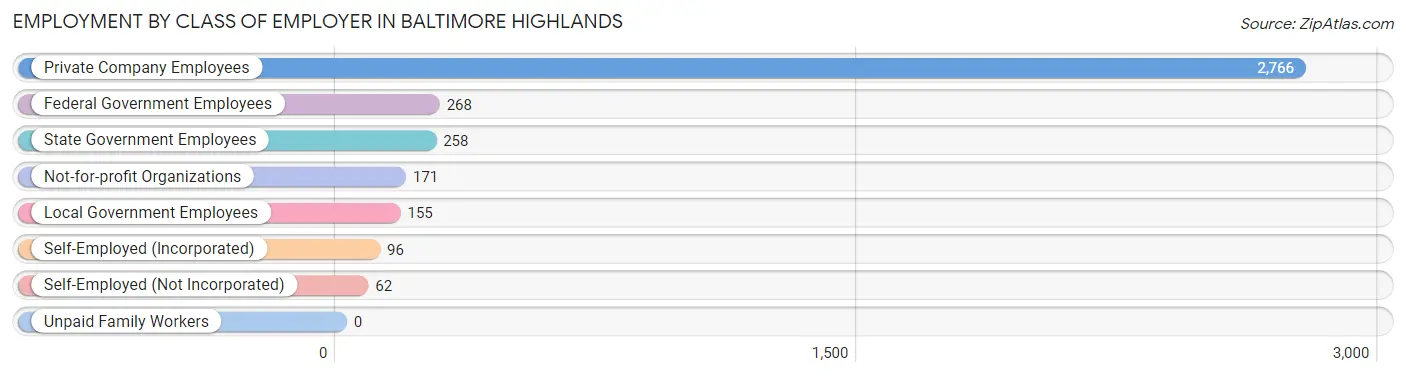
| Employer Class | # Employees | % Employees |
| Private Company Employees | 2,766 | 73.3% |
| Self-Employed (Incorporated) | 96 | 2.5% |
| Self-Employed (Not Incorporated) | 62 | 1.6% |
| Not-for-profit Organizations | 171 | 4.5% |
| Local Government Employees | 155 | 4.1% |
| State Government Employees | 258 | 6.8% |
| Federal Government Employees | 268 | 7.1% |
| Unpaid Family Workers | 0 | 0.0% |
| Total | 3,776 | 100.0% |
Employment Status by Age in Baltimore Highlands
According to the labor force statistics for Baltimore Highlands, out of the total population over 16 years of age (6,475), 62.6% or 4,053 individuals are in the labor force, with 6.0% or 243 of them unemployed. The age group with the highest labor force participation rate is 45 to 54 years, with 95.2% or 894 individuals in the labor force. Within the labor force, the 30 to 34 years age range has the highest percentage of unemployed individuals, with 17.9% or 130 of them being unemployed.
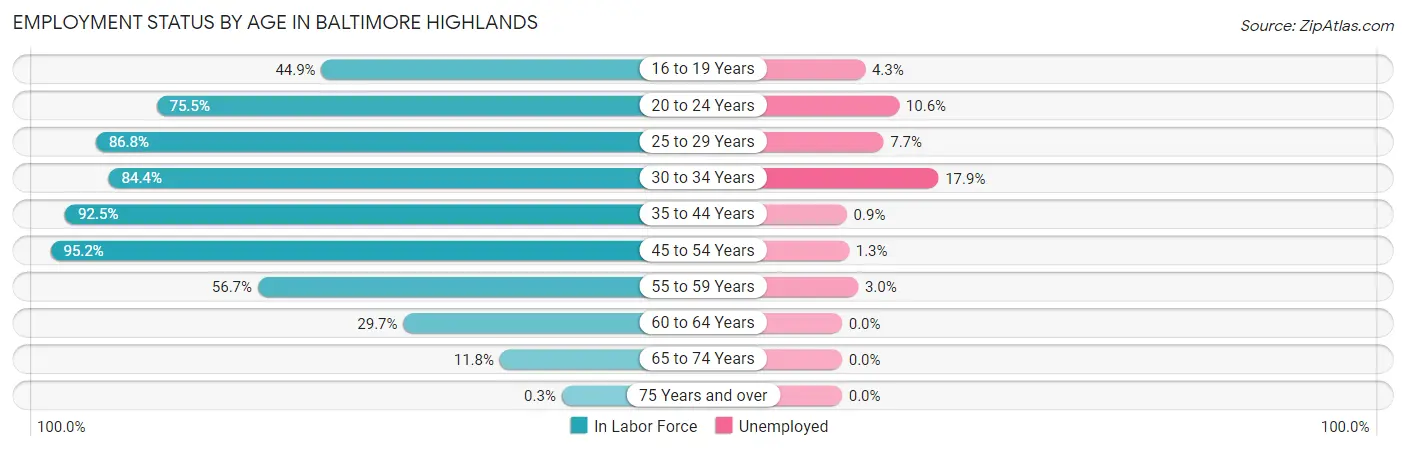
| Age Bracket | In Labor Force | Unemployed |
| 16 to 19 Years | 163 (44.9%) | 7 (4.3%) |
| 20 to 24 Years | 357 (75.5%) | 38 (10.6%) |
| 25 to 29 Years | 561 (86.8%) | 43 (7.7%) |
| 30 to 34 Years | 728 (84.4%) | 130 (17.9%) |
| 35 to 44 Years | 819 (92.5%) | 7 (0.9%) |
| 45 to 54 Years | 894 (95.2%) | 12 (1.3%) |
| 55 to 59 Years | 263 (56.7%) | 8 (3.0%) |
| 60 to 64 Years | 161 (29.7%) | 0 (0.0%) |
| 65 to 74 Years | 106 (11.8%) | 0 (0.0%) |
| 75 Years and over | 1 (0.3%) | 0 (0.0%) |
| Total | 4,053 (62.6%) | 243 (6.0%) |
Employment Status by Educational Attainment in Baltimore Highlands
According to labor force statistics for Baltimore Highlands, 78.9% of individuals (3,424) out of the total population between 25 and 64 years of age (4,340) are in the labor force, with 5.8% or 199 of them being unemployed. The group with the highest labor force participation rate are those with the educational attainment of college / associate degree, with 90.4% or 864 individuals in the labor force. Within the labor force, individuals with college / associate degree education have the highest percentage of unemployment, with 8.2% or 71 of them being unemployed.
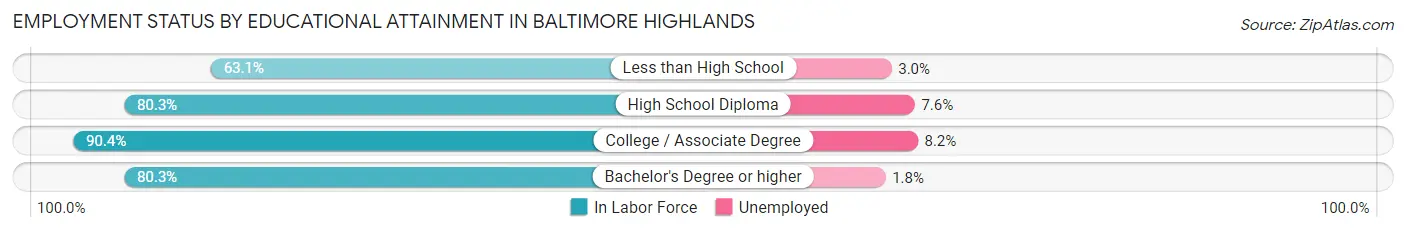
| Educational Attainment | In Labor Force | Unemployed |
| Less than High School | 570 (63.1%) | 27 (3.0%) |
| High School Diploma | 1,307 (80.3%) | 124 (7.6%) |
| College / Associate Degree | 864 (90.4%) | 78 (8.2%) |
| Bachelor's Degree or higher | 684 (80.3%) | 15 (1.8%) |
| Total | 3,424 (78.9%) | 252 (5.8%) |
Employment Occupations by Sex in Baltimore Highlands
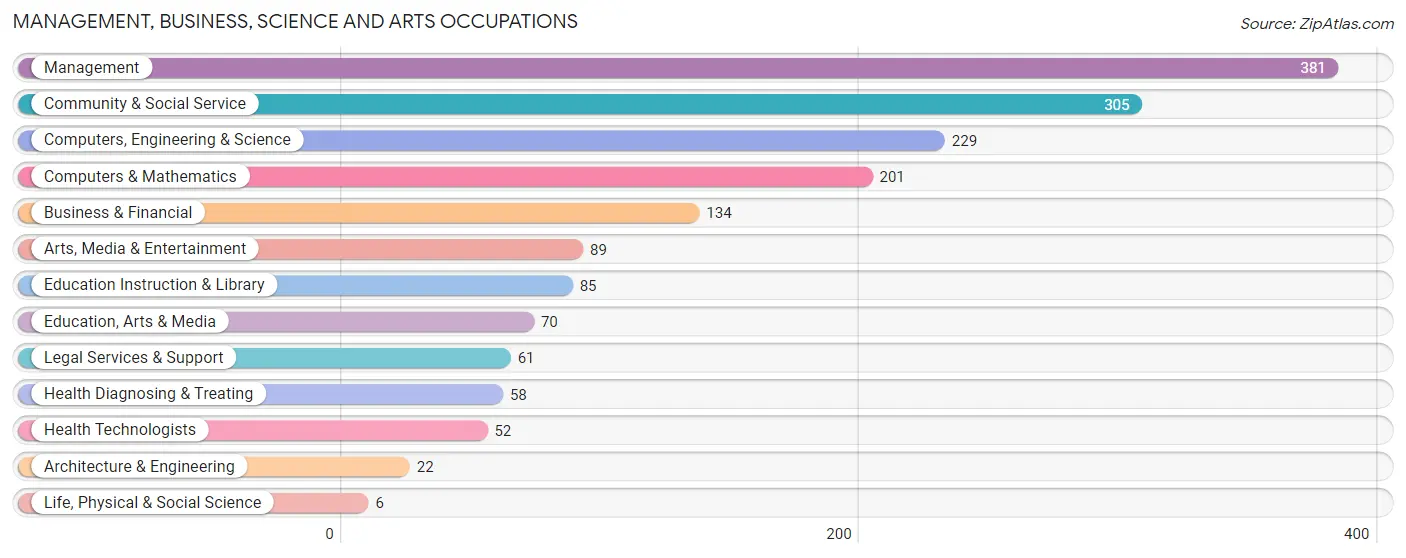
Management, Business, Science and Arts Occupations
The most common Management, Business, Science and Arts occupations in Baltimore Highlands are Management (381 | 10.0%), Community & Social Service (305 | 8.0%), Computers, Engineering & Science (229 | 6.0%), Computers & Mathematics (201 | 5.3%), and Business & Financial (134 | 3.5%).
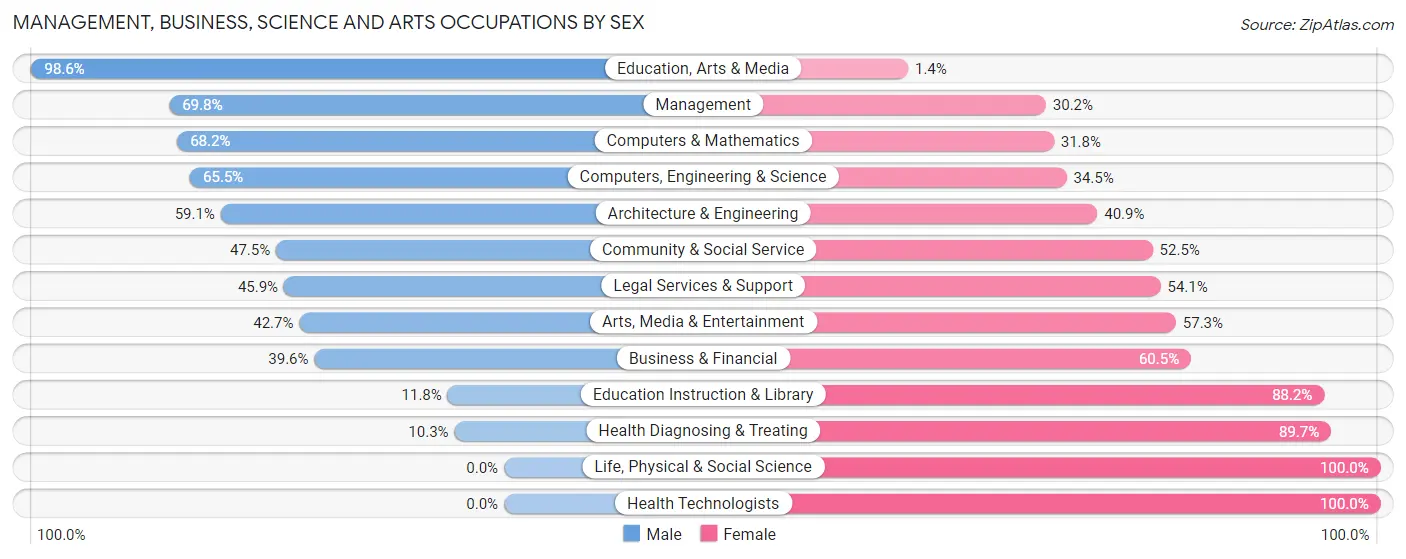
Management, Business, Science and Arts Occupations by Sex
Within the Management, Business, Science and Arts occupations in Baltimore Highlands, the most male-oriented occupations are Education, Arts & Media (98.6%), Management (69.8%), and Computers & Mathematics (68.2%), while the most female-oriented occupations are Life, Physical & Social Science (100.0%), Health Technologists (100.0%), and Health Diagnosing & Treating (89.7%).
| Occupation | Male | Female |
| Management | 266 (69.8%) | 115 (30.2%) |
| Business & Financial | 53 (39.6%) | 81 (60.5%) |
| Computers, Engineering & Science | 150 (65.5%) | 79 (34.5%) |
| Computers & Mathematics | 137 (68.2%) | 64 (31.8%) |
| Architecture & Engineering | 13 (59.1%) | 9 (40.9%) |
| Life, Physical & Social Science | 0 (0.0%) | 6 (100.0%) |
| Community & Social Service | 145 (47.5%) | 160 (52.5%) |
| Education, Arts & Media | 69 (98.6%) | 1 (1.4%) |
| Legal Services & Support | 28 (45.9%) | 33 (54.1%) |
| Education Instruction & Library | 10 (11.8%) | 75 (88.2%) |
| Arts, Media & Entertainment | 38 (42.7%) | 51 (57.3%) |
| Health Diagnosing & Treating | 6 (10.3%) | 52 (89.7%) |
| Health Technologists | 0 (0.0%) | 52 (100.0%) |
| Total (Category) | 620 (56.0%) | 487 (44.0%) |
| Total (Overall) | 2,147 (56.5%) | 1,655 (43.5%) |
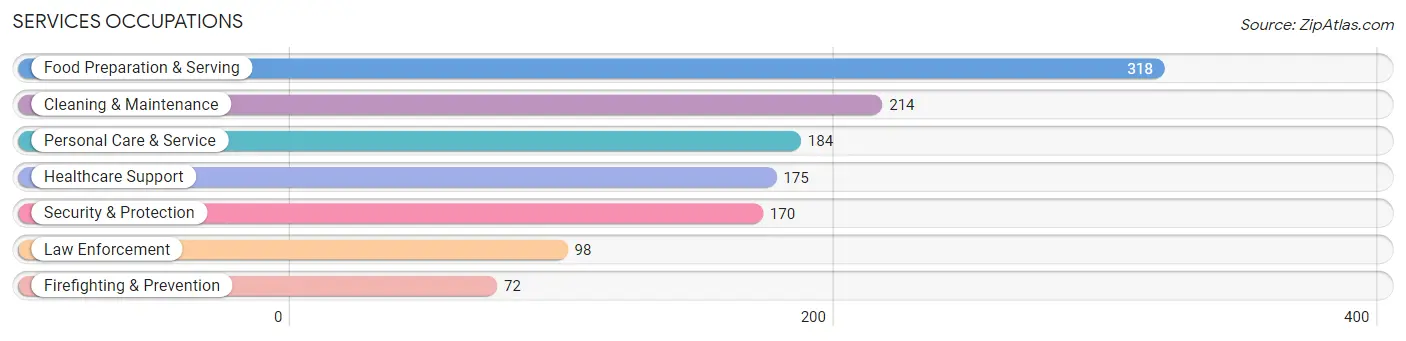
Services Occupations
The most common Services occupations in Baltimore Highlands are Food Preparation & Serving (318 | 8.4%), Cleaning & Maintenance (214 | 5.6%), Personal Care & Service (184 | 4.8%), Healthcare Support (175 | 4.6%), and Security & Protection (170 | 4.5%).
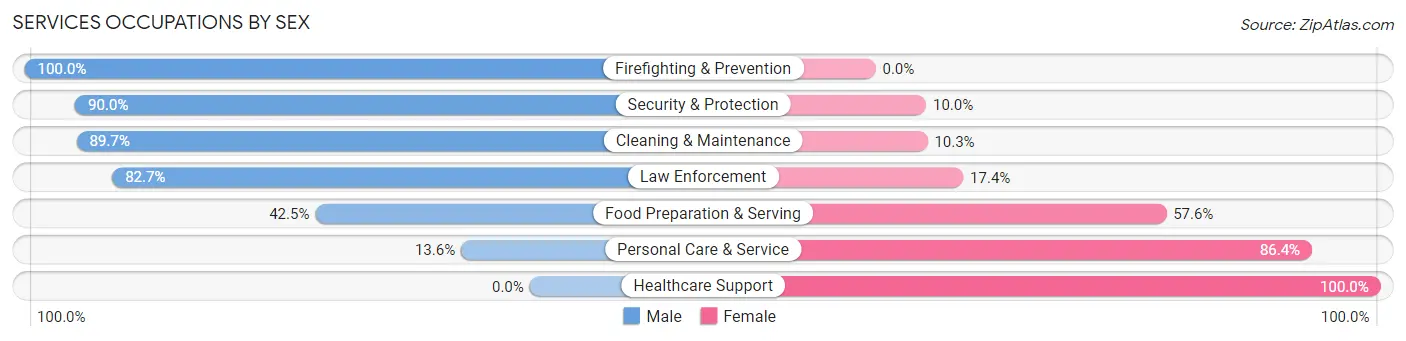
Services Occupations by Sex
Within the Services occupations in Baltimore Highlands, the most male-oriented occupations are Firefighting & Prevention (100.0%), Security & Protection (90.0%), and Cleaning & Maintenance (89.7%), while the most female-oriented occupations are Healthcare Support (100.0%), Personal Care & Service (86.4%), and Food Preparation & Serving (57.6%).
| Occupation | Male | Female |
| Healthcare Support | 0 (0.0%) | 175 (100.0%) |
| Security & Protection | 153 (90.0%) | 17 (10.0%) |
| Firefighting & Prevention | 72 (100.0%) | 0 (0.0%) |
| Law Enforcement | 81 (82.7%) | 17 (17.3%) |
| Food Preparation & Serving | 135 (42.4%) | 183 (57.6%) |
| Cleaning & Maintenance | 192 (89.7%) | 22 (10.3%) |
| Personal Care & Service | 25 (13.6%) | 159 (86.4%) |
| Total (Category) | 505 (47.6%) | 556 (52.4%) |
| Total (Overall) | 2,147 (56.5%) | 1,655 (43.5%) |
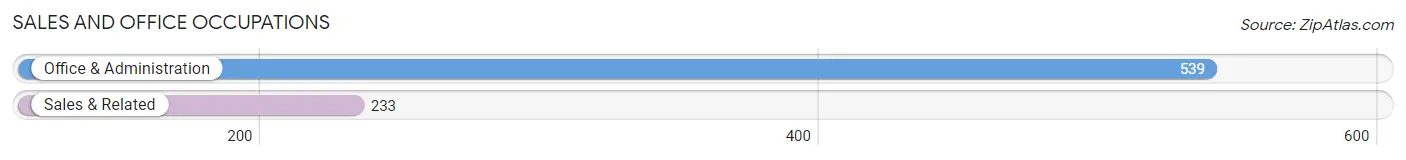
Sales and Office Occupations
The most common Sales and Office occupations in Baltimore Highlands are Office & Administration (539 | 14.2%), and Sales & Related (233 | 6.1%).
Sales and Office Occupations by Sex
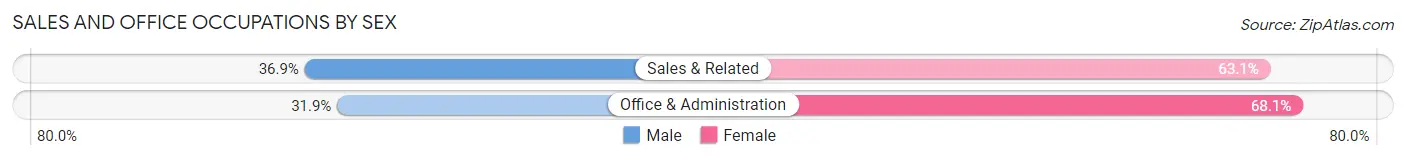
| Occupation | Male | Female |
| Sales & Related | 86 (36.9%) | 147 (63.1%) |
| Office & Administration | 172 (31.9%) | 367 (68.1%) |
| Total (Category) | 258 (33.4%) | 514 (66.6%) |
| Total (Overall) | 2,147 (56.5%) | 1,655 (43.5%) |
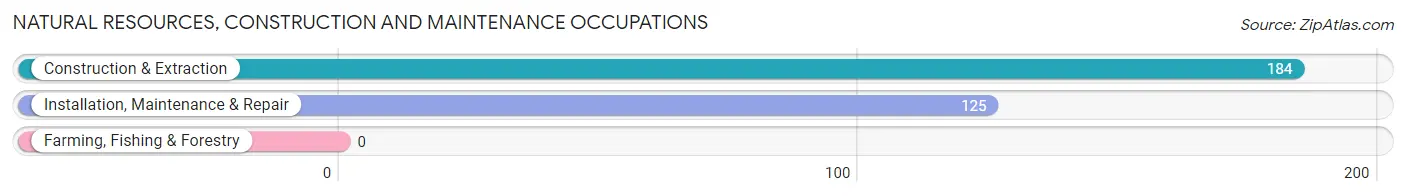
Natural Resources, Construction and Maintenance Occupations
The most common Natural Resources, Construction and Maintenance occupations in Baltimore Highlands are Construction & Extraction (184 | 4.8%), and Installation, Maintenance & Repair (125 | 3.3%).
Natural Resources, Construction and Maintenance Occupations by Sex
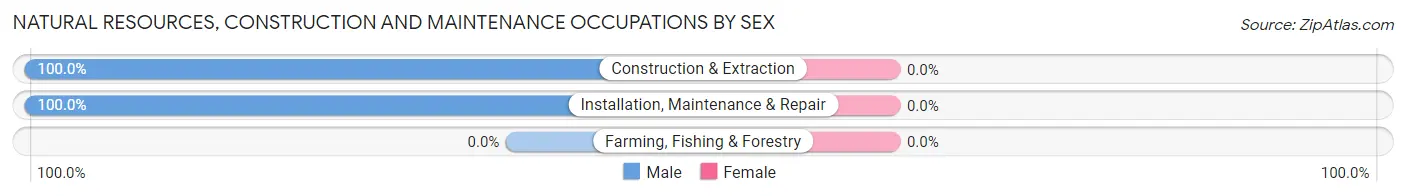
| Occupation | Male | Female |
| Farming, Fishing & Forestry | 0 (0.0%) | 0 (0.0%) |
| Construction & Extraction | 184 (100.0%) | 0 (0.0%) |
| Installation, Maintenance & Repair | 125 (100.0%) | 0 (0.0%) |
| Total (Category) | 309 (100.0%) | 0 (0.0%) |
| Total (Overall) | 2,147 (56.5%) | 1,655 (43.5%) |
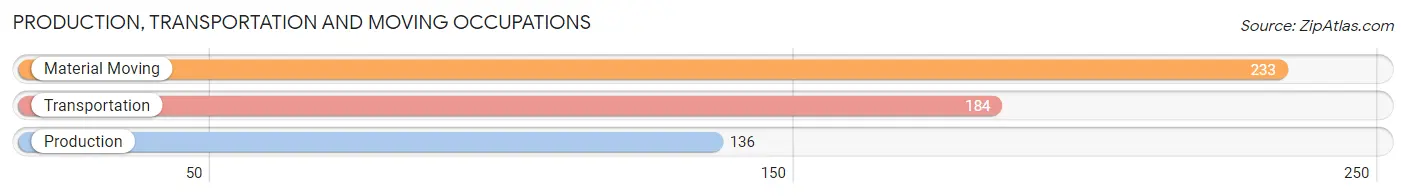
Production, Transportation and Moving Occupations
The most common Production, Transportation and Moving occupations in Baltimore Highlands are Material Moving (233 | 6.1%), Transportation (184 | 4.8%), and Production (136 | 3.6%).
Production, Transportation and Moving Occupations by Sex
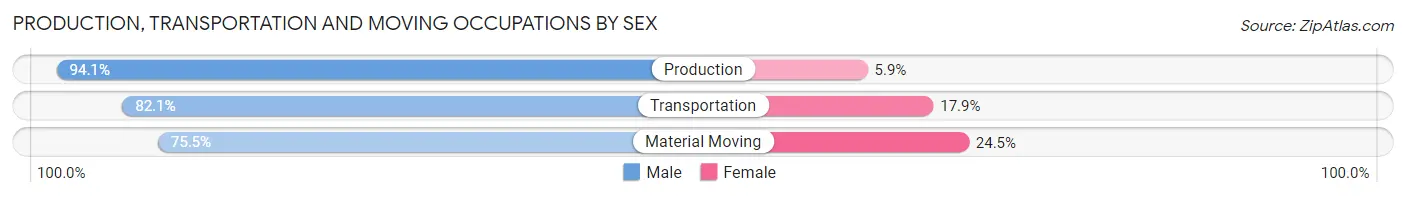
| Occupation | Male | Female |
| Production | 128 (94.1%) | 8 (5.9%) |
| Transportation | 151 (82.1%) | 33 (17.9%) |
| Material Moving | 176 (75.5%) | 57 (24.5%) |
| Total (Category) | 455 (82.3%) | 98 (17.7%) |
| Total (Overall) | 2,147 (56.5%) | 1,655 (43.5%) |
Employment Industries by Sex in Baltimore Highlands
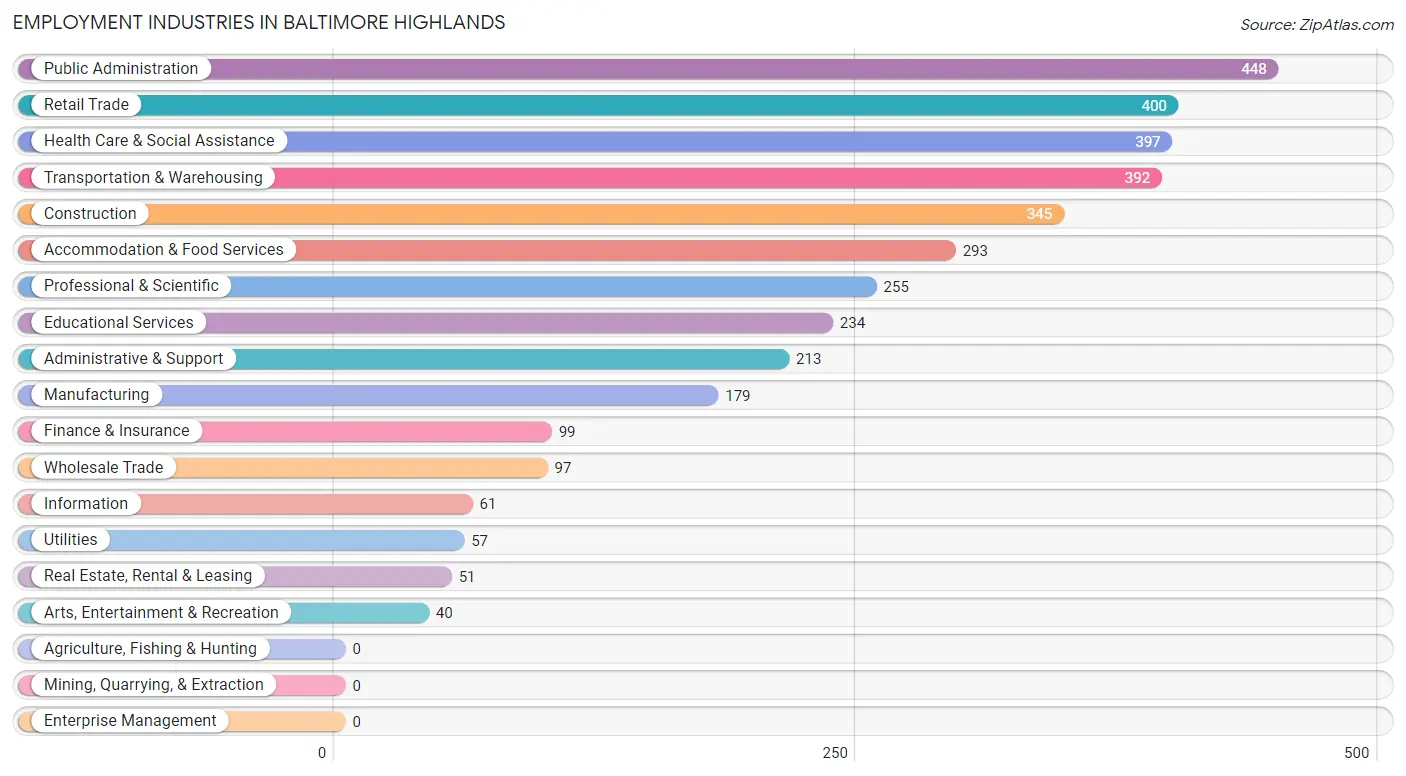
Employment Industries in Baltimore Highlands
The major employment industries in Baltimore Highlands include Public Administration (448 | 11.8%), Retail Trade (400 | 10.5%), Health Care & Social Assistance (397 | 10.4%), Transportation & Warehousing (392 | 10.3%), and Construction (345 | 9.1%).
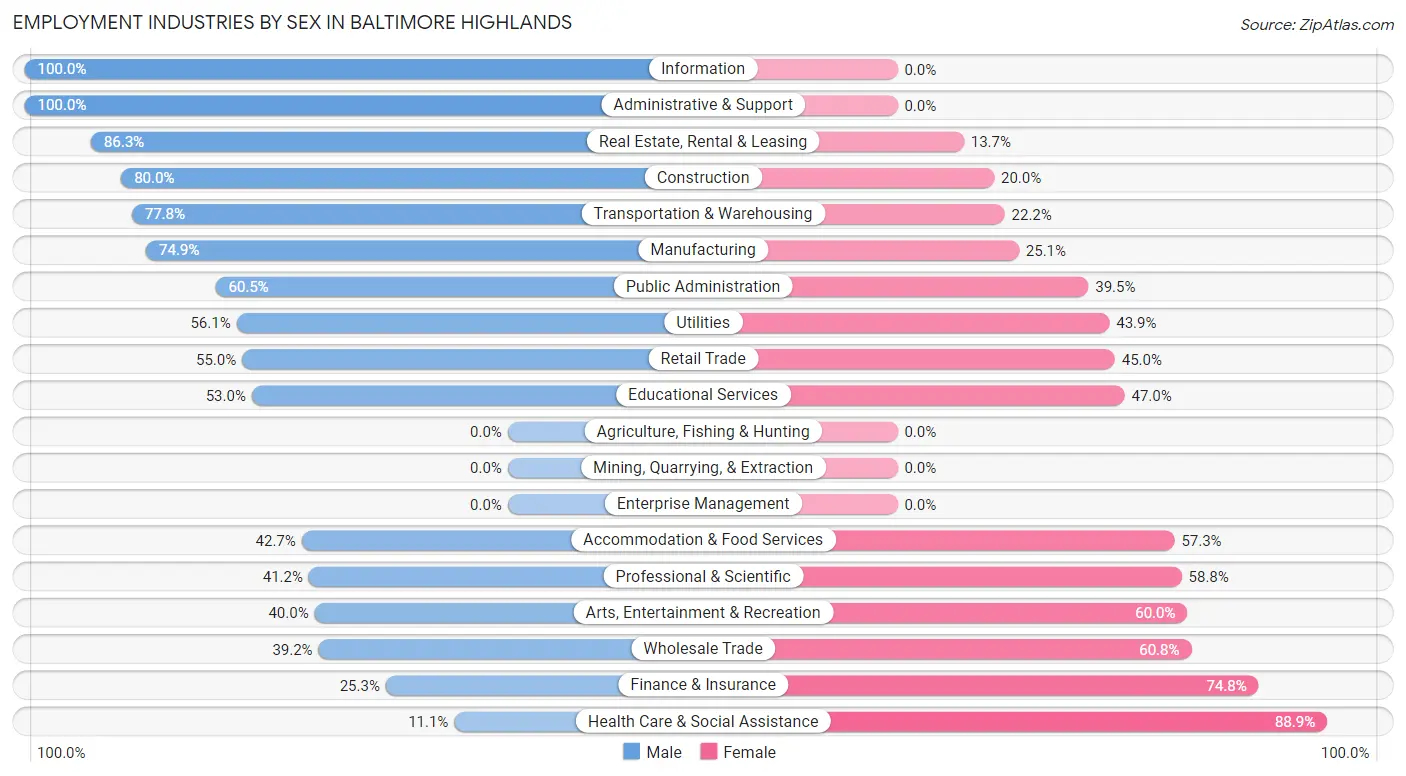
Employment Industries by Sex in Baltimore Highlands
The Baltimore Highlands industries that see more men than women are Information (100.0%), Administrative & Support (100.0%), and Real Estate, Rental & Leasing (86.3%), whereas the industries that tend to have a higher number of women are Health Care & Social Assistance (88.9%), Finance & Insurance (74.8%), and Wholesale Trade (60.8%).
| Industry | Male | Female |
| Agriculture, Fishing & Hunting | 0 (0.0%) | 0 (0.0%) |
| Mining, Quarrying, & Extraction | 0 (0.0%) | 0 (0.0%) |
| Construction | 276 (80.0%) | 69 (20.0%) |
| Manufacturing | 134 (74.9%) | 45 (25.1%) |
| Wholesale Trade | 38 (39.2%) | 59 (60.8%) |
| Retail Trade | 220 (55.0%) | 180 (45.0%) |
| Transportation & Warehousing | 305 (77.8%) | 87 (22.2%) |
| Utilities | 32 (56.1%) | 25 (43.9%) |
| Information | 61 (100.0%) | 0 (0.0%) |
| Finance & Insurance | 25 (25.3%) | 74 (74.8%) |
| Real Estate, Rental & Leasing | 44 (86.3%) | 7 (13.7%) |
| Professional & Scientific | 105 (41.2%) | 150 (58.8%) |
| Enterprise Management | 0 (0.0%) | 0 (0.0%) |
| Administrative & Support | 213 (100.0%) | 0 (0.0%) |
| Educational Services | 124 (53.0%) | 110 (47.0%) |
| Health Care & Social Assistance | 44 (11.1%) | 353 (88.9%) |
| Arts, Entertainment & Recreation | 16 (40.0%) | 24 (60.0%) |
| Accommodation & Food Services | 125 (42.7%) | 168 (57.3%) |
| Public Administration | 271 (60.5%) | 177 (39.5%) |
| Total | 2,147 (56.5%) | 1,655 (43.5%) |
Education in Baltimore Highlands
School Enrollment in Baltimore Highlands
The most common levels of schooling among the 2,006 students in Baltimore Highlands are middle school (402 | 20.0%), elementary school (397 | 19.8%), and college / undergraduate (370 | 18.4%).
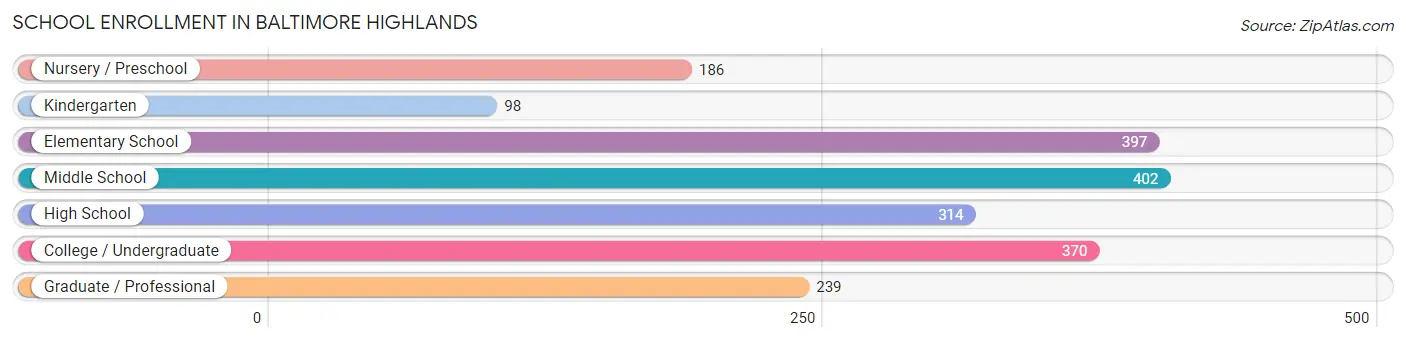
| School Level | # Students | % Students |
| Nursery / Preschool | 186 | 9.3% |
| Kindergarten | 98 | 4.9% |
| Elementary School | 397 | 19.8% |
| Middle School | 402 | 20.0% |
| High School | 314 | 15.7% |
| College / Undergraduate | 370 | 18.4% |
| Graduate / Professional | 239 | 11.9% |
| Total | 2,006 | 100.0% |
School Enrollment by Age by Funding Source in Baltimore Highlands
Out of a total of 2,006 students who are enrolled in schools in Baltimore Highlands, 229 (11.4%) attend a private institution, while the remaining 1,777 (88.6%) are enrolled in public schools. The age group of 25 to 34 year olds has the highest likelihood of being enrolled in private schools, with 83 (61.5% in the age bracket) enrolled. Conversely, the age group of 3 to 4 year olds has the lowest likelihood of being enrolled in a private school, with 128 (100.0% in the age bracket) attending a public institution.
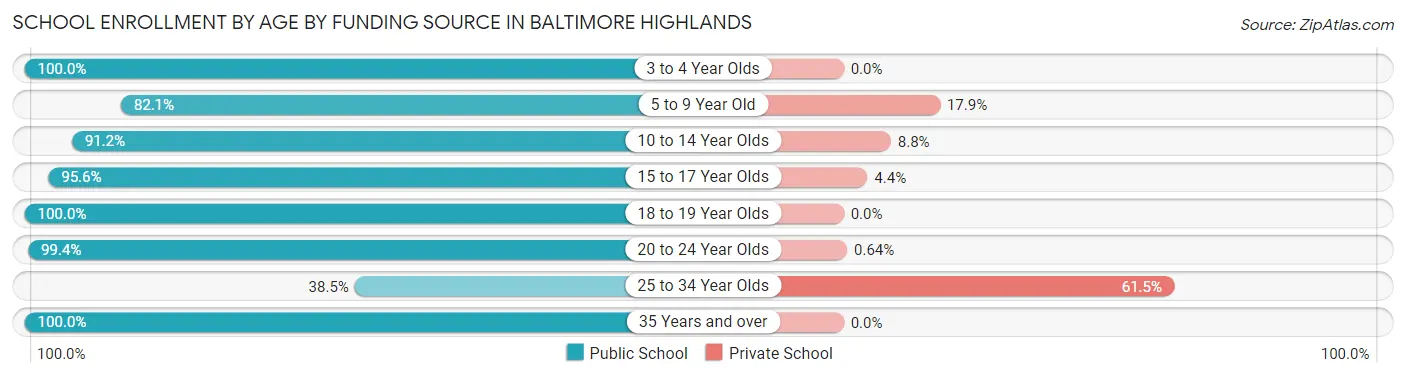
| Age Bracket | Public School | Private School |
| 3 to 4 Year Olds | 128 (100.0%) | 0 (0.0%) |
| 5 to 9 Year Old | 430 (82.1%) | 94 (17.9%) |
| 10 to 14 Year Olds | 415 (91.2%) | 40 (8.8%) |
| 15 to 17 Year Olds | 238 (95.6%) | 11 (4.4%) |
| 18 to 19 Year Olds | 123 (100.0%) | 0 (0.0%) |
| 20 to 24 Year Olds | 156 (99.4%) | 1 (0.6%) |
| 25 to 34 Year Olds | 52 (38.5%) | 83 (61.5%) |
| 35 Years and over | 235 (100.0%) | 0 (0.0%) |
| Total | 1,777 (88.6%) | 229 (11.4%) |
Educational Attainment by Field of Study in Baltimore Highlands
Education (313 | 25.7%), business (155 | 12.7%), arts & humanities (121 | 9.9%), science & technology (110 | 9.0%), and engineering (109 | 8.9%) are the most common fields of study among 1,218 individuals in Baltimore Highlands who have obtained a bachelor's degree or higher.
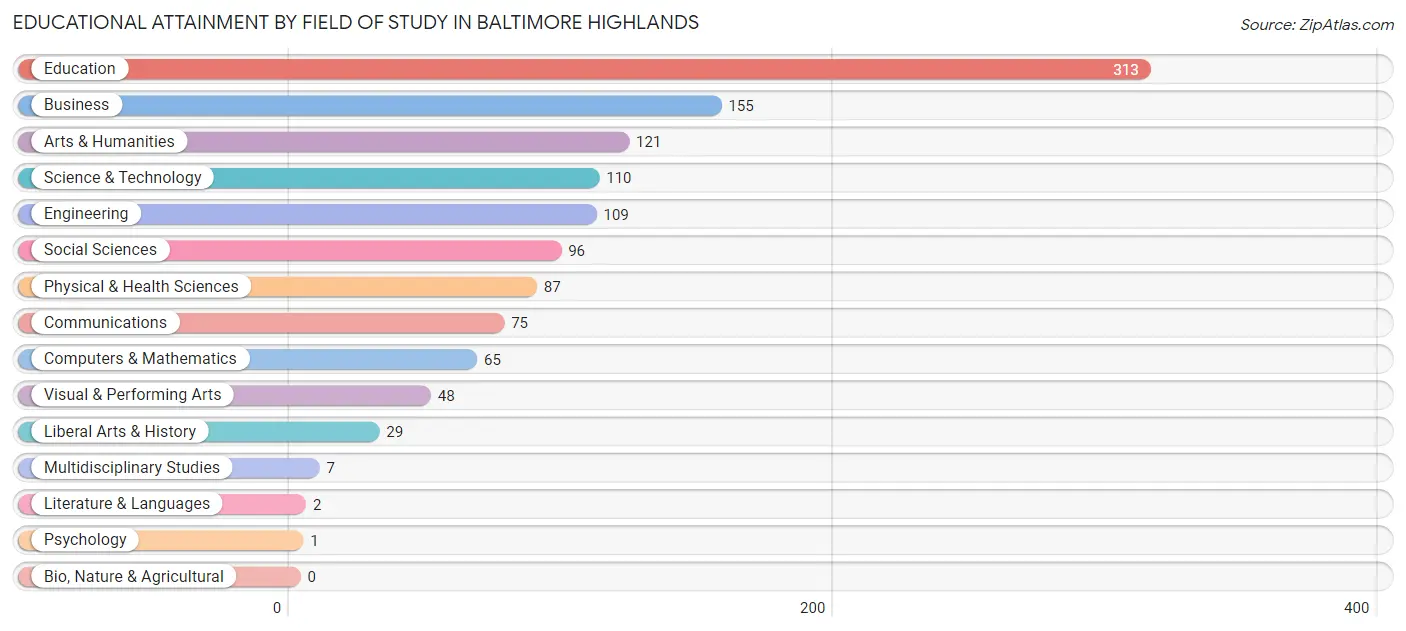
| Field of Study | # Graduates | % Graduates |
| Computers & Mathematics | 65 | 5.3% |
| Bio, Nature & Agricultural | 0 | 0.0% |
| Physical & Health Sciences | 87 | 7.1% |
| Psychology | 1 | 0.1% |
| Social Sciences | 96 | 7.9% |
| Engineering | 109 | 8.9% |
| Multidisciplinary Studies | 7 | 0.6% |
| Science & Technology | 110 | 9.0% |
| Business | 155 | 12.7% |
| Education | 313 | 25.7% |
| Literature & Languages | 2 | 0.2% |
| Liberal Arts & History | 29 | 2.4% |
| Visual & Performing Arts | 48 | 3.9% |
| Communications | 75 | 6.2% |
| Arts & Humanities | 121 | 9.9% |
| Total | 1,218 | 100.0% |
Transportation & Commute in Baltimore Highlands
Vehicle Availability by Sex in Baltimore Highlands
The most prevalent vehicle ownership categories in Baltimore Highlands are males with 2 vehicles (740, accounting for 34.5%) and females with 2 vehicles (422, making up 45.4%).
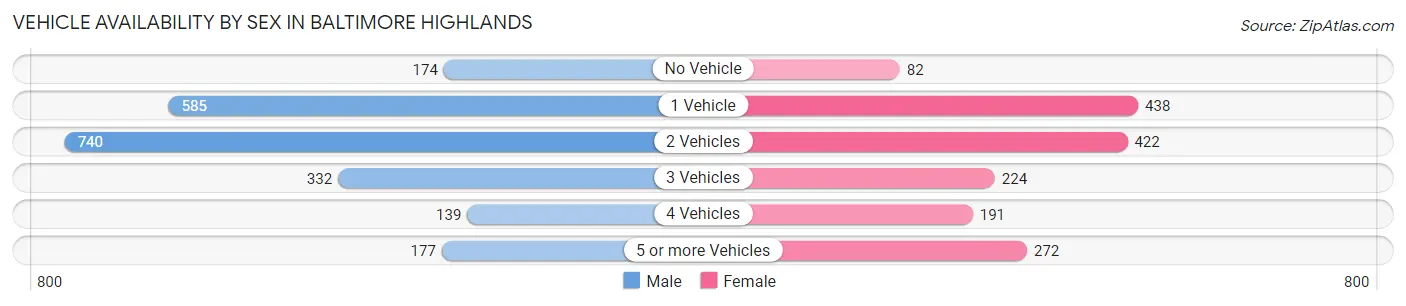
| Vehicles Available | Male | Female |
| No Vehicle | 174 (8.1%) | 82 (5.0%) |
| 1 Vehicle | 585 (27.3%) | 438 (26.9%) |
| 2 Vehicles | 740 (34.5%) | 422 (25.9%) |
| 3 Vehicles | 332 (15.5%) | 224 (13.8%) |
| 4 Vehicles | 139 (6.5%) | 191 (11.7%) |
| 5 or more Vehicles | 177 (8.2%) | 272 (16.7%) |
| Total | 2,147 (100.0%) | 1,629 (100.0%) |
Commute Time in Baltimore Highlands
The most frequently occuring commute durations in Baltimore Highlands are 30 to 34 minutes (884 commuters, 24.5%), 15 to 19 minutes (691 commuters, 19.2%), and 20 to 24 minutes (679 commuters, 18.9%).
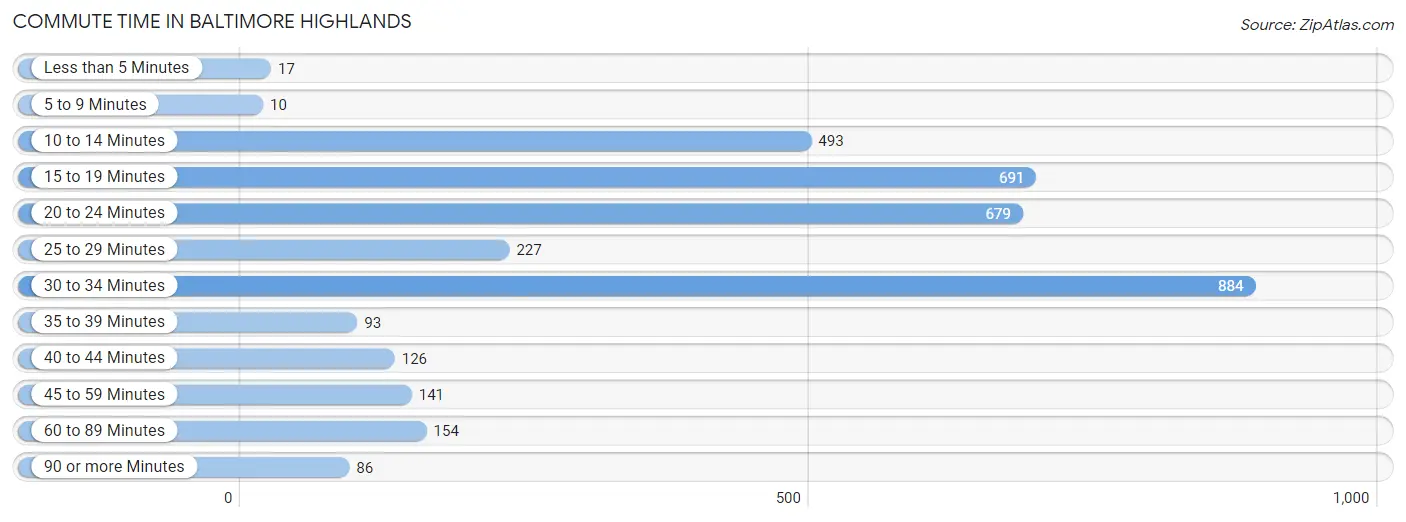
| Commute Time | # Commuters | % Commuters |
| Less than 5 Minutes | 17 | 0.5% |
| 5 to 9 Minutes | 10 | 0.3% |
| 10 to 14 Minutes | 493 | 13.7% |
| 15 to 19 Minutes | 691 | 19.2% |
| 20 to 24 Minutes | 679 | 18.9% |
| 25 to 29 Minutes | 227 | 6.3% |
| 30 to 34 Minutes | 884 | 24.5% |
| 35 to 39 Minutes | 93 | 2.6% |
| 40 to 44 Minutes | 126 | 3.5% |
| 45 to 59 Minutes | 141 | 3.9% |
| 60 to 89 Minutes | 154 | 4.3% |
| 90 or more Minutes | 86 | 2.4% |
Commute Time by Sex in Baltimore Highlands
The most common commute times in Baltimore Highlands are 30 to 34 minutes (532 commuters, 26.3%) for males and 15 to 19 minutes (356 commuters, 22.6%) for females.
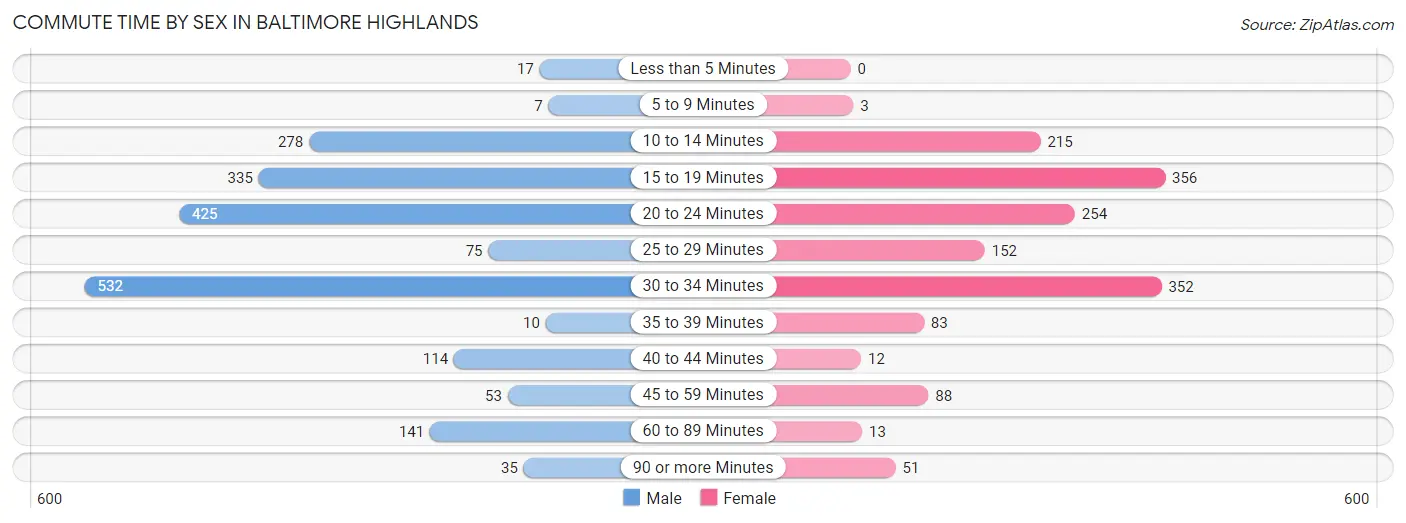
| Commute Time | Male | Female |
| Less than 5 Minutes | 17 (0.8%) | 0 (0.0%) |
| 5 to 9 Minutes | 7 (0.4%) | 3 (0.2%) |
| 10 to 14 Minutes | 278 (13.8%) | 215 (13.6%) |
| 15 to 19 Minutes | 335 (16.6%) | 356 (22.6%) |
| 20 to 24 Minutes | 425 (21.0%) | 254 (16.1%) |
| 25 to 29 Minutes | 75 (3.7%) | 152 (9.6%) |
| 30 to 34 Minutes | 532 (26.3%) | 352 (22.3%) |
| 35 to 39 Minutes | 10 (0.5%) | 83 (5.3%) |
| 40 to 44 Minutes | 114 (5.6%) | 12 (0.8%) |
| 45 to 59 Minutes | 53 (2.6%) | 88 (5.6%) |
| 60 to 89 Minutes | 141 (7.0%) | 13 (0.8%) |
| 90 or more Minutes | 35 (1.7%) | 51 (3.2%) |
Time of Departure to Work by Sex in Baltimore Highlands
The most frequent times of departure to work in Baltimore Highlands are 7:00 AM to 7:29 AM (286, 14.1%) for males and 12:00 PM to 3:59 PM (211, 13.4%) for females.
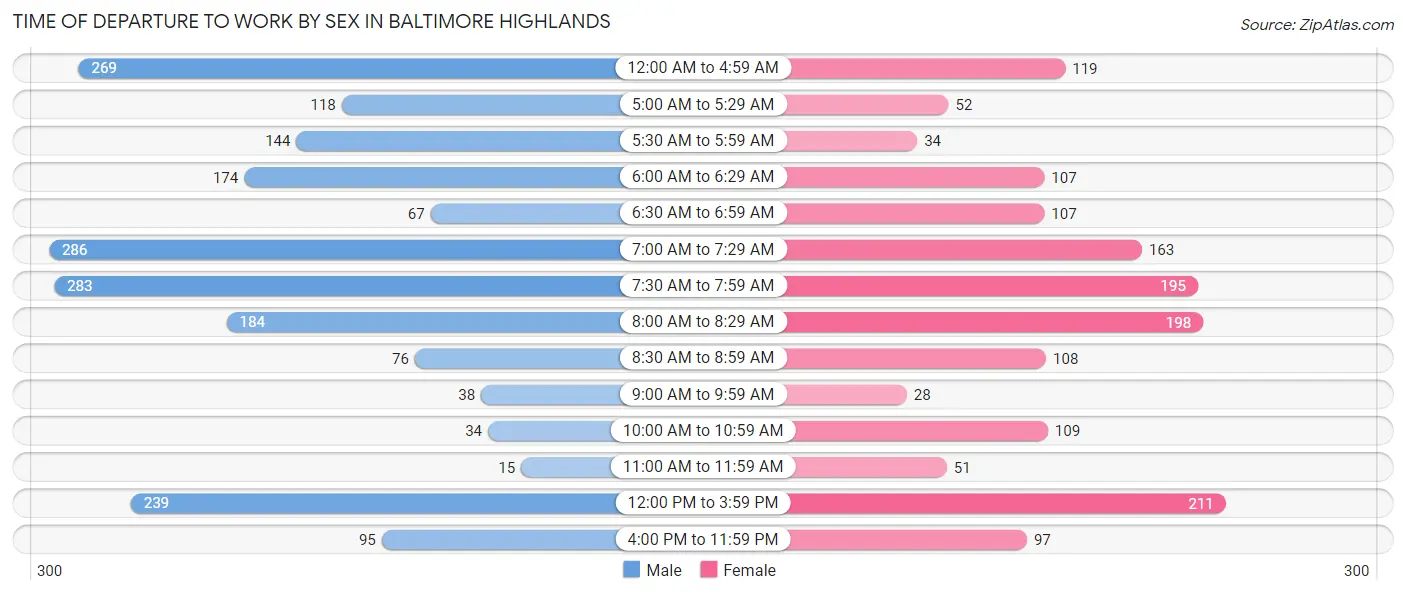
| Time of Departure | Male | Female |
| 12:00 AM to 4:59 AM | 269 (13.3%) | 119 (7.5%) |
| 5:00 AM to 5:29 AM | 118 (5.8%) | 52 (3.3%) |
| 5:30 AM to 5:59 AM | 144 (7.1%) | 34 (2.1%) |
| 6:00 AM to 6:29 AM | 174 (8.6%) | 107 (6.8%) |
| 6:30 AM to 6:59 AM | 67 (3.3%) | 107 (6.8%) |
| 7:00 AM to 7:29 AM | 286 (14.1%) | 163 (10.3%) |
| 7:30 AM to 7:59 AM | 283 (14.0%) | 195 (12.3%) |
| 8:00 AM to 8:29 AM | 184 (9.1%) | 198 (12.5%) |
| 8:30 AM to 8:59 AM | 76 (3.8%) | 108 (6.8%) |
| 9:00 AM to 9:59 AM | 38 (1.9%) | 28 (1.8%) |
| 10:00 AM to 10:59 AM | 34 (1.7%) | 109 (6.9%) |
| 11:00 AM to 11:59 AM | 15 (0.7%) | 51 (3.2%) |
| 12:00 PM to 3:59 PM | 239 (11.8%) | 211 (13.4%) |
| 4:00 PM to 11:59 PM | 95 (4.7%) | 97 (6.1%) |
| Total | 2,022 (100.0%) | 1,579 (100.0%) |
Housing Occupancy in Baltimore Highlands
Occupancy by Ownership in Baltimore Highlands
Of the total 2,959 dwellings in Baltimore Highlands, owner-occupied units account for 1,657 (56.0%), while renter-occupied units make up 1,302 (44.0%).
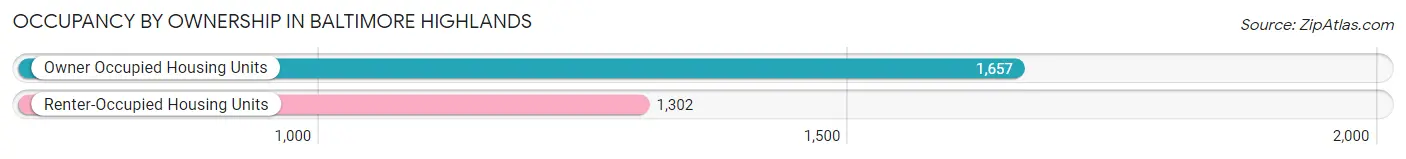
| Occupancy | # Housing Units | % Housing Units |
| Owner Occupied Housing Units | 1,657 | 56.0% |
| Renter-Occupied Housing Units | 1,302 | 44.0% |
| Total Occupied Housing Units | 2,959 | 100.0% |
Occupancy by Household Size in Baltimore Highlands
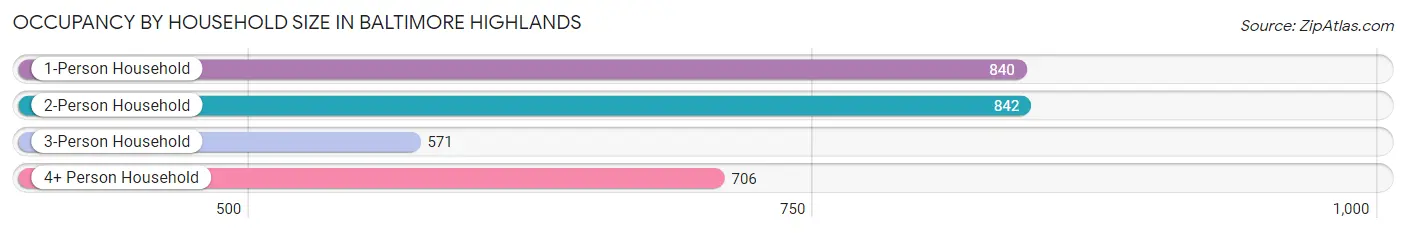
| Household Size | # Housing Units | % Housing Units |
| 1-Person Household | 840 | 28.4% |
| 2-Person Household | 842 | 28.5% |
| 3-Person Household | 571 | 19.3% |
| 4+ Person Household | 706 | 23.9% |
| Total Housing Units | 2,959 | 100.0% |
Occupancy by Ownership by Household Size in Baltimore Highlands
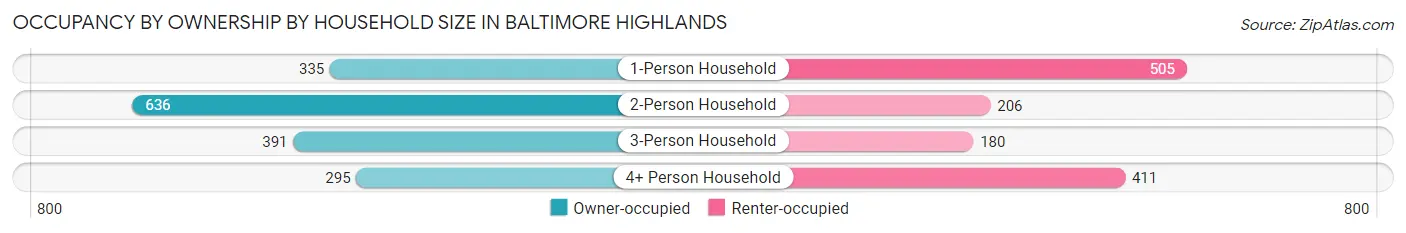
| Household Size | Owner-occupied | Renter-occupied |
| 1-Person Household | 335 (39.9%) | 505 (60.1%) |
| 2-Person Household | 636 (75.5%) | 206 (24.5%) |
| 3-Person Household | 391 (68.5%) | 180 (31.5%) |
| 4+ Person Household | 295 (41.8%) | 411 (58.2%) |
| Total Housing Units | 1,657 (56.0%) | 1,302 (44.0%) |
Occupancy by Educational Attainment in Baltimore Highlands
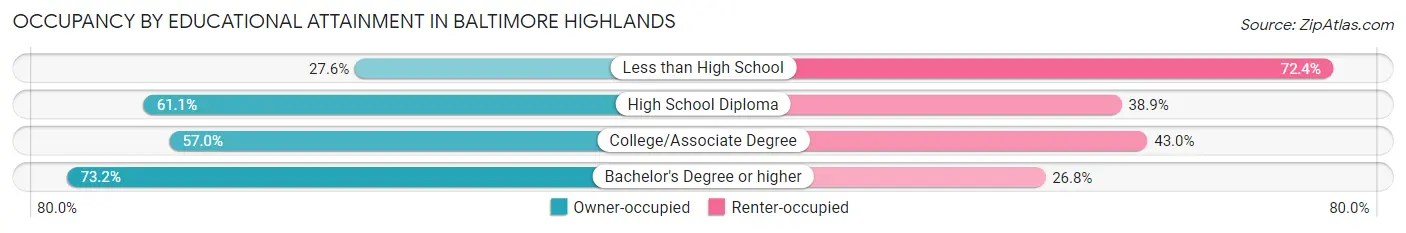
| Household Size | Owner-occupied | Renter-occupied |
| Less than High School | 163 (27.6%) | 428 (72.4%) |
| High School Diploma | 686 (61.1%) | 437 (38.9%) |
| College/Associate Degree | 363 (57.0%) | 274 (43.0%) |
| Bachelor's Degree or higher | 445 (73.2%) | 163 (26.8%) |
Occupancy by Age of Householder in Baltimore Highlands
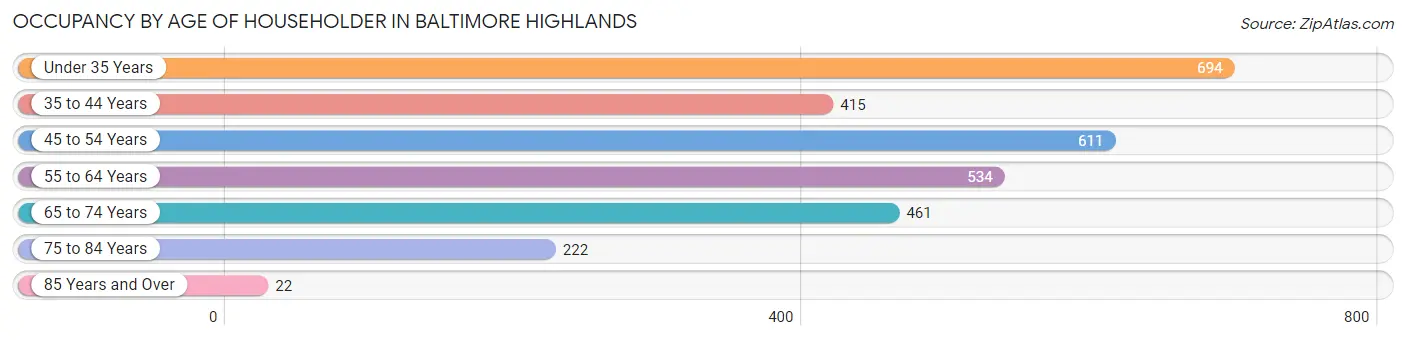
| Age Bracket | # Households | % Households |
| Under 35 Years | 694 | 23.4% |
| 35 to 44 Years | 415 | 14.0% |
| 45 to 54 Years | 611 | 20.6% |
| 55 to 64 Years | 534 | 18.0% |
| 65 to 74 Years | 461 | 15.6% |
| 75 to 84 Years | 222 | 7.5% |
| 85 Years and Over | 22 | 0.7% |
| Total | 2,959 | 100.0% |
Housing Finances in Baltimore Highlands
Median Income by Occupancy in Baltimore Highlands
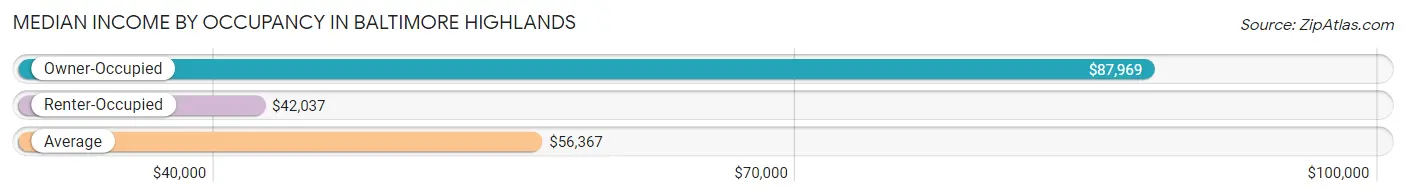
| Occupancy Type | # Households | Median Income |
| Owner-Occupied | 1,657 (56.0%) | $87,969 |
| Renter-Occupied | 1,302 (44.0%) | $42,037 |
| Average | 2,959 (100.0%) | $56,367 |
Occupancy by Householder Income Bracket in Baltimore Highlands
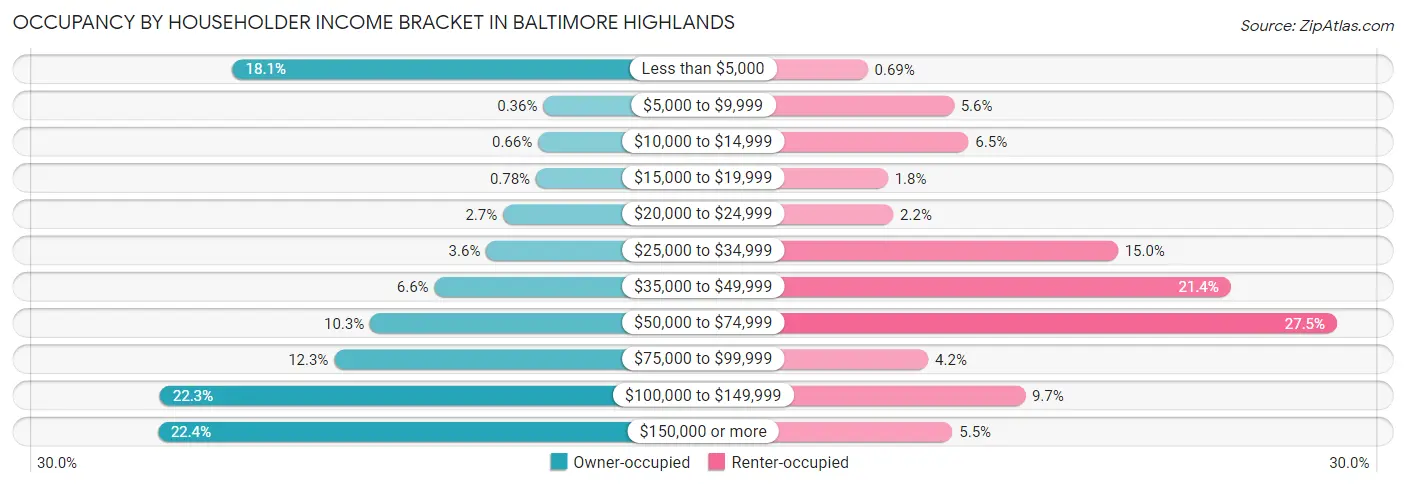
| Income Bracket | Owner-occupied | Renter-occupied |
| Less than $5,000 | 300 (18.1%) | 9 (0.7%) |
| $5,000 to $9,999 | 6 (0.4%) | 73 (5.6%) |
| $10,000 to $14,999 | 11 (0.7%) | 84 (6.5%) |
| $15,000 to $19,999 | 13 (0.8%) | 24 (1.8%) |
| $20,000 to $24,999 | 44 (2.7%) | 28 (2.1%) |
| $25,000 to $34,999 | 60 (3.6%) | 195 (15.0%) |
| $35,000 to $49,999 | 109 (6.6%) | 279 (21.4%) |
| $50,000 to $74,999 | 170 (10.3%) | 358 (27.5%) |
| $75,000 to $99,999 | 204 (12.3%) | 54 (4.2%) |
| $100,000 to $149,999 | 369 (22.3%) | 126 (9.7%) |
| $150,000 or more | 371 (22.4%) | 72 (5.5%) |
| Total | 1,657 (100.0%) | 1,302 (100.0%) |
Monthly Housing Cost Tiers in Baltimore Highlands
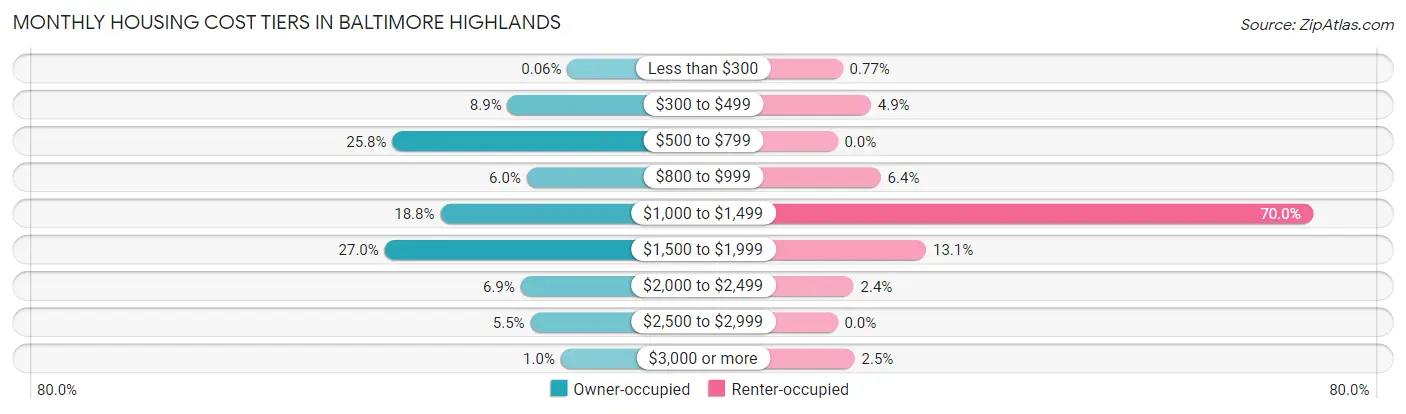
| Monthly Cost | Owner-occupied | Renter-occupied |
| Less than $300 | 1 (0.1%) | 10 (0.8%) |
| $300 to $499 | 147 (8.9%) | 64 (4.9%) |
| $500 to $799 | 428 (25.8%) | 0 (0.0%) |
| $800 to $999 | 100 (6.0%) | 83 (6.4%) |
| $1,000 to $1,499 | 311 (18.8%) | 911 (70.0%) |
| $1,500 to $1,999 | 447 (27.0%) | 170 (13.1%) |
| $2,000 to $2,499 | 115 (6.9%) | 31 (2.4%) |
| $2,500 to $2,999 | 91 (5.5%) | 0 (0.0%) |
| $3,000 or more | 17 (1.0%) | 33 (2.5%) |
| Total | 1,657 (100.0%) | 1,302 (100.0%) |
Physical Housing Characteristics in Baltimore Highlands
Housing Structures in Baltimore Highlands
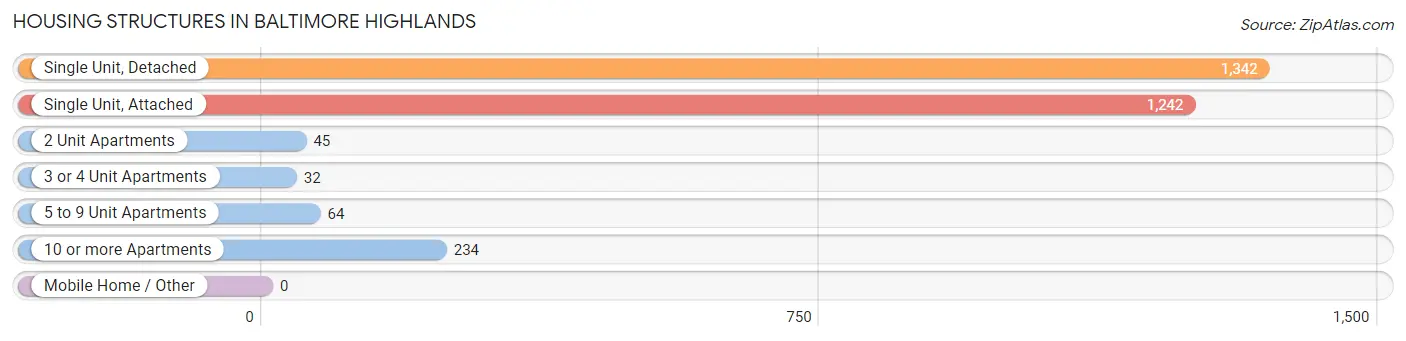
| Structure Type | # Housing Units | % Housing Units |
| Single Unit, Detached | 1,342 | 45.4% |
| Single Unit, Attached | 1,242 | 42.0% |
| 2 Unit Apartments | 45 | 1.5% |
| 3 or 4 Unit Apartments | 32 | 1.1% |
| 5 to 9 Unit Apartments | 64 | 2.2% |
| 10 or more Apartments | 234 | 7.9% |
| Mobile Home / Other | 0 | 0.0% |
| Total | 2,959 | 100.0% |
Housing Structures by Occupancy in Baltimore Highlands
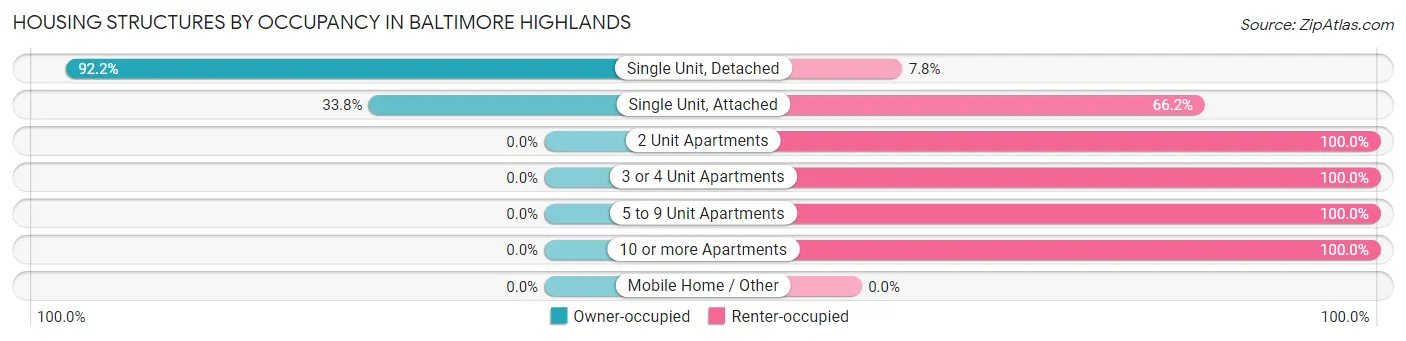
| Structure Type | Owner-occupied | Renter-occupied |
| Single Unit, Detached | 1,237 (92.2%) | 105 (7.8%) |
| Single Unit, Attached | 420 (33.8%) | 822 (66.2%) |
| 2 Unit Apartments | 0 (0.0%) | 45 (100.0%) |
| 3 or 4 Unit Apartments | 0 (0.0%) | 32 (100.0%) |
| 5 to 9 Unit Apartments | 0 (0.0%) | 64 (100.0%) |
| 10 or more Apartments | 0 (0.0%) | 234 (100.0%) |
| Mobile Home / Other | 0 (0.0%) | 0 (0.0%) |
| Total | 1,657 (56.0%) | 1,302 (44.0%) |
Housing Structures by Number of Rooms in Baltimore Highlands
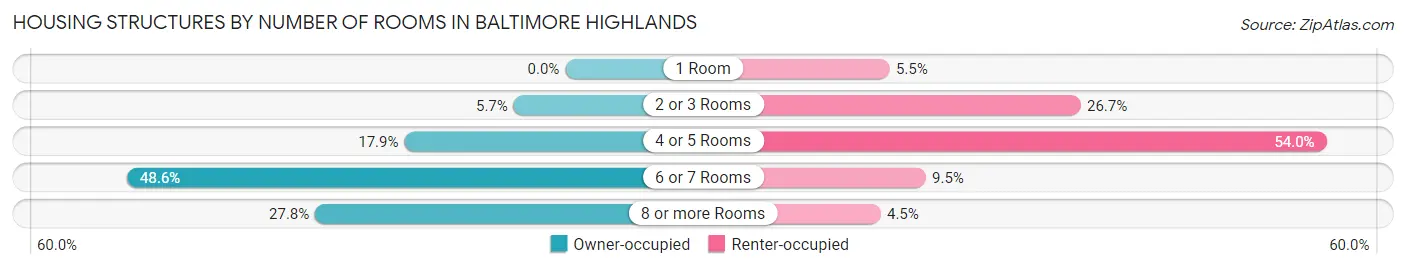
| Number of Rooms | Owner-occupied | Renter-occupied |
| 1 Room | 0 (0.0%) | 71 (5.4%) |
| 2 or 3 Rooms | 95 (5.7%) | 347 (26.7%) |
| 4 or 5 Rooms | 296 (17.9%) | 703 (54.0%) |
| 6 or 7 Rooms | 806 (48.6%) | 123 (9.5%) |
| 8 or more Rooms | 460 (27.8%) | 58 (4.4%) |
| Total | 1,657 (100.0%) | 1,302 (100.0%) |
Housing Structure by Heating Type in Baltimore Highlands
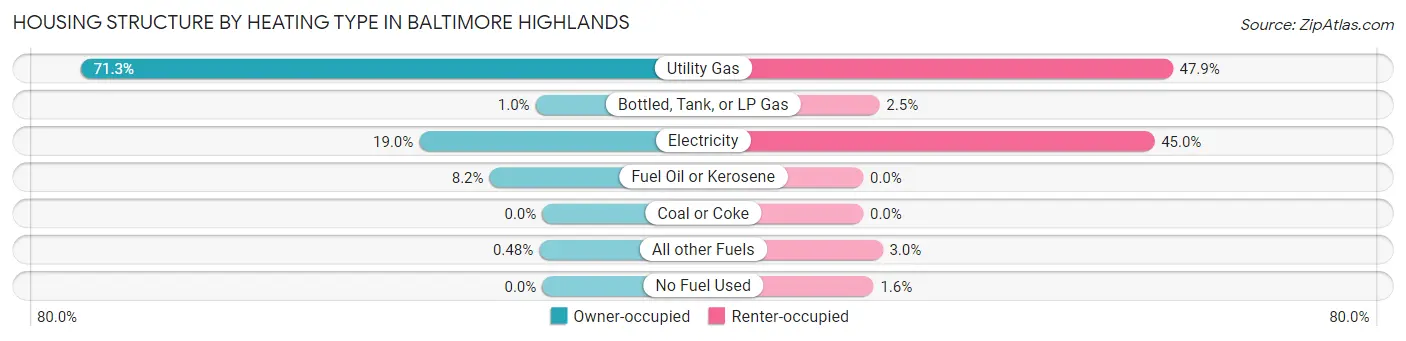
| Heating Type | Owner-occupied | Renter-occupied |
| Utility Gas | 1,182 (71.3%) | 623 (47.8%) |
| Bottled, Tank, or LP Gas | 17 (1.0%) | 33 (2.5%) |
| Electricity | 315 (19.0%) | 586 (45.0%) |
| Fuel Oil or Kerosene | 135 (8.2%) | 0 (0.0%) |
| Coal or Coke | 0 (0.0%) | 0 (0.0%) |
| All other Fuels | 8 (0.5%) | 39 (3.0%) |
| No Fuel Used | 0 (0.0%) | 21 (1.6%) |
| Total | 1,657 (100.0%) | 1,302 (100.0%) |
Household Vehicle Usage in Baltimore Highlands
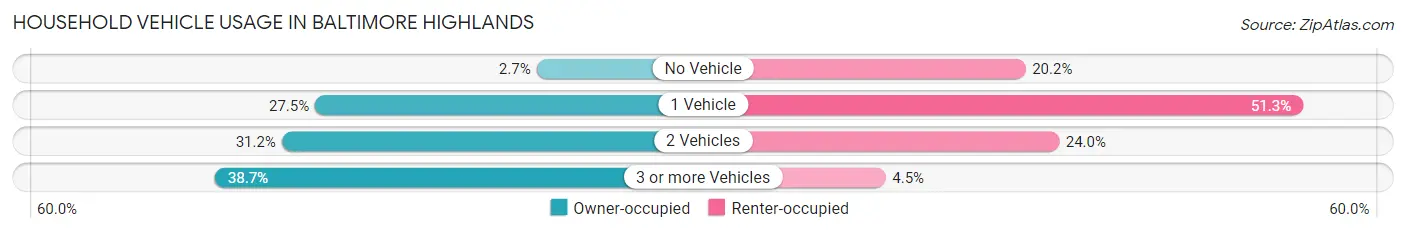
| Vehicles per Household | Owner-occupied | Renter-occupied |
| No Vehicle | 44 (2.7%) | 263 (20.2%) |
| 1 Vehicle | 455 (27.5%) | 668 (51.3%) |
| 2 Vehicles | 517 (31.2%) | 312 (24.0%) |
| 3 or more Vehicles | 641 (38.7%) | 59 (4.5%) |
| Total | 1,657 (100.0%) | 1,302 (100.0%) |
Real Estate & Mortgages in Baltimore Highlands
Real Estate and Mortgage Overview in Baltimore Highlands
| Characteristic | Without Mortgage | With Mortgage |
| Housing Units | 606 | 1,051 |
| Median Property Value | $263,600 | $233,700 |
| Median Household Income | - | - |
| Monthly Housing Costs | $694 | $17 |
| Real Estate Taxes | $3,203 | $0 |
Property Value by Mortgage Status in Baltimore Highlands
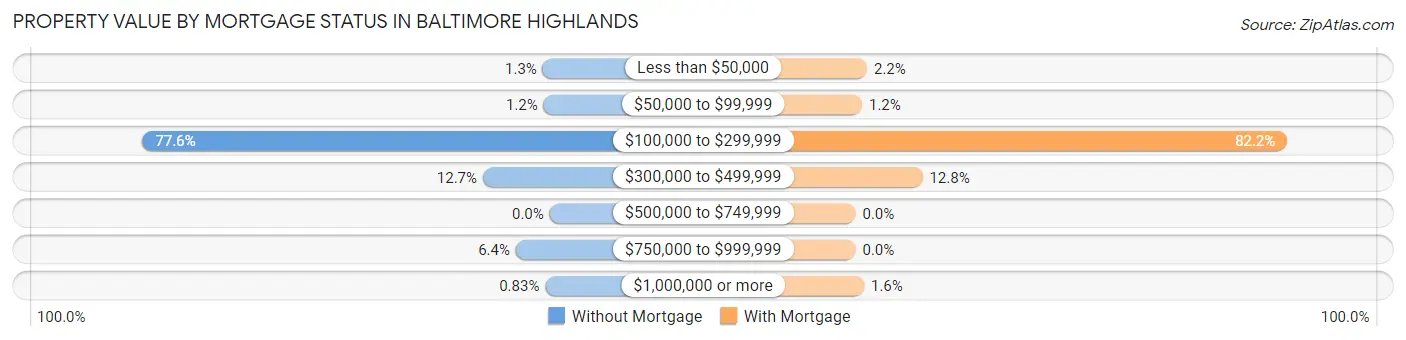
| Property Value | Without Mortgage | With Mortgage |
| Less than $50,000 | 8 (1.3%) | 23 (2.2%) |
| $50,000 to $99,999 | 7 (1.2%) | 13 (1.2%) |
| $100,000 to $299,999 | 470 (77.6%) | 864 (82.2%) |
| $300,000 to $499,999 | 77 (12.7%) | 134 (12.8%) |
| $500,000 to $749,999 | 0 (0.0%) | 0 (0.0%) |
| $750,000 to $999,999 | 39 (6.4%) | 0 (0.0%) |
| $1,000,000 or more | 5 (0.8%) | 17 (1.6%) |
| Total | 606 (100.0%) | 1,051 (100.0%) |
Household Income by Mortgage Status in Baltimore Highlands
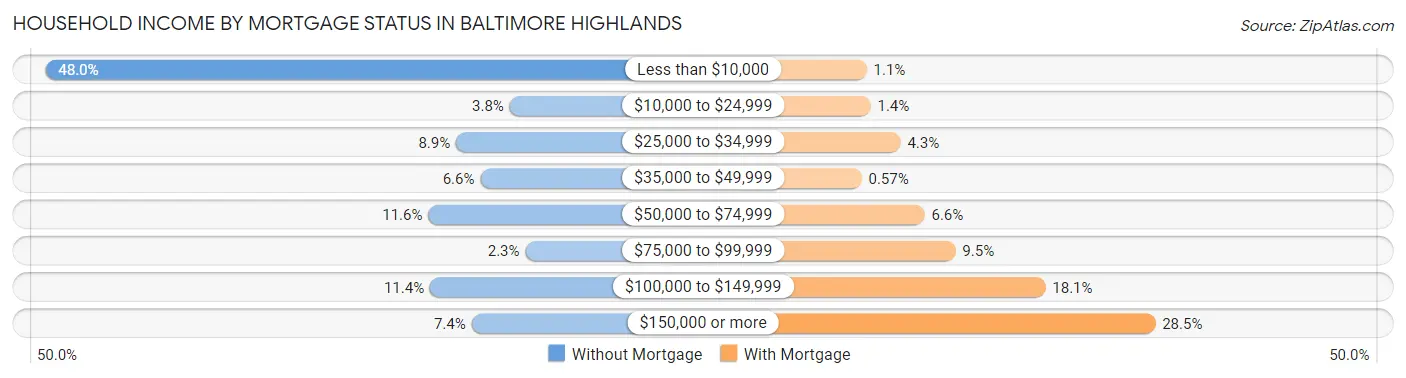
| Household Income | Without Mortgage | With Mortgage |
| Less than $10,000 | 291 (48.0%) | 11 (1.1%) |
| $10,000 to $24,999 | 23 (3.8%) | 15 (1.4%) |
| $25,000 to $34,999 | 54 (8.9%) | 45 (4.3%) |
| $35,000 to $49,999 | 40 (6.6%) | 6 (0.6%) |
| $50,000 to $74,999 | 70 (11.6%) | 69 (6.6%) |
| $75,000 to $99,999 | 14 (2.3%) | 100 (9.5%) |
| $100,000 to $149,999 | 69 (11.4%) | 190 (18.1%) |
| $150,000 or more | 45 (7.4%) | 300 (28.5%) |
| Total | 606 (100.0%) | 1,051 (100.0%) |
Property Value to Household Income Ratio in Baltimore Highlands
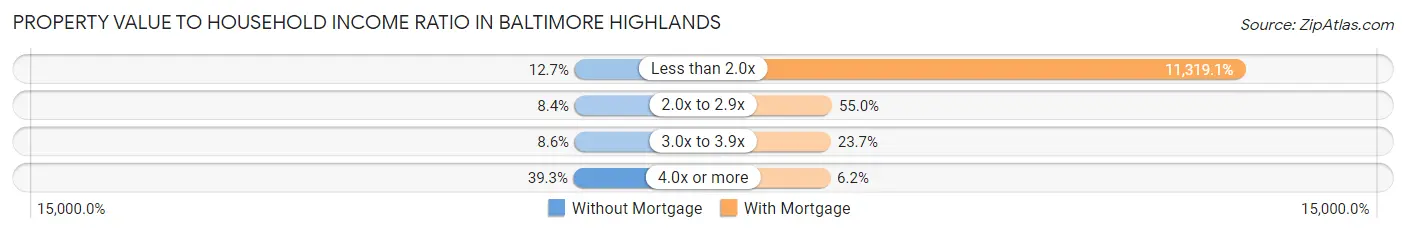
| Value-to-Income Ratio | Without Mortgage | With Mortgage |
| Less than 2.0x | 77 (12.7%) | 118,964 (11,319.1%) |
| 2.0x to 2.9x | 51 (8.4%) | 578 (55.0%) |
| 3.0x to 3.9x | 52 (8.6%) | 249 (23.7%) |
| 4.0x or more | 238 (39.3%) | 65 (6.2%) |
| Total | 606 (100.0%) | 1,051 (100.0%) |
Real Estate Taxes by Mortgage Status in Baltimore Highlands
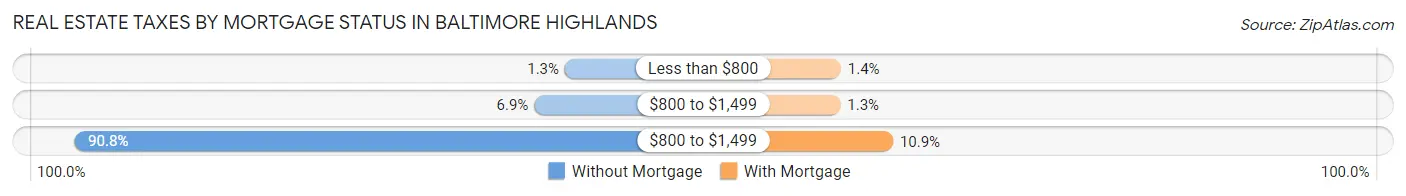
| Property Taxes | Without Mortgage | With Mortgage |
| Less than $800 | 8 (1.3%) | 15 (1.4%) |
| $800 to $1,499 | 42 (6.9%) | 14 (1.3%) |
| $800 to $1,499 | 550 (90.8%) | 115 (10.9%) |
| Total | 606 (100.0%) | 1,051 (100.0%) |
Health & Disability in Baltimore Highlands
Health Insurance Coverage by Age in Baltimore Highlands
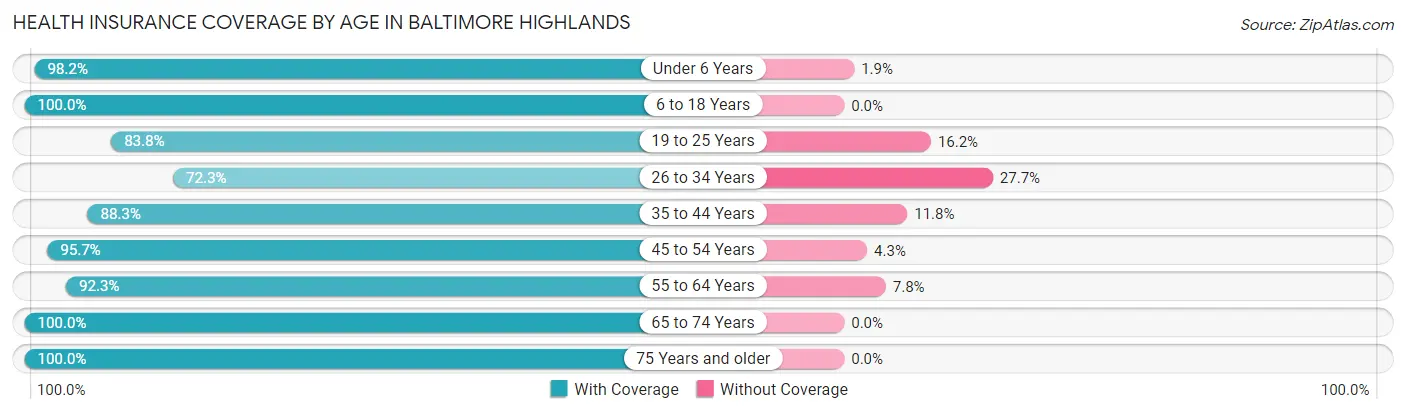
| Age Bracket | With Coverage | Without Coverage |
| Under 6 Years | 690 (98.2%) | 13 (1.8%) |
| 6 to 18 Years | 1,143 (100.0%) | 0 (0.0%) |
| 19 to 25 Years | 581 (83.8%) | 112 (16.2%) |
| 26 to 34 Years | 1,041 (72.3%) | 399 (27.7%) |
| 35 to 44 Years | 781 (88.2%) | 104 (11.7%) |
| 45 to 54 Years | 899 (95.7%) | 40 (4.3%) |
| 55 to 64 Years | 929 (92.2%) | 78 (7.7%) |
| 65 to 74 Years | 901 (100.0%) | 0 (0.0%) |
| 75 Years and older | 398 (100.0%) | 0 (0.0%) |
| Total | 7,363 (90.8%) | 746 (9.2%) |
Health Insurance Coverage by Citizenship Status in Baltimore Highlands
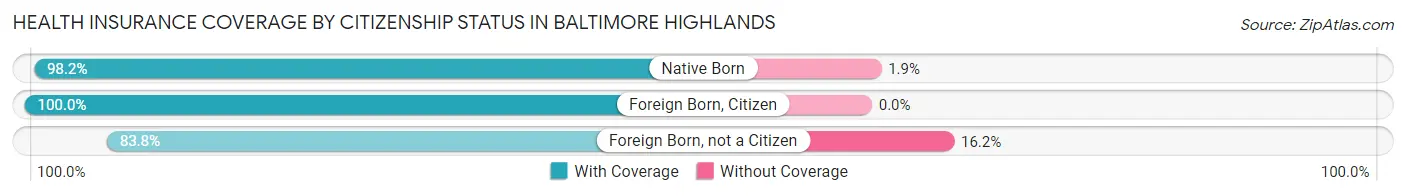
| Citizenship Status | With Coverage | Without Coverage |
| Native Born | 690 (98.2%) | 13 (1.8%) |
| Foreign Born, Citizen | 1,143 (100.0%) | 0 (0.0%) |
| Foreign Born, not a Citizen | 581 (83.8%) | 112 (16.2%) |
Health Insurance Coverage by Household Income in Baltimore Highlands
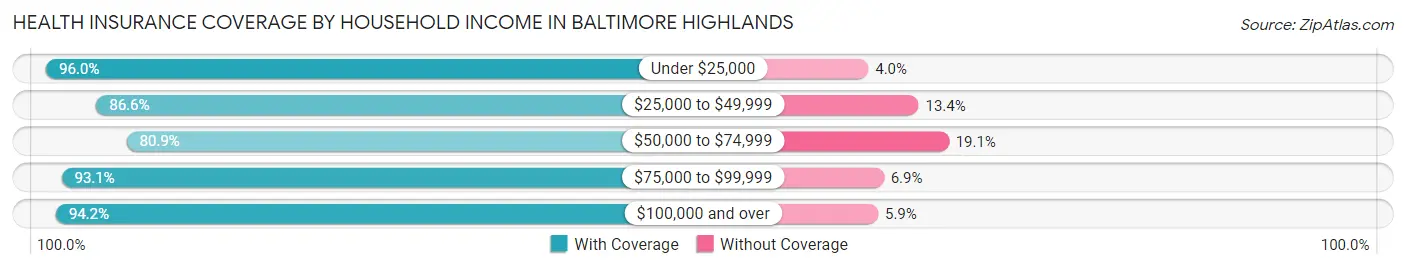
| Household Income | With Coverage | Without Coverage |
| Under $25,000 | 1,072 (96.0%) | 45 (4.0%) |
| $25,000 to $49,999 | 1,436 (86.6%) | 223 (13.4%) |
| $50,000 to $74,999 | 975 (80.9%) | 230 (19.1%) |
| $75,000 to $99,999 | 579 (93.1%) | 43 (6.9%) |
| $100,000 and over | 3,301 (94.2%) | 205 (5.9%) |
Public vs Private Health Insurance Coverage by Age in Baltimore Highlands
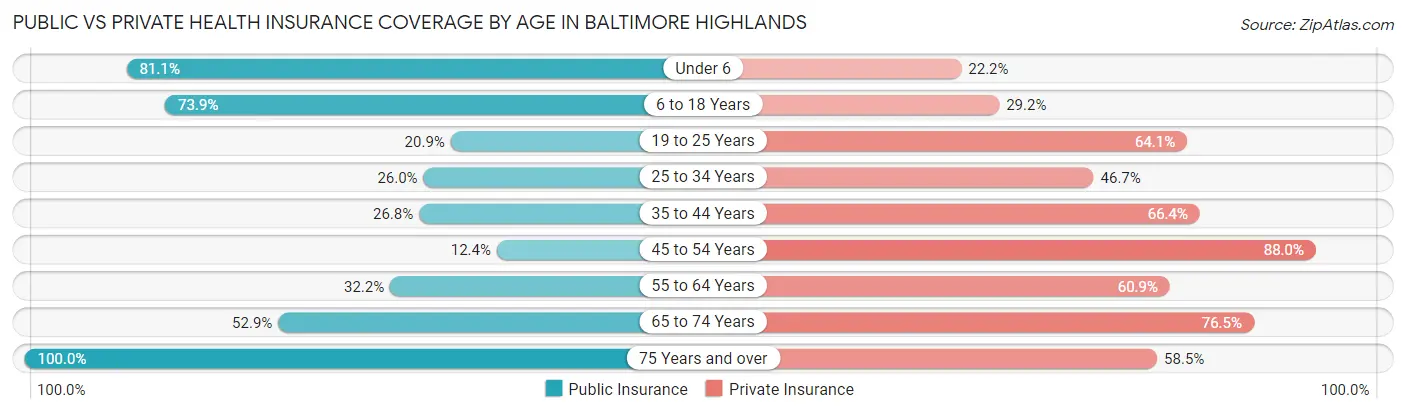
| Age Bracket | Public Insurance | Private Insurance |
| Under 6 | 570 (81.1%) | 156 (22.2%) |
| 6 to 18 Years | 845 (73.9%) | 334 (29.2%) |
| 19 to 25 Years | 145 (20.9%) | 444 (64.1%) |
| 25 to 34 Years | 374 (26.0%) | 673 (46.7%) |
| 35 to 44 Years | 237 (26.8%) | 588 (66.4%) |
| 45 to 54 Years | 116 (12.3%) | 826 (88.0%) |
| 55 to 64 Years | 324 (32.2%) | 613 (60.9%) |
| 65 to 74 Years | 477 (52.9%) | 689 (76.5%) |
| 75 Years and over | 398 (100.0%) | 233 (58.5%) |
| Total | 3,486 (43.0%) | 4,556 (56.2%) |
Disability Status by Sex by Age in Baltimore Highlands
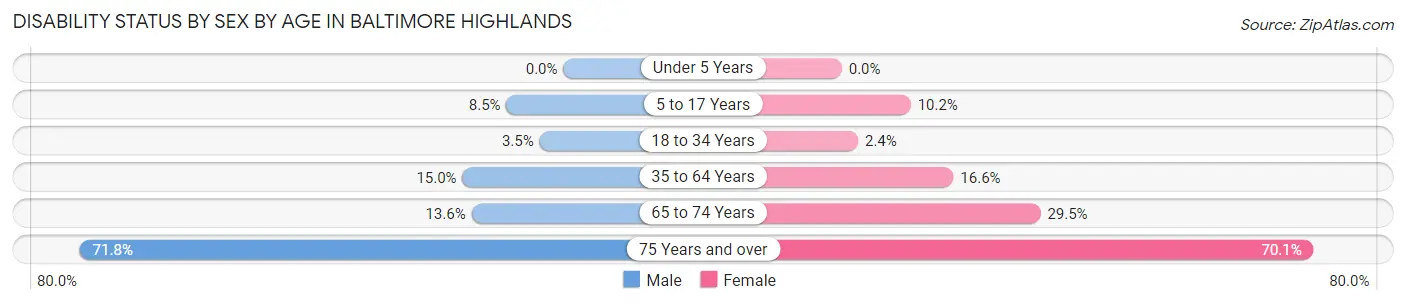
| Age Bracket | Male | Female |
| Under 5 Years | 0 (0.0%) | 0 (0.0%) |
| 5 to 17 Years | 56 (8.5%) | 58 (10.2%) |
| 18 to 34 Years | 41 (3.5%) | 25 (2.4%) |
| 35 to 64 Years | 226 (15.0%) | 219 (16.6%) |
| 65 to 74 Years | 54 (13.6%) | 149 (29.5%) |
| 75 Years and over | 130 (71.8%) | 152 (70.1%) |
Disability Class by Sex by Age in Baltimore Highlands
Disability Class: Hearing Difficulty
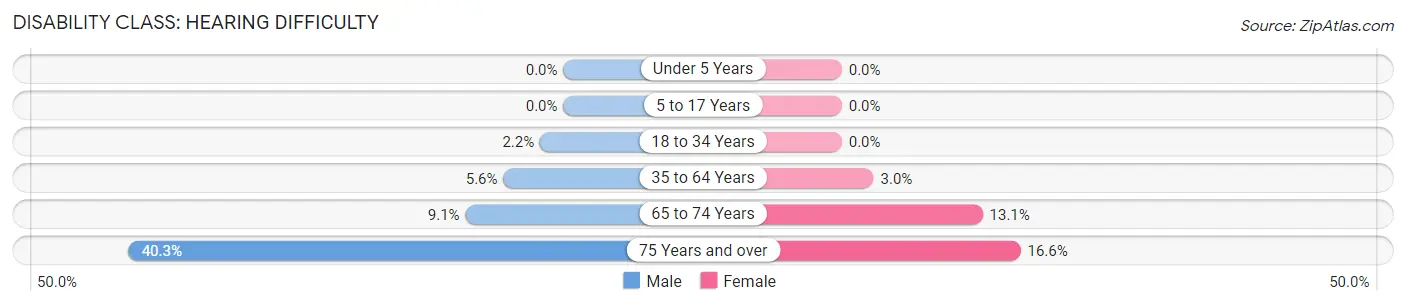
| Age Bracket | Male | Female |
| Under 5 Years | 0 (0.0%) | 0 (0.0%) |
| 5 to 17 Years | 0 (0.0%) | 0 (0.0%) |
| 18 to 34 Years | 25 (2.2%) | 0 (0.0%) |
| 35 to 64 Years | 84 (5.6%) | 39 (2.9%) |
| 65 to 74 Years | 36 (9.1%) | 66 (13.1%) |
| 75 Years and over | 73 (40.3%) | 36 (16.6%) |
Disability Class: Vision Difficulty
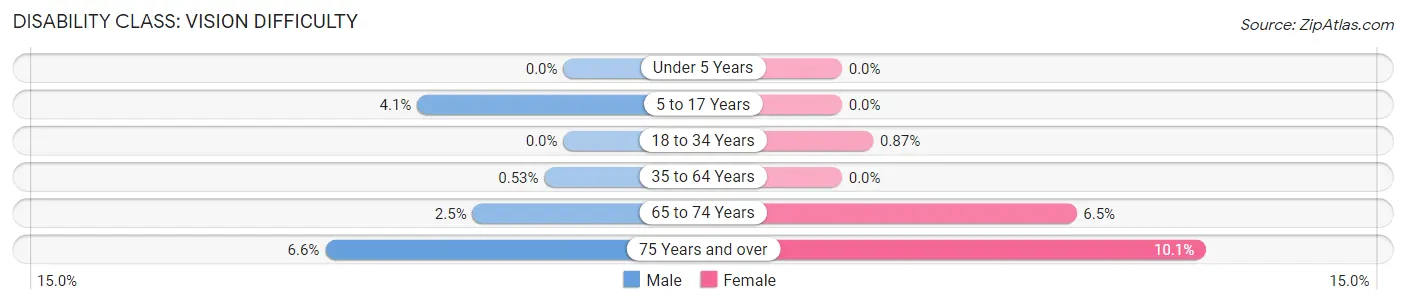
| Age Bracket | Male | Female |
| Under 5 Years | 0 (0.0%) | 0 (0.0%) |
| 5 to 17 Years | 27 (4.1%) | 0 (0.0%) |
| 18 to 34 Years | 0 (0.0%) | 9 (0.9%) |
| 35 to 64 Years | 8 (0.5%) | 0 (0.0%) |
| 65 to 74 Years | 10 (2.5%) | 33 (6.5%) |
| 75 Years and over | 12 (6.6%) | 22 (10.1%) |
Disability Class: Cognitive Difficulty
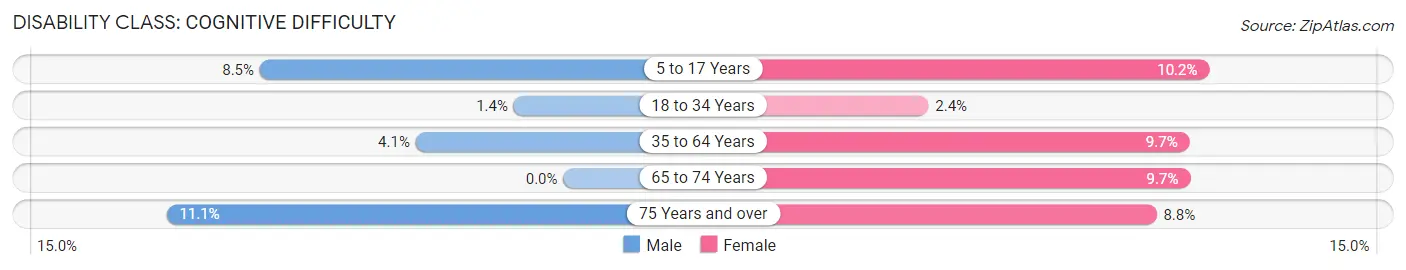
| Age Bracket | Male | Female |
| 5 to 17 Years | 56 (8.5%) | 58 (10.2%) |
| 18 to 34 Years | 16 (1.4%) | 25 (2.4%) |
| 35 to 64 Years | 62 (4.1%) | 128 (9.7%) |
| 65 to 74 Years | 0 (0.0%) | 49 (9.7%) |
| 75 Years and over | 20 (11.1%) | 19 (8.8%) |
Disability Class: Ambulatory Difficulty
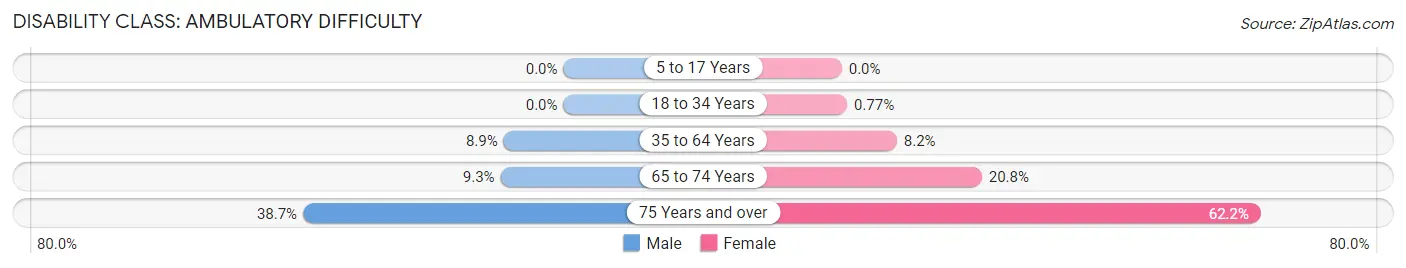
| Age Bracket | Male | Female |
| 5 to 17 Years | 0 (0.0%) | 0 (0.0%) |
| 18 to 34 Years | 0 (0.0%) | 8 (0.8%) |
| 35 to 64 Years | 134 (8.9%) | 108 (8.2%) |
| 65 to 74 Years | 37 (9.3%) | 105 (20.8%) |
| 75 Years and over | 70 (38.7%) | 135 (62.2%) |
Disability Class: Self-Care Difficulty
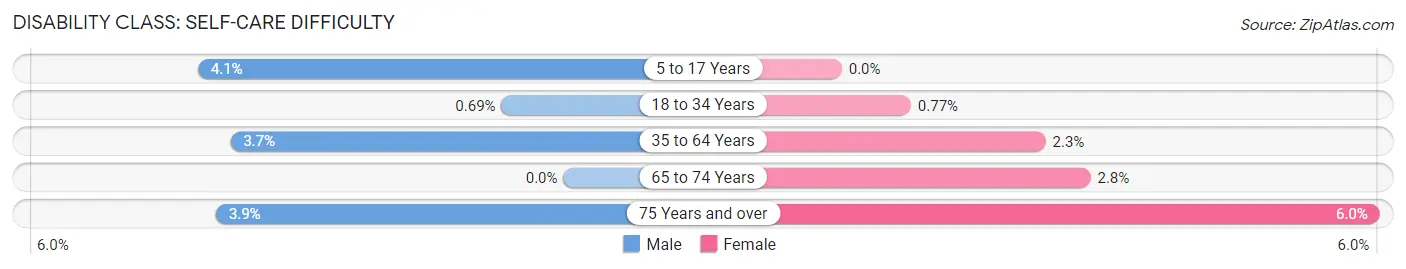
| Age Bracket | Male | Female |
| 5 to 17 Years | 27 (4.1%) | 0 (0.0%) |
| 18 to 34 Years | 8 (0.7%) | 8 (0.8%) |
| 35 to 64 Years | 56 (3.7%) | 30 (2.3%) |
| 65 to 74 Years | 0 (0.0%) | 14 (2.8%) |
| 75 Years and over | 7 (3.9%) | 13 (6.0%) |
Technology Access in Baltimore Highlands
Computing Device Access in Baltimore Highlands
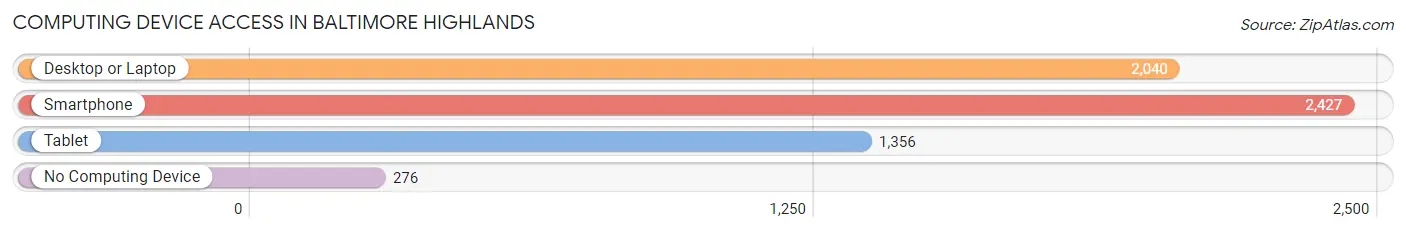
| Device Type | # Households | % Households |
| Desktop or Laptop | 2,040 | 68.9% |
| Smartphone | 2,427 | 82.0% |
| Tablet | 1,356 | 45.8% |
| No Computing Device | 276 | 9.3% |
| Total | 2,959 | 100.0% |
Internet Access in Baltimore Highlands
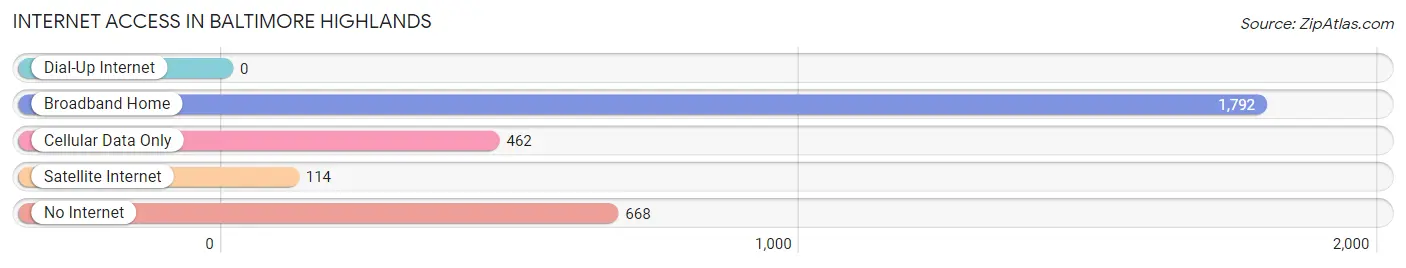
| Internet Type | # Households | % Households |
| Dial-Up Internet | 0 | 0.0% |
| Broadband Home | 1,792 | 60.6% |
| Cellular Data Only | 462 | 15.6% |
| Satellite Internet | 114 | 3.8% |
| No Internet | 668 | 22.6% |
| Total | 2,959 | 100.0% |
Baltimore Highlands Summary
Baltimore Highlands is a small, unincorporated community located in Baltimore County, Maryland. It is situated in the southeastern part of the county, just south of the city of Baltimore. The community is bordered by the Patapsco River to the east, the Baltimore City line to the north, and the communities of Brooklyn and Curtis Bay to the south and west, respectively.
History
The area that is now Baltimore Highlands was first settled in the late 1700s by German and Irish immigrants. The area was originally known as “Highlandtown” and was part of the larger community of Brooklyn. In the late 1800s, the area was annexed by the City of Baltimore and became known as “Baltimore Highlands.”
The area was primarily a working-class neighborhood, with many of its residents employed in the nearby steel mills and shipyards. The area was also home to a large number of African-American residents, many of whom were employed in the nearby factories.
In the early 1900s, the area began to experience a period of decline. The steel mills and shipyards began to close, and the area’s population began to decline. In the 1950s, the area was further impacted by the construction of the Baltimore-Washington Parkway, which cut through the community and caused further disruption.
In the late 1970s, the area began to experience a period of revitalization. The area was designated as an “Urban Renewal Area” and the city began to invest in the area, including the construction of new housing and the renovation of existing buildings.
Geography
Baltimore Highlands is located in the southeastern part of Baltimore County, just south of the city of Baltimore. The community is bordered by the Patapsco River to the east, the Baltimore City line to the north, and the communities of Brooklyn and Curtis Bay to the south and west, respectively.
The area is primarily residential, with a mix of single-family homes, townhouses, and apartment buildings. The area is also home to a number of parks and recreational facilities, including the Baltimore Highlands Recreation Center and the Baltimore Highlands Community Park.
Economy
The economy of Baltimore Highlands is primarily based on the service sector. The area is home to a number of small businesses, including restaurants, convenience stores, and other retail establishments. The area is also home to a number of industrial and manufacturing businesses, including a steel mill and a shipyard.
Demographics
As of the 2010 census, the population of Baltimore Highlands was 8,845. The racial makeup of the area was 63.3% White, 28.2% African American, 0.3% Native American, 1.2% Asian, and 6.9% from other races. The median household income was $41,945, and the median family income was $50,945.
Conclusion
Baltimore Highlands is a small, unincorporated community located in Baltimore County, Maryland. It is situated in the southeastern part of the county, just south of the city of Baltimore. The area has a long history, dating back to the late 1700s, and has experienced periods of both decline and revitalization. The economy of the area is primarily based on the service sector, and the population is primarily White and African American.
Common Questions
What is Per Capita Income in Baltimore Highlands?
Per Capita income in Baltimore Highlands is $31,079.
What is the Median Family Income in Baltimore Highlands?
Median Family Income in Baltimore Highlands is $72,589.
What is the Median Household income in Baltimore Highlands?
Median Household Income in Baltimore Highlands is $56,367.
What is Income or Wage Gap in Baltimore Highlands?
Income or Wage Gap in Baltimore Highlands is 19.6%.
Women in Baltimore Highlands earn 80.4 cents for every dollar earned by a man.
What is Inequality or Gini Index in Baltimore Highlands?
Inequality or Gini Index in Baltimore Highlands is 0.48.
What is the Total Population of Baltimore Highlands?
Total Population of Baltimore Highlands is 8,116.
What is the Total Male Population of Baltimore Highlands?
Total Male Population of Baltimore Highlands is 4,167.
What is the Total Female Population of Baltimore Highlands?
Total Female Population of Baltimore Highlands is 3,949.
What is the Ratio of Males per 100 Females in Baltimore Highlands?
There are 105.52 Males per 100 Females in Baltimore Highlands.
What is the Ratio of Females per 100 Males in Baltimore Highlands?
There are 94.77 Females per 100 Males in Baltimore Highlands.
What is the Median Population Age in Baltimore Highlands?
Median Population Age in Baltimore Highlands is 35.9 Years.
What is the Average Family Size in Baltimore Highlands
Average Family Size in Baltimore Highlands is 3.4 People.
What is the Average Household Size in Baltimore Highlands
Average Household Size in Baltimore Highlands is 2.7 People.
How Large is the Labor Force in Baltimore Highlands?
There are 4,053 People in the Labor Forcein in Baltimore Highlands.
What is the Percentage of People in the Labor Force in Baltimore Highlands?
62.6% of People are in the Labor Force in Baltimore Highlands.
What is the Unemployment Rate in Baltimore Highlands?
Unemployment Rate in Baltimore Highlands is 6.0%.