Spring Valley, NV Map & Demographics
Spring Valley Map
Spring Valley Overview
$37,666
PER CAPITA INCOME
$79,763
AVG FAMILY INCOME
$69,341
AVG HOUSEHOLD INCOME
11.3%
WAGE / INCOME GAP [ % ]
88.7¢/ $1
WAGE / INCOME GAP [ $ ]
$11,779
FAMILY INCOME DEFICIT
0.46
INEQUALITY / GINI INDEX
220,114
TOTAL POPULATION
111,697
MALE POPULATION
108,417
FEMALE POPULATION
103.03
MALES / 100 FEMALES
97.06
FEMALES / 100 MALES
38.5
MEDIAN AGE
3.2
AVG FAMILY SIZE
2.6
AVG HOUSEHOLD SIZE
123,687
LABOR FORCE [ PEOPLE ]
67.8%
PERCENT IN LABOR FORCE
7.6%
UNEMPLOYMENT RATE
Income in Spring Valley
Income Overview in Spring Valley
Per Capita Income in Spring Valley is $37,666, while median incomes of families and households are $79,763 and $69,341 respectively.
| Characteristic | Number | Measure |
| Per Capita Income | 220,114 | $37,666 |
| Median Family Income | 51,866 | $79,763 |
| Mean Family Income | 51,866 | $104,153 |
| Median Household Income | 85,915 | $69,341 |
| Mean Household Income | 85,915 | $92,999 |
| Income Deficit | 51,866 | $11,779 |
| Wage / Income Gap (%) | 220,114 | 11.29% |
| Wage / Income Gap ($) | 220,114 | 88.71¢ per $1 |
| Gini / Inequality Index | 220,114 | 0.46 |
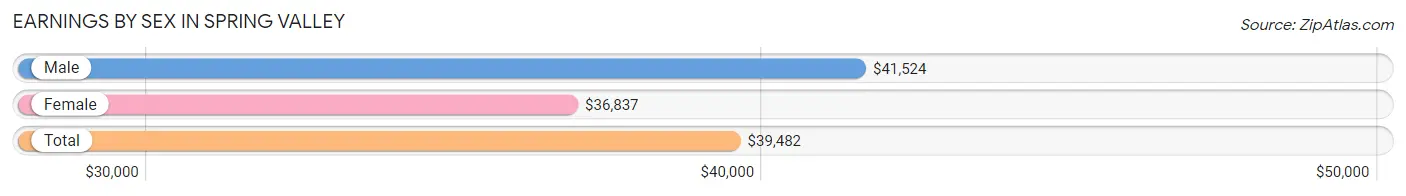
Earnings by Sex in Spring Valley
Average Earnings in Spring Valley are $39,482, $41,524 for men and $36,837 for women, a difference of 11.3%.
| Sex | Number | Average Earnings |
| Male | 66,761 (53.4%) | $41,524 |
| Female | 58,204 (46.6%) | $36,837 |
| Total | 124,965 (100.0%) | $39,482 |
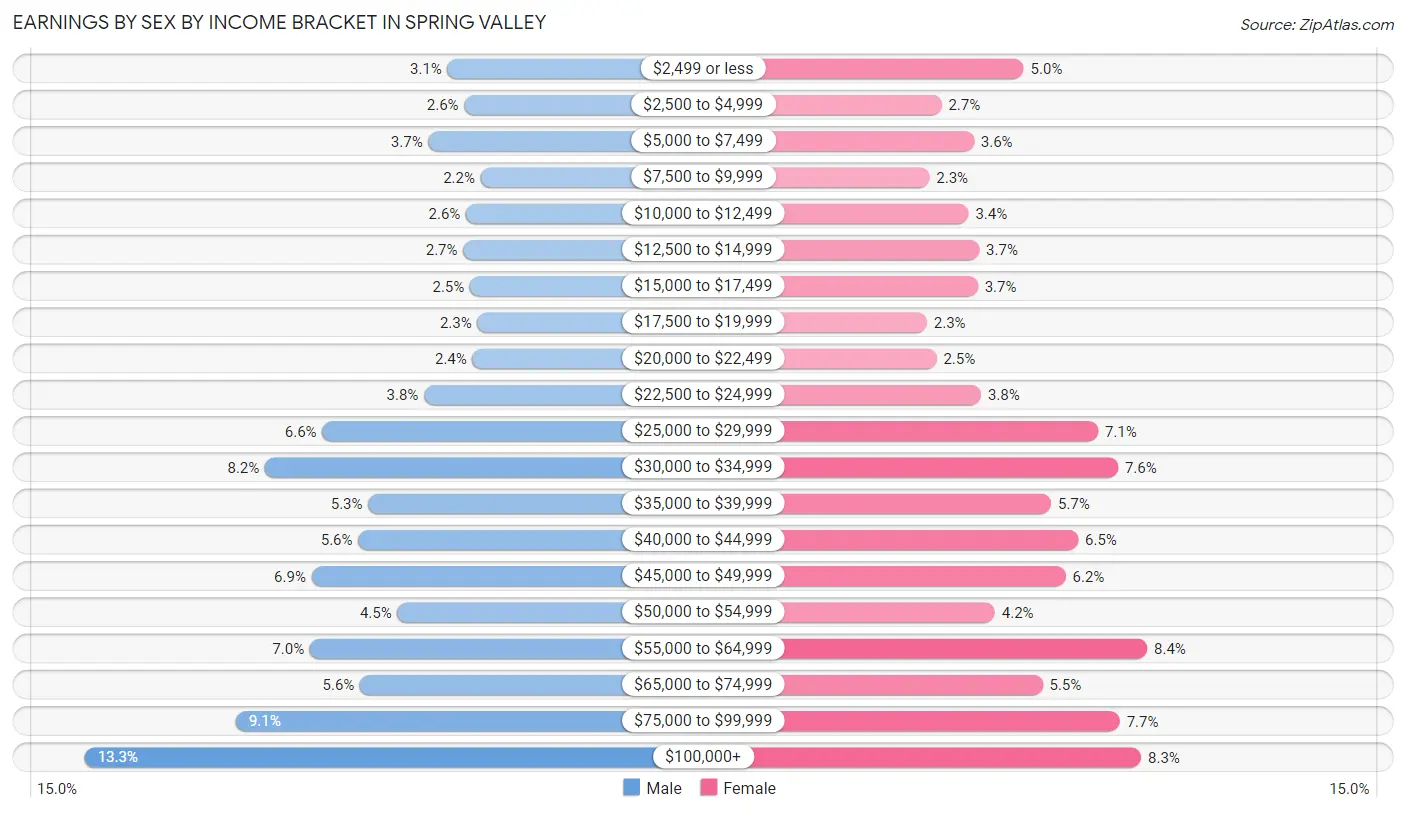
Earnings by Sex by Income Bracket in Spring Valley
The most common earnings brackets in Spring Valley are $100,000+ for men (8,889 | 13.3%) and $55,000 to $64,999 for women (4,910 | 8.4%).
| Income | Male | Female |
| $2,499 or less | 2,079 (3.1%) | 2,890 (5.0%) |
| $2,500 to $4,999 | 1,761 (2.6%) | 1,549 (2.7%) |
| $5,000 to $7,499 | 2,437 (3.6%) | 2,077 (3.6%) |
| $7,500 to $9,999 | 1,453 (2.2%) | 1,351 (2.3%) |
| $10,000 to $12,499 | 1,732 (2.6%) | 1,988 (3.4%) |
| $12,500 to $14,999 | 1,781 (2.7%) | 2,168 (3.7%) |
| $15,000 to $17,499 | 1,657 (2.5%) | 2,143 (3.7%) |
| $17,500 to $19,999 | 1,515 (2.3%) | 1,311 (2.2%) |
| $20,000 to $22,499 | 1,612 (2.4%) | 1,468 (2.5%) |
| $22,500 to $24,999 | 2,520 (3.8%) | 2,197 (3.8%) |
| $25,000 to $29,999 | 4,427 (6.6%) | 4,110 (7.1%) |
| $30,000 to $34,999 | 5,504 (8.2%) | 4,436 (7.6%) |
| $35,000 to $39,999 | 3,568 (5.3%) | 3,339 (5.7%) |
| $40,000 to $44,999 | 3,752 (5.6%) | 3,786 (6.5%) |
| $45,000 to $49,999 | 4,628 (6.9%) | 3,579 (6.1%) |
| $50,000 to $54,999 | 3,019 (4.5%) | 2,421 (4.2%) |
| $55,000 to $64,999 | 4,658 (7.0%) | 4,910 (8.4%) |
| $65,000 to $74,999 | 3,719 (5.6%) | 3,203 (5.5%) |
| $75,000 to $99,999 | 6,050 (9.1%) | 4,464 (7.7%) |
| $100,000+ | 8,889 (13.3%) | 4,814 (8.3%) |
| Total | 66,761 (100.0%) | 58,204 (100.0%) |
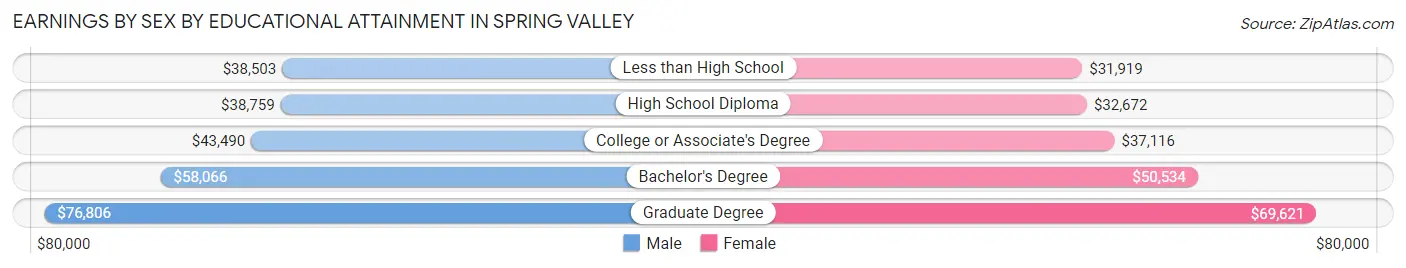
Earnings by Sex by Educational Attainment in Spring Valley
Average earnings in Spring Valley are $45,487 for men and $40,885 for women, a difference of 10.1%. Men with an educational attainment of graduate degree enjoy the highest average annual earnings of $76,806, while those with less than high school education earn the least with $38,503. Women with an educational attainment of graduate degree earn the most with the average annual earnings of $69,621, while those with less than high school education have the smallest earnings of $31,919.
| Educational Attainment | Male Income | Female Income |
| Less than High School | $38,503 | $31,919 |
| High School Diploma | $38,759 | $32,672 |
| College or Associate's Degree | $43,490 | $37,116 |
| Bachelor's Degree | $58,066 | $50,534 |
| Graduate Degree | $76,806 | $69,621 |
| Total | $45,487 | $40,885 |
Family Income in Spring Valley
Family Income Brackets in Spring Valley
According to the Spring Valley family income data, there are 10,166 families falling into the $100,000 to $149,999 income range, which is the most common income bracket and makes up 19.6% of all families. Conversely, the $10,000 to $14,999 income bracket is the least frequent group with only 934 families (1.8%) belonging to this category.
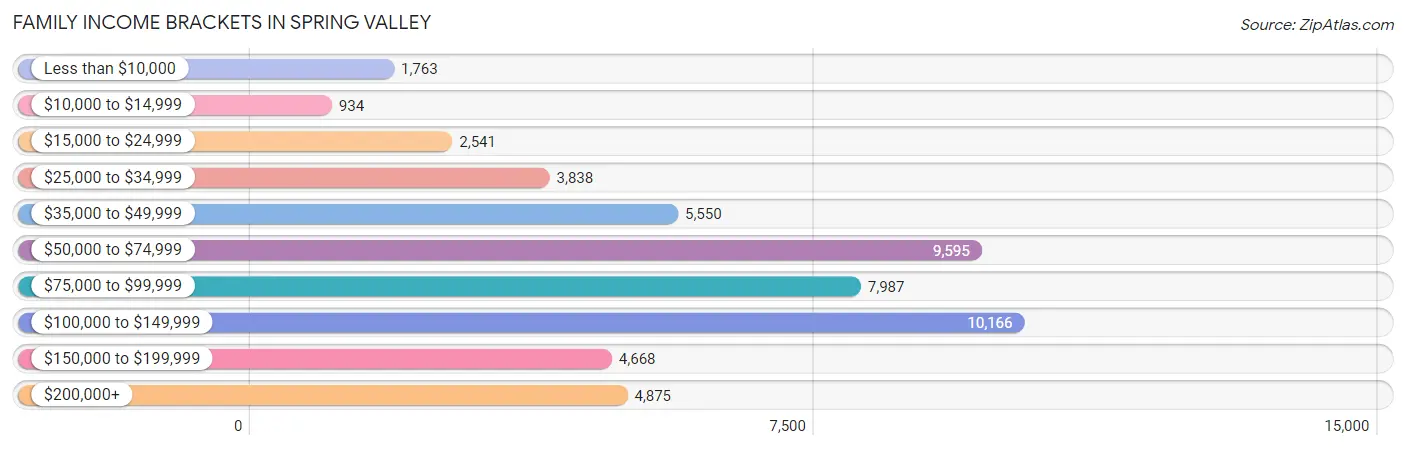
| Income Bracket | # Families | % Families |
| Less than $10,000 | 1,763 | 3.4% |
| $10,000 to $14,999 | 934 | 1.8% |
| $15,000 to $24,999 | 2,541 | 4.9% |
| $25,000 to $34,999 | 3,838 | 7.4% |
| $35,000 to $49,999 | 5,550 | 10.7% |
| $50,000 to $74,999 | 9,595 | 18.5% |
| $75,000 to $99,999 | 7,987 | 15.4% |
| $100,000 to $149,999 | 10,166 | 19.6% |
| $150,000 to $199,999 | 4,668 | 9.0% |
| $200,000+ | 4,875 | 9.4% |
Family Income by Famaliy Size in Spring Valley
6-person families (1,541 | 3.0%) account for the highest median family income in Spring Valley with $107,399 per family, while 2-person families (24,782 | 47.8%) have the highest median income of $35,149 per family member.
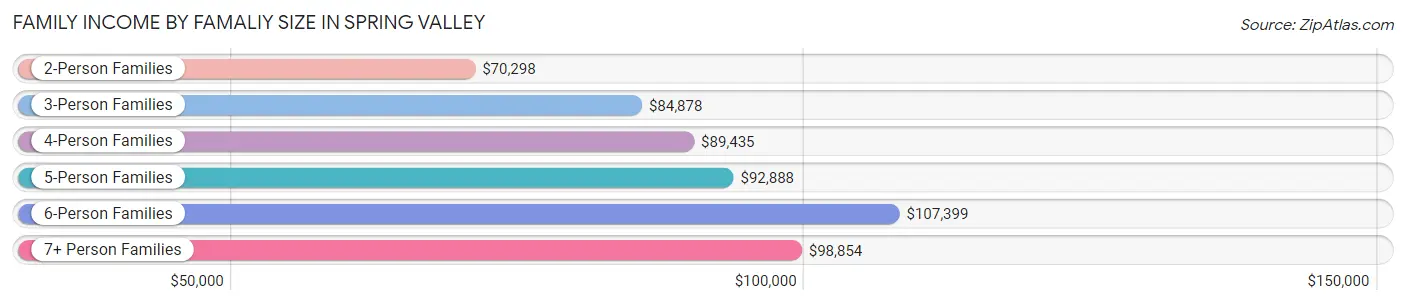
| Income Bracket | # Families | Median Income |
| 2-Person Families | 24,782 (47.8%) | $70,298 |
| 3-Person Families | 12,815 (24.7%) | $84,878 |
| 4-Person Families | 7,627 (14.7%) | $89,435 |
| 5-Person Families | 4,426 (8.5%) | $92,888 |
| 6-Person Families | 1,541 (3.0%) | $107,399 |
| 7+ Person Families | 675 (1.3%) | $98,854 |
| Total | 51,866 (100.0%) | $79,763 |
Family Income by Number of Earners in Spring Valley
The median family income in Spring Valley is $79,763, with families comprising 3+ earners (6,280) having the highest median family income of $124,099, while families with no earners (6,366) have the lowest median family income of $35,974, accounting for 12.1% and 12.3% of families, respectively.
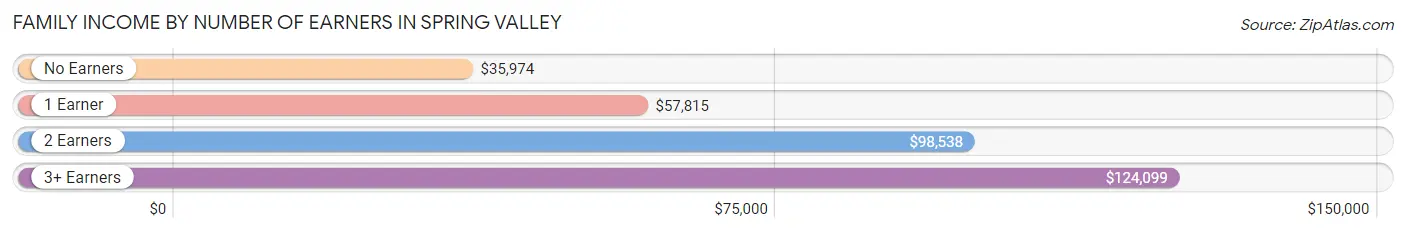
| Number of Earners | # Families | Median Income |
| No Earners | 6,366 (12.3%) | $35,974 |
| 1 Earner | 17,580 (33.9%) | $57,815 |
| 2 Earners | 21,640 (41.7%) | $98,538 |
| 3+ Earners | 6,280 (12.1%) | $124,099 |
| Total | 51,866 (100.0%) | $79,763 |
Household Income in Spring Valley
Household Income Brackets in Spring Valley
With 16,324 households falling in the category, the $50,000 to $74,999 income range is the most frequent in Spring Valley, accounting for 19.0% of all households. In contrast, only 1,976 households (2.3%) fall into the $10,000 to $14,999 income bracket, making it the least populous group.
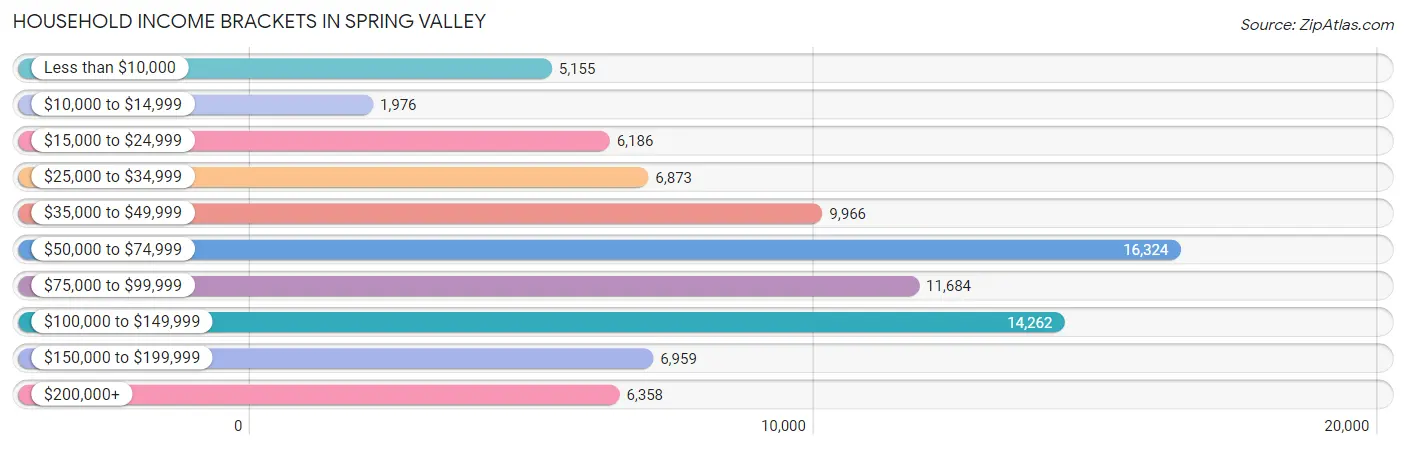
| Income Bracket | # Households | % Households |
| Less than $10,000 | 5,155 | 6.0% |
| $10,000 to $14,999 | 1,976 | 2.3% |
| $15,000 to $24,999 | 6,186 | 7.2% |
| $25,000 to $34,999 | 6,873 | 8.0% |
| $35,000 to $49,999 | 9,966 | 11.6% |
| $50,000 to $74,999 | 16,324 | 19.0% |
| $75,000 to $99,999 | 11,684 | 13.6% |
| $100,000 to $149,999 | 14,262 | 16.6% |
| $150,000 to $199,999 | 6,959 | 8.1% |
| $200,000+ | 6,358 | 7.4% |
Household Income by Householder Age in Spring Valley
The median household income in Spring Valley is $69,341, with the highest median household income of $77,853 found in the 45 to 64 years age bracket for the primary householder. A total of 31,012 households (36.1%) fall into this category. Meanwhile, the 65+ years age bracket for the primary householder has the lowest median household income of $49,648, with 18,631 households (21.7%) in this group.
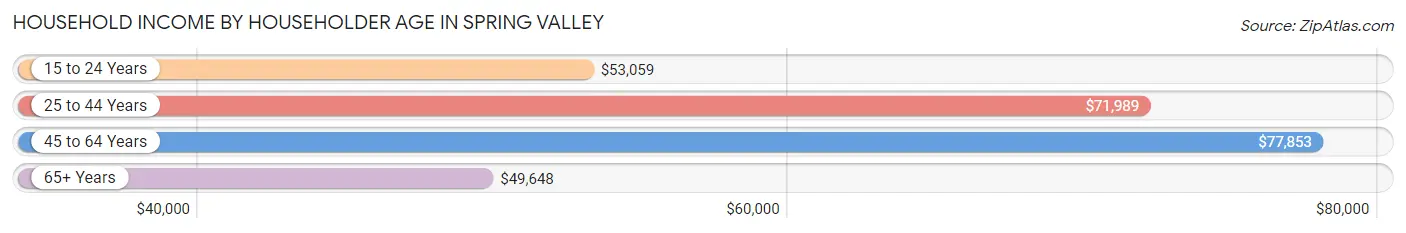
| Income Bracket | # Households | Median Income |
| 15 to 24 Years | 3,088 (3.6%) | $53,059 |
| 25 to 44 Years | 33,184 (38.6%) | $71,989 |
| 45 to 64 Years | 31,012 (36.1%) | $77,853 |
| 65+ Years | 18,631 (21.7%) | $49,648 |
| Total | 85,915 (100.0%) | $69,341 |
Poverty in Spring Valley
Income Below Poverty by Sex and Age in Spring Valley
With 11.7% poverty level for males and 13.8% for females among the residents of Spring Valley, 6 to 11 year old males and 15 year old females are the most vulnerable to poverty, with 1,875 males (25.7%) and 307 females (24.7%) in their respective age groups living below the poverty level.
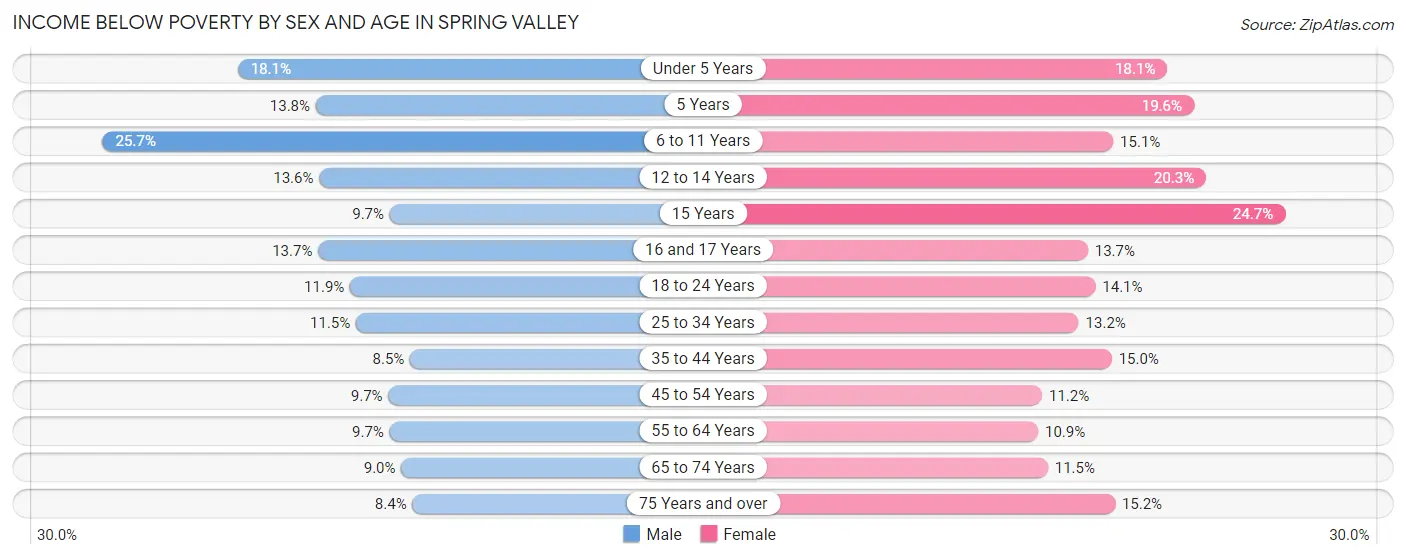
| Age Bracket | Male | Female |
| Under 5 Years | 1,204 (18.1%) | 897 (18.1%) |
| 5 Years | 173 (13.8%) | 262 (19.6%) |
| 6 to 11 Years | 1,875 (25.7%) | 915 (15.1%) |
| 12 to 14 Years | 500 (13.6%) | 707 (20.3%) |
| 15 Years | 111 (9.7%) | 307 (24.7%) |
| 16 and 17 Years | 283 (13.7%) | 336 (13.7%) |
| 18 to 24 Years | 1,151 (11.9%) | 1,262 (14.1%) |
| 25 to 34 Years | 2,204 (11.5%) | 2,251 (13.2%) |
| 35 to 44 Years | 1,466 (8.5%) | 2,451 (15.0%) |
| 45 to 54 Years | 1,523 (9.7%) | 1,563 (11.2%) |
| 55 to 64 Years | 1,277 (9.7%) | 1,506 (10.9%) |
| 65 to 74 Years | 835 (9.0%) | 1,246 (11.5%) |
| 75 Years and over | 424 (8.4%) | 1,176 (15.2%) |
| Total | 13,026 (11.7%) | 14,879 (13.8%) |
Income Above Poverty by Sex and Age in Spring Valley
According to the poverty statistics in Spring Valley, males aged 75 years and over and females aged 55 to 64 years are the age groups that are most secure financially, with 91.6% of males and 89.1% of females in these age groups living above the poverty line.
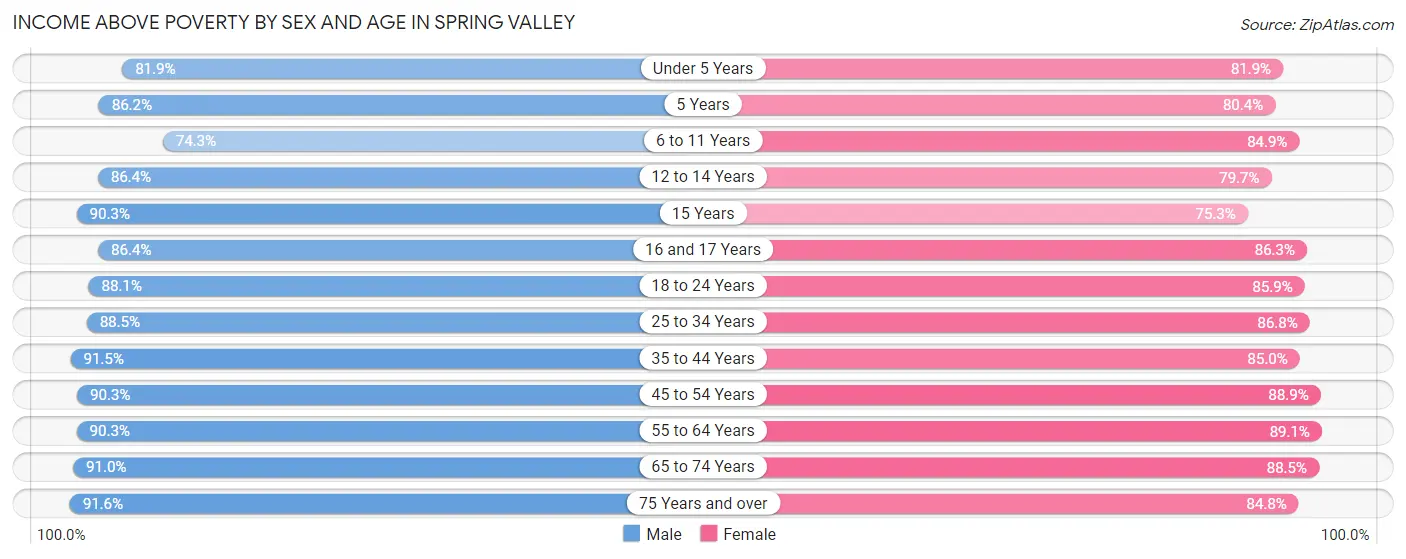
| Age Bracket | Male | Female |
| Under 5 Years | 5,436 (81.9%) | 4,054 (81.9%) |
| 5 Years | 1,082 (86.2%) | 1,075 (80.4%) |
| 6 to 11 Years | 5,431 (74.3%) | 5,141 (84.9%) |
| 12 to 14 Years | 3,179 (86.4%) | 2,780 (79.7%) |
| 15 Years | 1,038 (90.3%) | 937 (75.3%) |
| 16 and 17 Years | 1,790 (86.4%) | 2,117 (86.3%) |
| 18 to 24 Years | 8,547 (88.1%) | 7,676 (85.9%) |
| 25 to 34 Years | 16,888 (88.5%) | 14,811 (86.8%) |
| 35 to 44 Years | 15,722 (91.5%) | 13,857 (85.0%) |
| 45 to 54 Years | 14,113 (90.3%) | 12,450 (88.8%) |
| 55 to 64 Years | 11,928 (90.3%) | 12,278 (89.1%) |
| 65 to 74 Years | 8,427 (91.0%) | 9,613 (88.5%) |
| 75 Years and over | 4,622 (91.6%) | 6,555 (84.8%) |
| Total | 98,203 (88.3%) | 93,344 (86.3%) |
Income Below Poverty Among Married-Couple Families in Spring Valley
The poverty statistics for married-couple families in Spring Valley show that 5.9% or 1,933 of the total 33,033 families live below the poverty line. Families with 3 or 4 children have the highest poverty rate of 20.2%, comprising of 453 families. On the other hand, families with 5 or more children have the lowest poverty rate of 0.0%, which includes 0 families.
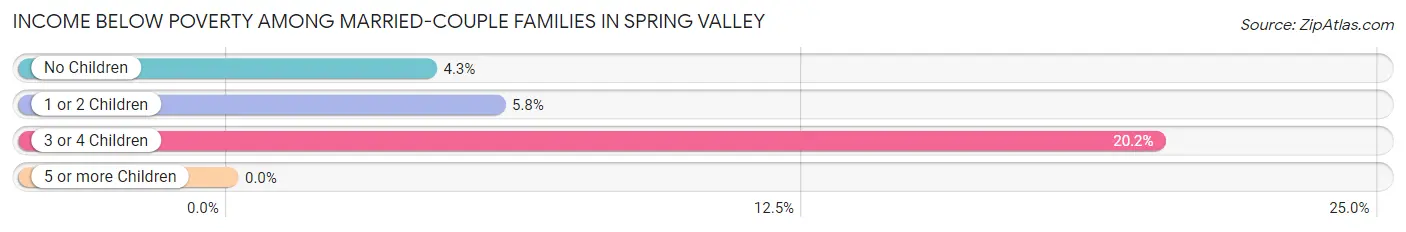
| Children | Above Poverty | Below Poverty |
| No Children | 19,619 (95.7%) | 885 (4.3%) |
| 1 or 2 Children | 9,642 (94.2%) | 595 (5.8%) |
| 3 or 4 Children | 1,792 (79.8%) | 453 (20.2%) |
| 5 or more Children | 47 (100.0%) | 0 (0.0%) |
| Total | 31,100 (94.2%) | 1,933 (5.9%) |
Income Below Poverty Among Single-Parent Households in Spring Valley
According to the poverty data in Spring Valley, 9.3% or 621 single-father households and 17.4% or 2,108 single-mother households are living below the poverty line. Among single-father households, those with 5 or more children have the highest poverty rate, with 92 households (66.2%) experiencing poverty. Likewise, among single-mother households, those with 5 or more children have the highest poverty rate, with 26 households (86.7%) falling below the poverty line.
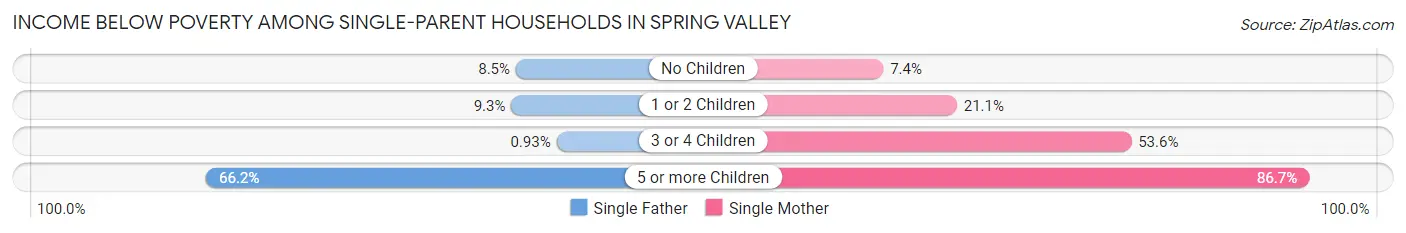
| Children | Single Father | Single Mother |
| No Children | 291 (8.5%) | 407 (7.4%) |
| 1 or 2 Children | 232 (9.3%) | 1,201 (21.1%) |
| 3 or 4 Children | 6 (0.9%) | 474 (53.6%) |
| 5 or more Children | 92 (66.2%) | 26 (86.7%) |
| Total | 621 (9.3%) | 2,108 (17.4%) |
Income Below Poverty Among Married-Couple vs Single-Parent Households in Spring Valley
The poverty data for Spring Valley shows that 1,933 of the married-couple family households (5.9%) and 2,729 of the single-parent households (14.5%) are living below the poverty level. Within the married-couple family households, those with 3 or 4 children have the highest poverty rate, with 453 households (20.2%) falling below the poverty line. Among the single-parent households, those with 5 or more children have the highest poverty rate, with 118 household (69.8%) living below poverty.
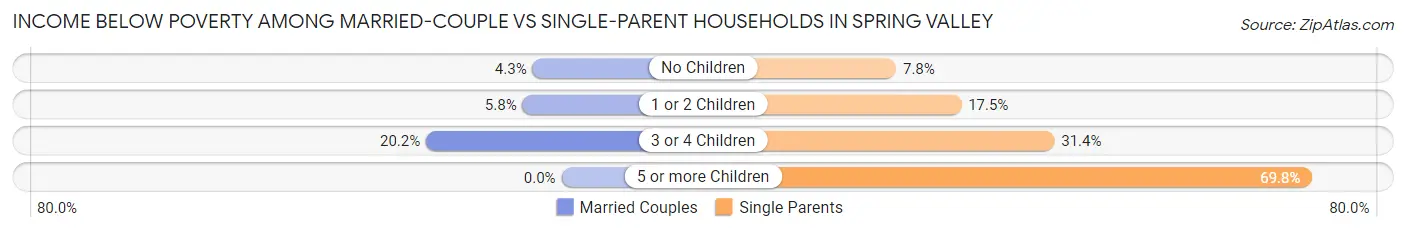
| Children | Married-Couple Families | Single-Parent Households |
| No Children | 885 (4.3%) | 698 (7.8%) |
| 1 or 2 Children | 595 (5.8%) | 1,433 (17.5%) |
| 3 or 4 Children | 453 (20.2%) | 480 (31.4%) |
| 5 or more Children | 0 (0.0%) | 118 (69.8%) |
| Total | 1,933 (5.9%) | 2,729 (14.5%) |
Race in Spring Valley
The most populous races in Spring Valley are White / Caucasian (96,564 | 43.9%), Hispanic or Latino (52,545 | 23.9%), and Asian (42,206 | 19.2%).
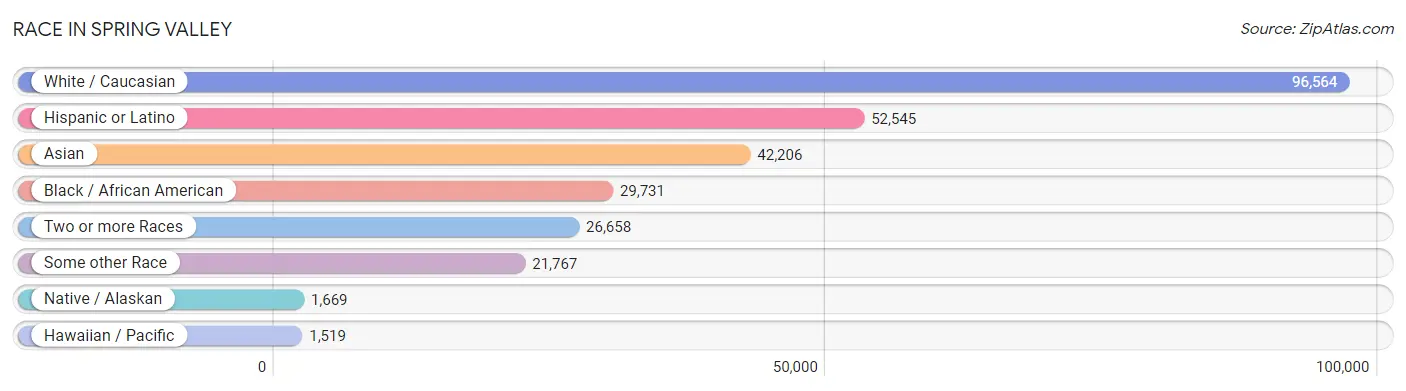
| Race | # Population | % Population |
| Asian | 42,206 | 19.2% |
| Black / African American | 29,731 | 13.5% |
| Hawaiian / Pacific | 1,519 | 0.7% |
| Hispanic or Latino | 52,545 | 23.9% |
| Native / Alaskan | 1,669 | 0.8% |
| White / Caucasian | 96,564 | 43.9% |
| Two or more Races | 26,658 | 12.1% |
| Some other Race | 21,767 | 9.9% |
| Total | 220,114 | 100.0% |
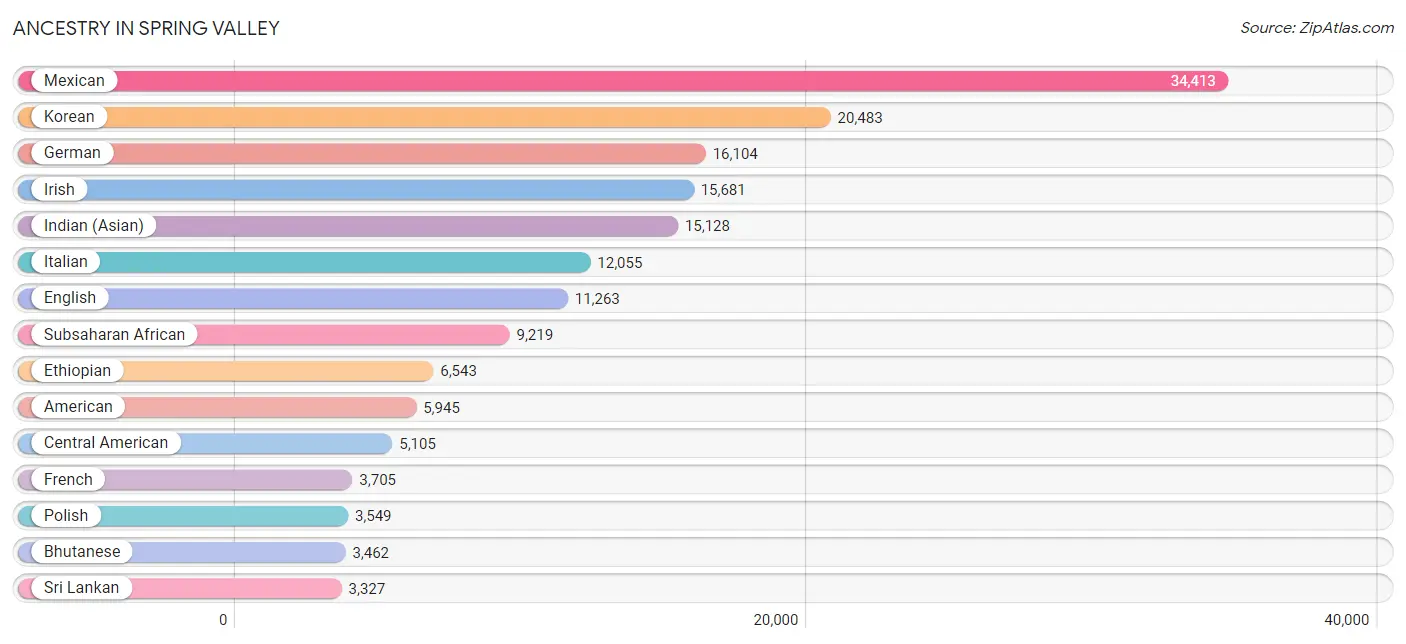
Ancestry in Spring Valley
The most populous ancestries reported in Spring Valley are Mexican (34,413 | 15.6%), Korean (20,483 | 9.3%), German (16,104 | 7.3%), Irish (15,681 | 7.1%), and Indian (Asian) (15,128 | 6.9%), together accounting for 46.2% of all Spring Valley residents.
| Ancestry | # Population | % Population |
| Afghan | 89 | 0.0% |
| African | 2,075 | 0.9% |
| Alaska Native | 13 | 0.0% |
| American | 5,945 | 2.7% |
| Apache | 158 | 0.1% |
| Arab | 1,949 | 0.9% |
| Argentinean | 422 | 0.2% |
| Armenian | 1,640 | 0.7% |
| Assyrian / Chaldean / Syriac | 50 | 0.0% |
| Australian | 140 | 0.1% |
| Austrian | 419 | 0.2% |
| Bahamian | 200 | 0.1% |
| Bangladeshi | 23 | 0.0% |
| Basque | 76 | 0.0% |
| Belgian | 183 | 0.1% |
| Belizean | 23 | 0.0% |
| Bhutanese | 3,462 | 1.6% |
| Blackfeet | 153 | 0.1% |
| Bolivian | 19 | 0.0% |
| Brazilian | 212 | 0.1% |
| British | 861 | 0.4% |
| Bulgarian | 462 | 0.2% |
| Burmese | 2,824 | 1.3% |
| Cajun | 27 | 0.0% |
| Cambodian | 89 | 0.0% |
| Canadian | 373 | 0.2% |
| Central American | 5,105 | 2.3% |
| Central American Indian | 232 | 0.1% |
| Cherokee | 983 | 0.4% |
| Cheyenne | 8 | 0.0% |
| Chickasaw | 31 | 0.0% |
| Chilean | 116 | 0.1% |
| Chippewa | 42 | 0.0% |
| Choctaw | 56 | 0.0% |
| Colombian | 692 | 0.3% |
| Costa Rican | 239 | 0.1% |
| Creek | 5 | 0.0% |
| Croatian | 149 | 0.1% |
| Cuban | 3,191 | 1.5% |
| Czech | 286 | 0.1% |
| Czechoslovakian | 71 | 0.0% |
| Danish | 900 | 0.4% |
| Dominican | 196 | 0.1% |
| Dutch | 1,094 | 0.5% |
| Eastern European | 423 | 0.2% |
| Ecuadorian | 190 | 0.1% |
| Egyptian | 357 | 0.2% |
| English | 11,263 | 5.1% |
| Ethiopian | 6,543 | 3.0% |
| European | 2,078 | 0.9% |
| Filipino | 380 | 0.2% |
| Finnish | 231 | 0.1% |
| French | 3,705 | 1.7% |
| French American Indian | 67 | 0.0% |
| French Canadian | 610 | 0.3% |
| German | 16,104 | 7.3% |
| Ghanaian | 208 | 0.1% |
| Greek | 956 | 0.4% |
| Guamanian / Chamorro | 460 | 0.2% |
| Guatemalan | 1,343 | 0.6% |
| Haitian | 137 | 0.1% |
| Honduran | 515 | 0.2% |
| Hopi | 22 | 0.0% |
| Hungarian | 973 | 0.4% |
| Icelander | 10 | 0.0% |
| Indian (Asian) | 15,128 | 6.9% |
| Indonesian | 38 | 0.0% |
| Iranian | 1,278 | 0.6% |
| Iraqi | 65 | 0.0% |
| Irish | 15,681 | 7.1% |
| Iroquois | 27 | 0.0% |
| Israeli | 449 | 0.2% |
| Italian | 12,055 | 5.5% |
| Jamaican | 223 | 0.1% |
| Japanese | 286 | 0.1% |
| Jordanian | 12 | 0.0% |
| Kenyan | 59 | 0.0% |
| Korean | 20,483 | 9.3% |
| Laotian | 200 | 0.1% |
| Latvian | 129 | 0.1% |
| Lebanese | 242 | 0.1% |
| Liberian | 42 | 0.0% |
| Lithuanian | 183 | 0.1% |
| Luxembourger | 9 | 0.0% |
| Macedonian | 24 | 0.0% |
| Malaysian | 1,104 | 0.5% |
| Maltese | 167 | 0.1% |
| Mexican | 34,413 | 15.6% |
| Mexican American Indian | 342 | 0.2% |
| Mongolian | 74 | 0.0% |
| Moroccan | 367 | 0.2% |
| Native Hawaiian | 2,161 | 1.0% |
| Navajo | 241 | 0.1% |
| New Zealander | 45 | 0.0% |
| Nicaraguan | 645 | 0.3% |
| Nigerian | 112 | 0.1% |
| Northern European | 99 | 0.0% |
| Norwegian | 1,629 | 0.7% |
| Okinawan | 17 | 0.0% |
| Osage | 29 | 0.0% |
| Paiute | 29 | 0.0% |
| Pakistani | 1,593 | 0.7% |
| Palestinian | 40 | 0.0% |
| Panamanian | 254 | 0.1% |
| Pennsylvania German | 179 | 0.1% |
| Peruvian | 1,331 | 0.6% |
| Polish | 3,549 | 1.6% |
| Portuguese | 1,046 | 0.5% |
| Potawatomi | 13 | 0.0% |
| Pueblo | 65 | 0.0% |
| Puerto Rican | 2,601 | 1.2% |
| Puget Sound Salish | 5 | 0.0% |
| Romanian | 608 | 0.3% |
| Russian | 2,222 | 1.0% |
| Salvadoran | 2,109 | 1.0% |
| Samoan | 302 | 0.1% |
| Scandinavian | 327 | 0.2% |
| Scotch-Irish | 581 | 0.3% |
| Scottish | 2,742 | 1.3% |
| Seminole | 111 | 0.1% |
| Serbian | 1,487 | 0.7% |
| Sierra Leonean | 150 | 0.1% |
| Sioux | 121 | 0.1% |
| Slavic | 24 | 0.0% |
| Slovak | 251 | 0.1% |
| Slovene | 13 | 0.0% |
| South African | 96 | 0.0% |
| South American | 3,166 | 1.4% |
| Spaniard | 931 | 0.4% |
| Spanish | 1,540 | 0.7% |
| Spanish American | 115 | 0.1% |
| Spanish American Indian | 16 | 0.0% |
| Sri Lankan | 3,327 | 1.5% |
| Subsaharan African | 9,219 | 4.2% |
| Sudanese | 18 | 0.0% |
| Swedish | 1,560 | 0.7% |
| Swiss | 235 | 0.1% |
| Syrian | 178 | 0.1% |
| Thai | 1,425 | 0.6% |
| Tlingit-Haida | 28 | 0.0% |
| Tohono O'Odham | 38 | 0.0% |
| Tongan | 38 | 0.0% |
| Trinidadian and Tobagonian | 32 | 0.0% |
| Turkish | 101 | 0.1% |
| Ukrainian | 824 | 0.4% |
| Uruguayan | 83 | 0.0% |
| Venezuelan | 310 | 0.1% |
| Welsh | 753 | 0.3% |
| West Indian | 59 | 0.0% |
| Yaqui | 123 | 0.1% |
| Yugoslavian | 365 | 0.2% | View All 151 Rows |
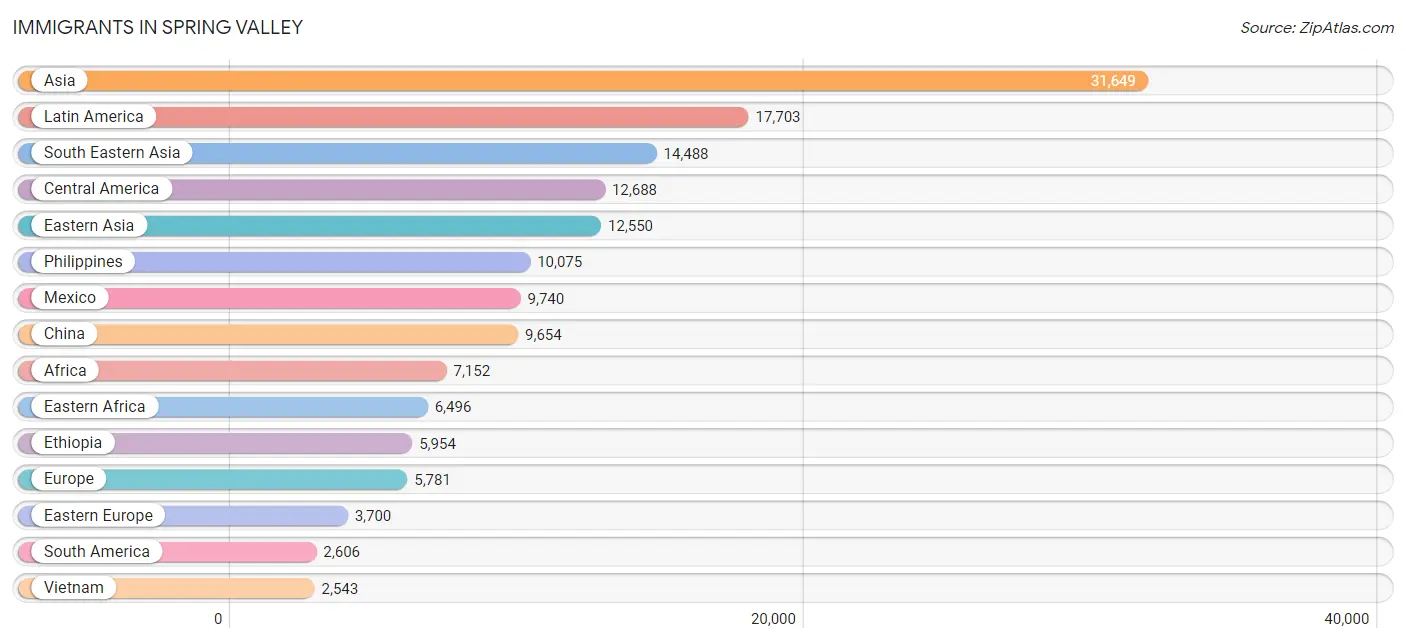
Immigrants in Spring Valley
The most numerous immigrant groups reported in Spring Valley came from Asia (31,649 | 14.4%), Latin America (17,703 | 8.0%), South Eastern Asia (14,488 | 6.6%), Central America (12,688 | 5.8%), and Eastern Asia (12,550 | 5.7%), together accounting for 40.5% of all Spring Valley residents.
| Immigration Origin | # Population | % Population |
| Afghanistan | 130 | 0.1% |
| Africa | 7,152 | 3.3% |
| Albania | 22 | 0.0% |
| Argentina | 523 | 0.2% |
| Armenia | 742 | 0.3% |
| Asia | 31,649 | 14.4% |
| Australia | 114 | 0.1% |
| Austria | 26 | 0.0% |
| Belarus | 22 | 0.0% |
| Belgium | 37 | 0.0% |
| Belize | 27 | 0.0% |
| Bolivia | 19 | 0.0% |
| Bosnia and Herzegovina | 694 | 0.3% |
| Brazil | 241 | 0.1% |
| Bulgaria | 493 | 0.2% |
| Cambodia | 71 | 0.0% |
| Canada | 990 | 0.4% |
| Caribbean | 2,409 | 1.1% |
| Central America | 12,688 | 5.8% |
| Chile | 73 | 0.0% |
| China | 9,654 | 4.4% |
| Colombia | 356 | 0.2% |
| Costa Rica | 121 | 0.1% |
| Croatia | 98 | 0.0% |
| Cuba | 2,141 | 1.0% |
| Czechoslovakia | 52 | 0.0% |
| Denmark | 101 | 0.1% |
| Dominican Republic | 60 | 0.0% |
| Eastern Africa | 6,496 | 2.9% |
| Eastern Asia | 12,550 | 5.7% |
| Eastern Europe | 3,700 | 1.7% |
| Ecuador | 66 | 0.0% |
| Egypt | 160 | 0.1% |
| El Salvador | 1,281 | 0.6% |
| England | 298 | 0.1% |
| Eritrea | 410 | 0.2% |
| Ethiopia | 5,954 | 2.7% |
| Europe | 5,781 | 2.6% |
| Fiji | 100 | 0.1% |
| France | 212 | 0.1% |
| Germany | 459 | 0.2% |
| Greece | 110 | 0.1% |
| Guatemala | 665 | 0.3% |
| Haiti | 51 | 0.0% |
| Honduras | 320 | 0.2% |
| Hong Kong | 1,004 | 0.5% |
| Hungary | 164 | 0.1% |
| India | 708 | 0.3% |
| Indonesia | 186 | 0.1% |
| Iran | 1,059 | 0.5% |
| Iraq | 125 | 0.1% |
| Ireland | 51 | 0.0% |
| Israel | 571 | 0.3% |
| Italy | 173 | 0.1% |
| Jamaica | 68 | 0.0% |
| Japan | 575 | 0.3% |
| Jordan | 55 | 0.0% |
| Kazakhstan | 32 | 0.0% |
| Kenya | 58 | 0.0% |
| Korea | 2,283 | 1.0% |
| Laos | 225 | 0.1% |
| Latin America | 17,703 | 8.0% |
| Latvia | 123 | 0.1% |
| Lebanon | 225 | 0.1% |
| Lithuania | 7 | 0.0% |
| Malaysia | 94 | 0.0% |
| Mexico | 9,740 | 4.4% |
| Moldova | 31 | 0.0% |
| Morocco | 126 | 0.1% |
| Nepal | 14 | 0.0% |
| Netherlands | 50 | 0.0% |
| Nicaragua | 425 | 0.2% |
| Nigeria | 76 | 0.0% |
| North Macedonia | 83 | 0.0% |
| Northern Africa | 414 | 0.2% |
| Northern Europe | 846 | 0.4% |
| Norway | 20 | 0.0% |
| Oceania | 313 | 0.1% |
| Pakistan | 57 | 0.0% |
| Panama | 109 | 0.1% |
| Peru | 998 | 0.4% |
| Philippines | 10,075 | 4.6% |
| Poland | 101 | 0.1% |
| Portugal | 68 | 0.0% |
| Romania | 339 | 0.2% |
| Russia | 598 | 0.3% |
| Saudi Arabia | 52 | 0.0% |
| Scotland | 27 | 0.0% |
| Serbia | 264 | 0.1% |
| Sierra Leone | 52 | 0.0% |
| Singapore | 88 | 0.0% |
| Somalia | 30 | 0.0% |
| South Africa | 104 | 0.1% |
| South America | 2,606 | 1.2% |
| South Central Asia | 2,523 | 1.1% |
| South Eastern Asia | 14,488 | 6.6% |
| Southern Europe | 387 | 0.2% |
| Spain | 36 | 0.0% |
| Sri Lanka | 288 | 0.1% |
| Sudan | 68 | 0.0% |
| Sweden | 39 | 0.0% |
| Syria | 146 | 0.1% |
| Taiwan | 1,138 | 0.5% |
| Thailand | 1,102 | 0.5% |
| Trinidad and Tobago | 89 | 0.0% |
| Turkey | 80 | 0.0% |
| Uganda | 35 | 0.0% |
| Ukraine | 389 | 0.2% |
| Uruguay | 33 | 0.0% |
| Venezuela | 206 | 0.1% |
| Vietnam | 2,543 | 1.2% |
| Western Africa | 128 | 0.1% |
| Western Asia | 2,052 | 0.9% |
| Western Europe | 784 | 0.4% |
| Zimbabwe | 9 | 0.0% | View All 115 Rows |
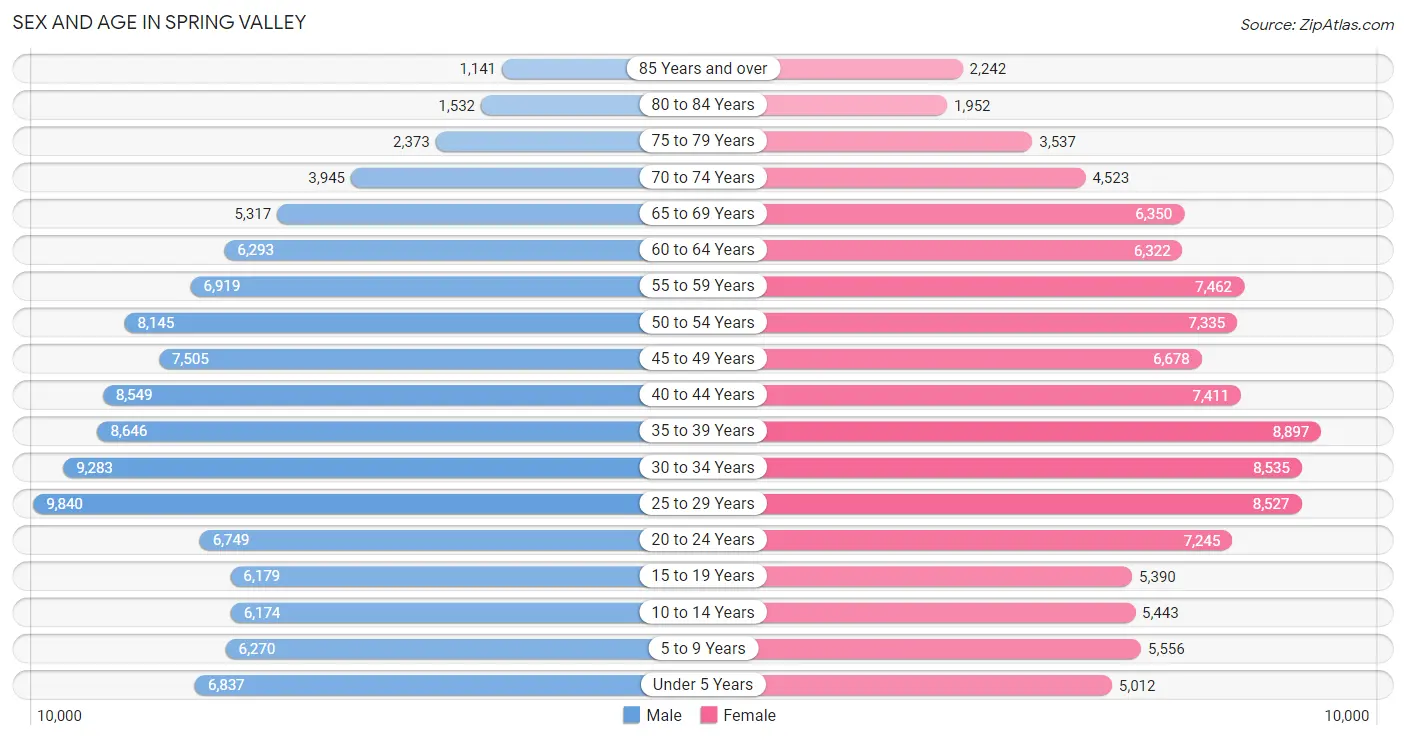
Sex and Age in Spring Valley
Sex and Age in Spring Valley
The most populous age groups in Spring Valley are 25 to 29 Years (9,840 | 8.8%) for men and 35 to 39 Years (8,897 | 8.2%) for women.
| Age Bracket | Male | Female |
| Under 5 Years | 6,837 (6.1%) | 5,012 (4.6%) |
| 5 to 9 Years | 6,270 (5.6%) | 5,556 (5.1%) |
| 10 to 14 Years | 6,174 (5.5%) | 5,443 (5.0%) |
| 15 to 19 Years | 6,179 (5.5%) | 5,390 (5.0%) |
| 20 to 24 Years | 6,749 (6.0%) | 7,245 (6.7%) |
| 25 to 29 Years | 9,840 (8.8%) | 8,527 (7.9%) |
| 30 to 34 Years | 9,283 (8.3%) | 8,535 (7.9%) |
| 35 to 39 Years | 8,646 (7.7%) | 8,897 (8.2%) |
| 40 to 44 Years | 8,549 (7.6%) | 7,411 (6.8%) |
| 45 to 49 Years | 7,505 (6.7%) | 6,678 (6.2%) |
| 50 to 54 Years | 8,145 (7.3%) | 7,335 (6.8%) |
| 55 to 59 Years | 6,919 (6.2%) | 7,462 (6.9%) |
| 60 to 64 Years | 6,293 (5.6%) | 6,322 (5.8%) |
| 65 to 69 Years | 5,317 (4.8%) | 6,350 (5.9%) |
| 70 to 74 Years | 3,945 (3.5%) | 4,523 (4.2%) |
| 75 to 79 Years | 2,373 (2.1%) | 3,537 (3.3%) |
| 80 to 84 Years | 1,532 (1.4%) | 1,952 (1.8%) |
| 85 Years and over | 1,141 (1.0%) | 2,242 (2.1%) |
| Total | 111,697 (100.0%) | 108,417 (100.0%) |
Families and Households in Spring Valley
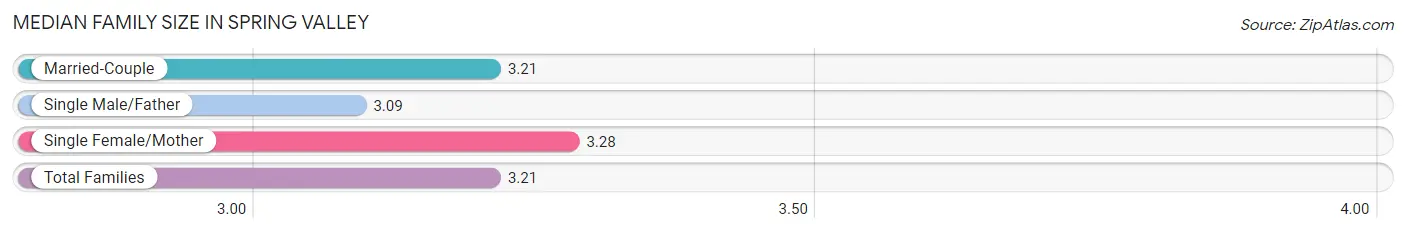
Median Family Size in Spring Valley
The median family size in Spring Valley is 3.21 persons per family, with single female/mother families (12,141 | 23.4%) accounting for the largest median family size of 3.28 persons per family. On the other hand, single male/father families (6,692 | 12.9%) represent the smallest median family size with 3.09 persons per family.
| Family Type | # Families | Family Size |
| Married-Couple | 33,033 (63.7%) | 3.21 |
| Single Male/Father | 6,692 (12.9%) | 3.09 |
| Single Female/Mother | 12,141 (23.4%) | 3.28 |
| Total Families | 51,866 (100.0%) | 3.21 |
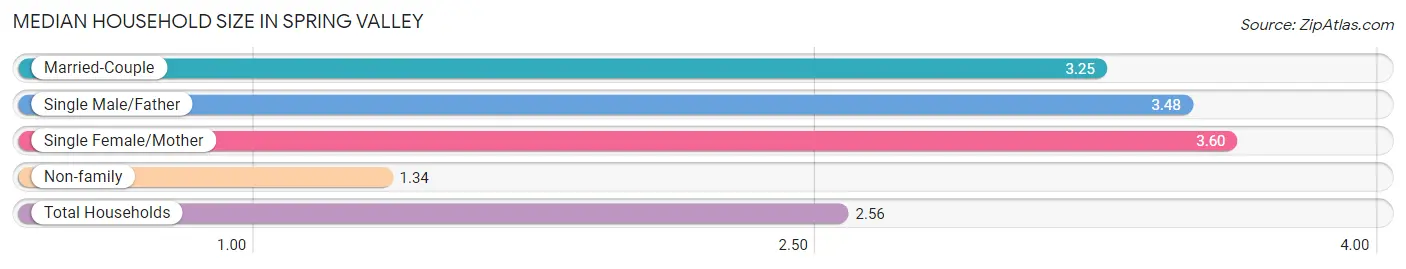
Median Household Size in Spring Valley
The median household size in Spring Valley is 2.56 persons per household, with single female/mother households (12,141 | 14.1%) accounting for the largest median household size of 3.6 persons per household. non-family households (34,049 | 39.6%) represent the smallest median household size with 1.34 persons per household.
| Household Type | # Households | Household Size |
| Married-Couple | 33,033 (38.5%) | 3.25 |
| Single Male/Father | 6,692 (7.8%) | 3.48 |
| Single Female/Mother | 12,141 (14.1%) | 3.60 |
| Non-family | 34,049 (39.6%) | 1.34 |
| Total Households | 85,915 (100.0%) | 2.56 |
Household Size by Marriage Status in Spring Valley
Out of a total of 85,915 households in Spring Valley, 51,866 (60.4%) are family households, while 34,049 (39.6%) are nonfamily households. The most numerous type of family households are 2-person households, comprising 21,911, and the most common type of nonfamily households are 1-person households, comprising 26,001.
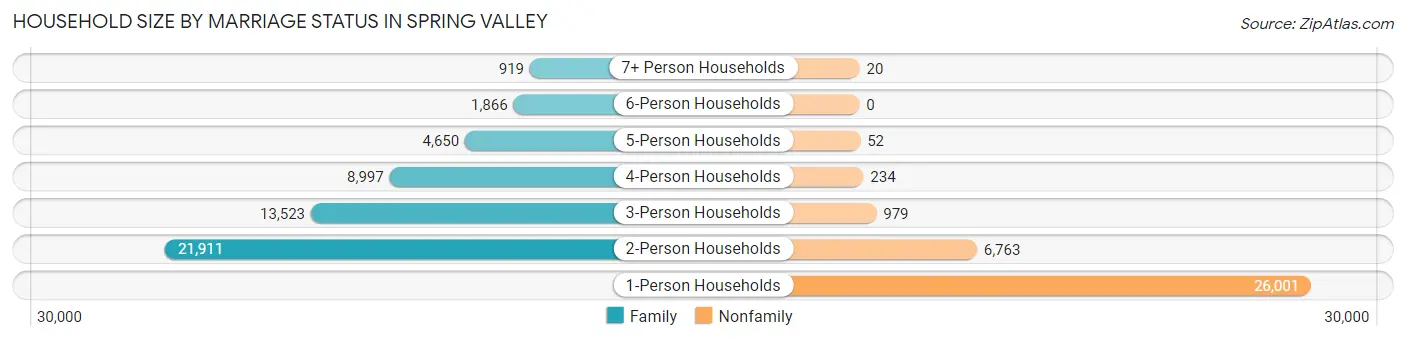
| Household Size | Family Households | Nonfamily Households |
| 1-Person Households | - | 26,001 (30.3%) |
| 2-Person Households | 21,911 (25.5%) | 6,763 (7.9%) |
| 3-Person Households | 13,523 (15.7%) | 979 (1.1%) |
| 4-Person Households | 8,997 (10.5%) | 234 (0.3%) |
| 5-Person Households | 4,650 (5.4%) | 52 (0.1%) |
| 6-Person Households | 1,866 (2.2%) | 0 (0.0%) |
| 7+ Person Households | 919 (1.1%) | 20 (0.0%) |
| Total | 51,866 (60.4%) | 34,049 (39.6%) |
Female Fertility in Spring Valley
Fertility by Age in Spring Valley
Average fertility rate in Spring Valley is 44.0 births per 1,000 women. Women in the age bracket of 20 to 34 years have the highest fertility rate with 58.0 births per 1,000 women. Women in the age bracket of 20 to 34 years acount for 59.6% of all women with births.
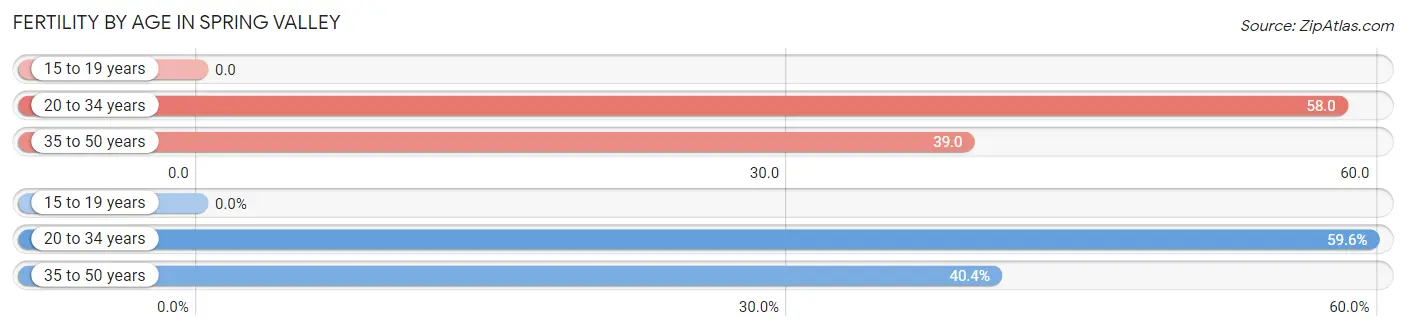
| Age Bracket | Women with Births | Births / 1,000 Women |
| 15 to 19 years | 0 (0.0%) | 0.0 |
| 20 to 34 years | 1,408 (59.6%) | 58.0 |
| 35 to 50 years | 954 (40.4%) | 39.0 |
| Total | 2,362 (100.0%) | 44.0 |
Fertility by Age by Marriage Status in Spring Valley
59.7% of women with births (2,362) in Spring Valley are married. The highest percentage of unmarried women with births falls into 20 to 34 years age bracket with 48.4% of them unmarried at the time of birth, while the lowest percentage of unmarried women with births belong to 35 to 50 years age bracket with 28.2% of them unmarried.
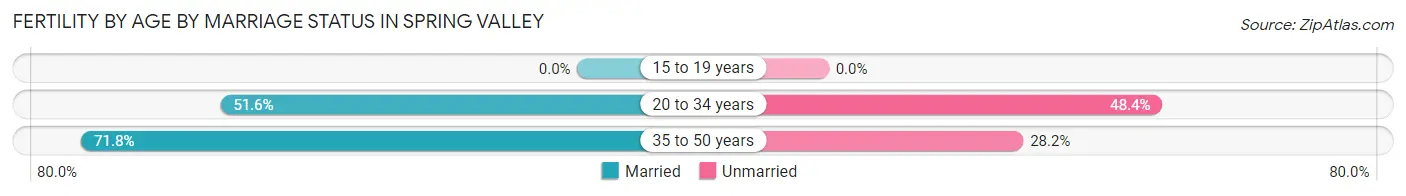
| Age Bracket | Married | Unmarried |
| 15 to 19 years | 0 (0.0%) | 0 (0.0%) |
| 20 to 34 years | 727 (51.6%) | 681 (48.4%) |
| 35 to 50 years | 685 (71.8%) | 269 (28.2%) |
| Total | 1,410 (59.7%) | 952 (40.3%) |
Fertility by Education in Spring Valley
Average fertility rate in Spring Valley is 44.0 births per 1,000 women. Women with the education attainment of bachelor's degree have the highest fertility rate of 55.0 births per 1,000 women, while women with the education attainment of college or associate's degree have the lowest fertility at 37.0 births per 1,000 women. Women with the education attainment of college or associate's degree represent 27.5% of all women with births.
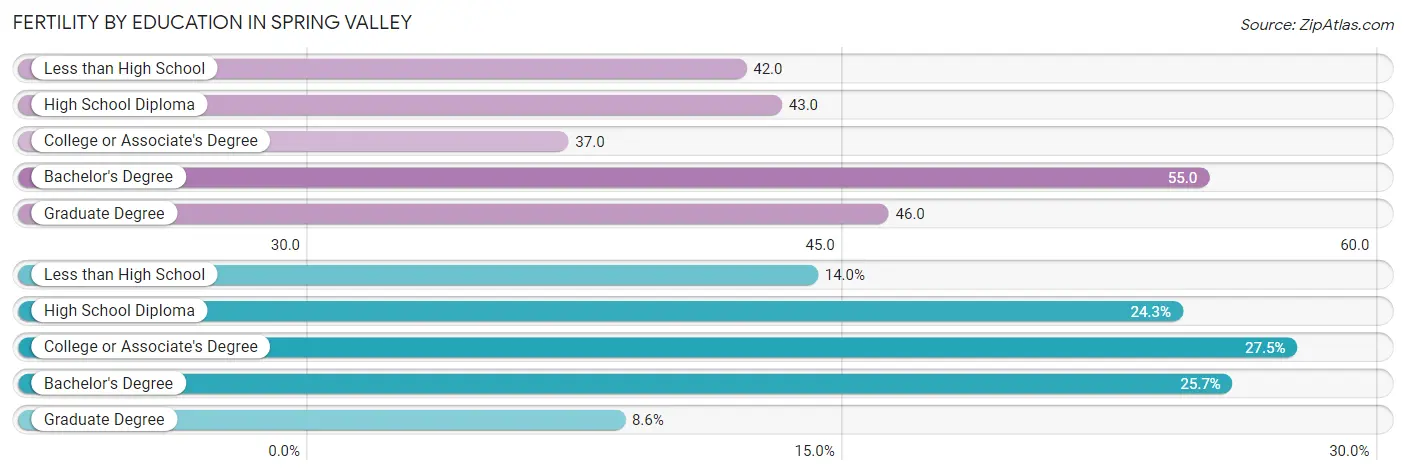
| Educational Attainment | Women with Births | Births / 1,000 Women |
| Less than High School | 331 (14.0%) | 42.0 |
| High School Diploma | 573 (24.3%) | 43.0 |
| College or Associate's Degree | 649 (27.5%) | 37.0 |
| Bachelor's Degree | 606 (25.7%) | 55.0 |
| Graduate Degree | 203 (8.6%) | 46.0 |
| Total | 2,362 (100.0%) | 44.0 |
Fertility by Education by Marriage Status in Spring Valley
40.3% of women with births in Spring Valley are unmarried. Women with the educational attainment of graduate degree are most likely to be married with 100.0% of them married at childbirth, while women with the educational attainment of high school diploma are least likely to be married with 79.2% of them unmarried at childbirth.
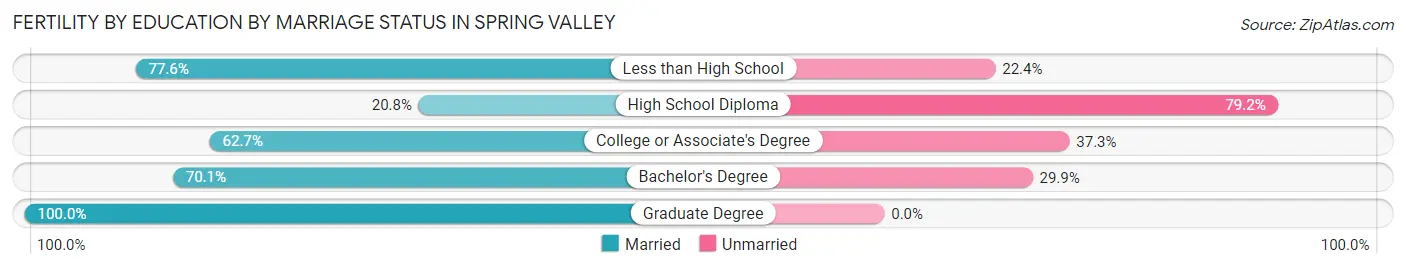
| Educational Attainment | Married | Unmarried |
| Less than High School | 257 (77.6%) | 74 (22.4%) |
| High School Diploma | 119 (20.8%) | 454 (79.2%) |
| College or Associate's Degree | 407 (62.7%) | 242 (37.3%) |
| Bachelor's Degree | 425 (70.1%) | 181 (29.9%) |
| Graduate Degree | 203 (100.0%) | 0 (0.0%) |
| Total | 1,410 (59.7%) | 952 (40.3%) |
Employment Characteristics in Spring Valley
Employment by Class of Employer in Spring Valley
Among the 111,145 employed individuals in Spring Valley, private company employees (88,459 | 79.6%), self-employed (not incorporated) (6,182 | 5.6%), and local government employees (5,241 | 4.7%) make up the most common classes of employment.
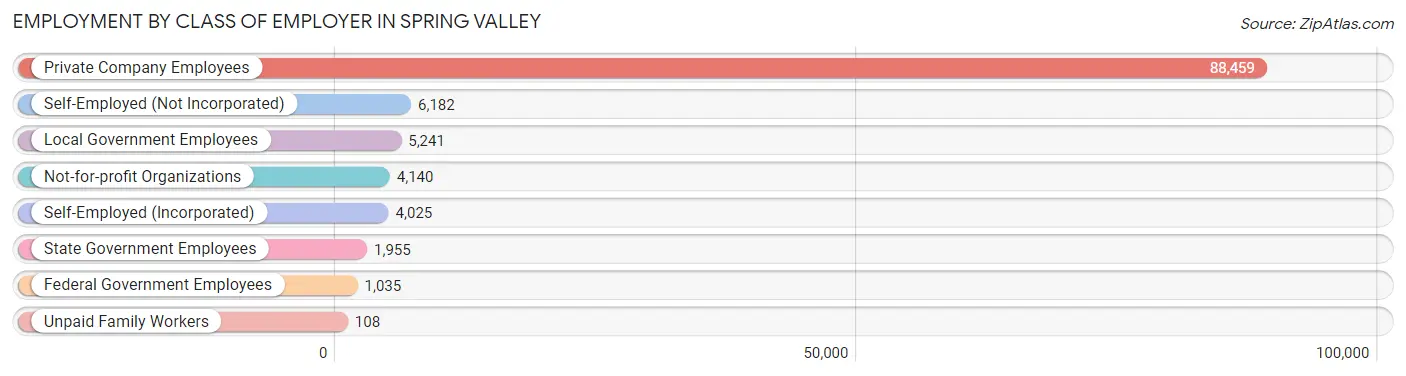
| Employer Class | # Employees | % Employees |
| Private Company Employees | 88,459 | 79.6% |
| Self-Employed (Incorporated) | 4,025 | 3.6% |
| Self-Employed (Not Incorporated) | 6,182 | 5.6% |
| Not-for-profit Organizations | 4,140 | 3.7% |
| Local Government Employees | 5,241 | 4.7% |
| State Government Employees | 1,955 | 1.8% |
| Federal Government Employees | 1,035 | 0.9% |
| Unpaid Family Workers | 108 | 0.1% |
| Total | 111,145 | 100.0% |
Employment Status by Age in Spring Valley
According to the labor force statistics for Spring Valley, out of the total population over 16 years of age (182,429), 67.8% or 123,687 individuals are in the labor force, with 7.6% or 9,400 of them unemployed. The age group with the highest labor force participation rate is 30 to 34 years, with 86.9% or 15,484 individuals in the labor force. Within the labor force, the 16 to 19 years age range has the highest percentage of unemployed individuals, with 13.7% or 451 of them being unemployed.
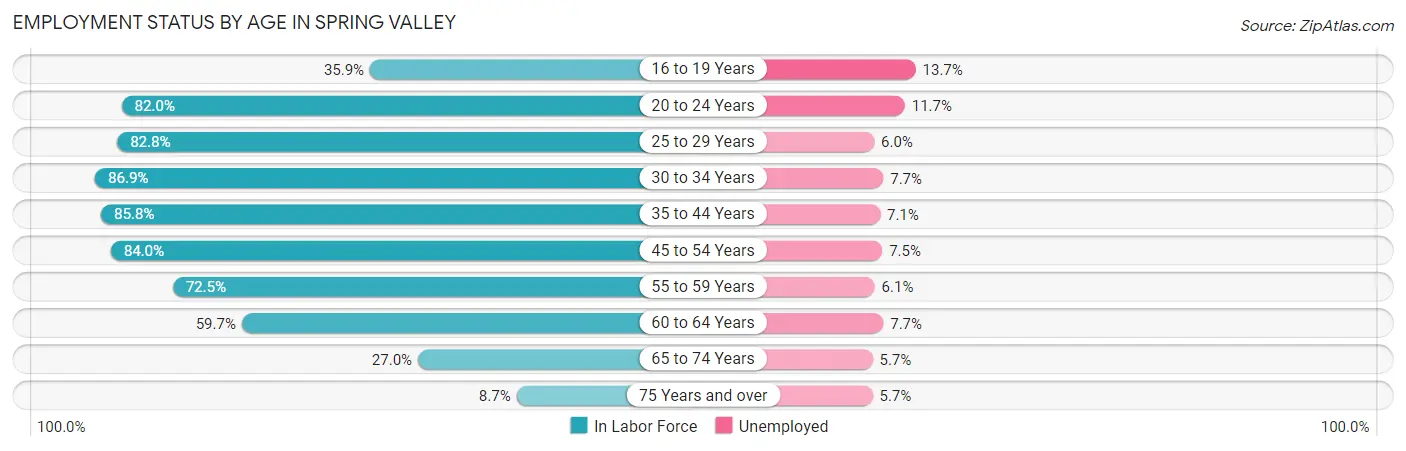
| Age Bracket | In Labor Force | Unemployed |
| 16 to 19 Years | 3,294 (35.9%) | 451 (13.7%) |
| 20 to 24 Years | 11,475 (82.0%) | 1,343 (11.7%) |
| 25 to 29 Years | 15,208 (82.8%) | 912 (6.0%) |
| 30 to 34 Years | 15,484 (86.9%) | 1,192 (7.7%) |
| 35 to 44 Years | 28,746 (85.8%) | 2,041 (7.1%) |
| 45 to 54 Years | 24,917 (84.0%) | 1,869 (7.5%) |
| 55 to 59 Years | 10,426 (72.5%) | 636 (6.1%) |
| 60 to 64 Years | 7,531 (59.7%) | 580 (7.7%) |
| 65 to 74 Years | 5,436 (27.0%) | 310 (5.7%) |
| 75 Years and over | 1,112 (8.7%) | 63 (5.7%) |
| Total | 123,687 (67.8%) | 9,400 (7.6%) |
Employment Status by Educational Attainment in Spring Valley
According to labor force statistics for Spring Valley, 81.0% of individuals (102,341) out of the total population between 25 and 64 years of age (126,347) are in the labor force, with 7.1% or 7,266 of them being unemployed. The group with the highest labor force participation rate are those with the educational attainment of bachelor's degree or higher, with 86.4% or 33,284 individuals in the labor force. Within the labor force, individuals with high school diploma education have the highest percentage of unemployment, with 8.7% or 2,329 of them being unemployed.
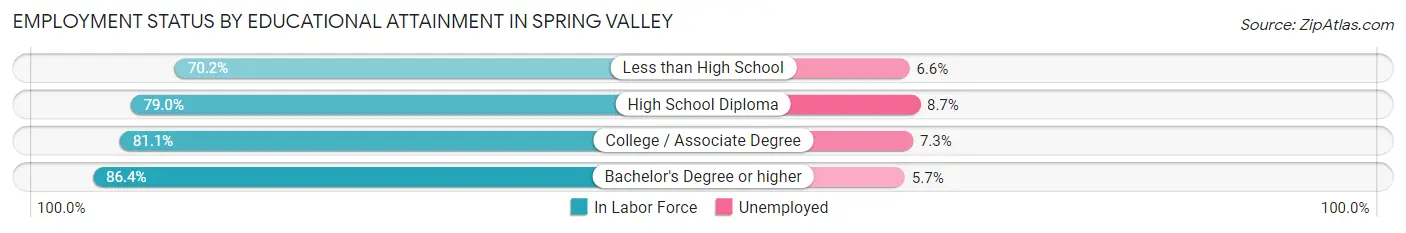
| Educational Attainment | In Labor Force | Unemployed |
| Less than High School | 9,528 (70.2%) | 896 (6.6%) |
| High School Diploma | 26,772 (79.0%) | 2,948 (8.7%) |
| College / Associate Degree | 32,734 (81.1%) | 2,946 (7.3%) |
| Bachelor's Degree or higher | 33,284 (86.4%) | 2,196 (5.7%) |
| Total | 102,341 (81.0%) | 8,971 (7.1%) |
Employment Occupations by Sex in Spring Valley
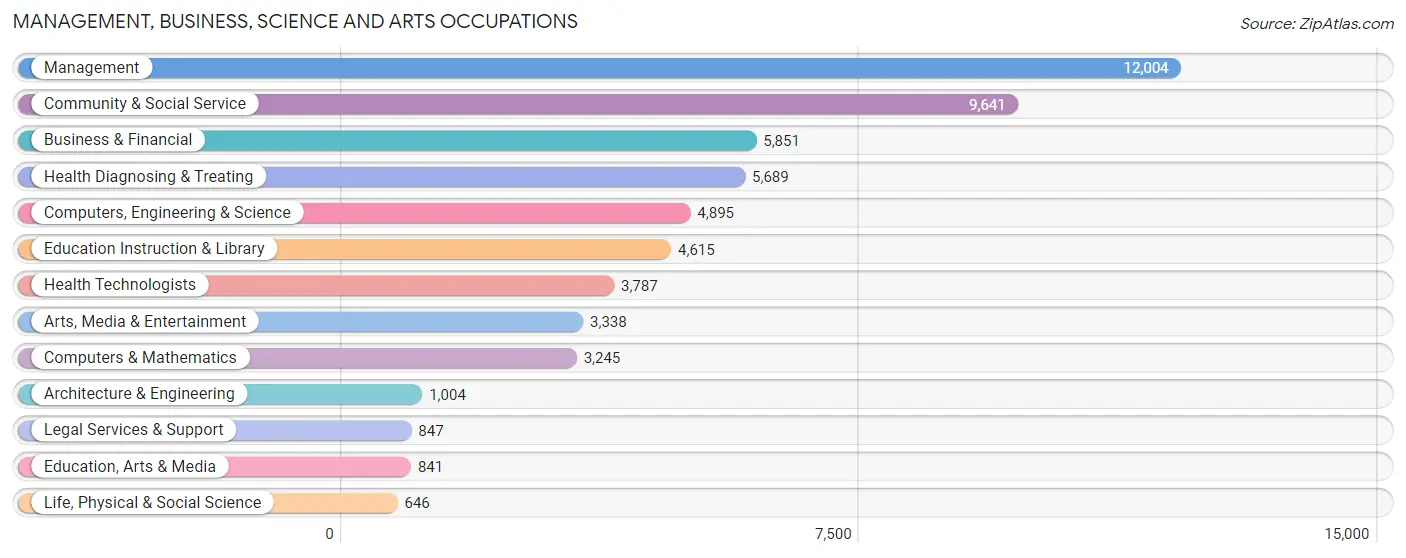
Management, Business, Science and Arts Occupations
The most common Management, Business, Science and Arts occupations in Spring Valley are Management (12,004 | 10.5%), Community & Social Service (9,641 | 8.5%), Business & Financial (5,851 | 5.1%), Health Diagnosing & Treating (5,689 | 5.0%), and Computers, Engineering & Science (4,895 | 4.3%).
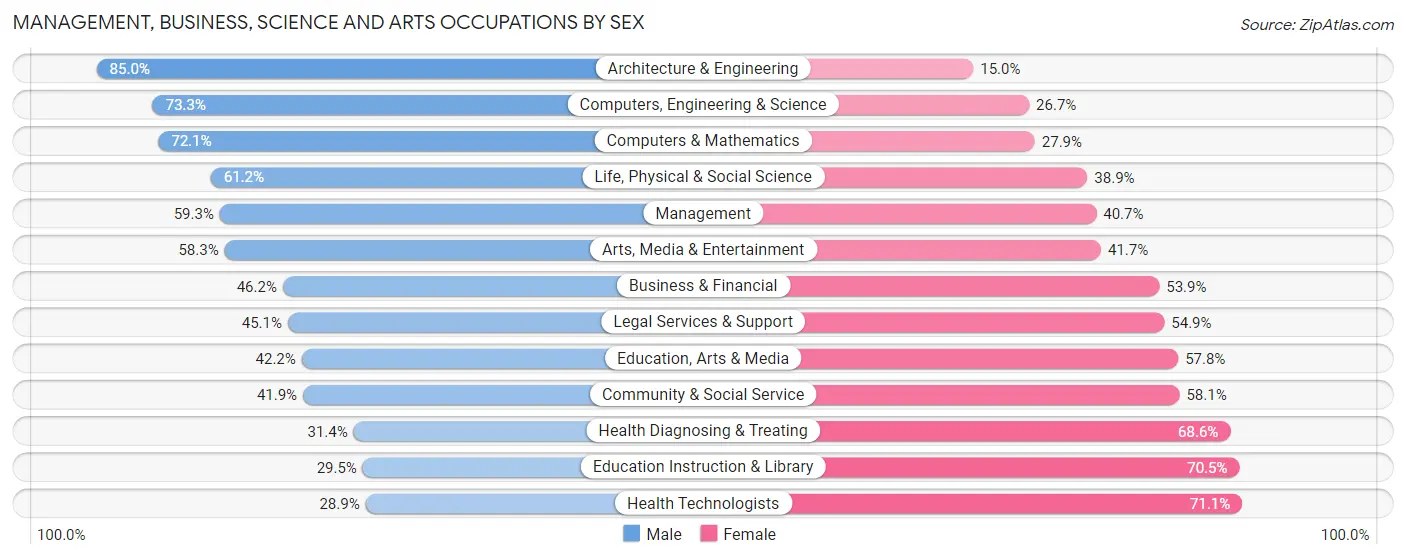
Management, Business, Science and Arts Occupations by Sex
Within the Management, Business, Science and Arts occupations in Spring Valley, the most male-oriented occupations are Architecture & Engineering (85.0%), Computers, Engineering & Science (73.3%), and Computers & Mathematics (72.1%), while the most female-oriented occupations are Health Technologists (71.1%), Education Instruction & Library (70.5%), and Health Diagnosing & Treating (68.6%).
| Occupation | Male | Female |
| Management | 7,117 (59.3%) | 4,887 (40.7%) |
| Business & Financial | 2,700 (46.2%) | 3,151 (53.8%) |
| Computers, Engineering & Science | 3,588 (73.3%) | 1,307 (26.7%) |
| Computers & Mathematics | 2,340 (72.1%) | 905 (27.9%) |
| Architecture & Engineering | 853 (85.0%) | 151 (15.0%) |
| Life, Physical & Social Science | 395 (61.2%) | 251 (38.9%) |
| Community & Social Service | 4,043 (41.9%) | 5,598 (58.1%) |
| Education, Arts & Media | 355 (42.2%) | 486 (57.8%) |
| Legal Services & Support | 382 (45.1%) | 465 (54.9%) |
| Education Instruction & Library | 1,360 (29.5%) | 3,255 (70.5%) |
| Arts, Media & Entertainment | 1,946 (58.3%) | 1,392 (41.7%) |
| Health Diagnosing & Treating | 1,785 (31.4%) | 3,904 (68.6%) |
| Health Technologists | 1,094 (28.9%) | 2,693 (71.1%) |
| Total (Category) | 19,233 (50.5%) | 18,847 (49.5%) |
| Total (Overall) | 60,894 (53.4%) | 53,165 (46.6%) |
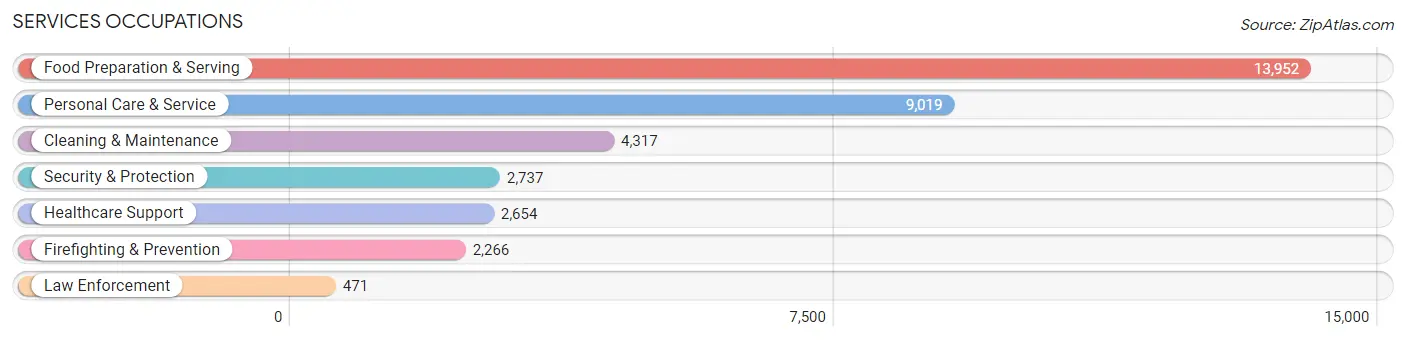
Services Occupations
The most common Services occupations in Spring Valley are Food Preparation & Serving (13,952 | 12.2%), Personal Care & Service (9,019 | 7.9%), Cleaning & Maintenance (4,317 | 3.8%), Security & Protection (2,737 | 2.4%), and Healthcare Support (2,654 | 2.3%).
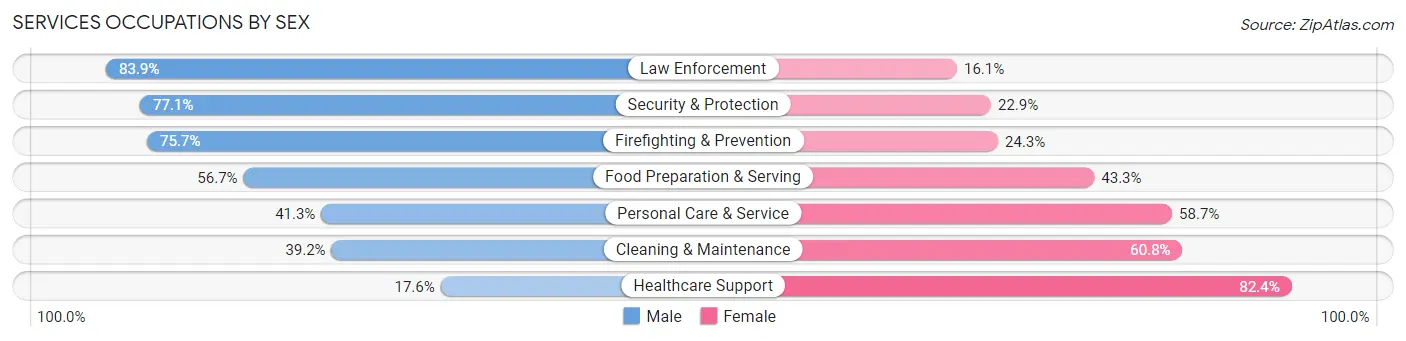
Services Occupations by Sex
Within the Services occupations in Spring Valley, the most male-oriented occupations are Law Enforcement (83.9%), Security & Protection (77.1%), and Firefighting & Prevention (75.7%), while the most female-oriented occupations are Healthcare Support (82.4%), Cleaning & Maintenance (60.8%), and Personal Care & Service (58.7%).
| Occupation | Male | Female |
| Healthcare Support | 468 (17.6%) | 2,186 (82.4%) |
| Security & Protection | 2,111 (77.1%) | 626 (22.9%) |
| Firefighting & Prevention | 1,716 (75.7%) | 550 (24.3%) |
| Law Enforcement | 395 (83.9%) | 76 (16.1%) |
| Food Preparation & Serving | 7,907 (56.7%) | 6,045 (43.3%) |
| Cleaning & Maintenance | 1,694 (39.2%) | 2,623 (60.8%) |
| Personal Care & Service | 3,722 (41.3%) | 5,297 (58.7%) |
| Total (Category) | 15,902 (48.7%) | 16,777 (51.3%) |
| Total (Overall) | 60,894 (53.4%) | 53,165 (46.6%) |
Sales and Office Occupations
The most common Sales and Office occupations in Spring Valley are Sales & Related (12,691 | 11.1%), and Office & Administration (12,390 | 10.9%).

Sales and Office Occupations by Sex
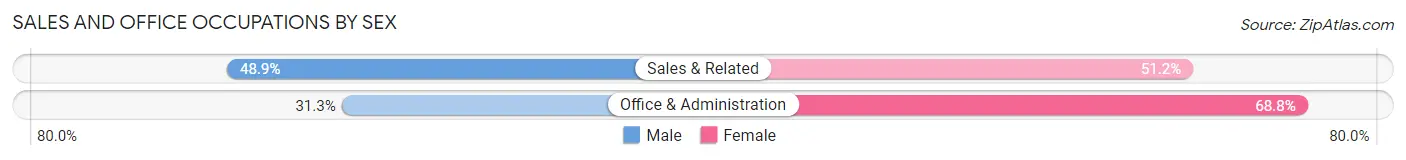
| Occupation | Male | Female |
| Sales & Related | 6,200 (48.8%) | 6,491 (51.1%) |
| Office & Administration | 3,872 (31.2%) | 8,518 (68.8%) |
| Total (Category) | 10,072 (40.2%) | 15,009 (59.8%) |
| Total (Overall) | 60,894 (53.4%) | 53,165 (46.6%) |
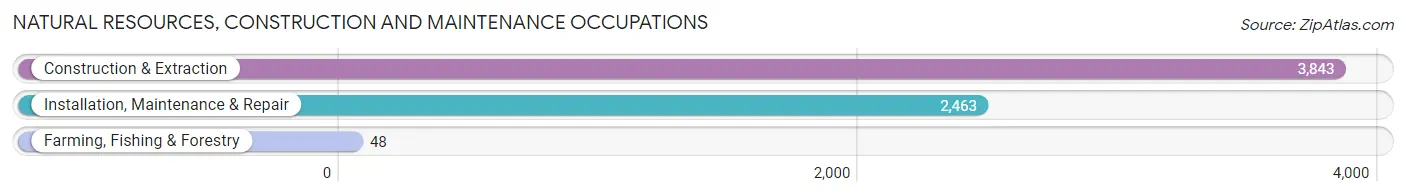
Natural Resources, Construction and Maintenance Occupations
The most common Natural Resources, Construction and Maintenance occupations in Spring Valley are Construction & Extraction (3,843 | 3.4%), Installation, Maintenance & Repair (2,463 | 2.2%), and Farming, Fishing & Forestry (48 | 0.0%).
Natural Resources, Construction and Maintenance Occupations by Sex
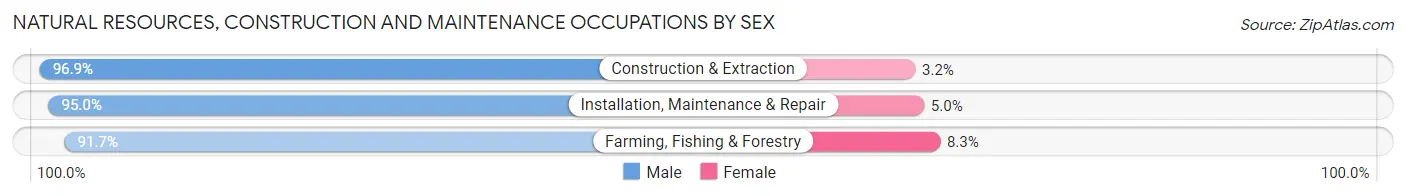
| Occupation | Male | Female |
| Farming, Fishing & Forestry | 44 (91.7%) | 4 (8.3%) |
| Construction & Extraction | 3,722 (96.9%) | 121 (3.2%) |
| Installation, Maintenance & Repair | 2,340 (95.0%) | 123 (5.0%) |
| Total (Category) | 6,106 (96.1%) | 248 (3.9%) |
| Total (Overall) | 60,894 (53.4%) | 53,165 (46.6%) |
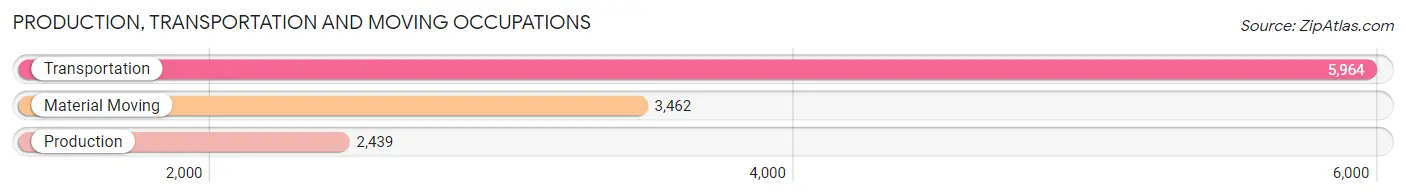
Production, Transportation and Moving Occupations
The most common Production, Transportation and Moving occupations in Spring Valley are Transportation (5,964 | 5.2%), Material Moving (3,462 | 3.0%), and Production (2,439 | 2.1%).
Production, Transportation and Moving Occupations by Sex
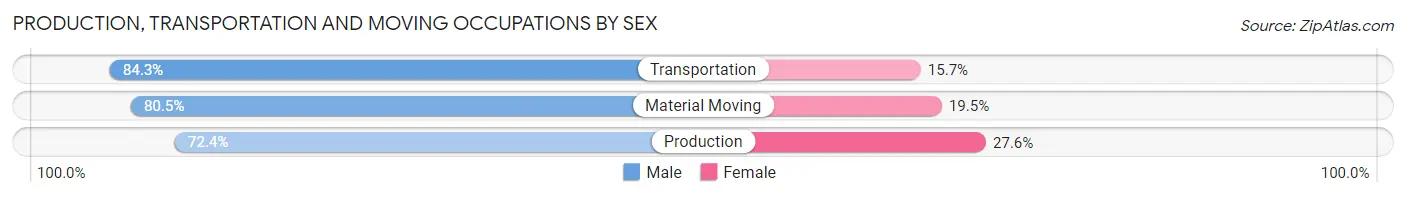
| Occupation | Male | Female |
| Production | 1,765 (72.4%) | 674 (27.6%) |
| Transportation | 5,030 (84.3%) | 934 (15.7%) |
| Material Moving | 2,786 (80.5%) | 676 (19.5%) |
| Total (Category) | 9,581 (80.7%) | 2,284 (19.3%) |
| Total (Overall) | 60,894 (53.4%) | 53,165 (46.6%) |
Employment Industries by Sex in Spring Valley
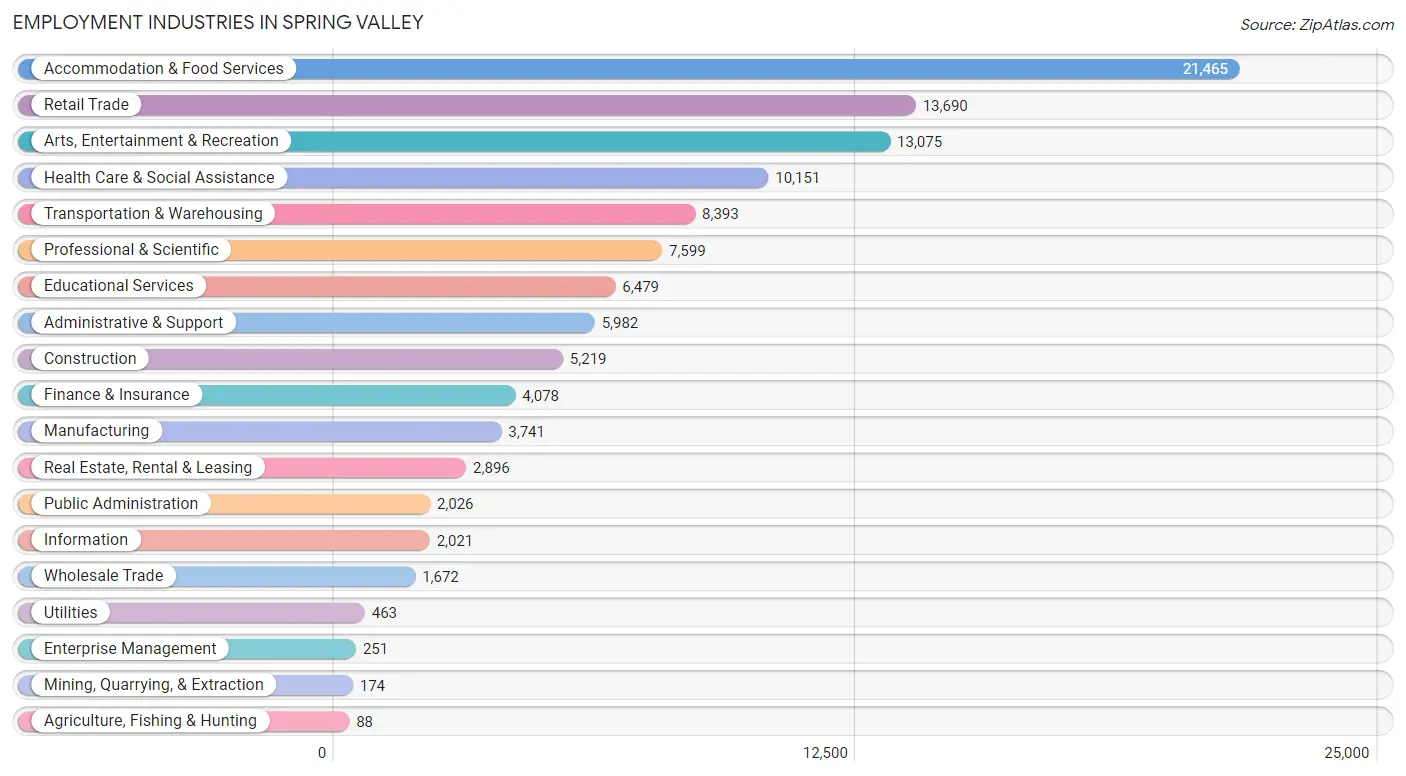
Employment Industries in Spring Valley
The major employment industries in Spring Valley include Accommodation & Food Services (21,465 | 18.8%), Retail Trade (13,690 | 12.0%), Arts, Entertainment & Recreation (13,075 | 11.5%), Health Care & Social Assistance (10,151 | 8.9%), and Transportation & Warehousing (8,393 | 7.4%).
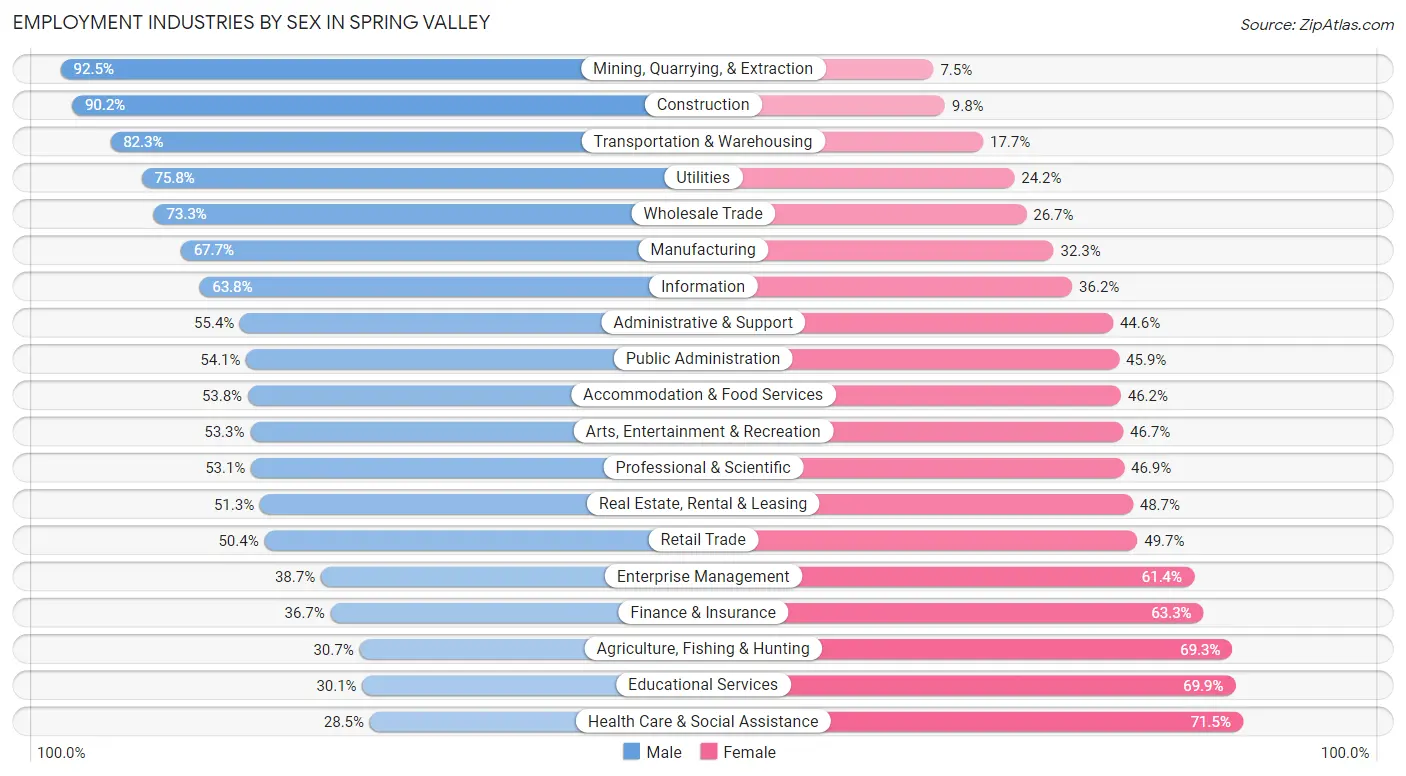
Employment Industries by Sex in Spring Valley
The Spring Valley industries that see more men than women are Mining, Quarrying, & Extraction (92.5%), Construction (90.2%), and Transportation & Warehousing (82.3%), whereas the industries that tend to have a higher number of women are Health Care & Social Assistance (71.5%), Educational Services (69.9%), and Agriculture, Fishing & Hunting (69.3%).
| Industry | Male | Female |
| Agriculture, Fishing & Hunting | 27 (30.7%) | 61 (69.3%) |
| Mining, Quarrying, & Extraction | 161 (92.5%) | 13 (7.5%) |
| Construction | 4,707 (90.2%) | 512 (9.8%) |
| Manufacturing | 2,532 (67.7%) | 1,209 (32.3%) |
| Wholesale Trade | 1,226 (73.3%) | 446 (26.7%) |
| Retail Trade | 6,893 (50.3%) | 6,797 (49.6%) |
| Transportation & Warehousing | 6,906 (82.3%) | 1,487 (17.7%) |
| Utilities | 351 (75.8%) | 112 (24.2%) |
| Information | 1,290 (63.8%) | 731 (36.2%) |
| Finance & Insurance | 1,495 (36.7%) | 2,583 (63.3%) |
| Real Estate, Rental & Leasing | 1,485 (51.3%) | 1,411 (48.7%) |
| Professional & Scientific | 4,035 (53.1%) | 3,564 (46.9%) |
| Enterprise Management | 97 (38.7%) | 154 (61.4%) |
| Administrative & Support | 3,313 (55.4%) | 2,669 (44.6%) |
| Educational Services | 1,948 (30.1%) | 4,531 (69.9%) |
| Health Care & Social Assistance | 2,896 (28.5%) | 7,255 (71.5%) |
| Arts, Entertainment & Recreation | 6,966 (53.3%) | 6,109 (46.7%) |
| Accommodation & Food Services | 11,541 (53.8%) | 9,924 (46.2%) |
| Public Administration | 1,096 (54.1%) | 930 (45.9%) |
| Total | 60,894 (53.4%) | 53,165 (46.6%) |
Education in Spring Valley
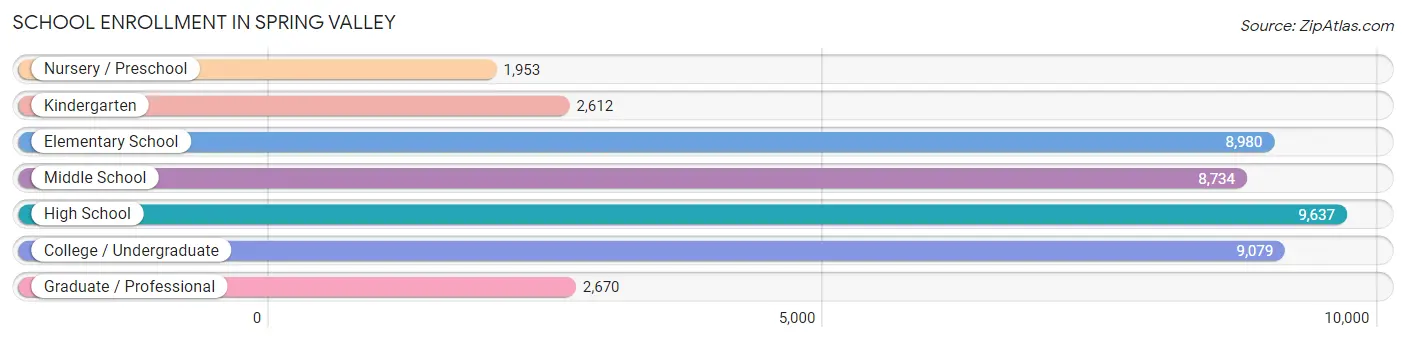
School Enrollment in Spring Valley
The most common levels of schooling among the 43,665 students in Spring Valley are high school (9,637 | 22.1%), college / undergraduate (9,079 | 20.8%), and elementary school (8,980 | 20.6%).
| School Level | # Students | % Students |
| Nursery / Preschool | 1,953 | 4.5% |
| Kindergarten | 2,612 | 6.0% |
| Elementary School | 8,980 | 20.6% |
| Middle School | 8,734 | 20.0% |
| High School | 9,637 | 22.1% |
| College / Undergraduate | 9,079 | 20.8% |
| Graduate / Professional | 2,670 | 6.1% |
| Total | 43,665 | 100.0% |
School Enrollment by Age by Funding Source in Spring Valley
Out of a total of 43,665 students who are enrolled in schools in Spring Valley, 6,462 (14.8%) attend a private institution, while the remaining 37,203 (85.2%) are enrolled in public schools. The age group of 3 to 4 year olds has the highest likelihood of being enrolled in private schools, with 799 (46.5% in the age bracket) enrolled. Conversely, the age group of 18 to 19 year olds has the lowest likelihood of being enrolled in a private school, with 2,540 (89.9% in the age bracket) attending a public institution.
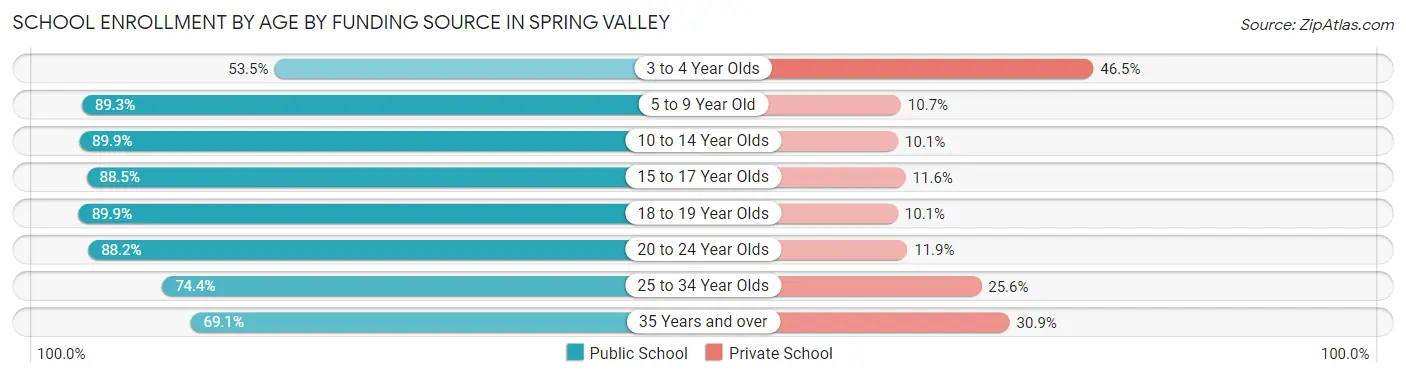
| Age Bracket | Public School | Private School |
| 3 to 4 Year Olds | 919 (53.5%) | 799 (46.5%) |
| 5 to 9 Year Old | 9,719 (89.3%) | 1,160 (10.7%) |
| 10 to 14 Year Olds | 10,077 (89.9%) | 1,137 (10.1%) |
| 15 to 17 Year Olds | 5,660 (88.4%) | 739 (11.6%) |
| 18 to 19 Year Olds | 2,540 (89.9%) | 285 (10.1%) |
| 20 to 24 Year Olds | 3,452 (88.1%) | 464 (11.8%) |
| 25 to 34 Year Olds | 2,749 (74.4%) | 948 (25.6%) |
| 35 Years and over | 2,084 (69.1%) | 933 (30.9%) |
| Total | 37,203 (85.2%) | 6,462 (14.8%) |
Educational Attainment by Field of Study in Spring Valley
Business (14,115 | 28.0%), science & technology (5,126 | 10.2%), education (4,558 | 9.0%), social sciences (3,942 | 7.8%), and arts & humanities (3,243 | 6.4%) are the most common fields of study among 50,382 individuals in Spring Valley who have obtained a bachelor's degree or higher.
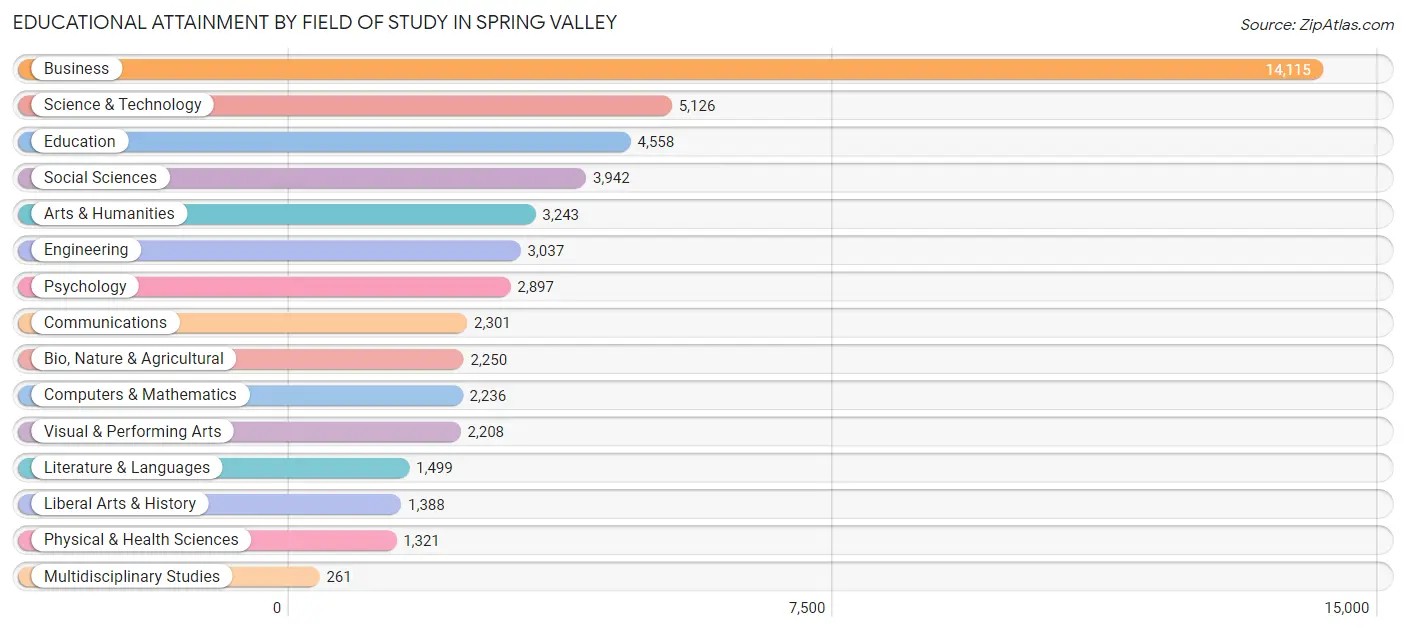
| Field of Study | # Graduates | % Graduates |
| Computers & Mathematics | 2,236 | 4.4% |
| Bio, Nature & Agricultural | 2,250 | 4.5% |
| Physical & Health Sciences | 1,321 | 2.6% |
| Psychology | 2,897 | 5.8% |
| Social Sciences | 3,942 | 7.8% |
| Engineering | 3,037 | 6.0% |
| Multidisciplinary Studies | 261 | 0.5% |
| Science & Technology | 5,126 | 10.2% |
| Business | 14,115 | 28.0% |
| Education | 4,558 | 9.0% |
| Literature & Languages | 1,499 | 3.0% |
| Liberal Arts & History | 1,388 | 2.8% |
| Visual & Performing Arts | 2,208 | 4.4% |
| Communications | 2,301 | 4.6% |
| Arts & Humanities | 3,243 | 6.4% |
| Total | 50,382 | 100.0% |
Transportation & Commute in Spring Valley
Vehicle Availability by Sex in Spring Valley
The most prevalent vehicle ownership categories in Spring Valley are males with 2 vehicles (25,541, accounting for 42.7%) and females with 2 vehicles (21,513, making up 49.8%).
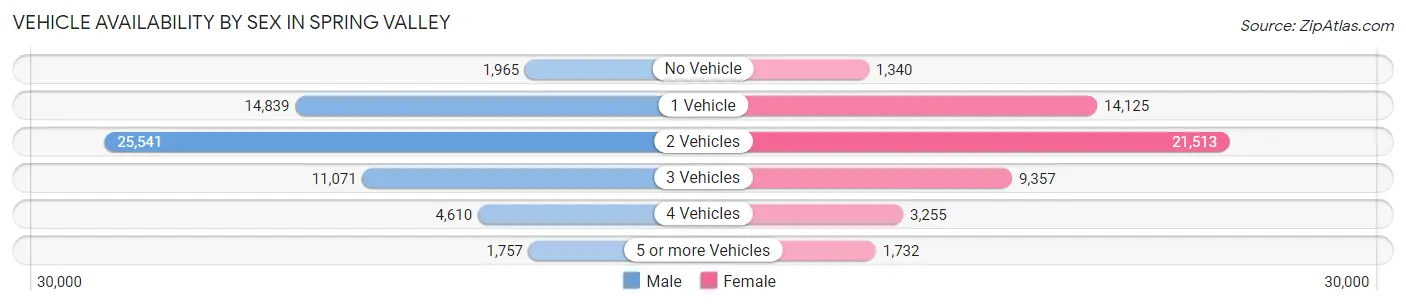
| Vehicles Available | Male | Female |
| No Vehicle | 1,965 (3.3%) | 1,340 (2.6%) |
| 1 Vehicle | 14,839 (24.8%) | 14,125 (27.5%) |
| 2 Vehicles | 25,541 (42.7%) | 21,513 (41.9%) |
| 3 Vehicles | 11,071 (18.5%) | 9,357 (18.2%) |
| 4 Vehicles | 4,610 (7.7%) | 3,255 (6.3%) |
| 5 or more Vehicles | 1,757 (2.9%) | 1,732 (3.4%) |
| Total | 59,783 (100.0%) | 51,322 (100.0%) |
Commute Time in Spring Valley
The most frequently occuring commute durations in Spring Valley are 20 to 24 minutes (22,644 commuters, 22.8%), 15 to 19 minutes (19,396 commuters, 19.5%), and 30 to 34 minutes (15,786 commuters, 15.9%).
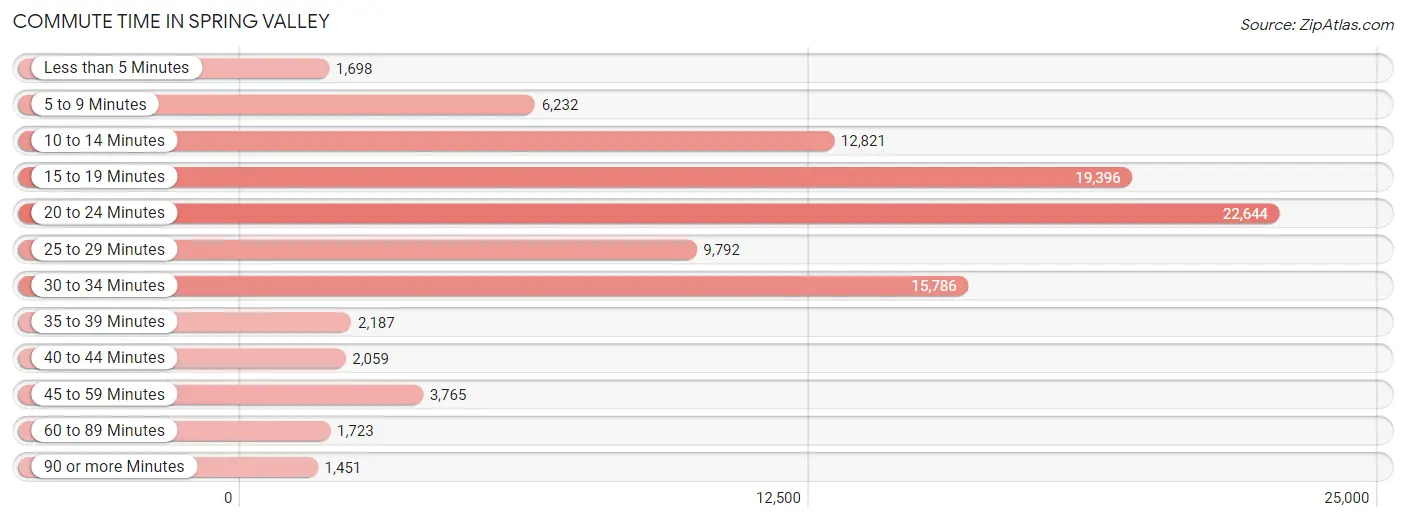
| Commute Time | # Commuters | % Commuters |
| Less than 5 Minutes | 1,698 | 1.7% |
| 5 to 9 Minutes | 6,232 | 6.3% |
| 10 to 14 Minutes | 12,821 | 12.9% |
| 15 to 19 Minutes | 19,396 | 19.5% |
| 20 to 24 Minutes | 22,644 | 22.8% |
| 25 to 29 Minutes | 9,792 | 9.8% |
| 30 to 34 Minutes | 15,786 | 15.9% |
| 35 to 39 Minutes | 2,187 | 2.2% |
| 40 to 44 Minutes | 2,059 | 2.1% |
| 45 to 59 Minutes | 3,765 | 3.8% |
| 60 to 89 Minutes | 1,723 | 1.7% |
| 90 or more Minutes | 1,451 | 1.5% |
Commute Time by Sex in Spring Valley
The most common commute times in Spring Valley are 20 to 24 minutes (11,845 commuters, 21.9%) for males and 20 to 24 minutes (10,799 commuters, 23.8%) for females.
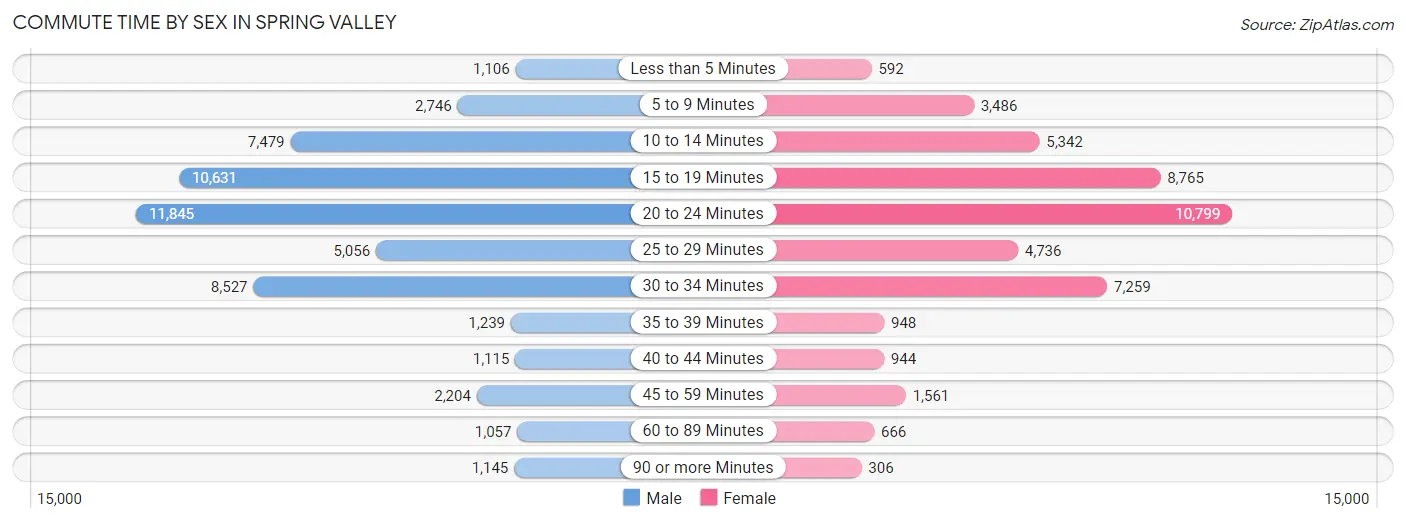
| Commute Time | Male | Female |
| Less than 5 Minutes | 1,106 (2.0%) | 592 (1.3%) |
| 5 to 9 Minutes | 2,746 (5.1%) | 3,486 (7.7%) |
| 10 to 14 Minutes | 7,479 (13.8%) | 5,342 (11.8%) |
| 15 to 19 Minutes | 10,631 (19.6%) | 8,765 (19.3%) |
| 20 to 24 Minutes | 11,845 (21.9%) | 10,799 (23.8%) |
| 25 to 29 Minutes | 5,056 (9.3%) | 4,736 (10.4%) |
| 30 to 34 Minutes | 8,527 (15.8%) | 7,259 (16.0%) |
| 35 to 39 Minutes | 1,239 (2.3%) | 948 (2.1%) |
| 40 to 44 Minutes | 1,115 (2.1%) | 944 (2.1%) |
| 45 to 59 Minutes | 2,204 (4.1%) | 1,561 (3.4%) |
| 60 to 89 Minutes | 1,057 (1.9%) | 666 (1.5%) |
| 90 or more Minutes | 1,145 (2.1%) | 306 (0.7%) |
Time of Departure to Work by Sex in Spring Valley
The most frequent times of departure to work in Spring Valley are 8:00 AM to 8:29 AM (6,128, 11.3%) for males and 8:00 AM to 8:29 AM (5,598, 12.3%) for females.
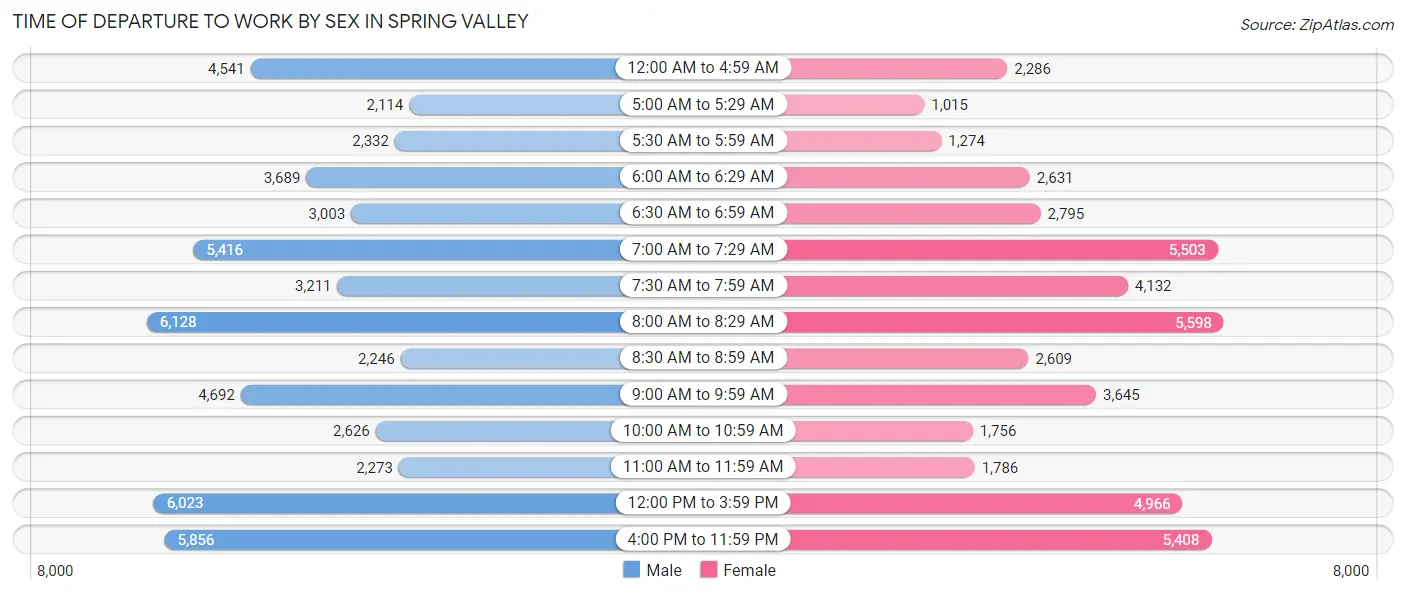
| Time of Departure | Male | Female |
| 12:00 AM to 4:59 AM | 4,541 (8.4%) | 2,286 (5.0%) |
| 5:00 AM to 5:29 AM | 2,114 (3.9%) | 1,015 (2.2%) |
| 5:30 AM to 5:59 AM | 2,332 (4.3%) | 1,274 (2.8%) |
| 6:00 AM to 6:29 AM | 3,689 (6.8%) | 2,631 (5.8%) |
| 6:30 AM to 6:59 AM | 3,003 (5.6%) | 2,795 (6.2%) |
| 7:00 AM to 7:29 AM | 5,416 (10.0%) | 5,503 (12.1%) |
| 7:30 AM to 7:59 AM | 3,211 (5.9%) | 4,132 (9.1%) |
| 8:00 AM to 8:29 AM | 6,128 (11.3%) | 5,598 (12.3%) |
| 8:30 AM to 8:59 AM | 2,246 (4.2%) | 2,609 (5.8%) |
| 9:00 AM to 9:59 AM | 4,692 (8.7%) | 3,645 (8.0%) |
| 10:00 AM to 10:59 AM | 2,626 (4.9%) | 1,756 (3.9%) |
| 11:00 AM to 11:59 AM | 2,273 (4.2%) | 1,786 (3.9%) |
| 12:00 PM to 3:59 PM | 6,023 (11.1%) | 4,966 (10.9%) |
| 4:00 PM to 11:59 PM | 5,856 (10.8%) | 5,408 (11.9%) |
| Total | 54,150 (100.0%) | 45,404 (100.0%) |
Housing Occupancy in Spring Valley
Occupancy by Ownership in Spring Valley
Of the total 85,915 dwellings in Spring Valley, owner-occupied units account for 42,175 (49.1%), while renter-occupied units make up 43,740 (50.9%).
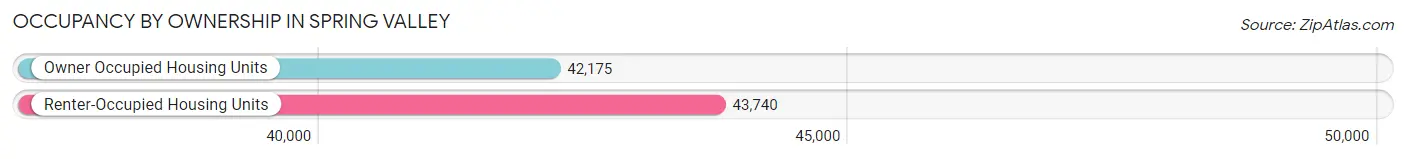
| Occupancy | # Housing Units | % Housing Units |
| Owner Occupied Housing Units | 42,175 | 49.1% |
| Renter-Occupied Housing Units | 43,740 | 50.9% |
| Total Occupied Housing Units | 85,915 | 100.0% |
Occupancy by Household Size in Spring Valley
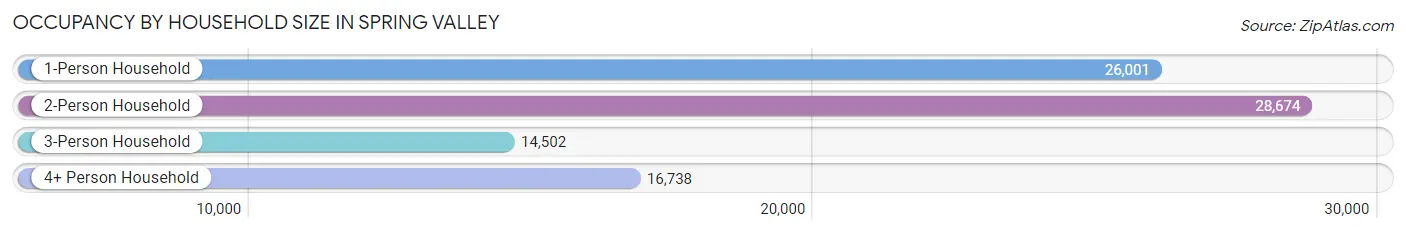
| Household Size | # Housing Units | % Housing Units |
| 1-Person Household | 26,001 | 30.3% |
| 2-Person Household | 28,674 | 33.4% |
| 3-Person Household | 14,502 | 16.9% |
| 4+ Person Household | 16,738 | 19.5% |
| Total Housing Units | 85,915 | 100.0% |
Occupancy by Ownership by Household Size in Spring Valley
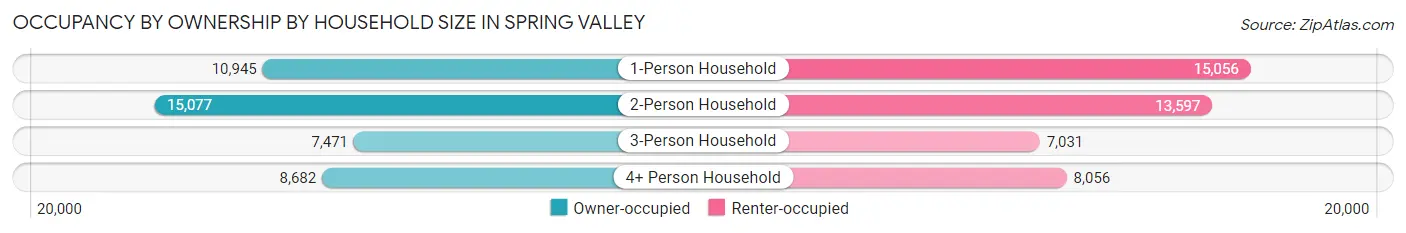
| Household Size | Owner-occupied | Renter-occupied |
| 1-Person Household | 10,945 (42.1%) | 15,056 (57.9%) |
| 2-Person Household | 15,077 (52.6%) | 13,597 (47.4%) |
| 3-Person Household | 7,471 (51.5%) | 7,031 (48.5%) |
| 4+ Person Household | 8,682 (51.9%) | 8,056 (48.1%) |
| Total Housing Units | 42,175 (49.1%) | 43,740 (50.9%) |
Occupancy by Educational Attainment in Spring Valley
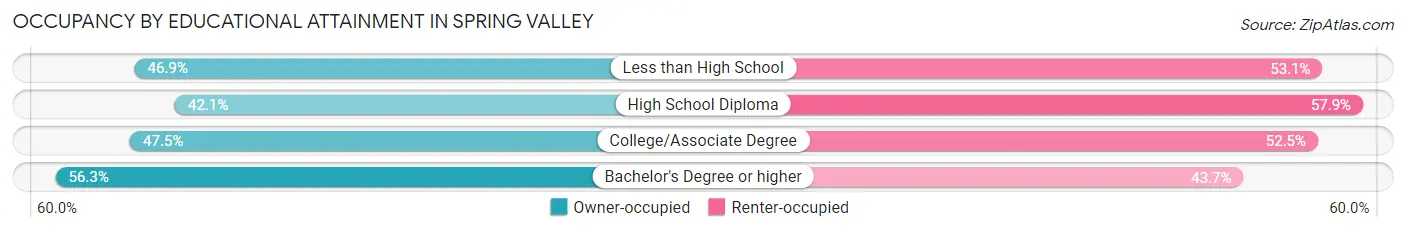
| Household Size | Owner-occupied | Renter-occupied |
| Less than High School | 3,797 (46.9%) | 4,296 (53.1%) |
| High School Diploma | 8,389 (42.1%) | 11,536 (57.9%) |
| College/Associate Degree | 14,033 (47.5%) | 15,533 (52.5%) |
| Bachelor's Degree or higher | 15,956 (56.3%) | 12,375 (43.7%) |
Occupancy by Age of Householder in Spring Valley
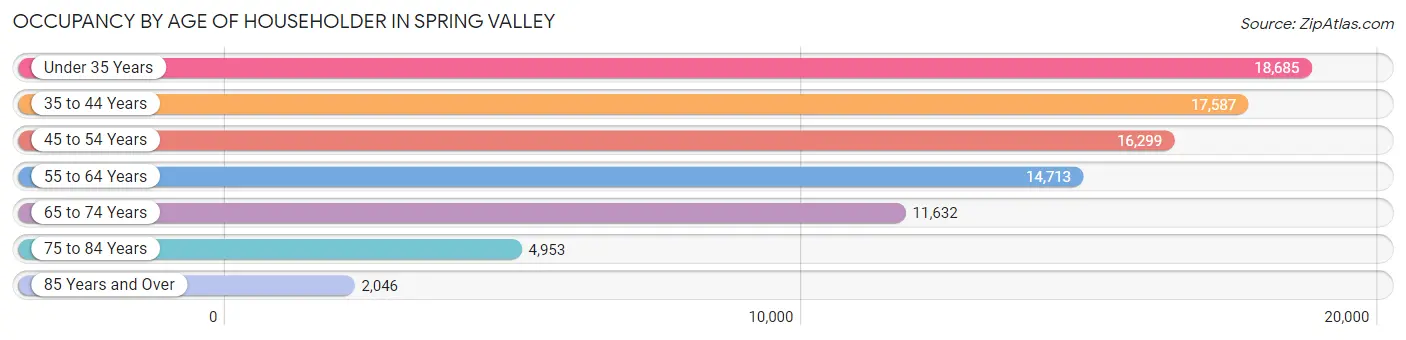
| Age Bracket | # Households | % Households |
| Under 35 Years | 18,685 | 21.7% |
| 35 to 44 Years | 17,587 | 20.5% |
| 45 to 54 Years | 16,299 | 19.0% |
| 55 to 64 Years | 14,713 | 17.1% |
| 65 to 74 Years | 11,632 | 13.5% |
| 75 to 84 Years | 4,953 | 5.8% |
| 85 Years and Over | 2,046 | 2.4% |
| Total | 85,915 | 100.0% |
Housing Finances in Spring Valley
Median Income by Occupancy in Spring Valley
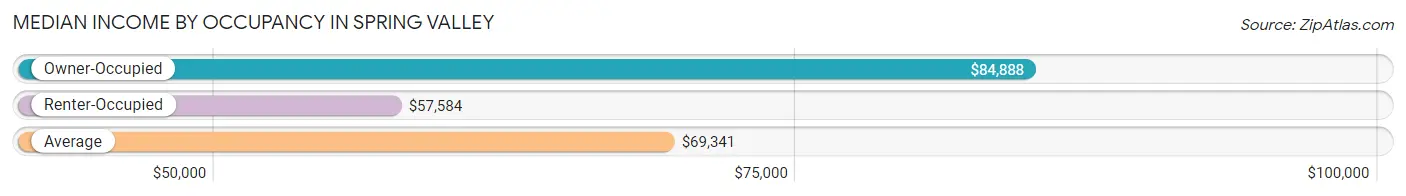
| Occupancy Type | # Households | Median Income |
| Owner-Occupied | 42,175 (49.1%) | $84,888 |
| Renter-Occupied | 43,740 (50.9%) | $57,584 |
| Average | 85,915 (100.0%) | $69,341 |
Occupancy by Householder Income Bracket in Spring Valley
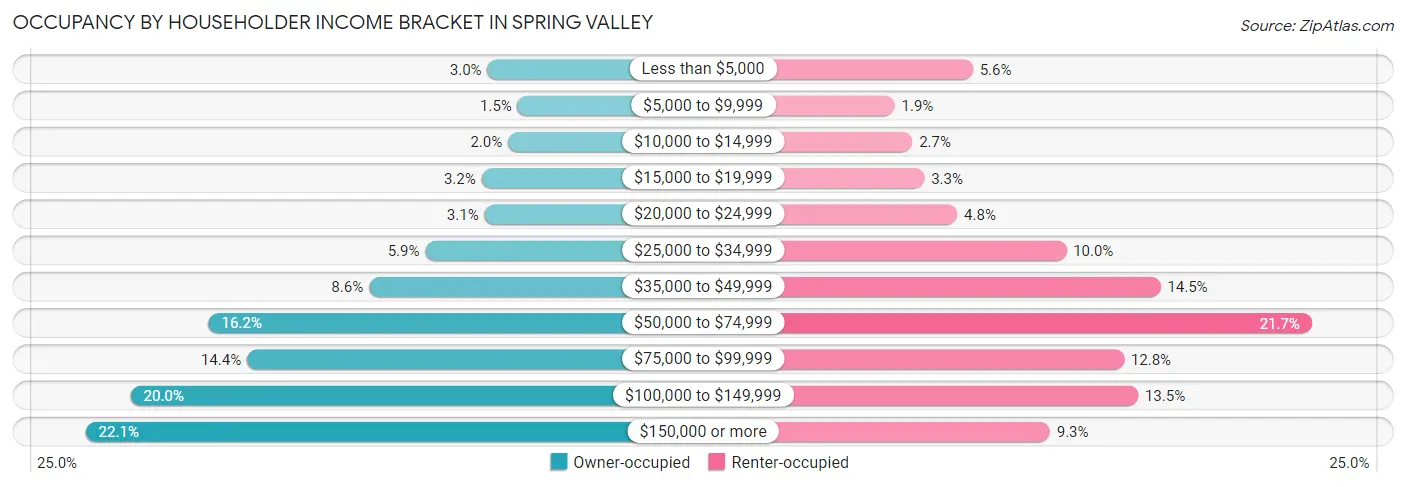
| Income Bracket | Owner-occupied | Renter-occupied |
| Less than $5,000 | 1,248 (3.0%) | 2,441 (5.6%) |
| $5,000 to $9,999 | 640 (1.5%) | 812 (1.9%) |
| $10,000 to $14,999 | 833 (2.0%) | 1,181 (2.7%) |
| $15,000 to $19,999 | 1,367 (3.2%) | 1,432 (3.3%) |
| $20,000 to $24,999 | 1,307 (3.1%) | 2,118 (4.8%) |
| $25,000 to $34,999 | 2,495 (5.9%) | 4,389 (10.0%) |
| $35,000 to $49,999 | 3,626 (8.6%) | 6,351 (14.5%) |
| $50,000 to $74,999 | 6,851 (16.2%) | 9,499 (21.7%) |
| $75,000 to $99,999 | 6,077 (14.4%) | 5,592 (12.8%) |
| $100,000 to $149,999 | 8,416 (20.0%) | 5,881 (13.5%) |
| $150,000 or more | 9,315 (22.1%) | 4,044 (9.2%) |
| Total | 42,175 (100.0%) | 43,740 (100.0%) |
Monthly Housing Cost Tiers in Spring Valley
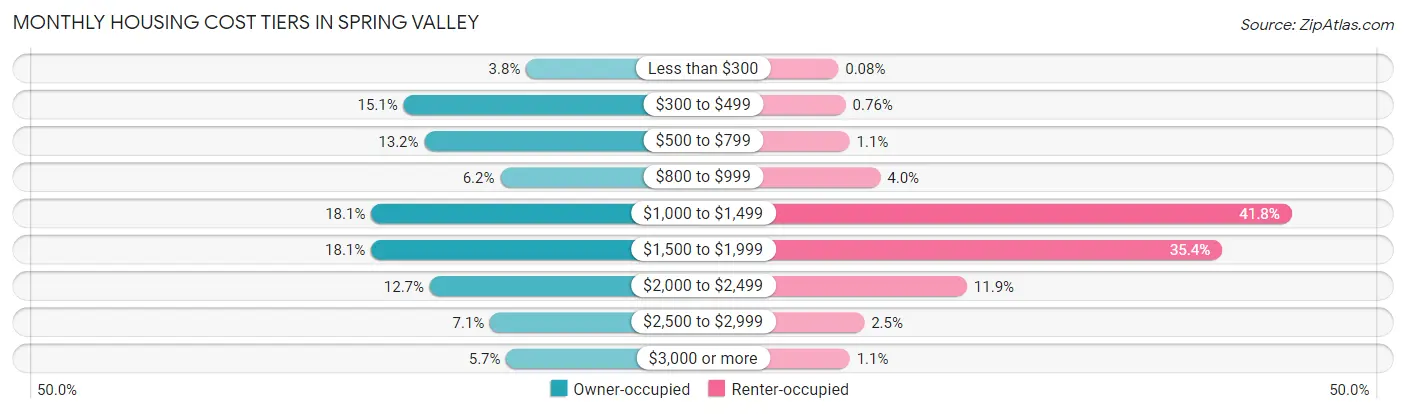
| Monthly Cost | Owner-occupied | Renter-occupied |
| Less than $300 | 1,610 (3.8%) | 33 (0.1%) |
| $300 to $499 | 6,372 (15.1%) | 333 (0.8%) |
| $500 to $799 | 5,565 (13.2%) | 488 (1.1%) |
| $800 to $999 | 2,618 (6.2%) | 1,726 (4.0%) |
| $1,000 to $1,499 | 7,630 (18.1%) | 18,286 (41.8%) |
| $1,500 to $1,999 | 7,634 (18.1%) | 15,482 (35.4%) |
| $2,000 to $2,499 | 5,353 (12.7%) | 5,212 (11.9%) |
| $2,500 to $2,999 | 3,010 (7.1%) | 1,079 (2.5%) |
| $3,000 or more | 2,383 (5.7%) | 493 (1.1%) |
| Total | 42,175 (100.0%) | 43,740 (100.0%) |
Physical Housing Characteristics in Spring Valley
Housing Structures in Spring Valley
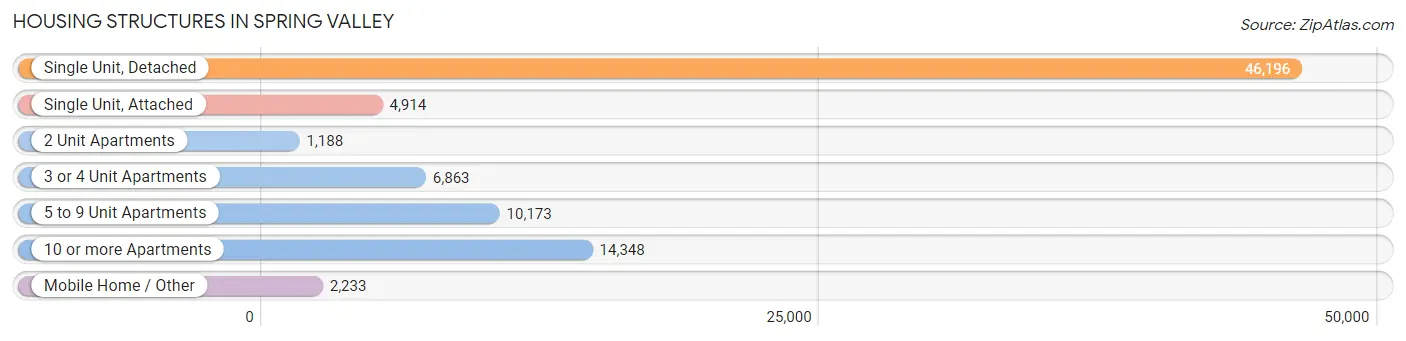
| Structure Type | # Housing Units | % Housing Units |
| Single Unit, Detached | 46,196 | 53.8% |
| Single Unit, Attached | 4,914 | 5.7% |
| 2 Unit Apartments | 1,188 | 1.4% |
| 3 or 4 Unit Apartments | 6,863 | 8.0% |
| 5 to 9 Unit Apartments | 10,173 | 11.8% |
| 10 or more Apartments | 14,348 | 16.7% |
| Mobile Home / Other | 2,233 | 2.6% |
| Total | 85,915 | 100.0% |
Housing Structures by Occupancy in Spring Valley
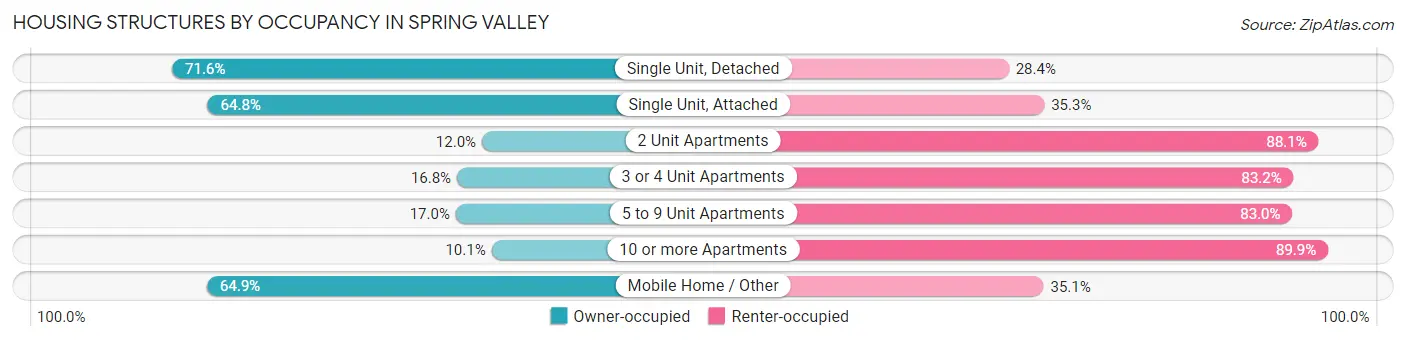
| Structure Type | Owner-occupied | Renter-occupied |
| Single Unit, Detached | 33,074 (71.6%) | 13,122 (28.4%) |
| Single Unit, Attached | 3,182 (64.7%) | 1,732 (35.2%) |
| 2 Unit Apartments | 142 (11.9%) | 1,046 (88.0%) |
| 3 or 4 Unit Apartments | 1,150 (16.8%) | 5,713 (83.2%) |
| 5 to 9 Unit Apartments | 1,728 (17.0%) | 8,445 (83.0%) |
| 10 or more Apartments | 1,450 (10.1%) | 12,898 (89.9%) |
| Mobile Home / Other | 1,449 (64.9%) | 784 (35.1%) |
| Total | 42,175 (49.1%) | 43,740 (50.9%) |
Housing Structures by Number of Rooms in Spring Valley
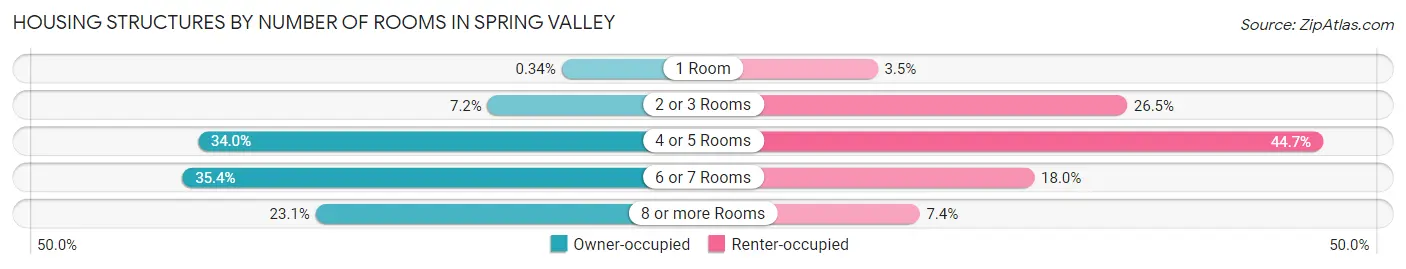
| Number of Rooms | Owner-occupied | Renter-occupied |
| 1 Room | 145 (0.3%) | 1,518 (3.5%) |
| 2 or 3 Rooms | 3,028 (7.2%) | 11,608 (26.5%) |
| 4 or 5 Rooms | 14,332 (34.0%) | 19,539 (44.7%) |
| 6 or 7 Rooms | 14,938 (35.4%) | 7,855 (18.0%) |
| 8 or more Rooms | 9,732 (23.1%) | 3,220 (7.4%) |
| Total | 42,175 (100.0%) | 43,740 (100.0%) |
Housing Structure by Heating Type in Spring Valley
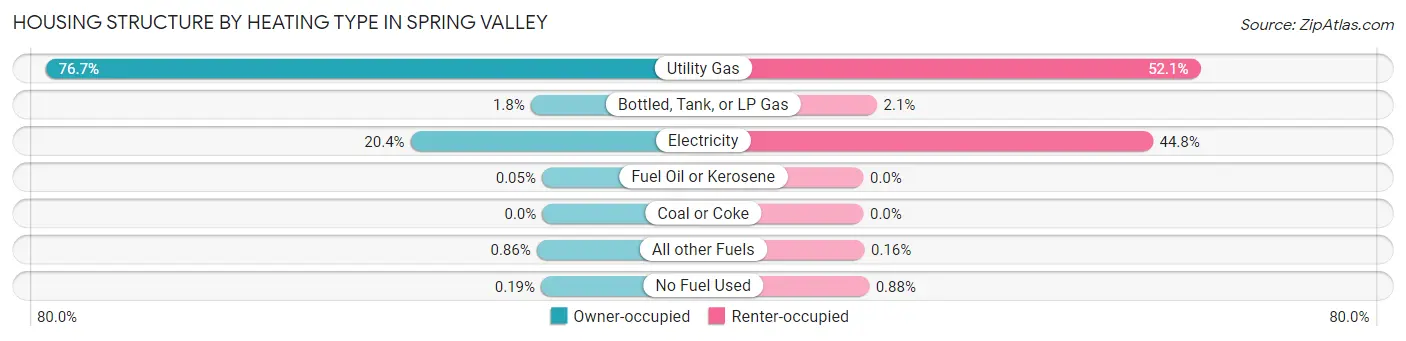
| Heating Type | Owner-occupied | Renter-occupied |
| Utility Gas | 32,366 (76.7%) | 22,798 (52.1%) |
| Bottled, Tank, or LP Gas | 754 (1.8%) | 913 (2.1%) |
| Electricity | 8,588 (20.4%) | 19,575 (44.8%) |
| Fuel Oil or Kerosene | 23 (0.1%) | 0 (0.0%) |
| Coal or Coke | 0 (0.0%) | 0 (0.0%) |
| All other Fuels | 364 (0.9%) | 70 (0.2%) |
| No Fuel Used | 80 (0.2%) | 384 (0.9%) |
| Total | 42,175 (100.0%) | 43,740 (100.0%) |
Household Vehicle Usage in Spring Valley
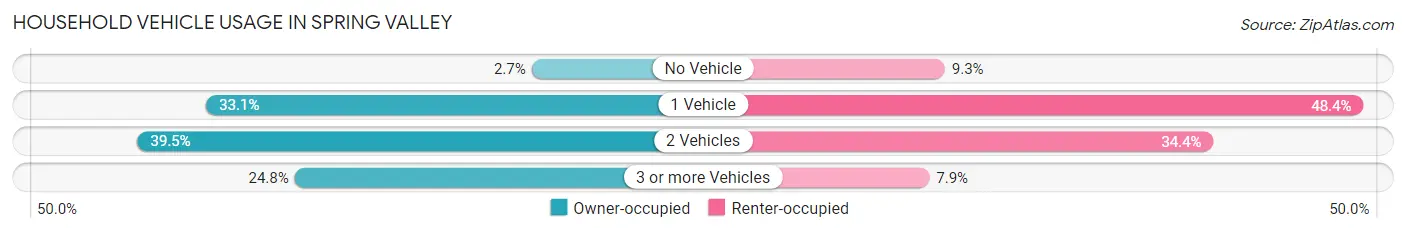
| Vehicles per Household | Owner-occupied | Renter-occupied |
| No Vehicle | 1,129 (2.7%) | 4,079 (9.3%) |
| 1 Vehicle | 13,942 (33.1%) | 21,169 (48.4%) |
| 2 Vehicles | 16,646 (39.5%) | 15,046 (34.4%) |
| 3 or more Vehicles | 10,458 (24.8%) | 3,446 (7.9%) |
| Total | 42,175 (100.0%) | 43,740 (100.0%) |
Real Estate & Mortgages in Spring Valley
Real Estate and Mortgage Overview in Spring Valley
| Characteristic | Without Mortgage | With Mortgage |
| Housing Units | 15,290 | 26,885 |
| Median Property Value | $360,600 | $381,400 |
| Median Household Income | $67,466 | $6,696 |
| Monthly Housing Costs | $491 | $2,281 |
| Real Estate Taxes | $1,850 | $906 |
Property Value by Mortgage Status in Spring Valley
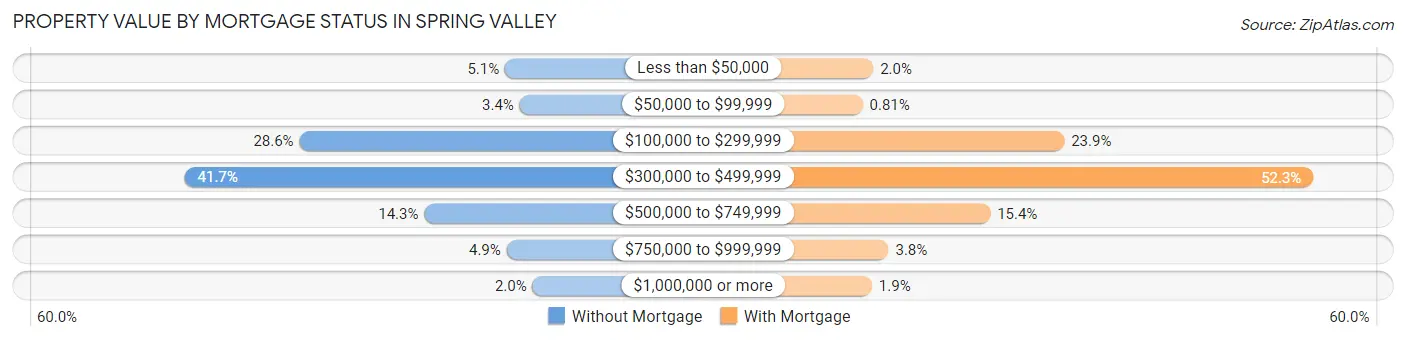
| Property Value | Without Mortgage | With Mortgage |
| Less than $50,000 | 779 (5.1%) | 542 (2.0%) |
| $50,000 to $99,999 | 523 (3.4%) | 218 (0.8%) |
| $100,000 to $299,999 | 4,372 (28.6%) | 6,413 (23.8%) |
| $300,000 to $499,999 | 6,378 (41.7%) | 14,060 (52.3%) |
| $500,000 to $749,999 | 2,190 (14.3%) | 4,137 (15.4%) |
| $750,000 to $999,999 | 750 (4.9%) | 1,013 (3.8%) |
| $1,000,000 or more | 298 (1.9%) | 502 (1.9%) |
| Total | 15,290 (100.0%) | 26,885 (100.0%) |
Household Income by Mortgage Status in Spring Valley
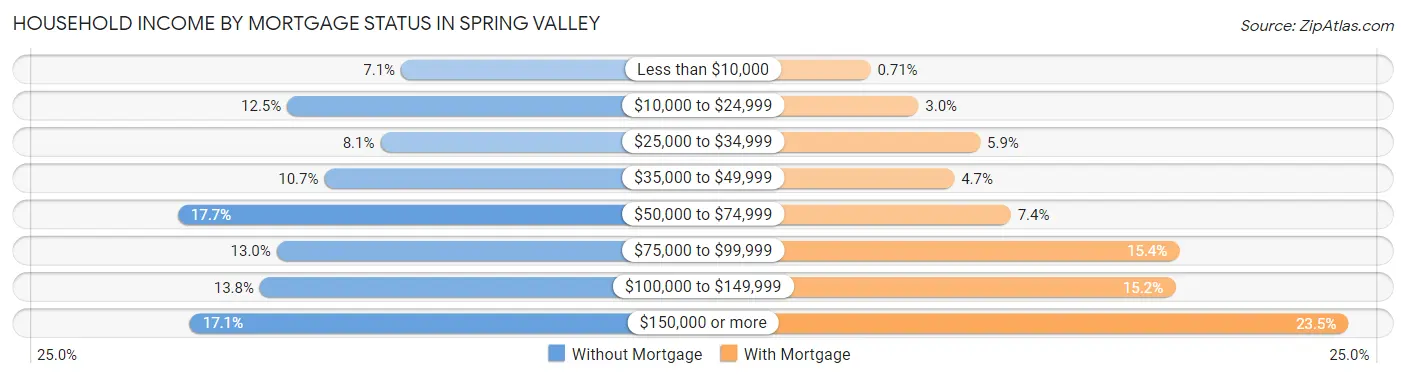
| Household Income | Without Mortgage | With Mortgage |
| Less than $10,000 | 1,083 (7.1%) | 190 (0.7%) |
| $10,000 to $24,999 | 1,912 (12.5%) | 805 (3.0%) |
| $25,000 to $34,999 | 1,232 (8.1%) | 1,595 (5.9%) |
| $35,000 to $49,999 | 1,640 (10.7%) | 1,263 (4.7%) |
| $50,000 to $74,999 | 2,707 (17.7%) | 1,986 (7.4%) |
| $75,000 to $99,999 | 1,987 (13.0%) | 4,144 (15.4%) |
| $100,000 to $149,999 | 2,110 (13.8%) | 4,090 (15.2%) |
| $150,000 or more | 2,619 (17.1%) | 6,306 (23.5%) |
| Total | 15,290 (100.0%) | 26,885 (100.0%) |
Property Value to Household Income Ratio in Spring Valley
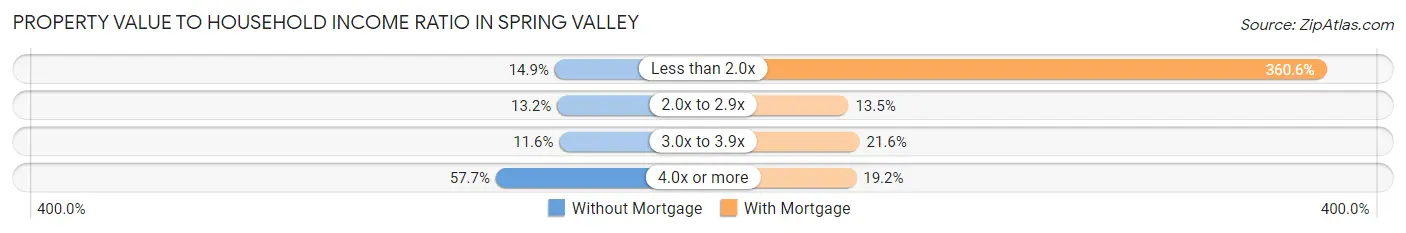
| Value-to-Income Ratio | Without Mortgage | With Mortgage |
| Less than 2.0x | 2,277 (14.9%) | 96,953 (360.6%) |
| 2.0x to 2.9x | 2,023 (13.2%) | 3,625 (13.5%) |
| 3.0x to 3.9x | 1,774 (11.6%) | 5,802 (21.6%) |
| 4.0x or more | 8,823 (57.7%) | 5,153 (19.2%) |
| Total | 15,290 (100.0%) | 26,885 (100.0%) |
Real Estate Taxes by Mortgage Status in Spring Valley
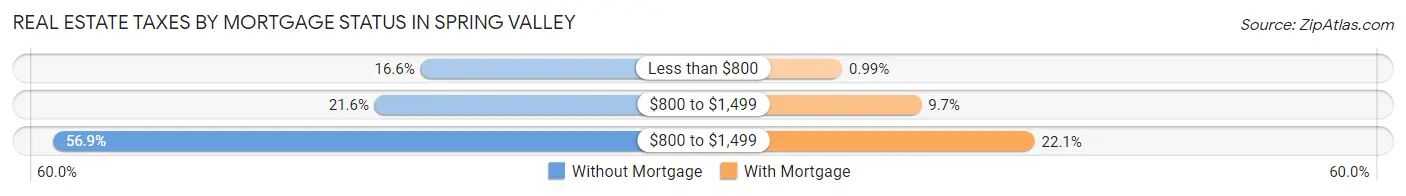
| Property Taxes | Without Mortgage | With Mortgage |
| Less than $800 | 2,539 (16.6%) | 266 (1.0%) |
| $800 to $1,499 | 3,306 (21.6%) | 2,600 (9.7%) |
| $800 to $1,499 | 8,702 (56.9%) | 5,938 (22.1%) |
| Total | 15,290 (100.0%) | 26,885 (100.0%) |
Health & Disability in Spring Valley
Health Insurance Coverage by Age in Spring Valley
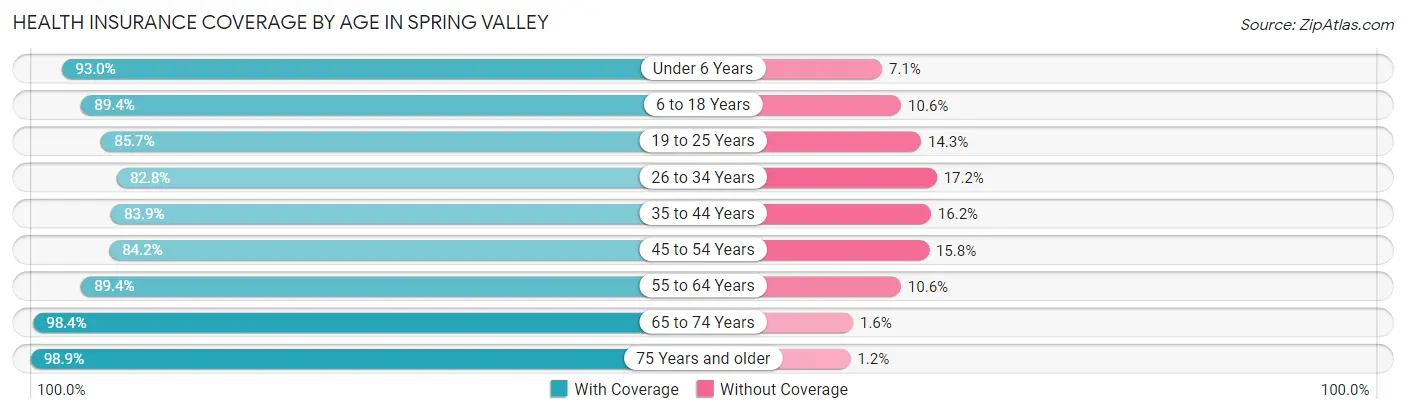
| Age Bracket | With Coverage | Without Coverage |
| Under 6 Years | 13,449 (92.9%) | 1,020 (7.0%) |
| 6 to 18 Years | 27,148 (89.4%) | 3,219 (10.6%) |
| 19 to 25 Years | 16,284 (85.7%) | 2,720 (14.3%) |
| 26 to 34 Years | 27,324 (82.8%) | 5,687 (17.2%) |
| 35 to 44 Years | 28,086 (83.9%) | 5,410 (16.2%) |
| 45 to 54 Years | 24,968 (84.2%) | 4,681 (15.8%) |
| 55 to 64 Years | 24,138 (89.4%) | 2,851 (10.6%) |
| 65 to 74 Years | 19,793 (98.4%) | 328 (1.6%) |
| 75 Years and older | 12,630 (98.9%) | 147 (1.1%) |
| Total | 193,820 (88.1%) | 26,063 (11.8%) |
Health Insurance Coverage by Citizenship Status in Spring Valley
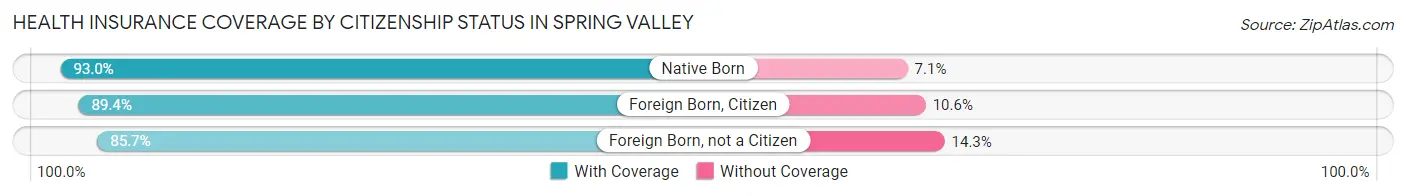
| Citizenship Status | With Coverage | Without Coverage |
| Native Born | 13,449 (92.9%) | 1,020 (7.0%) |
| Foreign Born, Citizen | 27,148 (89.4%) | 3,219 (10.6%) |
| Foreign Born, not a Citizen | 16,284 (85.7%) | 2,720 (14.3%) |
Health Insurance Coverage by Household Income in Spring Valley
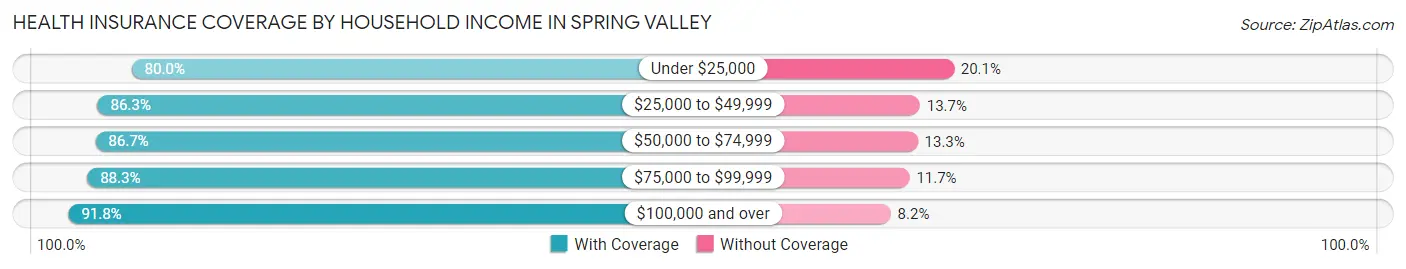
| Household Income | With Coverage | Without Coverage |
| Under $25,000 | 18,922 (79.9%) | 4,746 (20.1%) |
| $25,000 to $49,999 | 31,182 (86.3%) | 4,943 (13.7%) |
| $50,000 to $74,999 | 35,516 (86.7%) | 5,434 (13.3%) |
| $75,000 to $99,999 | 28,284 (88.3%) | 3,762 (11.7%) |
| $100,000 and over | 79,688 (91.8%) | 7,138 (8.2%) |
Public vs Private Health Insurance Coverage by Age in Spring Valley
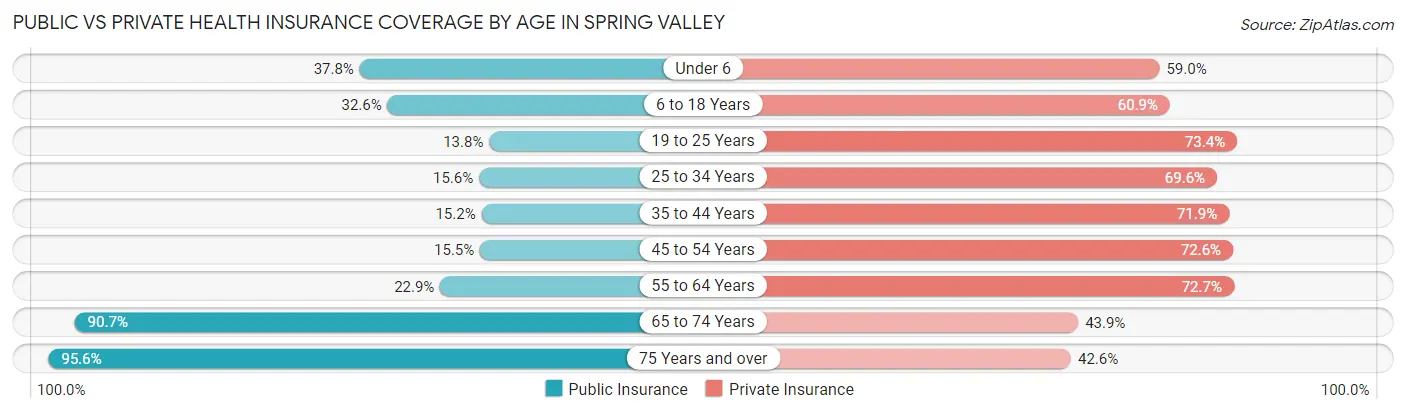
| Age Bracket | Public Insurance | Private Insurance |
| Under 6 | 5,469 (37.8%) | 8,533 (59.0%) |
| 6 to 18 Years | 9,908 (32.6%) | 18,491 (60.9%) |
| 19 to 25 Years | 2,615 (13.8%) | 13,940 (73.4%) |
| 25 to 34 Years | 5,164 (15.6%) | 22,981 (69.6%) |
| 35 to 44 Years | 5,090 (15.2%) | 24,073 (71.9%) |
| 45 to 54 Years | 4,582 (15.4%) | 21,524 (72.6%) |
| 55 to 64 Years | 6,170 (22.9%) | 19,632 (72.7%) |
| 65 to 74 Years | 18,249 (90.7%) | 8,829 (43.9%) |
| 75 Years and over | 12,214 (95.6%) | 5,436 (42.5%) |
| Total | 69,461 (31.6%) | 143,439 (65.2%) |
Disability Status by Sex by Age in Spring Valley
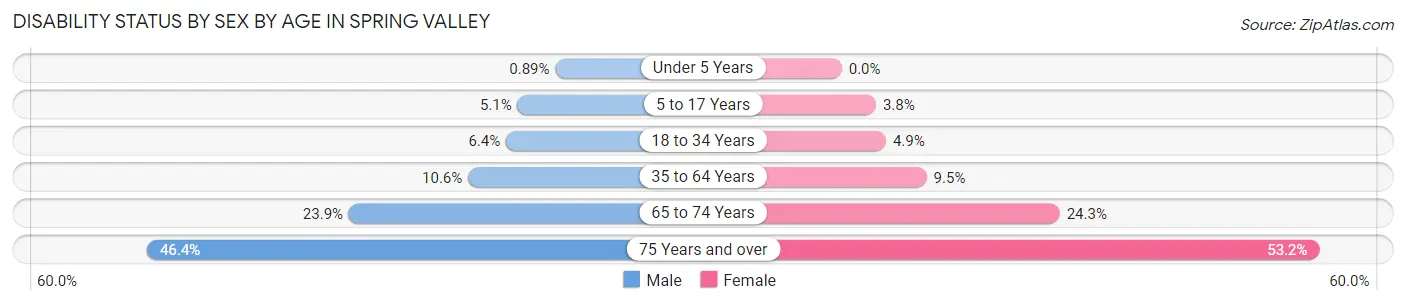
| Age Bracket | Male | Female |
| Under 5 Years | 61 (0.9%) | 0 (0.0%) |
| 5 to 17 Years | 799 (5.1%) | 560 (3.8%) |
| 18 to 34 Years | 1,827 (6.4%) | 1,278 (4.9%) |
| 35 to 64 Years | 4,884 (10.6%) | 4,166 (9.5%) |
| 65 to 74 Years | 2,212 (23.9%) | 2,635 (24.3%) |
| 75 Years and over | 2,340 (46.4%) | 4,111 (53.2%) |
Disability Class by Sex by Age in Spring Valley
Disability Class: Hearing Difficulty
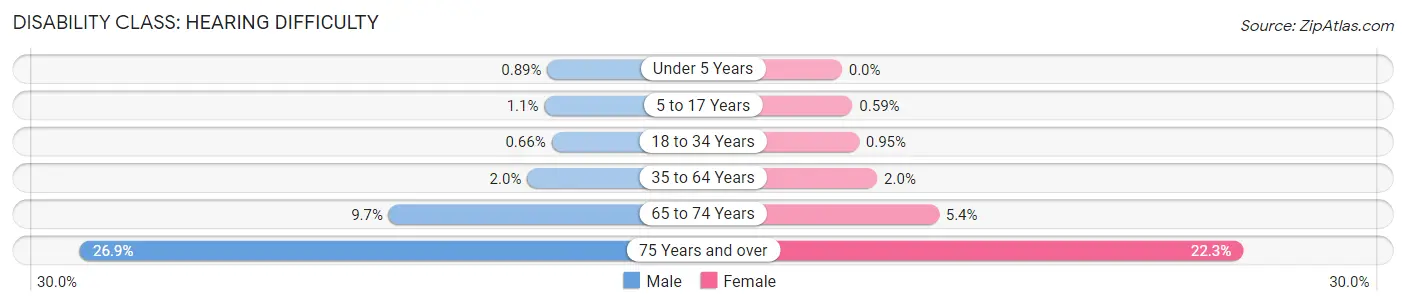
| Age Bracket | Male | Female |
| Under 5 Years | 61 (0.9%) | 0 (0.0%) |
| 5 to 17 Years | 166 (1.1%) | 87 (0.6%) |
| 18 to 34 Years | 190 (0.7%) | 247 (0.9%) |
| 35 to 64 Years | 923 (2.0%) | 867 (2.0%) |
| 65 to 74 Years | 900 (9.7%) | 586 (5.4%) |
| 75 Years and over | 1,358 (26.9%) | 1,727 (22.3%) |
Disability Class: Vision Difficulty
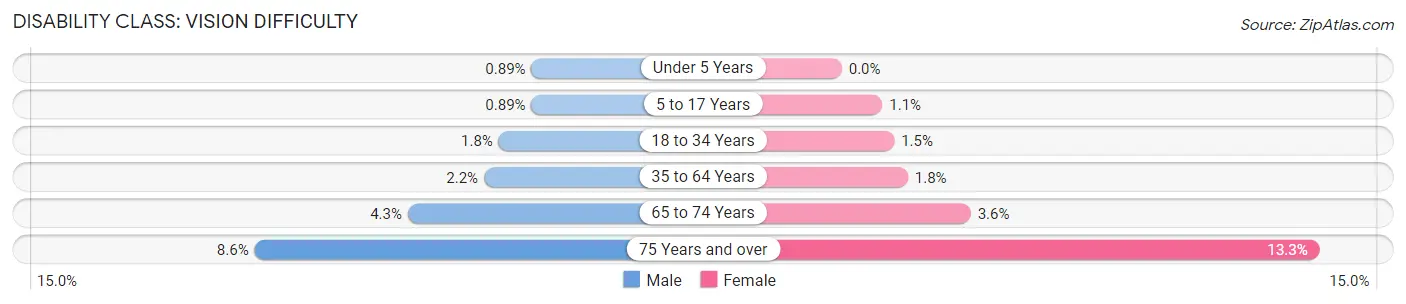
| Age Bracket | Male | Female |
| Under 5 Years | 61 (0.9%) | 0 (0.0%) |
| 5 to 17 Years | 139 (0.9%) | 166 (1.1%) |
| 18 to 34 Years | 516 (1.8%) | 379 (1.5%) |
| 35 to 64 Years | 1,019 (2.2%) | 810 (1.8%) |
| 65 to 74 Years | 401 (4.3%) | 390 (3.6%) |
| 75 Years and over | 434 (8.6%) | 1,028 (13.3%) |
Disability Class: Cognitive Difficulty
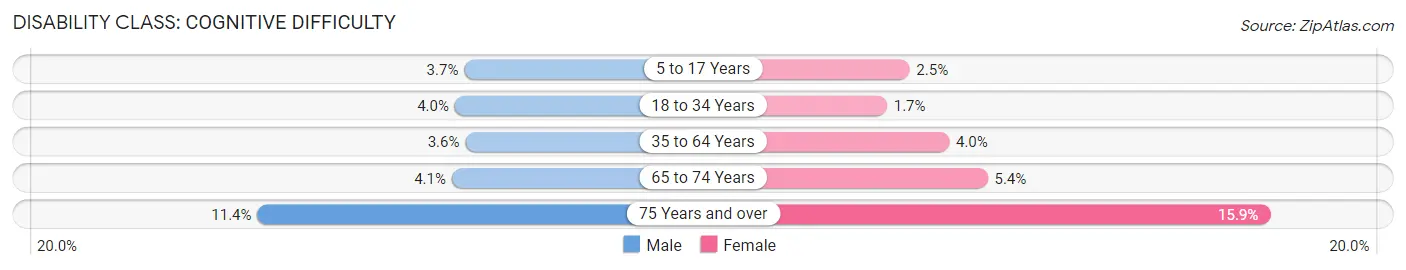
| Age Bracket | Male | Female |
| 5 to 17 Years | 577 (3.7%) | 369 (2.5%) |
| 18 to 34 Years | 1,154 (4.0%) | 433 (1.7%) |
| 35 to 64 Years | 1,676 (3.6%) | 1,754 (4.0%) |
| 65 to 74 Years | 383 (4.1%) | 587 (5.4%) |
| 75 Years and over | 573 (11.4%) | 1,229 (15.9%) |
Disability Class: Ambulatory Difficulty
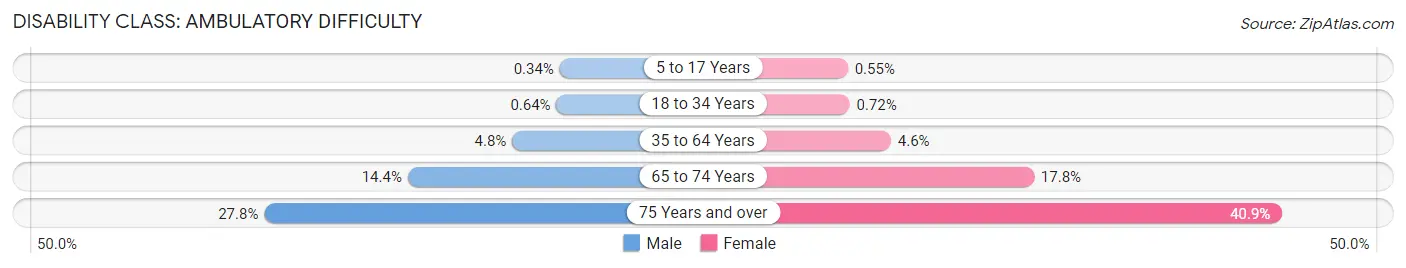
| Age Bracket | Male | Female |
| 5 to 17 Years | 54 (0.3%) | 81 (0.5%) |
| 18 to 34 Years | 182 (0.6%) | 186 (0.7%) |
| 35 to 64 Years | 2,186 (4.8%) | 2,005 (4.5%) |
| 65 to 74 Years | 1,337 (14.4%) | 1,936 (17.8%) |
| 75 Years and over | 1,401 (27.8%) | 3,160 (40.9%) |
Disability Class: Self-Care Difficulty
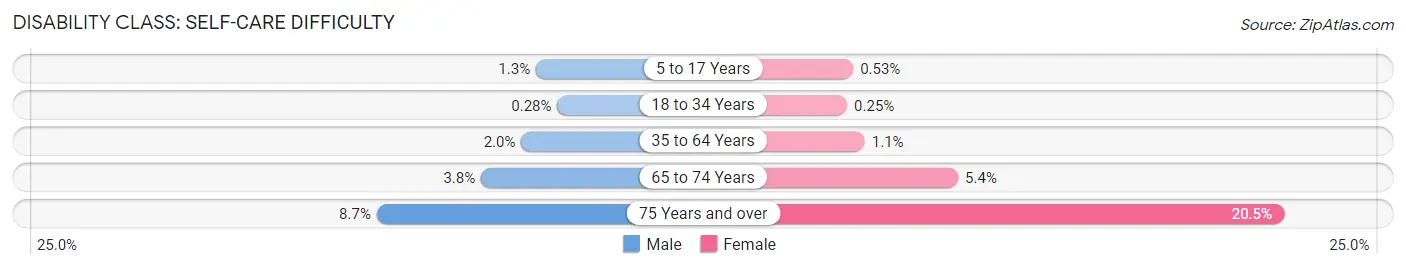
| Age Bracket | Male | Female |
| 5 to 17 Years | 199 (1.3%) | 78 (0.5%) |
| 18 to 34 Years | 80 (0.3%) | 65 (0.3%) |
| 35 to 64 Years | 898 (1.9%) | 473 (1.1%) |
| 65 to 74 Years | 354 (3.8%) | 586 (5.4%) |
| 75 Years and over | 437 (8.7%) | 1,586 (20.5%) |
Technology Access in Spring Valley
Computing Device Access in Spring Valley
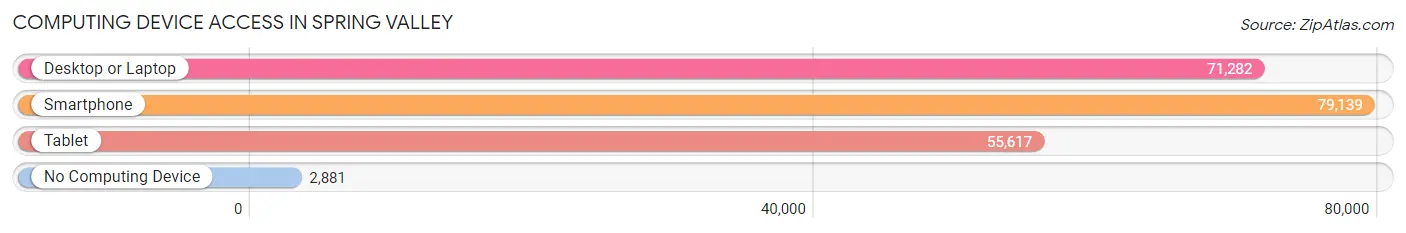
| Device Type | # Households | % Households |
| Desktop or Laptop | 71,282 | 83.0% |
| Smartphone | 79,139 | 92.1% |
| Tablet | 55,617 | 64.7% |
| No Computing Device | 2,881 | 3.4% |
| Total | 85,915 | 100.0% |
Internet Access in Spring Valley
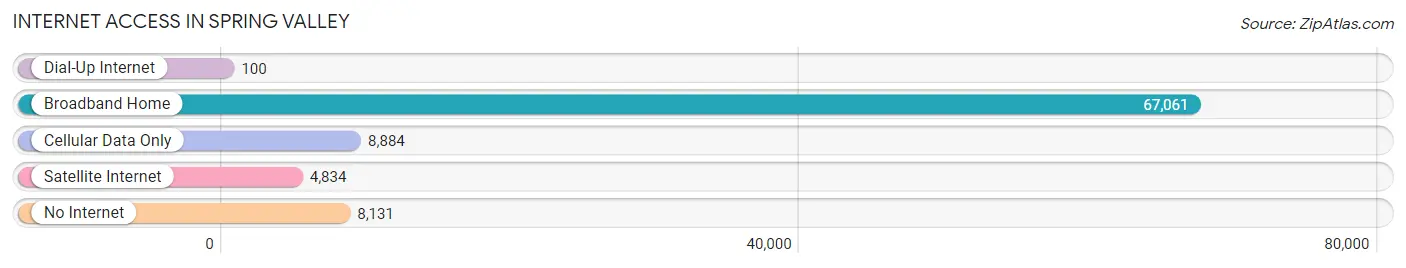
| Internet Type | # Households | % Households |
| Dial-Up Internet | 100 | 0.1% |
| Broadband Home | 67,061 | 78.1% |
| Cellular Data Only | 8,884 | 10.3% |
| Satellite Internet | 4,834 | 5.6% |
| No Internet | 8,131 | 9.5% |
| Total | 85,915 | 100.0% |
Spring Valley Summary
Introduction
Spring Valley is an unincorporated town located in Clark County, Nevada. It is located in the Las Vegas Valley and is one of the largest unincorporated towns in the United States. It is home to a diverse population of over 178,000 people and is a popular destination for tourists and locals alike. This paper will provide an overview of the history, geography, economy and demographics of Spring Valley, Nevada.
History
The area that is now Spring Valley was first settled in the late 19th century by Mormon settlers. The area was originally known as Las Vegas Rancho, and was used for farming and ranching. In the early 20th century, the area was developed as a residential community. The first homes were built in the 1920s, and the area was officially incorporated as the Town of Spring Valley in 1951.
The town experienced rapid growth in the 1950s and 1960s, as the population increased from just over 1,000 in 1950 to over 10,000 by 1970. The population continued to grow throughout the 1970s and 1980s, reaching over 50,000 by 1990. The population has continued to grow since then, and as of 2020, the population of Spring Valley is estimated to be over 178,000.
Geography
Spring Valley is located in the Las Vegas Valley, in the Mojave Desert of southern Nevada. It is bordered by the cities of Las Vegas, North Las Vegas, and Paradise. The town covers an area of approximately 33 square miles, and is located at an elevation of 2,000 feet.
The terrain of Spring Valley is mostly flat, with some hills and mountains in the area. The town is located in a desert climate, with hot summers and mild winters. The average annual temperature is around 70 degrees Fahrenheit, and the average annual precipitation is around 4 inches.
Economy
The economy of Spring Valley is largely based on tourism and gaming. The town is home to several casinos, including the MGM Grand, the Bellagio, and the Venetian. These casinos attract millions of visitors each year, and generate billions of dollars in revenue for the local economy.
In addition to the casinos, Spring Valley is also home to a variety of other businesses, including restaurants, retail stores, and hotels. The town is also home to several large employers, including the University of Nevada, Las Vegas, and the Las Vegas Metropolitan Police Department.
Demographics
As of 2020, the population of Spring Valley is estimated to be over 178,000. The population is diverse, with a mix of races and ethnicities. The largest racial group is White, making up over 50% of the population. Other racial groups include African American (14%), Hispanic or Latino (13%), Asian (7%), and Native American (2%).
The median household income in Spring Valley is $50,000, and the median home value is $250,000. The town has a high rate of homeownership, with over 70% of residents owning their own homes.
Conclusion
Spring Valley is an unincorporated town located in Clark County, Nevada. It is home to a diverse population of over 178,000 people and is a popular destination for tourists and locals alike. This paper has provided an overview of the history, geography, economy and demographics of Spring Valley, Nevada. The town is largely based on tourism and gaming, and is home to several large employers. The population is diverse, with a mix of races and ethnicities, and a high rate of homeownership.
Common Questions
What is Per Capita Income in Spring Valley?
Per Capita income in Spring Valley is $37,666.
What is the Median Family Income in Spring Valley?
Median Family Income in Spring Valley is $79,763.
What is the Median Household income in Spring Valley?
Median Household Income in Spring Valley is $69,341.
What is Income or Wage Gap in Spring Valley?
Income or Wage Gap in Spring Valley is 11.3%.
Women in Spring Valley earn 88.7 cents for every dollar earned by a man.
What is Family Income Deficit in Spring Valley?
Family Income Deficit in Spring Valley is $11,779.
Families that are below poverty line in Spring Valley earn $11,779 less on average than the poverty threshold level.
What is Inequality or Gini Index in Spring Valley?
Inequality or Gini Index in Spring Valley is 0.46.
What is the Total Population of Spring Valley?
Total Population of Spring Valley is 220,114.
What is the Total Male Population of Spring Valley?
Total Male Population of Spring Valley is 111,697.
What is the Total Female Population of Spring Valley?
Total Female Population of Spring Valley is 108,417.
What is the Ratio of Males per 100 Females in Spring Valley?
There are 103.03 Males per 100 Females in Spring Valley.
What is the Ratio of Females per 100 Males in Spring Valley?
There are 97.06 Females per 100 Males in Spring Valley.
What is the Median Population Age in Spring Valley?
Median Population Age in Spring Valley is 38.5 Years.
What is the Average Family Size in Spring Valley
Average Family Size in Spring Valley is 3.2 People.
What is the Average Household Size in Spring Valley
Average Household Size in Spring Valley is 2.6 People.
How Large is the Labor Force in Spring Valley?
There are 123,687 People in the Labor Forcein in Spring Valley.
What is the Percentage of People in the Labor Force in Spring Valley?
67.8% of People are in the Labor Force in Spring Valley.
What is the Unemployment Rate in Spring Valley?
Unemployment Rate in Spring Valley is 7.6%.