Waite Park, MN Map & Demographics
Waite Park Map
Waite Park Overview
$27,573
PER CAPITA INCOME
$68,438
AVG FAMILY INCOME
$52,391
AVG HOUSEHOLD INCOME
24.5%
WAGE / INCOME GAP [ % ]
75.5¢/ $1
WAGE / INCOME GAP [ $ ]
0.40
INEQUALITY / GINI INDEX
8,290
TOTAL POPULATION
4,007
MALE POPULATION
4,283
FEMALE POPULATION
93.56
MALES / 100 FEMALES
106.89
FEMALES / 100 MALES
40.7
MEDIAN AGE
3.0
AVG FAMILY SIZE
2.2
AVG HOUSEHOLD SIZE
4,294
LABOR FORCE [ PEOPLE ]
62.9%
PERCENT IN LABOR FORCE
5.5%
UNEMPLOYMENT RATE
Waite Park Zip Codes
Waite Park Area Codes
Income in Waite Park
Income Overview in Waite Park
Per Capita Income in Waite Park is $27,573, while median incomes of families and households are $68,438 and $52,391 respectively.
| Characteristic | Number | Measure |
| Per Capita Income | 8,290 | $27,573 |
| Median Family Income | 2,114 | $68,438 |
| Mean Family Income | 2,114 | $75,493 |
| Median Household Income | 3,724 | $52,391 |
| Mean Household Income | 3,724 | $61,627 |
| Income Deficit | 2,114 | $0 |
| Wage / Income Gap (%) | 8,290 | 24.48% |
| Wage / Income Gap ($) | 8,290 | 75.52¢ per $1 |
| Gini / Inequality Index | 8,290 | 0.40 |
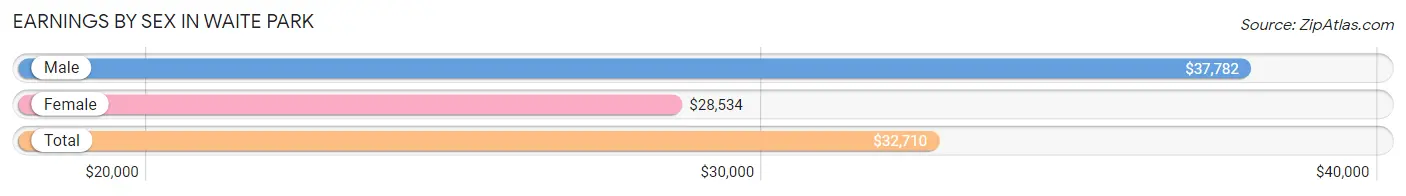
Earnings by Sex in Waite Park
Average Earnings in Waite Park are $32,710, $37,782 for men and $28,534 for women, a difference of 24.5%.
| Sex | Number | Average Earnings |
| Male | 2,242 (49.9%) | $37,782 |
| Female | 2,247 (50.1%) | $28,534 |
| Total | 4,489 (100.0%) | $32,710 |
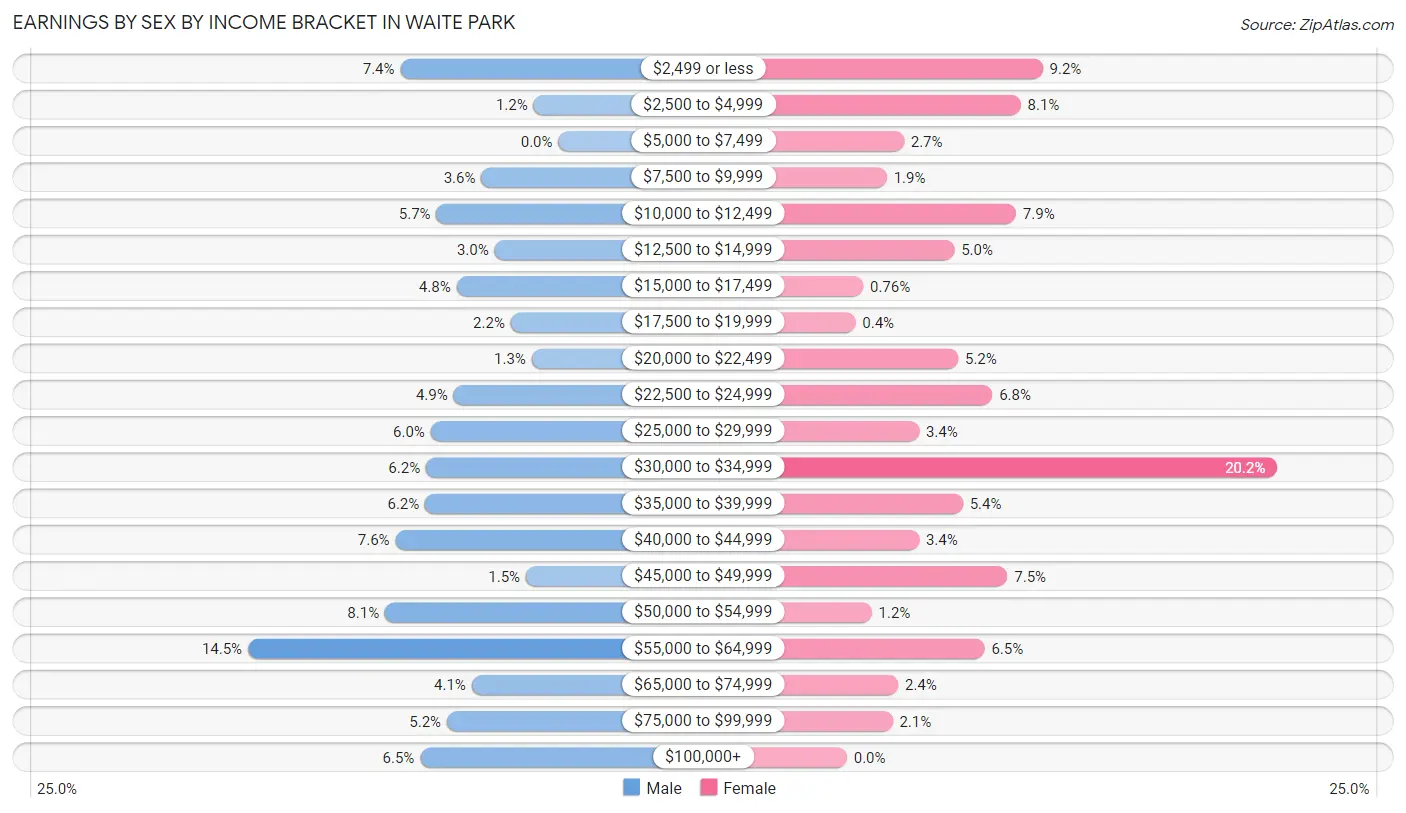
Earnings by Sex by Income Bracket in Waite Park
The most common earnings brackets in Waite Park are $55,000 to $64,999 for men (326 | 14.5%) and $30,000 to $34,999 for women (453 | 20.2%).
| Income | Male | Female |
| $2,499 or less | 166 (7.4%) | 206 (9.2%) |
| $2,500 to $4,999 | 26 (1.2%) | 183 (8.1%) |
| $5,000 to $7,499 | 0 (0.0%) | 60 (2.7%) |
| $7,500 to $9,999 | 81 (3.6%) | 42 (1.9%) |
| $10,000 to $12,499 | 128 (5.7%) | 178 (7.9%) |
| $12,500 to $14,999 | 67 (3.0%) | 113 (5.0%) |
| $15,000 to $17,499 | 107 (4.8%) | 17 (0.8%) |
| $17,500 to $19,999 | 50 (2.2%) | 9 (0.4%) |
| $20,000 to $22,499 | 28 (1.3%) | 117 (5.2%) |
| $22,500 to $24,999 | 110 (4.9%) | 153 (6.8%) |
| $25,000 to $29,999 | 134 (6.0%) | 76 (3.4%) |
| $30,000 to $34,999 | 139 (6.2%) | 453 (20.2%) |
| $35,000 to $39,999 | 140 (6.2%) | 122 (5.4%) |
| $40,000 to $44,999 | 171 (7.6%) | 76 (3.4%) |
| $45,000 to $49,999 | 34 (1.5%) | 169 (7.5%) |
| $50,000 to $54,999 | 182 (8.1%) | 26 (1.2%) |
| $55,000 to $64,999 | 326 (14.5%) | 145 (6.5%) |
| $65,000 to $74,999 | 91 (4.1%) | 54 (2.4%) |
| $75,000 to $99,999 | 117 (5.2%) | 48 (2.1%) |
| $100,000+ | 145 (6.5%) | 0 (0.0%) |
| Total | 2,242 (100.0%) | 2,247 (100.0%) |
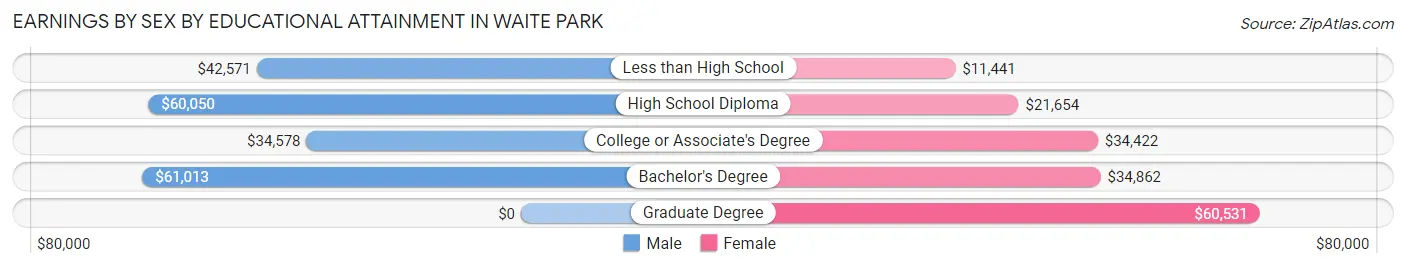
Earnings by Sex by Educational Attainment in Waite Park
Average earnings in Waite Park are $43,060 for men and $32,895 for women, a difference of 23.6%. Men with an educational attainment of bachelor's degree enjoy the highest average annual earnings of $61,013, while those with college or associate's degree education earn the least with $34,578. Women with an educational attainment of graduate degree earn the most with the average annual earnings of $60,531, while those with less than high school education have the smallest earnings of $11,441.
| Educational Attainment | Male Income | Female Income |
| Less than High School | $42,571 | $11,441 |
| High School Diploma | $60,050 | $21,654 |
| College or Associate's Degree | $34,578 | $34,422 |
| Bachelor's Degree | $61,013 | $34,862 |
| Graduate Degree | - | - |
| Total | $43,060 | $32,895 |
Family Income in Waite Park
Family Income Brackets in Waite Park
According to the Waite Park family income data, there are 533 families falling into the $100,000 to $149,999 income range, which is the most common income bracket and makes up 25.2% of all families. Conversely, the $200,000+ income bracket is the least frequent group with only 44 families (2.1%) belonging to this category.
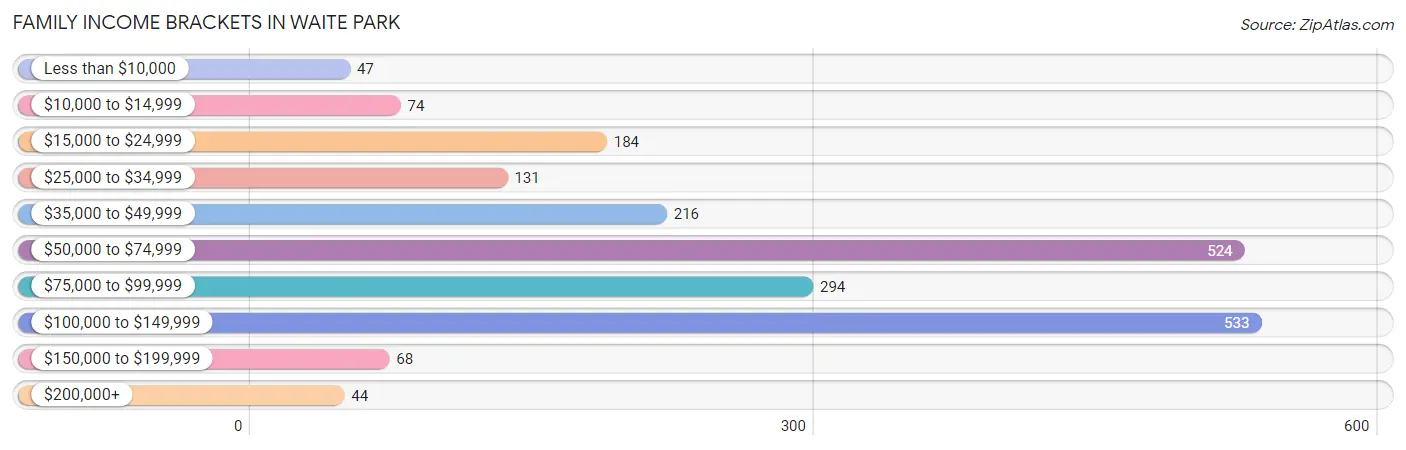
| Income Bracket | # Families | % Families |
| Less than $10,000 | 47 | 2.2% |
| $10,000 to $14,999 | 74 | 3.5% |
| $15,000 to $24,999 | 184 | 8.7% |
| $25,000 to $34,999 | 131 | 6.2% |
| $35,000 to $49,999 | 216 | 10.2% |
| $50,000 to $74,999 | 524 | 24.8% |
| $75,000 to $99,999 | 294 | 13.9% |
| $100,000 to $149,999 | 533 | 25.2% |
| $150,000 to $199,999 | 68 | 3.2% |
| $200,000+ | 44 | 2.1% |
Family Income by Famaliy Size in Waite Park
7+ person families (180 | 8.5%) account for the highest median family income in Waite Park with $116,226 per family, while 2-person families (1,144 | 54.1%) have the highest median income of $33,822 per family member.
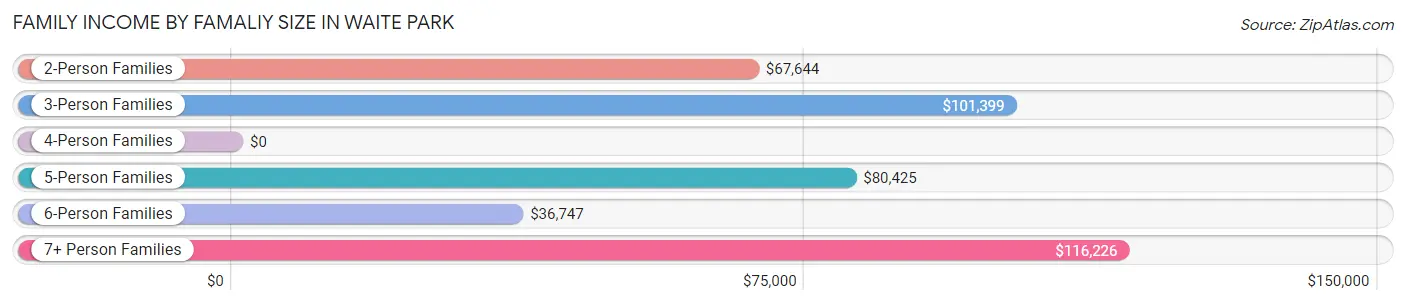
| Income Bracket | # Families | Median Income |
| 2-Person Families | 1,144 (54.1%) | $67,644 |
| 3-Person Families | 233 (11.0%) | $101,399 |
| 4-Person Families | 298 (14.1%) | $0 |
| 5-Person Families | 150 (7.1%) | $80,425 |
| 6-Person Families | 109 (5.2%) | $36,747 |
| 7+ Person Families | 180 (8.5%) | $116,226 |
| Total | 2,114 (100.0%) | $68,438 |
Family Income by Number of Earners in Waite Park
The median family income in Waite Park is $68,438, with families comprising 3+ earners (408) having the highest median family income of $110,000, while families with 1 earner (515) have the lowest median family income of $37,035, accounting for 19.3% and 24.4% of families, respectively.
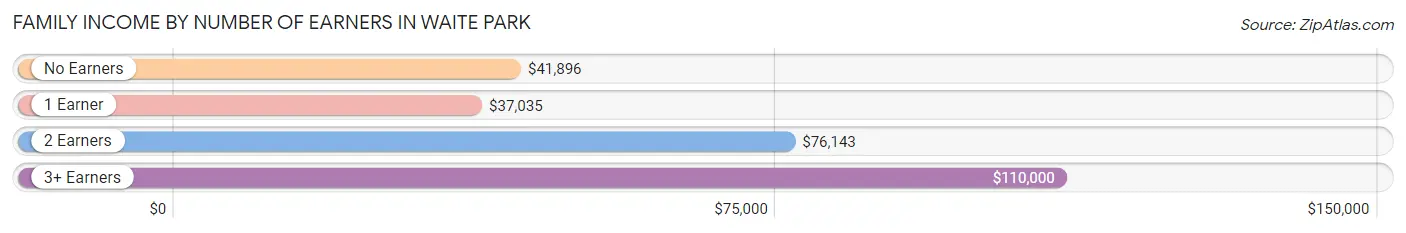
| Number of Earners | # Families | Median Income |
| No Earners | 427 (20.2%) | $41,896 |
| 1 Earner | 515 (24.4%) | $37,035 |
| 2 Earners | 764 (36.1%) | $76,143 |
| 3+ Earners | 408 (19.3%) | $110,000 |
| Total | 2,114 (100.0%) | $68,438 |
Household Income in Waite Park
Household Income Brackets in Waite Park
With 894 households falling in the category, the $50,000 to $74,999 income range is the most frequent in Waite Park, accounting for 24.0% of all households. In contrast, only 56 households (1.5%) fall into the $200,000+ income bracket, making it the least populous group.
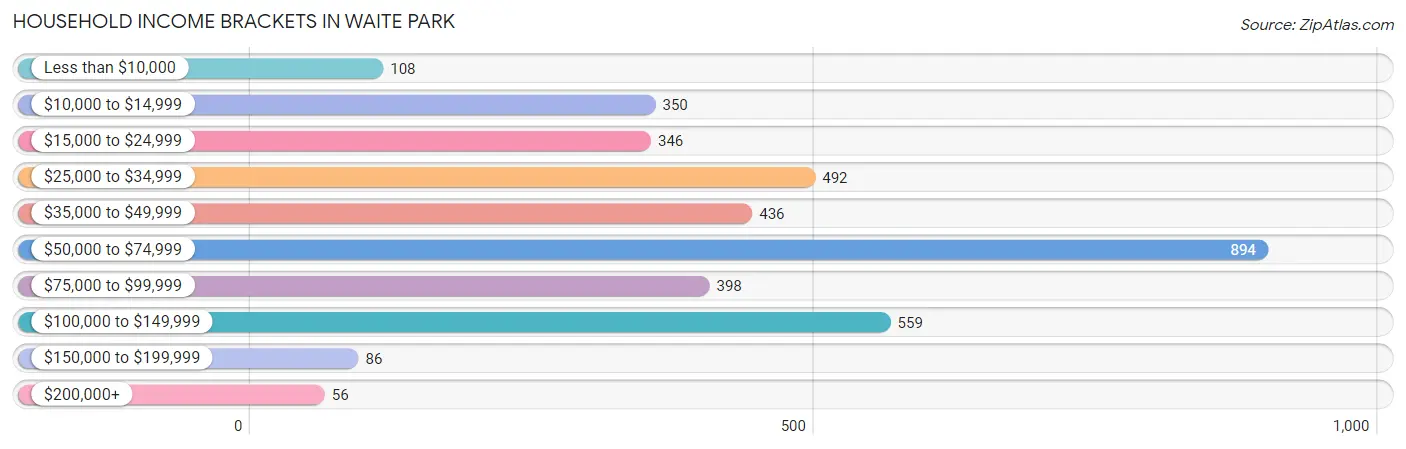
| Income Bracket | # Households | % Households |
| Less than $10,000 | 108 | 2.9% |
| $10,000 to $14,999 | 350 | 9.4% |
| $15,000 to $24,999 | 346 | 9.3% |
| $25,000 to $34,999 | 492 | 13.2% |
| $35,000 to $49,999 | 436 | 11.7% |
| $50,000 to $74,999 | 894 | 24.0% |
| $75,000 to $99,999 | 398 | 10.7% |
| $100,000 to $149,999 | 559 | 15.0% |
| $150,000 to $199,999 | 86 | 2.3% |
| $200,000+ | 56 | 1.5% |
Household Income by Householder Age in Waite Park
The median household income in Waite Park is $52,391, with the highest median household income of $69,063 found in the 25 to 44 years age bracket for the primary householder. A total of 974 households (26.2%) fall into this category. Meanwhile, the 65+ years age bracket for the primary householder has the lowest median household income of $41,404, with 1,318 households (35.4%) in this group.
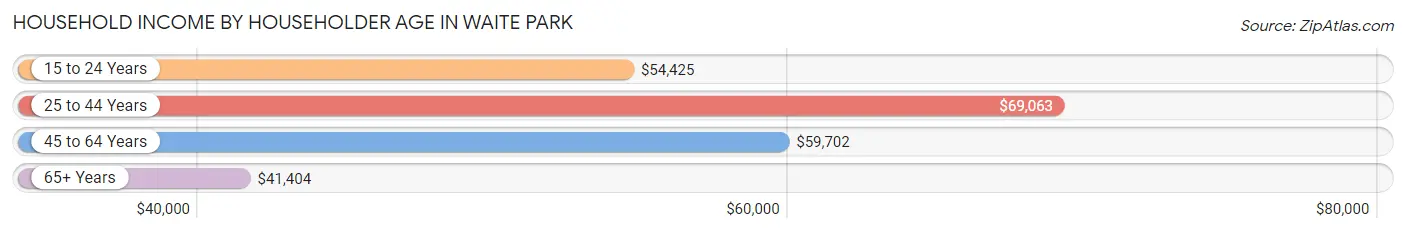
| Income Bracket | # Households | Median Income |
| 15 to 24 Years | 291 (7.8%) | $54,425 |
| 25 to 44 Years | 974 (26.2%) | $69,063 |
| 45 to 64 Years | 1,141 (30.6%) | $59,702 |
| 65+ Years | 1,318 (35.4%) | $41,404 |
| Total | 3,724 (100.0%) | $52,391 |
Poverty in Waite Park
Income Below Poverty by Sex and Age in Waite Park
With 22.9% poverty level for males and 27.2% for females among the residents of Waite Park, 15 year old males and 5 year old females are the most vulnerable to poverty, with 93 males (83.0%) and 25 females (69.4%) in their respective age groups living below the poverty level.
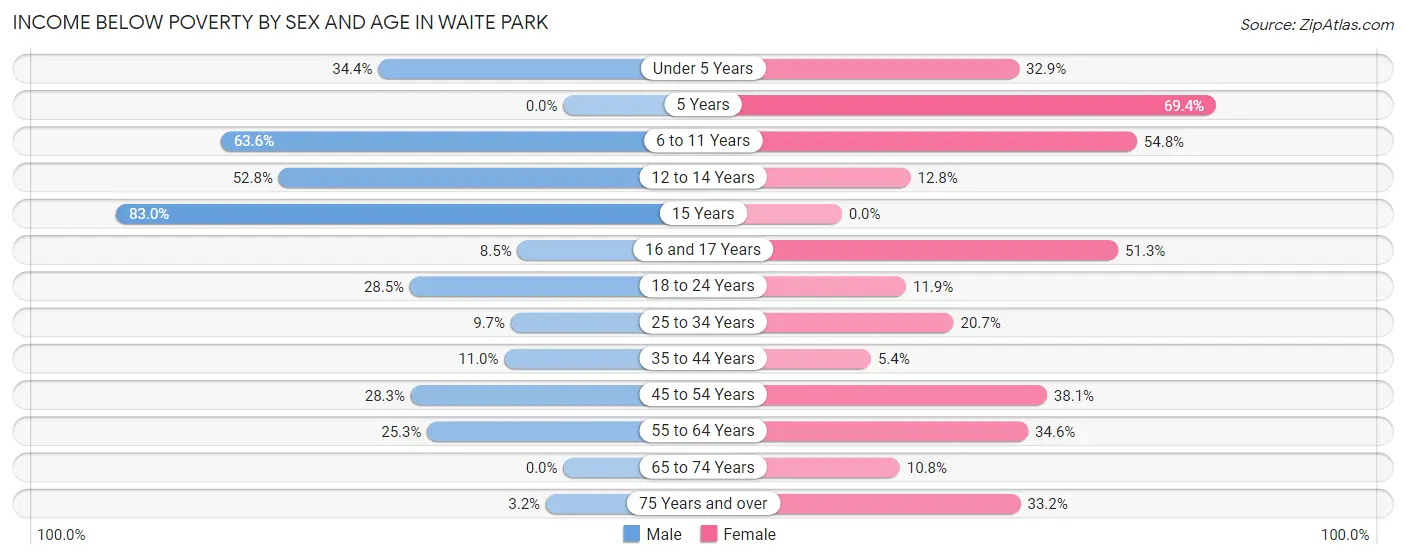
| Age Bracket | Male | Female |
| Under 5 Years | 101 (34.4%) | 52 (32.9%) |
| 5 Years | 0 (0.0%) | 25 (69.4%) |
| 6 to 11 Years | 138 (63.6%) | 149 (54.8%) |
| 12 to 14 Years | 84 (52.8%) | 24 (12.8%) |
| 15 Years | 93 (83.0%) | 0 (0.0%) |
| 16 and 17 Years | 8 (8.5%) | 118 (51.3%) |
| 18 to 24 Years | 119 (28.5%) | 59 (11.9%) |
| 25 to 34 Years | 42 (9.7%) | 112 (20.7%) |
| 35 to 44 Years | 52 (11.0%) | 19 (5.4%) |
| 45 to 54 Years | 122 (28.3%) | 201 (38.1%) |
| 55 to 64 Years | 145 (25.3%) | 147 (34.6%) |
| 65 to 74 Years | 0 (0.0%) | 43 (10.8%) |
| 75 Years and over | 12 (3.2%) | 210 (33.2%) |
| Total | 916 (22.9%) | 1,159 (27.2%) |
Income Above Poverty by Sex and Age in Waite Park
According to the poverty statistics in Waite Park, males aged 5 years and females aged 15 years are the age groups that are most secure financially, with 100.0% of males and 100.0% of females in these age groups living above the poverty line.
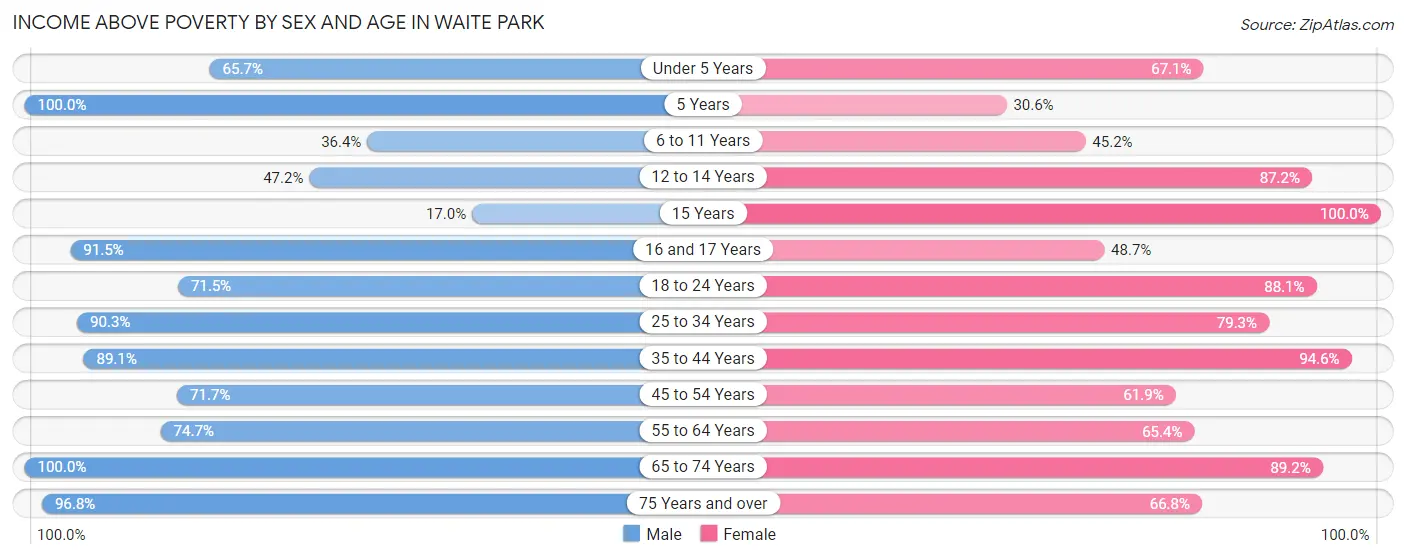
| Age Bracket | Male | Female |
| Under 5 Years | 193 (65.6%) | 106 (67.1%) |
| 5 Years | 18 (100.0%) | 11 (30.6%) |
| 6 to 11 Years | 79 (36.4%) | 123 (45.2%) |
| 12 to 14 Years | 75 (47.2%) | 164 (87.2%) |
| 15 Years | 19 (17.0%) | 10 (100.0%) |
| 16 and 17 Years | 86 (91.5%) | 112 (48.7%) |
| 18 to 24 Years | 299 (71.5%) | 436 (88.1%) |
| 25 to 34 Years | 389 (90.3%) | 428 (79.3%) |
| 35 to 44 Years | 423 (89.0%) | 332 (94.6%) |
| 45 to 54 Years | 309 (71.7%) | 327 (61.9%) |
| 55 to 64 Years | 429 (74.7%) | 278 (65.4%) |
| 65 to 74 Years | 402 (100.0%) | 356 (89.2%) |
| 75 Years and over | 359 (96.8%) | 423 (66.8%) |
| Total | 3,080 (77.1%) | 3,106 (72.8%) |
Income Below Poverty Among Married-Couple Families in Waite Park
The poverty statistics for married-couple families in Waite Park show that 12.1% or 205 of the total 1,687 families live below the poverty line. Families with 5 or more children have the highest poverty rate of 100.0%, comprising of 17 families. On the other hand, families with no children have the lowest poverty rate of 1.1%, which includes 11 families.
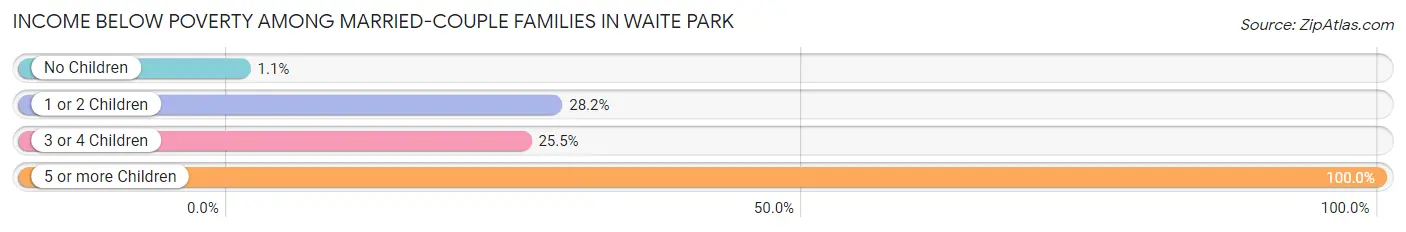
| Children | Above Poverty | Below Poverty |
| No Children | 1,001 (98.9%) | 11 (1.1%) |
| 1 or 2 Children | 239 (71.8%) | 94 (28.2%) |
| 3 or 4 Children | 242 (74.5%) | 83 (25.5%) |
| 5 or more Children | 0 (0.0%) | 17 (100.0%) |
| Total | 1,482 (87.8%) | 205 (12.1%) |
Income Below Poverty Among Single-Parent Households in Waite Park
According to the poverty data in Waite Park, 10.0% or 12 single-father households and 50.2% or 154 single-mother households are living below the poverty line. Among single-father households, those with 3 or 4 children have the highest poverty rate, with 6 households (42.9%) experiencing poverty. Likewise, among single-mother households, those with 3 or 4 children have the highest poverty rate, with 94 households (100.0%) falling below the poverty line.
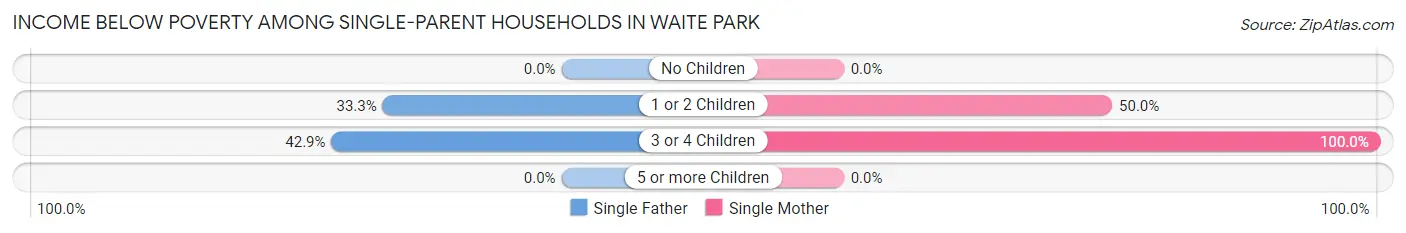
| Children | Single Father | Single Mother |
| No Children | 0 (0.0%) | 0 (0.0%) |
| 1 or 2 Children | 6 (33.3%) | 60 (50.0%) |
| 3 or 4 Children | 6 (42.9%) | 94 (100.0%) |
| 5 or more Children | 0 (0.0%) | 0 (0.0%) |
| Total | 12 (10.0%) | 154 (50.2%) |
Income Below Poverty Among Married-Couple vs Single-Parent Households in Waite Park
The poverty data for Waite Park shows that 205 of the married-couple family households (12.1%) and 166 of the single-parent households (38.9%) are living below the poverty level. Within the married-couple family households, those with 5 or more children have the highest poverty rate, with 17 households (100.0%) falling below the poverty line. Among the single-parent households, those with 3 or 4 children have the highest poverty rate, with 100 household (92.6%) living below poverty.
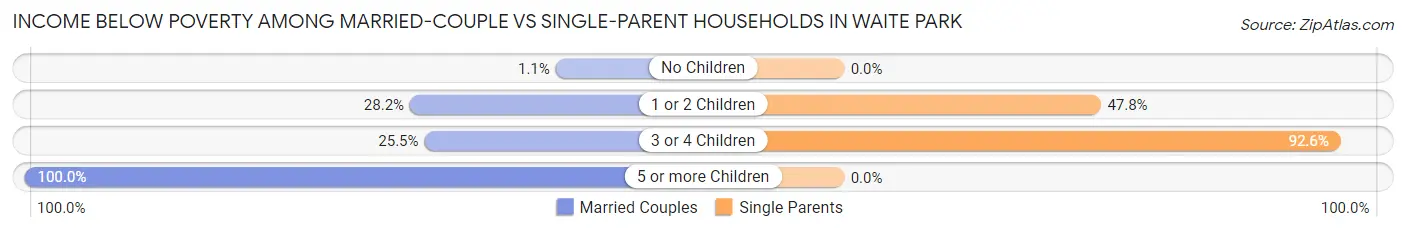
| Children | Married-Couple Families | Single-Parent Households |
| No Children | 11 (1.1%) | 0 (0.0%) |
| 1 or 2 Children | 94 (28.2%) | 66 (47.8%) |
| 3 or 4 Children | 83 (25.5%) | 100 (92.6%) |
| 5 or more Children | 17 (100.0%) | 0 (0.0%) |
| Total | 205 (12.1%) | 166 (38.9%) |
Race in Waite Park
The most populous races in Waite Park are White / Caucasian (4,827 | 58.2%), Black / African American (2,597 | 31.3%), and Hispanic or Latino (609 | 7.3%).
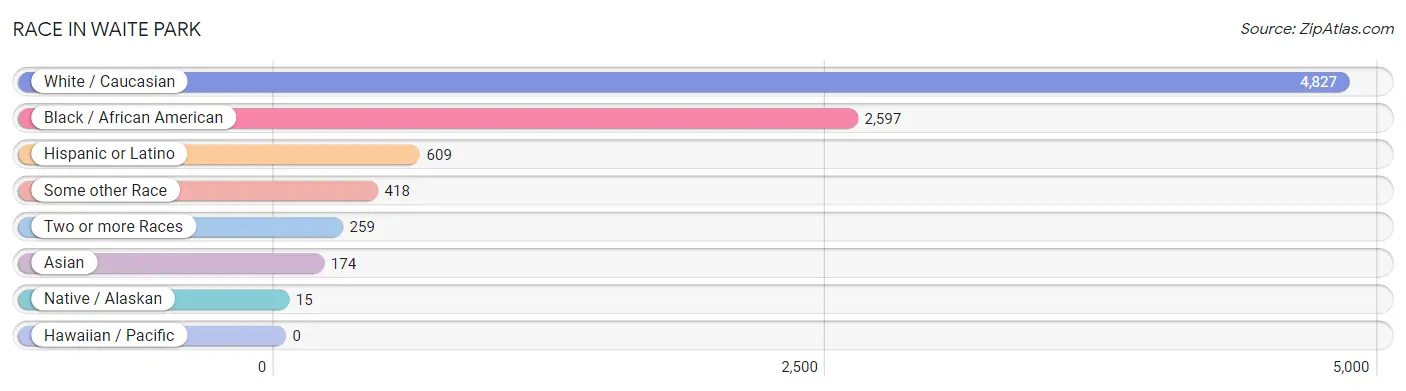
| Race | # Population | % Population |
| Asian | 174 | 2.1% |
| Black / African American | 2,597 | 31.3% |
| Hawaiian / Pacific | 0 | 0.0% |
| Hispanic or Latino | 609 | 7.3% |
| Native / Alaskan | 15 | 0.2% |
| White / Caucasian | 4,827 | 58.2% |
| Two or more Races | 259 | 3.1% |
| Some other Race | 418 | 5.0% |
| Total | 8,290 | 100.0% |
Ancestry in Waite Park
The most populous ancestries reported in Waite Park are German (1,968 | 23.7%), Subsaharan African (1,236 | 14.9%), African (611 | 7.4%), Irish (519 | 6.3%), and Norwegian (478 | 5.8%), together accounting for 58.1% of all Waite Park residents.
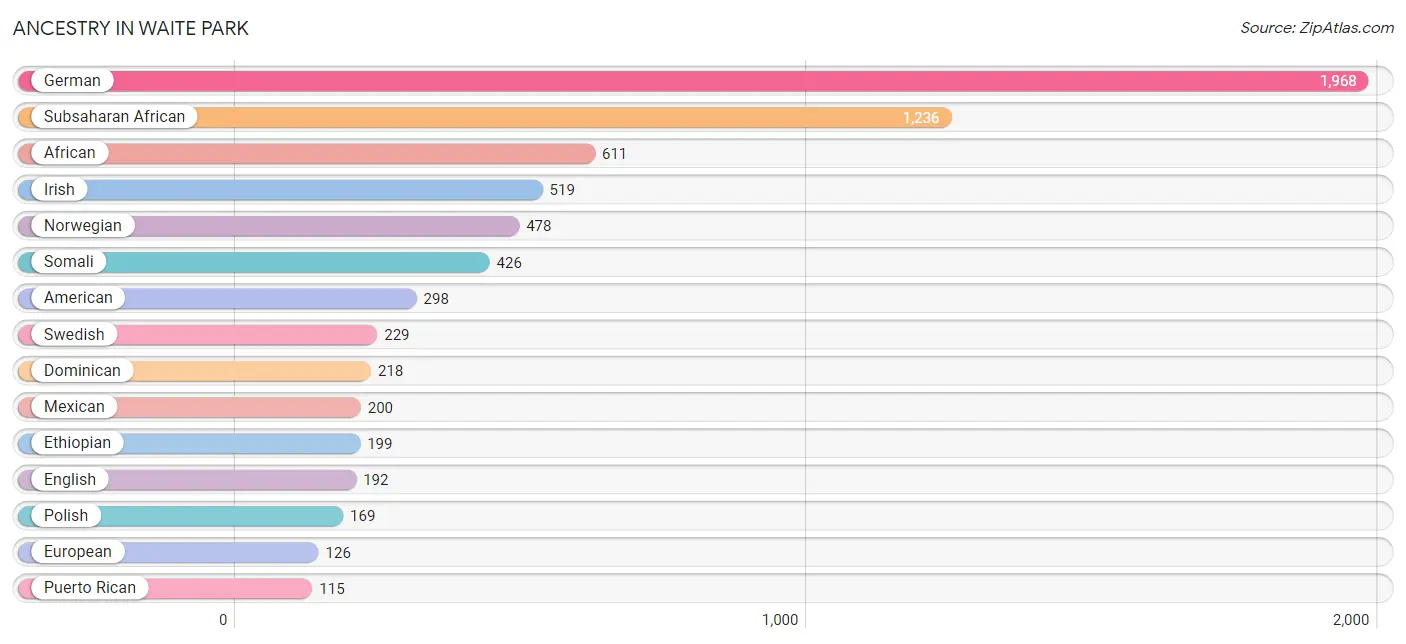
| Ancestry | # Population | % Population |
| African | 611 | 7.4% |
| American | 298 | 3.6% |
| Arab | 20 | 0.2% |
| Bangladeshi | 30 | 0.4% |
| Bhutanese | 10 | 0.1% |
| Burmese | 2 | 0.0% |
| Central American | 12 | 0.1% |
| Cherokee | 29 | 0.4% |
| Chippewa | 33 | 0.4% |
| Cuban | 18 | 0.2% |
| Czech | 69 | 0.8% |
| Czechoslovakian | 20 | 0.2% |
| Danish | 22 | 0.3% |
| Dominican | 218 | 2.6% |
| Dutch | 94 | 1.1% |
| English | 192 | 2.3% |
| Ethiopian | 199 | 2.4% |
| European | 126 | 1.5% |
| Finnish | 59 | 0.7% |
| French | 91 | 1.1% |
| French Canadian | 12 | 0.1% |
| German | 1,968 | 23.7% |
| Greek | 13 | 0.2% |
| Guatemalan | 12 | 0.1% |
| Indian (Asian) | 12 | 0.1% |
| Inupiat | 18 | 0.2% |
| Irish | 519 | 6.3% |
| Italian | 33 | 0.4% |
| Lebanese | 20 | 0.2% |
| Luxembourger | 13 | 0.2% |
| Mexican | 200 | 2.4% |
| Native Hawaiian | 28 | 0.3% |
| Norwegian | 478 | 5.8% |
| Polish | 169 | 2.0% |
| Puerto Rican | 115 | 1.4% |
| Russian | 18 | 0.2% |
| Samoan | 23 | 0.3% |
| Scandinavian | 25 | 0.3% |
| Scotch-Irish | 16 | 0.2% |
| Scottish | 23 | 0.3% |
| Sioux | 5 | 0.1% |
| Slovak | 20 | 0.2% |
| Somali | 426 | 5.1% |
| Spanish | 27 | 0.3% |
| Sri Lankan | 85 | 1.0% |
| Subsaharan African | 1,236 | 14.9% |
| Swedish | 229 | 2.8% |
| Tlingit-Haida | 48 | 0.6% |
| Yugoslavian | 21 | 0.3% | View All 49 Rows |
Immigrants in Waite Park
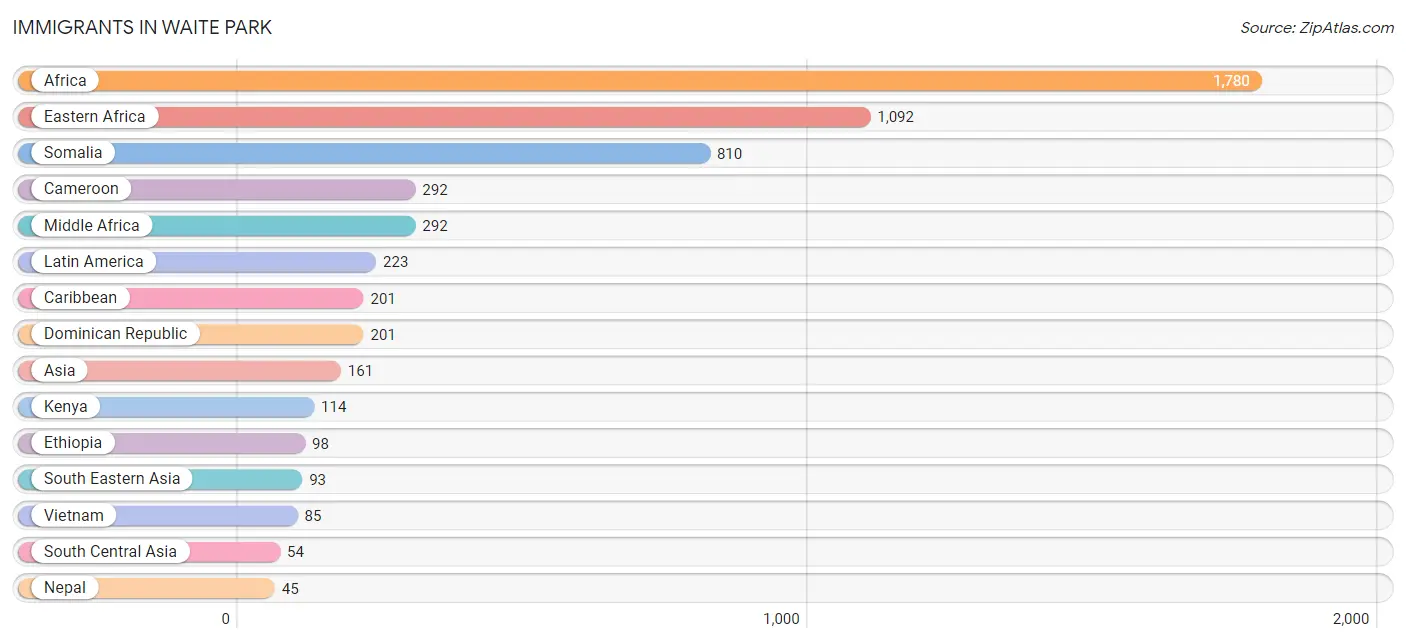
The most numerous immigrant groups reported in Waite Park came from Africa (1,780 | 21.5%), Eastern Africa (1,092 | 13.2%), Somalia (810 | 9.8%), Cameroon (292 | 3.5%), and Middle Africa (292 | 3.5%), together accounting for 51.5% of all Waite Park residents.
| Immigration Origin | # Population | % Population |
| Africa | 1,780 | 21.5% |
| Asia | 161 | 1.9% |
| Cameroon | 292 | 3.5% |
| Caribbean | 201 | 2.4% |
| Central America | 22 | 0.3% |
| China | 12 | 0.1% |
| Dominican Republic | 201 | 2.4% |
| Eastern Africa | 1,092 | 13.2% |
| Eastern Asia | 14 | 0.2% |
| Ethiopia | 98 | 1.2% |
| Europe | 17 | 0.2% |
| Germany | 17 | 0.2% |
| Guatemala | 5 | 0.1% |
| Kenya | 114 | 1.4% |
| Korea | 2 | 0.0% |
| Laos | 8 | 0.1% |
| Latin America | 223 | 2.7% |
| Mexico | 17 | 0.2% |
| Middle Africa | 292 | 3.5% |
| Nepal | 45 | 0.5% |
| Pakistan | 9 | 0.1% |
| Somalia | 810 | 9.8% |
| South Central Asia | 54 | 0.6% |
| South Eastern Asia | 93 | 1.1% |
| Vietnam | 85 | 1.0% |
| Western Europe | 17 | 0.2% | View All 26 Rows |
Sex and Age in Waite Park
Sex and Age in Waite Park
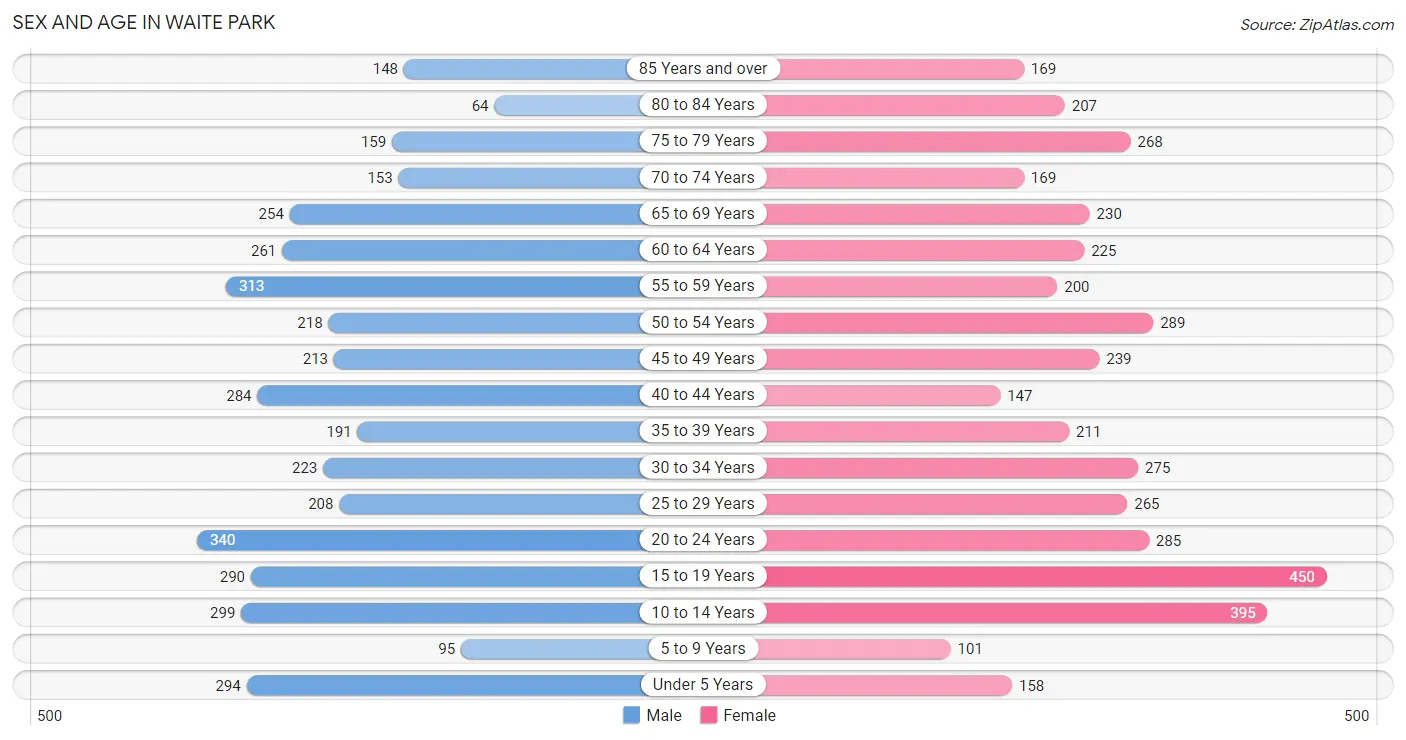
The most populous age groups in Waite Park are 20 to 24 Years (340 | 8.5%) for men and 15 to 19 Years (450 | 10.5%) for women.
| Age Bracket | Male | Female |
| Under 5 Years | 294 (7.3%) | 158 (3.7%) |
| 5 to 9 Years | 95 (2.4%) | 101 (2.4%) |
| 10 to 14 Years | 299 (7.5%) | 395 (9.2%) |
| 15 to 19 Years | 290 (7.2%) | 450 (10.5%) |
| 20 to 24 Years | 340 (8.5%) | 285 (6.7%) |
| 25 to 29 Years | 208 (5.2%) | 265 (6.2%) |
| 30 to 34 Years | 223 (5.6%) | 275 (6.4%) |
| 35 to 39 Years | 191 (4.8%) | 211 (4.9%) |
| 40 to 44 Years | 284 (7.1%) | 147 (3.4%) |
| 45 to 49 Years | 213 (5.3%) | 239 (5.6%) |
| 50 to 54 Years | 218 (5.4%) | 289 (6.8%) |
| 55 to 59 Years | 313 (7.8%) | 200 (4.7%) |
| 60 to 64 Years | 261 (6.5%) | 225 (5.2%) |
| 65 to 69 Years | 254 (6.3%) | 230 (5.4%) |
| 70 to 74 Years | 153 (3.8%) | 169 (4.0%) |
| 75 to 79 Years | 159 (4.0%) | 268 (6.3%) |
| 80 to 84 Years | 64 (1.6%) | 207 (4.8%) |
| 85 Years and over | 148 (3.7%) | 169 (4.0%) |
| Total | 4,007 (100.0%) | 4,283 (100.0%) |
Families and Households in Waite Park
Median Family Size in Waite Park
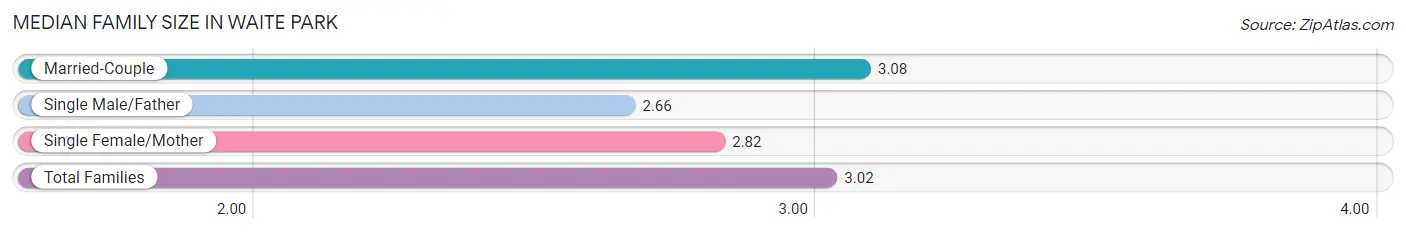
The median family size in Waite Park is 3.02 persons per family, with married-couple families (1,687 | 79.8%) accounting for the largest median family size of 3.08 persons per family. On the other hand, single male/father families (120 | 5.7%) represent the smallest median family size with 2.66 persons per family.
| Family Type | # Families | Family Size |
| Married-Couple | 1,687 (79.8%) | 3.08 |
| Single Male/Father | 120 (5.7%) | 2.66 |
| Single Female/Mother | 307 (14.5%) | 2.82 |
| Total Families | 2,114 (100.0%) | 3.02 |
Median Household Size in Waite Park
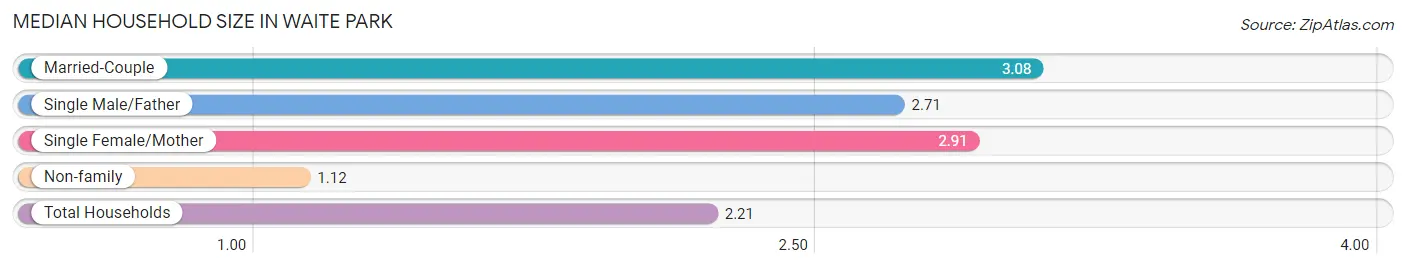
The median household size in Waite Park is 2.21 persons per household, with married-couple households (1,687 | 45.3%) accounting for the largest median household size of 3.08 persons per household. non-family households (1,610 | 43.2%) represent the smallest median household size with 1.12 persons per household.
| Household Type | # Households | Household Size |
| Married-Couple | 1,687 (45.3%) | 3.08 |
| Single Male/Father | 120 (3.2%) | 2.71 |
| Single Female/Mother | 307 (8.2%) | 2.91 |
| Non-family | 1,610 (43.2%) | 1.12 |
| Total Households | 3,724 (100.0%) | 2.21 |
Household Size by Marriage Status in Waite Park
Out of a total of 3,724 households in Waite Park, 2,114 (56.8%) are family households, while 1,610 (43.2%) are nonfamily households. The most numerous type of family households are 2-person households, comprising 1,134, and the most common type of nonfamily households are 1-person households, comprising 1,354.
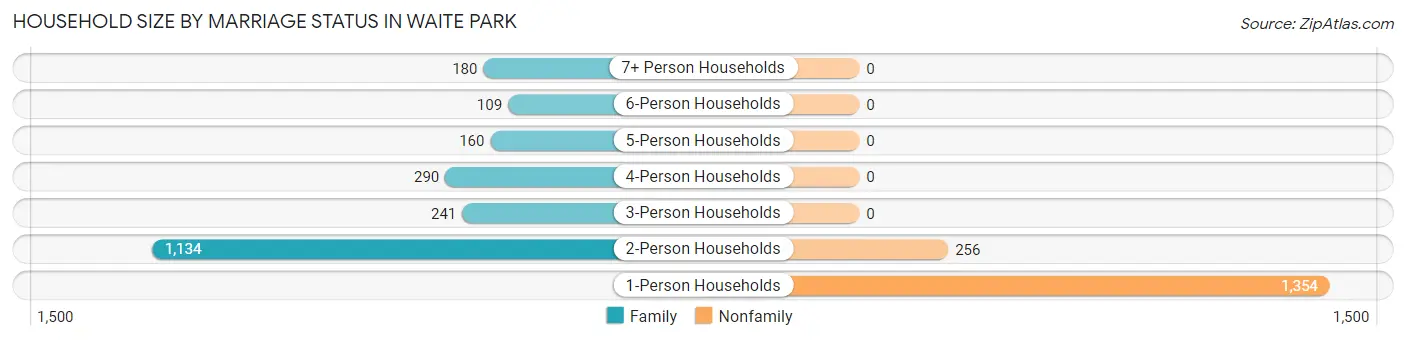
| Household Size | Family Households | Nonfamily Households |
| 1-Person Households | - | 1,354 (36.4%) |
| 2-Person Households | 1,134 (30.4%) | 256 (6.9%) |
| 3-Person Households | 241 (6.5%) | 0 (0.0%) |
| 4-Person Households | 290 (7.8%) | 0 (0.0%) |
| 5-Person Households | 160 (4.3%) | 0 (0.0%) |
| 6-Person Households | 109 (2.9%) | 0 (0.0%) |
| 7+ Person Households | 180 (4.8%) | 0 (0.0%) |
| Total | 2,114 (56.8%) | 1,610 (43.2%) |
Female Fertility in Waite Park
Fertility by Age in Waite Park
Average fertility rate in Waite Park is 70.0 births per 1,000 women. Women in the age bracket of 35 to 50 years have the highest fertility rate with 110.0 births per 1,000 women. Women in the age bracket of 35 to 50 years acount for 52.2% of all women with births.
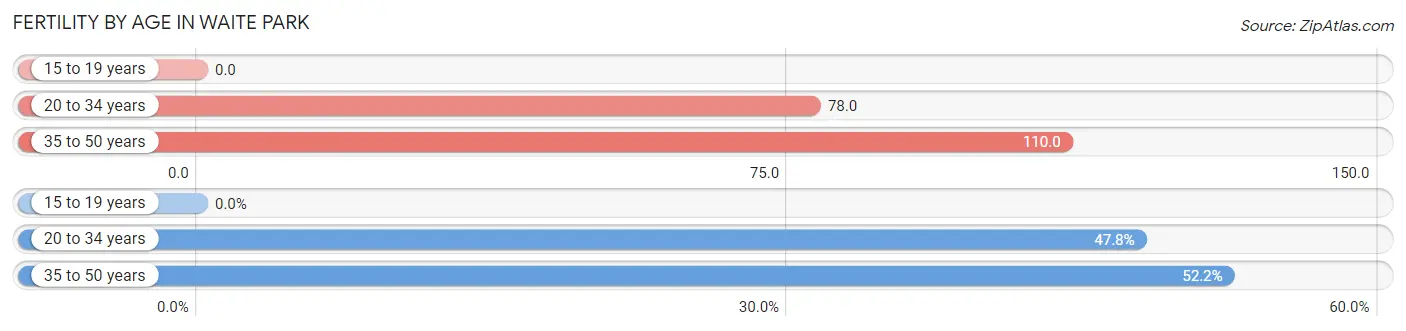
| Age Bracket | Women with Births | Births / 1,000 Women |
| 15 to 19 years | 0 (0.0%) | 0.0 |
| 20 to 34 years | 64 (47.8%) | 78.0 |
| 35 to 50 years | 70 (52.2%) | 110.0 |
| Total | 134 (100.0%) | 70.0 |
Fertility by Age by Marriage Status in Waite Park
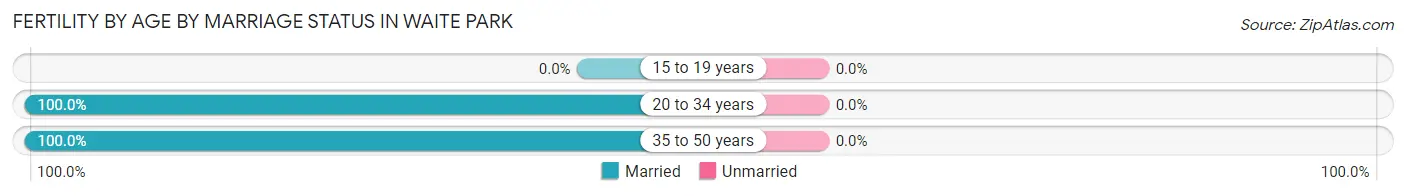
| Age Bracket | Married | Unmarried |
| 15 to 19 years | 0 (0.0%) | 0 (0.0%) |
| 20 to 34 years | 64 (100.0%) | 0 (0.0%) |
| 35 to 50 years | 70 (100.0%) | 0 (0.0%) |
| Total | 134 (100.0%) | 0 (0.0%) |
Fertility by Education in Waite Park
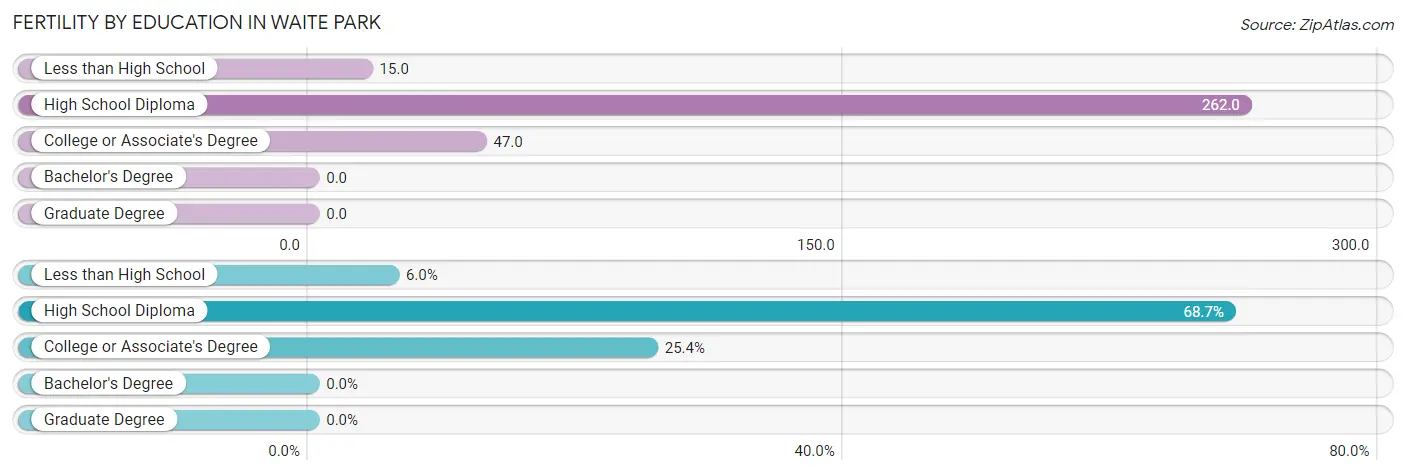
| Educational Attainment | Women with Births | Births / 1,000 Women |
| Less than High School | 8 (6.0%) | 15.0 |
| High School Diploma | 92 (68.7%) | 262.0 |
| College or Associate's Degree | 34 (25.4%) | 47.0 |
| Bachelor's Degree | 0 (0.0%) | 0.0 |
| Graduate Degree | 0 (0.0%) | 0.0 |
| Total | 134 (100.0%) | 70.0 |
Fertility by Education by Marriage Status in Waite Park
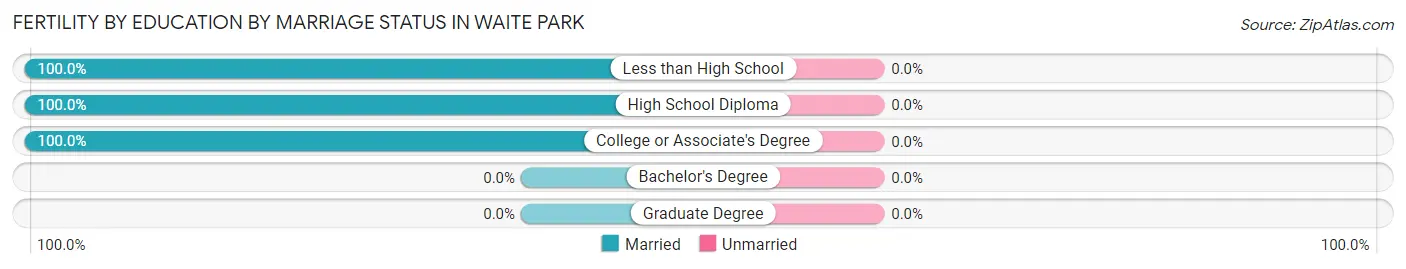
| Educational Attainment | Married | Unmarried |
| Less than High School | 8 (100.0%) | 0 (0.0%) |
| High School Diploma | 92 (100.0%) | 0 (0.0%) |
| College or Associate's Degree | 34 (100.0%) | 0 (0.0%) |
| Bachelor's Degree | 0 (0.0%) | 0 (0.0%) |
| Graduate Degree | 0 (0.0%) | 0 (0.0%) |
| Total | 134 (100.0%) | 0 (0.0%) |
Employment Characteristics in Waite Park
Employment by Class of Employer in Waite Park
Among the 4,032 employed individuals in Waite Park, private company employees (2,800 | 69.4%), not-for-profit organizations (565 | 14.0%), and self-employed (not incorporated) (292 | 7.2%) make up the most common classes of employment.
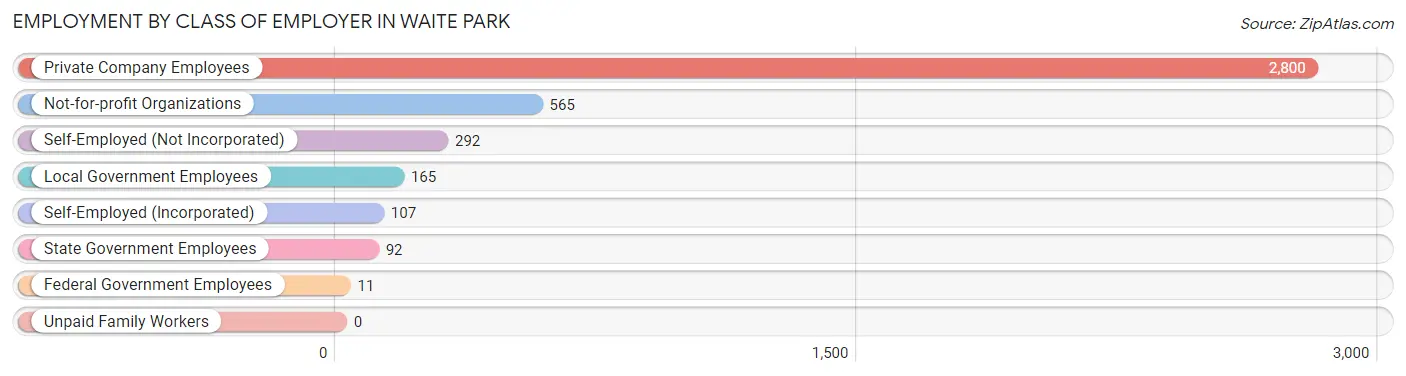
| Employer Class | # Employees | % Employees |
| Private Company Employees | 2,800 | 69.4% |
| Self-Employed (Incorporated) | 107 | 2.6% |
| Self-Employed (Not Incorporated) | 292 | 7.2% |
| Not-for-profit Organizations | 565 | 14.0% |
| Local Government Employees | 165 | 4.1% |
| State Government Employees | 92 | 2.3% |
| Federal Government Employees | 11 | 0.3% |
| Unpaid Family Workers | 0 | 0.0% |
| Total | 4,032 | 100.0% |
Employment Status by Age in Waite Park
According to the labor force statistics for Waite Park, out of the total population over 16 years of age (6,826), 62.9% or 4,294 individuals are in the labor force, with 5.5% or 236 of them unemployed. The age group with the highest labor force participation rate is 25 to 29 years, with 93.4% or 442 individuals in the labor force. Within the labor force, the 30 to 34 years age range has the highest percentage of unemployed individuals, with 10.5% or 43 of them being unemployed.
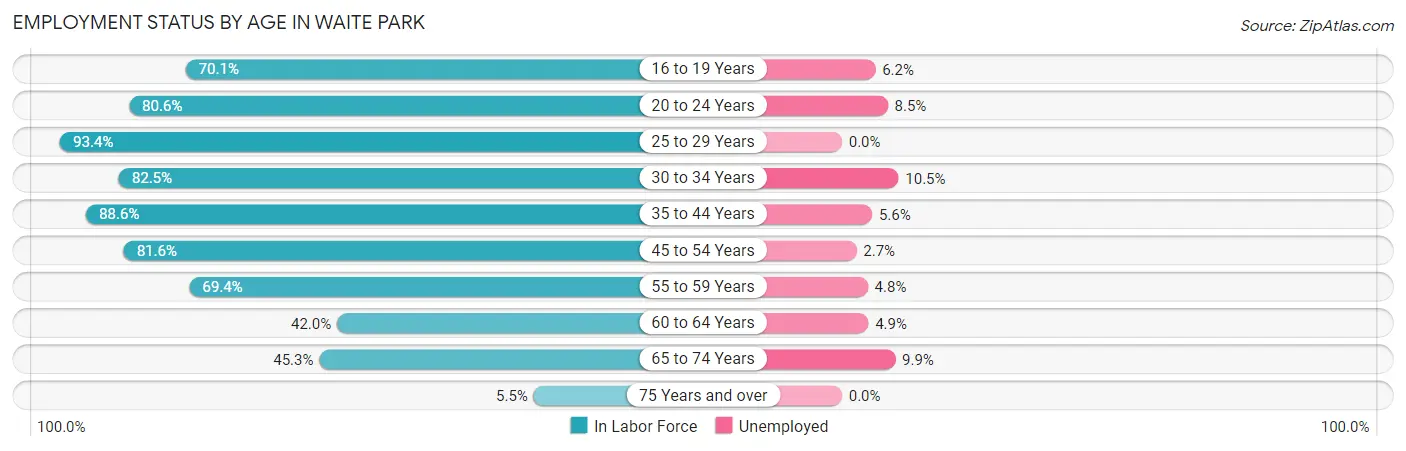
| Age Bracket | In Labor Force | Unemployed |
| 16 to 19 Years | 433 (70.1%) | 27 (6.2%) |
| 20 to 24 Years | 504 (80.6%) | 43 (8.5%) |
| 25 to 29 Years | 442 (93.4%) | 0 (0.0%) |
| 30 to 34 Years | 411 (82.5%) | 43 (10.5%) |
| 35 to 44 Years | 738 (88.6%) | 41 (5.6%) |
| 45 to 54 Years | 783 (81.6%) | 21 (2.7%) |
| 55 to 59 Years | 356 (69.4%) | 17 (4.8%) |
| 60 to 64 Years | 204 (42.0%) | 10 (4.9%) |
| 65 to 74 Years | 365 (45.3%) | 36 (9.9%) |
| 75 Years and over | 56 (5.5%) | 0 (0.0%) |
| Total | 4,294 (62.9%) | 236 (5.5%) |
Employment Status by Educational Attainment in Waite Park
According to labor force statistics for Waite Park, 78.0% of individuals (2,934) out of the total population between 25 and 64 years of age (3,762) are in the labor force, with 4.5% or 132 of them being unemployed. The group with the highest labor force participation rate are those with the educational attainment of bachelor's degree or higher, with 92.9% or 523 individuals in the labor force. Within the labor force, individuals with high school diploma education have the highest percentage of unemployment, with 15.3% or 111 of them being unemployed.
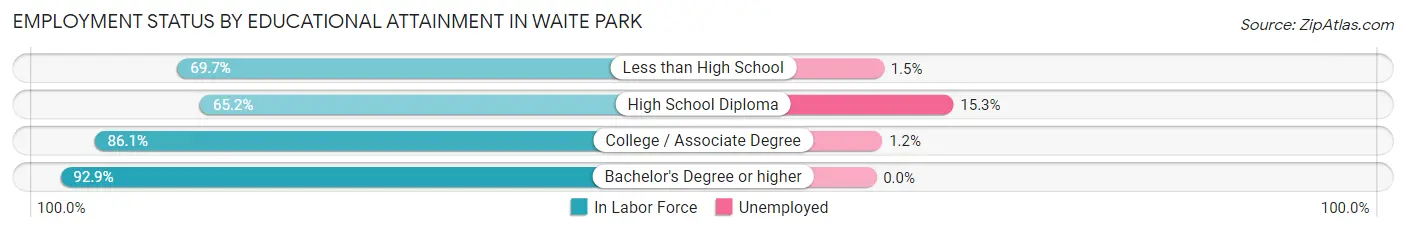
| Educational Attainment | In Labor Force | Unemployed |
| Less than High School | 470 (69.7%) | 10 (1.5%) |
| High School Diploma | 727 (65.2%) | 171 (15.3%) |
| College / Associate Degree | 1,214 (86.1%) | 17 (1.2%) |
| Bachelor's Degree or higher | 523 (92.9%) | 0 (0.0%) |
| Total | 2,934 (78.0%) | 169 (4.5%) |
Employment Occupations by Sex in Waite Park
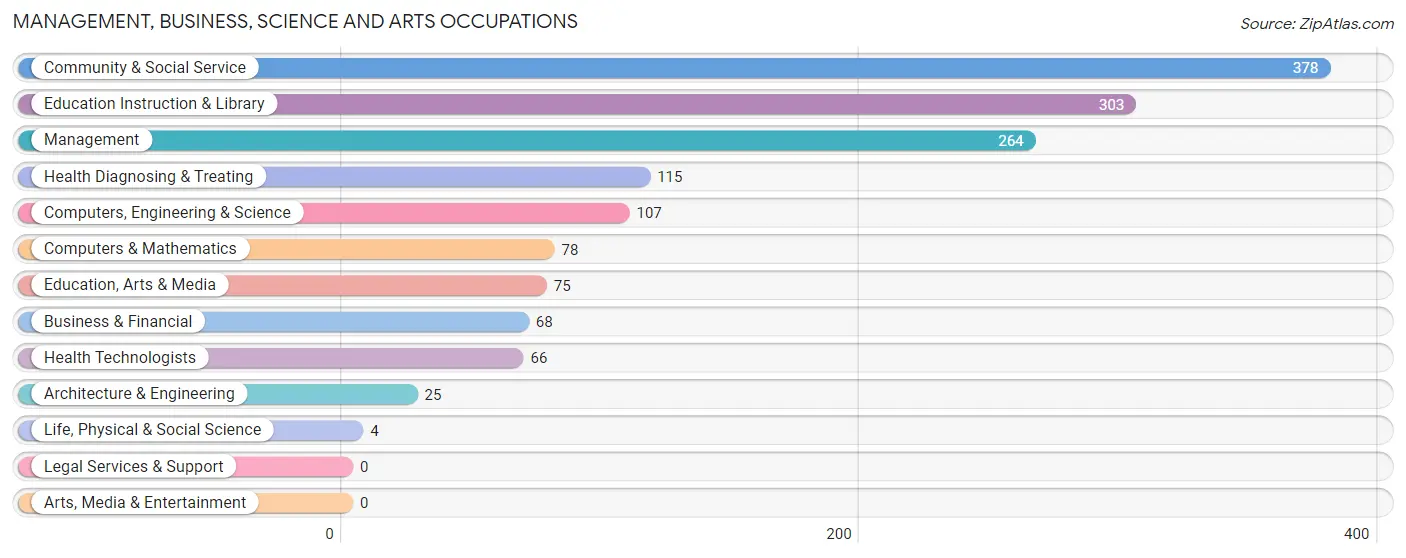
Management, Business, Science and Arts Occupations
The most common Management, Business, Science and Arts occupations in Waite Park are Community & Social Service (378 | 9.3%), Education Instruction & Library (303 | 7.5%), Management (264 | 6.5%), Health Diagnosing & Treating (115 | 2.8%), and Computers, Engineering & Science (107 | 2.6%).
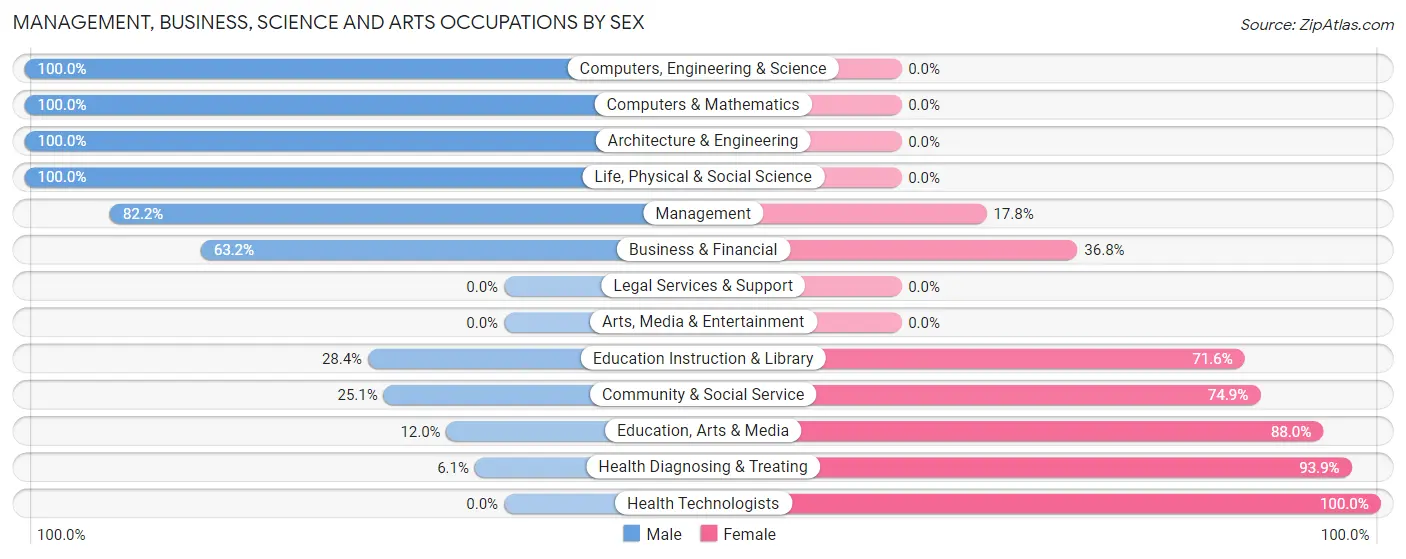
Management, Business, Science and Arts Occupations by Sex
Within the Management, Business, Science and Arts occupations in Waite Park, the most male-oriented occupations are Computers, Engineering & Science (100.0%), Computers & Mathematics (100.0%), and Architecture & Engineering (100.0%), while the most female-oriented occupations are Health Technologists (100.0%), Health Diagnosing & Treating (93.9%), and Education, Arts & Media (88.0%).
| Occupation | Male | Female |
| Management | 217 (82.2%) | 47 (17.8%) |
| Business & Financial | 43 (63.2%) | 25 (36.8%) |
| Computers, Engineering & Science | 107 (100.0%) | 0 (0.0%) |
| Computers & Mathematics | 78 (100.0%) | 0 (0.0%) |
| Architecture & Engineering | 25 (100.0%) | 0 (0.0%) |
| Life, Physical & Social Science | 4 (100.0%) | 0 (0.0%) |
| Community & Social Service | 95 (25.1%) | 283 (74.9%) |
| Education, Arts & Media | 9 (12.0%) | 66 (88.0%) |
| Legal Services & Support | 0 (0.0%) | 0 (0.0%) |
| Education Instruction & Library | 86 (28.4%) | 217 (71.6%) |
| Arts, Media & Entertainment | 0 (0.0%) | 0 (0.0%) |
| Health Diagnosing & Treating | 7 (6.1%) | 108 (93.9%) |
| Health Technologists | 0 (0.0%) | 66 (100.0%) |
| Total (Category) | 469 (50.3%) | 463 (49.7%) |
| Total (Overall) | 1,936 (47.8%) | 2,118 (52.2%) |
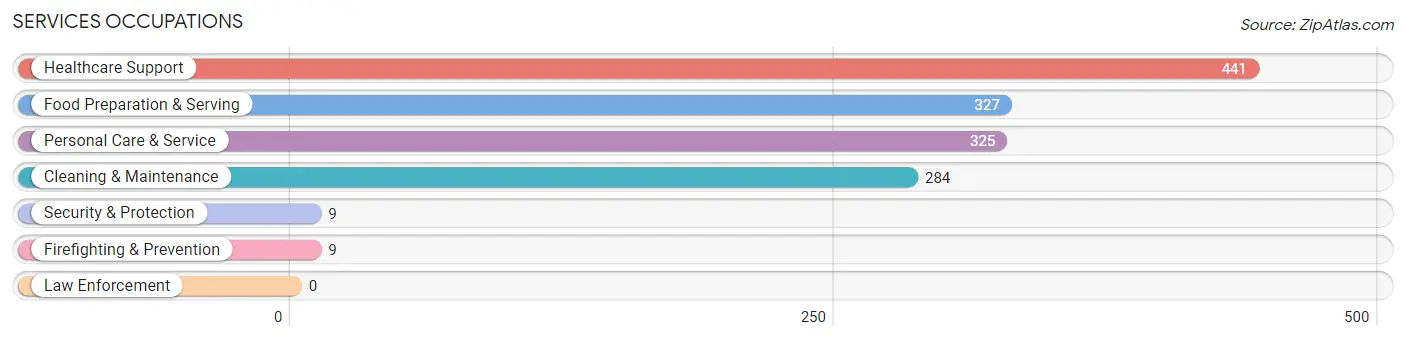
Services Occupations
The most common Services occupations in Waite Park are Healthcare Support (441 | 10.9%), Food Preparation & Serving (327 | 8.1%), Personal Care & Service (325 | 8.0%), Cleaning & Maintenance (284 | 7.0%), and Security & Protection (9 | 0.2%).
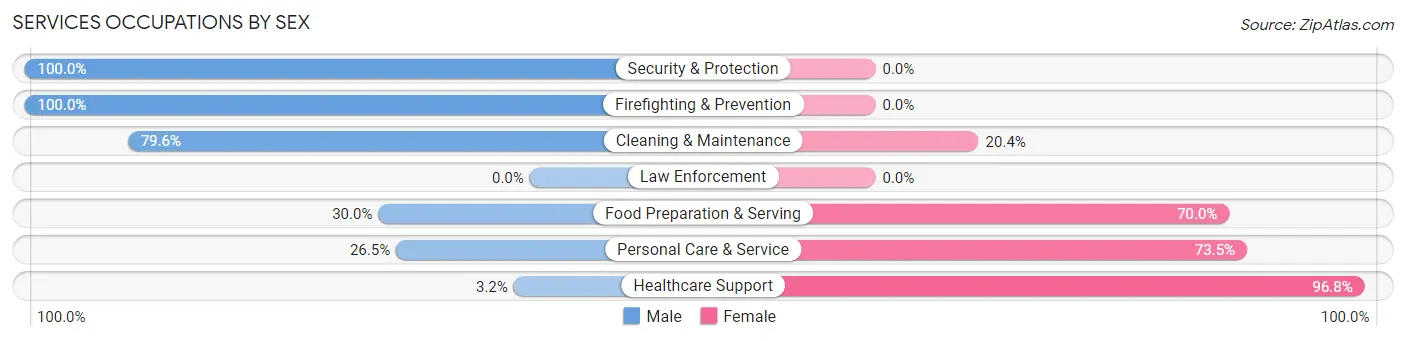
Services Occupations by Sex
Within the Services occupations in Waite Park, the most male-oriented occupations are Security & Protection (100.0%), Firefighting & Prevention (100.0%), and Cleaning & Maintenance (79.6%), while the most female-oriented occupations are Healthcare Support (96.8%), Personal Care & Service (73.5%), and Food Preparation & Serving (70.0%).
| Occupation | Male | Female |
| Healthcare Support | 14 (3.2%) | 427 (96.8%) |
| Security & Protection | 9 (100.0%) | 0 (0.0%) |
| Firefighting & Prevention | 9 (100.0%) | 0 (0.0%) |
| Law Enforcement | 0 (0.0%) | 0 (0.0%) |
| Food Preparation & Serving | 98 (30.0%) | 229 (70.0%) |
| Cleaning & Maintenance | 226 (79.6%) | 58 (20.4%) |
| Personal Care & Service | 86 (26.5%) | 239 (73.5%) |
| Total (Category) | 433 (31.2%) | 953 (68.8%) |
| Total (Overall) | 1,936 (47.8%) | 2,118 (52.2%) |
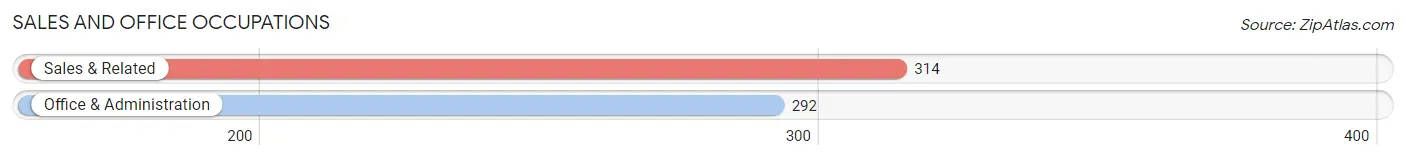
Sales and Office Occupations
The most common Sales and Office occupations in Waite Park are Sales & Related (314 | 7.7%), and Office & Administration (292 | 7.2%).
Sales and Office Occupations by Sex
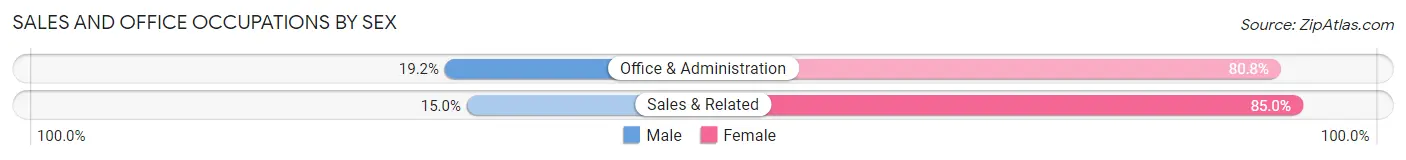
| Occupation | Male | Female |
| Sales & Related | 47 (15.0%) | 267 (85.0%) |
| Office & Administration | 56 (19.2%) | 236 (80.8%) |
| Total (Category) | 103 (17.0%) | 503 (83.0%) |
| Total (Overall) | 1,936 (47.8%) | 2,118 (52.2%) |
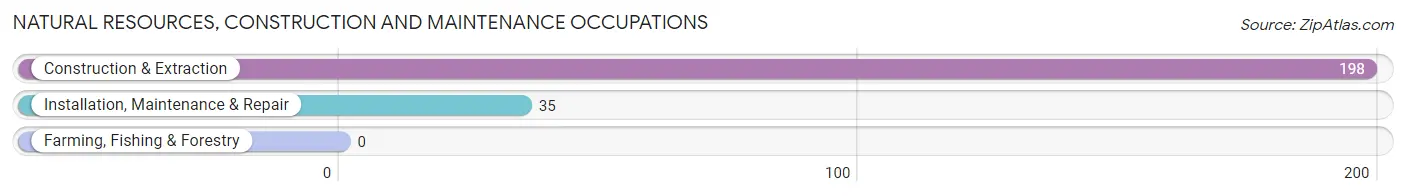
Natural Resources, Construction and Maintenance Occupations
The most common Natural Resources, Construction and Maintenance occupations in Waite Park are Construction & Extraction (198 | 4.9%), and Installation, Maintenance & Repair (35 | 0.9%).
Natural Resources, Construction and Maintenance Occupations by Sex
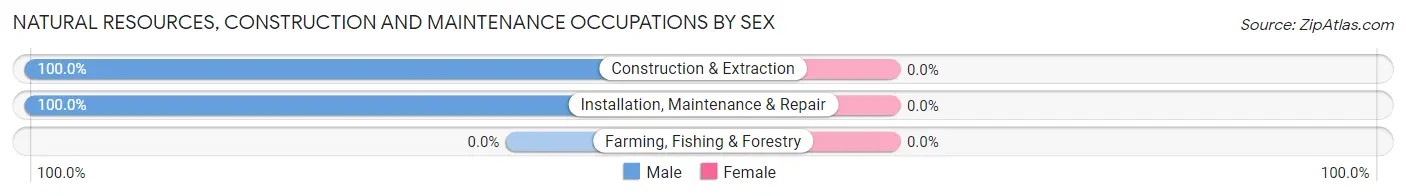
| Occupation | Male | Female |
| Farming, Fishing & Forestry | 0 (0.0%) | 0 (0.0%) |
| Construction & Extraction | 198 (100.0%) | 0 (0.0%) |
| Installation, Maintenance & Repair | 35 (100.0%) | 0 (0.0%) |
| Total (Category) | 233 (100.0%) | 0 (0.0%) |
| Total (Overall) | 1,936 (47.8%) | 2,118 (52.2%) |
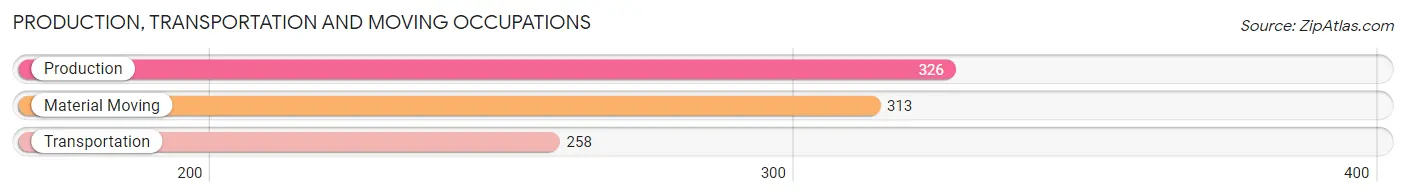
Production, Transportation and Moving Occupations
The most common Production, Transportation and Moving occupations in Waite Park are Production (326 | 8.0%), Material Moving (313 | 7.7%), and Transportation (258 | 6.4%).
Production, Transportation and Moving Occupations by Sex
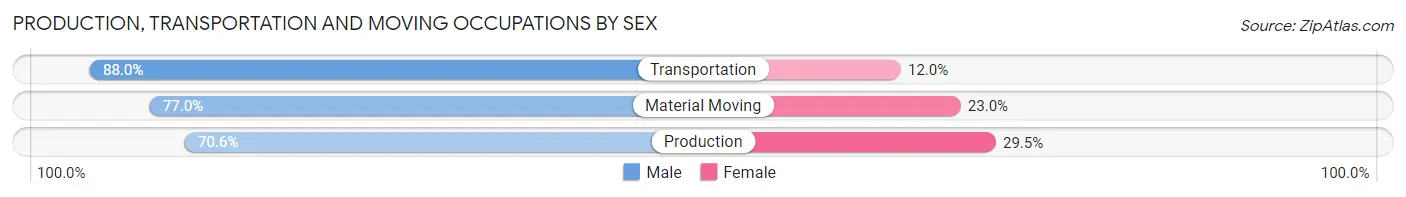
| Occupation | Male | Female |
| Production | 230 (70.6%) | 96 (29.4%) |
| Transportation | 227 (88.0%) | 31 (12.0%) |
| Material Moving | 241 (77.0%) | 72 (23.0%) |
| Total (Category) | 698 (77.8%) | 199 (22.2%) |
| Total (Overall) | 1,936 (47.8%) | 2,118 (52.2%) |
Employment Industries by Sex in Waite Park
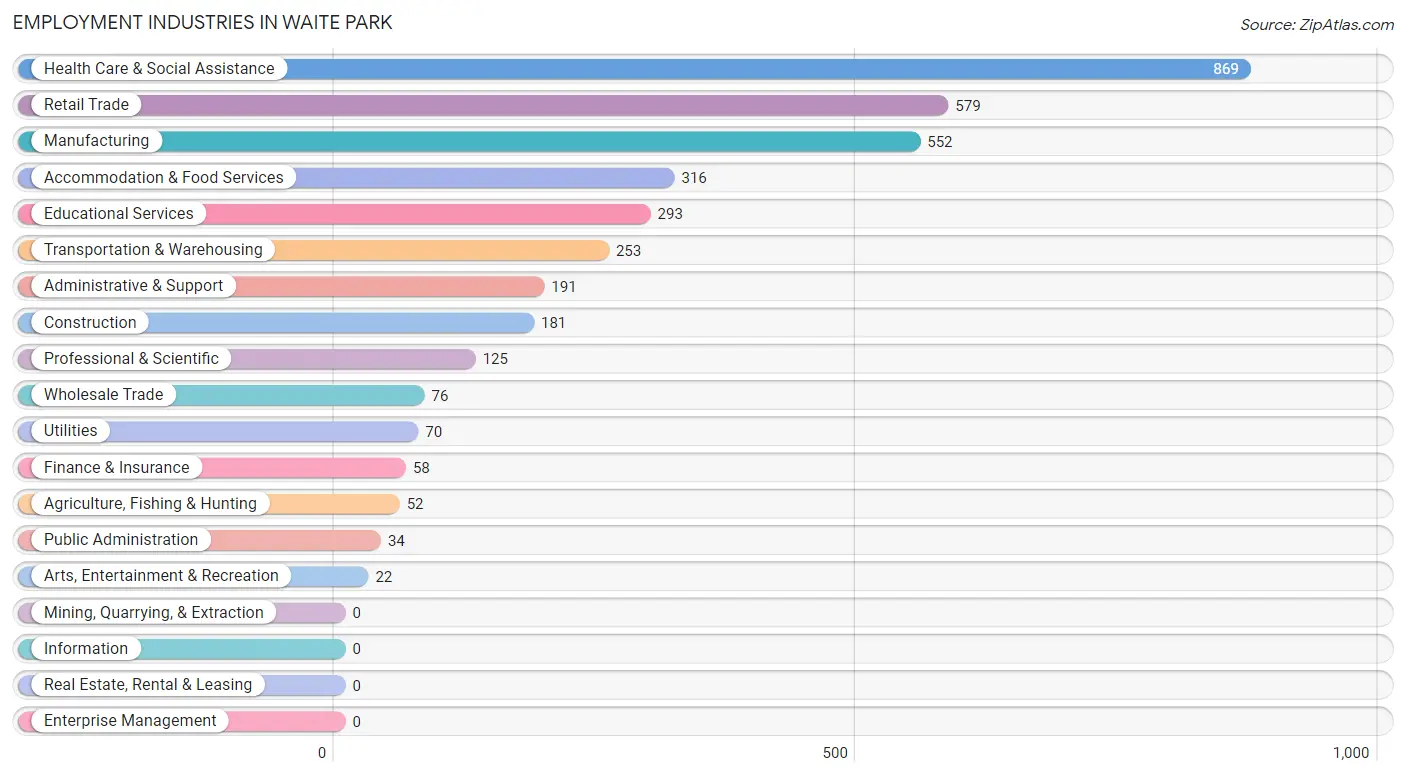
Employment Industries in Waite Park
The major employment industries in Waite Park include Health Care & Social Assistance (869 | 21.4%), Retail Trade (579 | 14.3%), Manufacturing (552 | 13.6%), Accommodation & Food Services (316 | 7.8%), and Educational Services (293 | 7.2%).
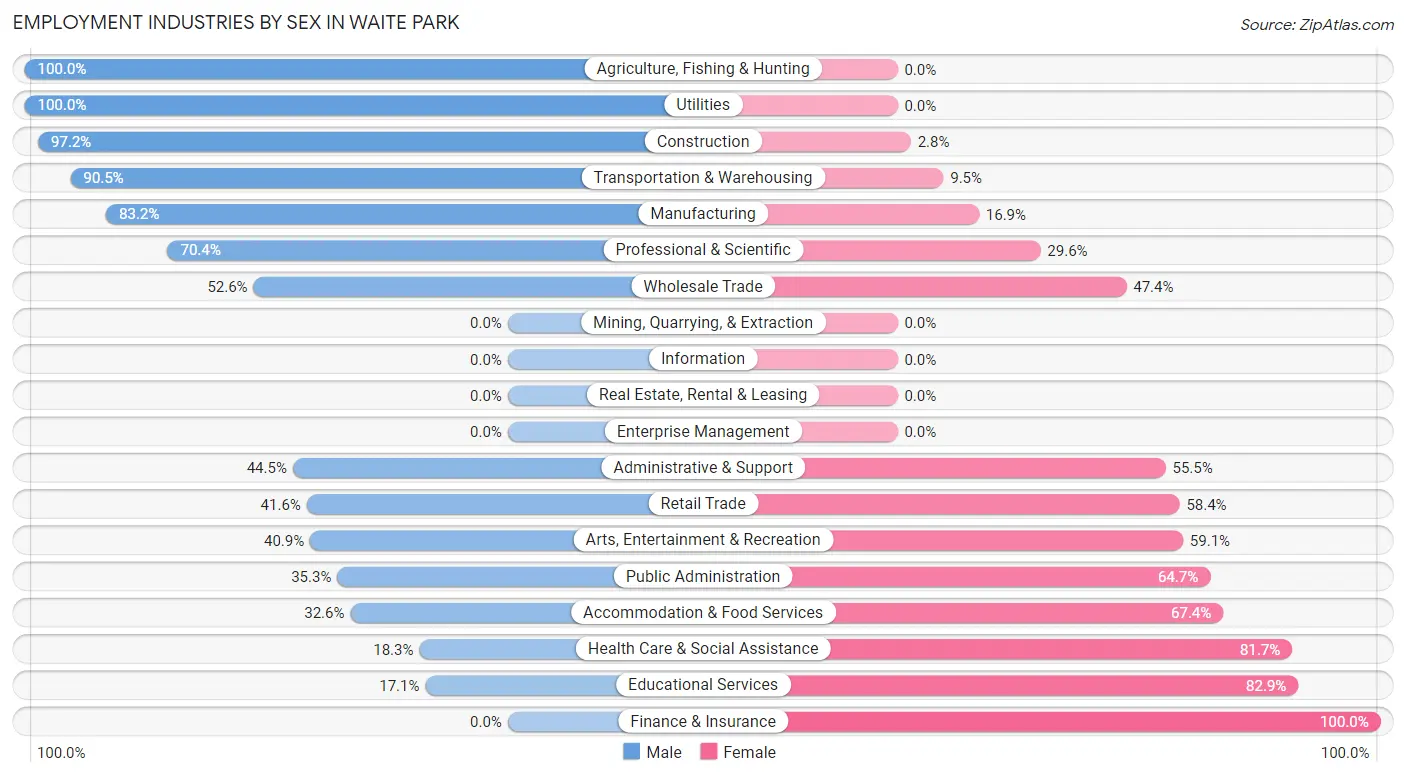
Employment Industries by Sex in Waite Park
The Waite Park industries that see more men than women are Agriculture, Fishing & Hunting (100.0%), Utilities (100.0%), and Construction (97.2%), whereas the industries that tend to have a higher number of women are Finance & Insurance (100.0%), Educational Services (82.9%), and Health Care & Social Assistance (81.7%).
| Industry | Male | Female |
| Agriculture, Fishing & Hunting | 52 (100.0%) | 0 (0.0%) |
| Mining, Quarrying, & Extraction | 0 (0.0%) | 0 (0.0%) |
| Construction | 176 (97.2%) | 5 (2.8%) |
| Manufacturing | 459 (83.2%) | 93 (16.9%) |
| Wholesale Trade | 40 (52.6%) | 36 (47.4%) |
| Retail Trade | 241 (41.6%) | 338 (58.4%) |
| Transportation & Warehousing | 229 (90.5%) | 24 (9.5%) |
| Utilities | 70 (100.0%) | 0 (0.0%) |
| Information | 0 (0.0%) | 0 (0.0%) |
| Finance & Insurance | 0 (0.0%) | 58 (100.0%) |
| Real Estate, Rental & Leasing | 0 (0.0%) | 0 (0.0%) |
| Professional & Scientific | 88 (70.4%) | 37 (29.6%) |
| Enterprise Management | 0 (0.0%) | 0 (0.0%) |
| Administrative & Support | 85 (44.5%) | 106 (55.5%) |
| Educational Services | 50 (17.1%) | 243 (82.9%) |
| Health Care & Social Assistance | 159 (18.3%) | 710 (81.7%) |
| Arts, Entertainment & Recreation | 9 (40.9%) | 13 (59.1%) |
| Accommodation & Food Services | 103 (32.6%) | 213 (67.4%) |
| Public Administration | 12 (35.3%) | 22 (64.7%) |
| Total | 1,936 (47.8%) | 2,118 (52.2%) |
Education in Waite Park
School Enrollment in Waite Park
The most common levels of schooling among the 1,701 students in Waite Park are high school (672 | 39.5%), middle school (369 | 21.7%), and college / undergraduate (356 | 20.9%).
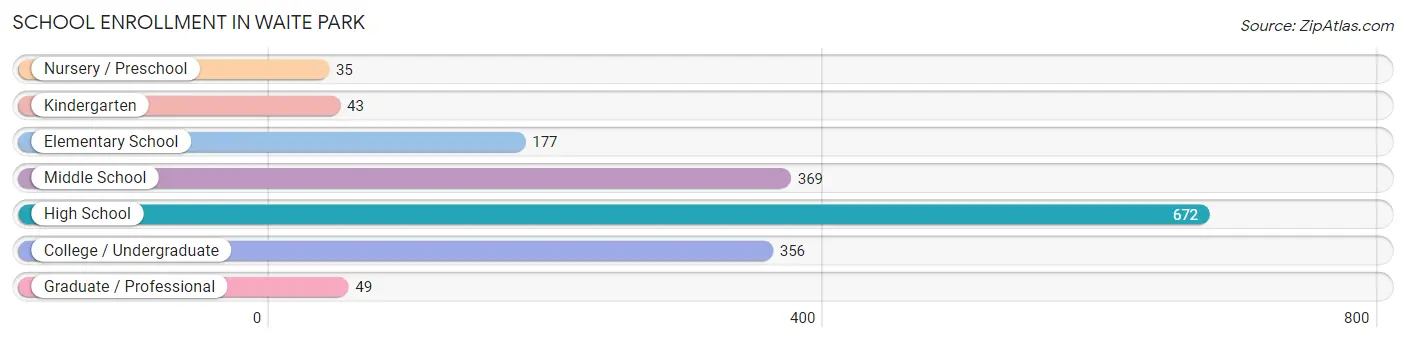
| School Level | # Students | % Students |
| Nursery / Preschool | 35 | 2.1% |
| Kindergarten | 43 | 2.5% |
| Elementary School | 177 | 10.4% |
| Middle School | 369 | 21.7% |
| High School | 672 | 39.5% |
| College / Undergraduate | 356 | 20.9% |
| Graduate / Professional | 49 | 2.9% |
| Total | 1,701 | 100.0% |
School Enrollment by Age by Funding Source in Waite Park
Out of a total of 1,701 students who are enrolled in schools in Waite Park, 206 (12.1%) attend a private institution, while the remaining 1,495 (87.9%) are enrolled in public schools. The age group of 35 years and over has the highest likelihood of being enrolled in private schools, with 42 (48.8% in the age bracket) enrolled. Conversely, the age group of 15 to 17 year olds has the lowest likelihood of being enrolled in a private school, with 392 (100.0% in the age bracket) attending a public institution.
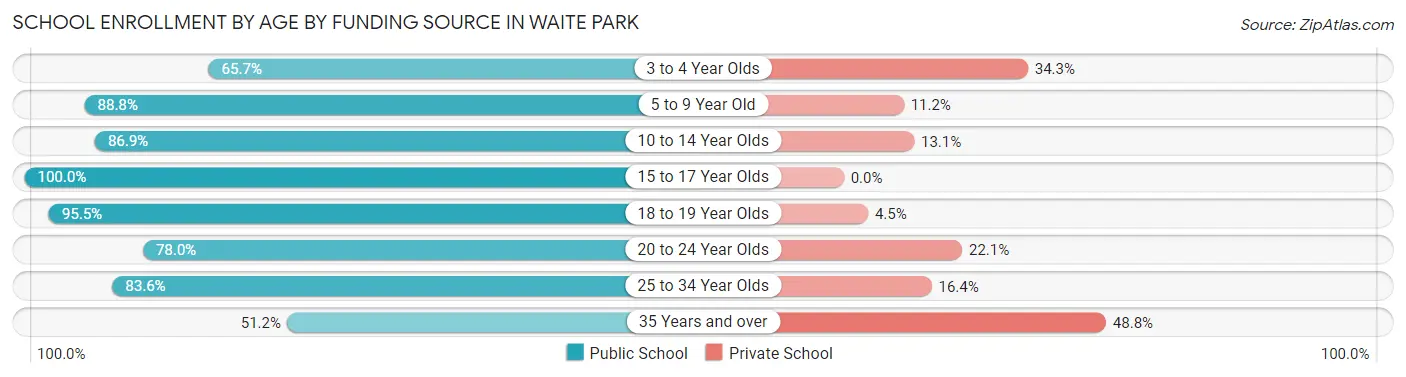
| Age Bracket | Public School | Private School |
| 3 to 4 Year Olds | 23 (65.7%) | 12 (34.3%) |
| 5 to 9 Year Old | 143 (88.8%) | 18 (11.2%) |
| 10 to 14 Year Olds | 464 (86.9%) | 70 (13.1%) |
| 15 to 17 Year Olds | 392 (100.0%) | 0 (0.0%) |
| 18 to 19 Year Olds | 232 (95.5%) | 11 (4.5%) |
| 20 to 24 Year Olds | 152 (77.9%) | 43 (22.1%) |
| 25 to 34 Year Olds | 46 (83.6%) | 9 (16.4%) |
| 35 Years and over | 44 (51.2%) | 42 (48.8%) |
| Total | 1,495 (87.9%) | 206 (12.1%) |
Educational Attainment by Field of Study in Waite Park
Arts & humanities (215 | 17.6%), psychology (197 | 16.2%), business (151 | 12.4%), education (142 | 11.7%), and liberal arts & history (96 | 7.9%) are the most common fields of study among 1,219 individuals in Waite Park who have obtained a bachelor's degree or higher.
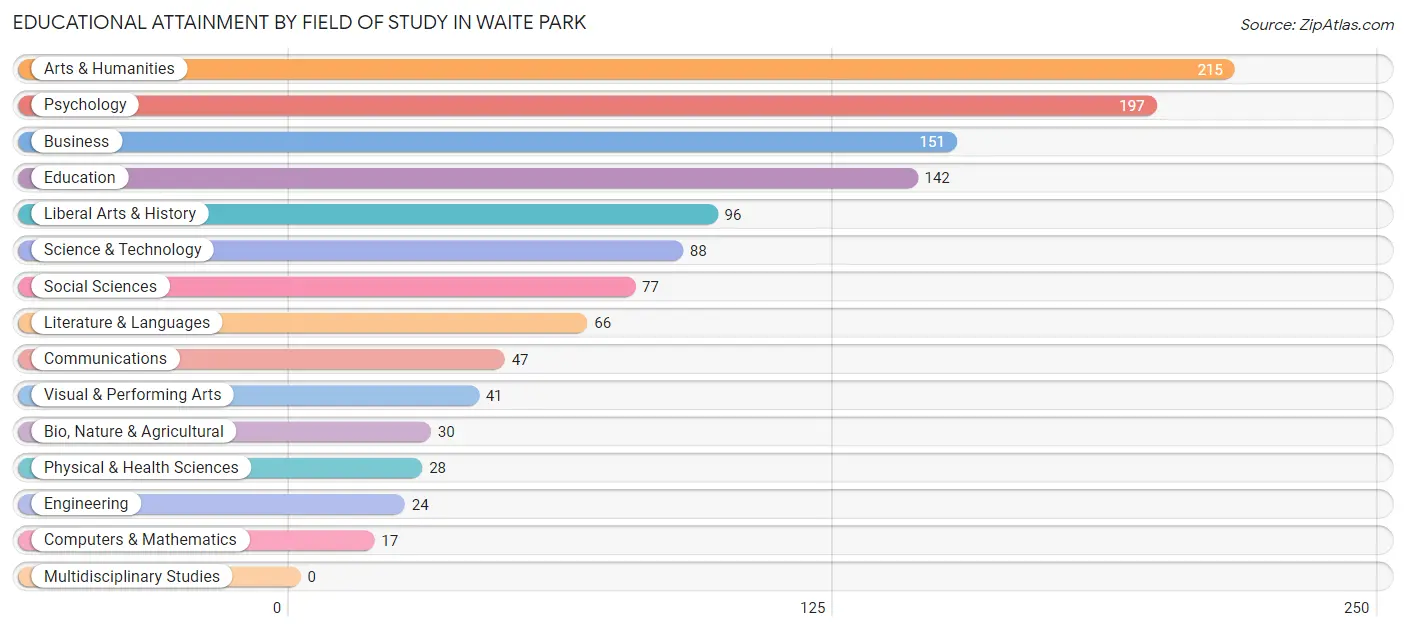
| Field of Study | # Graduates | % Graduates |
| Computers & Mathematics | 17 | 1.4% |
| Bio, Nature & Agricultural | 30 | 2.5% |
| Physical & Health Sciences | 28 | 2.3% |
| Psychology | 197 | 16.2% |
| Social Sciences | 77 | 6.3% |
| Engineering | 24 | 2.0% |
| Multidisciplinary Studies | 0 | 0.0% |
| Science & Technology | 88 | 7.2% |
| Business | 151 | 12.4% |
| Education | 142 | 11.7% |
| Literature & Languages | 66 | 5.4% |
| Liberal Arts & History | 96 | 7.9% |
| Visual & Performing Arts | 41 | 3.4% |
| Communications | 47 | 3.9% |
| Arts & Humanities | 215 | 17.6% |
| Total | 1,219 | 100.0% |
Transportation & Commute in Waite Park
Vehicle Availability by Sex in Waite Park
The most prevalent vehicle ownership categories in Waite Park are males with 3 vehicles (558, accounting for 29.1%) and females with 3 vehicles (459, making up 26.7%).
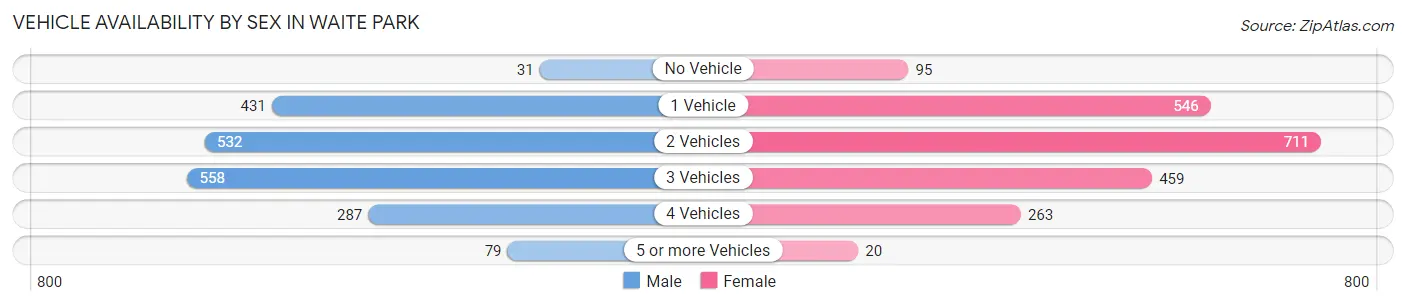
| Vehicles Available | Male | Female |
| No Vehicle | 31 (1.6%) | 95 (4.5%) |
| 1 Vehicle | 431 (22.5%) | 546 (26.1%) |
| 2 Vehicles | 532 (27.7%) | 711 (34.0%) |
| 3 Vehicles | 558 (29.1%) | 459 (21.9%) |
| 4 Vehicles | 287 (15.0%) | 263 (12.6%) |
| 5 or more Vehicles | 79 (4.1%) | 20 (1.0%) |
| Total | 1,918 (100.0%) | 2,094 (100.0%) |
Commute Time in Waite Park
The most frequently occuring commute durations in Waite Park are 15 to 19 minutes (977 commuters, 25.7%), 10 to 14 minutes (962 commuters, 25.3%), and 5 to 9 minutes (484 commuters, 12.7%).
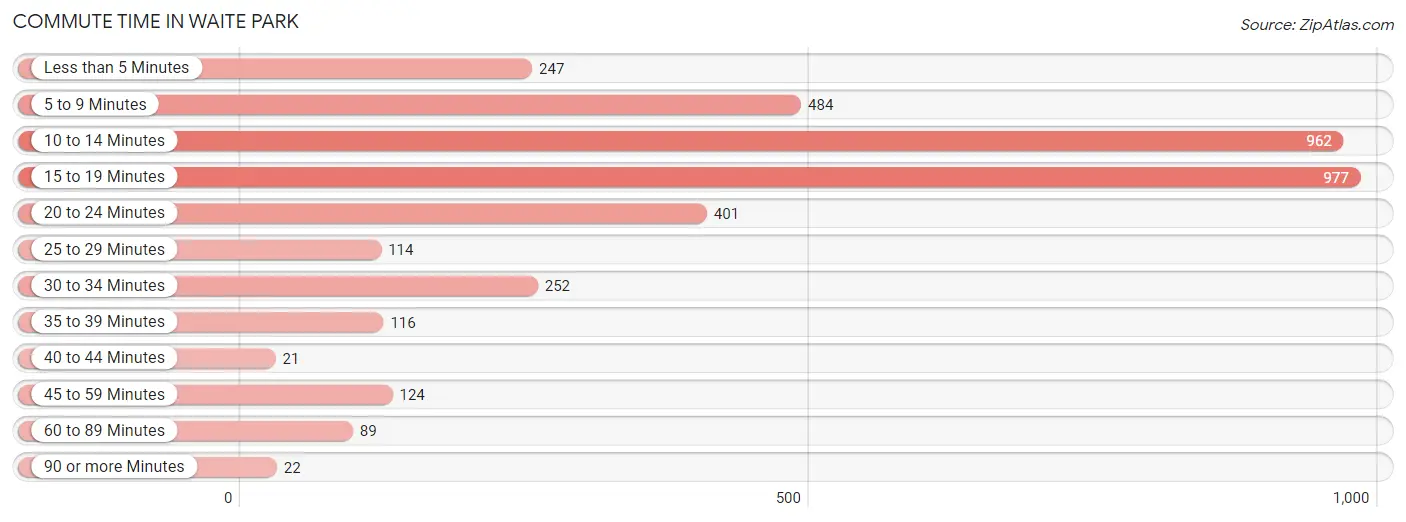
| Commute Time | # Commuters | % Commuters |
| Less than 5 Minutes | 247 | 6.5% |
| 5 to 9 Minutes | 484 | 12.7% |
| 10 to 14 Minutes | 962 | 25.3% |
| 15 to 19 Minutes | 977 | 25.7% |
| 20 to 24 Minutes | 401 | 10.5% |
| 25 to 29 Minutes | 114 | 3.0% |
| 30 to 34 Minutes | 252 | 6.6% |
| 35 to 39 Minutes | 116 | 3.0% |
| 40 to 44 Minutes | 21 | 0.5% |
| 45 to 59 Minutes | 124 | 3.3% |
| 60 to 89 Minutes | 89 | 2.3% |
| 90 or more Minutes | 22 | 0.6% |
Commute Time by Sex in Waite Park
The most common commute times in Waite Park are 10 to 14 minutes (522 commuters, 28.1%) for males and 15 to 19 minutes (656 commuters, 33.6%) for females.
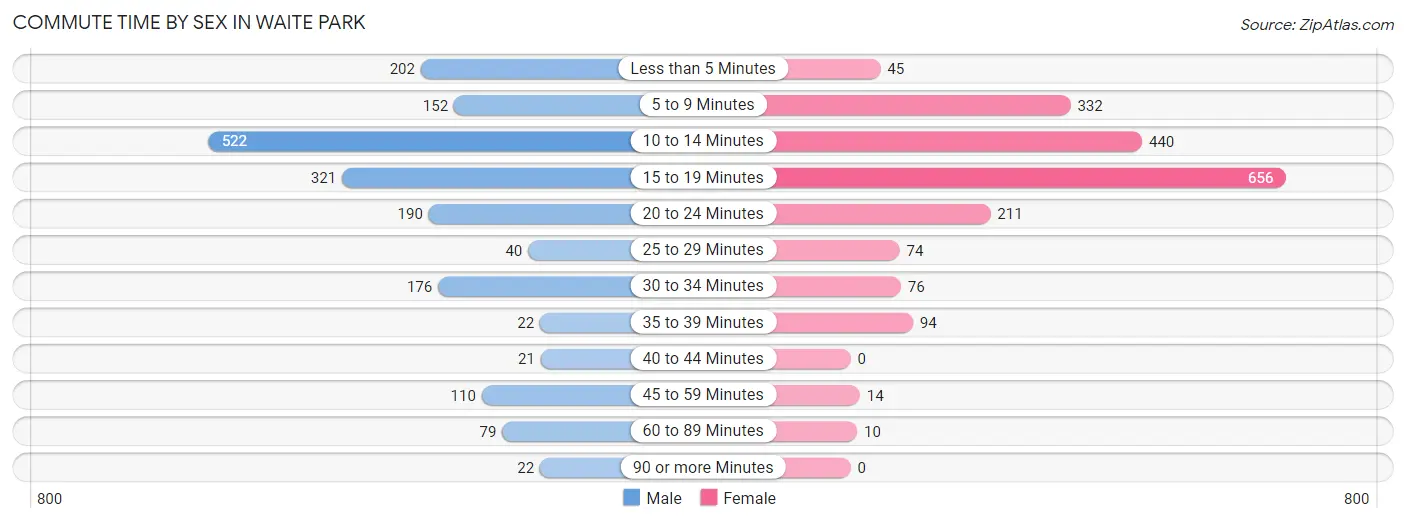
| Commute Time | Male | Female |
| Less than 5 Minutes | 202 (10.9%) | 45 (2.3%) |
| 5 to 9 Minutes | 152 (8.2%) | 332 (17.0%) |
| 10 to 14 Minutes | 522 (28.1%) | 440 (22.5%) |
| 15 to 19 Minutes | 321 (17.3%) | 656 (33.6%) |
| 20 to 24 Minutes | 190 (10.2%) | 211 (10.8%) |
| 25 to 29 Minutes | 40 (2.1%) | 74 (3.8%) |
| 30 to 34 Minutes | 176 (9.5%) | 76 (3.9%) |
| 35 to 39 Minutes | 22 (1.2%) | 94 (4.8%) |
| 40 to 44 Minutes | 21 (1.1%) | 0 (0.0%) |
| 45 to 59 Minutes | 110 (5.9%) | 14 (0.7%) |
| 60 to 89 Minutes | 79 (4.3%) | 10 (0.5%) |
| 90 or more Minutes | 22 (1.2%) | 0 (0.0%) |
Time of Departure to Work by Sex in Waite Park
The most frequent times of departure to work in Waite Park are 4:00 PM to 11:59 PM (490, 26.4%) for males and 12:00 PM to 3:59 PM (236, 12.1%) for females.
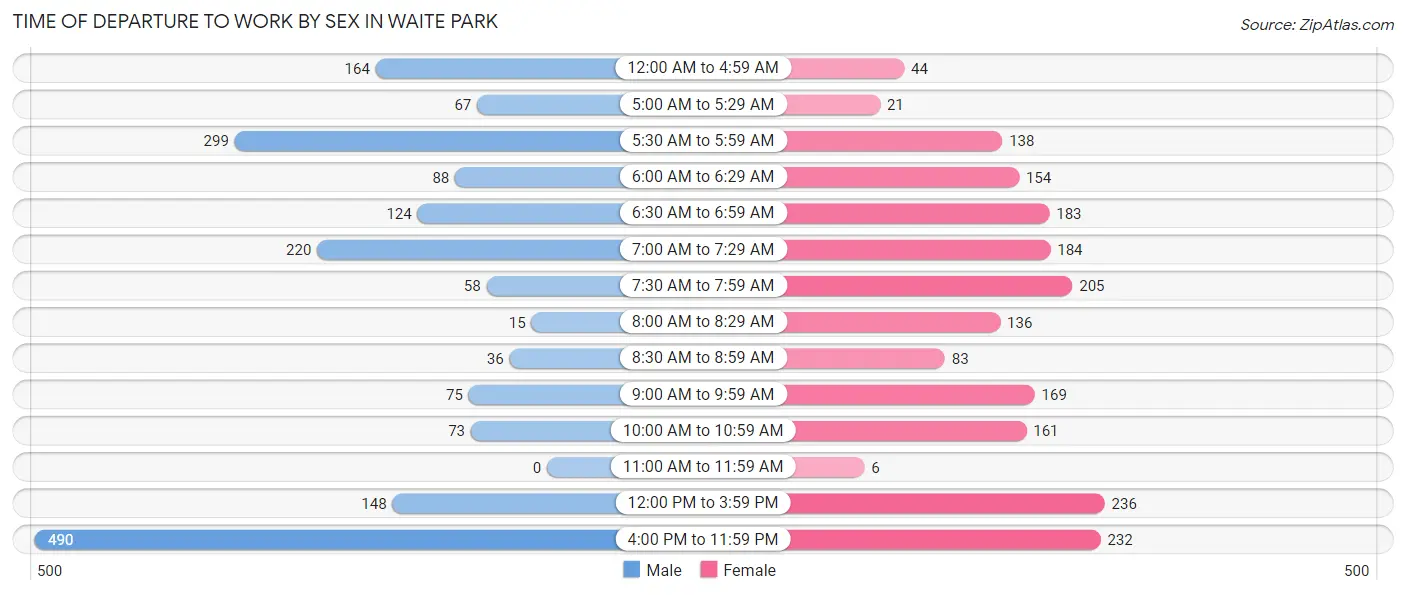
| Time of Departure | Male | Female |
| 12:00 AM to 4:59 AM | 164 (8.8%) | 44 (2.2%) |
| 5:00 AM to 5:29 AM | 67 (3.6%) | 21 (1.1%) |
| 5:30 AM to 5:59 AM | 299 (16.1%) | 138 (7.1%) |
| 6:00 AM to 6:29 AM | 88 (4.7%) | 154 (7.9%) |
| 6:30 AM to 6:59 AM | 124 (6.7%) | 183 (9.4%) |
| 7:00 AM to 7:29 AM | 220 (11.8%) | 184 (9.4%) |
| 7:30 AM to 7:59 AM | 58 (3.1%) | 205 (10.5%) |
| 8:00 AM to 8:29 AM | 15 (0.8%) | 136 (7.0%) |
| 8:30 AM to 8:59 AM | 36 (1.9%) | 83 (4.3%) |
| 9:00 AM to 9:59 AM | 75 (4.0%) | 169 (8.7%) |
| 10:00 AM to 10:59 AM | 73 (3.9%) | 161 (8.3%) |
| 11:00 AM to 11:59 AM | 0 (0.0%) | 6 (0.3%) |
| 12:00 PM to 3:59 PM | 148 (8.0%) | 236 (12.1%) |
| 4:00 PM to 11:59 PM | 490 (26.4%) | 232 (11.9%) |
| Total | 1,857 (100.0%) | 1,952 (100.0%) |
Housing Occupancy in Waite Park
Occupancy by Ownership in Waite Park
Of the total 3,724 dwellings in Waite Park, owner-occupied units account for 1,765 (47.4%), while renter-occupied units make up 1,959 (52.6%).
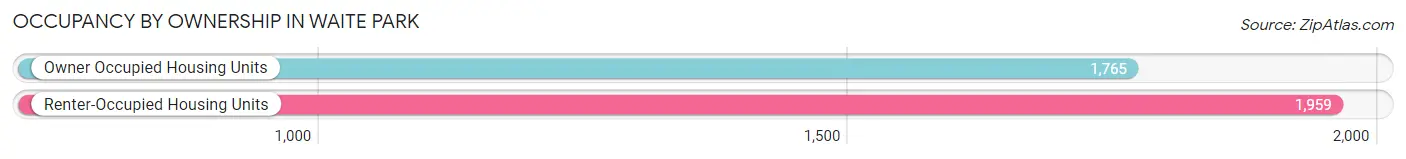
| Occupancy | # Housing Units | % Housing Units |
| Owner Occupied Housing Units | 1,765 | 47.4% |
| Renter-Occupied Housing Units | 1,959 | 52.6% |
| Total Occupied Housing Units | 3,724 | 100.0% |
Occupancy by Household Size in Waite Park
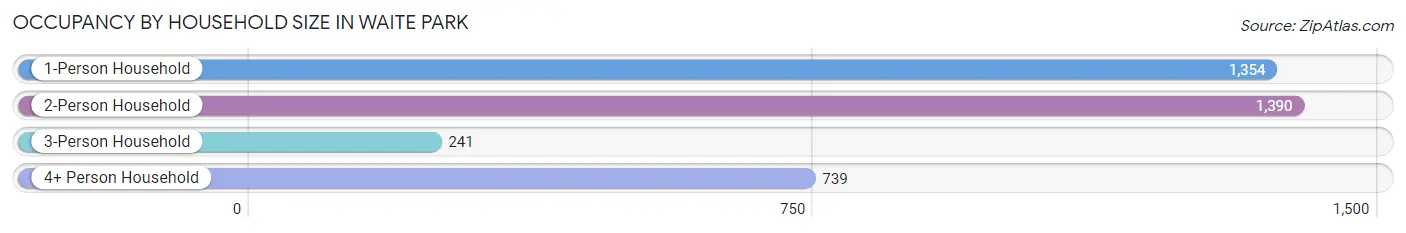
| Household Size | # Housing Units | % Housing Units |
| 1-Person Household | 1,354 | 36.4% |
| 2-Person Household | 1,390 | 37.3% |
| 3-Person Household | 241 | 6.5% |
| 4+ Person Household | 739 | 19.8% |
| Total Housing Units | 3,724 | 100.0% |
Occupancy by Ownership by Household Size in Waite Park
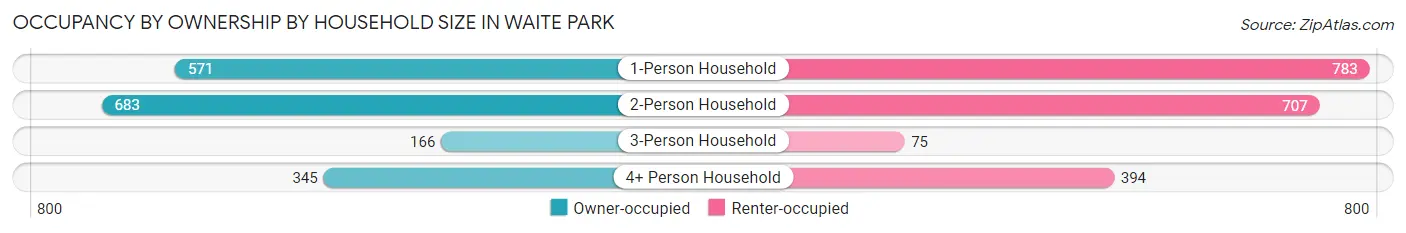
| Household Size | Owner-occupied | Renter-occupied |
| 1-Person Household | 571 (42.2%) | 783 (57.8%) |
| 2-Person Household | 683 (49.1%) | 707 (50.9%) |
| 3-Person Household | 166 (68.9%) | 75 (31.1%) |
| 4+ Person Household | 345 (46.7%) | 394 (53.3%) |
| Total Housing Units | 1,765 (47.4%) | 1,959 (52.6%) |
Occupancy by Educational Attainment in Waite Park
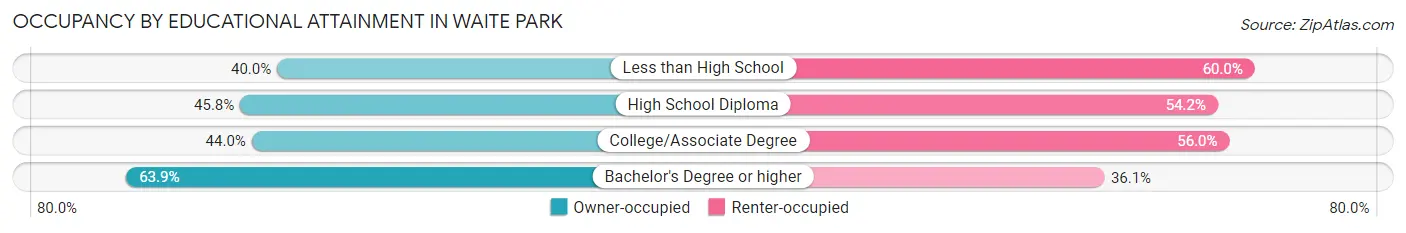
| Household Size | Owner-occupied | Renter-occupied |
| Less than High School | 217 (40.0%) | 326 (60.0%) |
| High School Diploma | 455 (45.8%) | 538 (54.2%) |
| College/Associate Degree | 674 (44.0%) | 858 (56.0%) |
| Bachelor's Degree or higher | 419 (63.9%) | 237 (36.1%) |
Occupancy by Age of Householder in Waite Park
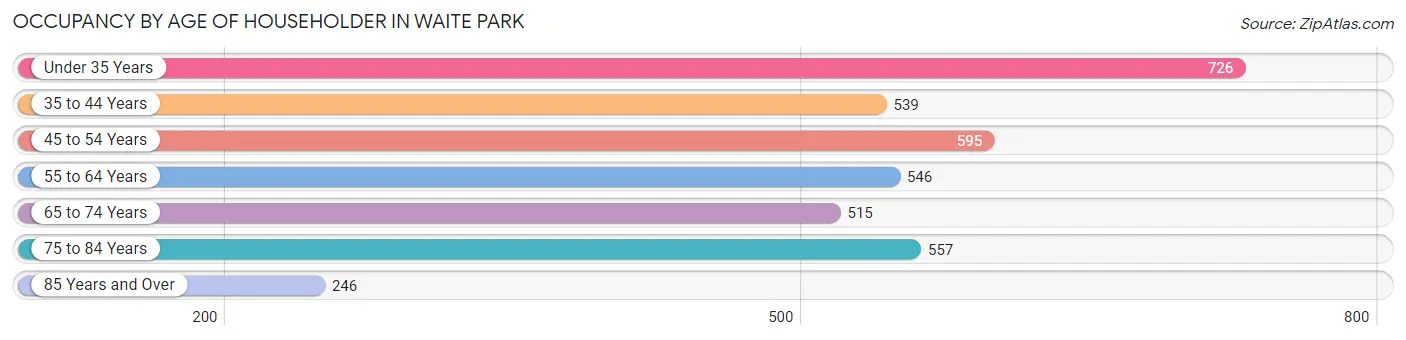
| Age Bracket | # Households | % Households |
| Under 35 Years | 726 | 19.5% |
| 35 to 44 Years | 539 | 14.5% |
| 45 to 54 Years | 595 | 16.0% |
| 55 to 64 Years | 546 | 14.7% |
| 65 to 74 Years | 515 | 13.8% |
| 75 to 84 Years | 557 | 15.0% |
| 85 Years and Over | 246 | 6.6% |
| Total | 3,724 | 100.0% |
Housing Finances in Waite Park
Median Income by Occupancy in Waite Park
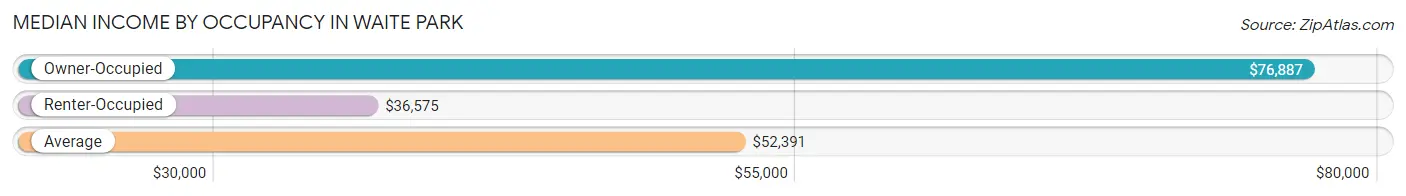
| Occupancy Type | # Households | Median Income |
| Owner-Occupied | 1,765 (47.4%) | $76,887 |
| Renter-Occupied | 1,959 (52.6%) | $36,575 |
| Average | 3,724 (100.0%) | $52,391 |
Occupancy by Householder Income Bracket in Waite Park
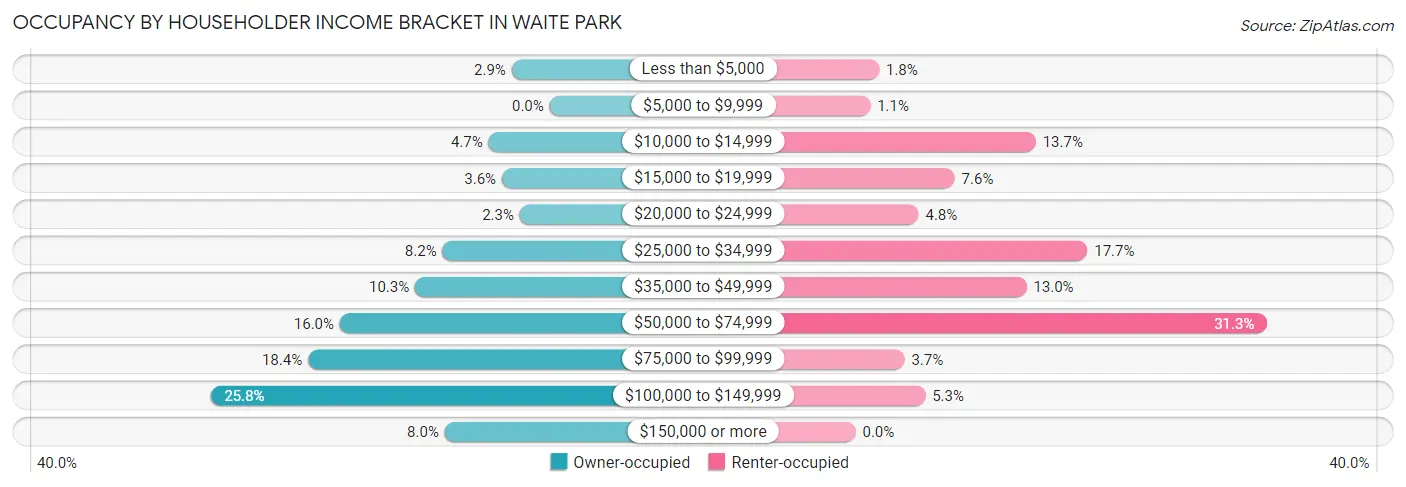
| Income Bracket | Owner-occupied | Renter-occupied |
| Less than $5,000 | 51 (2.9%) | 35 (1.8%) |
| $5,000 to $9,999 | 0 (0.0%) | 22 (1.1%) |
| $10,000 to $14,999 | 82 (4.6%) | 269 (13.7%) |
| $15,000 to $19,999 | 64 (3.6%) | 148 (7.5%) |
| $20,000 to $24,999 | 40 (2.3%) | 94 (4.8%) |
| $25,000 to $34,999 | 144 (8.2%) | 346 (17.7%) |
| $35,000 to $49,999 | 181 (10.2%) | 255 (13.0%) |
| $50,000 to $74,999 | 282 (16.0%) | 613 (31.3%) |
| $75,000 to $99,999 | 325 (18.4%) | 73 (3.7%) |
| $100,000 to $149,999 | 455 (25.8%) | 104 (5.3%) |
| $150,000 or more | 141 (8.0%) | 0 (0.0%) |
| Total | 1,765 (100.0%) | 1,959 (100.0%) |
Monthly Housing Cost Tiers in Waite Park
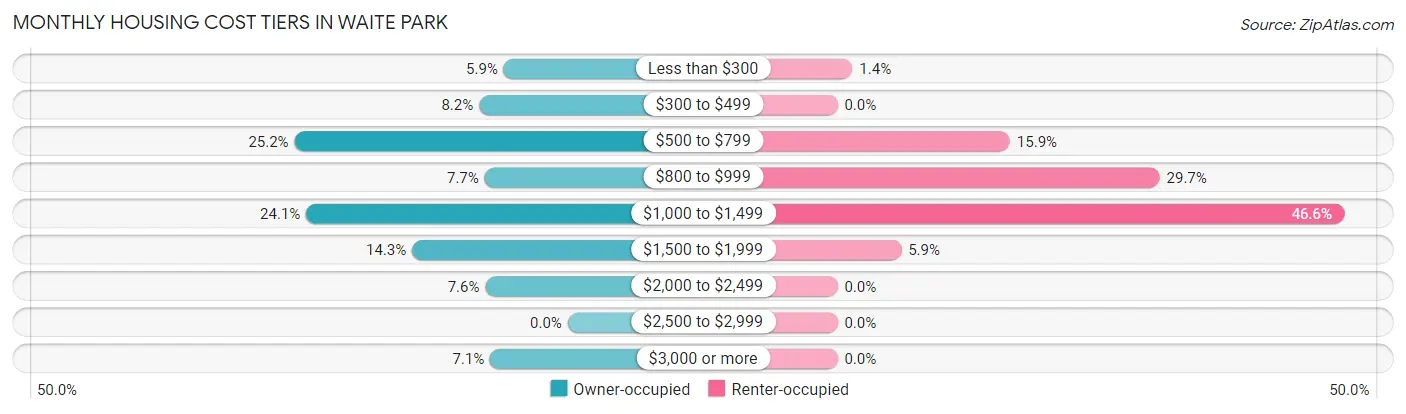
| Monthly Cost | Owner-occupied | Renter-occupied |
| Less than $300 | 104 (5.9%) | 27 (1.4%) |
| $300 to $499 | 144 (8.2%) | 0 (0.0%) |
| $500 to $799 | 444 (25.2%) | 311 (15.9%) |
| $800 to $999 | 135 (7.6%) | 581 (29.7%) |
| $1,000 to $1,499 | 425 (24.1%) | 913 (46.6%) |
| $1,500 to $1,999 | 253 (14.3%) | 115 (5.9%) |
| $2,000 to $2,499 | 134 (7.6%) | 0 (0.0%) |
| $2,500 to $2,999 | 0 (0.0%) | 0 (0.0%) |
| $3,000 or more | 126 (7.1%) | 0 (0.0%) |
| Total | 1,765 (100.0%) | 1,959 (100.0%) |
Physical Housing Characteristics in Waite Park
Housing Structures in Waite Park
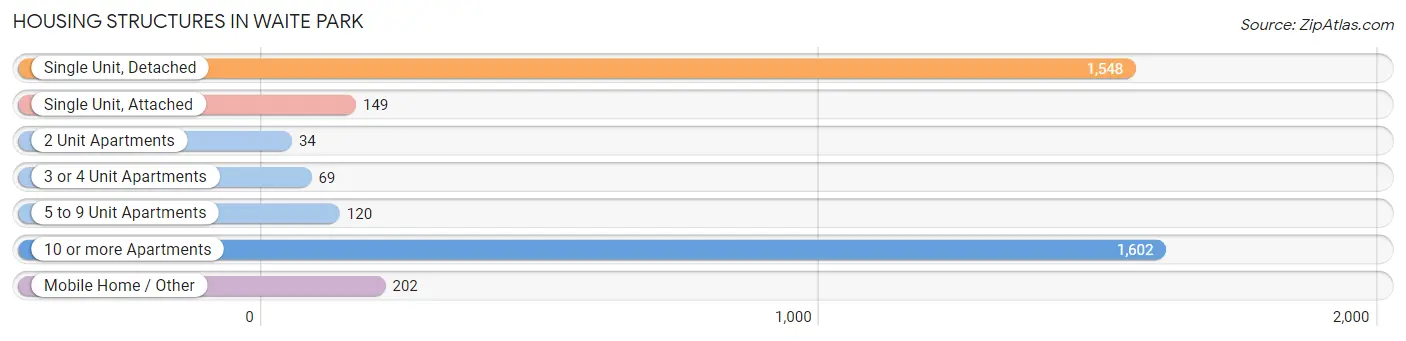
| Structure Type | # Housing Units | % Housing Units |
| Single Unit, Detached | 1,548 | 41.6% |
| Single Unit, Attached | 149 | 4.0% |
| 2 Unit Apartments | 34 | 0.9% |
| 3 or 4 Unit Apartments | 69 | 1.8% |
| 5 to 9 Unit Apartments | 120 | 3.2% |
| 10 or more Apartments | 1,602 | 43.0% |
| Mobile Home / Other | 202 | 5.4% |
| Total | 3,724 | 100.0% |
Housing Structures by Occupancy in Waite Park
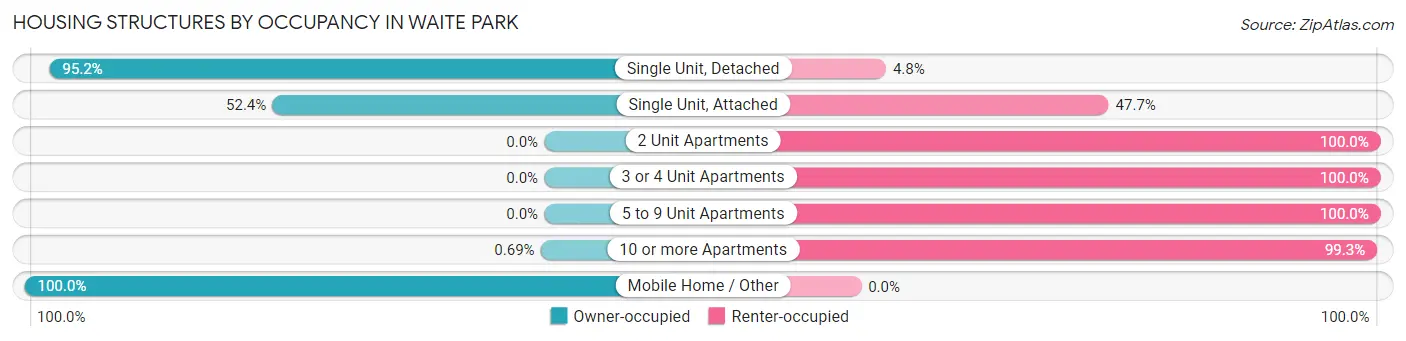
| Structure Type | Owner-occupied | Renter-occupied |
| Single Unit, Detached | 1,474 (95.2%) | 74 (4.8%) |
| Single Unit, Attached | 78 (52.3%) | 71 (47.6%) |
| 2 Unit Apartments | 0 (0.0%) | 34 (100.0%) |
| 3 or 4 Unit Apartments | 0 (0.0%) | 69 (100.0%) |
| 5 to 9 Unit Apartments | 0 (0.0%) | 120 (100.0%) |
| 10 or more Apartments | 11 (0.7%) | 1,591 (99.3%) |
| Mobile Home / Other | 202 (100.0%) | 0 (0.0%) |
| Total | 1,765 (47.4%) | 1,959 (52.6%) |
Housing Structures by Number of Rooms in Waite Park
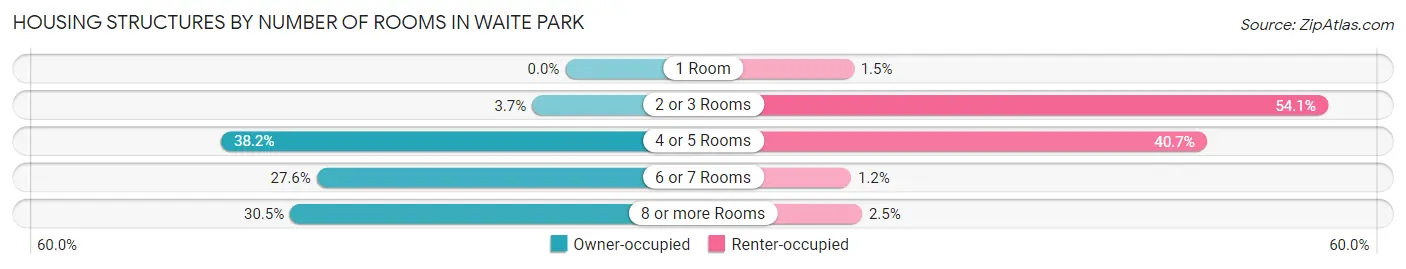
| Number of Rooms | Owner-occupied | Renter-occupied |
| 1 Room | 0 (0.0%) | 30 (1.5%) |
| 2 or 3 Rooms | 65 (3.7%) | 1,060 (54.1%) |
| 4 or 5 Rooms | 674 (38.2%) | 797 (40.7%) |
| 6 or 7 Rooms | 487 (27.6%) | 24 (1.2%) |
| 8 or more Rooms | 539 (30.5%) | 48 (2.5%) |
| Total | 1,765 (100.0%) | 1,959 (100.0%) |
Housing Structure by Heating Type in Waite Park
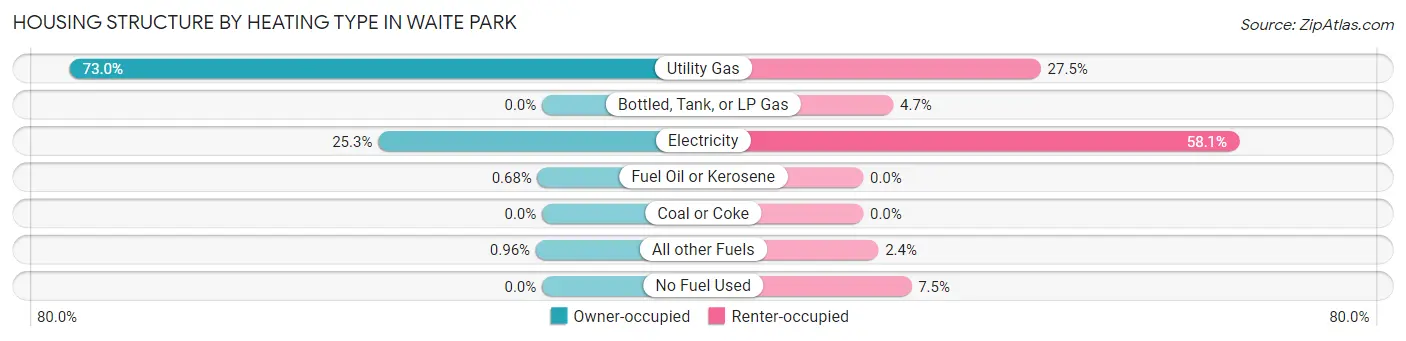
| Heating Type | Owner-occupied | Renter-occupied |
| Utility Gas | 1,289 (73.0%) | 538 (27.5%) |
| Bottled, Tank, or LP Gas | 0 (0.0%) | 91 (4.6%) |
| Electricity | 447 (25.3%) | 1,138 (58.1%) |
| Fuel Oil or Kerosene | 12 (0.7%) | 0 (0.0%) |
| Coal or Coke | 0 (0.0%) | 0 (0.0%) |
| All other Fuels | 17 (1.0%) | 46 (2.4%) |
| No Fuel Used | 0 (0.0%) | 146 (7.4%) |
| Total | 1,765 (100.0%) | 1,959 (100.0%) |
Household Vehicle Usage in Waite Park
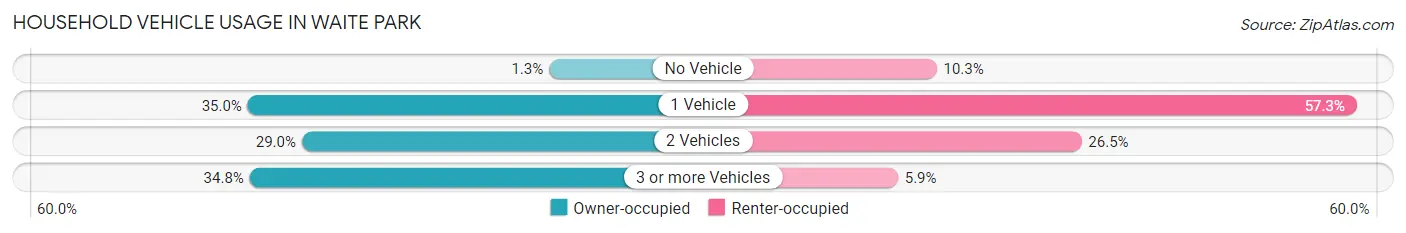
| Vehicles per Household | Owner-occupied | Renter-occupied |
| No Vehicle | 22 (1.3%) | 201 (10.3%) |
| 1 Vehicle | 618 (35.0%) | 1,123 (57.3%) |
| 2 Vehicles | 511 (28.9%) | 519 (26.5%) |
| 3 or more Vehicles | 614 (34.8%) | 116 (5.9%) |
| Total | 1,765 (100.0%) | 1,959 (100.0%) |
Real Estate & Mortgages in Waite Park
Real Estate and Mortgage Overview in Waite Park
| Characteristic | Without Mortgage | With Mortgage |
| Housing Units | 835 | 930 |
| Median Property Value | $212,100 | $195,100 |
| Median Household Income | $61,442 | $97 |
| Monthly Housing Costs | $561 | $118 |
| Real Estate Taxes | $2,226 | $12 |
Property Value by Mortgage Status in Waite Park
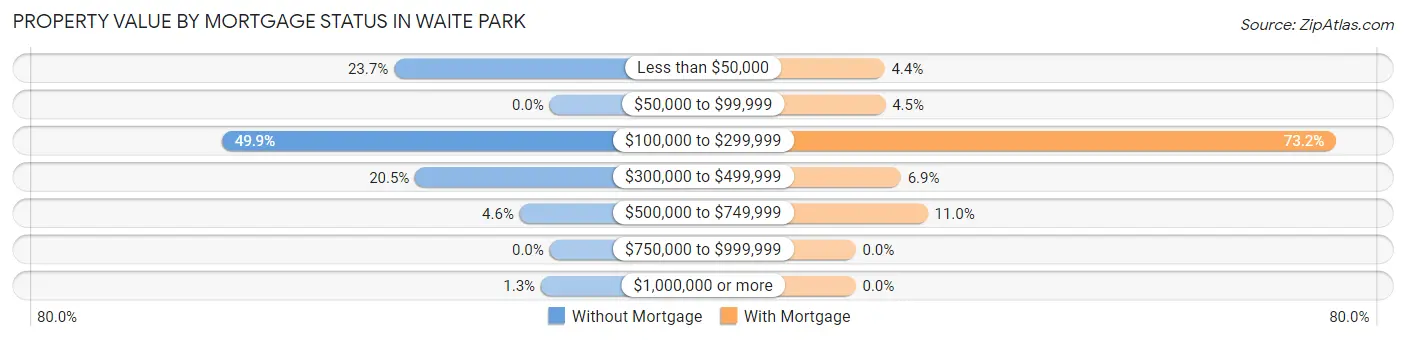
| Property Value | Without Mortgage | With Mortgage |
| Less than $50,000 | 198 (23.7%) | 41 (4.4%) |
| $50,000 to $99,999 | 0 (0.0%) | 42 (4.5%) |
| $100,000 to $299,999 | 417 (49.9%) | 681 (73.2%) |
| $300,000 to $499,999 | 171 (20.5%) | 64 (6.9%) |
| $500,000 to $749,999 | 38 (4.5%) | 102 (11.0%) |
| $750,000 to $999,999 | 0 (0.0%) | 0 (0.0%) |
| $1,000,000 or more | 11 (1.3%) | 0 (0.0%) |
| Total | 835 (100.0%) | 930 (100.0%) |
Household Income by Mortgage Status in Waite Park
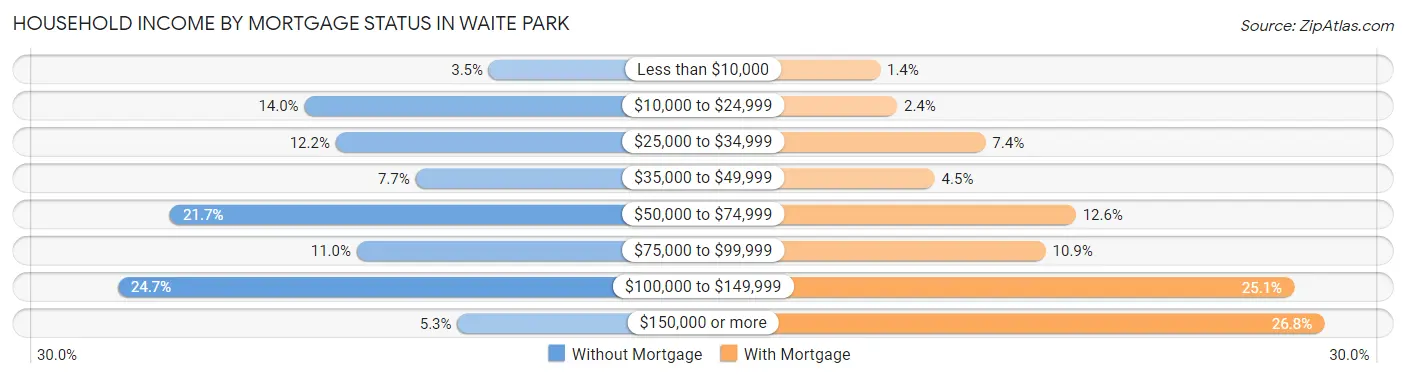
| Household Income | Without Mortgage | With Mortgage |
| Less than $10,000 | 29 (3.5%) | 13 (1.4%) |
| $10,000 to $24,999 | 117 (14.0%) | 22 (2.4%) |
| $25,000 to $34,999 | 102 (12.2%) | 69 (7.4%) |
| $35,000 to $49,999 | 64 (7.7%) | 42 (4.5%) |
| $50,000 to $74,999 | 181 (21.7%) | 117 (12.6%) |
| $75,000 to $99,999 | 92 (11.0%) | 101 (10.9%) |
| $100,000 to $149,999 | 206 (24.7%) | 233 (25.1%) |
| $150,000 or more | 44 (5.3%) | 249 (26.8%) |
| Total | 835 (100.0%) | 930 (100.0%) |
Property Value to Household Income Ratio in Waite Park
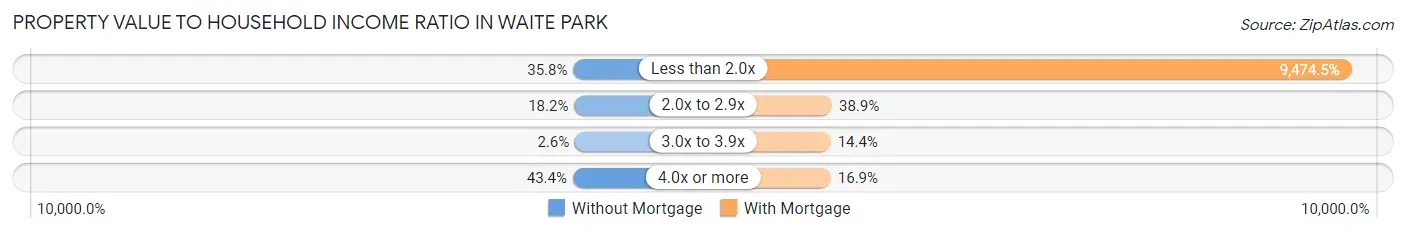
| Value-to-Income Ratio | Without Mortgage | With Mortgage |
| Less than 2.0x | 299 (35.8%) | 88,113 (9,474.5%) |
| 2.0x to 2.9x | 152 (18.2%) | 362 (38.9%) |
| 3.0x to 3.9x | 22 (2.6%) | 134 (14.4%) |
| 4.0x or more | 362 (43.3%) | 157 (16.9%) |
| Total | 835 (100.0%) | 930 (100.0%) |
Real Estate Taxes by Mortgage Status in Waite Park
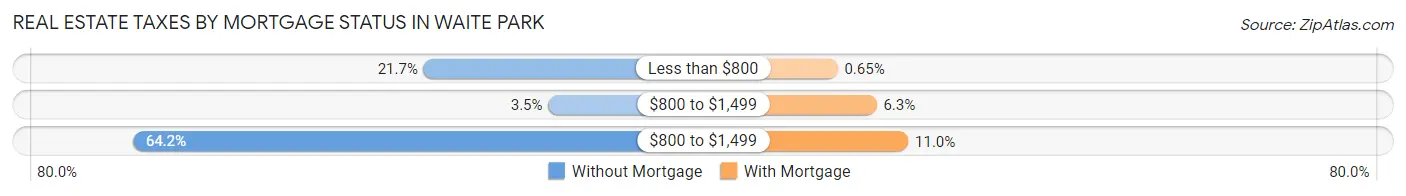
| Property Taxes | Without Mortgage | With Mortgage |
| Less than $800 | 181 (21.7%) | 6 (0.6%) |
| $800 to $1,499 | 29 (3.5%) | 59 (6.3%) |
| $800 to $1,499 | 536 (64.2%) | 102 (11.0%) |
| Total | 835 (100.0%) | 930 (100.0%) |
Health & Disability in Waite Park
Health Insurance Coverage by Age in Waite Park
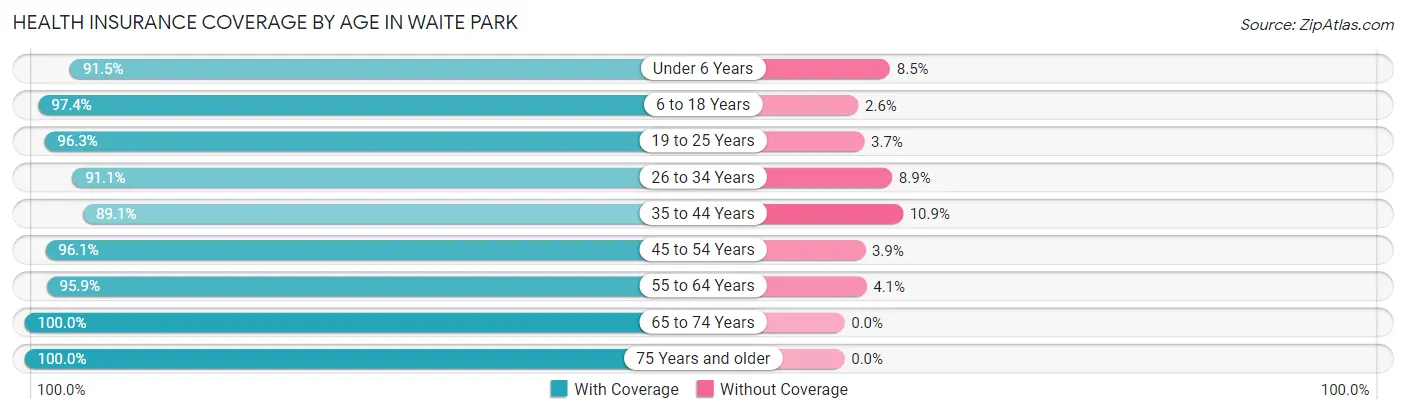
| Age Bracket | With Coverage | Without Coverage |
| Under 6 Years | 463 (91.5%) | 43 (8.5%) |
| 6 to 18 Years | 1,398 (97.4%) | 37 (2.6%) |
| 19 to 25 Years | 832 (96.3%) | 32 (3.7%) |
| 26 to 34 Years | 790 (91.1%) | 77 (8.9%) |
| 35 to 44 Years | 736 (89.1%) | 90 (10.9%) |
| 45 to 54 Years | 922 (96.1%) | 37 (3.9%) |
| 55 to 64 Years | 958 (95.9%) | 41 (4.1%) |
| 65 to 74 Years | 801 (100.0%) | 0 (0.0%) |
| 75 Years and older | 1,004 (100.0%) | 0 (0.0%) |
| Total | 7,904 (95.7%) | 357 (4.3%) |
Health Insurance Coverage by Citizenship Status in Waite Park
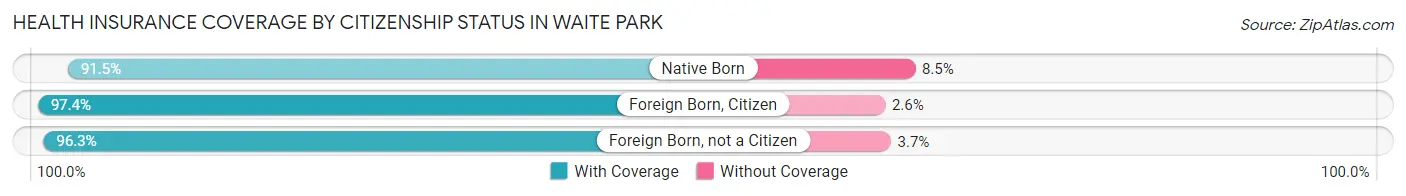
| Citizenship Status | With Coverage | Without Coverage |
| Native Born | 463 (91.5%) | 43 (8.5%) |
| Foreign Born, Citizen | 1,398 (97.4%) | 37 (2.6%) |
| Foreign Born, not a Citizen | 832 (96.3%) | 32 (3.7%) |
Health Insurance Coverage by Household Income in Waite Park
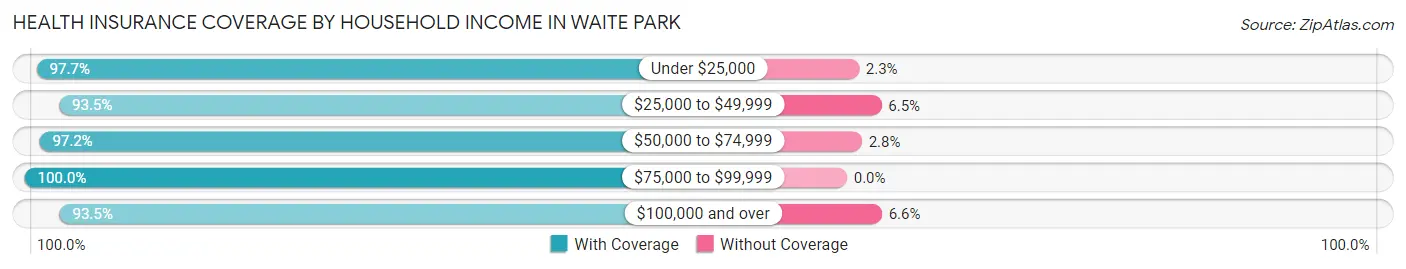
| Household Income | With Coverage | Without Coverage |
| Under $25,000 | 1,470 (97.7%) | 34 (2.3%) |
| $25,000 to $49,999 | 1,649 (93.5%) | 114 (6.5%) |
| $50,000 to $74,999 | 1,710 (97.2%) | 49 (2.8%) |
| $75,000 to $99,999 | 886 (100.0%) | 0 (0.0%) |
| $100,000 and over | 2,155 (93.4%) | 151 (6.6%) |
Public vs Private Health Insurance Coverage by Age in Waite Park
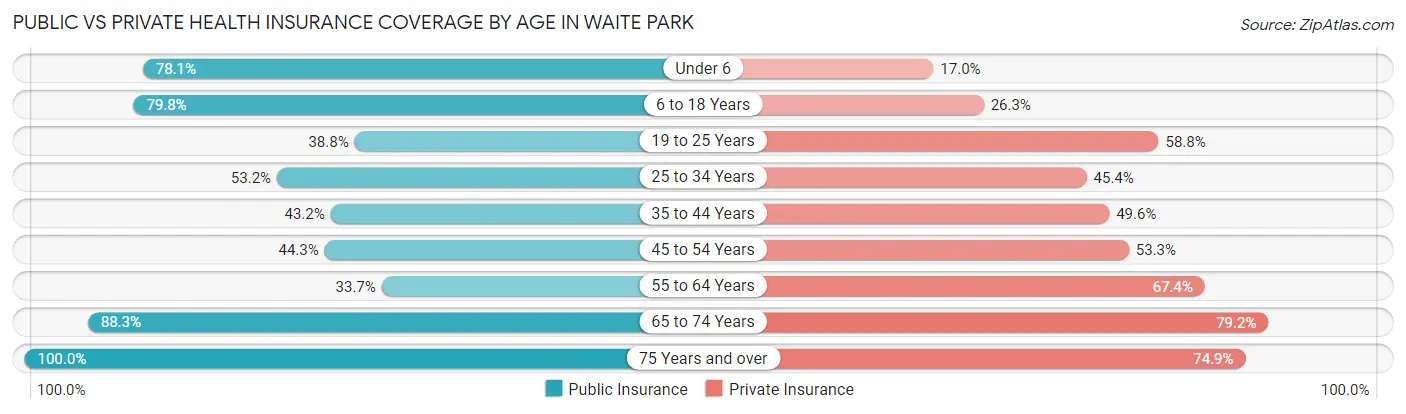
| Age Bracket | Public Insurance | Private Insurance |
| Under 6 | 395 (78.1%) | 86 (17.0%) |
| 6 to 18 Years | 1,145 (79.8%) | 378 (26.3%) |
| 19 to 25 Years | 335 (38.8%) | 508 (58.8%) |
| 25 to 34 Years | 461 (53.2%) | 394 (45.4%) |
| 35 to 44 Years | 357 (43.2%) | 410 (49.6%) |
| 45 to 54 Years | 425 (44.3%) | 511 (53.3%) |
| 55 to 64 Years | 337 (33.7%) | 673 (67.4%) |
| 65 to 74 Years | 707 (88.3%) | 634 (79.1%) |
| 75 Years and over | 1,004 (100.0%) | 752 (74.9%) |
| Total | 5,166 (62.5%) | 4,346 (52.6%) |
Disability Status by Sex by Age in Waite Park
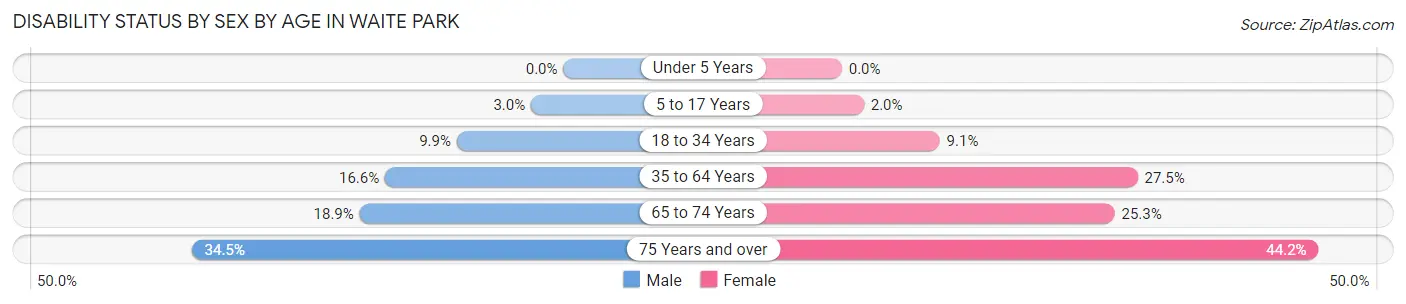
| Age Bracket | Male | Female |
| Under 5 Years | 0 (0.0%) | 0 (0.0%) |
| 5 to 17 Years | 18 (3.0%) | 15 (2.0%) |
| 18 to 34 Years | 84 (9.9%) | 94 (9.1%) |
| 35 to 64 Years | 245 (16.6%) | 358 (27.5%) |
| 65 to 74 Years | 76 (18.9%) | 101 (25.3%) |
| 75 Years and over | 128 (34.5%) | 280 (44.2%) |
Disability Class by Sex by Age in Waite Park
Disability Class: Hearing Difficulty
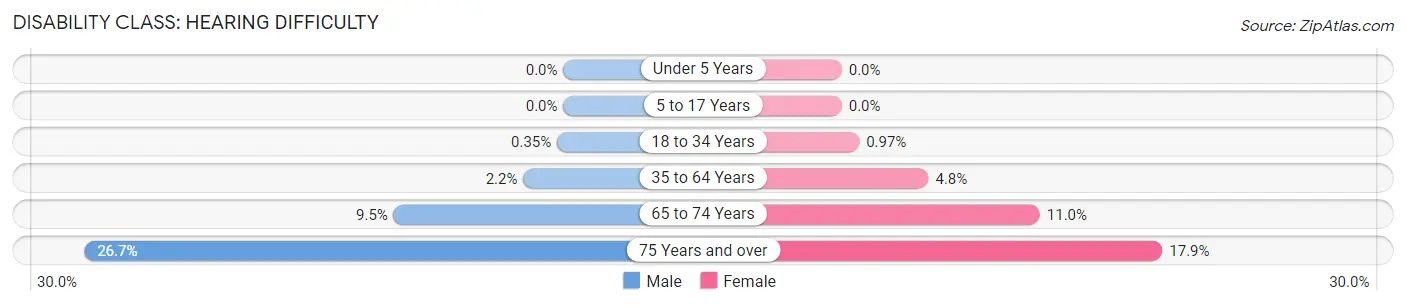
| Age Bracket | Male | Female |
| Under 5 Years | 0 (0.0%) | 0 (0.0%) |
| 5 to 17 Years | 0 (0.0%) | 0 (0.0%) |
| 18 to 34 Years | 3 (0.4%) | 10 (1.0%) |
| 35 to 64 Years | 33 (2.2%) | 63 (4.8%) |
| 65 to 74 Years | 38 (9.5%) | 44 (11.0%) |
| 75 Years and over | 99 (26.7%) | 113 (17.8%) |
Disability Class: Vision Difficulty
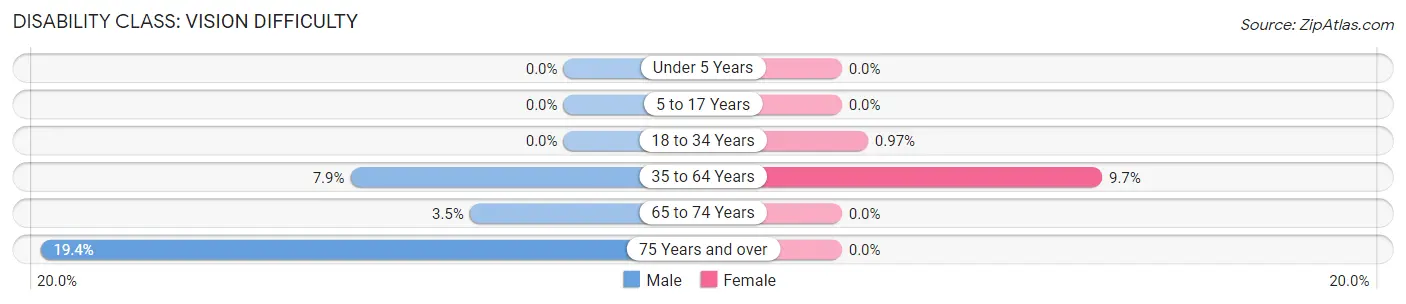
| Age Bracket | Male | Female |
| Under 5 Years | 0 (0.0%) | 0 (0.0%) |
| 5 to 17 Years | 0 (0.0%) | 0 (0.0%) |
| 18 to 34 Years | 0 (0.0%) | 10 (1.0%) |
| 35 to 64 Years | 117 (7.9%) | 126 (9.7%) |
| 65 to 74 Years | 14 (3.5%) | 0 (0.0%) |
| 75 Years and over | 72 (19.4%) | 0 (0.0%) |
Disability Class: Cognitive Difficulty
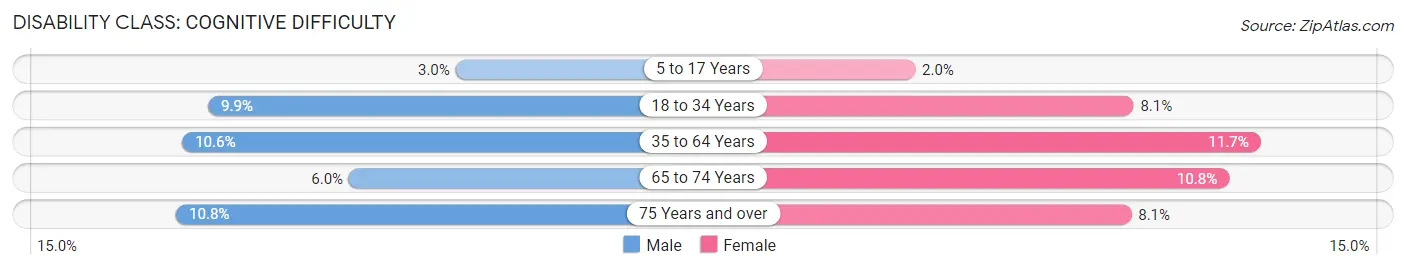
| Age Bracket | Male | Female |
| 5 to 17 Years | 18 (3.0%) | 15 (2.0%) |
| 18 to 34 Years | 84 (9.9%) | 84 (8.1%) |
| 35 to 64 Years | 157 (10.6%) | 152 (11.7%) |
| 65 to 74 Years | 24 (6.0%) | 43 (10.8%) |
| 75 Years and over | 40 (10.8%) | 51 (8.1%) |
Disability Class: Ambulatory Difficulty
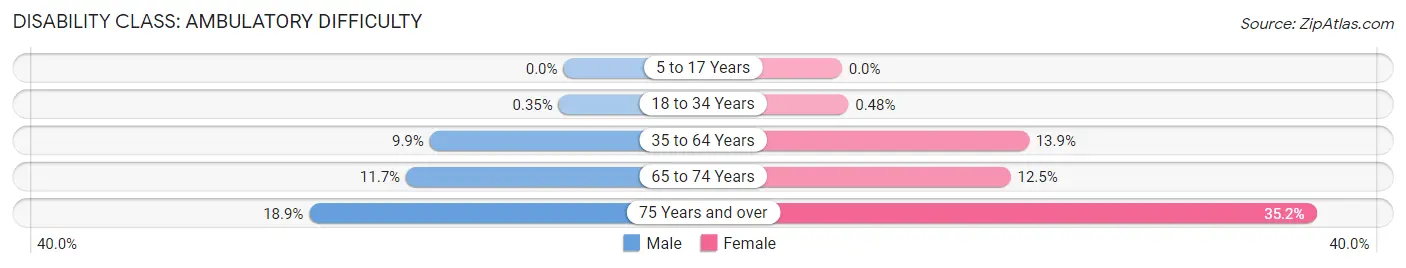
| Age Bracket | Male | Female |
| 5 to 17 Years | 0 (0.0%) | 0 (0.0%) |
| 18 to 34 Years | 3 (0.4%) | 5 (0.5%) |
| 35 to 64 Years | 147 (9.9%) | 181 (13.9%) |
| 65 to 74 Years | 47 (11.7%) | 50 (12.5%) |
| 75 Years and over | 70 (18.9%) | 223 (35.2%) |
Disability Class: Self-Care Difficulty
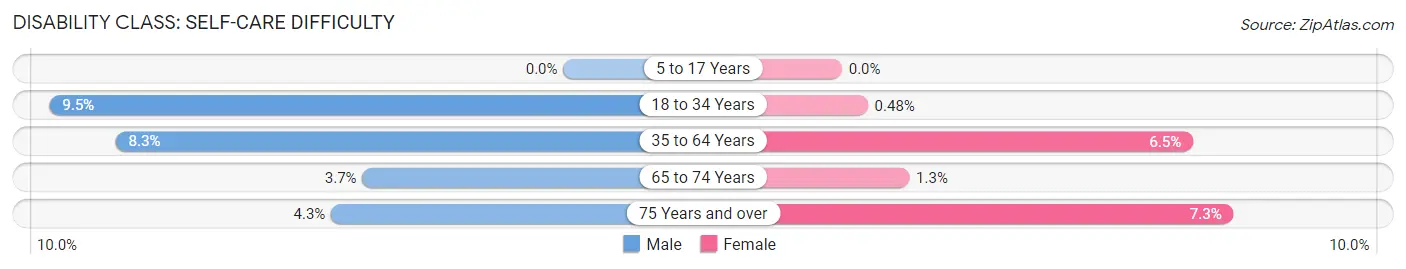
| Age Bracket | Male | Female |
| 5 to 17 Years | 0 (0.0%) | 0 (0.0%) |
| 18 to 34 Years | 81 (9.5%) | 5 (0.5%) |
| 35 to 64 Years | 123 (8.3%) | 85 (6.5%) |
| 65 to 74 Years | 15 (3.7%) | 5 (1.3%) |
| 75 Years and over | 16 (4.3%) | 46 (7.3%) |
Technology Access in Waite Park
Computing Device Access in Waite Park
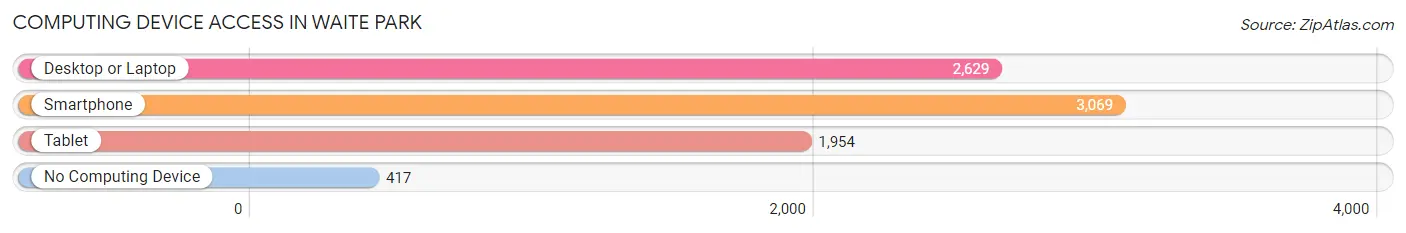
| Device Type | # Households | % Households |
| Desktop or Laptop | 2,629 | 70.6% |
| Smartphone | 3,069 | 82.4% |
| Tablet | 1,954 | 52.5% |
| No Computing Device | 417 | 11.2% |
| Total | 3,724 | 100.0% |
Internet Access in Waite Park
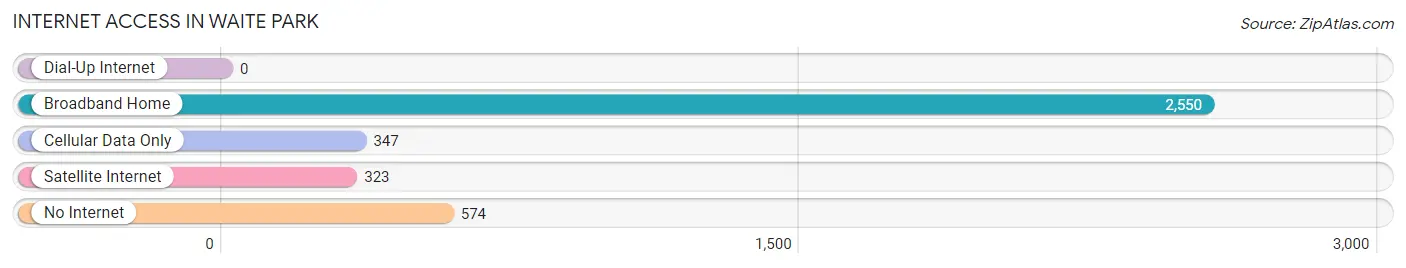
| Internet Type | # Households | % Households |
| Dial-Up Internet | 0 | 0.0% |
| Broadband Home | 2,550 | 68.5% |
| Cellular Data Only | 347 | 9.3% |
| Satellite Internet | 323 | 8.7% |
| No Internet | 574 | 15.4% |
| Total | 3,724 | 100.0% |
Waite Park Summary
Waite Park is a city located in Stearns County, Minnesota, United States. The population was 6,715 at the 2010 census. It is part of the St. Cloud Metropolitan Statistical Area.
History
Waite Park was founded in 1892 by William Waite, a local businessman. Waite purchased a large tract of land and began to develop it into a residential area. He named the area Waite Park after himself. The first post office was established in 1894.
In the early 1900s, Waite Park was a popular summer resort destination for people from the Twin Cities. The area was known for its natural beauty and its many lakes.
In the 1920s, Waite Park began to grow rapidly. The city was incorporated in 1924 and the population had grown to over 1,000 by 1930.
In the 1950s, Waite Park began to experience a period of growth and development. The city was home to several businesses, including a lumber yard, a grain elevator, and a feed mill.
Geography
Waite Park is located at 45°37′N 94°14′W (45.619, -94.233). According to the United States Census Bureau, the city has a total area of 4.2 square miles (10.8 km2), all of it land.
The city is located on the banks of the Sauk River, which flows through the city. The Sauk River is a tributary of the Mississippi River.
Economy
Waite Park is home to several businesses, including manufacturing, retail, and service industries. The city is also home to several large employers, including the St. Cloud Regional Medical Center, the St. Cloud State University, and the St. Cloud Technical and Community College.
The city is also home to several small businesses including restaurants bars and retail stores
Demographics
As of the census of 2010, there were 6,715 people, 2,845 households, and 1,717 families residing in the city. The population density was 1,611.2 people per square mile (619.7/km2). There were 3,039 housing units at an average density of 730.2 per square mile (282.2/km2). The racial makeup of the city was 94.2% White, 0.7% African American, 0.4% Native American, 1.7% Asian, 0.1% Pacific Islander, 1.3% from other races, and 1.8% from two or more races. Hispanic or Latino of any race were 3.3% of the population.
There were 2,845 households, out of which 28.2% had children under the age of 18 living with them, 44.2% were married couples living together, 10.7% had a female householder with no husband present, and 40.2% were non-families. 33.2% of all households were made up of individuals, and 13.2% had someone living alone who was 65 years of age or older. The average household size was 2.30 and the average family size was 2.94.
In the city, the population was spread out, with 23.2% under the age of 18, 11.2% from 18 to 24, 28.2% from 25 to 44, 21.2% from 45 to 64, and 16.2% who were 65 years of age or older. The median age was 36 years. For every 100 females, there were 93.2 males. For every 100 females age 18 and over, there were 90.2 males.
The median income for a household in the city was $41,944, and the median income for a family was $51,944. Males had a median income of $35,944 versus $25,944 for females. The per capita income for the city was $20,944. About 5.2% of families and 8.2% of the population were below the poverty line, including 10.2% of those under age 18 and 8.2% of those age 65 or over.
Common Questions
What is Per Capita Income in Waite Park?
Per Capita income in Waite Park is $27,573.
What is the Median Family Income in Waite Park?
Median Family Income in Waite Park is $68,438.
What is the Median Household income in Waite Park?
Median Household Income in Waite Park is $52,391.
What is Income or Wage Gap in Waite Park?
Income or Wage Gap in Waite Park is 24.5%.
Women in Waite Park earn 75.5 cents for every dollar earned by a man.
What is Inequality or Gini Index in Waite Park?
Inequality or Gini Index in Waite Park is 0.40.
What is the Total Population of Waite Park?
Total Population of Waite Park is 8,290.
What is the Total Male Population of Waite Park?
Total Male Population of Waite Park is 4,007.
What is the Total Female Population of Waite Park?
Total Female Population of Waite Park is 4,283.
What is the Ratio of Males per 100 Females in Waite Park?
There are 93.56 Males per 100 Females in Waite Park.
What is the Ratio of Females per 100 Males in Waite Park?
There are 106.89 Females per 100 Males in Waite Park.
What is the Median Population Age in Waite Park?
Median Population Age in Waite Park is 40.7 Years.
What is the Average Family Size in Waite Park
Average Family Size in Waite Park is 3.0 People.
What is the Average Household Size in Waite Park
Average Household Size in Waite Park is 2.2 People.
How Large is the Labor Force in Waite Park?
There are 4,294 People in the Labor Forcein in Waite Park.
What is the Percentage of People in the Labor Force in Waite Park?
62.9% of People are in the Labor Force in Waite Park.
What is the Unemployment Rate in Waite Park?
Unemployment Rate in Waite Park is 5.5%.