Magnolia, TX Map & Demographics
Magnolia Map
Magnolia Overview
$43,176
PER CAPITA INCOME
$91,750
AVG FAMILY INCOME
$59,922
AVG HOUSEHOLD INCOME
28.4%
WAGE / INCOME GAP [ % ]
71.6¢/ $1
WAGE / INCOME GAP [ $ ]
0.52
INEQUALITY / GINI INDEX
2,620
TOTAL POPULATION
1,245
MALE POPULATION
1,375
FEMALE POPULATION
90.55
MALES / 100 FEMALES
110.44
FEMALES / 100 MALES
36.4
MEDIAN AGE
3.3
AVG FAMILY SIZE
2.6
AVG HOUSEHOLD SIZE
1,264
LABOR FORCE [ PEOPLE ]
62.0%
PERCENT IN LABOR FORCE
1.0%
UNEMPLOYMENT RATE
Income in Magnolia
Income Overview in Magnolia
Per Capita Income in Magnolia is $43,176, while median incomes of families and households are $91,750 and $59,922 respectively.
| Characteristic | Number | Measure |
| Per Capita Income | 2,620 | $43,176 |
| Median Family Income | 637 | $91,750 |
| Mean Family Income | 637 | $125,943 |
| Median Household Income | 1,011 | $59,922 |
| Mean Household Income | 1,011 | $105,114 |
| Income Deficit | 637 | $0 |
| Wage / Income Gap (%) | 2,620 | 28.40% |
| Wage / Income Gap ($) | 2,620 | 71.60¢ per $1 |
| Gini / Inequality Index | 2,620 | 0.52 |
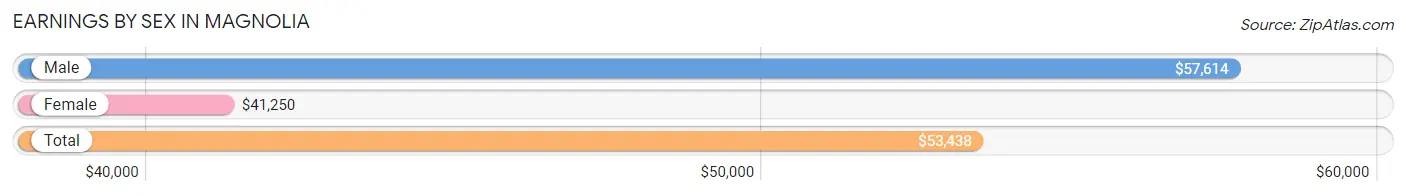
Earnings by Sex in Magnolia
Average Earnings in Magnolia are $53,438, $57,614 for men and $41,250 for women, a difference of 28.4%.
| Sex | Number | Average Earnings |
| Male | 820 (65.1%) | $57,614 |
| Female | 440 (34.9%) | $41,250 |
| Total | 1,260 (100.0%) | $53,438 |
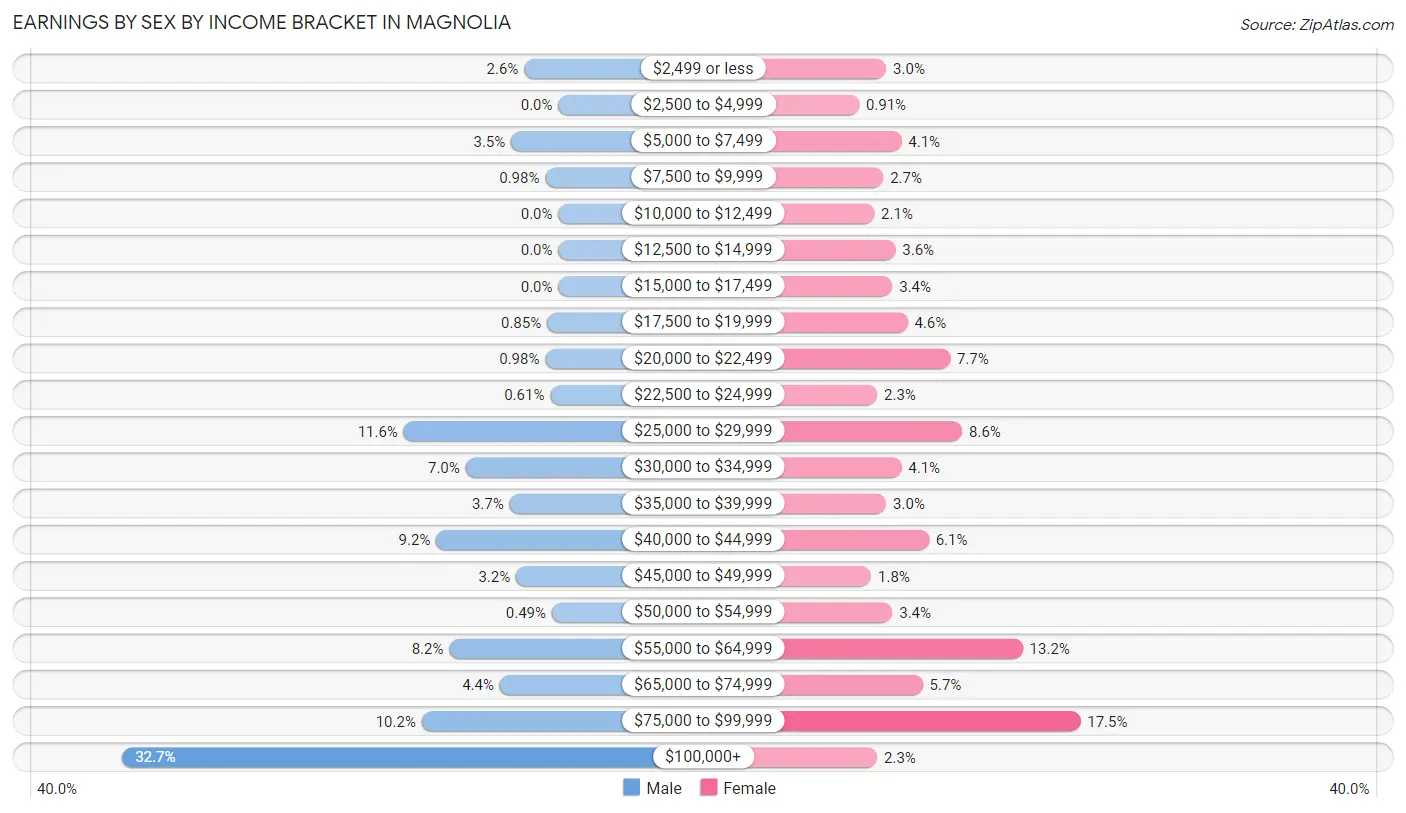
Earnings by Sex by Income Bracket in Magnolia
The most common earnings brackets in Magnolia are $100,000+ for men (268 | 32.7%) and $75,000 to $99,999 for women (77 | 17.5%).
| Income | Male | Female |
| $2,499 or less | 21 (2.6%) | 13 (2.9%) |
| $2,500 to $4,999 | 0 (0.0%) | 4 (0.9%) |
| $5,000 to $7,499 | 29 (3.5%) | 18 (4.1%) |
| $7,500 to $9,999 | 8 (1.0%) | 12 (2.7%) |
| $10,000 to $12,499 | 0 (0.0%) | 9 (2.1%) |
| $12,500 to $14,999 | 0 (0.0%) | 16 (3.6%) |
| $15,000 to $17,499 | 0 (0.0%) | 15 (3.4%) |
| $17,500 to $19,999 | 7 (0.9%) | 20 (4.5%) |
| $20,000 to $22,499 | 8 (1.0%) | 34 (7.7%) |
| $22,500 to $24,999 | 5 (0.6%) | 10 (2.3%) |
| $25,000 to $29,999 | 95 (11.6%) | 38 (8.6%) |
| $30,000 to $34,999 | 57 (7.0%) | 18 (4.1%) |
| $35,000 to $39,999 | 30 (3.7%) | 13 (2.9%) |
| $40,000 to $44,999 | 75 (9.1%) | 27 (6.1%) |
| $45,000 to $49,999 | 26 (3.2%) | 8 (1.8%) |
| $50,000 to $54,999 | 4 (0.5%) | 15 (3.4%) |
| $55,000 to $64,999 | 67 (8.2%) | 58 (13.2%) |
| $65,000 to $74,999 | 36 (4.4%) | 25 (5.7%) |
| $75,000 to $99,999 | 84 (10.2%) | 77 (17.5%) |
| $100,000+ | 268 (32.7%) | 10 (2.3%) |
| Total | 820 (100.0%) | 440 (100.0%) |
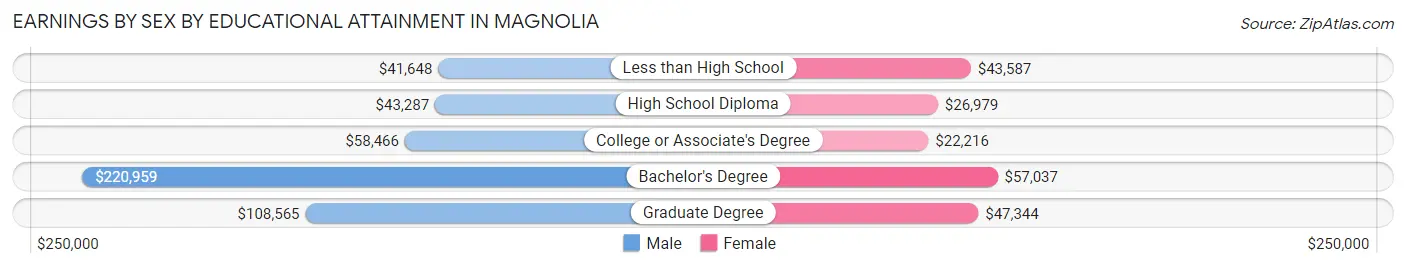
Earnings by Sex by Educational Attainment in Magnolia
Average earnings in Magnolia are $70,417 for men and $42,731 for women, a difference of 39.3%. Men with an educational attainment of bachelor's degree enjoy the highest average annual earnings of $220,959, while those with less than high school education earn the least with $41,648. Women with an educational attainment of bachelor's degree earn the most with the average annual earnings of $57,037, while those with college or associate's degree education have the smallest earnings of $22,216.
| Educational Attainment | Male Income | Female Income |
| Less than High School | $41,648 | $43,587 |
| High School Diploma | $43,287 | $26,979 |
| College or Associate's Degree | $58,466 | $22,216 |
| Bachelor's Degree | $220,959 | $57,037 |
| Graduate Degree | $108,565 | $47,344 |
| Total | $70,417 | $42,731 |
Family Income in Magnolia
Family Income Brackets in Magnolia
According to the Magnolia family income data, there are 136 families falling into the $100,000 to $149,999 income range, which is the most common income bracket and makes up 21.3% of all families.
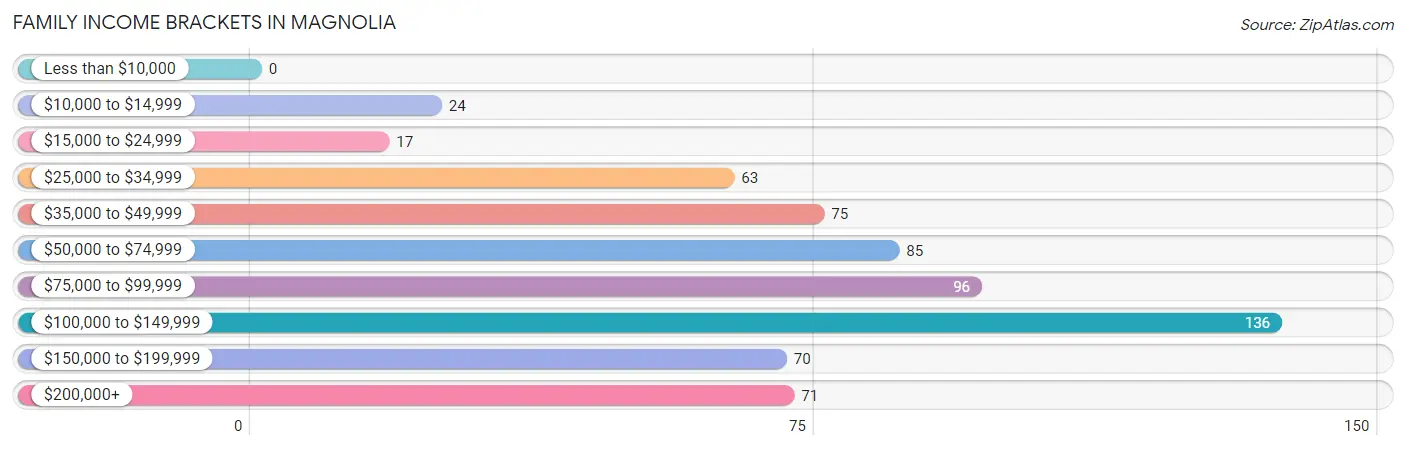
| Income Bracket | # Families | % Families |
| Less than $10,000 | 0 | 0.0% |
| $10,000 to $14,999 | 24 | 3.8% |
| $15,000 to $24,999 | 17 | 2.7% |
| $25,000 to $34,999 | 63 | 9.9% |
| $35,000 to $49,999 | 75 | 11.8% |
| $50,000 to $74,999 | 85 | 13.3% |
| $75,000 to $99,999 | 96 | 15.1% |
| $100,000 to $149,999 | 136 | 21.4% |
| $150,000 to $199,999 | 70 | 11.0% |
| $200,000+ | 71 | 11.1% |
Family Income by Famaliy Size in Magnolia
5-person families (50 | 7.9%) account for the highest median family income in Magnolia with $117,885 per family, while 2-person families (238 | 37.4%) have the highest median income of $39,375 per family member.
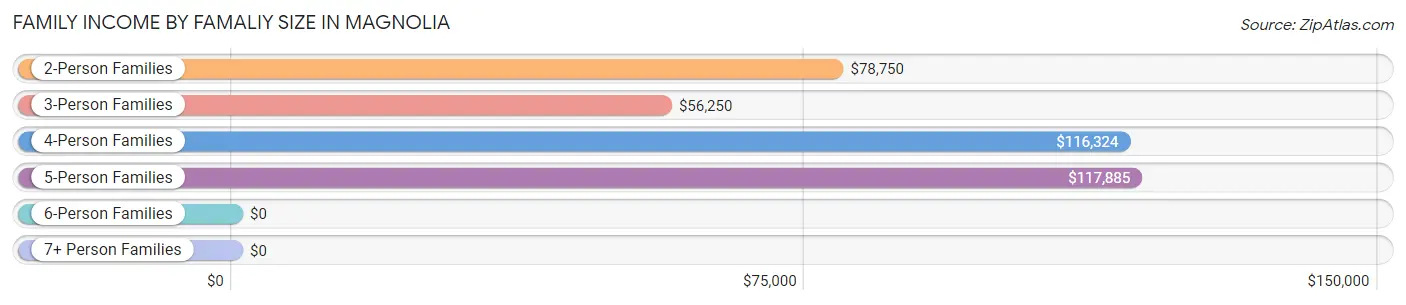
| Income Bracket | # Families | Median Income |
| 2-Person Families | 238 (37.4%) | $78,750 |
| 3-Person Families | 158 (24.8%) | $56,250 |
| 4-Person Families | 158 (24.8%) | $116,324 |
| 5-Person Families | 50 (7.9%) | $117,885 |
| 6-Person Families | 8 (1.3%) | $0 |
| 7+ Person Families | 25 (3.9%) | $0 |
| Total | 637 (100.0%) | $91,750 |
Family Income by Number of Earners in Magnolia
The median family income in Magnolia is $91,750, with families comprising 3+ earners (37) having the highest median family income of $132,875, while families with no earners (82) have the lowest median family income of $34,048, accounting for 5.8% and 12.9% of families, respectively.
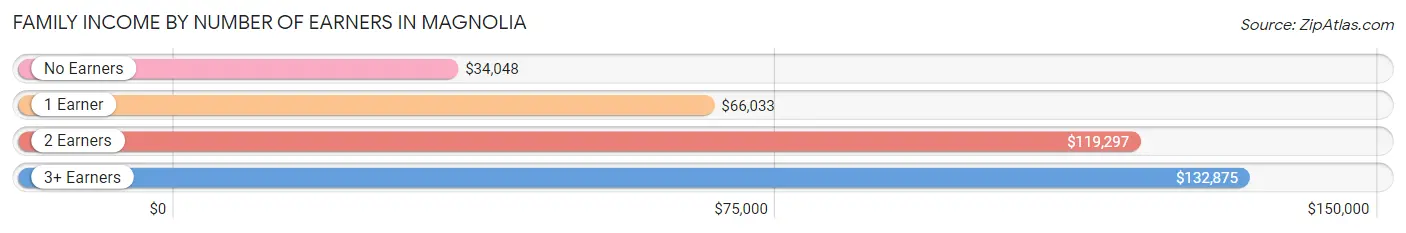
| Number of Earners | # Families | Median Income |
| No Earners | 82 (12.9%) | $34,048 |
| 1 Earner | 243 (38.2%) | $66,033 |
| 2 Earners | 275 (43.2%) | $119,297 |
| 3+ Earners | 37 (5.8%) | $132,875 |
| Total | 637 (100.0%) | $91,750 |
Household Income in Magnolia
Household Income Brackets in Magnolia
With 175 households falling in the category, the $25,000 to $34,999 income range is the most frequent in Magnolia, accounting for 17.3% of all households. In contrast, only 12 households (1.2%) fall into the less than $10,000 income bracket, making it the least populous group.
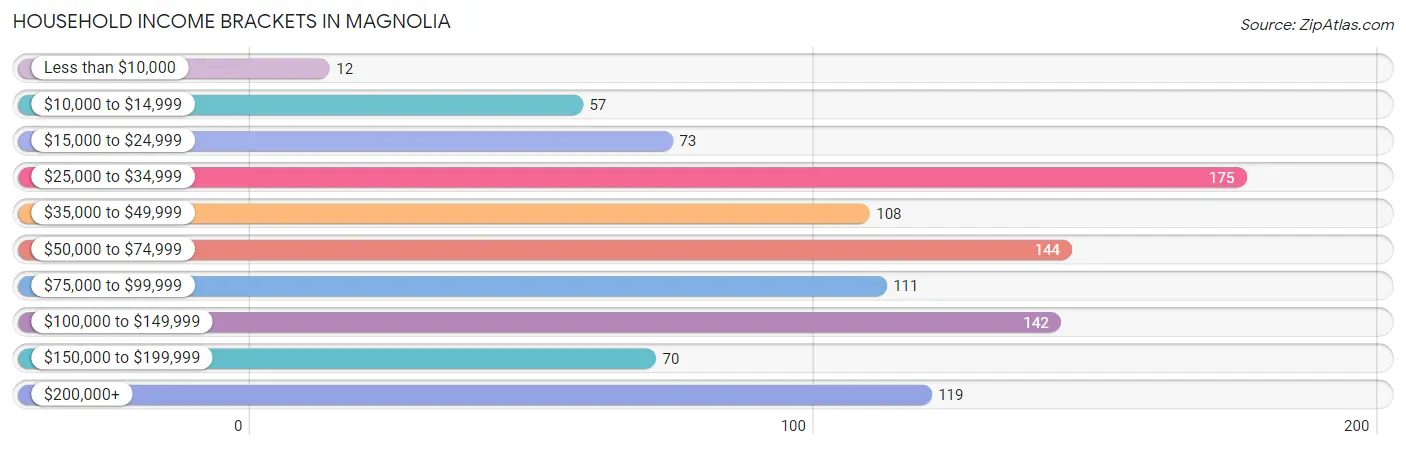
| Income Bracket | # Households | % Households |
| Less than $10,000 | 12 | 1.2% |
| $10,000 to $14,999 | 57 | 5.6% |
| $15,000 to $24,999 | 73 | 7.2% |
| $25,000 to $34,999 | 175 | 17.3% |
| $35,000 to $49,999 | 108 | 10.7% |
| $50,000 to $74,999 | 144 | 14.2% |
| $75,000 to $99,999 | 111 | 11.0% |
| $100,000 to $149,999 | 142 | 14.0% |
| $150,000 to $199,999 | 70 | 6.9% |
| $200,000+ | 119 | 11.8% |
Household Income by Householder Age in Magnolia
The median household income in Magnolia is $59,922, with the highest median household income of $103,958 found in the 25 to 44 years age bracket for the primary householder. A total of 284 households (28.1%) fall into this category. Meanwhile, the 65+ years age bracket for the primary householder has the lowest median household income of $30,545, with 305 households (30.2%) in this group.
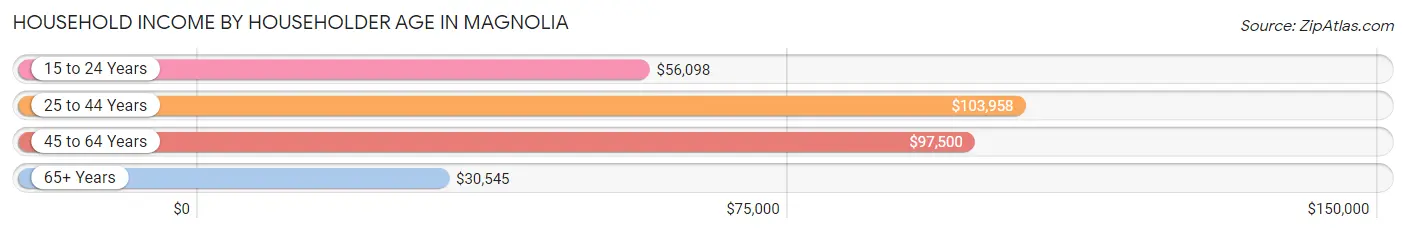
| Income Bracket | # Households | Median Income |
| 15 to 24 Years | 46 (4.5%) | $56,098 |
| 25 to 44 Years | 284 (28.1%) | $103,958 |
| 45 to 64 Years | 376 (37.2%) | $97,500 |
| 65+ Years | 305 (30.2%) | $30,545 |
| Total | 1,011 (100.0%) | $59,922 |
Poverty in Magnolia
Income Below Poverty by Sex and Age in Magnolia
With 4.2% poverty level for males and 8.9% for females among the residents of Magnolia, 45 to 54 year old males and 35 to 44 year old females are the most vulnerable to poverty, with 37 males (22.2%) and 30 females (26.3%) in their respective age groups living below the poverty level.
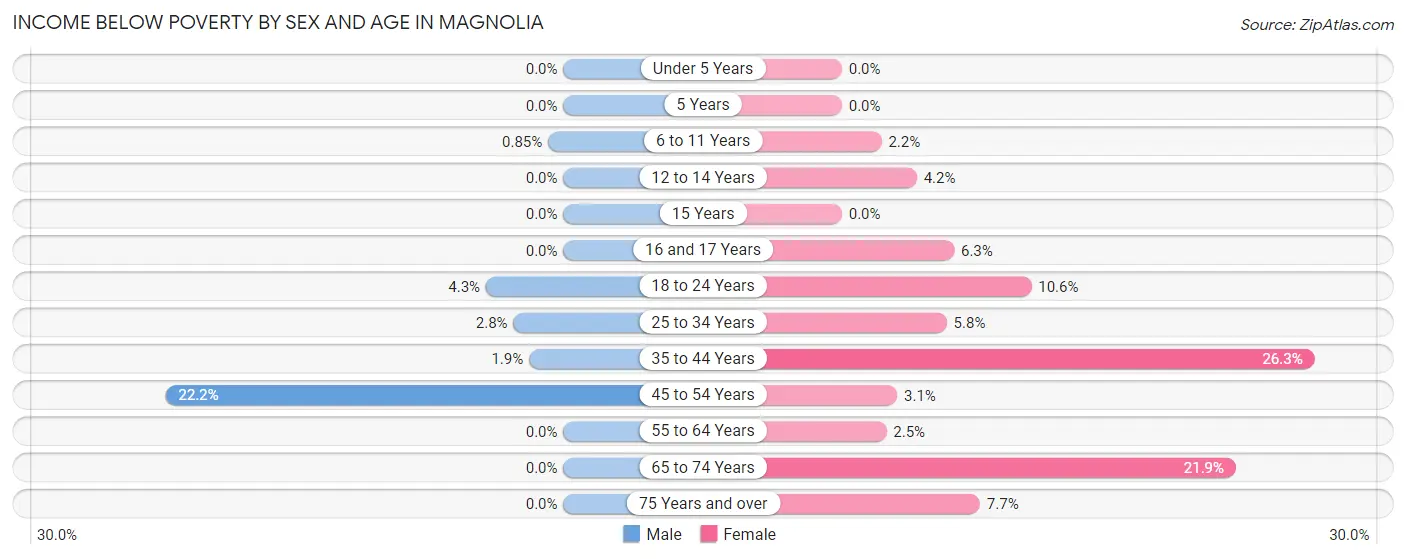
| Age Bracket | Male | Female |
| Under 5 Years | 0 (0.0%) | 0 (0.0%) |
| 5 Years | 0 (0.0%) | 0 (0.0%) |
| 6 to 11 Years | 1 (0.9%) | 3 (2.2%) |
| 12 to 14 Years | 0 (0.0%) | 4 (4.2%) |
| 15 Years | 0 (0.0%) | 0 (0.0%) |
| 16 and 17 Years | 0 (0.0%) | 1 (6.2%) |
| 18 to 24 Years | 5 (4.3%) | 25 (10.5%) |
| 25 to 34 Years | 5 (2.8%) | 8 (5.8%) |
| 35 to 44 Years | 4 (1.9%) | 30 (26.3%) |
| 45 to 54 Years | 37 (22.2%) | 2 (3.1%) |
| 55 to 64 Years | 0 (0.0%) | 4 (2.5%) |
| 65 to 74 Years | 0 (0.0%) | 34 (21.9%) |
| 75 Years and over | 0 (0.0%) | 11 (7.7%) |
| Total | 52 (4.2%) | 122 (8.9%) |
Income Above Poverty by Sex and Age in Magnolia
According to the poverty statistics in Magnolia, males aged under 5 years and females aged under 5 years are the age groups that are most secure financially, with 100.0% of males and 100.0% of females in these age groups living above the poverty line.
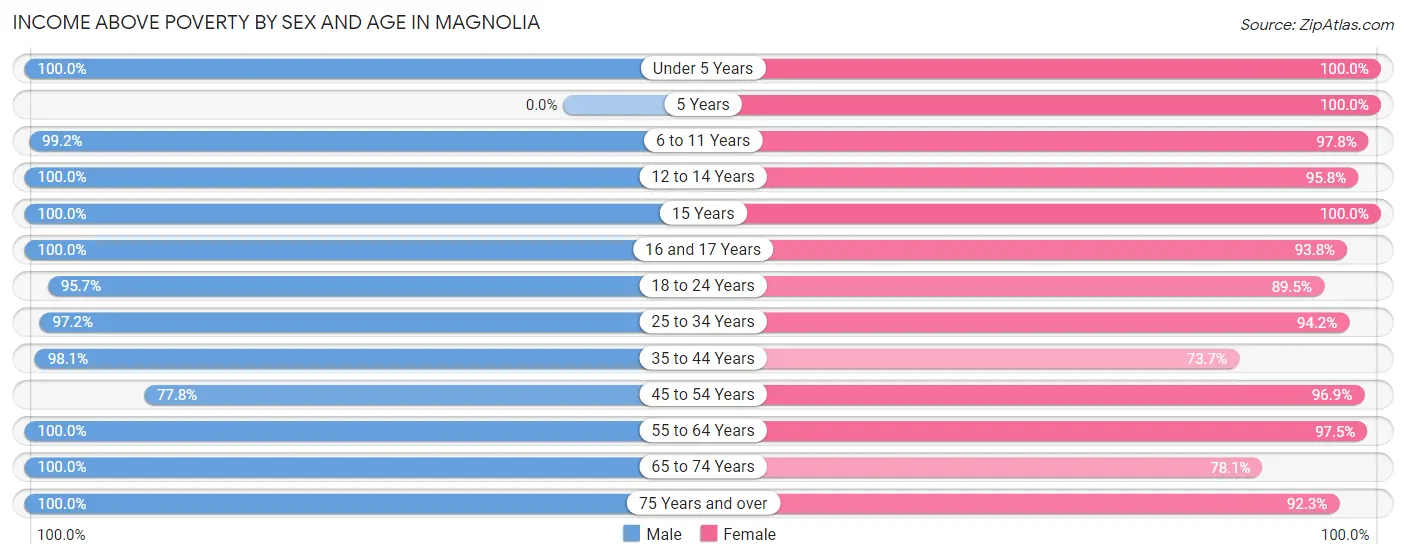
| Age Bracket | Male | Female |
| Under 5 Years | 65 (100.0%) | 74 (100.0%) |
| 5 Years | 0 (0.0%) | 31 (100.0%) |
| 6 to 11 Years | 117 (99.2%) | 133 (97.8%) |
| 12 to 14 Years | 38 (100.0%) | 92 (95.8%) |
| 15 Years | 16 (100.0%) | 8 (100.0%) |
| 16 and 17 Years | 10 (100.0%) | 15 (93.8%) |
| 18 to 24 Years | 111 (95.7%) | 212 (89.4%) |
| 25 to 34 Years | 175 (97.2%) | 129 (94.2%) |
| 35 to 44 Years | 205 (98.1%) | 84 (73.7%) |
| 45 to 54 Years | 130 (77.8%) | 63 (96.9%) |
| 55 to 64 Years | 228 (100.0%) | 157 (97.5%) |
| 65 to 74 Years | 49 (100.0%) | 121 (78.1%) |
| 75 Years and over | 49 (100.0%) | 132 (92.3%) |
| Total | 1,193 (95.8%) | 1,251 (91.1%) |
Income Below Poverty Among Married-Couple Families in Magnolia
The poverty statistics for married-couple families in Magnolia show that 6.5% or 31 of the total 478 families live below the poverty line. Families with no children have the highest poverty rate of 11.2%, comprising of 29 families. On the other hand, families with 3 or 4 children have the lowest poverty rate of 0.0%, which includes 0 families.
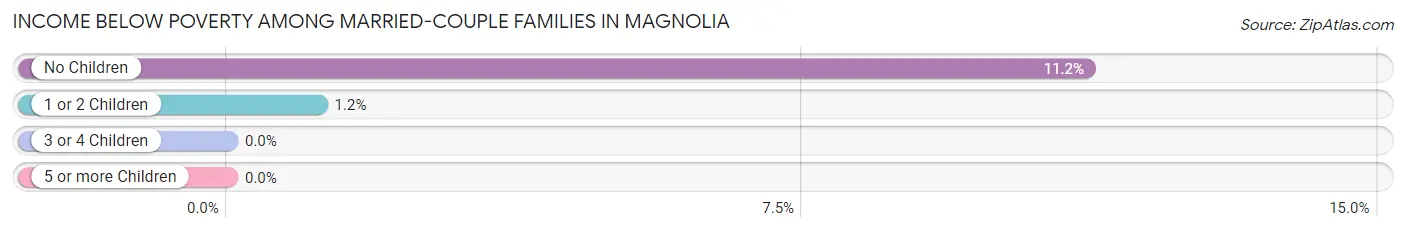
| Children | Above Poverty | Below Poverty |
| No Children | 230 (88.8%) | 29 (11.2%) |
| 1 or 2 Children | 169 (98.8%) | 2 (1.2%) |
| 3 or 4 Children | 48 (100.0%) | 0 (0.0%) |
| 5 or more Children | 0 (0.0%) | 0 (0.0%) |
| Total | 447 (93.5%) | 31 (6.5%) |
Income Below Poverty Among Single-Parent Households in Magnolia
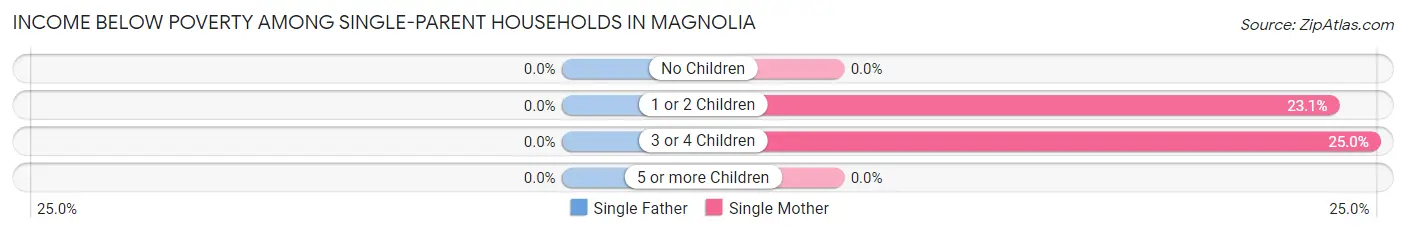
| Children | Single Father | Single Mother |
| No Children | 0 (0.0%) | 0 (0.0%) |
| 1 or 2 Children | 0 (0.0%) | 6 (23.1%) |
| 3 or 4 Children | 0 (0.0%) | 1 (25.0%) |
| 5 or more Children | 0 (0.0%) | 0 (0.0%) |
| Total | 0 (0.0%) | 7 (7.5%) |
Income Below Poverty Among Married-Couple vs Single-Parent Households in Magnolia
The poverty data for Magnolia shows that 31 of the married-couple family households (6.5%) and 7 of the single-parent households (4.4%) are living below the poverty level. Within the married-couple family households, those with no children have the highest poverty rate, with 29 households (11.2%) falling below the poverty line. Among the single-parent households, those with 3 or 4 children have the highest poverty rate, with 1 household (12.5%) living below poverty.
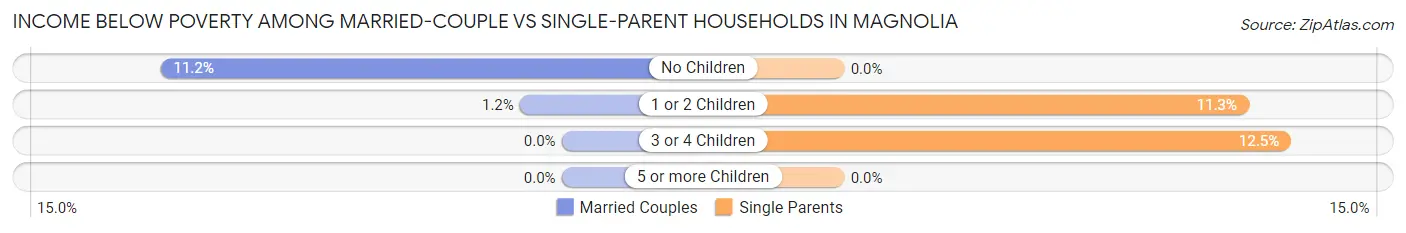
| Children | Married-Couple Families | Single-Parent Households |
| No Children | 29 (11.2%) | 0 (0.0%) |
| 1 or 2 Children | 2 (1.2%) | 6 (11.3%) |
| 3 or 4 Children | 0 (0.0%) | 1 (12.5%) |
| 5 or more Children | 0 (0.0%) | 0 (0.0%) |
| Total | 31 (6.5%) | 7 (4.4%) |
Race in Magnolia
The most populous races in Magnolia are White / Caucasian (1,993 | 76.1%), Hispanic or Latino (484 | 18.5%), and Black / African American (280 | 10.7%).
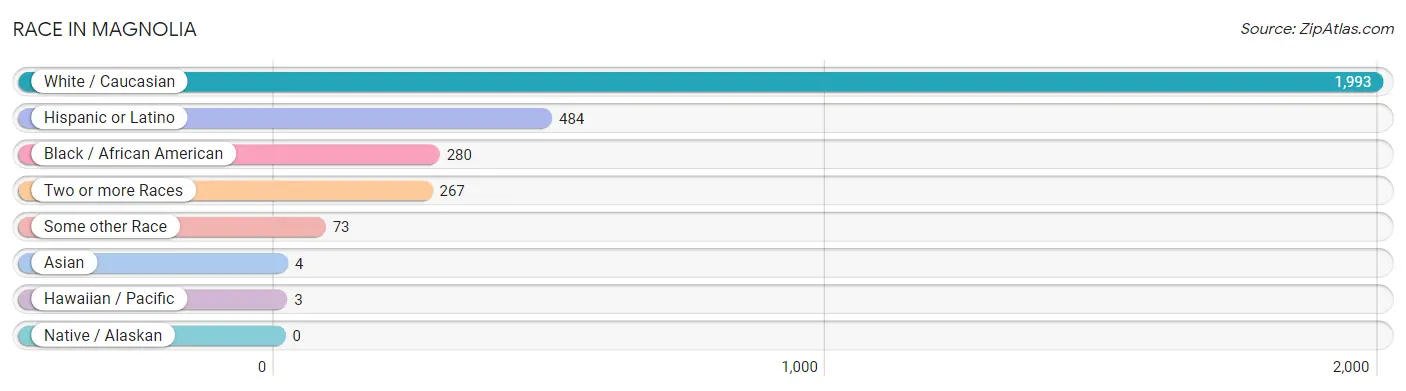
| Race | # Population | % Population |
| Asian | 4 | 0.2% |
| Black / African American | 280 | 10.7% |
| Hawaiian / Pacific | 3 | 0.1% |
| Hispanic or Latino | 484 | 18.5% |
| Native / Alaskan | 0 | 0.0% |
| White / Caucasian | 1,993 | 76.1% |
| Two or more Races | 267 | 10.2% |
| Some other Race | 73 | 2.8% |
| Total | 2,620 | 100.0% |
Ancestry in Magnolia
The most populous ancestries reported in Magnolia are German (312 | 11.9%), Irish (298 | 11.4%), English (290 | 11.1%), Mexican (272 | 10.4%), and American (147 | 5.6%), together accounting for 50.3% of all Magnolia residents.
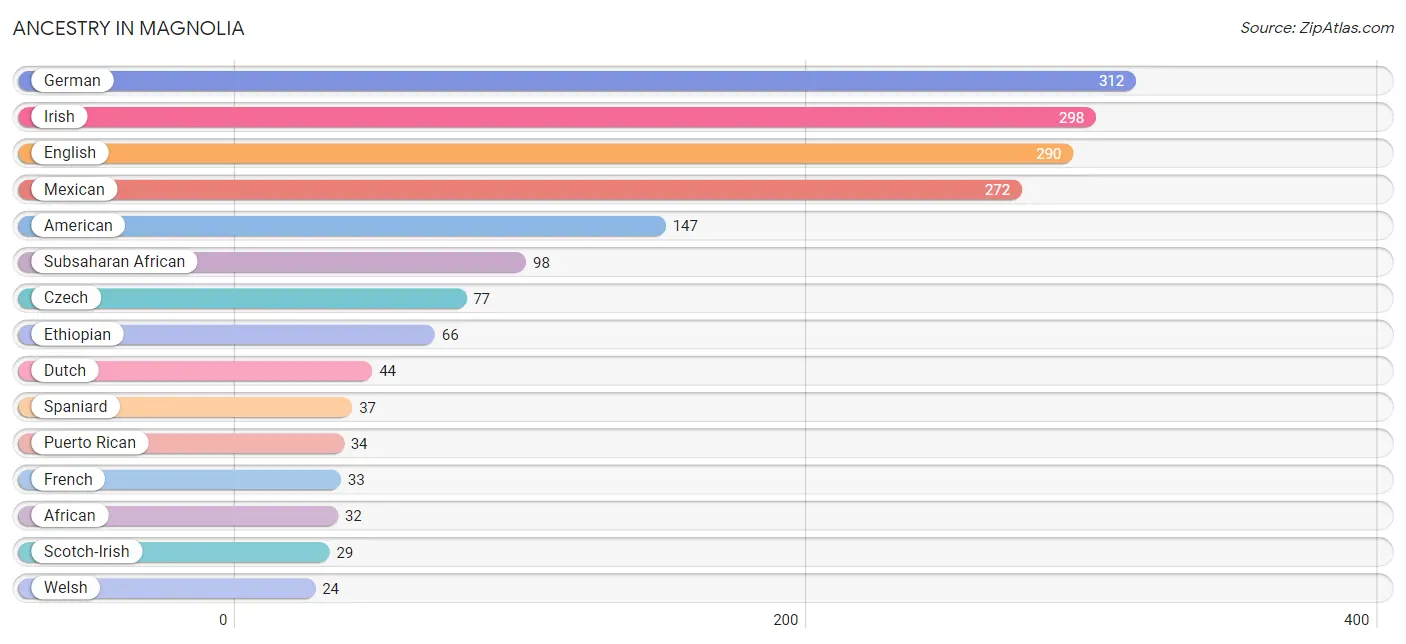
| Ancestry | # Population | % Population |
| African | 32 | 1.2% |
| American | 147 | 5.6% |
| Austrian | 4 | 0.2% |
| Central American | 7 | 0.3% |
| Cherokee | 4 | 0.2% |
| Czech | 77 | 2.9% |
| Dutch | 44 | 1.7% |
| Eastern European | 5 | 0.2% |
| English | 290 | 11.1% |
| Ethiopian | 66 | 2.5% |
| European | 16 | 0.6% |
| French | 33 | 1.3% |
| French Canadian | 11 | 0.4% |
| German | 312 | 11.9% |
| Greek | 19 | 0.7% |
| Hungarian | 8 | 0.3% |
| Indian (Asian) | 8 | 0.3% |
| Irish | 298 | 11.4% |
| Italian | 17 | 0.6% |
| Jamaican | 8 | 0.3% |
| Mexican | 272 | 10.4% |
| Native Hawaiian | 3 | 0.1% |
| Norwegian | 19 | 0.7% |
| Polish | 8 | 0.3% |
| Puerto Rican | 34 | 1.3% |
| Romanian | 16 | 0.6% |
| Russian | 5 | 0.2% |
| Salvadoran | 7 | 0.3% |
| Scotch-Irish | 29 | 1.1% |
| Scottish | 4 | 0.2% |
| Spaniard | 37 | 1.4% |
| Sri Lankan | 4 | 0.2% |
| Subsaharan African | 98 | 3.7% |
| Swedish | 13 | 0.5% |
| Swiss | 11 | 0.4% |
| Turkish | 8 | 0.3% |
| Welsh | 24 | 0.9% | View All 37 Rows |
Immigrants in Magnolia
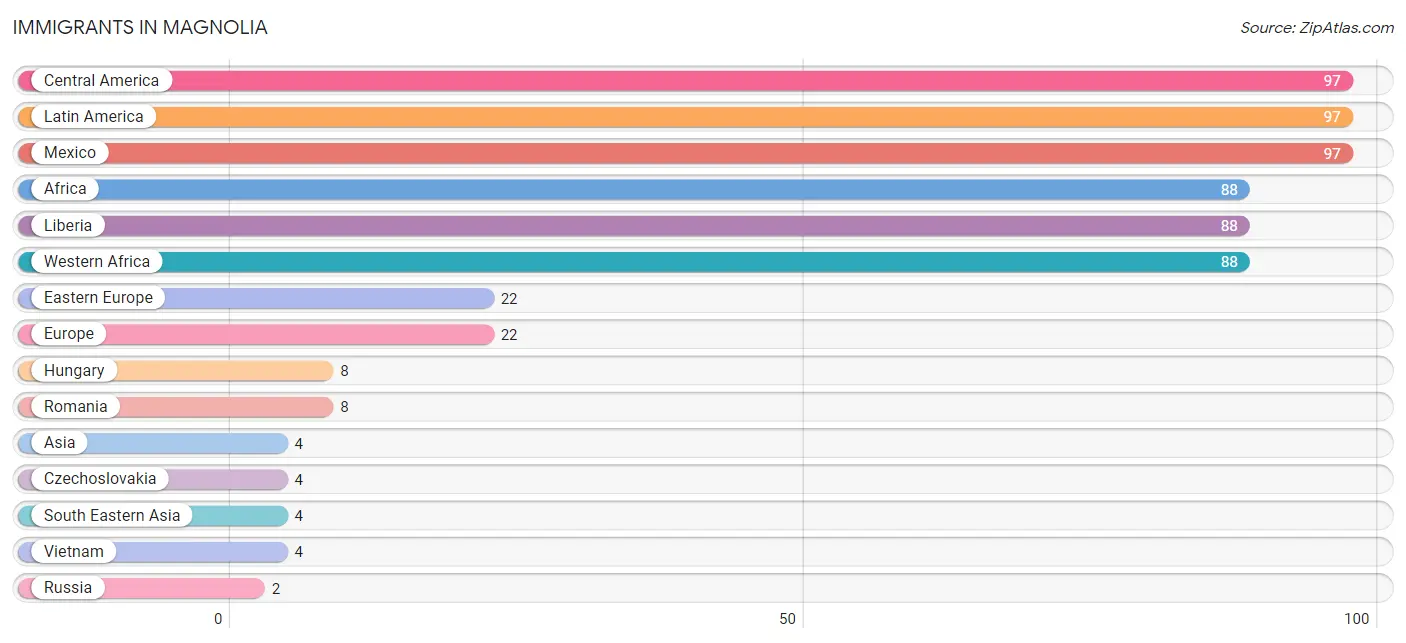
The most numerous immigrant groups reported in Magnolia came from Central America (97 | 3.7%), Latin America (97 | 3.7%), Mexico (97 | 3.7%), Africa (88 | 3.4%), and Liberia (88 | 3.4%), together accounting for 17.8% of all Magnolia residents.
| Immigration Origin | # Population | % Population |
| Africa | 88 | 3.4% |
| Asia | 4 | 0.2% |
| Central America | 97 | 3.7% |
| Czechoslovakia | 4 | 0.2% |
| Eastern Europe | 22 | 0.8% |
| Europe | 22 | 0.8% |
| Hungary | 8 | 0.3% |
| Latin America | 97 | 3.7% |
| Liberia | 88 | 3.4% |
| Mexico | 97 | 3.7% |
| Romania | 8 | 0.3% |
| Russia | 2 | 0.1% |
| South Eastern Asia | 4 | 0.2% |
| Vietnam | 4 | 0.2% |
| Western Africa | 88 | 3.4% | View All 15 Rows |
Sex and Age in Magnolia
Sex and Age in Magnolia
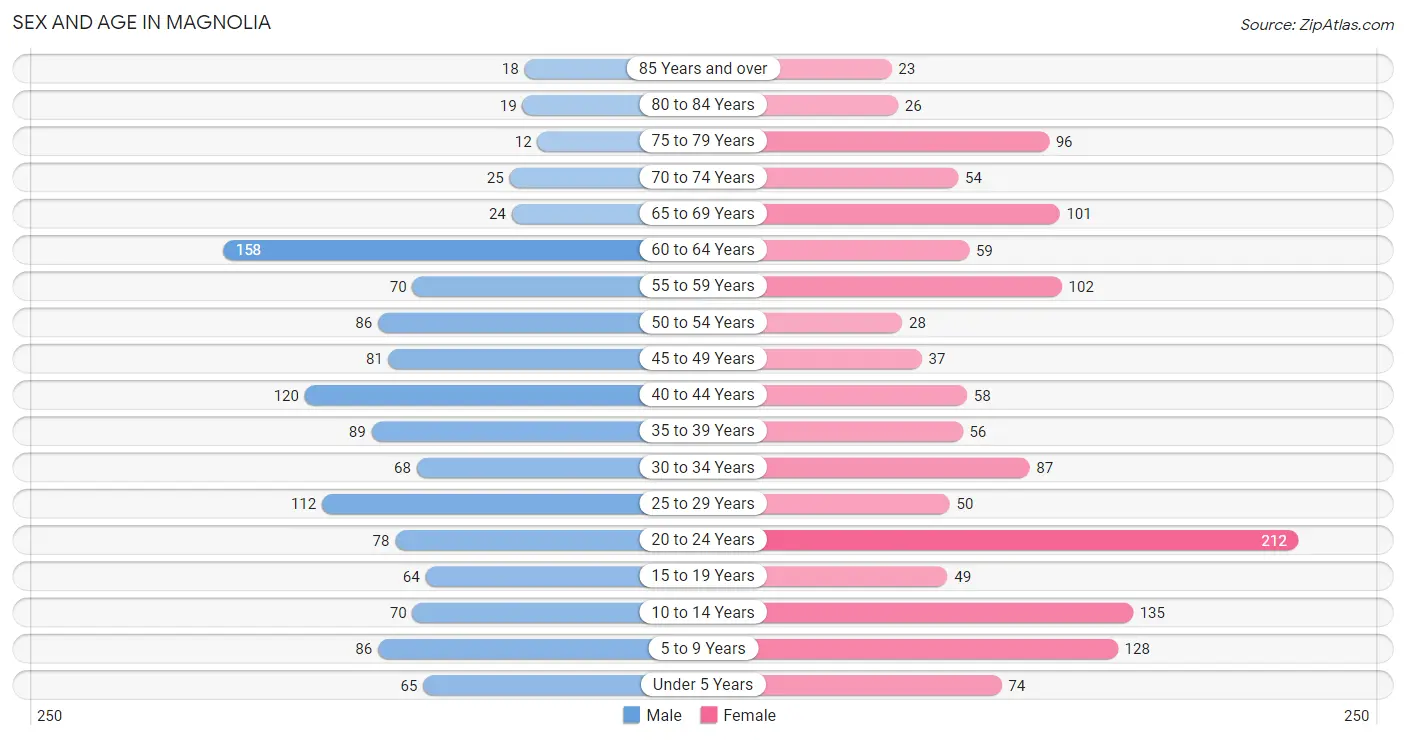
The most populous age groups in Magnolia are 60 to 64 Years (158 | 12.7%) for men and 20 to 24 Years (212 | 15.4%) for women.
| Age Bracket | Male | Female |
| Under 5 Years | 65 (5.2%) | 74 (5.4%) |
| 5 to 9 Years | 86 (6.9%) | 128 (9.3%) |
| 10 to 14 Years | 70 (5.6%) | 135 (9.8%) |
| 15 to 19 Years | 64 (5.1%) | 49 (3.6%) |
| 20 to 24 Years | 78 (6.3%) | 212 (15.4%) |
| 25 to 29 Years | 112 (9.0%) | 50 (3.6%) |
| 30 to 34 Years | 68 (5.5%) | 87 (6.3%) |
| 35 to 39 Years | 89 (7.1%) | 56 (4.1%) |
| 40 to 44 Years | 120 (9.6%) | 58 (4.2%) |
| 45 to 49 Years | 81 (6.5%) | 37 (2.7%) |
| 50 to 54 Years | 86 (6.9%) | 28 (2.0%) |
| 55 to 59 Years | 70 (5.6%) | 102 (7.4%) |
| 60 to 64 Years | 158 (12.7%) | 59 (4.3%) |
| 65 to 69 Years | 24 (1.9%) | 101 (7.3%) |
| 70 to 74 Years | 25 (2.0%) | 54 (3.9%) |
| 75 to 79 Years | 12 (1.0%) | 96 (7.0%) |
| 80 to 84 Years | 19 (1.5%) | 26 (1.9%) |
| 85 Years and over | 18 (1.5%) | 23 (1.7%) |
| Total | 1,245 (100.0%) | 1,375 (100.0%) |
Families and Households in Magnolia
Median Family Size in Magnolia
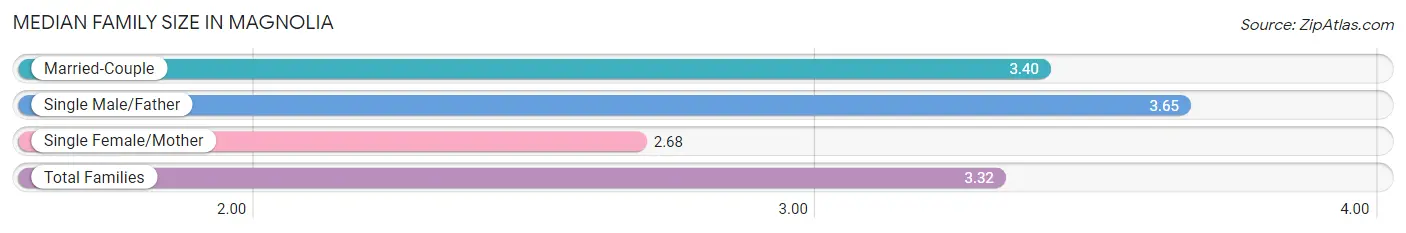
The median family size in Magnolia is 3.32 persons per family, with single male/father families (66 | 10.4%) accounting for the largest median family size of 3.65 persons per family. On the other hand, single female/mother families (93 | 14.6%) represent the smallest median family size with 2.68 persons per family.
| Family Type | # Families | Family Size |
| Married-Couple | 478 (75.0%) | 3.40 |
| Single Male/Father | 66 (10.4%) | 3.65 |
| Single Female/Mother | 93 (14.6%) | 2.68 |
| Total Families | 637 (100.0%) | 3.32 |
Median Household Size in Magnolia
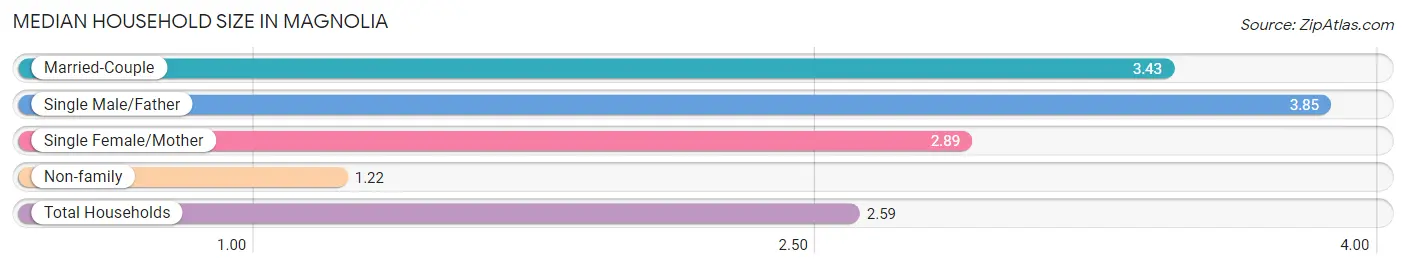
The median household size in Magnolia is 2.59 persons per household, with single male/father households (66 | 6.5%) accounting for the largest median household size of 3.85 persons per household. non-family households (374 | 37.0%) represent the smallest median household size with 1.22 persons per household.
| Household Type | # Households | Household Size |
| Married-Couple | 478 (47.3%) | 3.43 |
| Single Male/Father | 66 (6.5%) | 3.85 |
| Single Female/Mother | 93 (9.2%) | 2.89 |
| Non-family | 374 (37.0%) | 1.22 |
| Total Households | 1,011 (100.0%) | 2.59 |
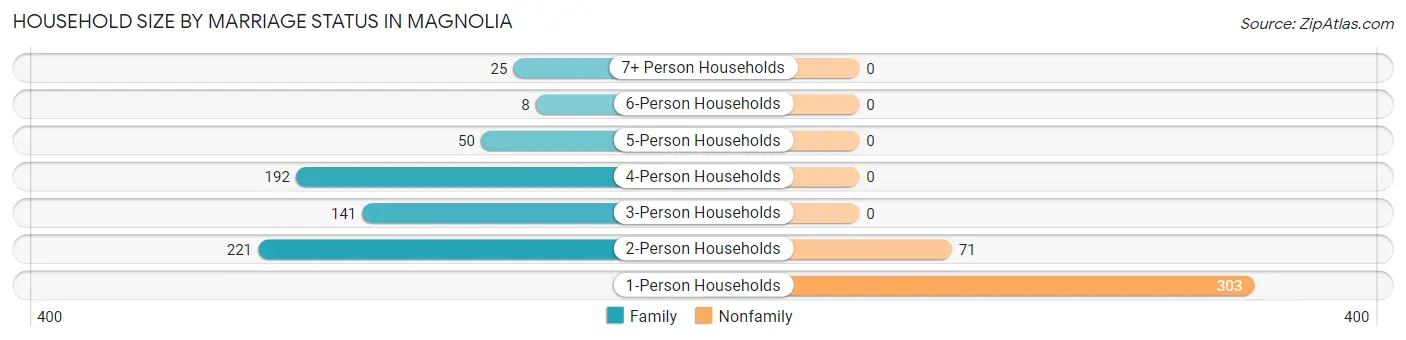
Household Size by Marriage Status in Magnolia
Out of a total of 1,011 households in Magnolia, 637 (63.0%) are family households, while 374 (37.0%) are nonfamily households. The most numerous type of family households are 2-person households, comprising 221, and the most common type of nonfamily households are 1-person households, comprising 303.
| Household Size | Family Households | Nonfamily Households |
| 1-Person Households | - | 303 (30.0%) |
| 2-Person Households | 221 (21.9%) | 71 (7.0%) |
| 3-Person Households | 141 (14.0%) | 0 (0.0%) |
| 4-Person Households | 192 (19.0%) | 0 (0.0%) |
| 5-Person Households | 50 (5.0%) | 0 (0.0%) |
| 6-Person Households | 8 (0.8%) | 0 (0.0%) |
| 7+ Person Households | 25 (2.5%) | 0 (0.0%) |
| Total | 637 (63.0%) | 374 (37.0%) |
Female Fertility in Magnolia
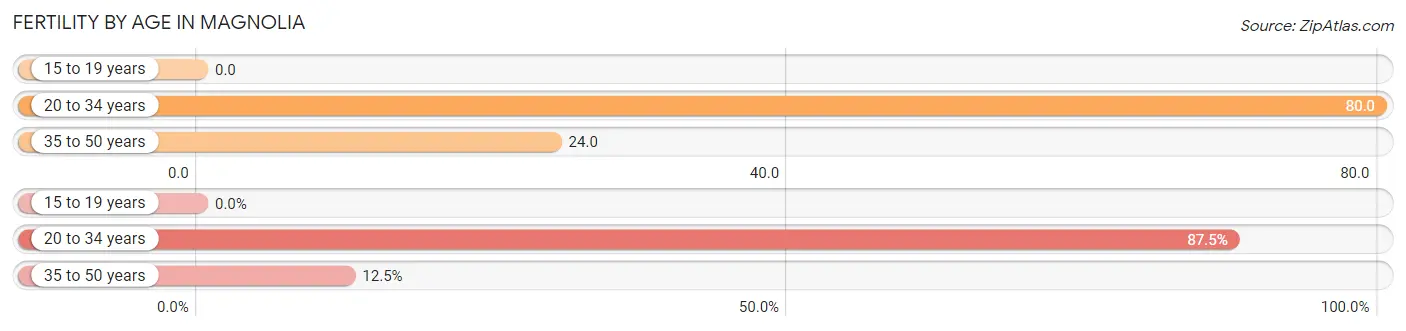
Fertility by Age in Magnolia
Average fertility rate in Magnolia is 57.0 births per 1,000 women. Women in the age bracket of 20 to 34 years have the highest fertility rate with 80.0 births per 1,000 women. Women in the age bracket of 20 to 34 years acount for 87.5% of all women with births.
| Age Bracket | Women with Births | Births / 1,000 Women |
| 15 to 19 years | 0 (0.0%) | 0.0 |
| 20 to 34 years | 28 (87.5%) | 80.0 |
| 35 to 50 years | 4 (12.5%) | 24.0 |
| Total | 32 (100.0%) | 57.0 |
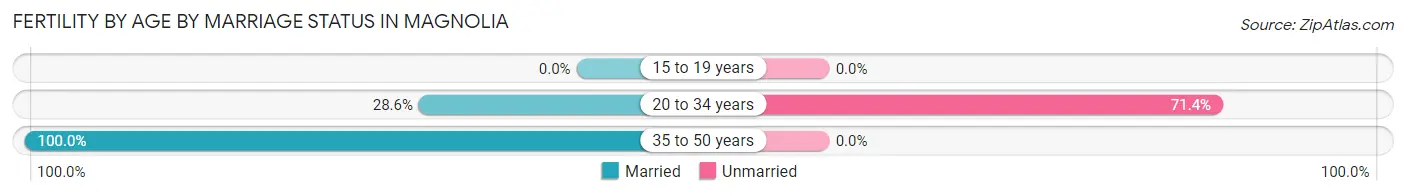
Fertility by Age by Marriage Status in Magnolia
37.5% of women with births (32) in Magnolia are married. The highest percentage of unmarried women with births falls into 20 to 34 years age bracket with 71.4% of them unmarried at the time of birth, while the lowest percentage of unmarried women with births belong to 35 to 50 years age bracket with 0.0% of them unmarried.
| Age Bracket | Married | Unmarried |
| 15 to 19 years | 0 (0.0%) | 0 (0.0%) |
| 20 to 34 years | 8 (28.6%) | 20 (71.4%) |
| 35 to 50 years | 4 (100.0%) | 0 (0.0%) |
| Total | 12 (37.5%) | 20 (62.5%) |
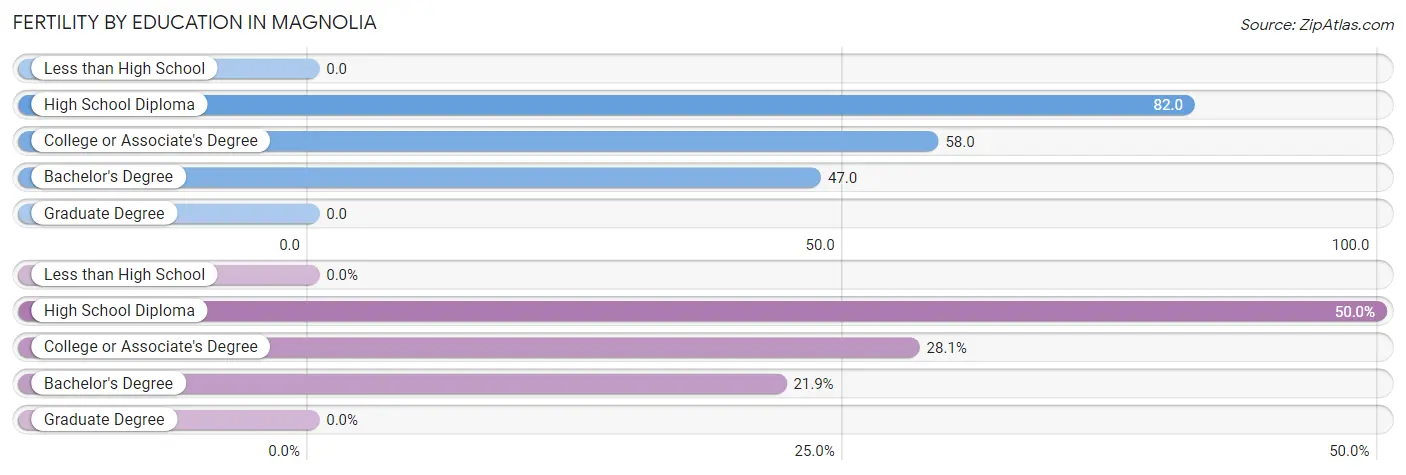
Fertility by Education in Magnolia
| Educational Attainment | Women with Births | Births / 1,000 Women |
| Less than High School | 0 (0.0%) | 0.0 |
| High School Diploma | 16 (50.0%) | 82.0 |
| College or Associate's Degree | 9 (28.1%) | 58.0 |
| Bachelor's Degree | 7 (21.9%) | 47.0 |
| Graduate Degree | 0 (0.0%) | 0.0 |
| Total | 32 (100.0%) | 57.0 |
Fertility by Education by Marriage Status in Magnolia
62.5% of women with births in Magnolia are unmarried. Women with the educational attainment of bachelor's degree are most likely to be married with 100.0% of them married at childbirth, while women with the educational attainment of college or associate's degree are least likely to be married with 100.0% of them unmarried at childbirth.
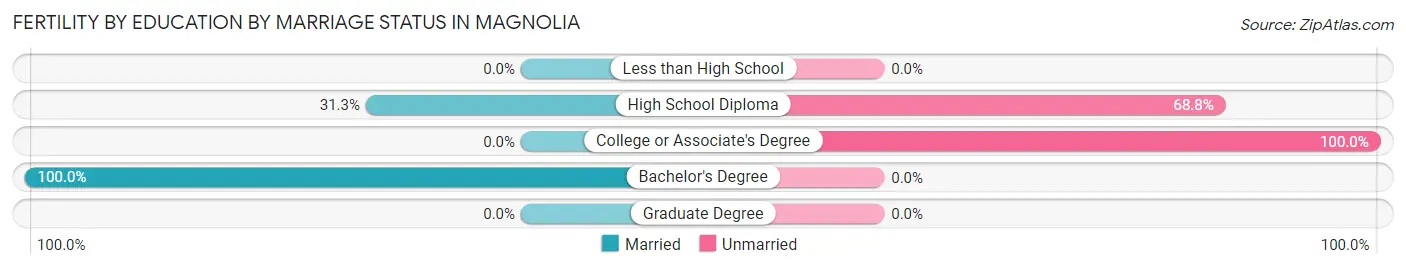
| Educational Attainment | Married | Unmarried |
| Less than High School | 0 (0.0%) | 0 (0.0%) |
| High School Diploma | 5 (31.2%) | 11 (68.8%) |
| College or Associate's Degree | 0 (0.0%) | 9 (100.0%) |
| Bachelor's Degree | 7 (100.0%) | 0 (0.0%) |
| Graduate Degree | 0 (0.0%) | 0 (0.0%) |
| Total | 12 (37.5%) | 20 (62.5%) |
Employment Characteristics in Magnolia
Employment by Class of Employer in Magnolia
Among the 1,168 employed individuals in Magnolia, private company employees (918 | 78.6%), self-employed (incorporated) (67 | 5.7%), and local government employees (60 | 5.1%) make up the most common classes of employment.
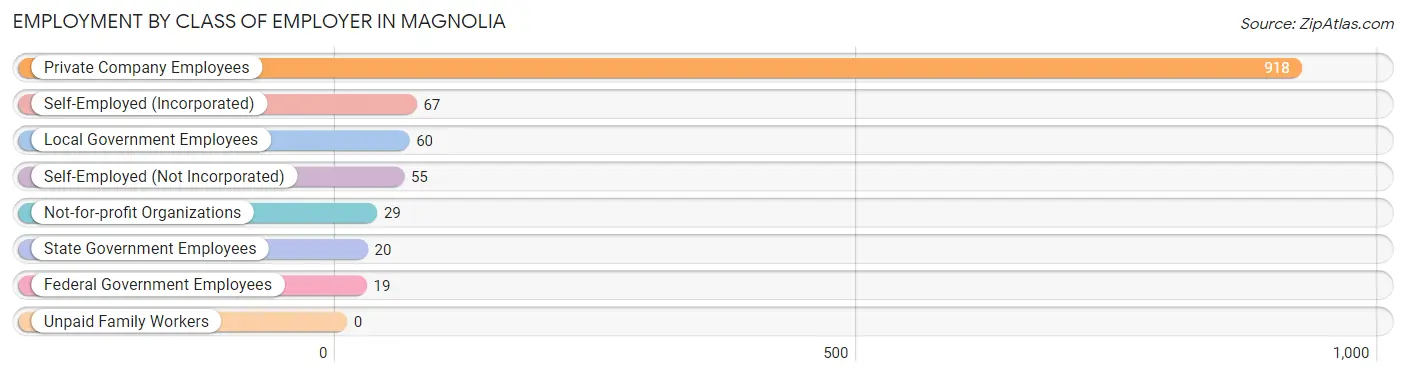
| Employer Class | # Employees | % Employees |
| Private Company Employees | 918 | 78.6% |
| Self-Employed (Incorporated) | 67 | 5.7% |
| Self-Employed (Not Incorporated) | 55 | 4.7% |
| Not-for-profit Organizations | 29 | 2.5% |
| Local Government Employees | 60 | 5.1% |
| State Government Employees | 20 | 1.7% |
| Federal Government Employees | 19 | 1.6% |
| Unpaid Family Workers | 0 | 0.0% |
| Total | 1,168 | 100.0% |
Employment Status by Age in Magnolia
According to the labor force statistics for Magnolia, out of the total population over 16 years of age (2,038), 62.0% or 1,264 individuals are in the labor force, with 1.0% or 13 of them unemployed. The age group with the highest labor force participation rate is 25 to 29 years, with 90.7% or 147 individuals in the labor force. Within the labor force, the 16 to 19 years age range has the highest percentage of unemployed individuals, with 25.0% or 7 of them being unemployed.
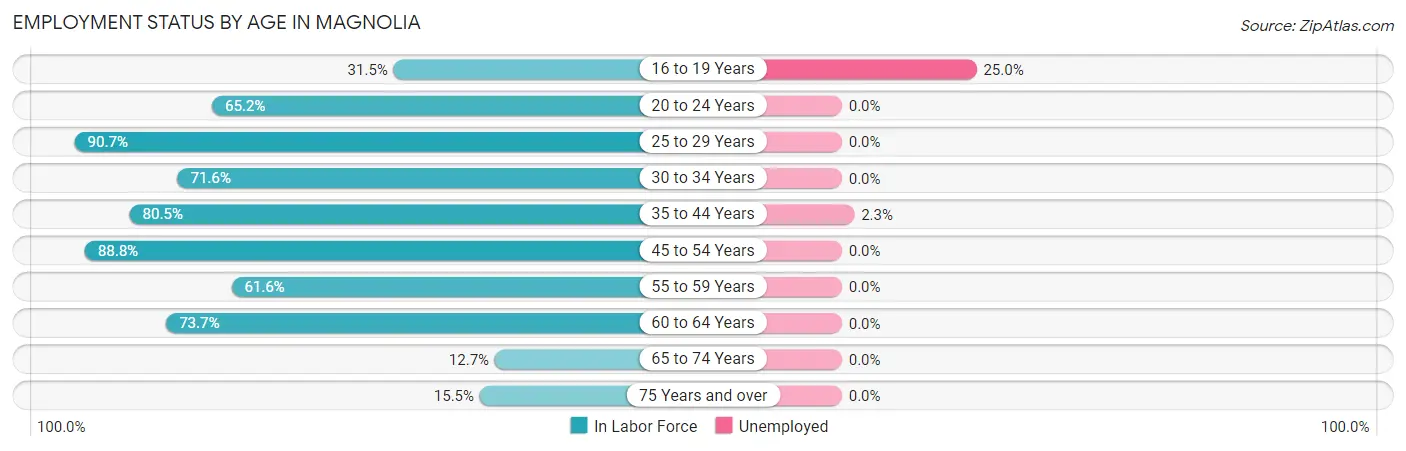
| Age Bracket | In Labor Force | Unemployed |
| 16 to 19 Years | 28 (31.5%) | 7 (25.0%) |
| 20 to 24 Years | 189 (65.2%) | 0 (0.0%) |
| 25 to 29 Years | 147 (90.7%) | 0 (0.0%) |
| 30 to 34 Years | 111 (71.6%) | 0 (0.0%) |
| 35 to 44 Years | 260 (80.5%) | 6 (2.3%) |
| 45 to 54 Years | 206 (88.8%) | 0 (0.0%) |
| 55 to 59 Years | 106 (61.6%) | 0 (0.0%) |
| 60 to 64 Years | 160 (73.7%) | 0 (0.0%) |
| 65 to 74 Years | 26 (12.7%) | 0 (0.0%) |
| 75 Years and over | 30 (15.5%) | 0 (0.0%) |
| Total | 1,264 (62.0%) | 13 (1.0%) |
Employment Status by Educational Attainment in Magnolia
According to labor force statistics for Magnolia, 78.5% of individuals (990) out of the total population between 25 and 64 years of age (1,261) are in the labor force, with 0.6% or 6 of them being unemployed. The group with the highest labor force participation rate are those with the educational attainment of bachelor's degree or higher, with 98.4% or 368 individuals in the labor force. Within the labor force, individuals with bachelor's degree or higher education have the highest percentage of unemployment, with 1.1% or 4 of them being unemployed.
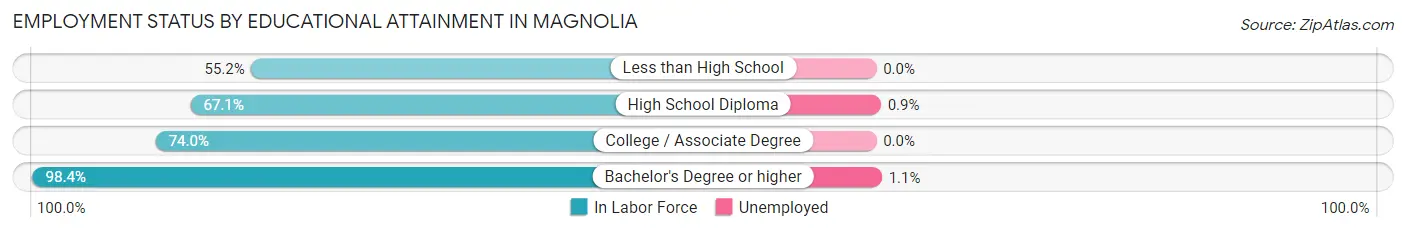
| Educational Attainment | In Labor Force | Unemployed |
| Less than High School | 32 (55.2%) | 0 (0.0%) |
| High School Diploma | 226 (67.1%) | 3 (0.9%) |
| College / Associate Degree | 364 (74.0%) | 0 (0.0%) |
| Bachelor's Degree or higher | 368 (98.4%) | 4 (1.1%) |
| Total | 990 (78.5%) | 8 (0.6%) |
Employment Occupations by Sex in Magnolia
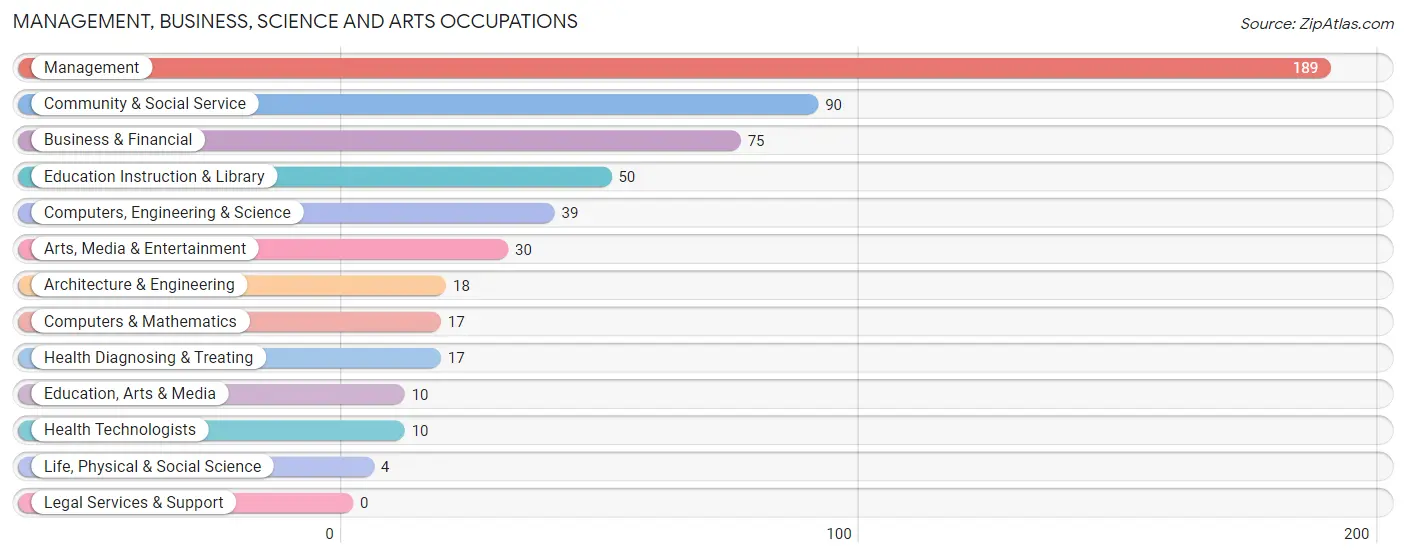
Management, Business, Science and Arts Occupations
The most common Management, Business, Science and Arts occupations in Magnolia are Management (189 | 15.1%), Community & Social Service (90 | 7.2%), Business & Financial (75 | 6.0%), Education Instruction & Library (50 | 4.0%), and Computers, Engineering & Science (39 | 3.1%).
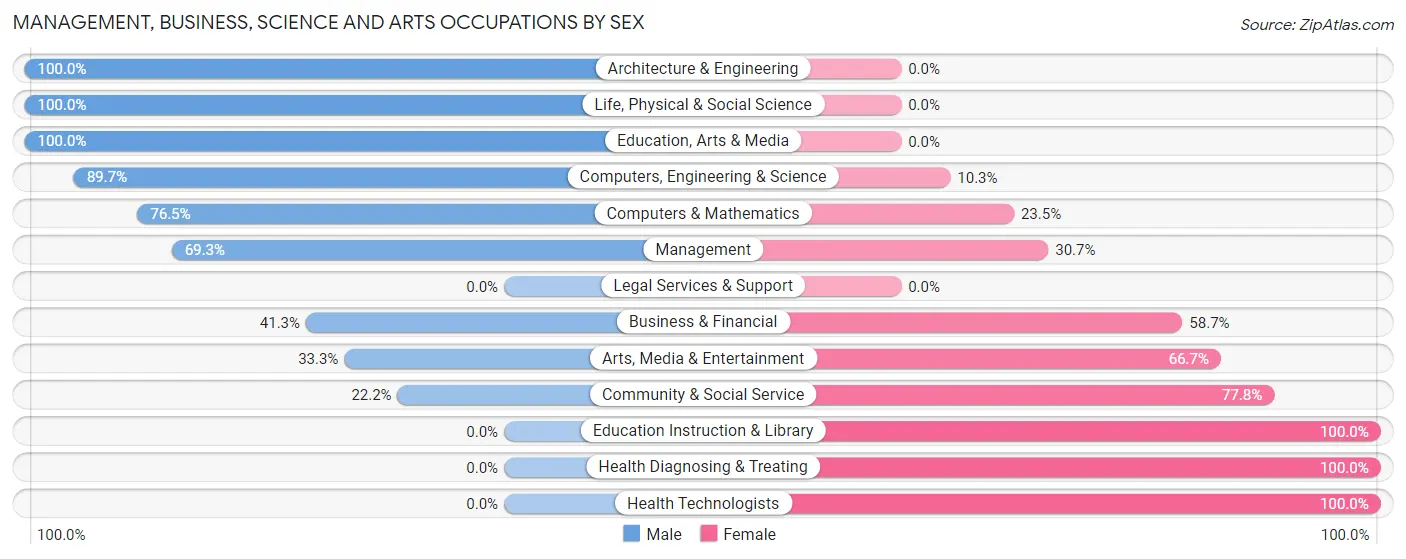
Management, Business, Science and Arts Occupations by Sex
Within the Management, Business, Science and Arts occupations in Magnolia, the most male-oriented occupations are Architecture & Engineering (100.0%), Life, Physical & Social Science (100.0%), and Education, Arts & Media (100.0%), while the most female-oriented occupations are Education Instruction & Library (100.0%), Health Diagnosing & Treating (100.0%), and Health Technologists (100.0%).
| Occupation | Male | Female |
| Management | 131 (69.3%) | 58 (30.7%) |
| Business & Financial | 31 (41.3%) | 44 (58.7%) |
| Computers, Engineering & Science | 35 (89.7%) | 4 (10.3%) |
| Computers & Mathematics | 13 (76.5%) | 4 (23.5%) |
| Architecture & Engineering | 18 (100.0%) | 0 (0.0%) |
| Life, Physical & Social Science | 4 (100.0%) | 0 (0.0%) |
| Community & Social Service | 20 (22.2%) | 70 (77.8%) |
| Education, Arts & Media | 10 (100.0%) | 0 (0.0%) |
| Legal Services & Support | 0 (0.0%) | 0 (0.0%) |
| Education Instruction & Library | 0 (0.0%) | 50 (100.0%) |
| Arts, Media & Entertainment | 10 (33.3%) | 20 (66.7%) |
| Health Diagnosing & Treating | 0 (0.0%) | 17 (100.0%) |
| Health Technologists | 0 (0.0%) | 10 (100.0%) |
| Total (Category) | 217 (52.9%) | 193 (47.1%) |
| Total (Overall) | 816 (65.3%) | 434 (34.7%) |
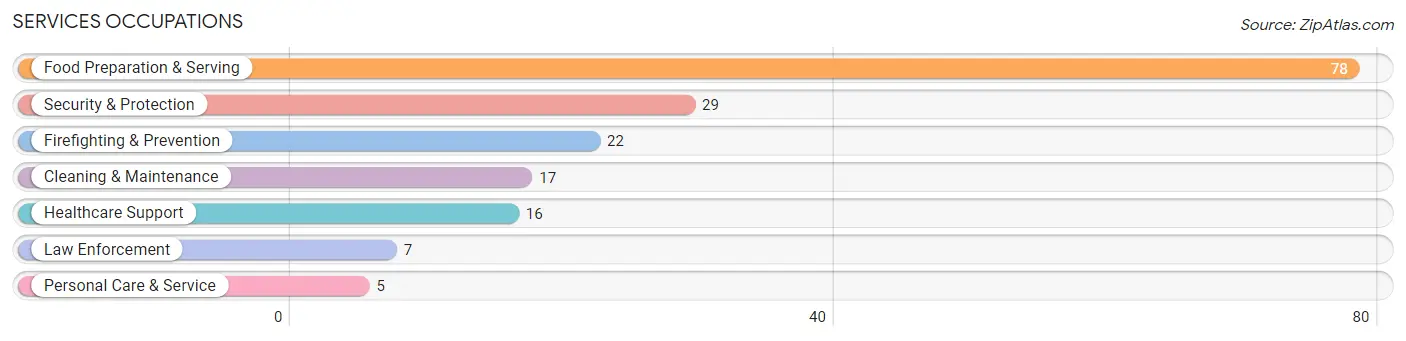
Services Occupations
The most common Services occupations in Magnolia are Food Preparation & Serving (78 | 6.2%), Security & Protection (29 | 2.3%), Firefighting & Prevention (22 | 1.8%), Cleaning & Maintenance (17 | 1.4%), and Healthcare Support (16 | 1.3%).
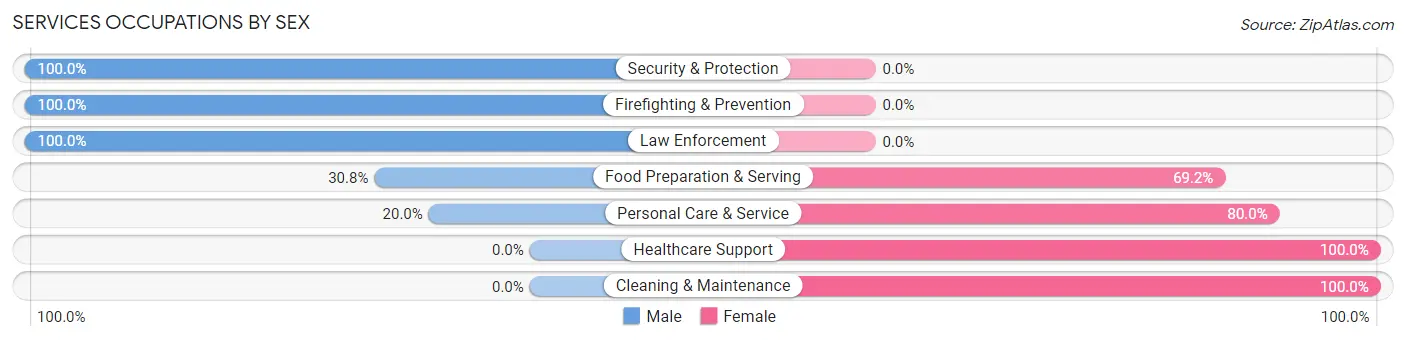
Services Occupations by Sex
Within the Services occupations in Magnolia, the most male-oriented occupations are Security & Protection (100.0%), Firefighting & Prevention (100.0%), and Law Enforcement (100.0%), while the most female-oriented occupations are Healthcare Support (100.0%), Cleaning & Maintenance (100.0%), and Personal Care & Service (80.0%).
| Occupation | Male | Female |
| Healthcare Support | 0 (0.0%) | 16 (100.0%) |
| Security & Protection | 29 (100.0%) | 0 (0.0%) |
| Firefighting & Prevention | 22 (100.0%) | 0 (0.0%) |
| Law Enforcement | 7 (100.0%) | 0 (0.0%) |
| Food Preparation & Serving | 24 (30.8%) | 54 (69.2%) |
| Cleaning & Maintenance | 0 (0.0%) | 17 (100.0%) |
| Personal Care & Service | 1 (20.0%) | 4 (80.0%) |
| Total (Category) | 54 (37.2%) | 91 (62.8%) |
| Total (Overall) | 816 (65.3%) | 434 (34.7%) |
Sales and Office Occupations
The most common Sales and Office occupations in Magnolia are Sales & Related (209 | 16.7%), and Office & Administration (109 | 8.7%).
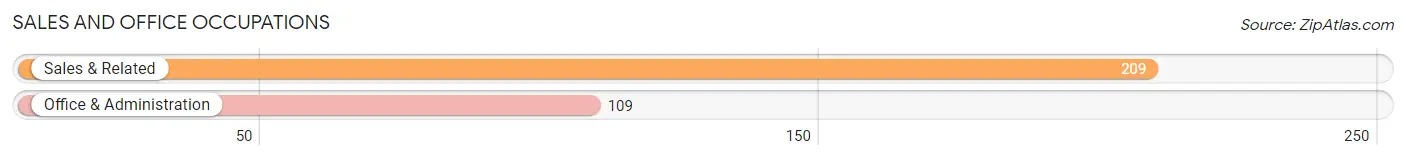
Sales and Office Occupations by Sex
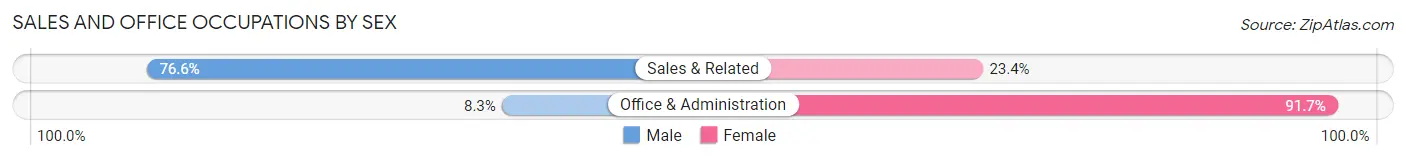
| Occupation | Male | Female |
| Sales & Related | 160 (76.6%) | 49 (23.4%) |
| Office & Administration | 9 (8.3%) | 100 (91.7%) |
| Total (Category) | 169 (53.1%) | 149 (46.9%) |
| Total (Overall) | 816 (65.3%) | 434 (34.7%) |
Natural Resources, Construction and Maintenance Occupations
The most common Natural Resources, Construction and Maintenance occupations in Magnolia are Construction & Extraction (156 | 12.5%), and Installation, Maintenance & Repair (49 | 3.9%).
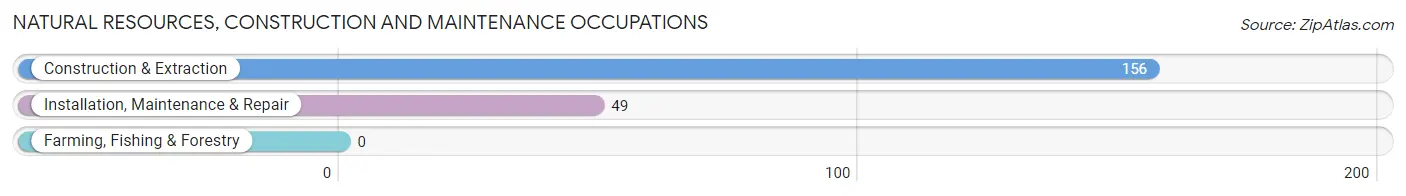
Natural Resources, Construction and Maintenance Occupations by Sex
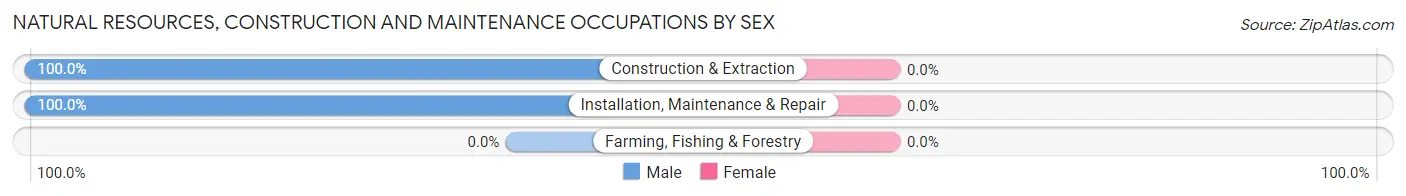
| Occupation | Male | Female |
| Farming, Fishing & Forestry | 0 (0.0%) | 0 (0.0%) |
| Construction & Extraction | 156 (100.0%) | 0 (0.0%) |
| Installation, Maintenance & Repair | 49 (100.0%) | 0 (0.0%) |
| Total (Category) | 205 (100.0%) | 0 (0.0%) |
| Total (Overall) | 816 (65.3%) | 434 (34.7%) |
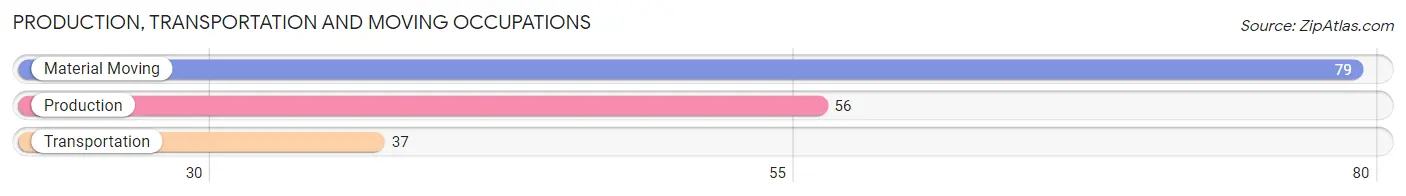
Production, Transportation and Moving Occupations
The most common Production, Transportation and Moving occupations in Magnolia are Material Moving (79 | 6.3%), Production (56 | 4.5%), and Transportation (37 | 3.0%).
Production, Transportation and Moving Occupations by Sex
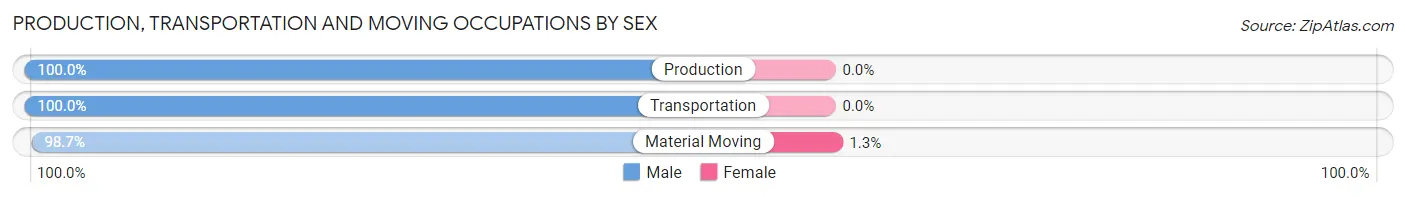
| Occupation | Male | Female |
| Production | 56 (100.0%) | 0 (0.0%) |
| Transportation | 37 (100.0%) | 0 (0.0%) |
| Material Moving | 78 (98.7%) | 1 (1.3%) |
| Total (Category) | 171 (99.4%) | 1 (0.6%) |
| Total (Overall) | 816 (65.3%) | 434 (34.7%) |
Employment Industries by Sex in Magnolia
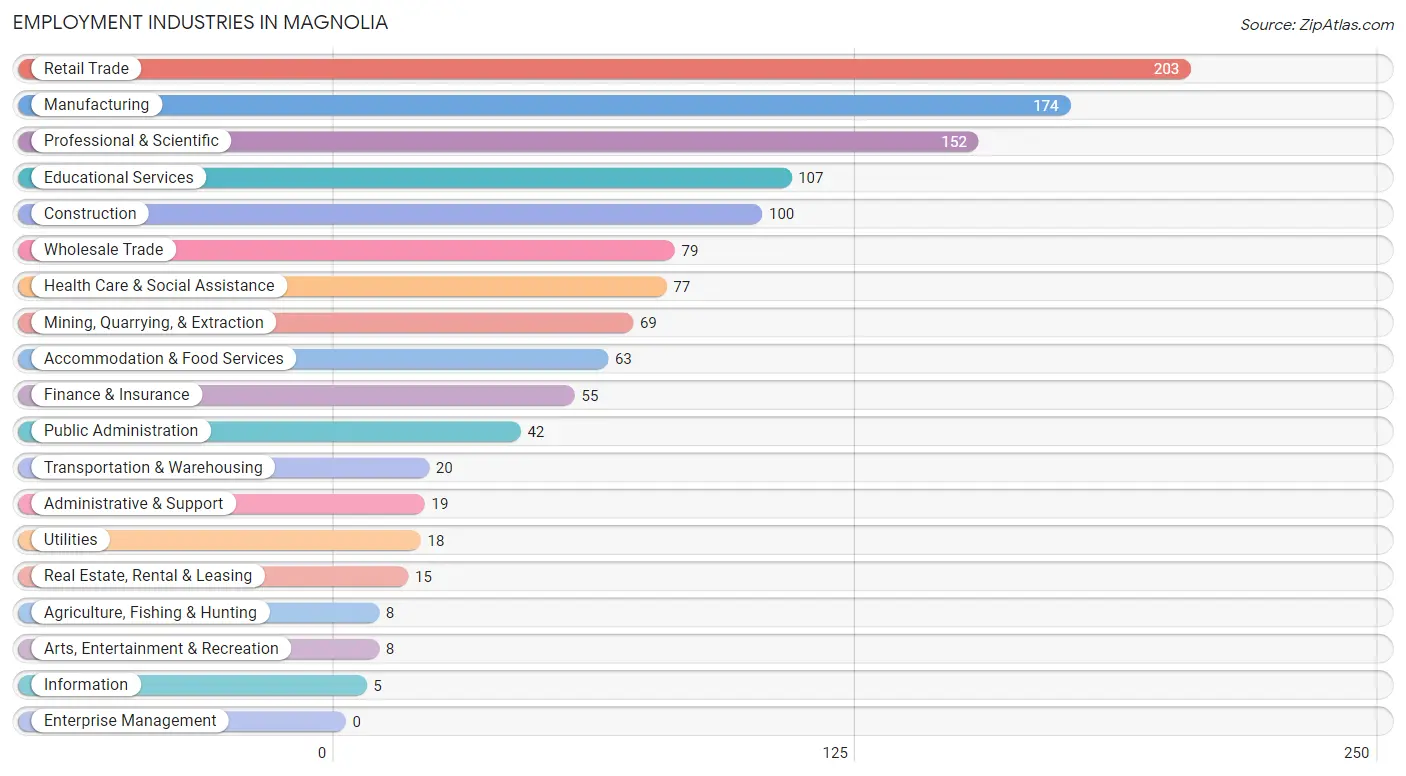
Employment Industries in Magnolia
The major employment industries in Magnolia include Retail Trade (203 | 16.2%), Manufacturing (174 | 13.9%), Professional & Scientific (152 | 12.2%), Educational Services (107 | 8.6%), and Construction (100 | 8.0%).
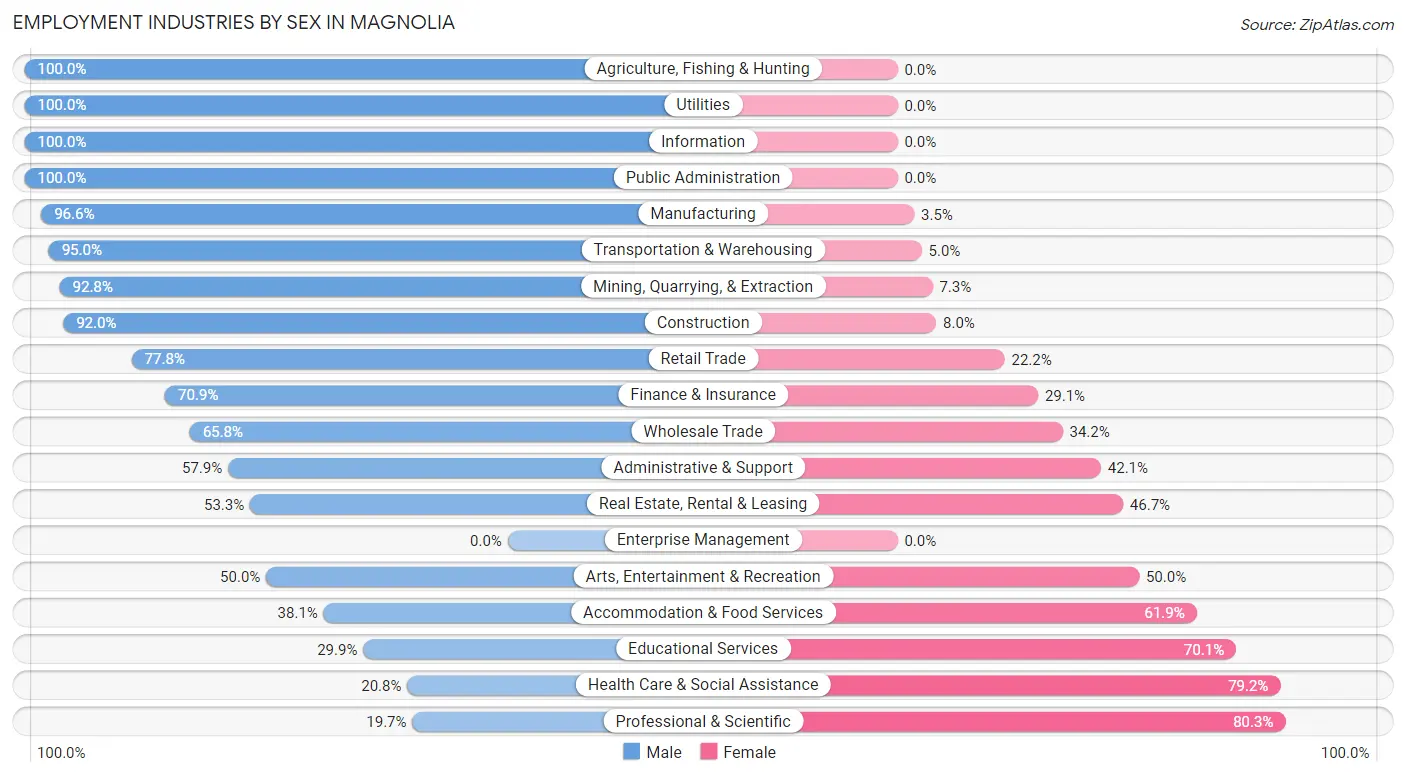
Employment Industries by Sex in Magnolia
The Magnolia industries that see more men than women are Agriculture, Fishing & Hunting (100.0%), Utilities (100.0%), and Information (100.0%), whereas the industries that tend to have a higher number of women are Professional & Scientific (80.3%), Health Care & Social Assistance (79.2%), and Educational Services (70.1%).
| Industry | Male | Female |
| Agriculture, Fishing & Hunting | 8 (100.0%) | 0 (0.0%) |
| Mining, Quarrying, & Extraction | 64 (92.7%) | 5 (7.2%) |
| Construction | 92 (92.0%) | 8 (8.0%) |
| Manufacturing | 168 (96.6%) | 6 (3.5%) |
| Wholesale Trade | 52 (65.8%) | 27 (34.2%) |
| Retail Trade | 158 (77.8%) | 45 (22.2%) |
| Transportation & Warehousing | 19 (95.0%) | 1 (5.0%) |
| Utilities | 18 (100.0%) | 0 (0.0%) |
| Information | 5 (100.0%) | 0 (0.0%) |
| Finance & Insurance | 39 (70.9%) | 16 (29.1%) |
| Real Estate, Rental & Leasing | 8 (53.3%) | 7 (46.7%) |
| Professional & Scientific | 30 (19.7%) | 122 (80.3%) |
| Enterprise Management | 0 (0.0%) | 0 (0.0%) |
| Administrative & Support | 11 (57.9%) | 8 (42.1%) |
| Educational Services | 32 (29.9%) | 75 (70.1%) |
| Health Care & Social Assistance | 16 (20.8%) | 61 (79.2%) |
| Arts, Entertainment & Recreation | 4 (50.0%) | 4 (50.0%) |
| Accommodation & Food Services | 24 (38.1%) | 39 (61.9%) |
| Public Administration | 42 (100.0%) | 0 (0.0%) |
| Total | 816 (65.3%) | 434 (34.7%) |
Education in Magnolia
School Enrollment in Magnolia
The most common levels of schooling among the 662 students in Magnolia are middle school (188 | 28.4%), elementary school (166 | 25.1%), and high school (102 | 15.4%).
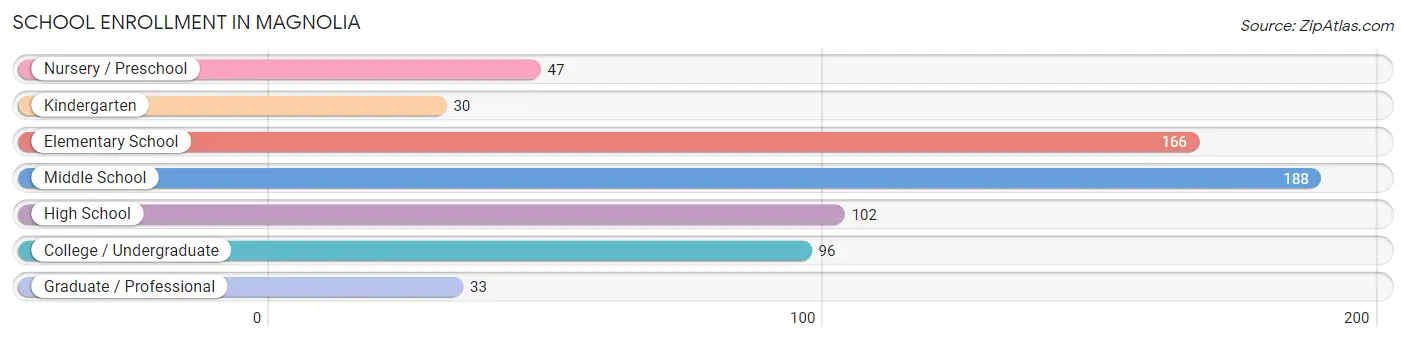
| School Level | # Students | % Students |
| Nursery / Preschool | 47 | 7.1% |
| Kindergarten | 30 | 4.5% |
| Elementary School | 166 | 25.1% |
| Middle School | 188 | 28.4% |
| High School | 102 | 15.4% |
| College / Undergraduate | 96 | 14.5% |
| Graduate / Professional | 33 | 5.0% |
| Total | 662 | 100.0% |
School Enrollment by Age by Funding Source in Magnolia
Out of a total of 662 students who are enrolled in schools in Magnolia, 63 (9.5%) attend a private institution, while the remaining 599 (90.5%) are enrolled in public schools. The age group of 10 to 14 year olds has the highest likelihood of being enrolled in private schools, with 39 (19.3% in the age bracket) enrolled. Conversely, the age group of 3 to 4 year olds has the lowest likelihood of being enrolled in a private school, with 16 (100.0% in the age bracket) attending a public institution.
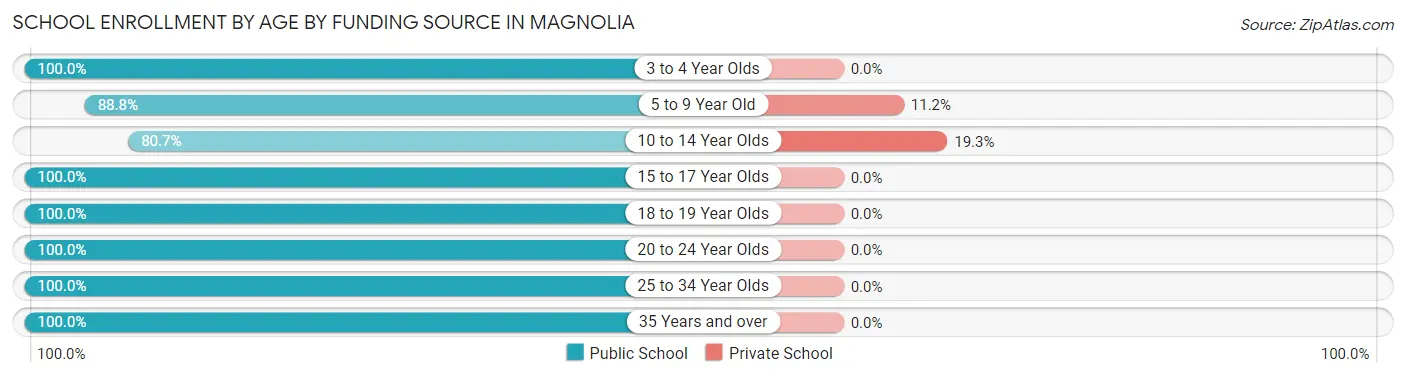
| Age Bracket | Public School | Private School |
| 3 to 4 Year Olds | 16 (100.0%) | 0 (0.0%) |
| 5 to 9 Year Old | 190 (88.8%) | 24 (11.2%) |
| 10 to 14 Year Olds | 163 (80.7%) | 39 (19.3%) |
| 15 to 17 Year Olds | 50 (100.0%) | 0 (0.0%) |
| 18 to 19 Year Olds | 51 (100.0%) | 0 (0.0%) |
| 20 to 24 Year Olds | 63 (100.0%) | 0 (0.0%) |
| 25 to 34 Year Olds | 11 (100.0%) | 0 (0.0%) |
| 35 Years and over | 55 (100.0%) | 0 (0.0%) |
| Total | 599 (90.5%) | 63 (9.5%) |
Educational Attainment by Field of Study in Magnolia
Arts & humanities (131 | 27.1%), business (104 | 21.5%), bio, nature & agricultural (78 | 16.2%), education (59 | 12.2%), and engineering (27 | 5.6%) are the most common fields of study among 483 individuals in Magnolia who have obtained a bachelor's degree or higher.
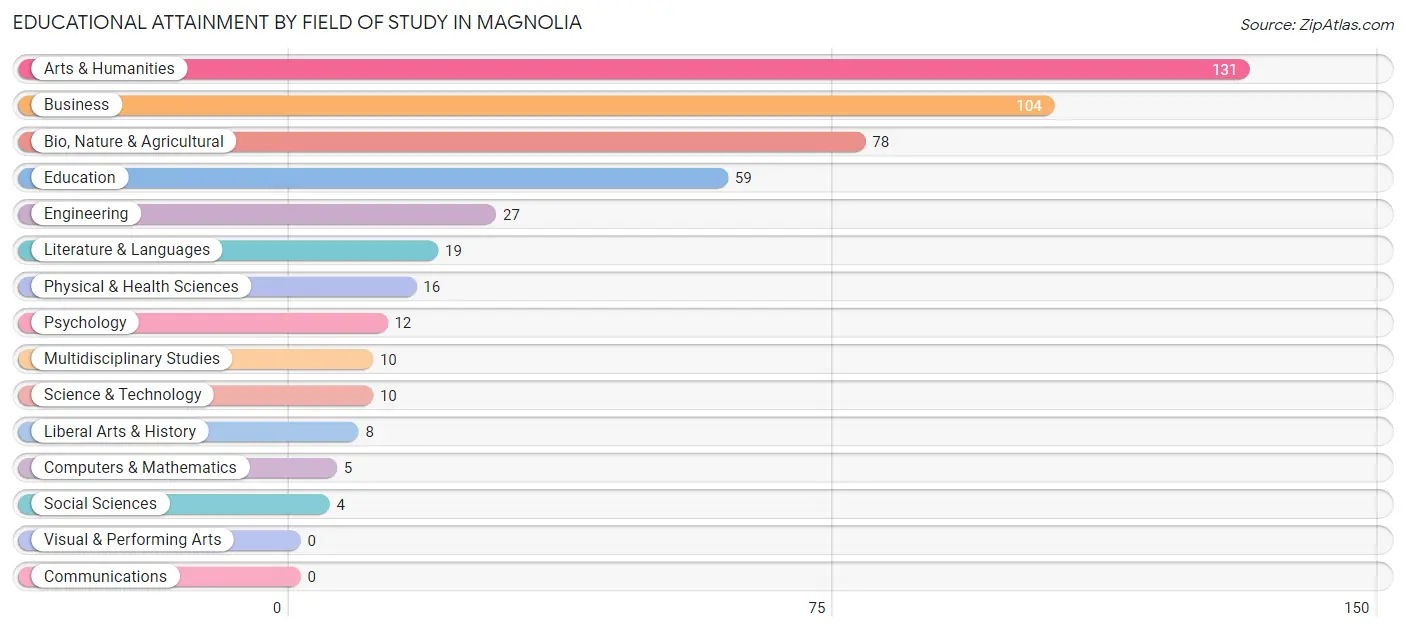
| Field of Study | # Graduates | % Graduates |
| Computers & Mathematics | 5 | 1.0% |
| Bio, Nature & Agricultural | 78 | 16.2% |
| Physical & Health Sciences | 16 | 3.3% |
| Psychology | 12 | 2.5% |
| Social Sciences | 4 | 0.8% |
| Engineering | 27 | 5.6% |
| Multidisciplinary Studies | 10 | 2.1% |
| Science & Technology | 10 | 2.1% |
| Business | 104 | 21.5% |
| Education | 59 | 12.2% |
| Literature & Languages | 19 | 3.9% |
| Liberal Arts & History | 8 | 1.7% |
| Visual & Performing Arts | 0 | 0.0% |
| Communications | 0 | 0.0% |
| Arts & Humanities | 131 | 27.1% |
| Total | 483 | 100.0% |
Transportation & Commute in Magnolia
Vehicle Availability by Sex in Magnolia
The most prevalent vehicle ownership categories in Magnolia are males with 2 vehicles (291, accounting for 38.5%) and females with 2 vehicles (180, making up 70.6%).
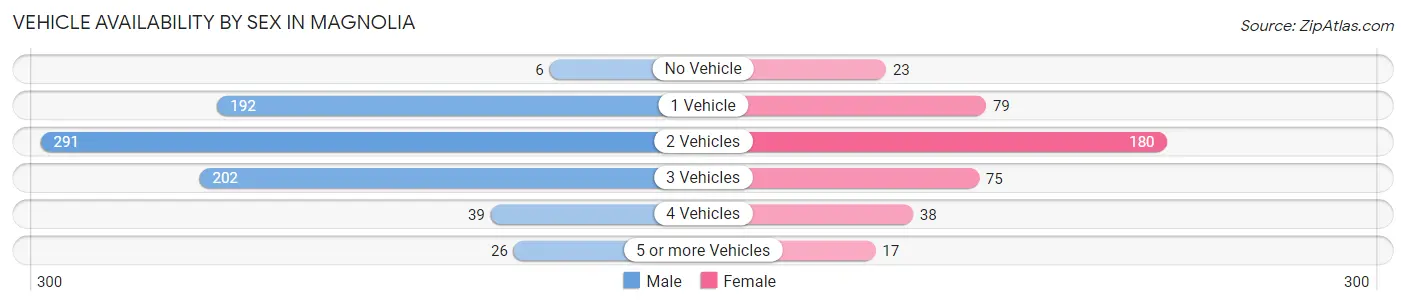
| Vehicles Available | Male | Female |
| No Vehicle | 6 (0.8%) | 23 (5.6%) |
| 1 Vehicle | 192 (25.4%) | 79 (19.2%) |
| 2 Vehicles | 291 (38.5%) | 180 (43.7%) |
| 3 Vehicles | 202 (26.7%) | 75 (18.2%) |
| 4 Vehicles | 39 (5.2%) | 38 (9.2%) |
| 5 or more Vehicles | 26 (3.4%) | 17 (4.1%) |
| Total | 756 (100.0%) | 412 (100.0%) |
Commute Time in Magnolia
The most frequently occuring commute durations in Magnolia are 45 to 59 minutes (229 commuters, 23.0%), 30 to 34 minutes (158 commuters, 15.9%), and 60 to 89 minutes (130 commuters, 13.1%).
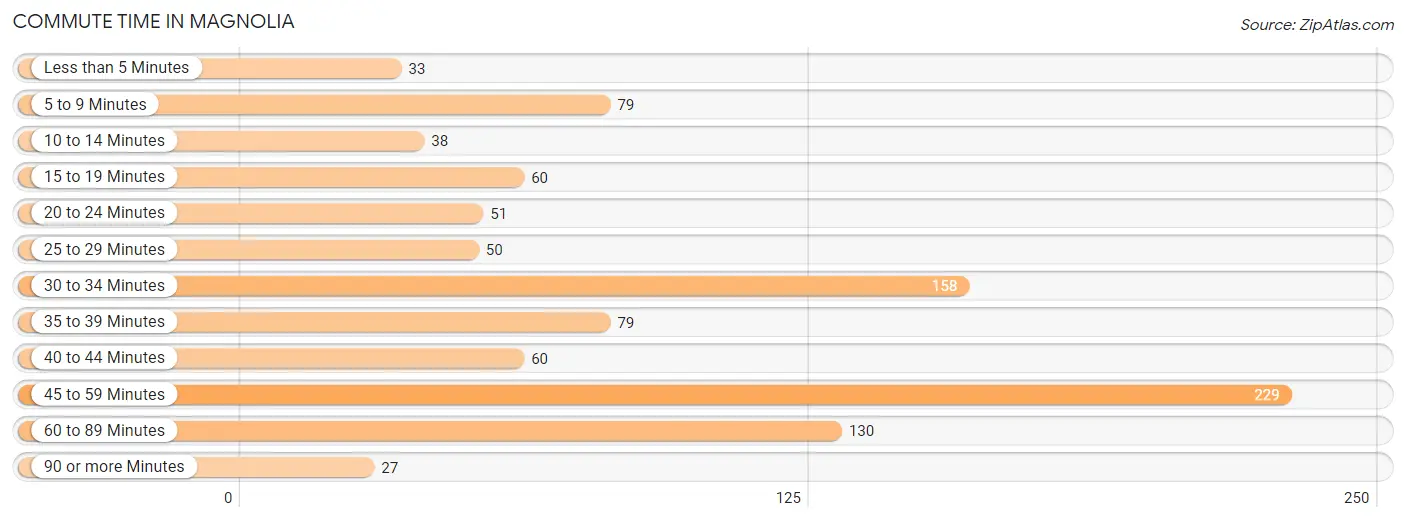
| Commute Time | # Commuters | % Commuters |
| Less than 5 Minutes | 33 | 3.3% |
| 5 to 9 Minutes | 79 | 8.0% |
| 10 to 14 Minutes | 38 | 3.8% |
| 15 to 19 Minutes | 60 | 6.0% |
| 20 to 24 Minutes | 51 | 5.1% |
| 25 to 29 Minutes | 50 | 5.0% |
| 30 to 34 Minutes | 158 | 15.9% |
| 35 to 39 Minutes | 79 | 8.0% |
| 40 to 44 Minutes | 60 | 6.0% |
| 45 to 59 Minutes | 229 | 23.0% |
| 60 to 89 Minutes | 130 | 13.1% |
| 90 or more Minutes | 27 | 2.7% |
Commute Time by Sex in Magnolia
The most common commute times in Magnolia are 45 to 59 minutes (102 commuters, 16.9%) for males and 45 to 59 minutes (127 commuters, 32.4%) for females.
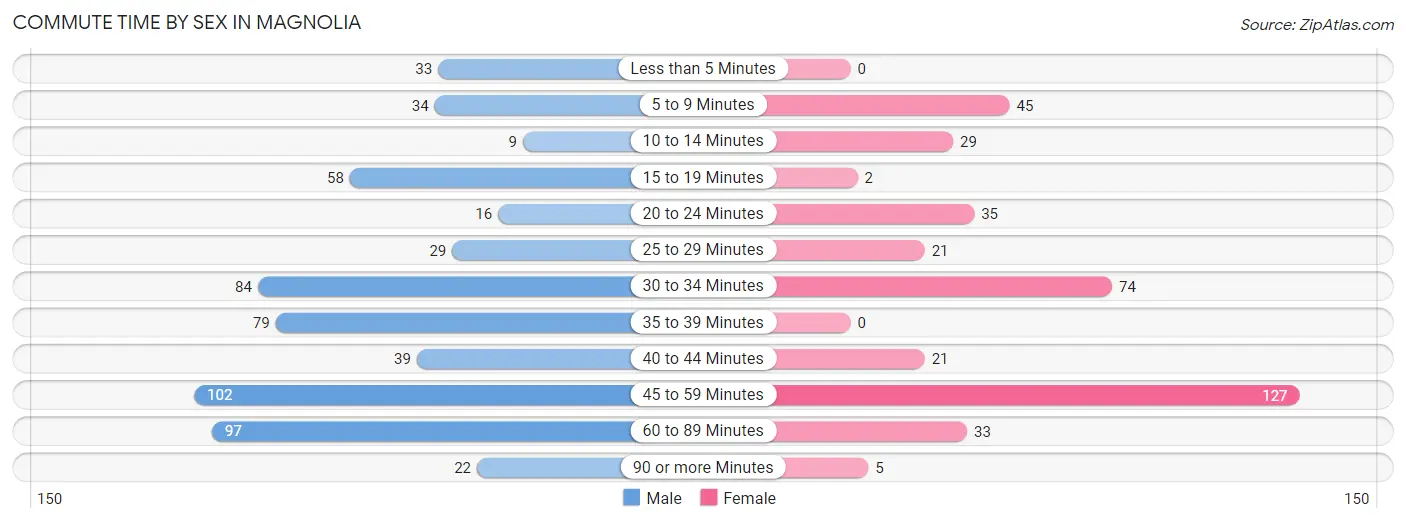
| Commute Time | Male | Female |
| Less than 5 Minutes | 33 (5.5%) | 0 (0.0%) |
| 5 to 9 Minutes | 34 (5.7%) | 45 (11.5%) |
| 10 to 14 Minutes | 9 (1.5%) | 29 (7.4%) |
| 15 to 19 Minutes | 58 (9.6%) | 2 (0.5%) |
| 20 to 24 Minutes | 16 (2.7%) | 35 (8.9%) |
| 25 to 29 Minutes | 29 (4.8%) | 21 (5.4%) |
| 30 to 34 Minutes | 84 (14.0%) | 74 (18.9%) |
| 35 to 39 Minutes | 79 (13.1%) | 0 (0.0%) |
| 40 to 44 Minutes | 39 (6.5%) | 21 (5.4%) |
| 45 to 59 Minutes | 102 (16.9%) | 127 (32.4%) |
| 60 to 89 Minutes | 97 (16.1%) | 33 (8.4%) |
| 90 or more Minutes | 22 (3.6%) | 5 (1.3%) |
Time of Departure to Work by Sex in Magnolia
The most frequent times of departure to work in Magnolia are 6:00 AM to 6:29 AM (153, 25.4%) for males and 6:00 AM to 6:29 AM (116, 29.6%) for females.
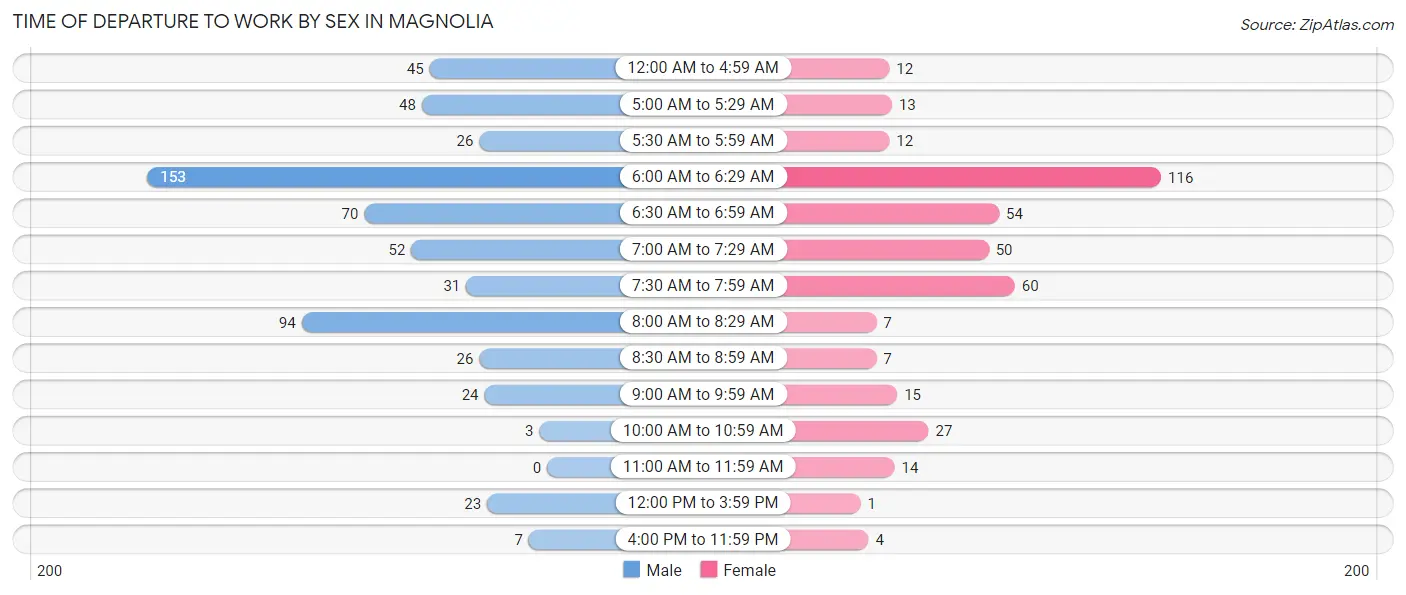
| Time of Departure | Male | Female |
| 12:00 AM to 4:59 AM | 45 (7.5%) | 12 (3.1%) |
| 5:00 AM to 5:29 AM | 48 (8.0%) | 13 (3.3%) |
| 5:30 AM to 5:59 AM | 26 (4.3%) | 12 (3.1%) |
| 6:00 AM to 6:29 AM | 153 (25.4%) | 116 (29.6%) |
| 6:30 AM to 6:59 AM | 70 (11.6%) | 54 (13.8%) |
| 7:00 AM to 7:29 AM | 52 (8.6%) | 50 (12.8%) |
| 7:30 AM to 7:59 AM | 31 (5.1%) | 60 (15.3%) |
| 8:00 AM to 8:29 AM | 94 (15.6%) | 7 (1.8%) |
| 8:30 AM to 8:59 AM | 26 (4.3%) | 7 (1.8%) |
| 9:00 AM to 9:59 AM | 24 (4.0%) | 15 (3.8%) |
| 10:00 AM to 10:59 AM | 3 (0.5%) | 27 (6.9%) |
| 11:00 AM to 11:59 AM | 0 (0.0%) | 14 (3.6%) |
| 12:00 PM to 3:59 PM | 23 (3.8%) | 1 (0.3%) |
| 4:00 PM to 11:59 PM | 7 (1.2%) | 4 (1.0%) |
| Total | 602 (100.0%) | 392 (100.0%) |
Housing Occupancy in Magnolia
Occupancy by Ownership in Magnolia
Of the total 1,011 dwellings in Magnolia, owner-occupied units account for 563 (55.7%), while renter-occupied units make up 448 (44.3%).
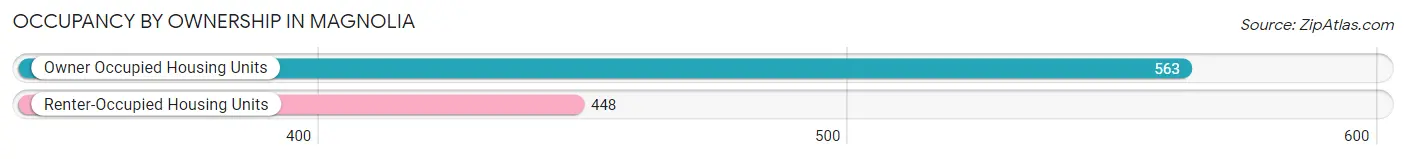
| Occupancy | # Housing Units | % Housing Units |
| Owner Occupied Housing Units | 563 | 55.7% |
| Renter-Occupied Housing Units | 448 | 44.3% |
| Total Occupied Housing Units | 1,011 | 100.0% |
Occupancy by Household Size in Magnolia
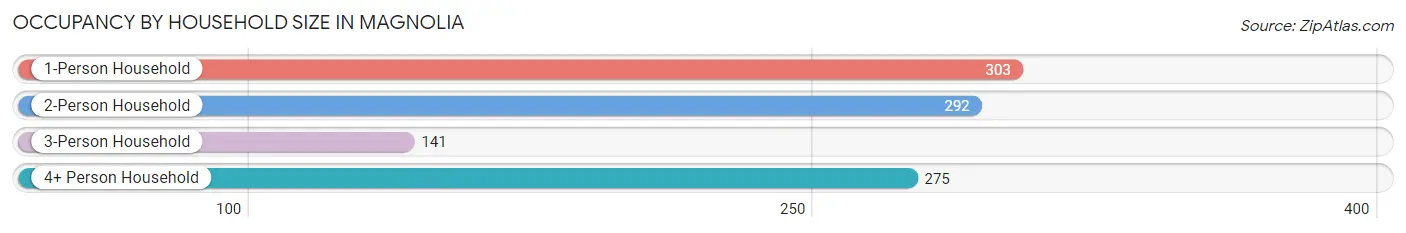
| Household Size | # Housing Units | % Housing Units |
| 1-Person Household | 303 | 30.0% |
| 2-Person Household | 292 | 28.9% |
| 3-Person Household | 141 | 14.0% |
| 4+ Person Household | 275 | 27.2% |
| Total Housing Units | 1,011 | 100.0% |
Occupancy by Ownership by Household Size in Magnolia
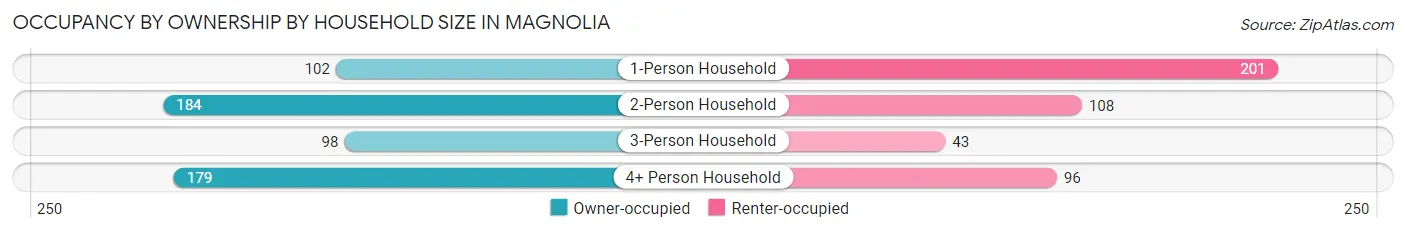
| Household Size | Owner-occupied | Renter-occupied |
| 1-Person Household | 102 (33.7%) | 201 (66.3%) |
| 2-Person Household | 184 (63.0%) | 108 (37.0%) |
| 3-Person Household | 98 (69.5%) | 43 (30.5%) |
| 4+ Person Household | 179 (65.1%) | 96 (34.9%) |
| Total Housing Units | 563 (55.7%) | 448 (44.3%) |
Occupancy by Educational Attainment in Magnolia
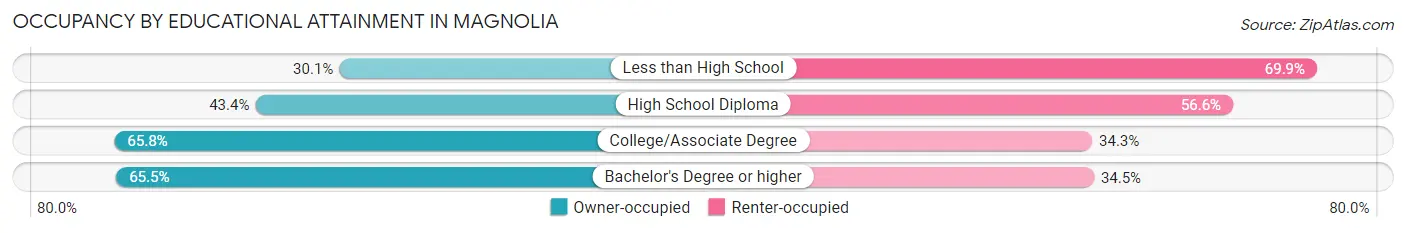
| Household Size | Owner-occupied | Renter-occupied |
| Less than High School | 28 (30.1%) | 65 (69.9%) |
| High School Diploma | 132 (43.4%) | 172 (56.6%) |
| College/Associate Degree | 240 (65.7%) | 125 (34.3%) |
| Bachelor's Degree or higher | 163 (65.5%) | 86 (34.5%) |
Occupancy by Age of Householder in Magnolia
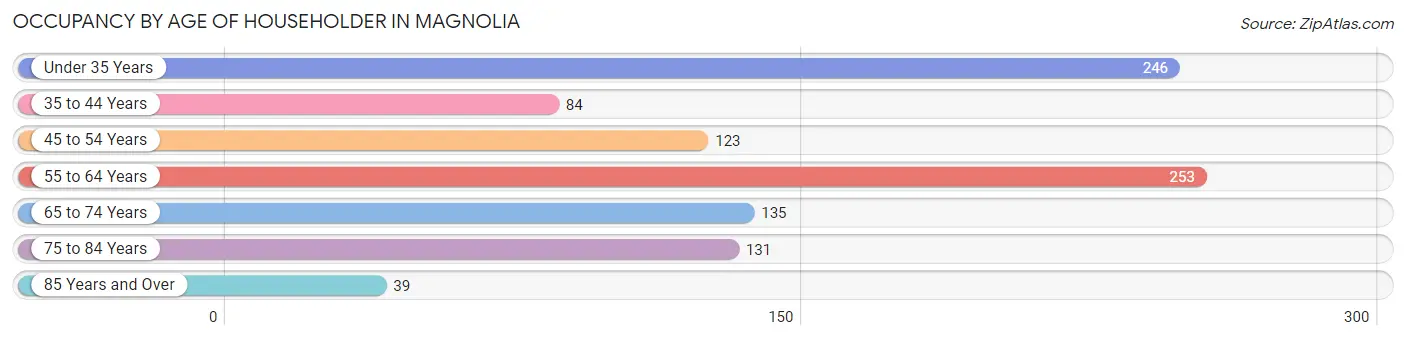
| Age Bracket | # Households | % Households |
| Under 35 Years | 246 | 24.3% |
| 35 to 44 Years | 84 | 8.3% |
| 45 to 54 Years | 123 | 12.2% |
| 55 to 64 Years | 253 | 25.0% |
| 65 to 74 Years | 135 | 13.4% |
| 75 to 84 Years | 131 | 13.0% |
| 85 Years and Over | 39 | 3.9% |
| Total | 1,011 | 100.0% |
Housing Finances in Magnolia
Median Income by Occupancy in Magnolia
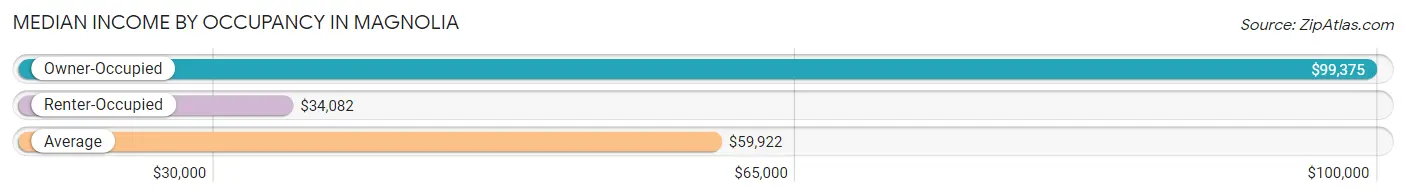
| Occupancy Type | # Households | Median Income |
| Owner-Occupied | 563 (55.7%) | $99,375 |
| Renter-Occupied | 448 (44.3%) | $34,082 |
| Average | 1,011 (100.0%) | $59,922 |
Occupancy by Householder Income Bracket in Magnolia
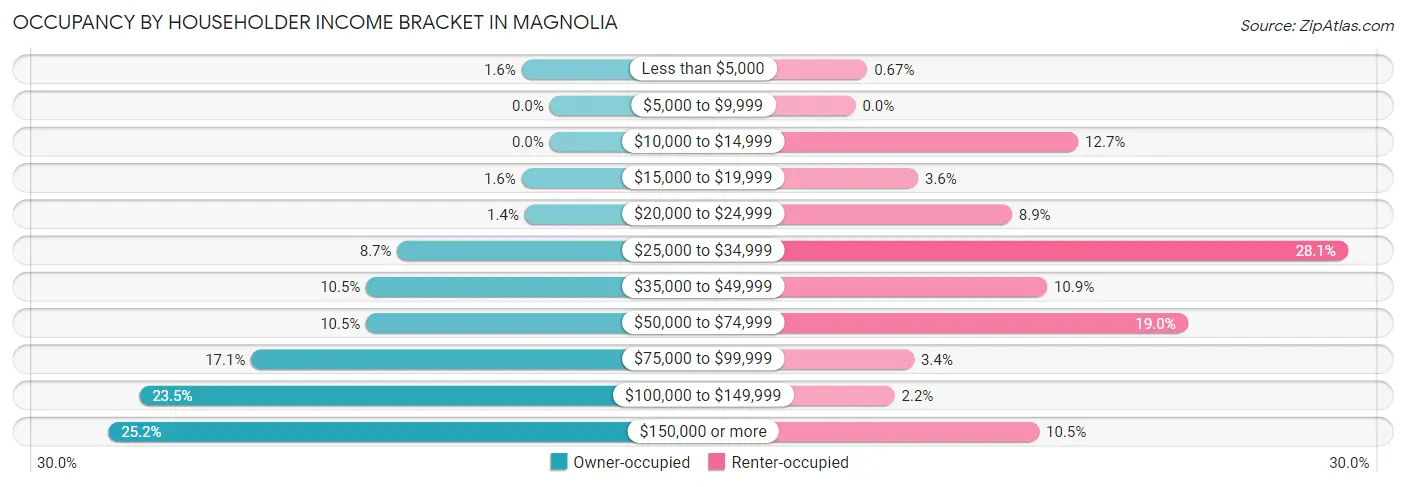
| Income Bracket | Owner-occupied | Renter-occupied |
| Less than $5,000 | 9 (1.6%) | 3 (0.7%) |
| $5,000 to $9,999 | 0 (0.0%) | 0 (0.0%) |
| $10,000 to $14,999 | 0 (0.0%) | 57 (12.7%) |
| $15,000 to $19,999 | 9 (1.6%) | 16 (3.6%) |
| $20,000 to $24,999 | 8 (1.4%) | 40 (8.9%) |
| $25,000 to $34,999 | 49 (8.7%) | 126 (28.1%) |
| $35,000 to $49,999 | 59 (10.5%) | 49 (10.9%) |
| $50,000 to $74,999 | 59 (10.5%) | 85 (19.0%) |
| $75,000 to $99,999 | 96 (17.1%) | 15 (3.4%) |
| $100,000 to $149,999 | 132 (23.4%) | 10 (2.2%) |
| $150,000 or more | 142 (25.2%) | 47 (10.5%) |
| Total | 563 (100.0%) | 448 (100.0%) |
Monthly Housing Cost Tiers in Magnolia
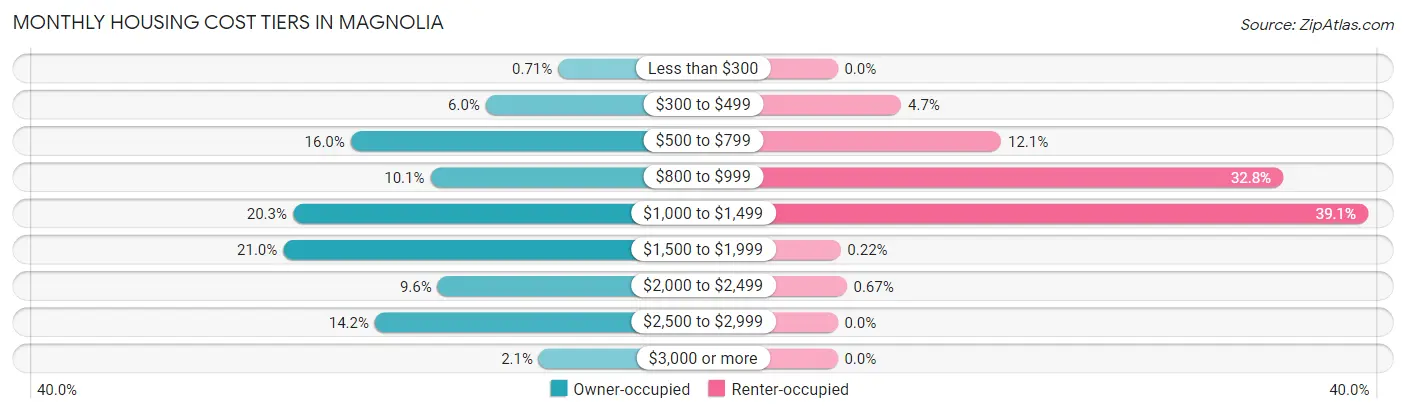
| Monthly Cost | Owner-occupied | Renter-occupied |
| Less than $300 | 4 (0.7%) | 0 (0.0%) |
| $300 to $499 | 34 (6.0%) | 21 (4.7%) |
| $500 to $799 | 90 (16.0%) | 54 (12.0%) |
| $800 to $999 | 57 (10.1%) | 147 (32.8%) |
| $1,000 to $1,499 | 114 (20.3%) | 175 (39.1%) |
| $1,500 to $1,999 | 118 (21.0%) | 1 (0.2%) |
| $2,000 to $2,499 | 54 (9.6%) | 3 (0.7%) |
| $2,500 to $2,999 | 80 (14.2%) | 0 (0.0%) |
| $3,000 or more | 12 (2.1%) | 0 (0.0%) |
| Total | 563 (100.0%) | 448 (100.0%) |
Physical Housing Characteristics in Magnolia
Housing Structures in Magnolia
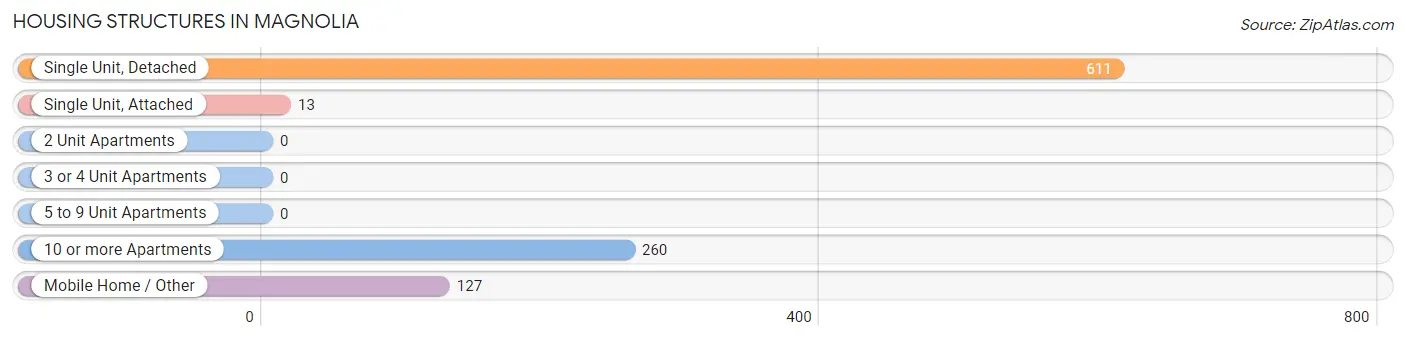
| Structure Type | # Housing Units | % Housing Units |
| Single Unit, Detached | 611 | 60.4% |
| Single Unit, Attached | 13 | 1.3% |
| 2 Unit Apartments | 0 | 0.0% |
| 3 or 4 Unit Apartments | 0 | 0.0% |
| 5 to 9 Unit Apartments | 0 | 0.0% |
| 10 or more Apartments | 260 | 25.7% |
| Mobile Home / Other | 127 | 12.6% |
| Total | 1,011 | 100.0% |
Housing Structures by Occupancy in Magnolia
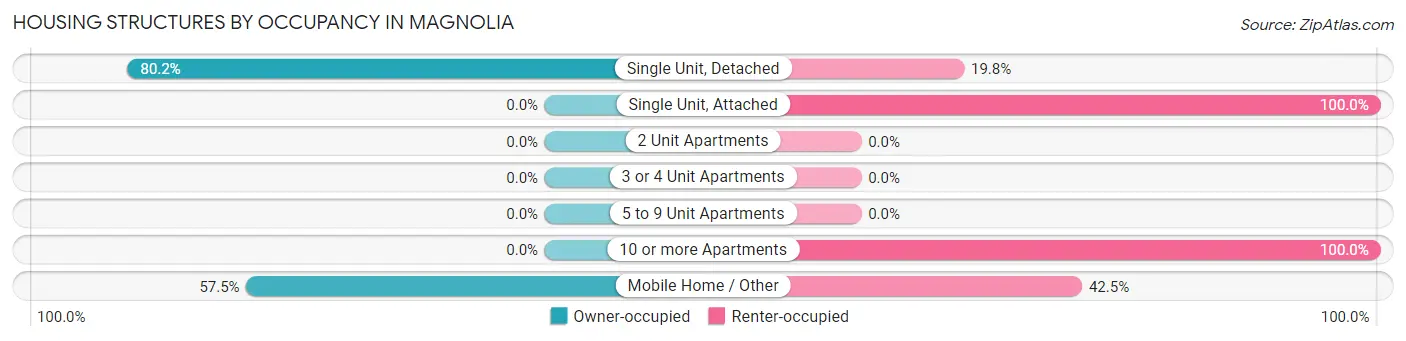
| Structure Type | Owner-occupied | Renter-occupied |
| Single Unit, Detached | 490 (80.2%) | 121 (19.8%) |
| Single Unit, Attached | 0 (0.0%) | 13 (100.0%) |
| 2 Unit Apartments | 0 (0.0%) | 0 (0.0%) |
| 3 or 4 Unit Apartments | 0 (0.0%) | 0 (0.0%) |
| 5 to 9 Unit Apartments | 0 (0.0%) | 0 (0.0%) |
| 10 or more Apartments | 0 (0.0%) | 260 (100.0%) |
| Mobile Home / Other | 73 (57.5%) | 54 (42.5%) |
| Total | 563 (55.7%) | 448 (44.3%) |
Housing Structures by Number of Rooms in Magnolia
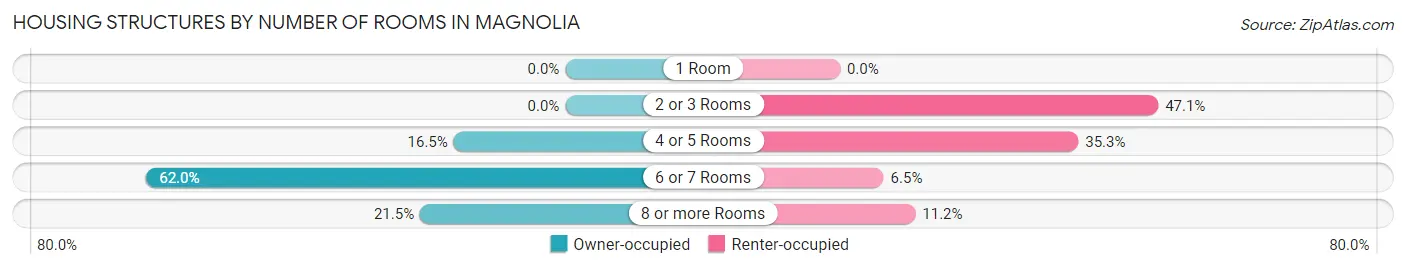
| Number of Rooms | Owner-occupied | Renter-occupied |
| 1 Room | 0 (0.0%) | 0 (0.0%) |
| 2 or 3 Rooms | 0 (0.0%) | 211 (47.1%) |
| 4 or 5 Rooms | 93 (16.5%) | 158 (35.3%) |
| 6 or 7 Rooms | 349 (62.0%) | 29 (6.5%) |
| 8 or more Rooms | 121 (21.5%) | 50 (11.2%) |
| Total | 563 (100.0%) | 448 (100.0%) |
Housing Structure by Heating Type in Magnolia
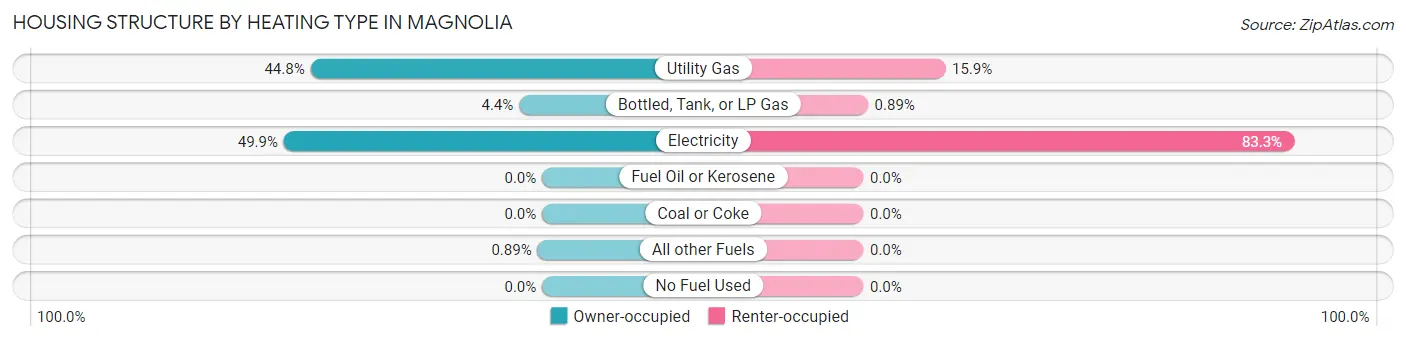
| Heating Type | Owner-occupied | Renter-occupied |
| Utility Gas | 252 (44.8%) | 71 (15.9%) |
| Bottled, Tank, or LP Gas | 25 (4.4%) | 4 (0.9%) |
| Electricity | 281 (49.9%) | 373 (83.3%) |
| Fuel Oil or Kerosene | 0 (0.0%) | 0 (0.0%) |
| Coal or Coke | 0 (0.0%) | 0 (0.0%) |
| All other Fuels | 5 (0.9%) | 0 (0.0%) |
| No Fuel Used | 0 (0.0%) | 0 (0.0%) |
| Total | 563 (100.0%) | 448 (100.0%) |
Household Vehicle Usage in Magnolia
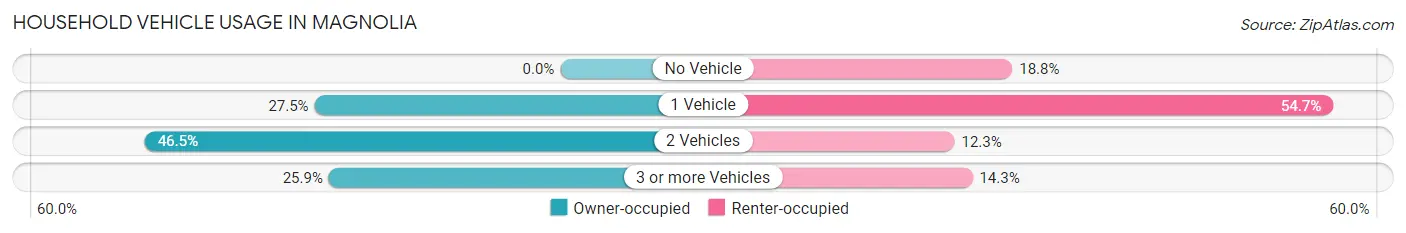
| Vehicles per Household | Owner-occupied | Renter-occupied |
| No Vehicle | 0 (0.0%) | 84 (18.8%) |
| 1 Vehicle | 155 (27.5%) | 245 (54.7%) |
| 2 Vehicles | 262 (46.5%) | 55 (12.3%) |
| 3 or more Vehicles | 146 (25.9%) | 64 (14.3%) |
| Total | 563 (100.0%) | 448 (100.0%) |
Real Estate & Mortgages in Magnolia
Real Estate and Mortgage Overview in Magnolia
| Characteristic | Without Mortgage | With Mortgage |
| Housing Units | 198 | 365 |
| Median Property Value | $193,000 | $268,200 |
| Median Household Income | - | - |
| Monthly Housing Costs | $673 | $9 |
| Real Estate Taxes | $3,267 | $25 |
Property Value by Mortgage Status in Magnolia
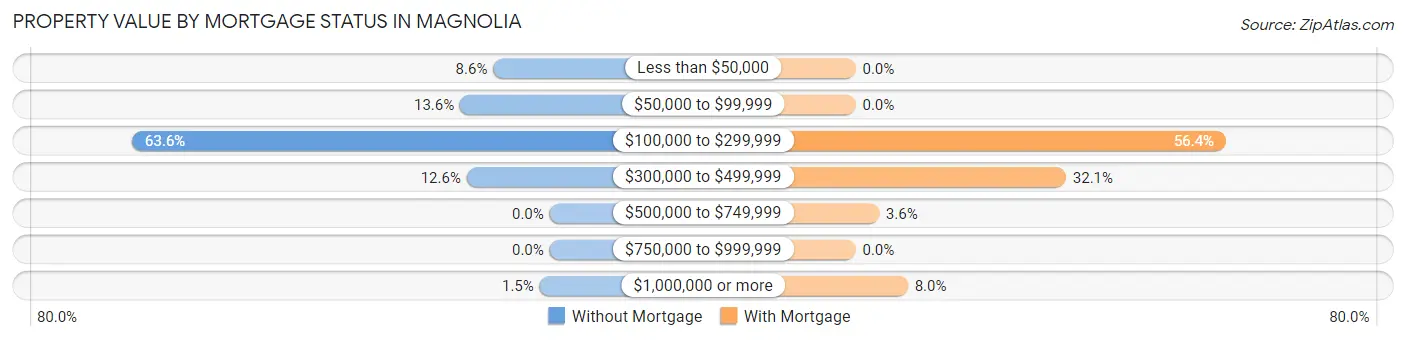
| Property Value | Without Mortgage | With Mortgage |
| Less than $50,000 | 17 (8.6%) | 0 (0.0%) |
| $50,000 to $99,999 | 27 (13.6%) | 0 (0.0%) |
| $100,000 to $299,999 | 126 (63.6%) | 206 (56.4%) |
| $300,000 to $499,999 | 25 (12.6%) | 117 (32.1%) |
| $500,000 to $749,999 | 0 (0.0%) | 13 (3.6%) |
| $750,000 to $999,999 | 0 (0.0%) | 0 (0.0%) |
| $1,000,000 or more | 3 (1.5%) | 29 (8.0%) |
| Total | 198 (100.0%) | 365 (100.0%) |
Household Income by Mortgage Status in Magnolia
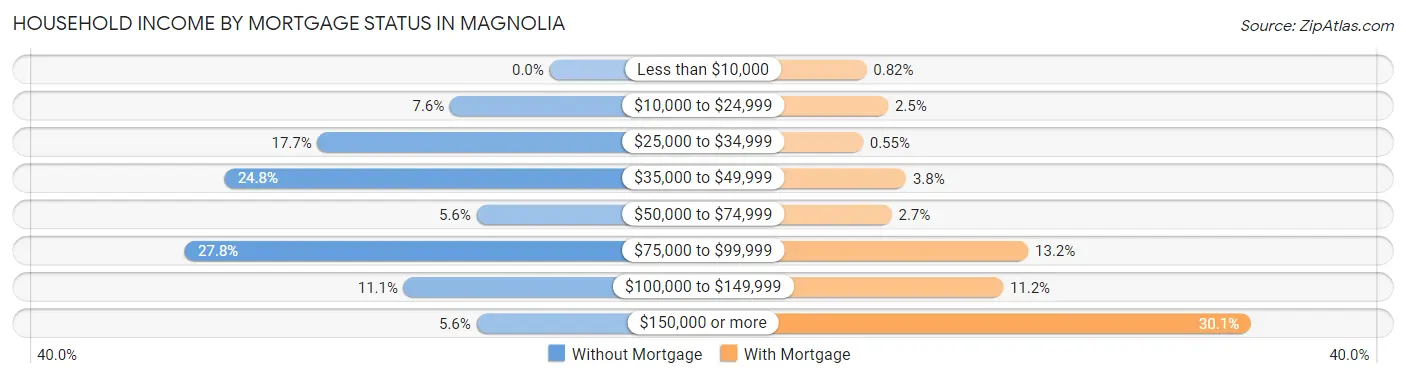
| Household Income | Without Mortgage | With Mortgage |
| Less than $10,000 | 0 (0.0%) | 3 (0.8%) |
| $10,000 to $24,999 | 15 (7.6%) | 9 (2.5%) |
| $25,000 to $34,999 | 35 (17.7%) | 2 (0.5%) |
| $35,000 to $49,999 | 49 (24.7%) | 14 (3.8%) |
| $50,000 to $74,999 | 11 (5.6%) | 10 (2.7%) |
| $75,000 to $99,999 | 55 (27.8%) | 48 (13.2%) |
| $100,000 to $149,999 | 22 (11.1%) | 41 (11.2%) |
| $150,000 or more | 11 (5.6%) | 110 (30.1%) |
| Total | 198 (100.0%) | 365 (100.0%) |
Property Value to Household Income Ratio in Magnolia
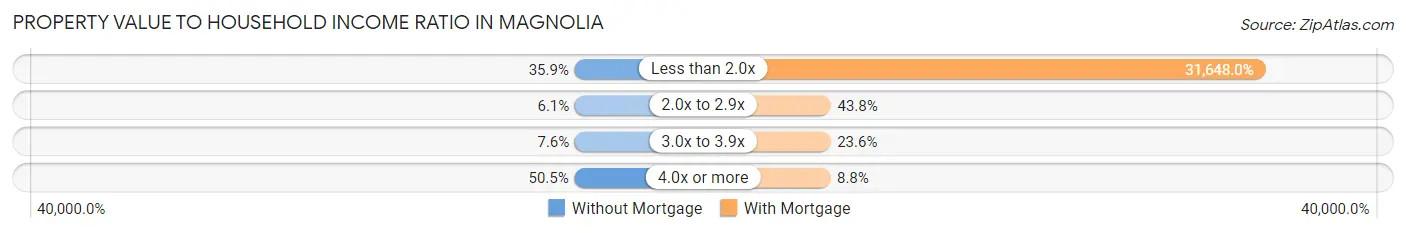
| Value-to-Income Ratio | Without Mortgage | With Mortgage |
| Less than 2.0x | 71 (35.9%) | 115,515 (31,647.9%) |
| 2.0x to 2.9x | 12 (6.1%) | 160 (43.8%) |
| 3.0x to 3.9x | 15 (7.6%) | 86 (23.6%) |
| 4.0x or more | 100 (50.5%) | 32 (8.8%) |
| Total | 198 (100.0%) | 365 (100.0%) |
Real Estate Taxes by Mortgage Status in Magnolia
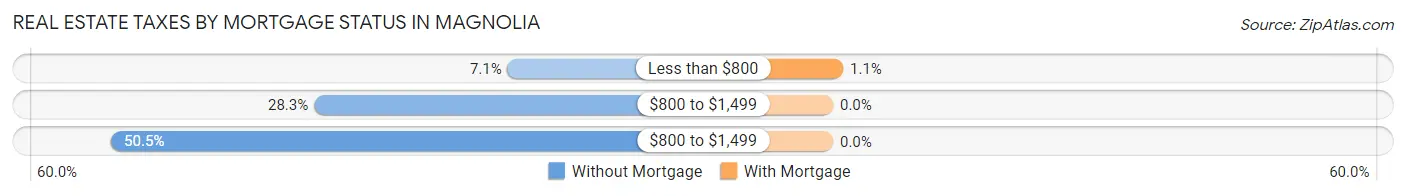
| Property Taxes | Without Mortgage | With Mortgage |
| Less than $800 | 14 (7.1%) | 4 (1.1%) |
| $800 to $1,499 | 56 (28.3%) | 0 (0.0%) |
| $800 to $1,499 | 100 (50.5%) | 0 (0.0%) |
| Total | 198 (100.0%) | 365 (100.0%) |
Health & Disability in Magnolia
Health Insurance Coverage by Age in Magnolia
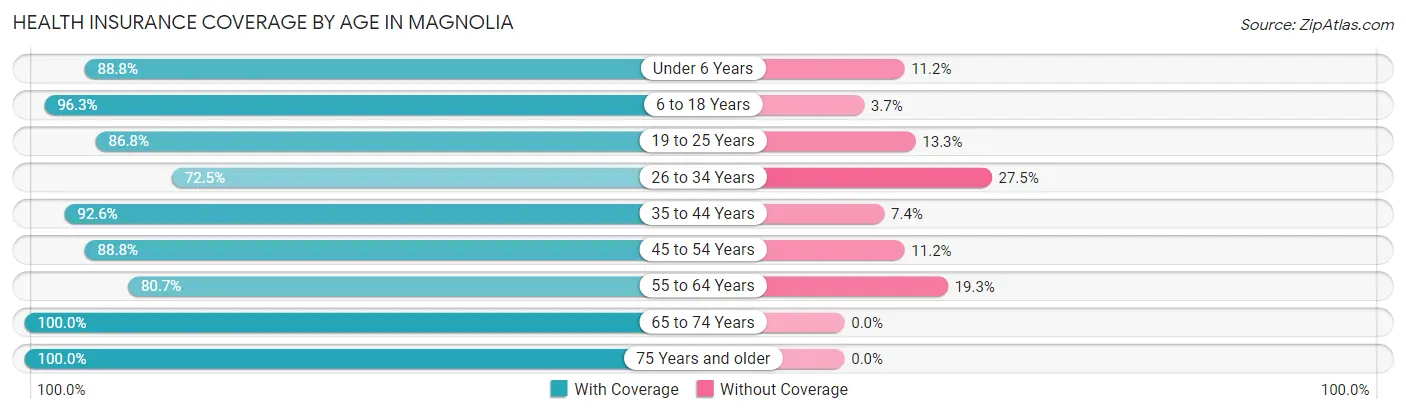
| Age Bracket | With Coverage | Without Coverage |
| Under 6 Years | 151 (88.8%) | 19 (11.2%) |
| 6 to 18 Years | 474 (96.3%) | 18 (3.7%) |
| 19 to 25 Years | 288 (86.8%) | 44 (13.3%) |
| 26 to 34 Years | 206 (72.5%) | 78 (27.5%) |
| 35 to 44 Years | 299 (92.6%) | 24 (7.4%) |
| 45 to 54 Years | 206 (88.8%) | 26 (11.2%) |
| 55 to 64 Years | 314 (80.7%) | 75 (19.3%) |
| 65 to 74 Years | 204 (100.0%) | 0 (0.0%) |
| 75 Years and older | 192 (100.0%) | 0 (0.0%) |
| Total | 2,334 (89.1%) | 284 (10.8%) |
Health Insurance Coverage by Citizenship Status in Magnolia
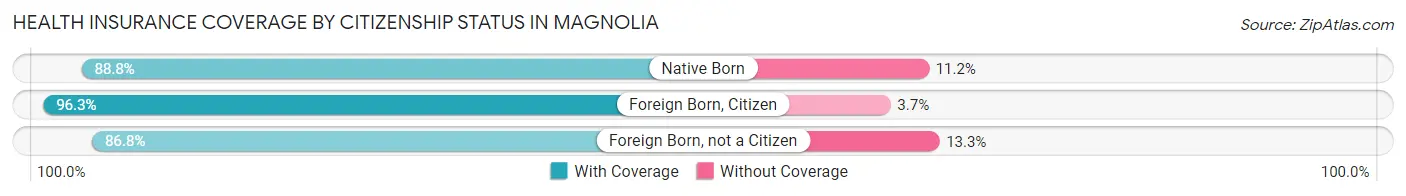
| Citizenship Status | With Coverage | Without Coverage |
| Native Born | 151 (88.8%) | 19 (11.2%) |
| Foreign Born, Citizen | 474 (96.3%) | 18 (3.7%) |
| Foreign Born, not a Citizen | 288 (86.8%) | 44 (13.3%) |
Health Insurance Coverage by Household Income in Magnolia
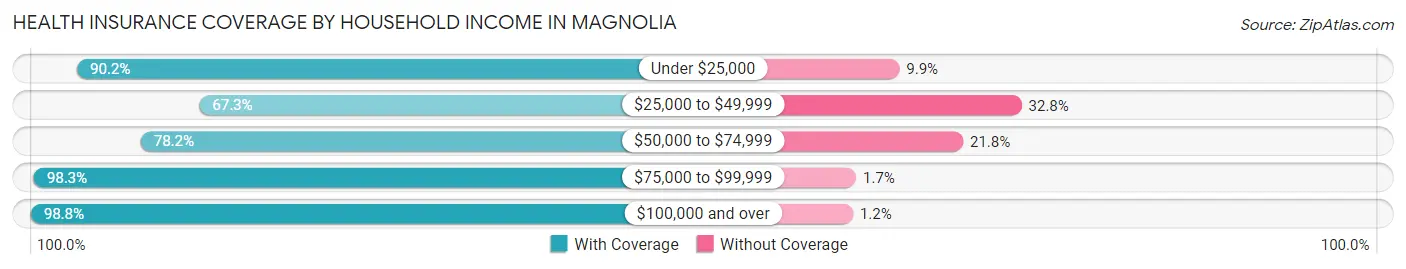
| Household Income | With Coverage | Without Coverage |
| Under $25,000 | 183 (90.1%) | 20 (9.9%) |
| $25,000 to $49,999 | 345 (67.2%) | 168 (32.8%) |
| $50,000 to $74,999 | 273 (78.2%) | 76 (21.8%) |
| $75,000 to $99,999 | 339 (98.3%) | 6 (1.7%) |
| $100,000 and over | 1,194 (98.8%) | 14 (1.2%) |
Public vs Private Health Insurance Coverage by Age in Magnolia
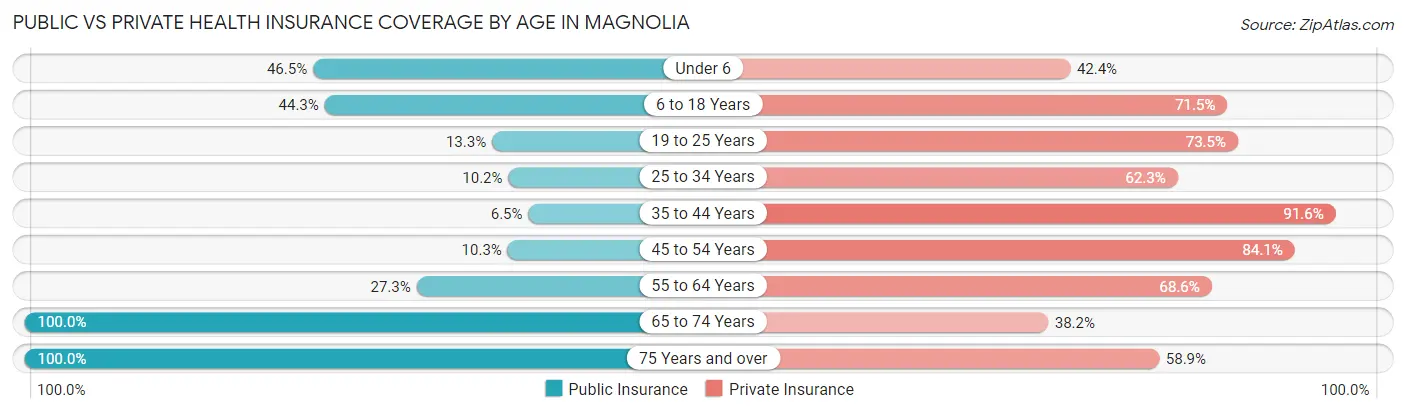
| Age Bracket | Public Insurance | Private Insurance |
| Under 6 | 79 (46.5%) | 72 (42.3%) |
| 6 to 18 Years | 218 (44.3%) | 352 (71.5%) |
| 19 to 25 Years | 44 (13.3%) | 244 (73.5%) |
| 25 to 34 Years | 29 (10.2%) | 177 (62.3%) |
| 35 to 44 Years | 21 (6.5%) | 296 (91.6%) |
| 45 to 54 Years | 24 (10.3%) | 195 (84.1%) |
| 55 to 64 Years | 106 (27.3%) | 267 (68.6%) |
| 65 to 74 Years | 204 (100.0%) | 78 (38.2%) |
| 75 Years and over | 192 (100.0%) | 113 (58.9%) |
| Total | 917 (35.0%) | 1,794 (68.5%) |
Disability Status by Sex by Age in Magnolia
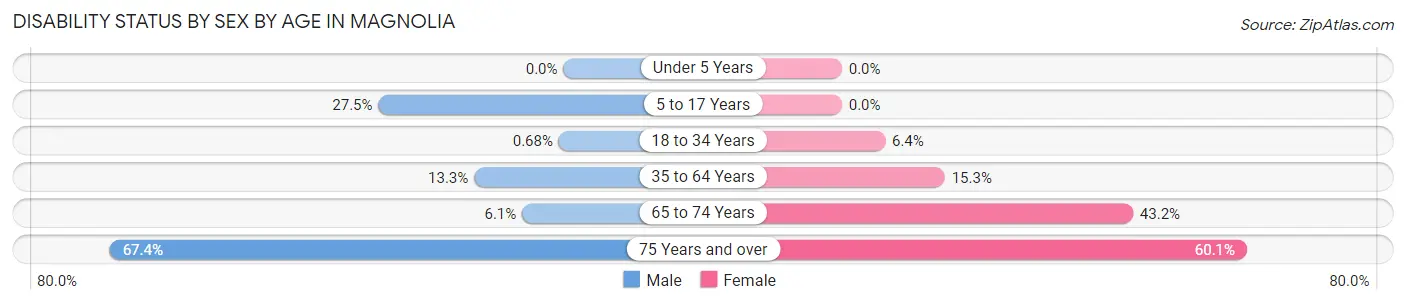
| Age Bracket | Male | Female |
| Under 5 Years | 0 (0.0%) | 0 (0.0%) |
| 5 to 17 Years | 50 (27.5%) | 0 (0.0%) |
| 18 to 34 Years | 2 (0.7%) | 24 (6.4%) |
| 35 to 64 Years | 80 (13.3%) | 52 (15.3%) |
| 65 to 74 Years | 3 (6.1%) | 67 (43.2%) |
| 75 Years and over | 33 (67.3%) | 86 (60.1%) |
Disability Class by Sex by Age in Magnolia
Disability Class: Hearing Difficulty
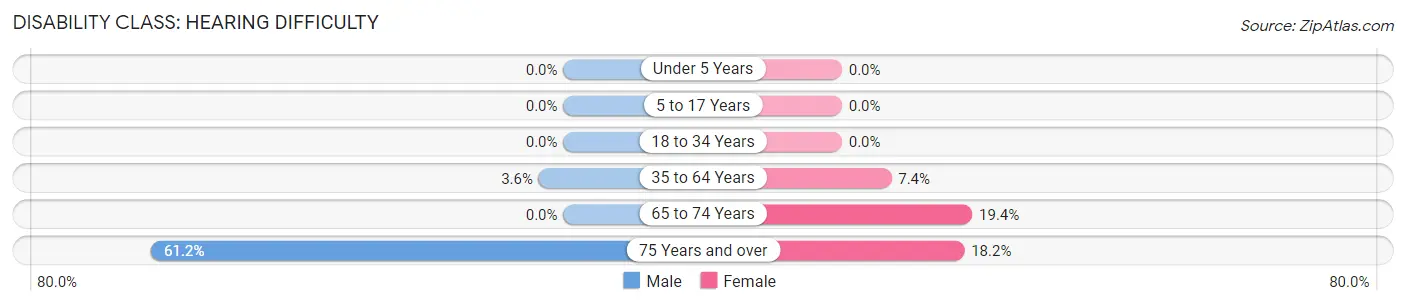
| Age Bracket | Male | Female |
| Under 5 Years | 0 (0.0%) | 0 (0.0%) |
| 5 to 17 Years | 0 (0.0%) | 0 (0.0%) |
| 18 to 34 Years | 0 (0.0%) | 0 (0.0%) |
| 35 to 64 Years | 22 (3.6%) | 25 (7.3%) |
| 65 to 74 Years | 0 (0.0%) | 30 (19.4%) |
| 75 Years and over | 30 (61.2%) | 26 (18.2%) |
Disability Class: Vision Difficulty
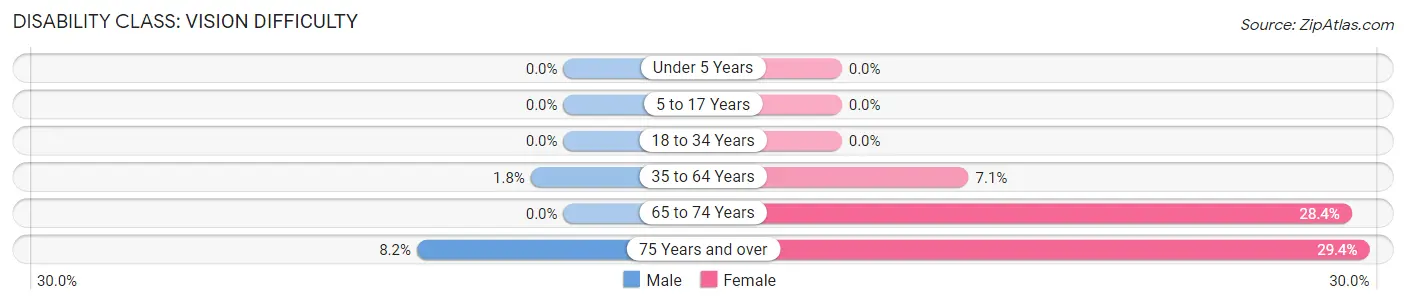
| Age Bracket | Male | Female |
| Under 5 Years | 0 (0.0%) | 0 (0.0%) |
| 5 to 17 Years | 0 (0.0%) | 0 (0.0%) |
| 18 to 34 Years | 0 (0.0%) | 0 (0.0%) |
| 35 to 64 Years | 11 (1.8%) | 24 (7.1%) |
| 65 to 74 Years | 0 (0.0%) | 44 (28.4%) |
| 75 Years and over | 4 (8.2%) | 42 (29.4%) |
Disability Class: Cognitive Difficulty
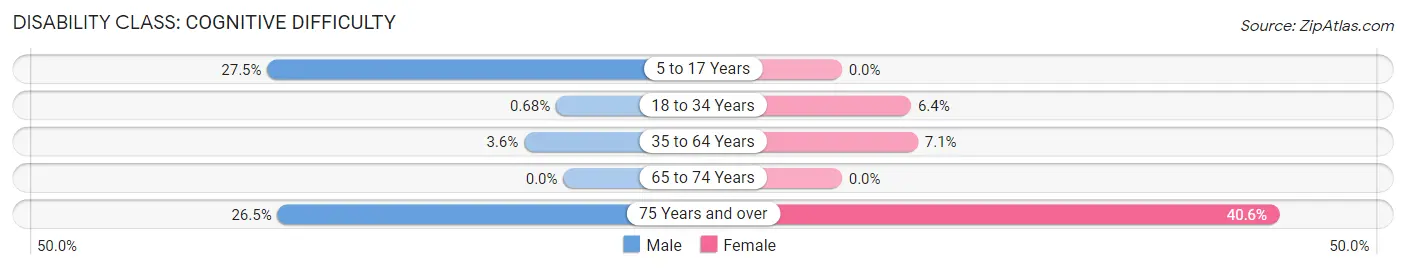
| Age Bracket | Male | Female |
| 5 to 17 Years | 50 (27.5%) | 0 (0.0%) |
| 18 to 34 Years | 2 (0.7%) | 24 (6.4%) |
| 35 to 64 Years | 22 (3.6%) | 24 (7.1%) |
| 65 to 74 Years | 0 (0.0%) | 0 (0.0%) |
| 75 Years and over | 13 (26.5%) | 58 (40.6%) |
Disability Class: Ambulatory Difficulty
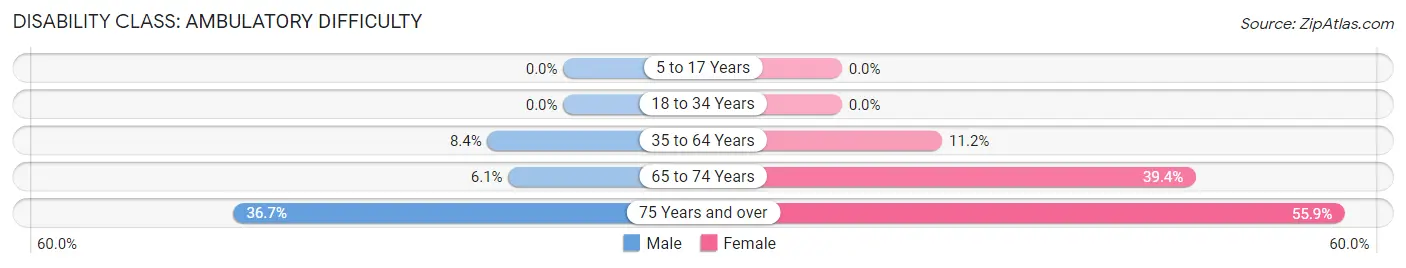
| Age Bracket | Male | Female |
| 5 to 17 Years | 0 (0.0%) | 0 (0.0%) |
| 18 to 34 Years | 0 (0.0%) | 0 (0.0%) |
| 35 to 64 Years | 51 (8.4%) | 38 (11.2%) |
| 65 to 74 Years | 3 (6.1%) | 61 (39.4%) |
| 75 Years and over | 18 (36.7%) | 80 (55.9%) |
Disability Class: Self-Care Difficulty
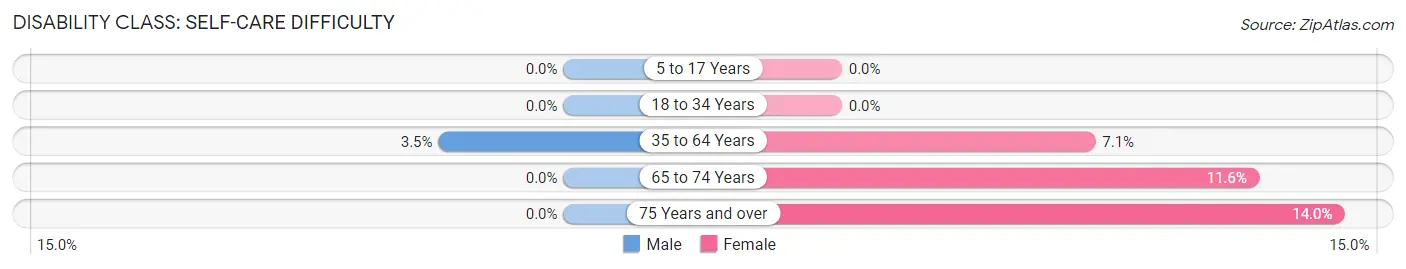
| Age Bracket | Male | Female |
| 5 to 17 Years | 0 (0.0%) | 0 (0.0%) |
| 18 to 34 Years | 0 (0.0%) | 0 (0.0%) |
| 35 to 64 Years | 21 (3.5%) | 24 (7.1%) |
| 65 to 74 Years | 0 (0.0%) | 18 (11.6%) |
| 75 Years and over | 0 (0.0%) | 20 (14.0%) |
Technology Access in Magnolia
Computing Device Access in Magnolia
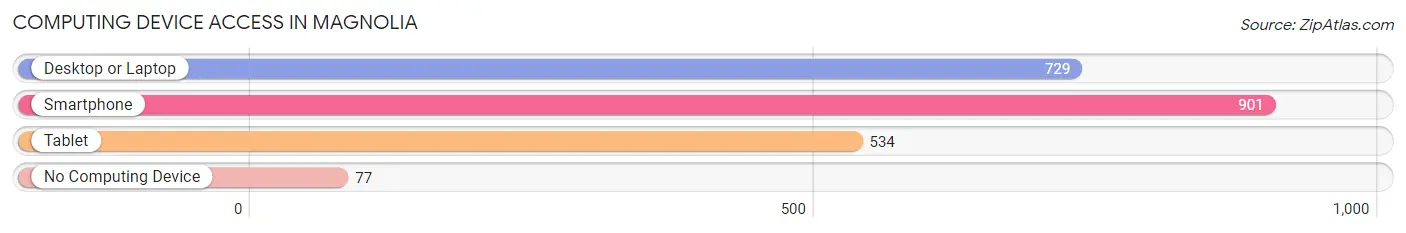
| Device Type | # Households | % Households |
| Desktop or Laptop | 729 | 72.1% |
| Smartphone | 901 | 89.1% |
| Tablet | 534 | 52.8% |
| No Computing Device | 77 | 7.6% |
| Total | 1,011 | 100.0% |
Internet Access in Magnolia
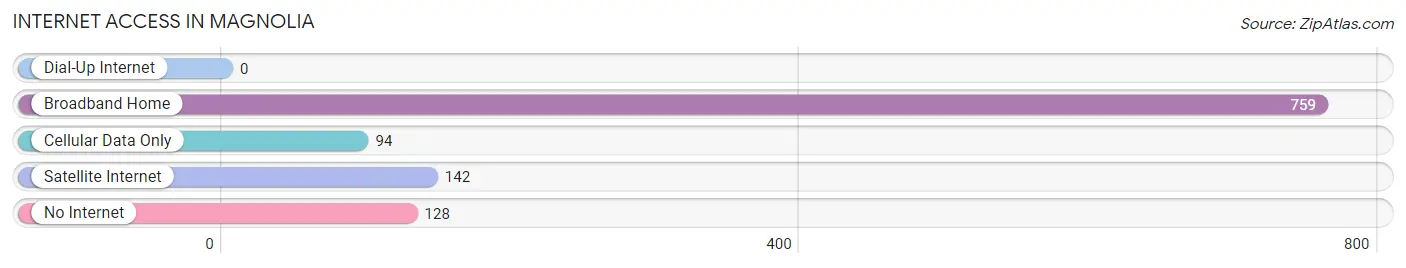
| Internet Type | # Households | % Households |
| Dial-Up Internet | 0 | 0.0% |
| Broadband Home | 759 | 75.1% |
| Cellular Data Only | 94 | 9.3% |
| Satellite Internet | 142 | 14.1% |
| No Internet | 128 | 12.7% |
| Total | 1,011 | 100.0% |
Magnolia Summary
Magnolia, Texas is a small town located in Montgomery County, Texas, about 40 miles northwest of Houston. The town was founded in 1848 and is named after the magnolia trees that were abundant in the area. The population of Magnolia was estimated to be 1,845 in 2019.
Geography
Magnolia is located in the southeastern part of Montgomery County, Texas, about 40 miles northwest of Houston. The town is situated on the banks of the West Fork of the San Jacinto River. The terrain is mostly flat, with some rolling hills in the area. The climate is humid subtropical, with hot summers and mild winters.
Economy
The economy of Magnolia is largely based on agriculture and oil and gas production. The town is home to several large farms, including the Magnolia Farms, which produces cotton, corn, and soybeans. The town is also home to several oil and gas production companies, including Magnolia Oil and Gas, which produces natural gas and crude oil.
Demographics
As of the 2019 census, the population of Magnolia was estimated to be 1,845. The racial makeup of the town was 79.2% White, 15.2% Hispanic or Latino, 2.2% African American, 0.7% Native American, 0.3% Asian, and 2.4% from other races. The median household income was $50,945, and the median home value was $179,400.
Education
The Magnolia Independent School District serves the town of Magnolia. The district has three elementary schools, one middle school, and one high school. The district also operates a vocational-technical school. The town is also home to a branch of Lone Star College, which offers a variety of associate degree and certificate programs.
History
The town of Magnolia was founded in 1848 by a group of settlers from Alabama. The town was named after the magnolia trees that were abundant in the area. The town grew slowly over the years, and by the early 1900s, it had become a thriving agricultural community. In the 1950s, oil and gas production began in the area, and the town experienced a period of growth. In the 1970s, the town was incorporated, and the population began to grow steadily. Today, Magnolia is a small, rural town with a strong sense of community.
Common Questions
What is Per Capita Income in Magnolia?
Per Capita income in Magnolia is $43,176.
What is the Median Family Income in Magnolia?
Median Family Income in Magnolia is $91,750.
What is the Median Household income in Magnolia?
Median Household Income in Magnolia is $59,922.
What is Income or Wage Gap in Magnolia?
Income or Wage Gap in Magnolia is 28.4%.
Women in Magnolia earn 71.6 cents for every dollar earned by a man.
What is Inequality or Gini Index in Magnolia?
Inequality or Gini Index in Magnolia is 0.52.
What is the Total Population of Magnolia?
Total Population of Magnolia is 2,620.
What is the Total Male Population of Magnolia?
Total Male Population of Magnolia is 1,245.
What is the Total Female Population of Magnolia?
Total Female Population of Magnolia is 1,375.
What is the Ratio of Males per 100 Females in Magnolia?
There are 90.55 Males per 100 Females in Magnolia.
What is the Ratio of Females per 100 Males in Magnolia?
There are 110.44 Females per 100 Males in Magnolia.
What is the Median Population Age in Magnolia?
Median Population Age in Magnolia is 36.4 Years.
What is the Average Family Size in Magnolia
Average Family Size in Magnolia is 3.3 People.
What is the Average Household Size in Magnolia
Average Household Size in Magnolia is 2.6 People.
How Large is the Labor Force in Magnolia?
There are 1,264 People in the Labor Forcein in Magnolia.
What is the Percentage of People in the Labor Force in Magnolia?
62.0% of People are in the Labor Force in Magnolia.
What is the Unemployment Rate in Magnolia?
Unemployment Rate in Magnolia is 1.0%.