Riverside, MO Map & Demographics
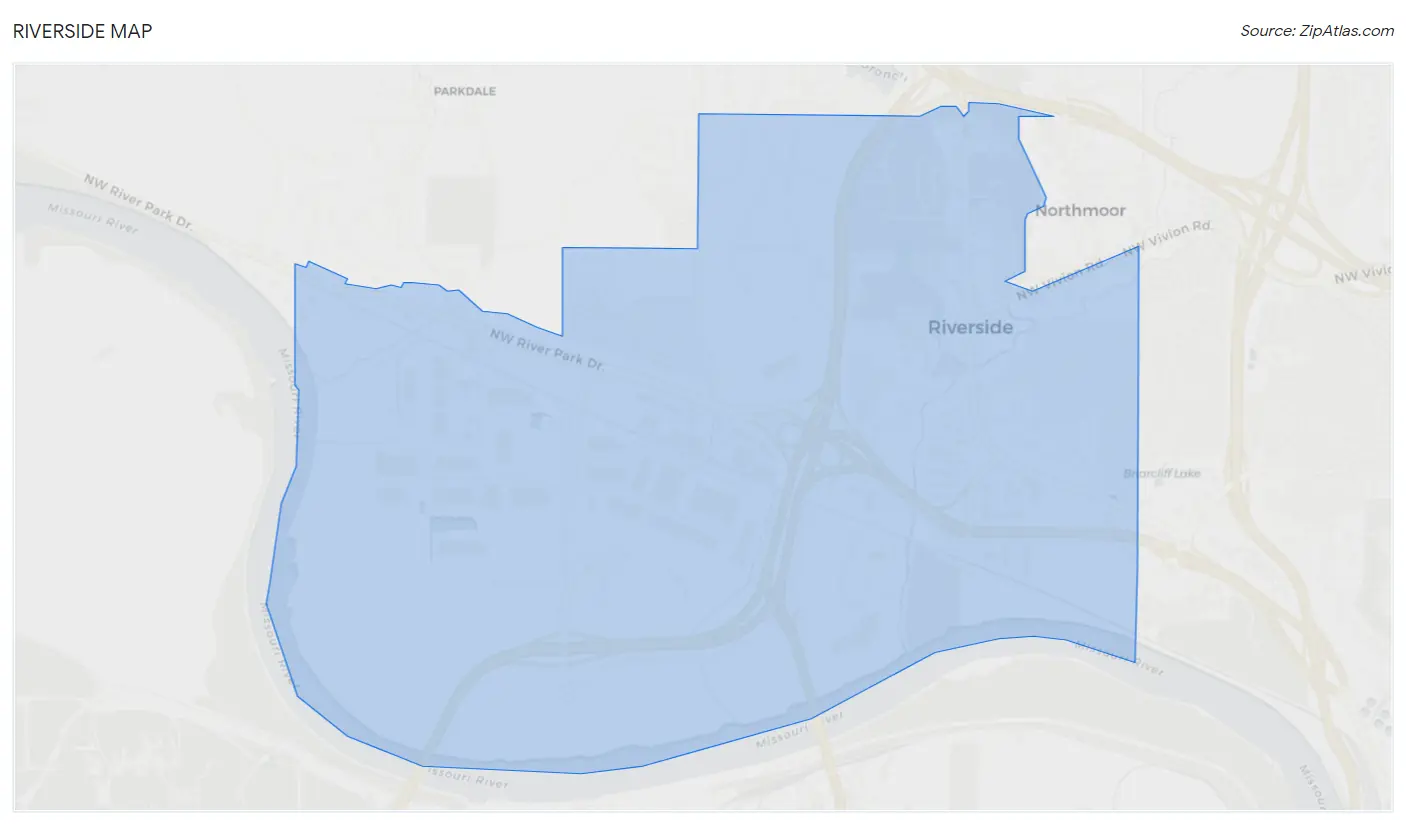
Riverside Map
Riverside Overview
$33,601
PER CAPITA INCOME
$48,964
AVG FAMILY INCOME
$47,668
AVG HOUSEHOLD INCOME
37.4%
WAGE / INCOME GAP [ % ]
62.6¢/ $1
WAGE / INCOME GAP [ $ ]
0.51
INEQUALITY / GINI INDEX
4,017
TOTAL POPULATION
2,285
MALE POPULATION
1,732
FEMALE POPULATION
131.93
MALES / 100 FEMALES
75.80
FEMALES / 100 MALES
34.9
MEDIAN AGE
3.1
AVG FAMILY SIZE
2.4
AVG HOUSEHOLD SIZE
1,842
LABOR FORCE [ PEOPLE ]
59.7%
PERCENT IN LABOR FORCE
4.6%
UNEMPLOYMENT RATE
Riverside Zip Codes
Riverside Area Codes
Income in Riverside
Income Overview in Riverside
Per Capita Income in Riverside is $33,601, while median incomes of families and households are $48,964 and $47,668 respectively.
| Characteristic | Number | Measure |
| Per Capita Income | 4,017 | $33,601 |
| Median Family Income | 972 | $48,964 |
| Mean Family Income | 972 | $96,880 |
| Median Household Income | 1,585 | $47,668 |
| Mean Household Income | 1,585 | $84,192 |
| Income Deficit | 972 | $0 |
| Wage / Income Gap (%) | 4,017 | 37.35% |
| Wage / Income Gap ($) | 4,017 | 62.65¢ per $1 |
| Gini / Inequality Index | 4,017 | 0.51 |
Earnings by Sex in Riverside
Average Earnings in Riverside are $34,675, $46,492 for men and $29,125 for women, a difference of 37.3%.
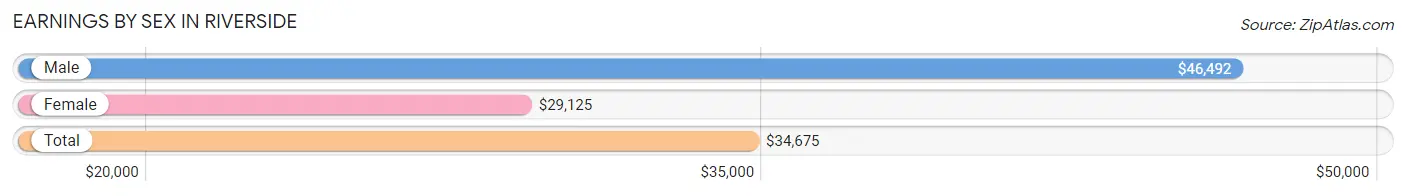
| Sex | Number | Average Earnings |
| Male | 1,217 (60.8%) | $46,492 |
| Female | 786 (39.2%) | $29,125 |
| Total | 2,003 (100.0%) | $34,675 |
Earnings by Sex by Income Bracket in Riverside
The most common earnings brackets in Riverside are $100,000+ for men (193 | 15.9%) and $2,500 to $4,999 for women (136 | 17.3%).
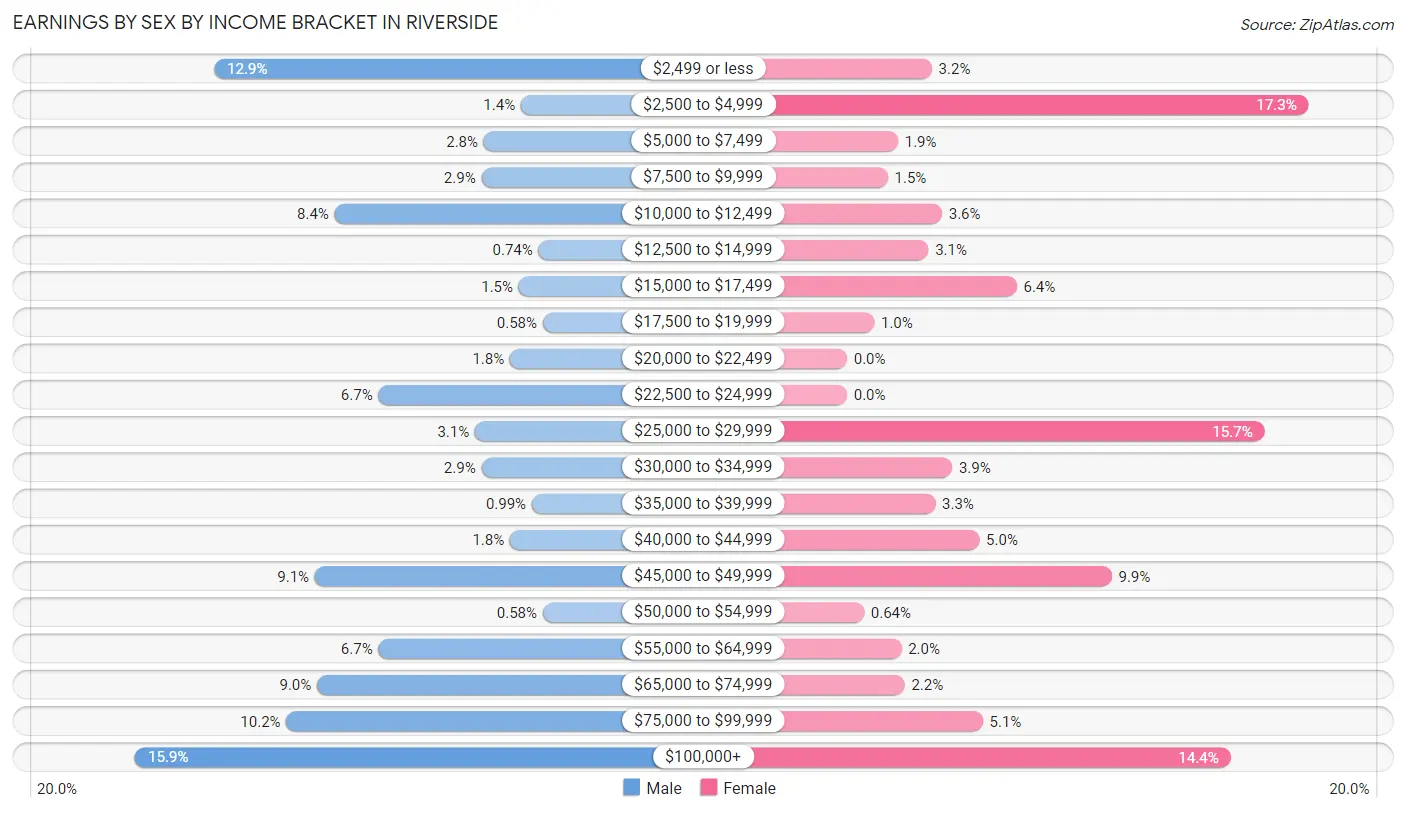
| Income | Male | Female |
| $2,499 or less | 157 (12.9%) | 25 (3.2%) |
| $2,500 to $4,999 | 17 (1.4%) | 136 (17.3%) |
| $5,000 to $7,499 | 34 (2.8%) | 15 (1.9%) |
| $7,500 to $9,999 | 35 (2.9%) | 12 (1.5%) |
| $10,000 to $12,499 | 102 (8.4%) | 28 (3.6%) |
| $12,500 to $14,999 | 9 (0.7%) | 24 (3.0%) |
| $15,000 to $17,499 | 18 (1.5%) | 50 (6.4%) |
| $17,500 to $19,999 | 7 (0.6%) | 8 (1.0%) |
| $20,000 to $22,499 | 22 (1.8%) | 0 (0.0%) |
| $22,500 to $24,999 | 82 (6.7%) | 0 (0.0%) |
| $25,000 to $29,999 | 38 (3.1%) | 123 (15.7%) |
| $30,000 to $34,999 | 35 (2.9%) | 31 (3.9%) |
| $35,000 to $39,999 | 12 (1.0%) | 26 (3.3%) |
| $40,000 to $44,999 | 22 (1.8%) | 39 (5.0%) |
| $45,000 to $49,999 | 111 (9.1%) | 78 (9.9%) |
| $50,000 to $54,999 | 7 (0.6%) | 5 (0.6%) |
| $55,000 to $64,999 | 82 (6.7%) | 16 (2.0%) |
| $65,000 to $74,999 | 110 (9.0%) | 17 (2.2%) |
| $75,000 to $99,999 | 124 (10.2%) | 40 (5.1%) |
| $100,000+ | 193 (15.9%) | 113 (14.4%) |
| Total | 1,217 (100.0%) | 786 (100.0%) |
Earnings by Sex by Educational Attainment in Riverside
Average earnings in Riverside are $49,234 for men and $32,813 for women, a difference of 33.4%. Men with an educational attainment of graduate degree enjoy the highest average annual earnings of $67,381, while those with less than high school education earn the least with $40,096. Women with an educational attainment of graduate degree earn the most with the average annual earnings of $76,042, while those with high school diploma education have the smallest earnings of $15,163.
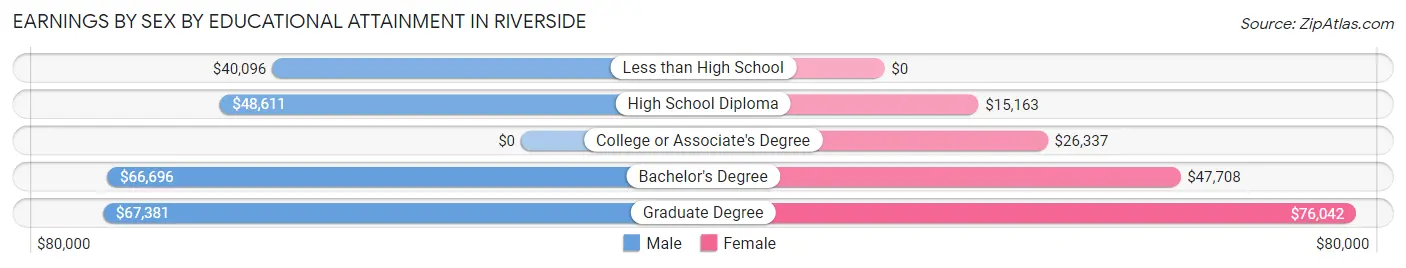
| Educational Attainment | Male Income | Female Income |
| Less than High School | $40,096 | $0 |
| High School Diploma | $48,611 | $15,163 |
| College or Associate's Degree | - | - |
| Bachelor's Degree | $66,696 | $47,708 |
| Graduate Degree | $67,381 | $76,042 |
| Total | $49,234 | $32,813 |
Family Income in Riverside
Family Income Brackets in Riverside
According to the Riverside family income data, there are 203 families falling into the $35,000 to $49,999 income range, which is the most common income bracket and makes up 20.9% of all families.
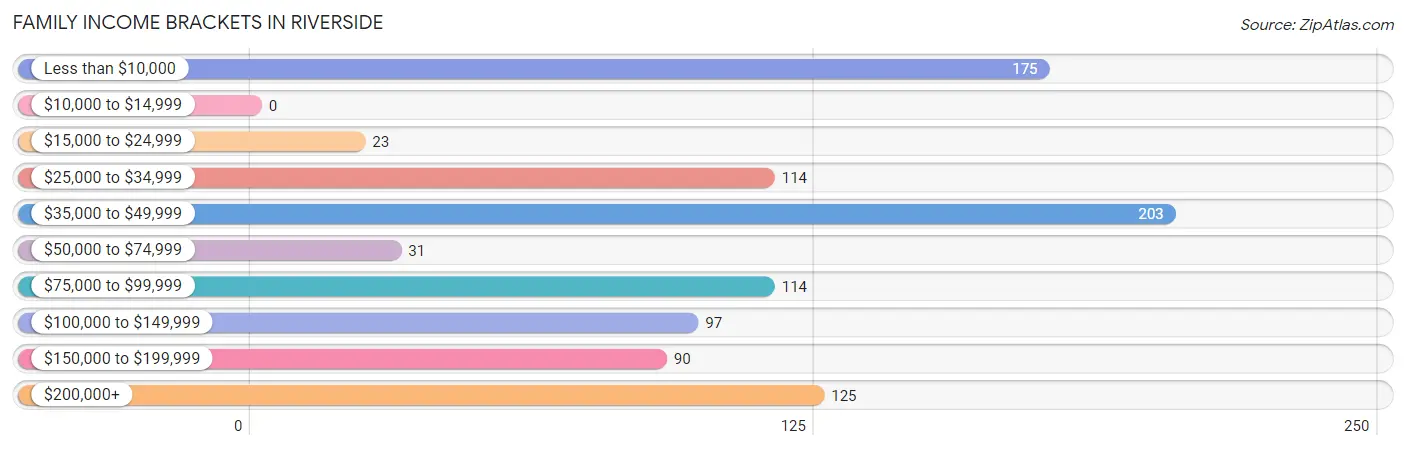
| Income Bracket | # Families | % Families |
| Less than $10,000 | 175 | 18.0% |
| $10,000 to $14,999 | 0 | 0.0% |
| $15,000 to $24,999 | 23 | 2.4% |
| $25,000 to $34,999 | 114 | 11.7% |
| $35,000 to $49,999 | 203 | 20.9% |
| $50,000 to $74,999 | 31 | 3.2% |
| $75,000 to $99,999 | 114 | 11.7% |
| $100,000 to $149,999 | 97 | 10.0% |
| $150,000 to $199,999 | 90 | 9.3% |
| $200,000+ | 125 | 12.9% |
Family Income by Famaliy Size in Riverside
2-person families (395 | 40.6%) account for the highest median family income in Riverside with $79,554 per family, while 2-person families (395 | 40.6%) have the highest median income of $39,777 per family member.
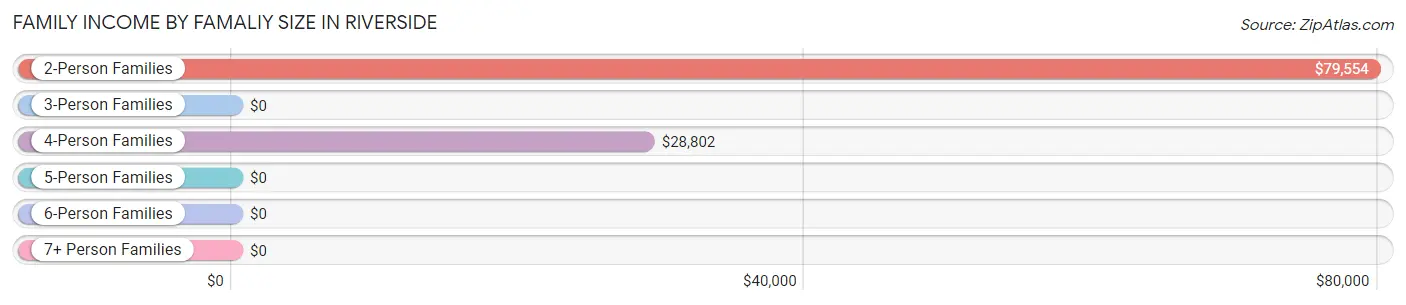
| Income Bracket | # Families | Median Income |
| 2-Person Families | 395 (40.6%) | $79,554 |
| 3-Person Families | 210 (21.6%) | $0 |
| 4-Person Families | 297 (30.6%) | $28,802 |
| 5-Person Families | 41 (4.2%) | $0 |
| 6-Person Families | 29 (3.0%) | $0 |
| 7+ Person Families | 0 (0.0%) | $0 |
| Total | 972 (100.0%) | $48,964 |
Family Income by Number of Earners in Riverside
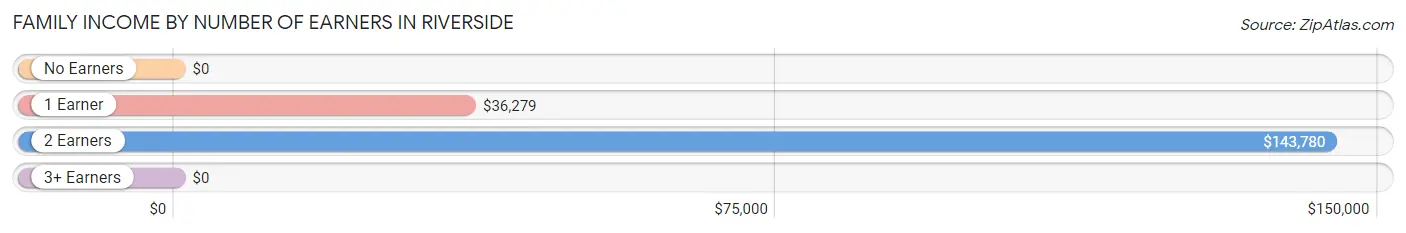
| Number of Earners | # Families | Median Income |
| No Earners | 151 (15.5%) | $0 |
| 1 Earner | 404 (41.6%) | $36,279 |
| 2 Earners | 369 (38.0%) | $143,780 |
| 3+ Earners | 48 (4.9%) | $0 |
| Total | 972 (100.0%) | $48,964 |
Household Income in Riverside
Household Income Brackets in Riverside
With 277 households falling in the category, the $25,000 to $34,999 income range is the most frequent in Riverside, accounting for 17.5% of all households. In contrast, only 48 households (3.0%) fall into the $10,000 to $14,999 income bracket, making it the least populous group.
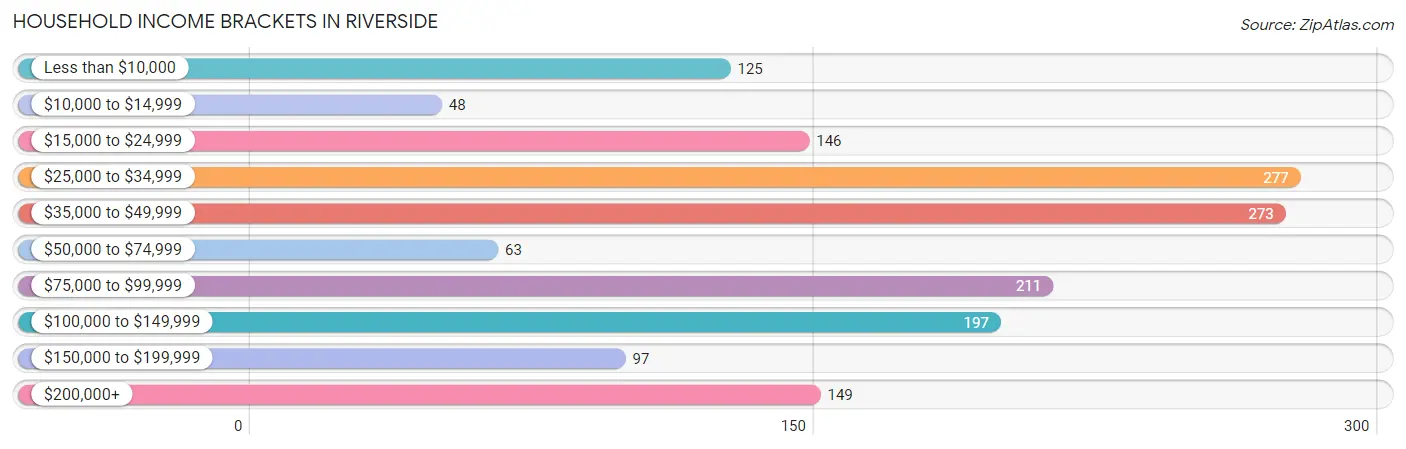
| Income Bracket | # Households | % Households |
| Less than $10,000 | 125 | 7.9% |
| $10,000 to $14,999 | 48 | 3.0% |
| $15,000 to $24,999 | 146 | 9.2% |
| $25,000 to $34,999 | 277 | 17.5% |
| $35,000 to $49,999 | 273 | 17.2% |
| $50,000 to $74,999 | 63 | 4.0% |
| $75,000 to $99,999 | 211 | 13.3% |
| $100,000 to $149,999 | 197 | 12.4% |
| $150,000 to $199,999 | 97 | 6.1% |
| $200,000+ | 149 | 9.4% |
Household Income by Householder Age in Riverside
The median household income in Riverside is $47,668, with the highest median household income of $48,981 found in the 45 to 64 years age bracket for the primary householder. A total of 520 households (32.8%) fall into this category. Meanwhile, the 15 to 24 years age bracket for the primary householder has the lowest median household income of $28,125, with 35 households (2.2%) in this group.
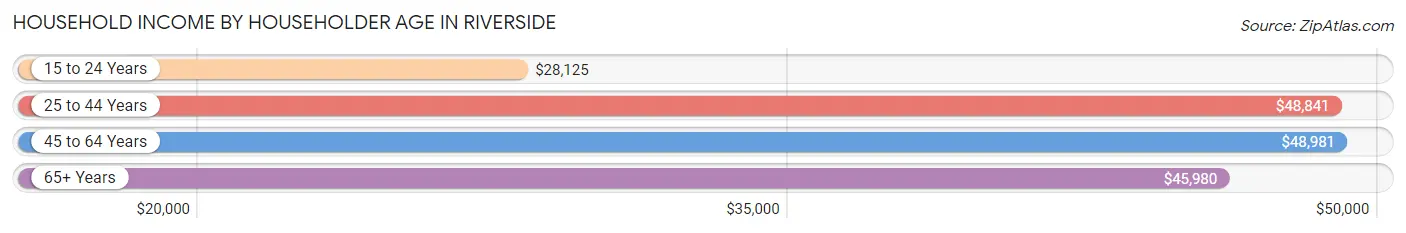
| Income Bracket | # Households | Median Income |
| 15 to 24 Years | 35 (2.2%) | $28,125 |
| 25 to 44 Years | 669 (42.2%) | $48,841 |
| 45 to 64 Years | 520 (32.8%) | $48,981 |
| 65+ Years | 361 (22.8%) | $45,980 |
| Total | 1,585 (100.0%) | $47,668 |
Poverty in Riverside
Income Below Poverty by Sex and Age in Riverside
With 26.2% poverty level for males and 26.5% for females among the residents of Riverside, 18 to 24 year old males and 15 year old females are the most vulnerable to poverty, with 102 males (66.7%) and 26 females (100.0%) in their respective age groups living below the poverty level.
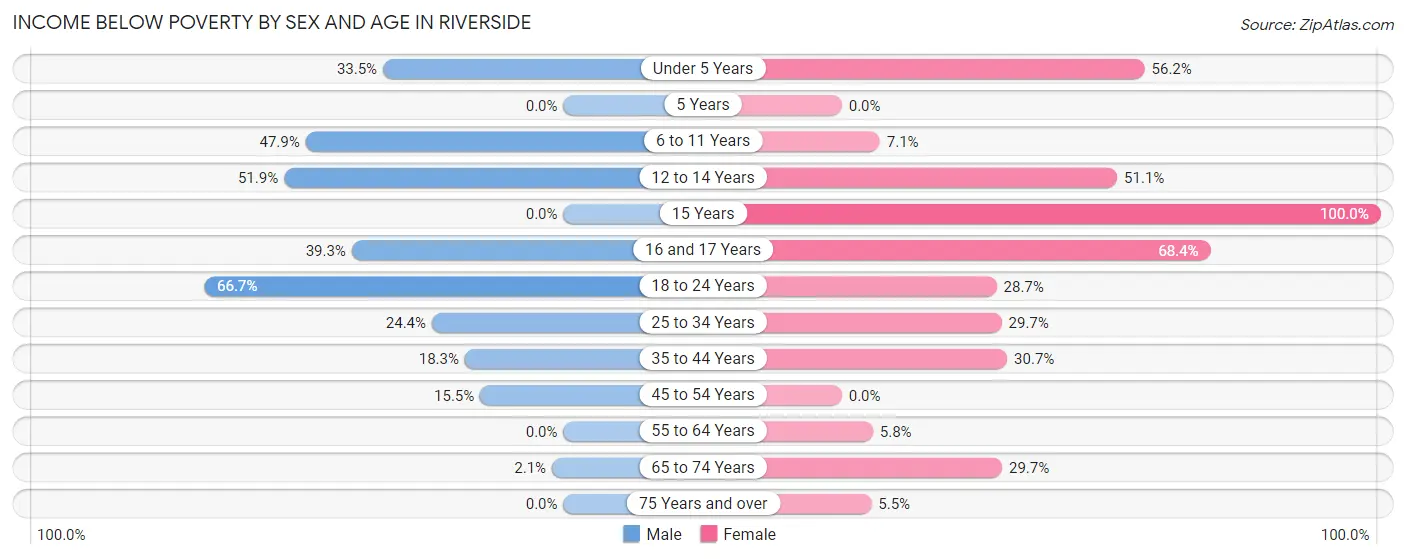
| Age Bracket | Male | Female |
| Under 5 Years | 70 (33.5%) | 86 (56.2%) |
| 5 Years | 0 (0.0%) | 0 (0.0%) |
| 6 to 11 Years | 134 (47.9%) | 6 (7.1%) |
| 12 to 14 Years | 56 (51.8%) | 23 (51.1%) |
| 15 Years | 0 (0.0%) | 26 (100.0%) |
| 16 and 17 Years | 11 (39.3%) | 26 (68.4%) |
| 18 to 24 Years | 102 (66.7%) | 25 (28.7%) |
| 25 to 34 Years | 125 (24.4%) | 78 (29.7%) |
| 35 to 44 Years | 43 (18.3%) | 89 (30.7%) |
| 45 to 54 Years | 36 (15.4%) | 0 (0.0%) |
| 55 to 64 Years | 0 (0.0%) | 15 (5.8%) |
| 65 to 74 Years | 4 (2.1%) | 69 (29.7%) |
| 75 Years and over | 0 (0.0%) | 4 (5.5%) |
| Total | 581 (26.2%) | 447 (26.5%) |
Income Above Poverty by Sex and Age in Riverside
According to the poverty statistics in Riverside, males aged 5 years and females aged 45 to 54 years are the age groups that are most secure financially, with 100.0% of males and 100.0% of females in these age groups living above the poverty line.
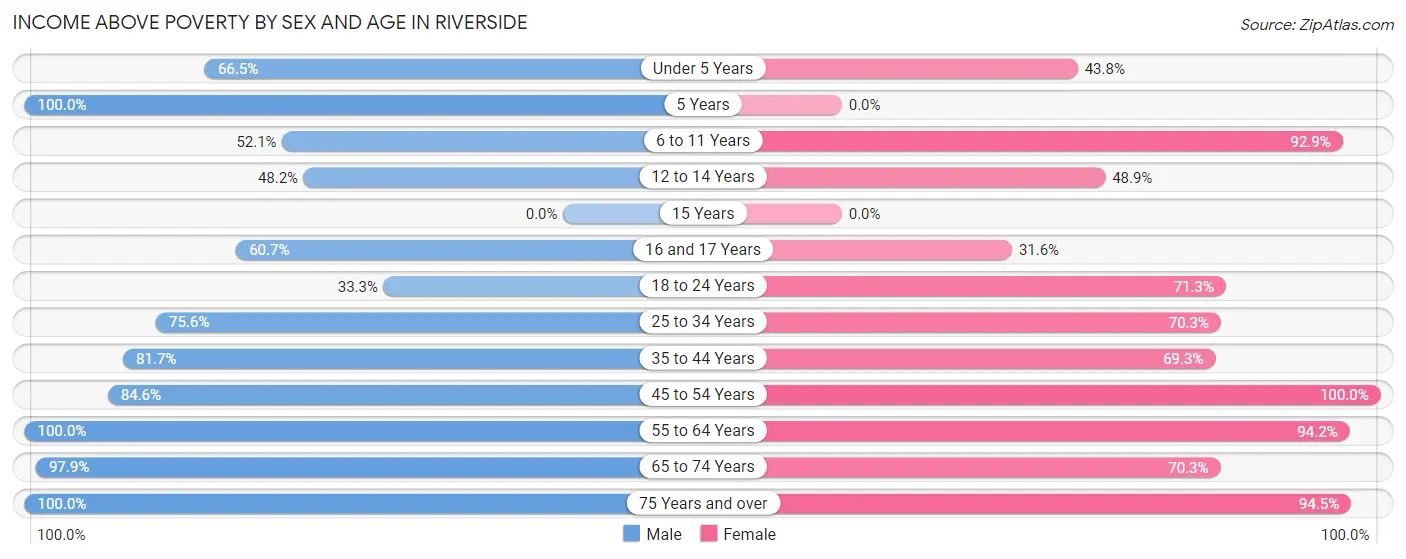
| Age Bracket | Male | Female |
| Under 5 Years | 139 (66.5%) | 67 (43.8%) |
| 5 Years | 22 (100.0%) | 0 (0.0%) |
| 6 to 11 Years | 146 (52.1%) | 79 (92.9%) |
| 12 to 14 Years | 52 (48.1%) | 22 (48.9%) |
| 15 Years | 0 (0.0%) | 0 (0.0%) |
| 16 and 17 Years | 17 (60.7%) | 12 (31.6%) |
| 18 to 24 Years | 51 (33.3%) | 62 (71.3%) |
| 25 to 34 Years | 387 (75.6%) | 185 (70.3%) |
| 35 to 44 Years | 192 (81.7%) | 201 (69.3%) |
| 45 to 54 Years | 197 (84.6%) | 138 (100.0%) |
| 55 to 64 Years | 182 (100.0%) | 245 (94.2%) |
| 65 to 74 Years | 185 (97.9%) | 163 (70.3%) |
| 75 Years and over | 69 (100.0%) | 69 (94.5%) |
| Total | 1,639 (73.8%) | 1,243 (73.6%) |
Income Below Poverty Among Married-Couple Families in Riverside
The poverty statistics for married-couple families in Riverside show that 12.6% or 78 of the total 621 families live below the poverty line. Families with 3 or 4 children have the highest poverty rate of 32.7%, comprising of 17 families. On the other hand, families with no children have the lowest poverty rate of 2.6%, which includes 8 families.
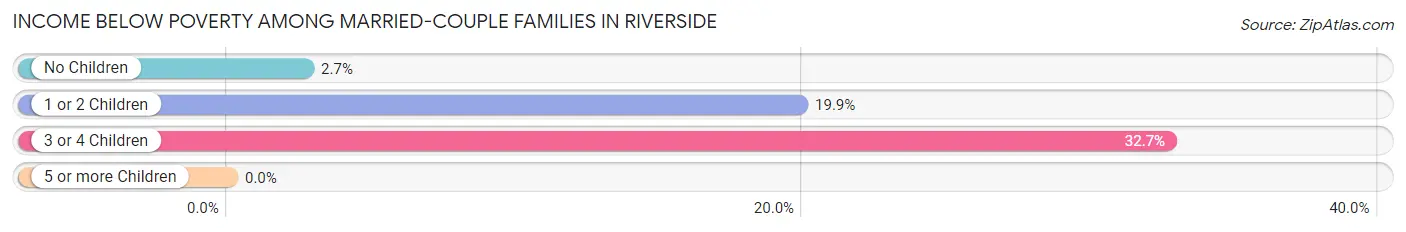
| Children | Above Poverty | Below Poverty |
| No Children | 294 (97.4%) | 8 (2.6%) |
| 1 or 2 Children | 214 (80.1%) | 53 (19.9%) |
| 3 or 4 Children | 35 (67.3%) | 17 (32.7%) |
| 5 or more Children | 0 (0.0%) | 0 (0.0%) |
| Total | 543 (87.4%) | 78 (12.6%) |
Income Below Poverty Among Single-Parent Households in Riverside
According to the poverty data in Riverside, 36.5% or 23 single-father households and 52.1% or 150 single-mother households are living below the poverty line. Among single-father households, those with 3 or 4 children have the highest poverty rate, with 15 households (100.0%) experiencing poverty. Likewise, among single-mother households, those with 3 or 4 children have the highest poverty rate, with 53 households (100.0%) falling below the poverty line.
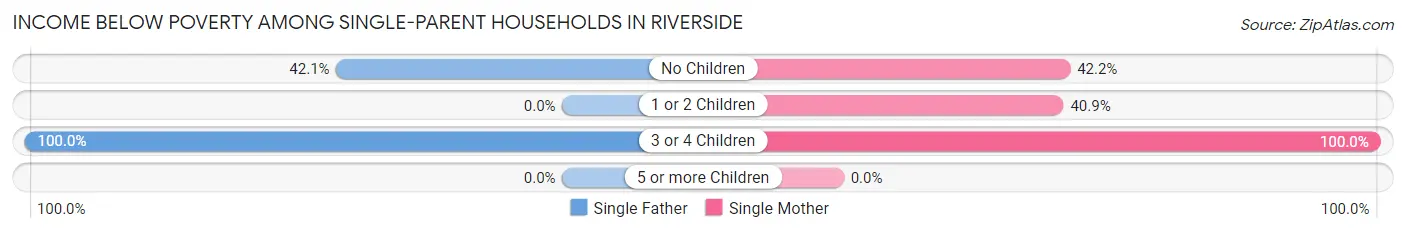
| Children | Single Father | Single Mother |
| No Children | 8 (42.1%) | 27 (42.2%) |
| 1 or 2 Children | 0 (0.0%) | 70 (40.9%) |
| 3 or 4 Children | 15 (100.0%) | 53 (100.0%) |
| 5 or more Children | 0 (0.0%) | 0 (0.0%) |
| Total | 23 (36.5%) | 150 (52.1%) |
Income Below Poverty Among Married-Couple vs Single-Parent Households in Riverside
The poverty data for Riverside shows that 78 of the married-couple family households (12.6%) and 173 of the single-parent households (49.3%) are living below the poverty level. Within the married-couple family households, those with 3 or 4 children have the highest poverty rate, with 17 households (32.7%) falling below the poverty line. Among the single-parent households, those with 3 or 4 children have the highest poverty rate, with 68 household (100.0%) living below poverty.
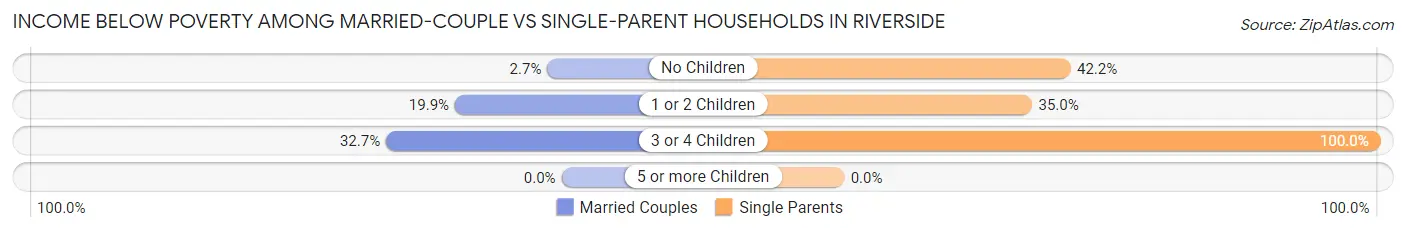
| Children | Married-Couple Families | Single-Parent Households |
| No Children | 8 (2.6%) | 35 (42.2%) |
| 1 or 2 Children | 53 (19.9%) | 70 (35.0%) |
| 3 or 4 Children | 17 (32.7%) | 68 (100.0%) |
| 5 or more Children | 0 (0.0%) | 0 (0.0%) |
| Total | 78 (12.6%) | 173 (49.3%) |
Race in Riverside
The most populous races in Riverside are White / Caucasian (2,950 | 73.4%), Black / African American (703 | 17.5%), and Hispanic or Latino (370 | 9.2%).
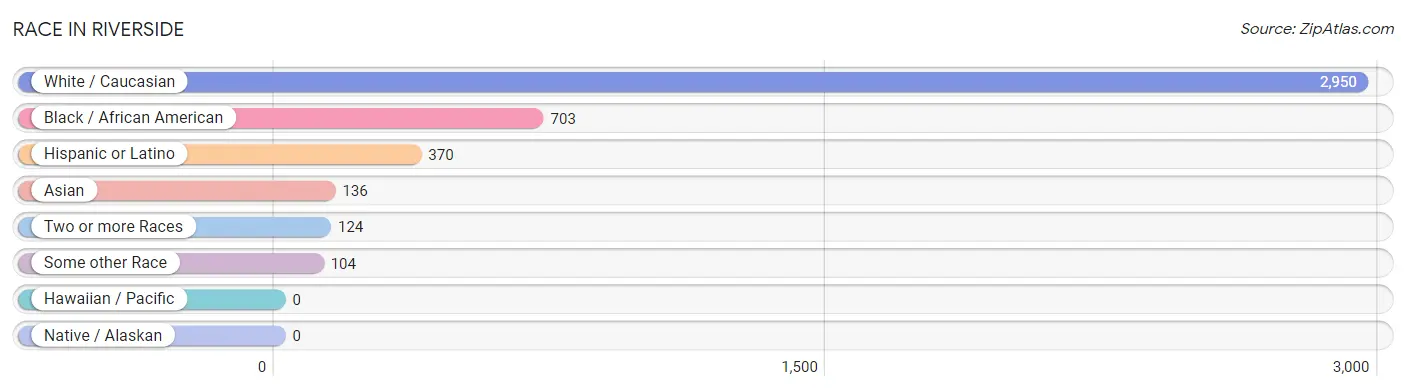
| Race | # Population | % Population |
| Asian | 136 | 3.4% |
| Black / African American | 703 | 17.5% |
| Hawaiian / Pacific | 0 | 0.0% |
| Hispanic or Latino | 370 | 9.2% |
| Native / Alaskan | 0 | 0.0% |
| White / Caucasian | 2,950 | 73.4% |
| Two or more Races | 124 | 3.1% |
| Some other Race | 104 | 2.6% |
| Total | 4,017 | 100.0% |
Ancestry in Riverside
The most populous ancestries reported in Riverside are German (721 | 17.9%), English (628 | 15.6%), Subsaharan African (443 | 11.0%), Irish (351 | 8.7%), and Mexican (285 | 7.1%), together accounting for 60.4% of all Riverside residents.
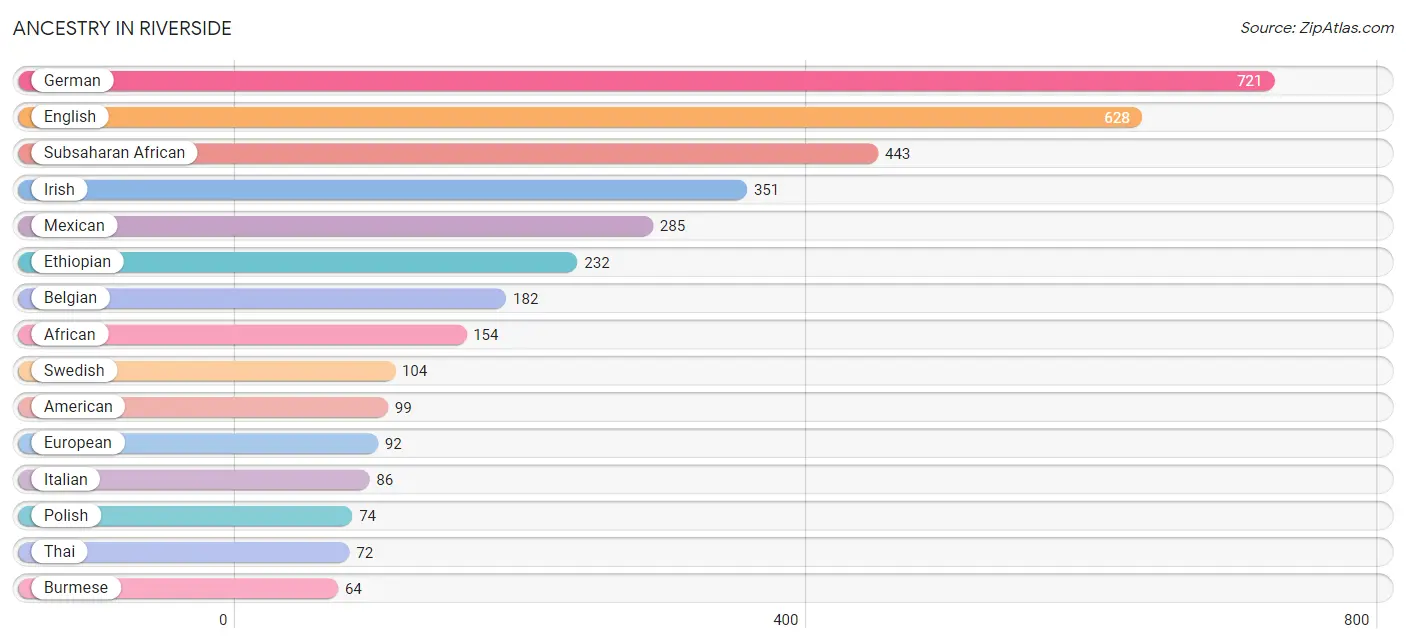
| Ancestry | # Population | % Population |
| African | 154 | 3.8% |
| American | 99 | 2.5% |
| Belgian | 182 | 4.5% |
| Blackfeet | 1 | 0.0% |
| Burmese | 64 | 1.6% |
| Canadian | 8 | 0.2% |
| Central American | 26 | 0.6% |
| Cherokee | 7 | 0.2% |
| Colombian | 4 | 0.1% |
| Czech | 8 | 0.2% |
| Danish | 16 | 0.4% |
| Dutch | 4 | 0.1% |
| English | 628 | 15.6% |
| Ethiopian | 232 | 5.8% |
| European | 92 | 2.3% |
| French | 43 | 1.1% |
| German | 721 | 17.9% |
| Greek | 6 | 0.2% |
| Guatemalan | 26 | 0.6% |
| Irish | 351 | 8.7% |
| Italian | 86 | 2.1% |
| Liberian | 54 | 1.3% |
| Mexican | 285 | 7.1% |
| Northern European | 11 | 0.3% |
| Norwegian | 28 | 0.7% |
| Polish | 74 | 1.8% |
| Puerto Rican | 46 | 1.1% |
| Scandinavian | 9 | 0.2% |
| Scottish | 21 | 0.5% |
| Slovene | 10 | 0.3% |
| South American | 4 | 0.1% |
| Spaniard | 9 | 0.2% |
| Subsaharan African | 443 | 11.0% |
| Sudanese | 14 | 0.4% |
| Swedish | 104 | 2.6% |
| Thai | 72 | 1.8% |
| Welsh | 29 | 0.7% | View All 37 Rows |
Immigrants in Riverside
The most numerous immigrant groups reported in Riverside came from Africa (404 | 10.1%), Eastern Africa (234 | 5.8%), Ethiopia (182 | 4.5%), Asia (97 | 2.4%), and Eastern Asia (64 | 1.6%), together accounting for 24.4% of all Riverside residents.
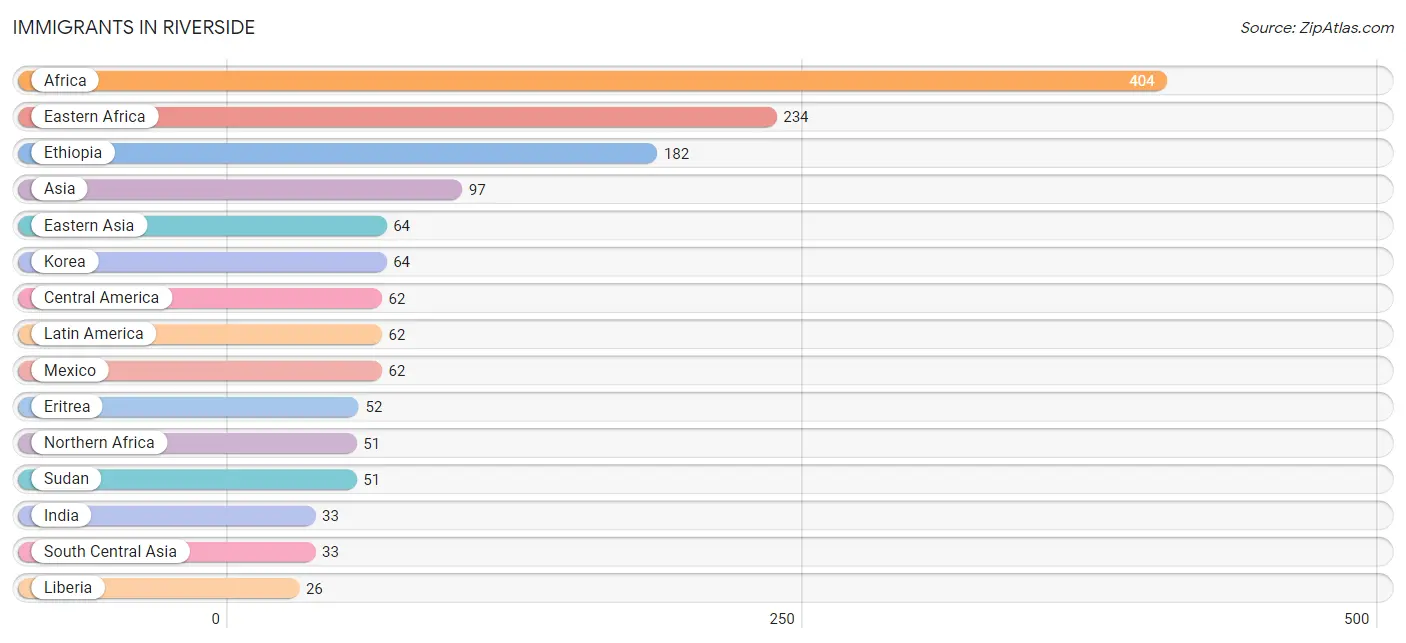
| Immigration Origin | # Population | % Population |
| Africa | 404 | 10.1% |
| Asia | 97 | 2.4% |
| Canada | 8 | 0.2% |
| Central America | 62 | 1.5% |
| Eastern Africa | 234 | 5.8% |
| Eastern Asia | 64 | 1.6% |
| Eritrea | 52 | 1.3% |
| Ethiopia | 182 | 4.5% |
| Europe | 10 | 0.3% |
| Germany | 10 | 0.3% |
| India | 33 | 0.8% |
| Korea | 64 | 1.6% |
| Latin America | 62 | 1.5% |
| Liberia | 26 | 0.6% |
| Mexico | 62 | 1.5% |
| Northern Africa | 51 | 1.3% |
| South Central Asia | 33 | 0.8% |
| Sudan | 51 | 1.3% |
| Western Africa | 26 | 0.6% |
| Western Europe | 10 | 0.3% | View All 20 Rows |
Sex and Age in Riverside
Sex and Age in Riverside
The most populous age groups in Riverside are 30 to 34 Years (312 | 13.7%) for men and 60 to 64 Years (184 | 10.6%) for women.
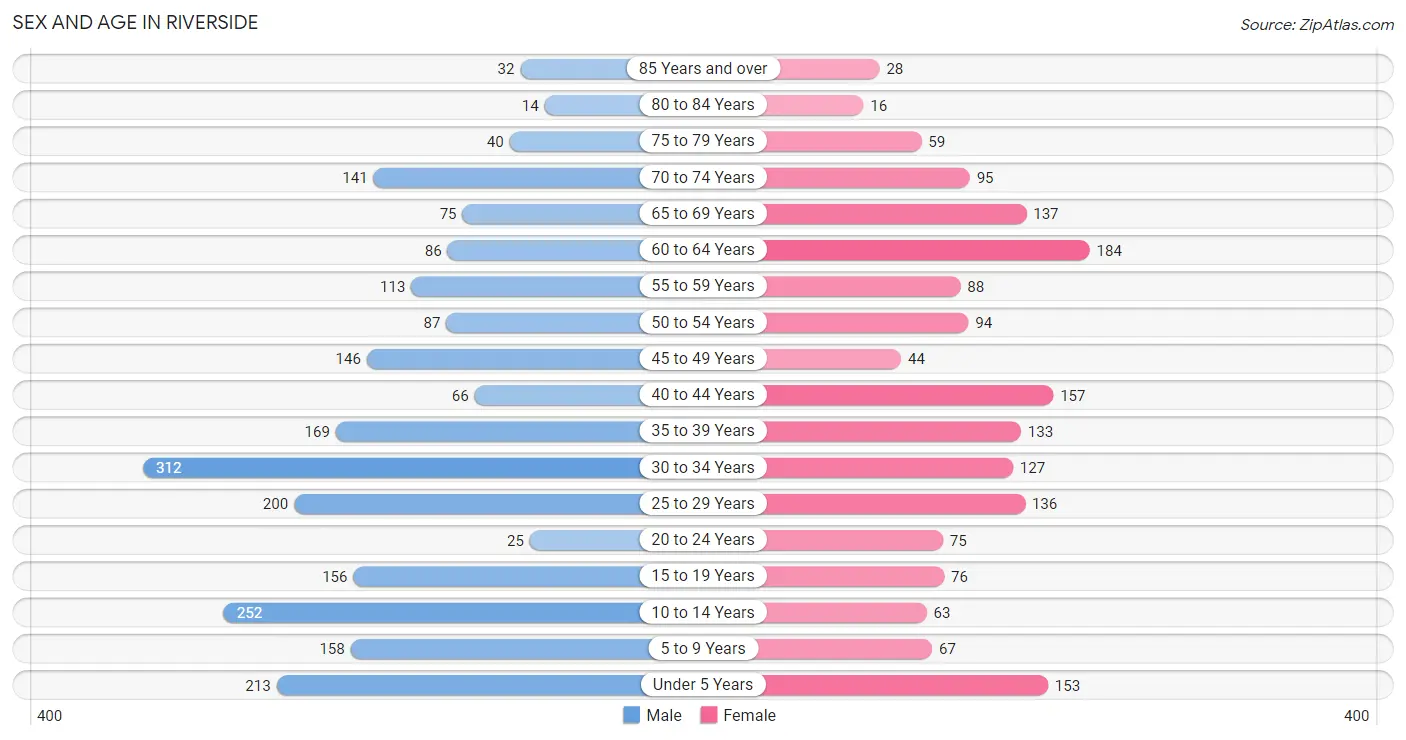
| Age Bracket | Male | Female |
| Under 5 Years | 213 (9.3%) | 153 (8.8%) |
| 5 to 9 Years | 158 (6.9%) | 67 (3.9%) |
| 10 to 14 Years | 252 (11.0%) | 63 (3.6%) |
| 15 to 19 Years | 156 (6.8%) | 76 (4.4%) |
| 20 to 24 Years | 25 (1.1%) | 75 (4.3%) |
| 25 to 29 Years | 200 (8.7%) | 136 (7.9%) |
| 30 to 34 Years | 312 (13.7%) | 127 (7.3%) |
| 35 to 39 Years | 169 (7.4%) | 133 (7.7%) |
| 40 to 44 Years | 66 (2.9%) | 157 (9.1%) |
| 45 to 49 Years | 146 (6.4%) | 44 (2.5%) |
| 50 to 54 Years | 87 (3.8%) | 94 (5.4%) |
| 55 to 59 Years | 113 (5.0%) | 88 (5.1%) |
| 60 to 64 Years | 86 (3.8%) | 184 (10.6%) |
| 65 to 69 Years | 75 (3.3%) | 137 (7.9%) |
| 70 to 74 Years | 141 (6.2%) | 95 (5.5%) |
| 75 to 79 Years | 40 (1.8%) | 59 (3.4%) |
| 80 to 84 Years | 14 (0.6%) | 16 (0.9%) |
| 85 Years and over | 32 (1.4%) | 28 (1.6%) |
| Total | 2,285 (100.0%) | 1,732 (100.0%) |
Families and Households in Riverside
Median Family Size in Riverside
The median family size in Riverside is 3.09 persons per family, with single female/mother families (288 | 29.6%) accounting for the largest median family size of 3.29 persons per family. On the other hand, single male/father families (63 | 6.5%) represent the smallest median family size with 2.98 persons per family.
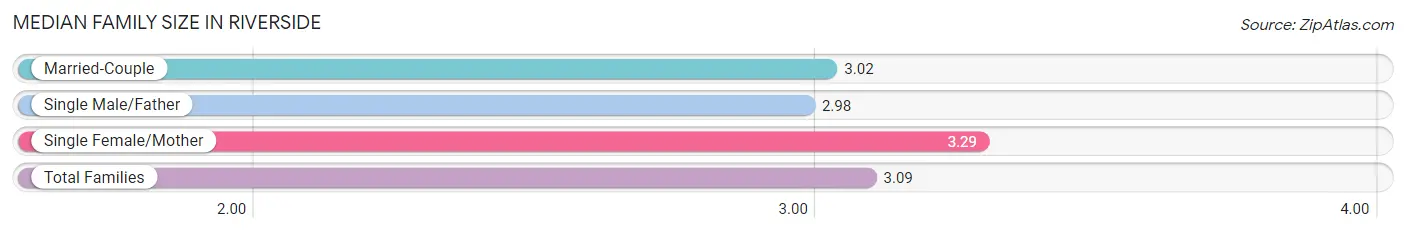
| Family Type | # Families | Family Size |
| Married-Couple | 621 (63.9%) | 3.02 |
| Single Male/Father | 63 (6.5%) | 2.98 |
| Single Female/Mother | 288 (29.6%) | 3.29 |
| Total Families | 972 (100.0%) | 3.09 |
Median Household Size in Riverside
The median household size in Riverside is 2.44 persons per household, with single female/mother households (288 | 18.2%) accounting for the largest median household size of 3.56 persons per household. non-family households (613 | 38.7%) represent the smallest median household size with 1.26 persons per household.
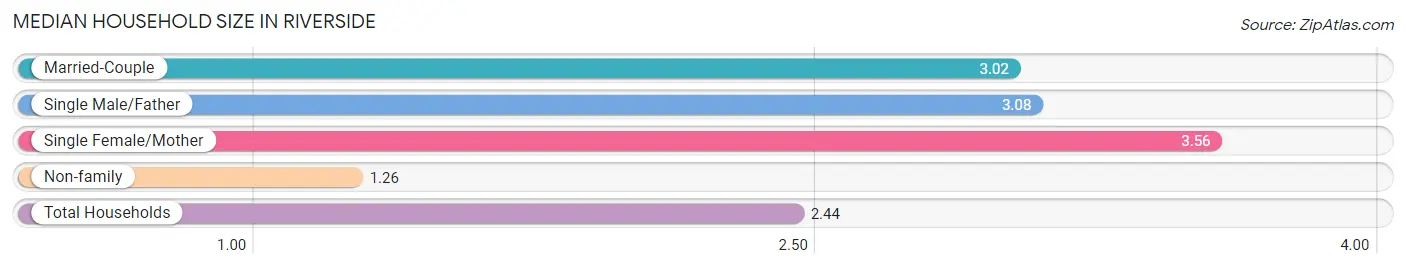
| Household Type | # Households | Household Size |
| Married-Couple | 621 (39.2%) | 3.02 |
| Single Male/Father | 63 (4.0%) | 3.08 |
| Single Female/Mother | 288 (18.2%) | 3.56 |
| Non-family | 613 (38.7%) | 1.26 |
| Total Households | 1,585 (100.0%) | 2.44 |
Household Size by Marriage Status in Riverside
Out of a total of 1,585 households in Riverside, 972 (61.3%) are family households, while 613 (38.7%) are nonfamily households. The most numerous type of family households are 2-person households, comprising 387, and the most common type of nonfamily households are 1-person households, comprising 481.
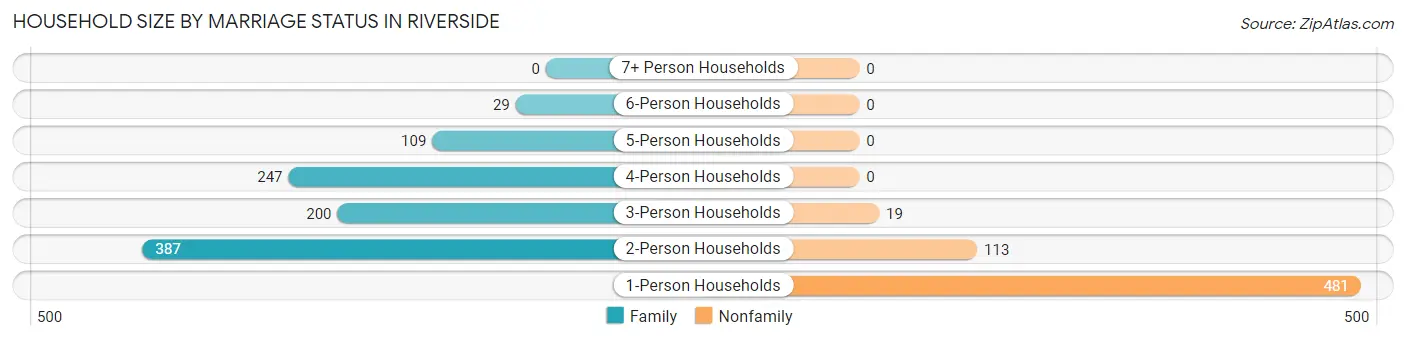
| Household Size | Family Households | Nonfamily Households |
| 1-Person Households | - | 481 (30.3%) |
| 2-Person Households | 387 (24.4%) | 113 (7.1%) |
| 3-Person Households | 200 (12.6%) | 19 (1.2%) |
| 4-Person Households | 247 (15.6%) | 0 (0.0%) |
| 5-Person Households | 109 (6.9%) | 0 (0.0%) |
| 6-Person Households | 29 (1.8%) | 0 (0.0%) |
| 7+ Person Households | 0 (0.0%) | 0 (0.0%) |
| Total | 972 (61.3%) | 613 (38.7%) |
Female Fertility in Riverside
Fertility by Age in Riverside
Average fertility rate in Riverside is 55.0 births per 1,000 women. Women in the age bracket of 20 to 34 years have the highest fertility rate with 124.0 births per 1,000 women. Women in the age bracket of 20 to 34 years acount for 100.0% of all women with births.
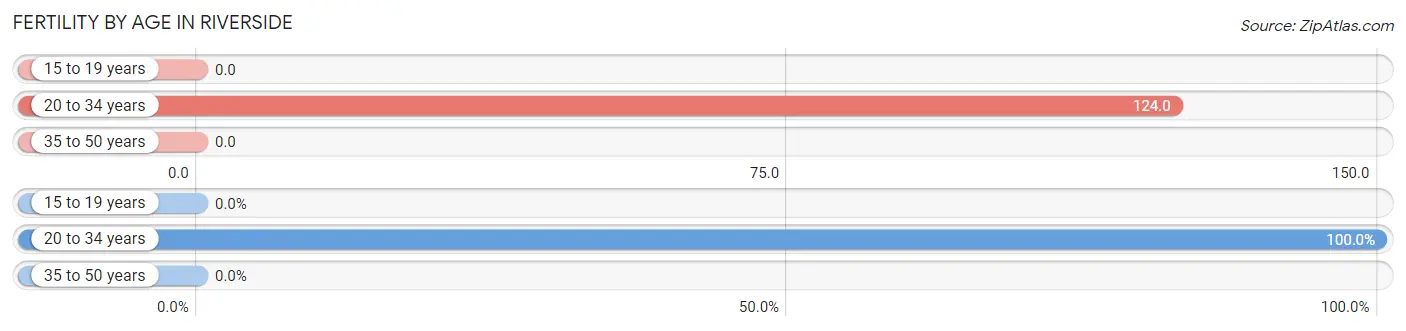
| Age Bracket | Women with Births | Births / 1,000 Women |
| 15 to 19 years | 0 (0.0%) | 0.0 |
| 20 to 34 years | 42 (100.0%) | 124.0 |
| 35 to 50 years | 0 (0.0%) | 0.0 |
| Total | 42 (100.0%) | 55.0 |
Fertility by Age by Marriage Status in Riverside
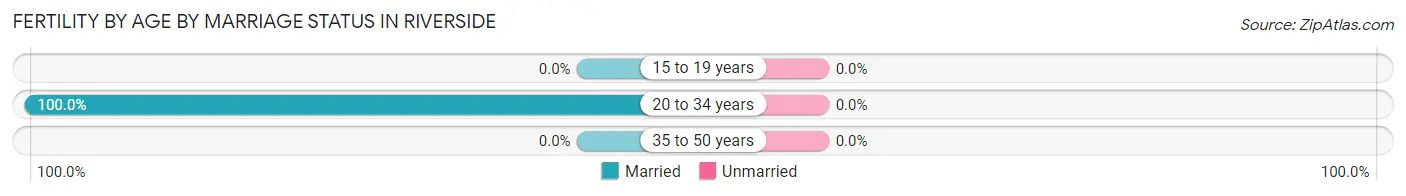
| Age Bracket | Married | Unmarried |
| 15 to 19 years | 0 (0.0%) | 0 (0.0%) |
| 20 to 34 years | 42 (100.0%) | 0 (0.0%) |
| 35 to 50 years | 0 (0.0%) | 0 (0.0%) |
| Total | 42 (100.0%) | 0 (0.0%) |
Fertility by Education in Riverside
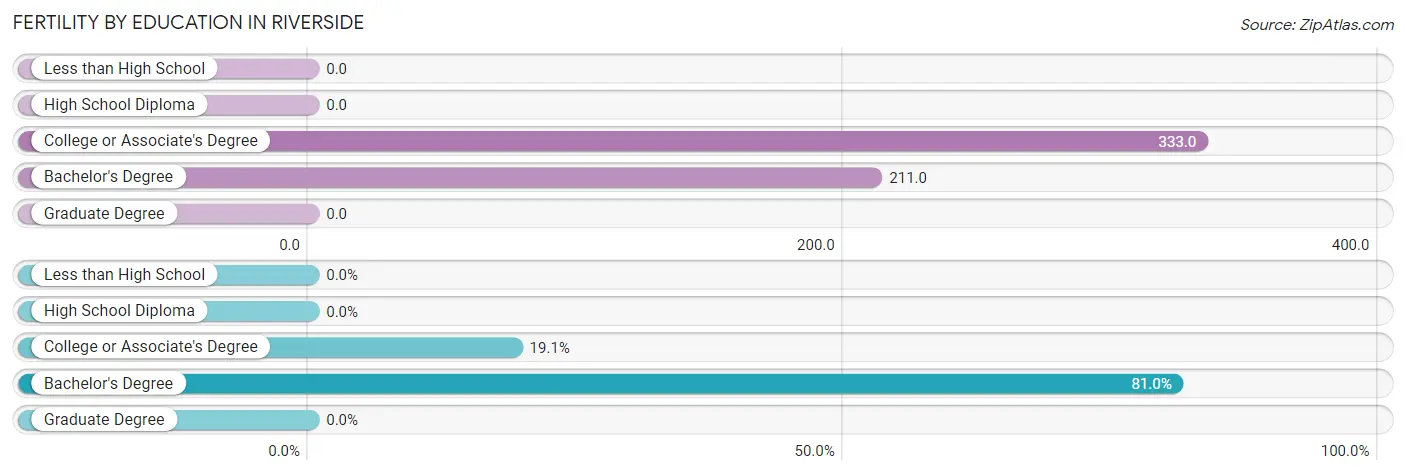
| Educational Attainment | Women with Births | Births / 1,000 Women |
| Less than High School | 0 (0.0%) | 0.0 |
| High School Diploma | 0 (0.0%) | 0.0 |
| College or Associate's Degree | 8 (19.1%) | 333.0 |
| Bachelor's Degree | 34 (80.9%) | 211.0 |
| Graduate Degree | 0 (0.0%) | 0.0 |
| Total | 42 (100.0%) | 55.0 |
Fertility by Education by Marriage Status in Riverside
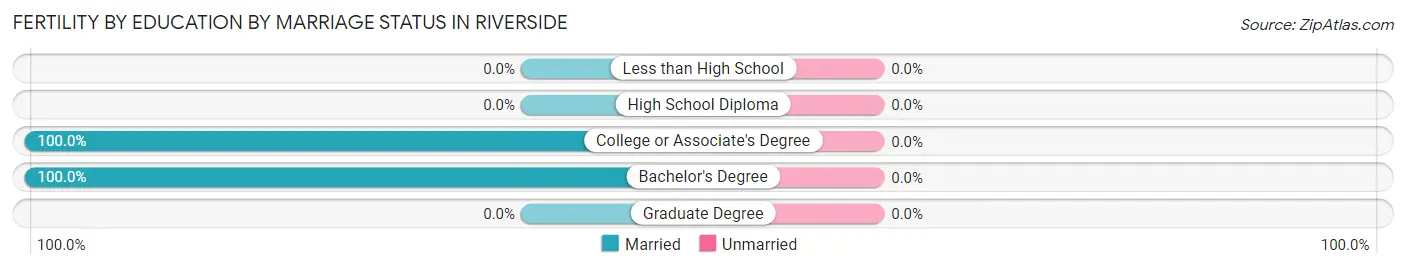
| Educational Attainment | Married | Unmarried |
| Less than High School | 0 (0.0%) | 0 (0.0%) |
| High School Diploma | 0 (0.0%) | 0 (0.0%) |
| College or Associate's Degree | 8 (100.0%) | 0 (0.0%) |
| Bachelor's Degree | 34 (100.0%) | 0 (0.0%) |
| Graduate Degree | 0 (0.0%) | 0 (0.0%) |
| Total | 42 (100.0%) | 0 (0.0%) |
Employment Characteristics in Riverside
Employment by Class of Employer in Riverside
Among the 1,709 employed individuals in Riverside, private company employees (1,170 | 68.5%), local government employees (164 | 9.6%), and not-for-profit organizations (149 | 8.7%) make up the most common classes of employment.
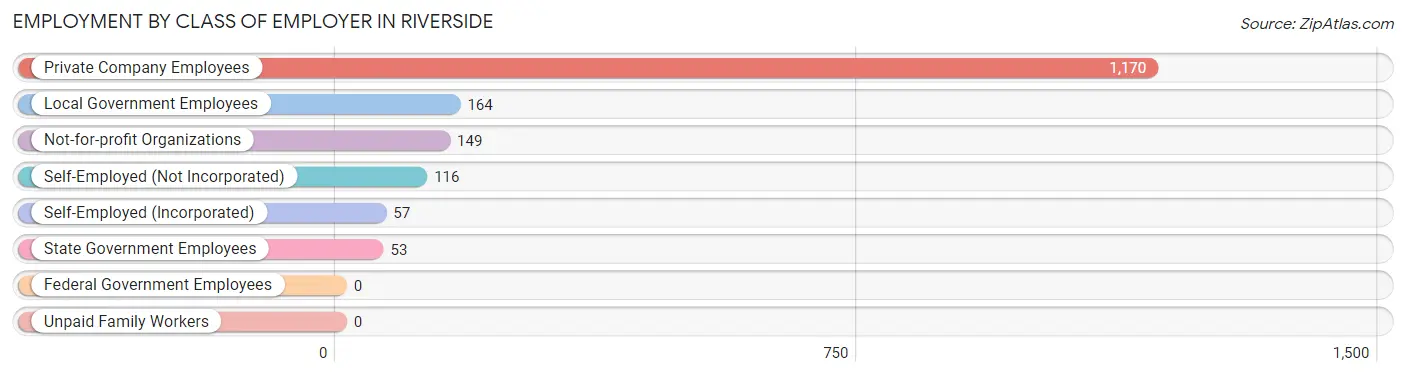
| Employer Class | # Employees | % Employees |
| Private Company Employees | 1,170 | 68.5% |
| Self-Employed (Incorporated) | 57 | 3.3% |
| Self-Employed (Not Incorporated) | 116 | 6.8% |
| Not-for-profit Organizations | 149 | 8.7% |
| Local Government Employees | 164 | 9.6% |
| State Government Employees | 53 | 3.1% |
| Federal Government Employees | 0 | 0.0% |
| Unpaid Family Workers | 0 | 0.0% |
| Total | 1,709 | 100.0% |
Employment Status by Age in Riverside
According to the labor force statistics for Riverside, out of the total population over 16 years of age (3,085), 59.7% or 1,842 individuals are in the labor force, with 4.6% or 85 of them unemployed. The age group with the highest labor force participation rate is 45 to 54 years, with 89.8% or 333 individuals in the labor force. Within the labor force, the 16 to 19 years age range has the highest percentage of unemployed individuals, with 24.1% or 34 of them being unemployed.
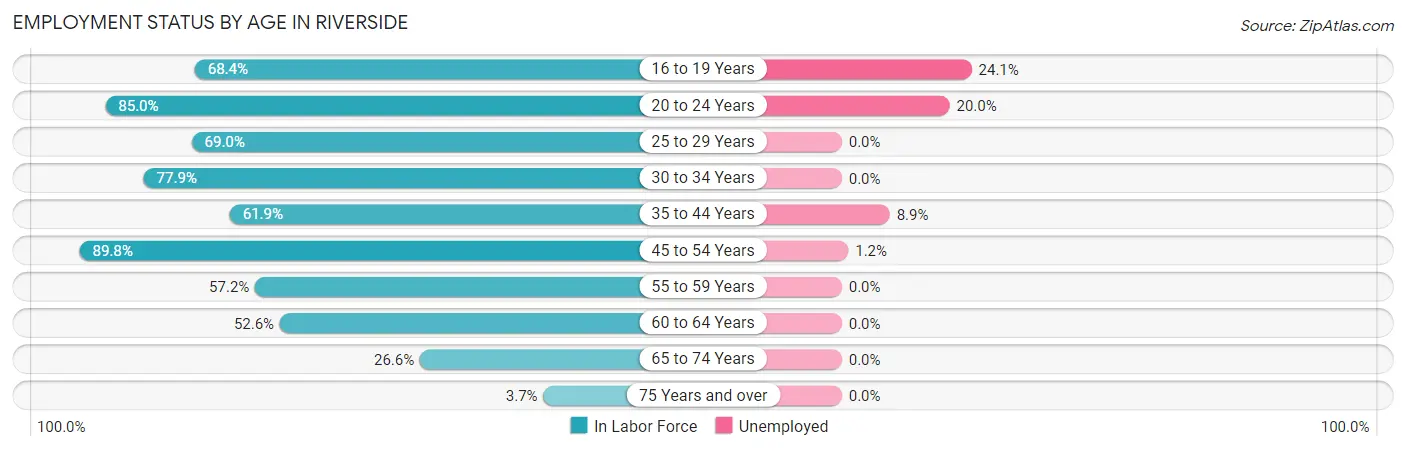
| Age Bracket | In Labor Force | Unemployed |
| 16 to 19 Years | 141 (68.4%) | 34 (24.1%) |
| 20 to 24 Years | 85 (85.0%) | 17 (20.0%) |
| 25 to 29 Years | 232 (69.0%) | 0 (0.0%) |
| 30 to 34 Years | 342 (77.9%) | 0 (0.0%) |
| 35 to 44 Years | 325 (61.9%) | 29 (8.9%) |
| 45 to 54 Years | 333 (89.8%) | 4 (1.2%) |
| 55 to 59 Years | 115 (57.2%) | 0 (0.0%) |
| 60 to 64 Years | 142 (52.6%) | 0 (0.0%) |
| 65 to 74 Years | 119 (26.6%) | 0 (0.0%) |
| 75 Years and over | 7 (3.7%) | 0 (0.0%) |
| Total | 1,842 (59.7%) | 85 (4.6%) |
Employment Status by Educational Attainment in Riverside
According to labor force statistics for Riverside, 69.5% of individuals (1,489) out of the total population between 25 and 64 years of age (2,142) are in the labor force, with 2.2% or 33 of them being unemployed. The group with the highest labor force participation rate are those with the educational attainment of bachelor's degree or higher, with 75.3% or 638 individuals in the labor force. Within the labor force, individuals with high school diploma education have the highest percentage of unemployment, with 9.1% or 33 of them being unemployed.
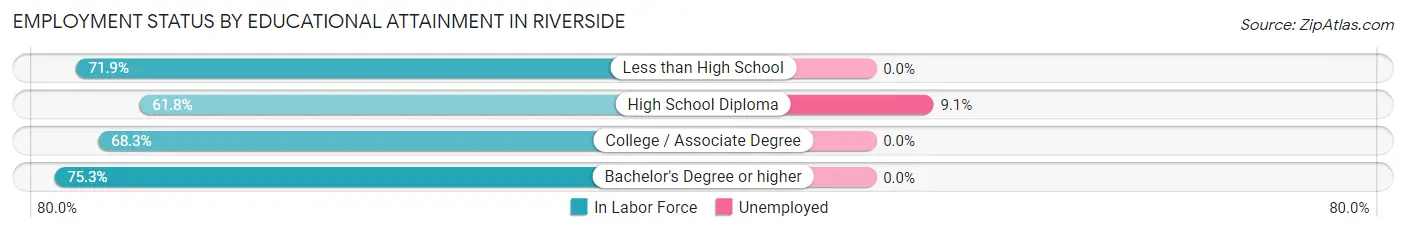
| Educational Attainment | In Labor Force | Unemployed |
| Less than High School | 87 (71.9%) | 0 (0.0%) |
| High School Diploma | 363 (61.8%) | 53 (9.1%) |
| College / Associate Degree | 401 (68.3%) | 0 (0.0%) |
| Bachelor's Degree or higher | 638 (75.3%) | 0 (0.0%) |
| Total | 1,489 (69.5%) | 47 (2.2%) |
Employment Occupations by Sex in Riverside
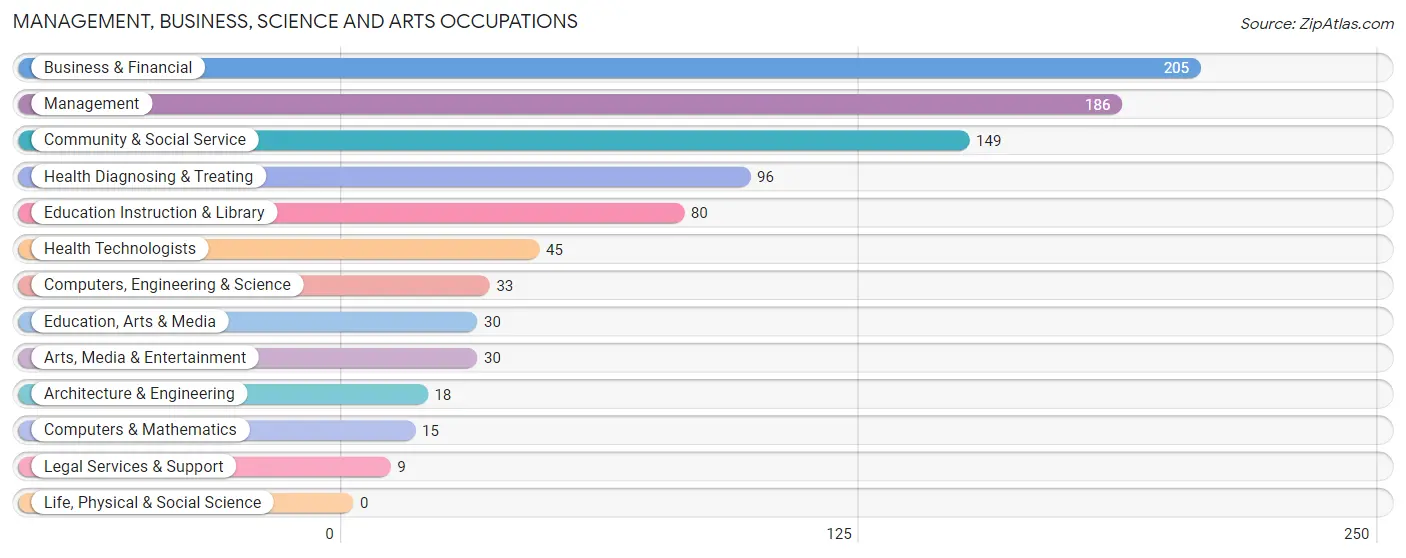
Management, Business, Science and Arts Occupations
The most common Management, Business, Science and Arts occupations in Riverside are Business & Financial (205 | 11.7%), Management (186 | 10.6%), Community & Social Service (149 | 8.5%), Health Diagnosing & Treating (96 | 5.5%), and Education Instruction & Library (80 | 4.5%).
Management, Business, Science and Arts Occupations by Sex
Within the Management, Business, Science and Arts occupations in Riverside, the most male-oriented occupations are Computers, Engineering & Science (100.0%), Computers & Mathematics (100.0%), and Architecture & Engineering (100.0%), while the most female-oriented occupations are Education, Arts & Media (96.7%), Health Diagnosing & Treating (93.8%), and Health Technologists (86.7%).
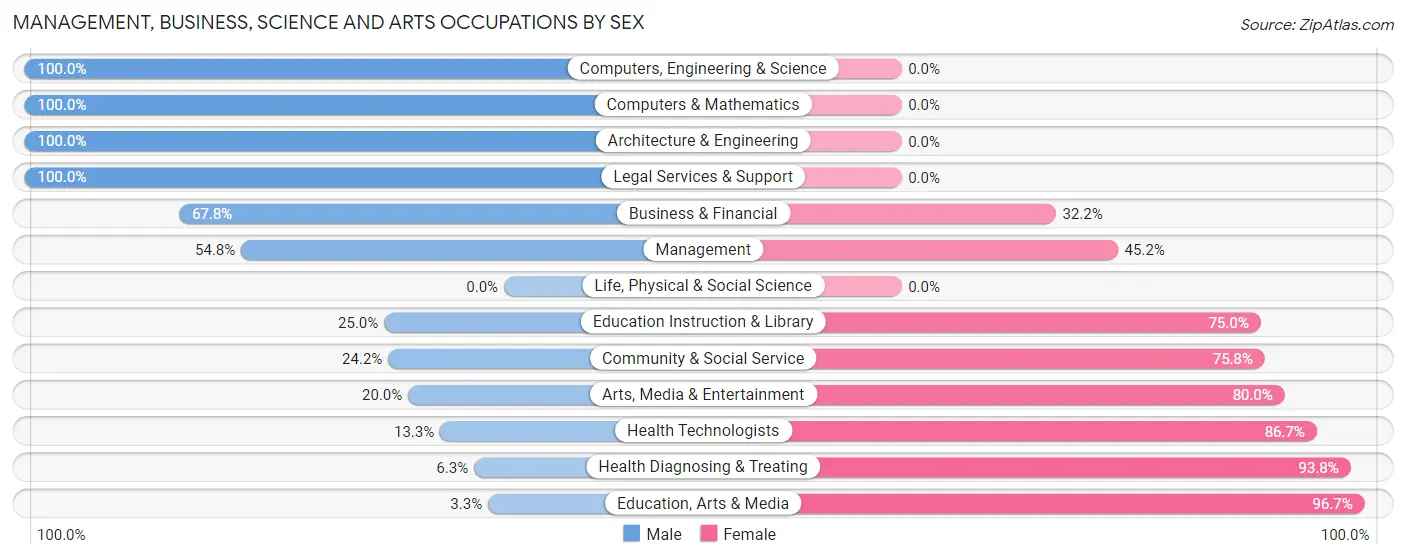
| Occupation | Male | Female |
| Management | 102 (54.8%) | 84 (45.2%) |
| Business & Financial | 139 (67.8%) | 66 (32.2%) |
| Computers, Engineering & Science | 33 (100.0%) | 0 (0.0%) |
| Computers & Mathematics | 15 (100.0%) | 0 (0.0%) |
| Architecture & Engineering | 18 (100.0%) | 0 (0.0%) |
| Life, Physical & Social Science | 0 (0.0%) | 0 (0.0%) |
| Community & Social Service | 36 (24.2%) | 113 (75.8%) |
| Education, Arts & Media | 1 (3.3%) | 29 (96.7%) |
| Legal Services & Support | 9 (100.0%) | 0 (0.0%) |
| Education Instruction & Library | 20 (25.0%) | 60 (75.0%) |
| Arts, Media & Entertainment | 6 (20.0%) | 24 (80.0%) |
| Health Diagnosing & Treating | 6 (6.2%) | 90 (93.8%) |
| Health Technologists | 6 (13.3%) | 39 (86.7%) |
| Total (Category) | 316 (47.2%) | 353 (52.8%) |
| Total (Overall) | 1,078 (61.4%) | 679 (38.7%) |
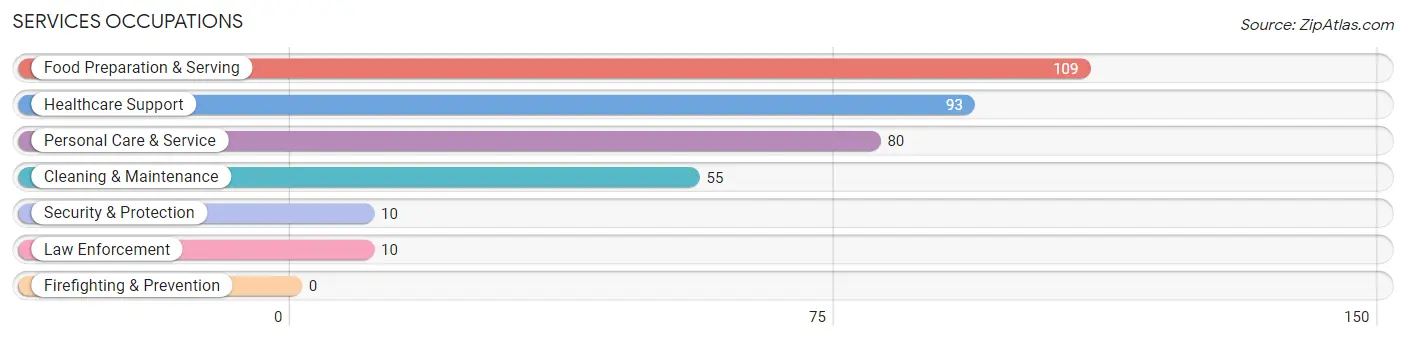
Services Occupations
The most common Services occupations in Riverside are Food Preparation & Serving (109 | 6.2%), Healthcare Support (93 | 5.3%), Personal Care & Service (80 | 4.5%), Cleaning & Maintenance (55 | 3.1%), and Security & Protection (10 | 0.6%).
Services Occupations by Sex
Within the Services occupations in Riverside, the most male-oriented occupations are Security & Protection (100.0%), Law Enforcement (100.0%), and Healthcare Support (88.2%), while the most female-oriented occupations are Personal Care & Service (73.8%), Cleaning & Maintenance (67.3%), and Food Preparation & Serving (28.4%).
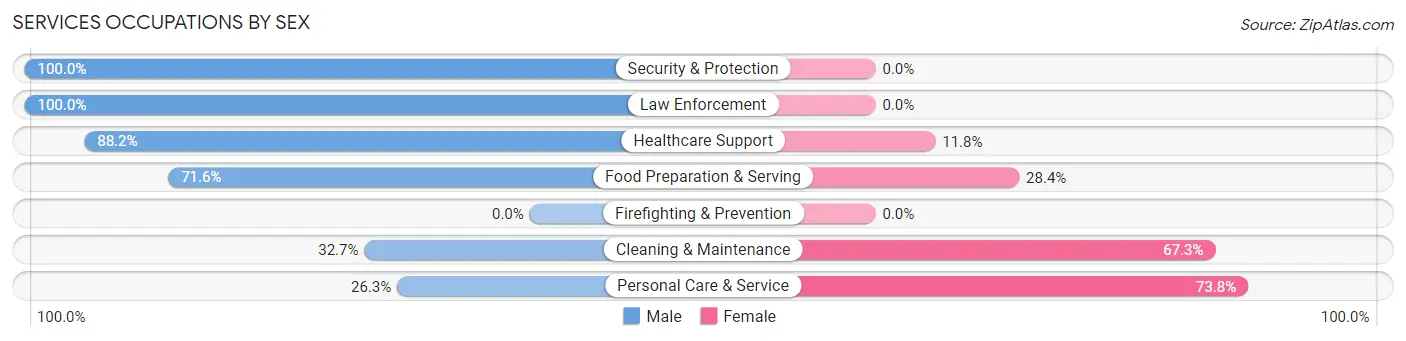
| Occupation | Male | Female |
| Healthcare Support | 82 (88.2%) | 11 (11.8%) |
| Security & Protection | 10 (100.0%) | 0 (0.0%) |
| Firefighting & Prevention | 0 (0.0%) | 0 (0.0%) |
| Law Enforcement | 10 (100.0%) | 0 (0.0%) |
| Food Preparation & Serving | 78 (71.6%) | 31 (28.4%) |
| Cleaning & Maintenance | 18 (32.7%) | 37 (67.3%) |
| Personal Care & Service | 21 (26.3%) | 59 (73.8%) |
| Total (Category) | 209 (60.2%) | 138 (39.8%) |
| Total (Overall) | 1,078 (61.4%) | 679 (38.7%) |
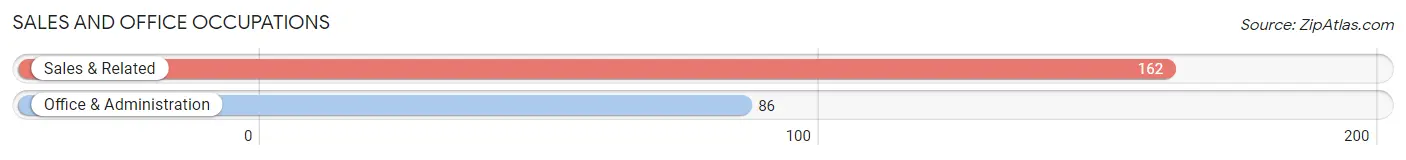
Sales and Office Occupations
The most common Sales and Office occupations in Riverside are Sales & Related (162 | 9.2%), and Office & Administration (86 | 4.9%).
Sales and Office Occupations by Sex
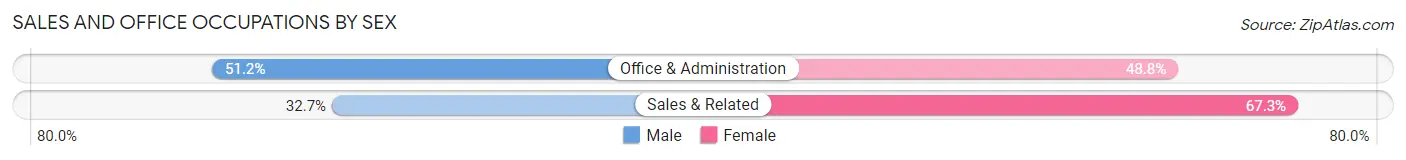
| Occupation | Male | Female |
| Sales & Related | 53 (32.7%) | 109 (67.3%) |
| Office & Administration | 44 (51.2%) | 42 (48.8%) |
| Total (Category) | 97 (39.1%) | 151 (60.9%) |
| Total (Overall) | 1,078 (61.4%) | 679 (38.7%) |
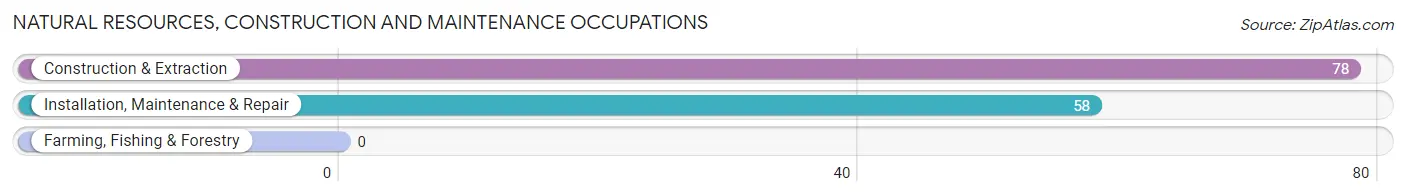
Natural Resources, Construction and Maintenance Occupations
The most common Natural Resources, Construction and Maintenance occupations in Riverside are Construction & Extraction (78 | 4.4%), and Installation, Maintenance & Repair (58 | 3.3%).
Natural Resources, Construction and Maintenance Occupations by Sex
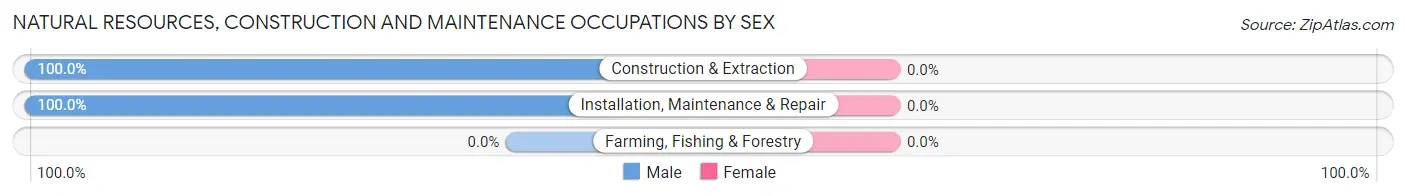
| Occupation | Male | Female |
| Farming, Fishing & Forestry | 0 (0.0%) | 0 (0.0%) |
| Construction & Extraction | 78 (100.0%) | 0 (0.0%) |
| Installation, Maintenance & Repair | 58 (100.0%) | 0 (0.0%) |
| Total (Category) | 136 (100.0%) | 0 (0.0%) |
| Total (Overall) | 1,078 (61.4%) | 679 (38.7%) |
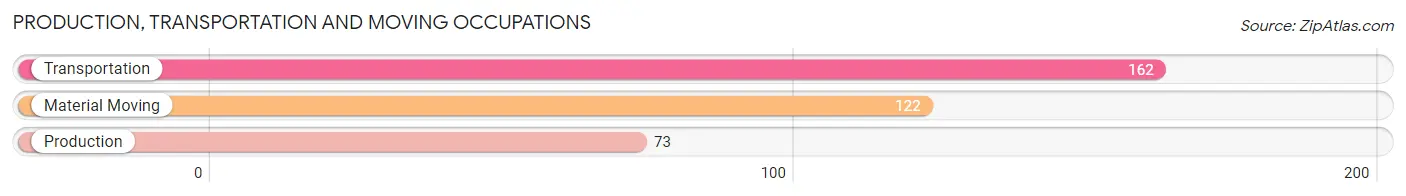
Production, Transportation and Moving Occupations
The most common Production, Transportation and Moving occupations in Riverside are Transportation (162 | 9.2%), Material Moving (122 | 6.9%), and Production (73 | 4.2%).
Production, Transportation and Moving Occupations by Sex
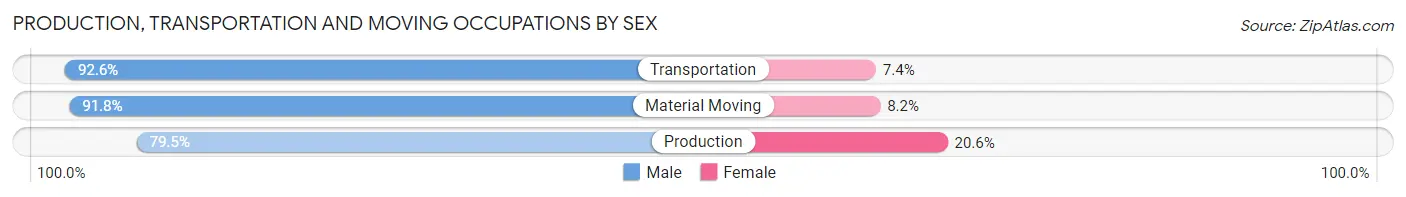
| Occupation | Male | Female |
| Production | 58 (79.4%) | 15 (20.5%) |
| Transportation | 150 (92.6%) | 12 (7.4%) |
| Material Moving | 112 (91.8%) | 10 (8.2%) |
| Total (Category) | 320 (89.6%) | 37 (10.4%) |
| Total (Overall) | 1,078 (61.4%) | 679 (38.7%) |
Employment Industries by Sex in Riverside
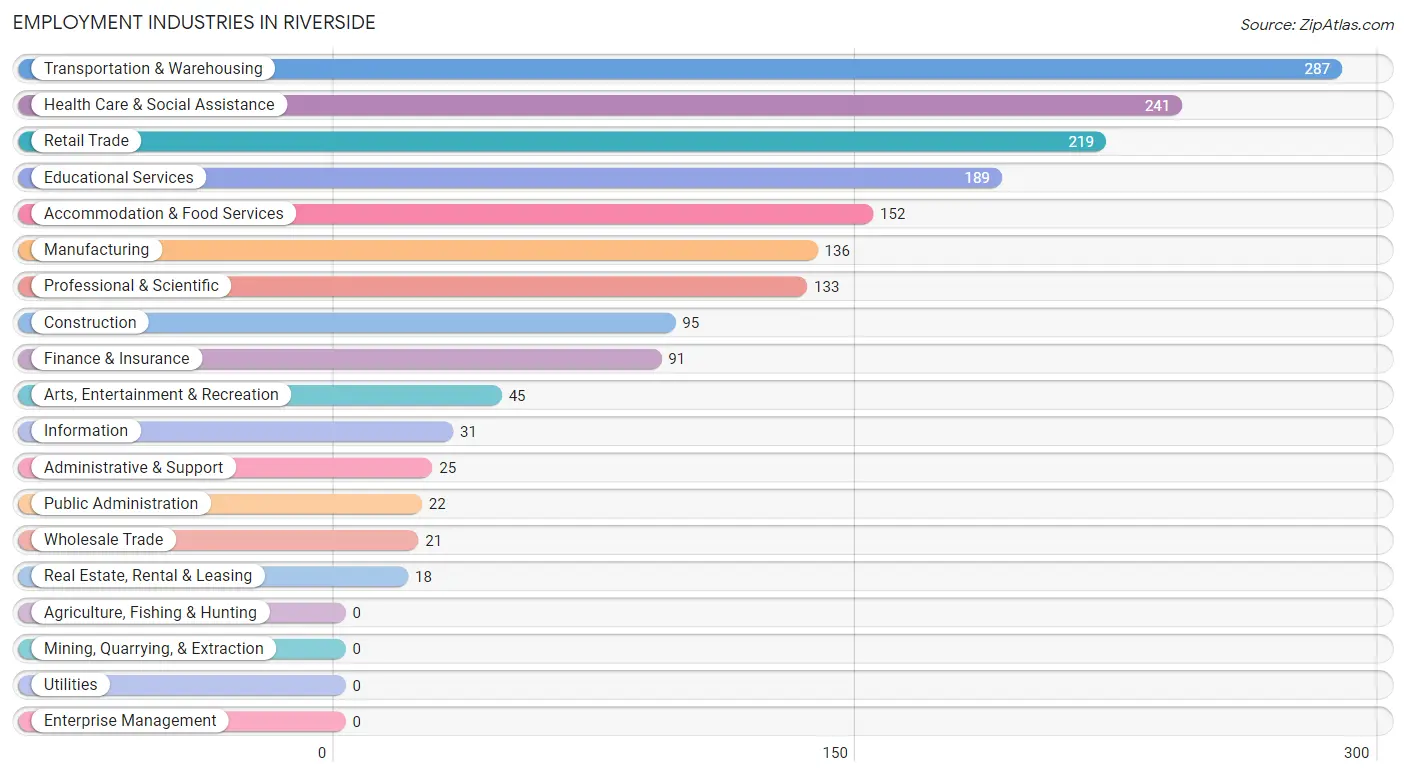
Employment Industries in Riverside
The major employment industries in Riverside include Transportation & Warehousing (287 | 16.3%), Health Care & Social Assistance (241 | 13.7%), Retail Trade (219 | 12.5%), Educational Services (189 | 10.8%), and Accommodation & Food Services (152 | 8.6%).
Employment Industries by Sex in Riverside
The Riverside industries that see more men than women are Construction (100.0%), Wholesale Trade (100.0%), and Transportation & Warehousing (92.3%), whereas the industries that tend to have a higher number of women are Information (100.0%), Finance & Insurance (81.3%), and Real Estate, Rental & Leasing (66.7%).
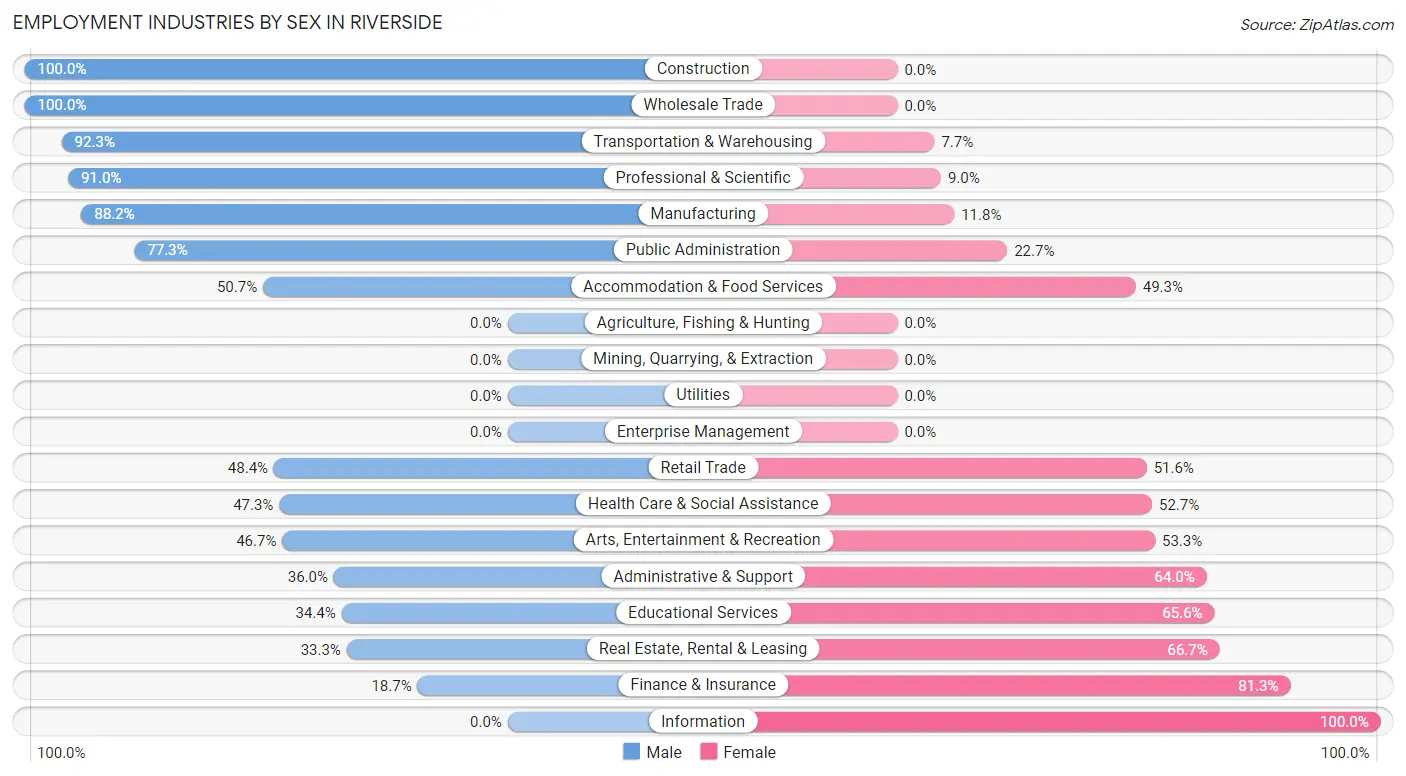
| Industry | Male | Female |
| Agriculture, Fishing & Hunting | 0 (0.0%) | 0 (0.0%) |
| Mining, Quarrying, & Extraction | 0 (0.0%) | 0 (0.0%) |
| Construction | 95 (100.0%) | 0 (0.0%) |
| Manufacturing | 120 (88.2%) | 16 (11.8%) |
| Wholesale Trade | 21 (100.0%) | 0 (0.0%) |
| Retail Trade | 106 (48.4%) | 113 (51.6%) |
| Transportation & Warehousing | 265 (92.3%) | 22 (7.7%) |
| Utilities | 0 (0.0%) | 0 (0.0%) |
| Information | 0 (0.0%) | 31 (100.0%) |
| Finance & Insurance | 17 (18.7%) | 74 (81.3%) |
| Real Estate, Rental & Leasing | 6 (33.3%) | 12 (66.7%) |
| Professional & Scientific | 121 (91.0%) | 12 (9.0%) |
| Enterprise Management | 0 (0.0%) | 0 (0.0%) |
| Administrative & Support | 9 (36.0%) | 16 (64.0%) |
| Educational Services | 65 (34.4%) | 124 (65.6%) |
| Health Care & Social Assistance | 114 (47.3%) | 127 (52.7%) |
| Arts, Entertainment & Recreation | 21 (46.7%) | 24 (53.3%) |
| Accommodation & Food Services | 77 (50.7%) | 75 (49.3%) |
| Public Administration | 17 (77.3%) | 5 (22.7%) |
| Total | 1,078 (61.4%) | 679 (38.7%) |
Education in Riverside
School Enrollment in Riverside
The most common levels of schooling among the 845 students in Riverside are middle school (209 | 24.7%), elementary school (164 | 19.4%), and college / undergraduate (117 | 13.9%).
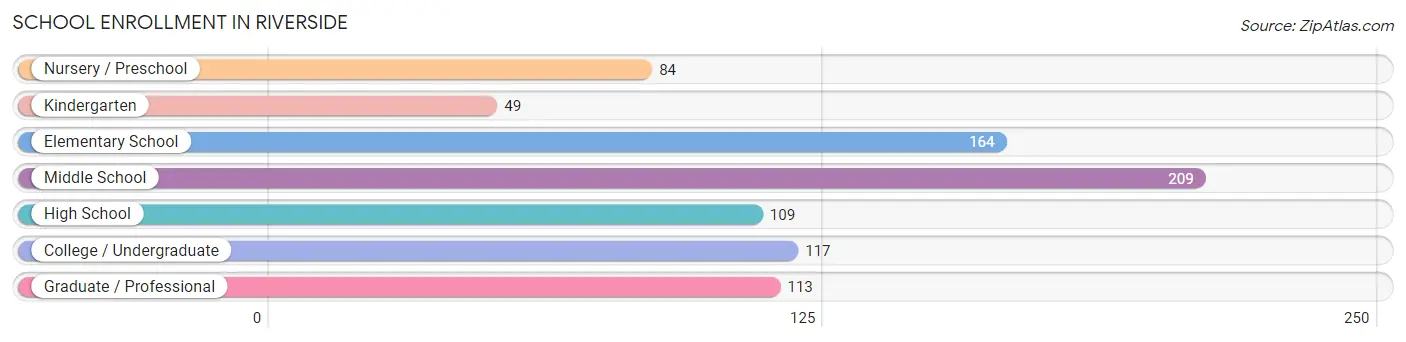
| School Level | # Students | % Students |
| Nursery / Preschool | 84 | 9.9% |
| Kindergarten | 49 | 5.8% |
| Elementary School | 164 | 19.4% |
| Middle School | 209 | 24.7% |
| High School | 109 | 12.9% |
| College / Undergraduate | 117 | 13.9% |
| Graduate / Professional | 113 | 13.4% |
| Total | 845 | 100.0% |
School Enrollment by Age by Funding Source in Riverside
Out of a total of 845 students who are enrolled in schools in Riverside, 134 (15.9%) attend a private institution, while the remaining 711 (84.1%) are enrolled in public schools. The age group of 25 to 34 year olds has the highest likelihood of being enrolled in private schools, with 52 (34.9% in the age bracket) enrolled. Conversely, the age group of 15 to 17 year olds has the lowest likelihood of being enrolled in a private school, with 92 (100.0% in the age bracket) attending a public institution.
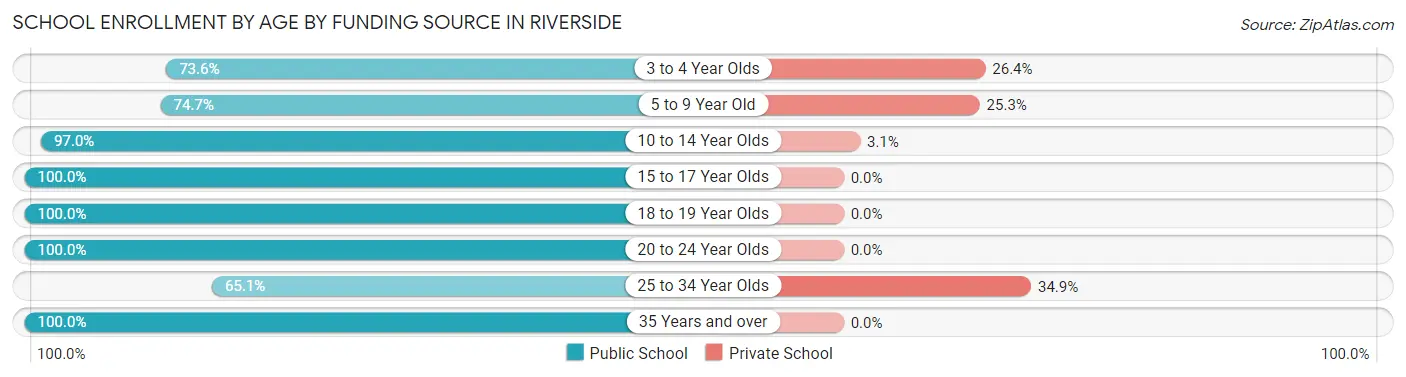
| Age Bracket | Public School | Private School |
| 3 to 4 Year Olds | 53 (73.6%) | 19 (26.4%) |
| 5 to 9 Year Old | 168 (74.7%) | 57 (25.3%) |
| 10 to 14 Year Olds | 191 (97.0%) | 6 (3.0%) |
| 15 to 17 Year Olds | 92 (100.0%) | 0 (0.0%) |
| 18 to 19 Year Olds | 53 (100.0%) | 0 (0.0%) |
| 20 to 24 Year Olds | 17 (100.0%) | 0 (0.0%) |
| 25 to 34 Year Olds | 97 (65.1%) | 52 (34.9%) |
| 35 Years and over | 40 (100.0%) | 0 (0.0%) |
| Total | 711 (84.1%) | 134 (15.9%) |
Educational Attainment by Field of Study in Riverside
Business (241 | 21.5%), arts & humanities (126 | 11.2%), communications (113 | 10.1%), education (111 | 9.9%), and engineering (109 | 9.7%) are the most common fields of study among 1,121 individuals in Riverside who have obtained a bachelor's degree or higher.
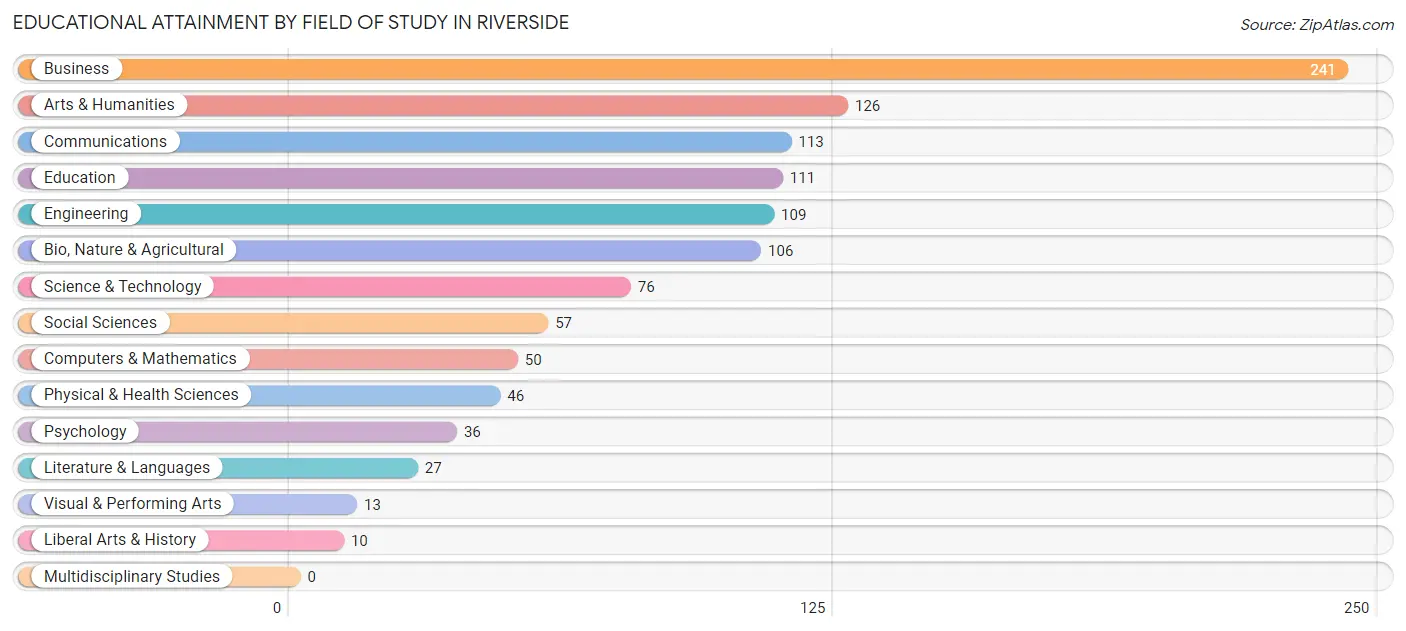
| Field of Study | # Graduates | % Graduates |
| Computers & Mathematics | 50 | 4.5% |
| Bio, Nature & Agricultural | 106 | 9.5% |
| Physical & Health Sciences | 46 | 4.1% |
| Psychology | 36 | 3.2% |
| Social Sciences | 57 | 5.1% |
| Engineering | 109 | 9.7% |
| Multidisciplinary Studies | 0 | 0.0% |
| Science & Technology | 76 | 6.8% |
| Business | 241 | 21.5% |
| Education | 111 | 9.9% |
| Literature & Languages | 27 | 2.4% |
| Liberal Arts & History | 10 | 0.9% |
| Visual & Performing Arts | 13 | 1.2% |
| Communications | 113 | 10.1% |
| Arts & Humanities | 126 | 11.2% |
| Total | 1,121 | 100.0% |
Transportation & Commute in Riverside
Vehicle Availability by Sex in Riverside
The most prevalent vehicle ownership categories in Riverside are males with 2 vehicles (510, accounting for 48.7%) and females with 2 vehicles (291, making up 77.7%).
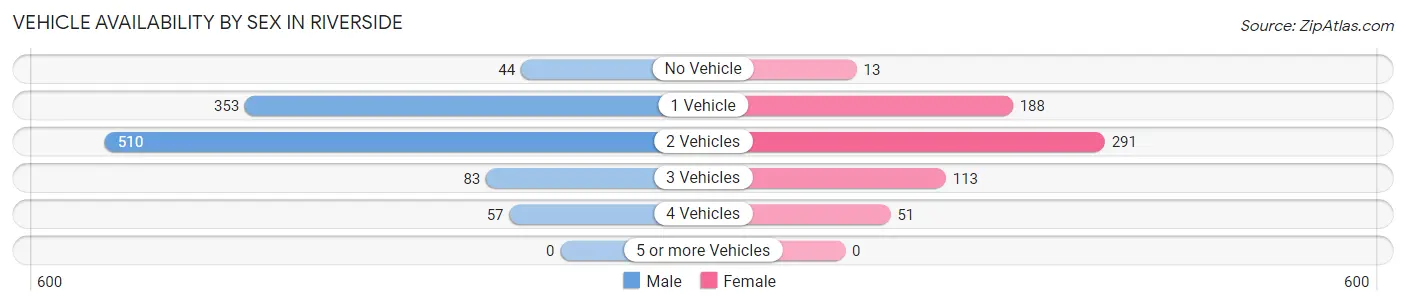
| Vehicles Available | Male | Female |
| No Vehicle | 44 (4.2%) | 13 (2.0%) |
| 1 Vehicle | 353 (33.7%) | 188 (28.7%) |
| 2 Vehicles | 510 (48.7%) | 291 (44.4%) |
| 3 Vehicles | 83 (7.9%) | 113 (17.2%) |
| 4 Vehicles | 57 (5.4%) | 51 (7.8%) |
| 5 or more Vehicles | 0 (0.0%) | 0 (0.0%) |
| Total | 1,047 (100.0%) | 656 (100.0%) |
Commute Time in Riverside
The most frequently occuring commute durations in Riverside are 20 to 24 minutes (397 commuters, 29.1%), 15 to 19 minutes (351 commuters, 25.7%), and 10 to 14 minutes (278 commuters, 20.3%).
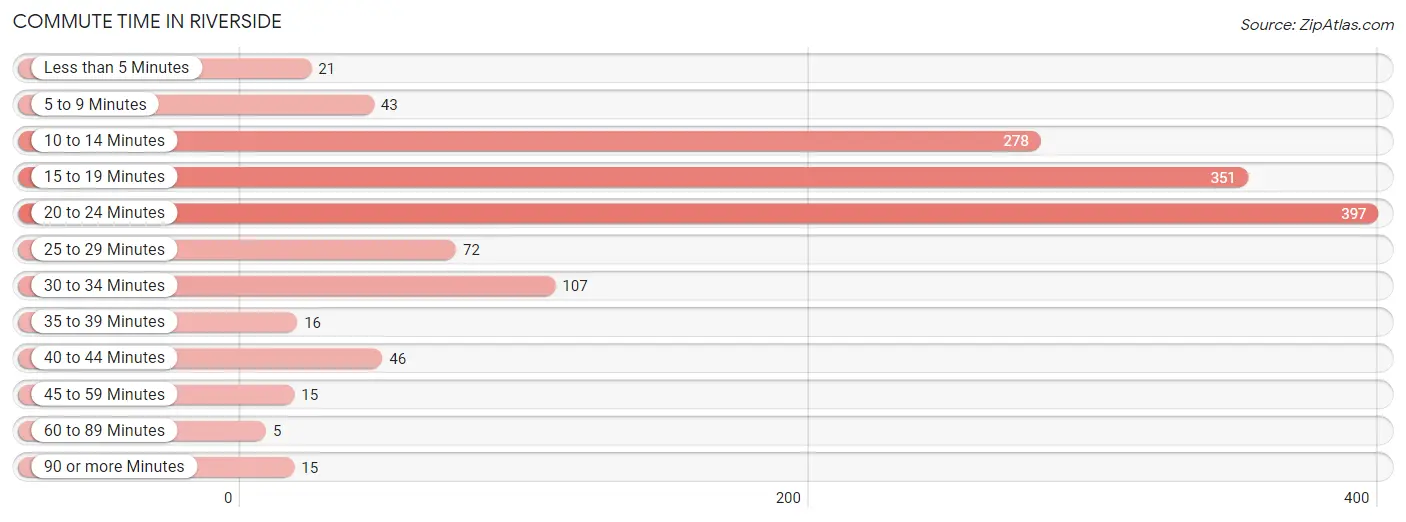
| Commute Time | # Commuters | % Commuters |
| Less than 5 Minutes | 21 | 1.5% |
| 5 to 9 Minutes | 43 | 3.2% |
| 10 to 14 Minutes | 278 | 20.3% |
| 15 to 19 Minutes | 351 | 25.7% |
| 20 to 24 Minutes | 397 | 29.1% |
| 25 to 29 Minutes | 72 | 5.3% |
| 30 to 34 Minutes | 107 | 7.8% |
| 35 to 39 Minutes | 16 | 1.2% |
| 40 to 44 Minutes | 46 | 3.4% |
| 45 to 59 Minutes | 15 | 1.1% |
| 60 to 89 Minutes | 5 | 0.4% |
| 90 or more Minutes | 15 | 1.1% |
Commute Time by Sex in Riverside
The most common commute times in Riverside are 20 to 24 minutes (296 commuters, 35.0%) for males and 10 to 14 minutes (166 commuters, 31.9%) for females.
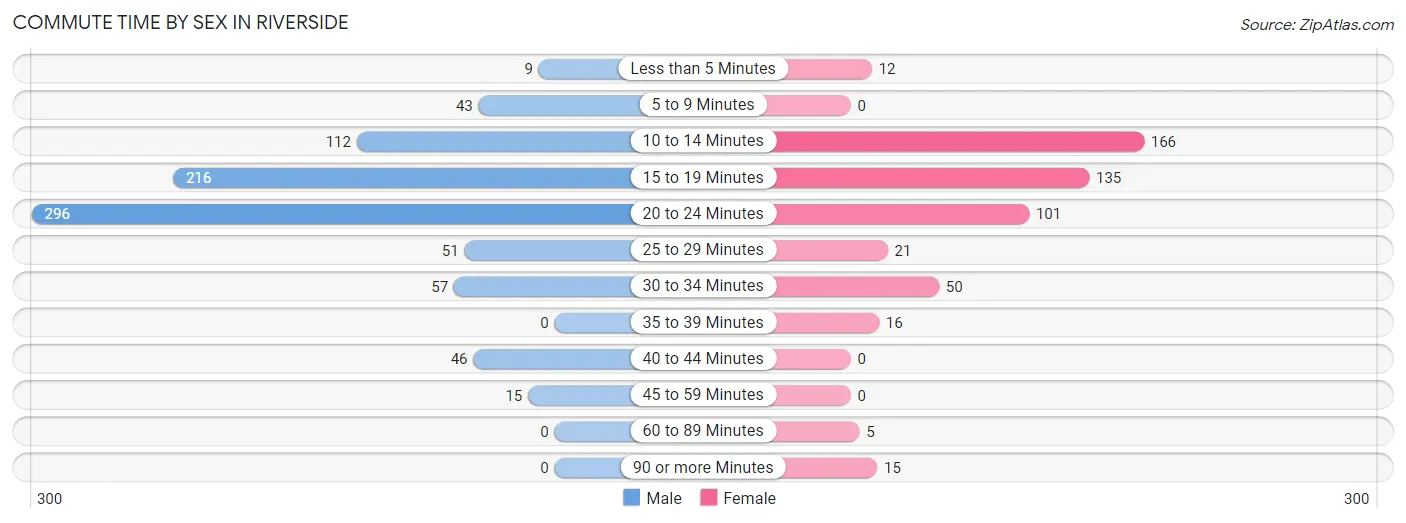
| Commute Time | Male | Female |
| Less than 5 Minutes | 9 (1.1%) | 12 (2.3%) |
| 5 to 9 Minutes | 43 (5.1%) | 0 (0.0%) |
| 10 to 14 Minutes | 112 (13.3%) | 166 (31.9%) |
| 15 to 19 Minutes | 216 (25.6%) | 135 (25.9%) |
| 20 to 24 Minutes | 296 (35.0%) | 101 (19.4%) |
| 25 to 29 Minutes | 51 (6.0%) | 21 (4.0%) |
| 30 to 34 Minutes | 57 (6.8%) | 50 (9.6%) |
| 35 to 39 Minutes | 0 (0.0%) | 16 (3.1%) |
| 40 to 44 Minutes | 46 (5.4%) | 0 (0.0%) |
| 45 to 59 Minutes | 15 (1.8%) | 0 (0.0%) |
| 60 to 89 Minutes | 0 (0.0%) | 5 (1.0%) |
| 90 or more Minutes | 0 (0.0%) | 15 (2.9%) |
Time of Departure to Work by Sex in Riverside
The most frequent times of departure to work in Riverside are 4:00 PM to 11:59 PM (155, 18.3%) for males and 7:00 AM to 7:29 AM (155, 29.7%) for females.
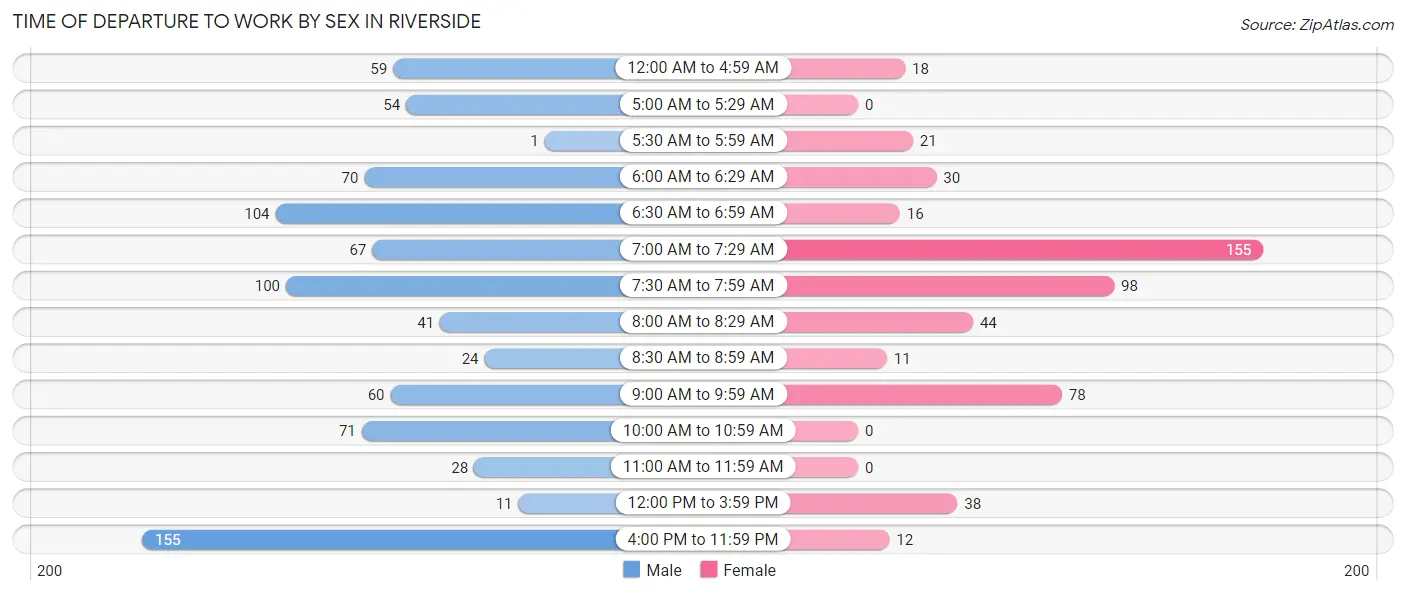
| Time of Departure | Male | Female |
| 12:00 AM to 4:59 AM | 59 (7.0%) | 18 (3.5%) |
| 5:00 AM to 5:29 AM | 54 (6.4%) | 0 (0.0%) |
| 5:30 AM to 5:59 AM | 1 (0.1%) | 21 (4.0%) |
| 6:00 AM to 6:29 AM | 70 (8.3%) | 30 (5.8%) |
| 6:30 AM to 6:59 AM | 104 (12.3%) | 16 (3.1%) |
| 7:00 AM to 7:29 AM | 67 (7.9%) | 155 (29.7%) |
| 7:30 AM to 7:59 AM | 100 (11.8%) | 98 (18.8%) |
| 8:00 AM to 8:29 AM | 41 (4.9%) | 44 (8.5%) |
| 8:30 AM to 8:59 AM | 24 (2.8%) | 11 (2.1%) |
| 9:00 AM to 9:59 AM | 60 (7.1%) | 78 (15.0%) |
| 10:00 AM to 10:59 AM | 71 (8.4%) | 0 (0.0%) |
| 11:00 AM to 11:59 AM | 28 (3.3%) | 0 (0.0%) |
| 12:00 PM to 3:59 PM | 11 (1.3%) | 38 (7.3%) |
| 4:00 PM to 11:59 PM | 155 (18.3%) | 12 (2.3%) |
| Total | 845 (100.0%) | 521 (100.0%) |
Housing Occupancy in Riverside
Occupancy by Ownership in Riverside
Of the total 1,585 dwellings in Riverside, owner-occupied units account for 631 (39.8%), while renter-occupied units make up 954 (60.2%).
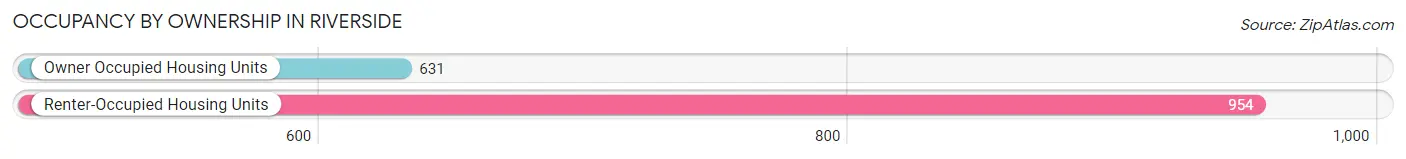
| Occupancy | # Housing Units | % Housing Units |
| Owner Occupied Housing Units | 631 | 39.8% |
| Renter-Occupied Housing Units | 954 | 60.2% |
| Total Occupied Housing Units | 1,585 | 100.0% |
Occupancy by Household Size in Riverside
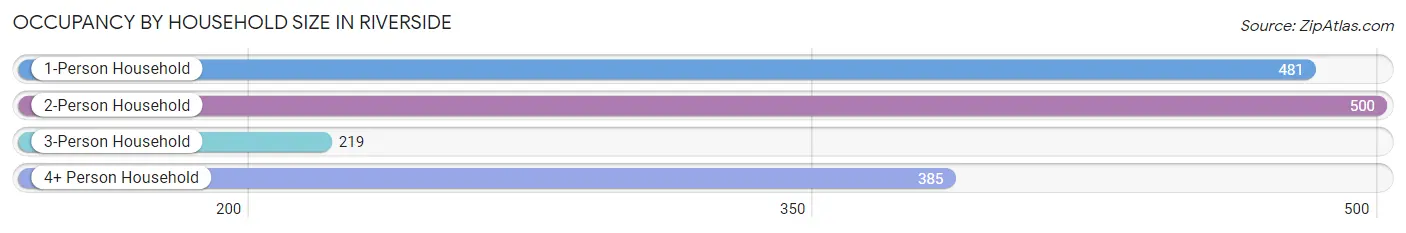
| Household Size | # Housing Units | % Housing Units |
| 1-Person Household | 481 | 30.3% |
| 2-Person Household | 500 | 31.6% |
| 3-Person Household | 219 | 13.8% |
| 4+ Person Household | 385 | 24.3% |
| Total Housing Units | 1,585 | 100.0% |
Occupancy by Ownership by Household Size in Riverside
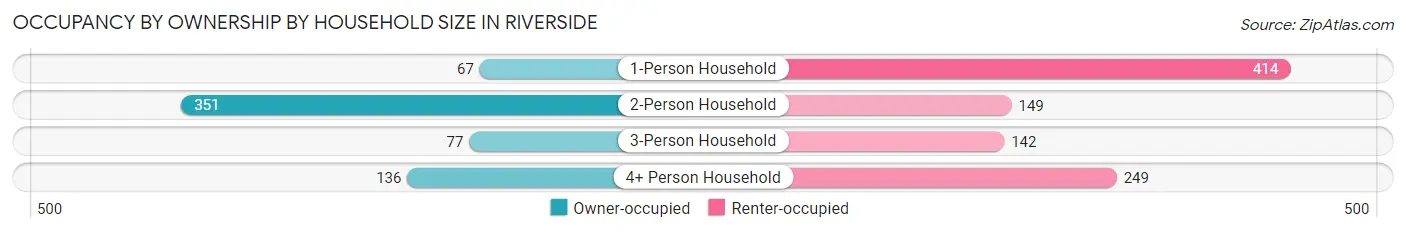
| Household Size | Owner-occupied | Renter-occupied |
| 1-Person Household | 67 (13.9%) | 414 (86.1%) |
| 2-Person Household | 351 (70.2%) | 149 (29.8%) |
| 3-Person Household | 77 (35.2%) | 142 (64.8%) |
| 4+ Person Household | 136 (35.3%) | 249 (64.7%) |
| Total Housing Units | 631 (39.8%) | 954 (60.2%) |
Occupancy by Educational Attainment in Riverside
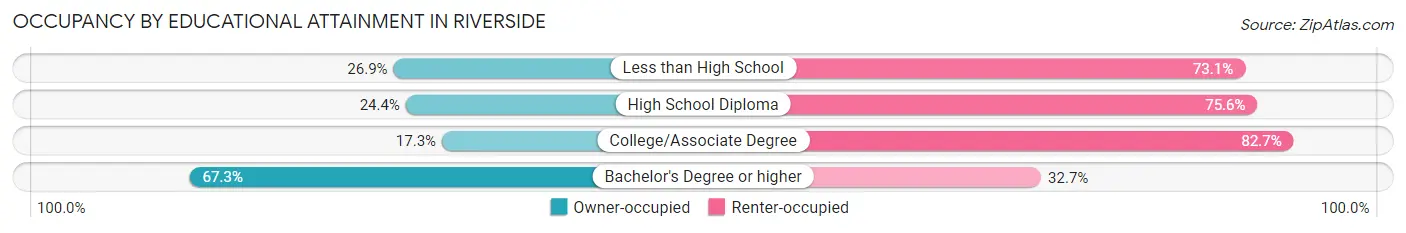
| Household Size | Owner-occupied | Renter-occupied |
| Less than High School | 25 (26.9%) | 68 (73.1%) |
| High School Diploma | 98 (24.4%) | 303 (75.6%) |
| College/Associate Degree | 78 (17.3%) | 374 (82.7%) |
| Bachelor's Degree or higher | 430 (67.3%) | 209 (32.7%) |
Occupancy by Age of Householder in Riverside
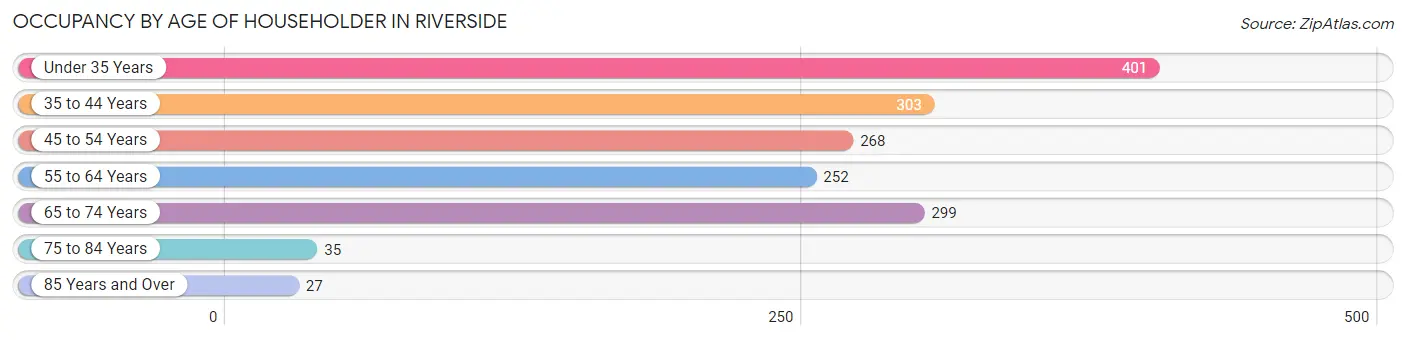
| Age Bracket | # Households | % Households |
| Under 35 Years | 401 | 25.3% |
| 35 to 44 Years | 303 | 19.1% |
| 45 to 54 Years | 268 | 16.9% |
| 55 to 64 Years | 252 | 15.9% |
| 65 to 74 Years | 299 | 18.9% |
| 75 to 84 Years | 35 | 2.2% |
| 85 Years and Over | 27 | 1.7% |
| Total | 1,585 | 100.0% |
Housing Finances in Riverside
Median Income by Occupancy in Riverside
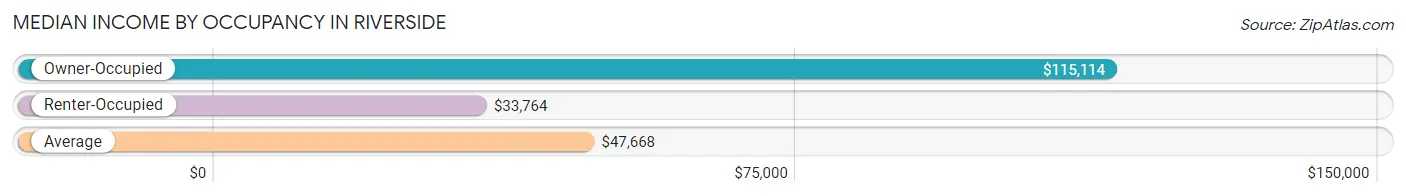
| Occupancy Type | # Households | Median Income |
| Owner-Occupied | 631 (39.8%) | $115,114 |
| Renter-Occupied | 954 (60.2%) | $33,764 |
| Average | 1,585 (100.0%) | $47,668 |
Occupancy by Householder Income Bracket in Riverside
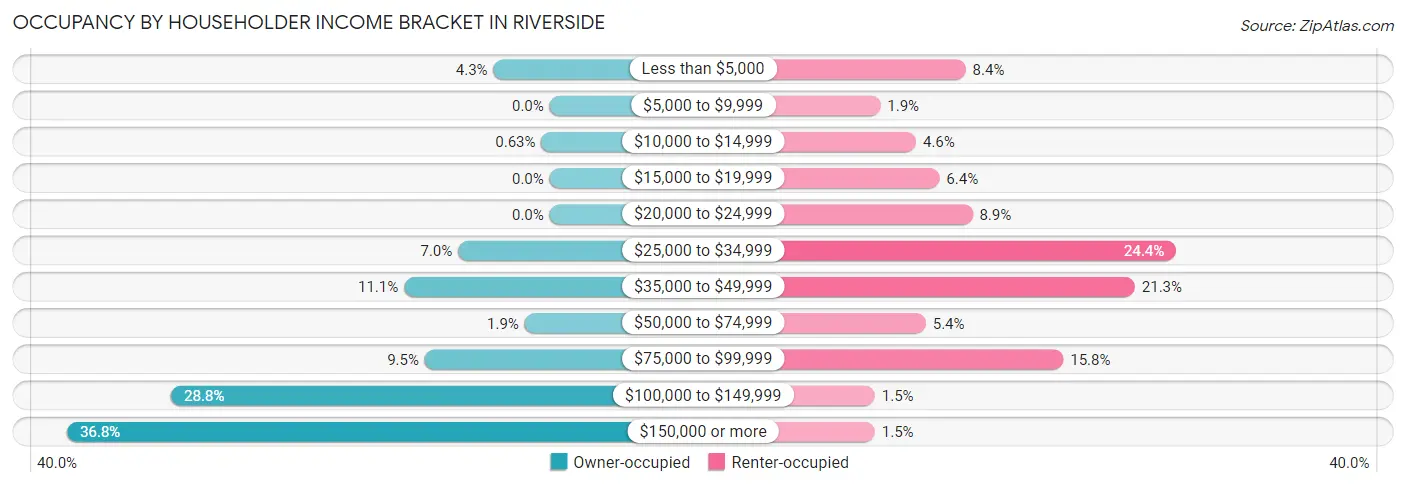
| Income Bracket | Owner-occupied | Renter-occupied |
| Less than $5,000 | 27 (4.3%) | 80 (8.4%) |
| $5,000 to $9,999 | 0 (0.0%) | 18 (1.9%) |
| $10,000 to $14,999 | 4 (0.6%) | 44 (4.6%) |
| $15,000 to $19,999 | 0 (0.0%) | 61 (6.4%) |
| $20,000 to $24,999 | 0 (0.0%) | 85 (8.9%) |
| $25,000 to $34,999 | 44 (7.0%) | 233 (24.4%) |
| $35,000 to $49,999 | 70 (11.1%) | 203 (21.3%) |
| $50,000 to $74,999 | 12 (1.9%) | 51 (5.3%) |
| $75,000 to $99,999 | 60 (9.5%) | 151 (15.8%) |
| $100,000 to $149,999 | 182 (28.8%) | 14 (1.5%) |
| $150,000 or more | 232 (36.8%) | 14 (1.5%) |
| Total | 631 (100.0%) | 954 (100.0%) |
Monthly Housing Cost Tiers in Riverside
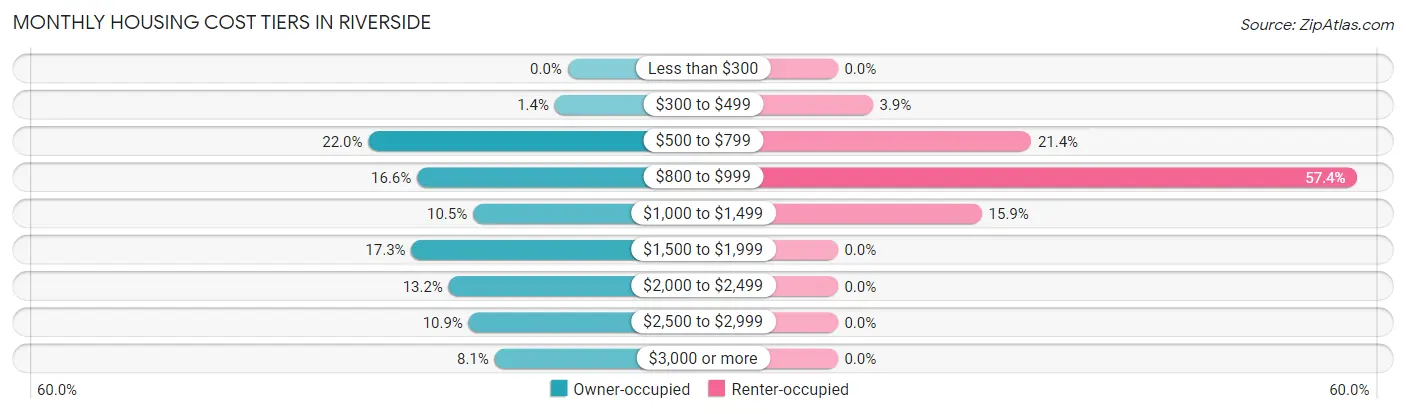
| Monthly Cost | Owner-occupied | Renter-occupied |
| Less than $300 | 0 (0.0%) | 0 (0.0%) |
| $300 to $499 | 9 (1.4%) | 37 (3.9%) |
| $500 to $799 | 139 (22.0%) | 204 (21.4%) |
| $800 to $999 | 105 (16.6%) | 548 (57.4%) |
| $1,000 to $1,499 | 66 (10.5%) | 152 (15.9%) |
| $1,500 to $1,999 | 109 (17.3%) | 0 (0.0%) |
| $2,000 to $2,499 | 83 (13.2%) | 0 (0.0%) |
| $2,500 to $2,999 | 69 (10.9%) | 0 (0.0%) |
| $3,000 or more | 51 (8.1%) | 0 (0.0%) |
| Total | 631 (100.0%) | 954 (100.0%) |
Physical Housing Characteristics in Riverside
Housing Structures in Riverside
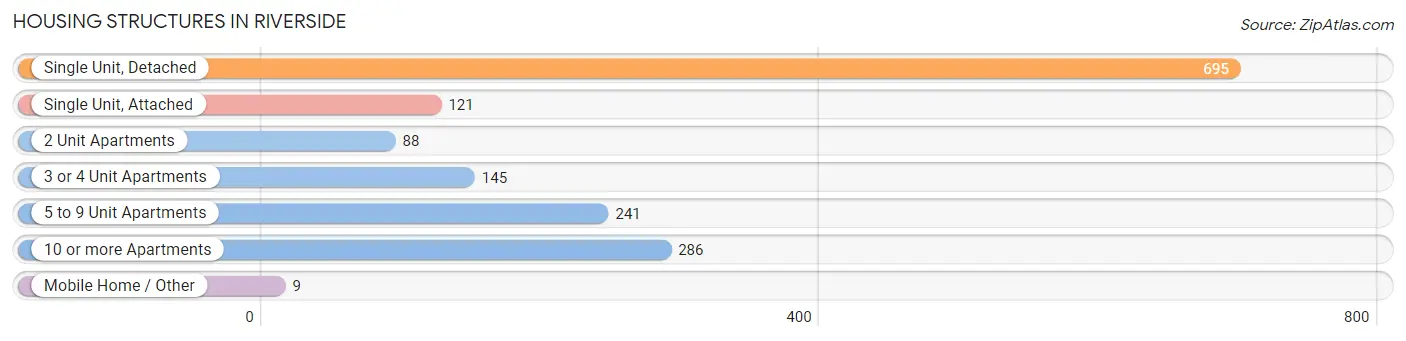
| Structure Type | # Housing Units | % Housing Units |
| Single Unit, Detached | 695 | 43.9% |
| Single Unit, Attached | 121 | 7.6% |
| 2 Unit Apartments | 88 | 5.6% |
| 3 or 4 Unit Apartments | 145 | 9.1% |
| 5 to 9 Unit Apartments | 241 | 15.2% |
| 10 or more Apartments | 286 | 18.0% |
| Mobile Home / Other | 9 | 0.6% |
| Total | 1,585 | 100.0% |
Housing Structures by Occupancy in Riverside
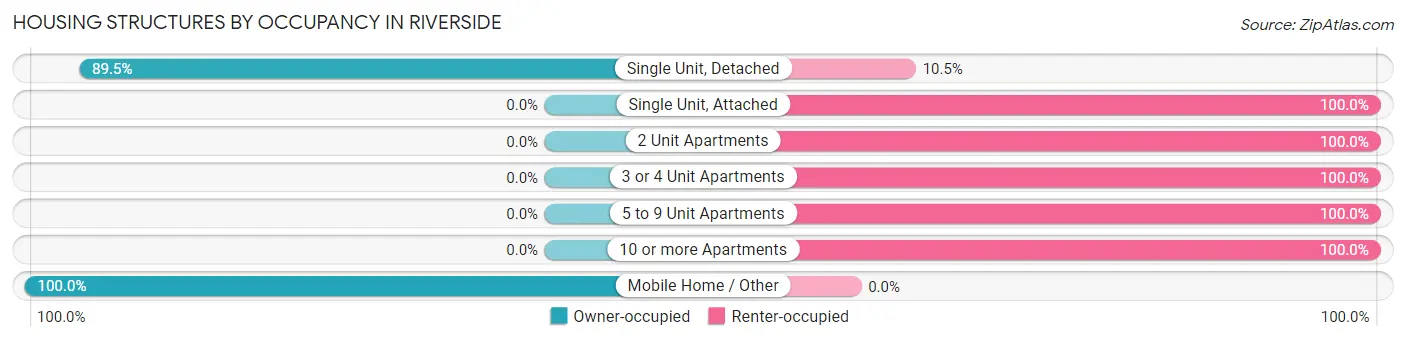
| Structure Type | Owner-occupied | Renter-occupied |
| Single Unit, Detached | 622 (89.5%) | 73 (10.5%) |
| Single Unit, Attached | 0 (0.0%) | 121 (100.0%) |
| 2 Unit Apartments | 0 (0.0%) | 88 (100.0%) |
| 3 or 4 Unit Apartments | 0 (0.0%) | 145 (100.0%) |
| 5 to 9 Unit Apartments | 0 (0.0%) | 241 (100.0%) |
| 10 or more Apartments | 0 (0.0%) | 286 (100.0%) |
| Mobile Home / Other | 9 (100.0%) | 0 (0.0%) |
| Total | 631 (39.8%) | 954 (60.2%) |
Housing Structures by Number of Rooms in Riverside
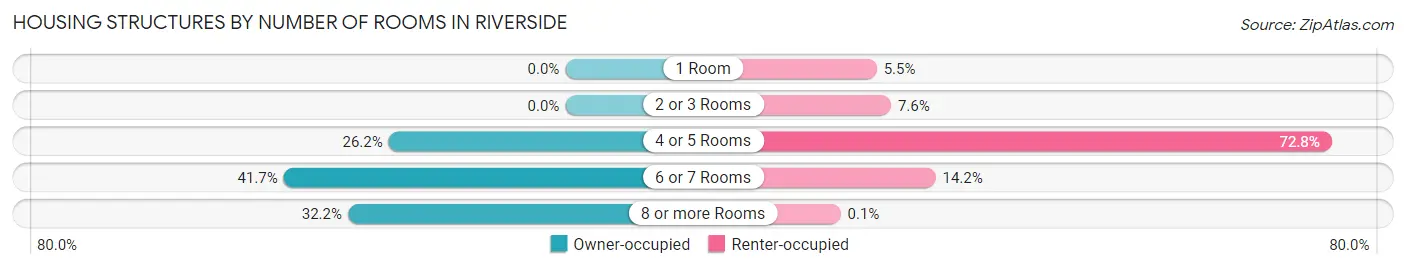
| Number of Rooms | Owner-occupied | Renter-occupied |
| 1 Room | 0 (0.0%) | 52 (5.4%) |
| 2 or 3 Rooms | 0 (0.0%) | 72 (7.5%) |
| 4 or 5 Rooms | 165 (26.2%) | 694 (72.8%) |
| 6 or 7 Rooms | 263 (41.7%) | 135 (14.1%) |
| 8 or more Rooms | 203 (32.2%) | 1 (0.1%) |
| Total | 631 (100.0%) | 954 (100.0%) |
Housing Structure by Heating Type in Riverside
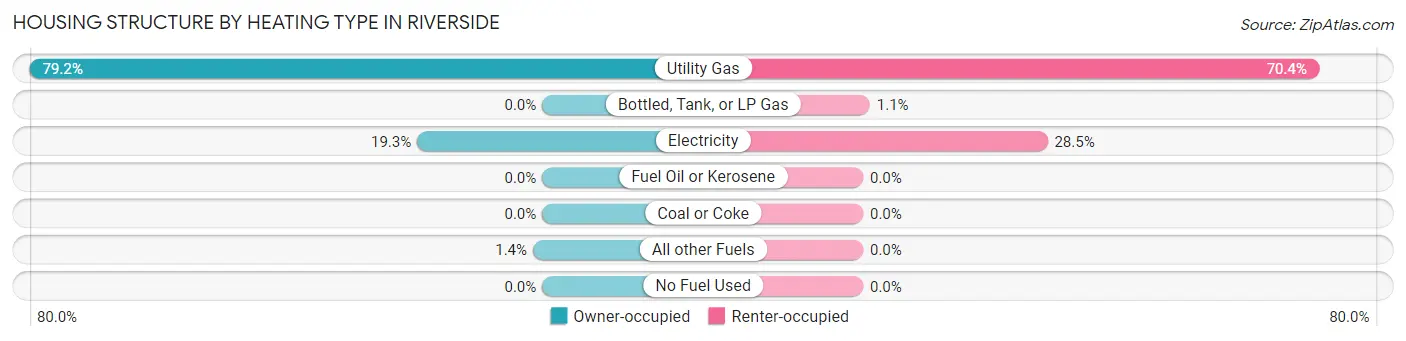
| Heating Type | Owner-occupied | Renter-occupied |
| Utility Gas | 500 (79.2%) | 672 (70.4%) |
| Bottled, Tank, or LP Gas | 0 (0.0%) | 10 (1.1%) |
| Electricity | 122 (19.3%) | 272 (28.5%) |
| Fuel Oil or Kerosene | 0 (0.0%) | 0 (0.0%) |
| Coal or Coke | 0 (0.0%) | 0 (0.0%) |
| All other Fuels | 9 (1.4%) | 0 (0.0%) |
| No Fuel Used | 0 (0.0%) | 0 (0.0%) |
| Total | 631 (100.0%) | 954 (100.0%) |
Household Vehicle Usage in Riverside
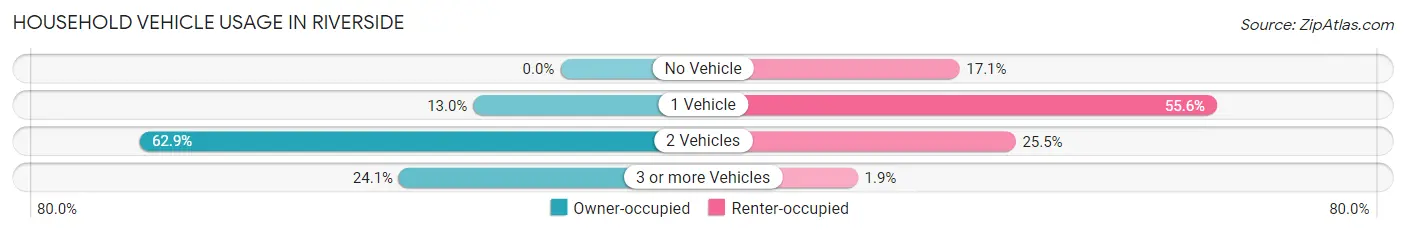
| Vehicles per Household | Owner-occupied | Renter-occupied |
| No Vehicle | 0 (0.0%) | 163 (17.1%) |
| 1 Vehicle | 82 (13.0%) | 530 (55.6%) |
| 2 Vehicles | 397 (62.9%) | 243 (25.5%) |
| 3 or more Vehicles | 152 (24.1%) | 18 (1.9%) |
| Total | 631 (100.0%) | 954 (100.0%) |
Real Estate & Mortgages in Riverside
Real Estate and Mortgage Overview in Riverside
| Characteristic | Without Mortgage | With Mortgage |
| Housing Units | 219 | 412 |
| Median Property Value | $237,000 | $308,300 |
| Median Household Income | $97,014 | $178 |
| Monthly Housing Costs | $661 | $51 |
| Real Estate Taxes | $3,123 | $1 |
Property Value by Mortgage Status in Riverside
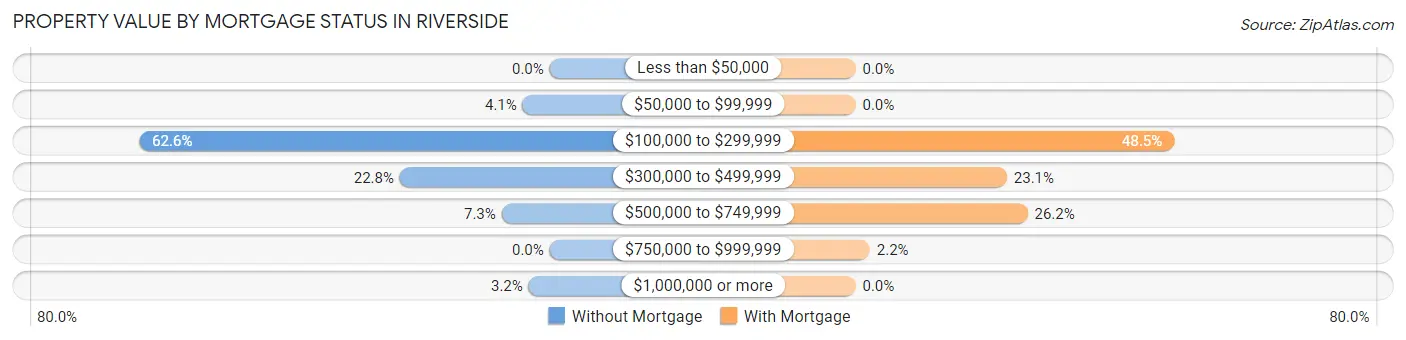
| Property Value | Without Mortgage | With Mortgage |
| Less than $50,000 | 0 (0.0%) | 0 (0.0%) |
| $50,000 to $99,999 | 9 (4.1%) | 0 (0.0%) |
| $100,000 to $299,999 | 137 (62.6%) | 200 (48.5%) |
| $300,000 to $499,999 | 50 (22.8%) | 95 (23.1%) |
| $500,000 to $749,999 | 16 (7.3%) | 108 (26.2%) |
| $750,000 to $999,999 | 0 (0.0%) | 9 (2.2%) |
| $1,000,000 or more | 7 (3.2%) | 0 (0.0%) |
| Total | 219 (100.0%) | 412 (100.0%) |
Household Income by Mortgage Status in Riverside
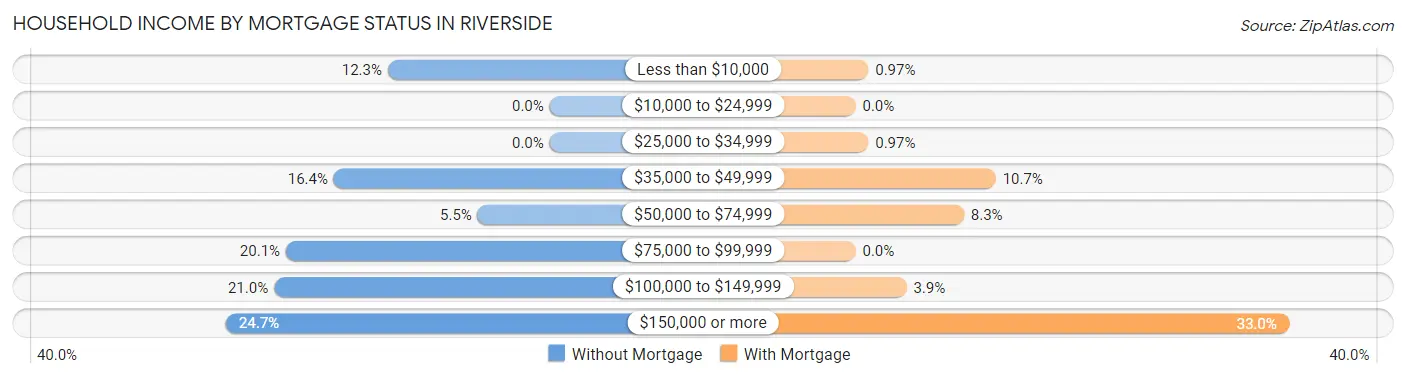
| Household Income | Without Mortgage | With Mortgage |
| Less than $10,000 | 27 (12.3%) | 4 (1.0%) |
| $10,000 to $24,999 | 0 (0.0%) | 0 (0.0%) |
| $25,000 to $34,999 | 0 (0.0%) | 4 (1.0%) |
| $35,000 to $49,999 | 36 (16.4%) | 44 (10.7%) |
| $50,000 to $74,999 | 12 (5.5%) | 34 (8.3%) |
| $75,000 to $99,999 | 44 (20.1%) | 0 (0.0%) |
| $100,000 to $149,999 | 46 (21.0%) | 16 (3.9%) |
| $150,000 or more | 54 (24.7%) | 136 (33.0%) |
| Total | 219 (100.0%) | 412 (100.0%) |
Property Value to Household Income Ratio in Riverside
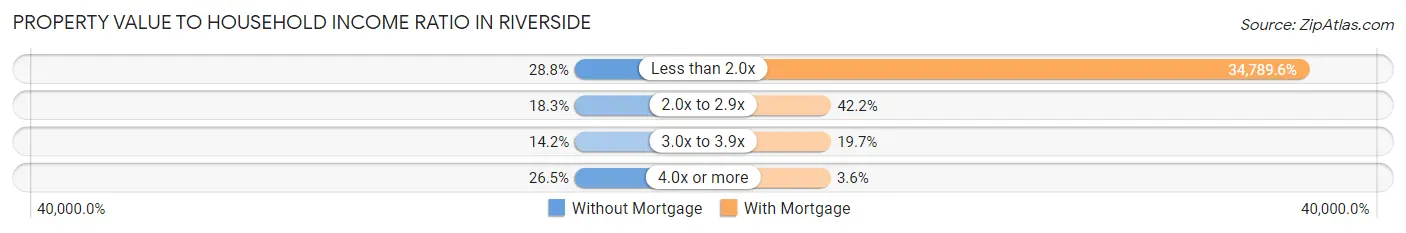
| Value-to-Income Ratio | Without Mortgage | With Mortgage |
| Less than 2.0x | 63 (28.8%) | 143,333 (34,789.6%) |
| 2.0x to 2.9x | 40 (18.3%) | 174 (42.2%) |
| 3.0x to 3.9x | 31 (14.2%) | 81 (19.7%) |
| 4.0x or more | 58 (26.5%) | 15 (3.6%) |
| Total | 219 (100.0%) | 412 (100.0%) |
Real Estate Taxes by Mortgage Status in Riverside
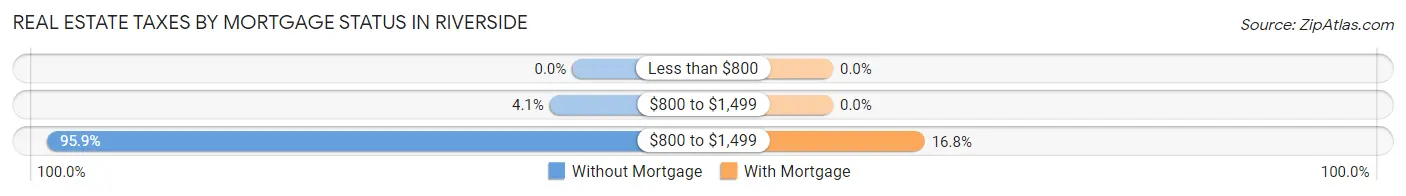
| Property Taxes | Without Mortgage | With Mortgage |
| Less than $800 | 0 (0.0%) | 0 (0.0%) |
| $800 to $1,499 | 9 (4.1%) | 0 (0.0%) |
| $800 to $1,499 | 210 (95.9%) | 69 (16.8%) |
| Total | 219 (100.0%) | 412 (100.0%) |
Health & Disability in Riverside
Health Insurance Coverage by Age in Riverside
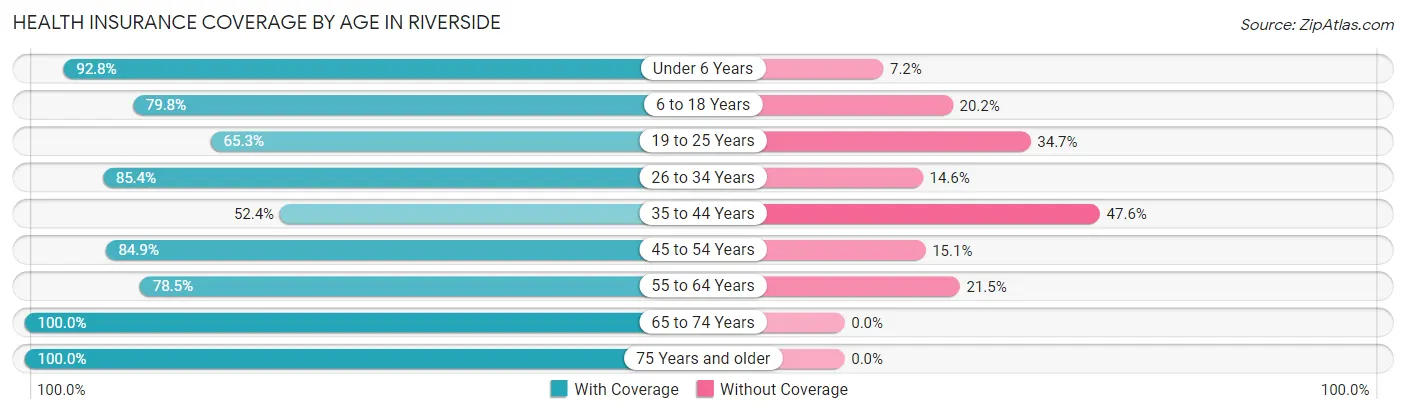
| Age Bracket | With Coverage | Without Coverage |
| Under 6 Years | 360 (92.8%) | 28 (7.2%) |
| 6 to 18 Years | 514 (79.8%) | 130 (20.2%) |
| 19 to 25 Years | 175 (65.3%) | 93 (34.7%) |
| 26 to 34 Years | 609 (85.4%) | 104 (14.6%) |
| 35 to 44 Years | 275 (52.4%) | 250 (47.6%) |
| 45 to 54 Years | 315 (84.9%) | 56 (15.1%) |
| 55 to 64 Years | 347 (78.5%) | 95 (21.5%) |
| 65 to 74 Years | 421 (100.0%) | 0 (0.0%) |
| 75 Years and older | 142 (100.0%) | 0 (0.0%) |
| Total | 3,158 (80.7%) | 756 (19.3%) |
Health Insurance Coverage by Citizenship Status in Riverside
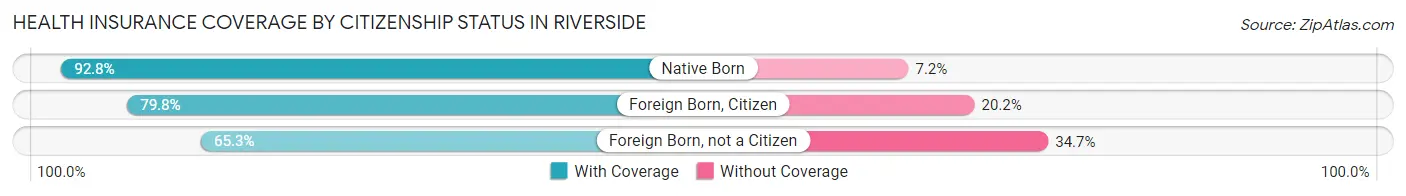
| Citizenship Status | With Coverage | Without Coverage |
| Native Born | 360 (92.8%) | 28 (7.2%) |
| Foreign Born, Citizen | 514 (79.8%) | 130 (20.2%) |
| Foreign Born, not a Citizen | 175 (65.3%) | 93 (34.7%) |
Health Insurance Coverage by Household Income in Riverside
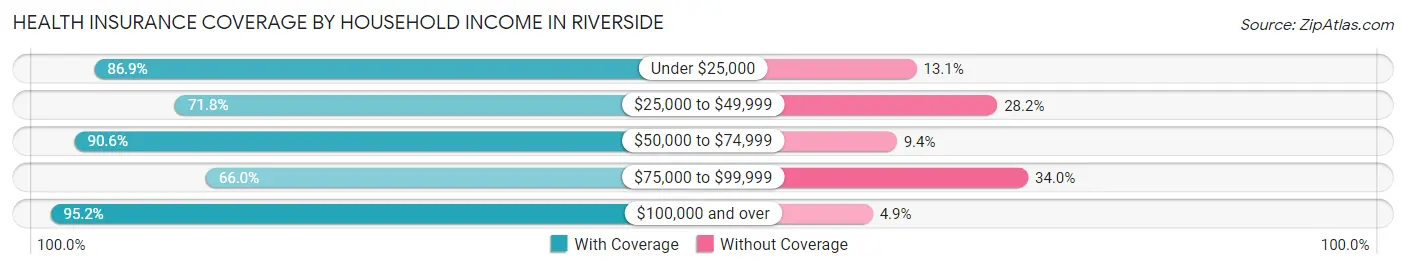
| Household Income | With Coverage | Without Coverage |
| Under $25,000 | 519 (86.9%) | 78 (13.1%) |
| $25,000 to $49,999 | 950 (71.8%) | 373 (28.2%) |
| $50,000 to $74,999 | 155 (90.6%) | 16 (9.4%) |
| $75,000 to $99,999 | 451 (66.0%) | 232 (34.0%) |
| $100,000 and over | 1,039 (95.2%) | 53 (4.9%) |
Public vs Private Health Insurance Coverage by Age in Riverside
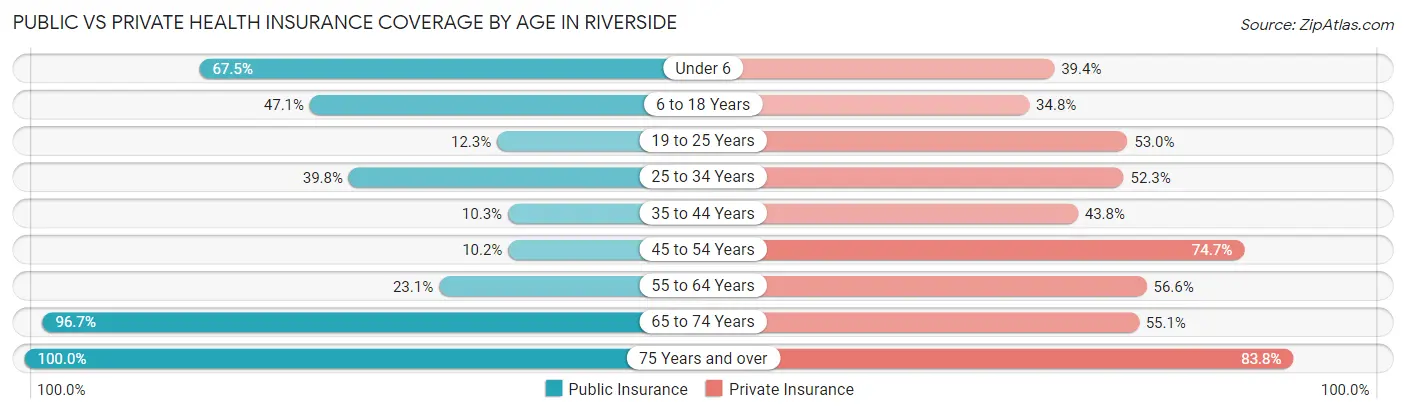
| Age Bracket | Public Insurance | Private Insurance |
| Under 6 | 262 (67.5%) | 153 (39.4%) |
| 6 to 18 Years | 303 (47.0%) | 224 (34.8%) |
| 19 to 25 Years | 33 (12.3%) | 142 (53.0%) |
| 25 to 34 Years | 284 (39.8%) | 373 (52.3%) |
| 35 to 44 Years | 54 (10.3%) | 230 (43.8%) |
| 45 to 54 Years | 38 (10.2%) | 277 (74.7%) |
| 55 to 64 Years | 102 (23.1%) | 250 (56.6%) |
| 65 to 74 Years | 407 (96.7%) | 232 (55.1%) |
| 75 Years and over | 142 (100.0%) | 119 (83.8%) |
| Total | 1,625 (41.5%) | 2,000 (51.1%) |
Disability Status by Sex by Age in Riverside
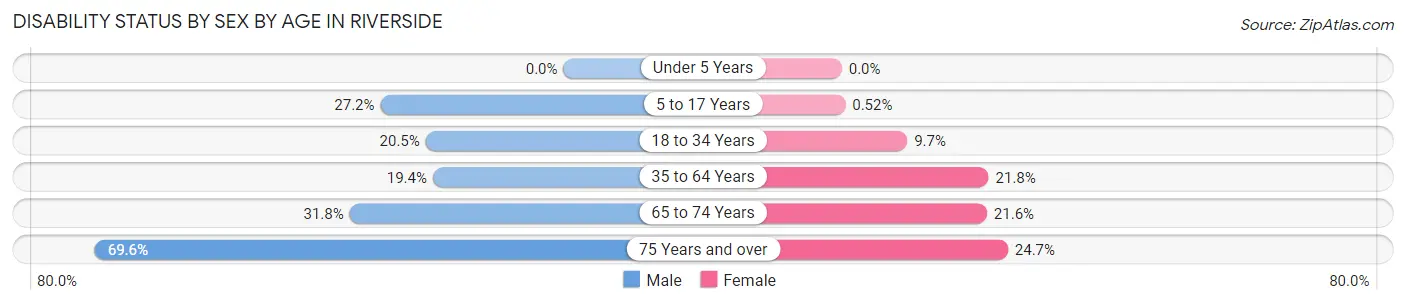
| Age Bracket | Male | Female |
| Under 5 Years | 0 (0.0%) | 0 (0.0%) |
| 5 to 17 Years | 119 (27.2%) | 1 (0.5%) |
| 18 to 34 Years | 136 (20.4%) | 34 (9.7%) |
| 35 to 64 Years | 126 (19.4%) | 150 (21.8%) |
| 65 to 74 Years | 60 (31.8%) | 50 (21.5%) |
| 75 Years and over | 48 (69.6%) | 18 (24.7%) |
Disability Class by Sex by Age in Riverside
Disability Class: Hearing Difficulty
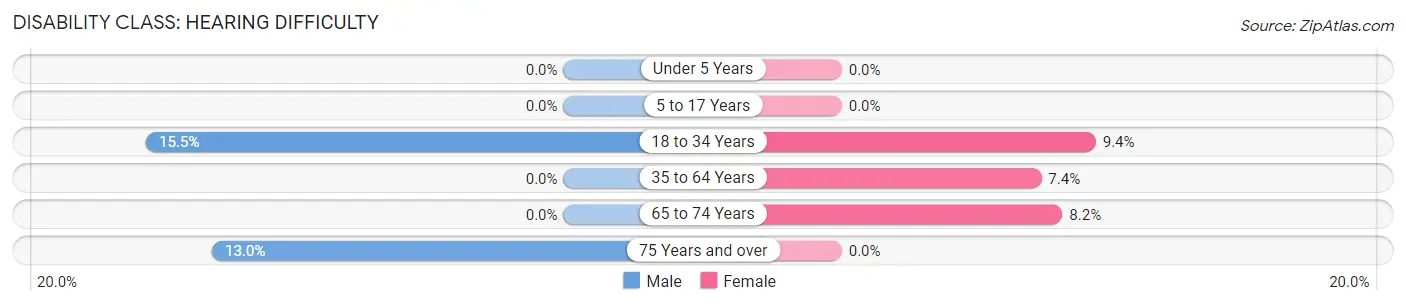
| Age Bracket | Male | Female |
| Under 5 Years | 0 (0.0%) | 0 (0.0%) |
| 5 to 17 Years | 0 (0.0%) | 0 (0.0%) |
| 18 to 34 Years | 103 (15.5%) | 33 (9.4%) |
| 35 to 64 Years | 0 (0.0%) | 51 (7.4%) |
| 65 to 74 Years | 0 (0.0%) | 19 (8.2%) |
| 75 Years and over | 9 (13.0%) | 0 (0.0%) |
Disability Class: Vision Difficulty
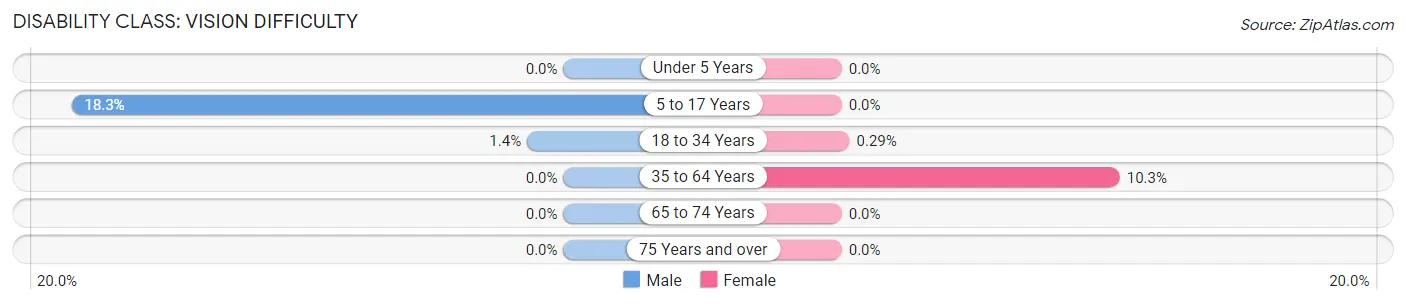
| Age Bracket | Male | Female |
| Under 5 Years | 0 (0.0%) | 0 (0.0%) |
| 5 to 17 Years | 80 (18.3%) | 0 (0.0%) |
| 18 to 34 Years | 9 (1.3%) | 1 (0.3%) |
| 35 to 64 Years | 0 (0.0%) | 71 (10.3%) |
| 65 to 74 Years | 0 (0.0%) | 0 (0.0%) |
| 75 Years and over | 0 (0.0%) | 0 (0.0%) |
Disability Class: Cognitive Difficulty
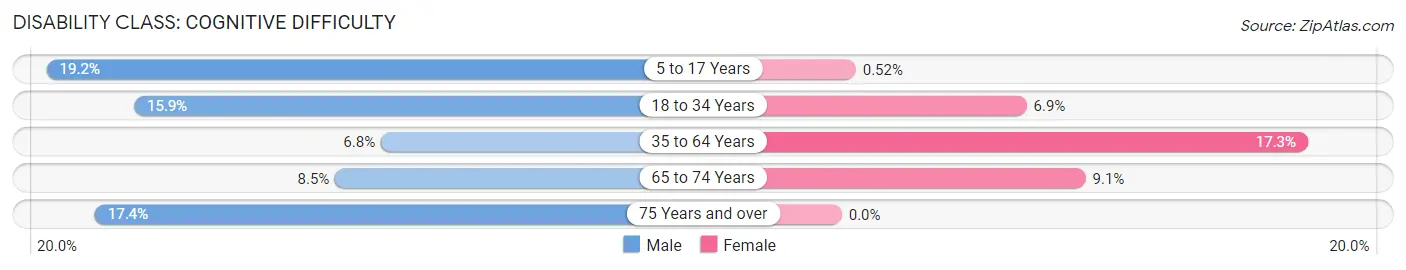
| Age Bracket | Male | Female |
| 5 to 17 Years | 84 (19.2%) | 1 (0.5%) |
| 18 to 34 Years | 106 (15.9%) | 24 (6.9%) |
| 35 to 64 Years | 44 (6.8%) | 119 (17.3%) |
| 65 to 74 Years | 16 (8.5%) | 21 (9.0%) |
| 75 Years and over | 12 (17.4%) | 0 (0.0%) |
Disability Class: Ambulatory Difficulty
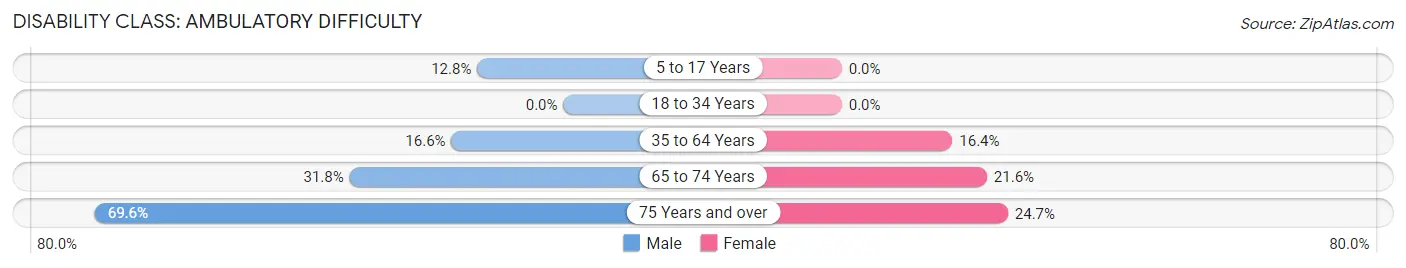
| Age Bracket | Male | Female |
| 5 to 17 Years | 56 (12.8%) | 0 (0.0%) |
| 18 to 34 Years | 0 (0.0%) | 0 (0.0%) |
| 35 to 64 Years | 108 (16.6%) | 113 (16.4%) |
| 65 to 74 Years | 60 (31.8%) | 50 (21.5%) |
| 75 Years and over | 48 (69.6%) | 18 (24.7%) |
Disability Class: Self-Care Difficulty
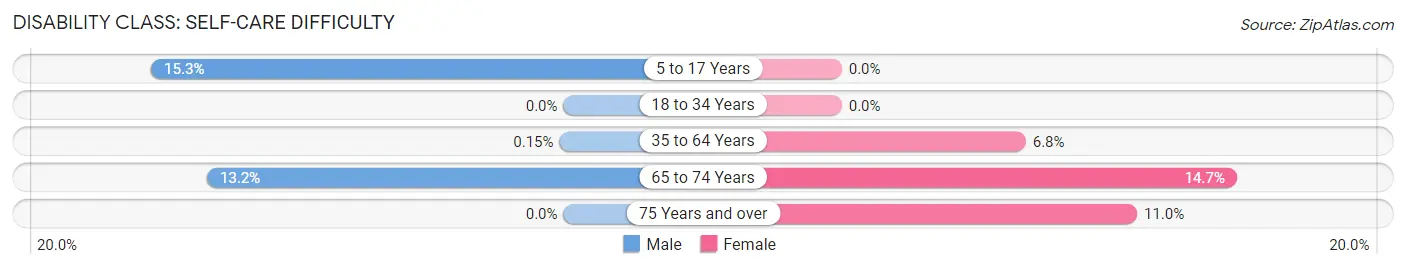
| Age Bracket | Male | Female |
| 5 to 17 Years | 67 (15.3%) | 0 (0.0%) |
| 18 to 34 Years | 0 (0.0%) | 0 (0.0%) |
| 35 to 64 Years | 1 (0.2%) | 47 (6.8%) |
| 65 to 74 Years | 25 (13.2%) | 34 (14.7%) |
| 75 Years and over | 0 (0.0%) | 8 (11.0%) |
Technology Access in Riverside
Computing Device Access in Riverside
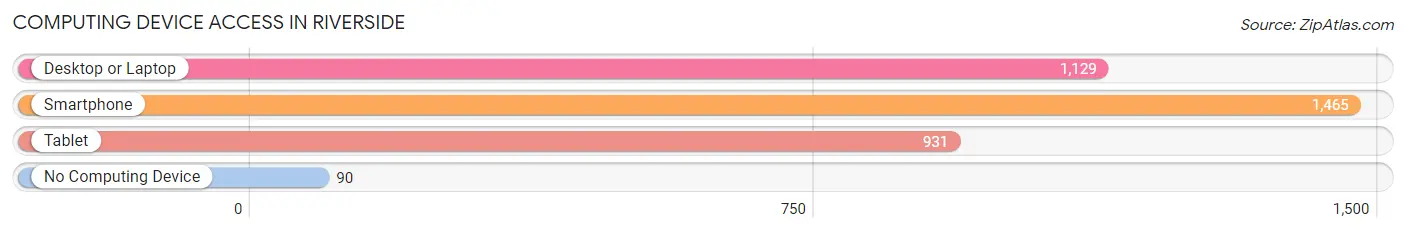
| Device Type | # Households | % Households |
| Desktop or Laptop | 1,129 | 71.2% |
| Smartphone | 1,465 | 92.4% |
| Tablet | 931 | 58.7% |
| No Computing Device | 90 | 5.7% |
| Total | 1,585 | 100.0% |
Internet Access in Riverside
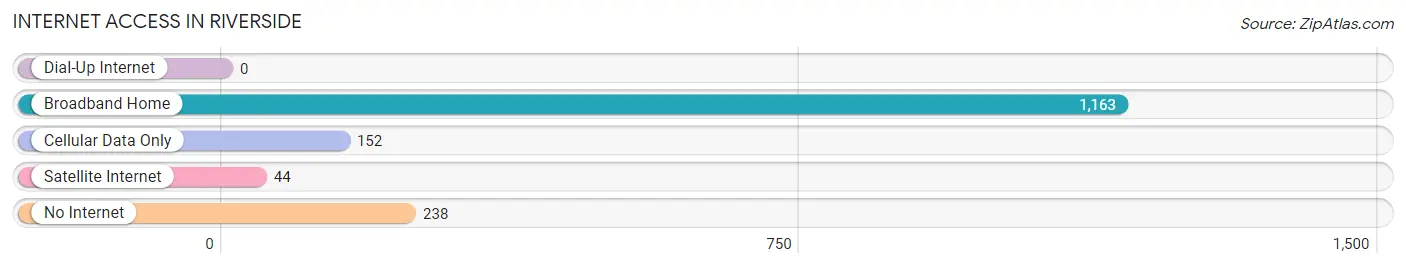
| Internet Type | # Households | % Households |
| Dial-Up Internet | 0 | 0.0% |
| Broadband Home | 1,163 | 73.4% |
| Cellular Data Only | 152 | 9.6% |
| Satellite Internet | 44 | 2.8% |
| No Internet | 238 | 15.0% |
| Total | 1,585 | 100.0% |
Riverside Summary
Riverside, Missouri is a small city located in Platte County, Missouri, just north of Kansas City. The city is situated on the Missouri River and is home to approximately 4,000 people. Riverside is a part of the Kansas City Metropolitan Area and is located in the heart of the Midwest.
History
Riverside was founded in 1855 by a group of settlers from the nearby town of Weston. The settlers were looking for a place to settle and build a new town. The town was named after the nearby Missouri River, which was known as the “Riverside” at the time. The town was officially incorporated in 1868.
In the late 19th century, Riverside was a thriving agricultural community. The town was home to several large farms and was known for its production of wheat, corn, and other crops. The town also had a thriving lumber industry, which provided lumber for the construction of homes and businesses in the area.
In the early 20th century, Riverside began to experience a period of growth and development. The town was home to several factories, including a flour mill, a canning factory, and a brickyard. The town also had a thriving business district, which included several stores, restaurants, and other businesses.
Geography
Riverside is located in Platte County, Missouri, just north of Kansas City. The city is situated on the Missouri River and is home to approximately 4,000 people. The city is located in the heart of the Midwest and is part of the Kansas City Metropolitan Area.
The city is located in a flat, open area, with rolling hills and valleys. The city is surrounded by farmland and is home to several small lakes and ponds. The city is also home to several parks, including Riverside Park, which is located on the banks of the Missouri River.
Economy
Riverside is a small city with a diverse economy. The city is home to several small businesses, including restaurants, retail stores, and other services. The city is also home to several manufacturing companies, including a flour mill, a canning factory, and a brickyard.
The city is also home to several large employers, including the Platte County School District, the Riverside Medical Center, and the Riverside County Courthouse. The city is also home to several government offices, including the Platte County Sheriff’s Office and the Platte County Health Department.
Demographics
Riverside is a small city with a population of approximately 4,000 people. The city is predominantly white, with a small African American population. The city also has a small Hispanic population. The median household income in Riverside is $45,000, and the median home value is $150,000. The city has a low unemployment rate and a high rate of homeownership.
Common Questions
What is Per Capita Income in Riverside?
Per Capita income in Riverside is $33,601.
What is the Median Family Income in Riverside?
Median Family Income in Riverside is $48,964.
What is the Median Household income in Riverside?
Median Household Income in Riverside is $47,668.
What is Income or Wage Gap in Riverside?
Income or Wage Gap in Riverside is 37.4%.
Women in Riverside earn 62.6 cents for every dollar earned by a man.
What is Inequality or Gini Index in Riverside?
Inequality or Gini Index in Riverside is 0.51.
What is the Total Population of Riverside?
Total Population of Riverside is 4,017.
What is the Total Male Population of Riverside?
Total Male Population of Riverside is 2,285.
What is the Total Female Population of Riverside?
Total Female Population of Riverside is 1,732.
What is the Ratio of Males per 100 Females in Riverside?
There are 131.93 Males per 100 Females in Riverside.
What is the Ratio of Females per 100 Males in Riverside?
There are 75.80 Females per 100 Males in Riverside.
What is the Median Population Age in Riverside?
Median Population Age in Riverside is 34.9 Years.
What is the Average Family Size in Riverside
Average Family Size in Riverside is 3.1 People.
What is the Average Household Size in Riverside
Average Household Size in Riverside is 2.4 People.
How Large is the Labor Force in Riverside?
There are 1,842 People in the Labor Forcein in Riverside.
What is the Percentage of People in the Labor Force in Riverside?
59.7% of People are in the Labor Force in Riverside.
What is the Unemployment Rate in Riverside?
Unemployment Rate in Riverside is 4.6%.