Eureka, WI Map & Demographics
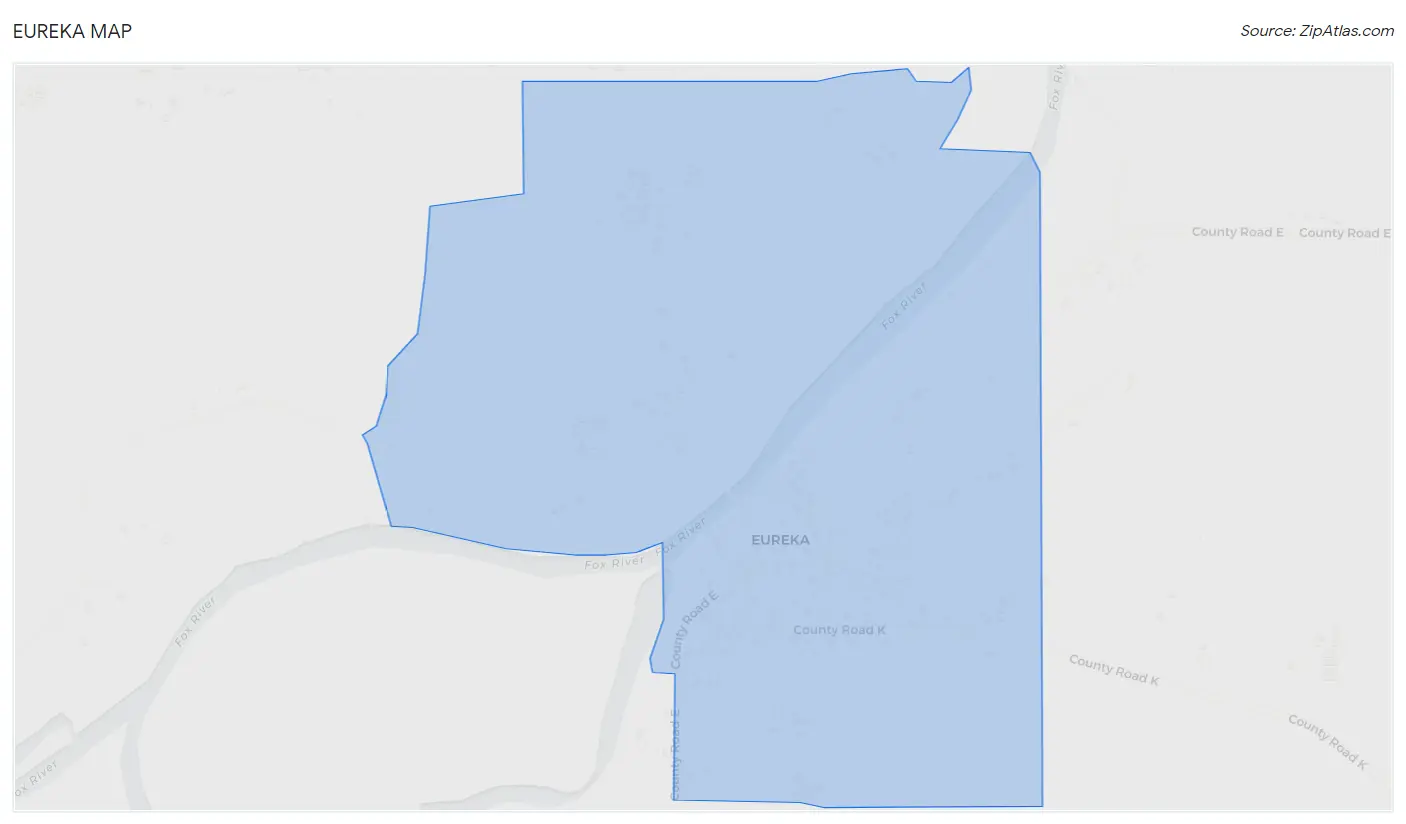
Eureka Map
Eureka Overview
$28,377
PER CAPITA INCOME
$63,750
AVG FAMILY INCOME
$51,806
AVG HOUSEHOLD INCOME
22.8%
WAGE / INCOME GAP [ % ]
77.2¢/ $1
WAGE / INCOME GAP [ $ ]
0.35
INEQUALITY / GINI INDEX
280
TOTAL POPULATION
145
MALE POPULATION
135
FEMALE POPULATION
107.41
MALES / 100 FEMALES
93.10
FEMALES / 100 MALES
31.9
MEDIAN AGE
2.9
AVG FAMILY SIZE
2.5
AVG HOUSEHOLD SIZE
151
LABOR FORCE [ PEOPLE ]
73.3%
PERCENT IN LABOR FORCE
Eureka Area Codes
Income in Eureka
Income Overview in Eureka
Per Capita Income in Eureka is $28,377, while median incomes of families and households are $63,750 and $51,806 respectively.
| Characteristic | Number | Measure |
| Per Capita Income | 280 | $28,377 |
| Median Family Income | 75 | $63,750 |
| Mean Family Income | 75 | $74,367 |
| Median Household Income | 111 | $51,806 |
| Mean Household Income | 111 | $70,232 |
| Income Deficit | 75 | $0 |
| Wage / Income Gap (%) | 280 | 22.84% |
| Wage / Income Gap ($) | 280 | 77.16¢ per $1 |
| Gini / Inequality Index | 280 | 0.35 |
Earnings by Sex in Eureka
Average Earnings in Eureka are $36,250, $40,500 for men and $31,250 for women, a difference of 22.8%.
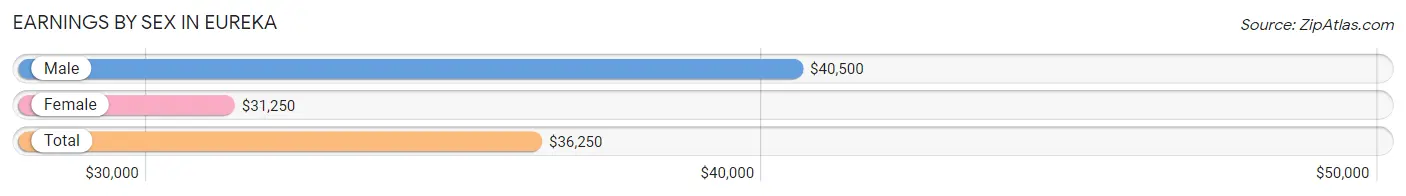
| Sex | Number | Average Earnings |
| Male | 82 (53.9%) | $40,500 |
| Female | 70 (46.1%) | $31,250 |
| Total | 152 (100.0%) | $36,250 |
Earnings by Sex by Income Bracket in Eureka
The most common earnings brackets in Eureka are $55,000 to $64,999 for men (16 | 19.5%) and $35,000 to $39,999 for women (20 | 28.6%).
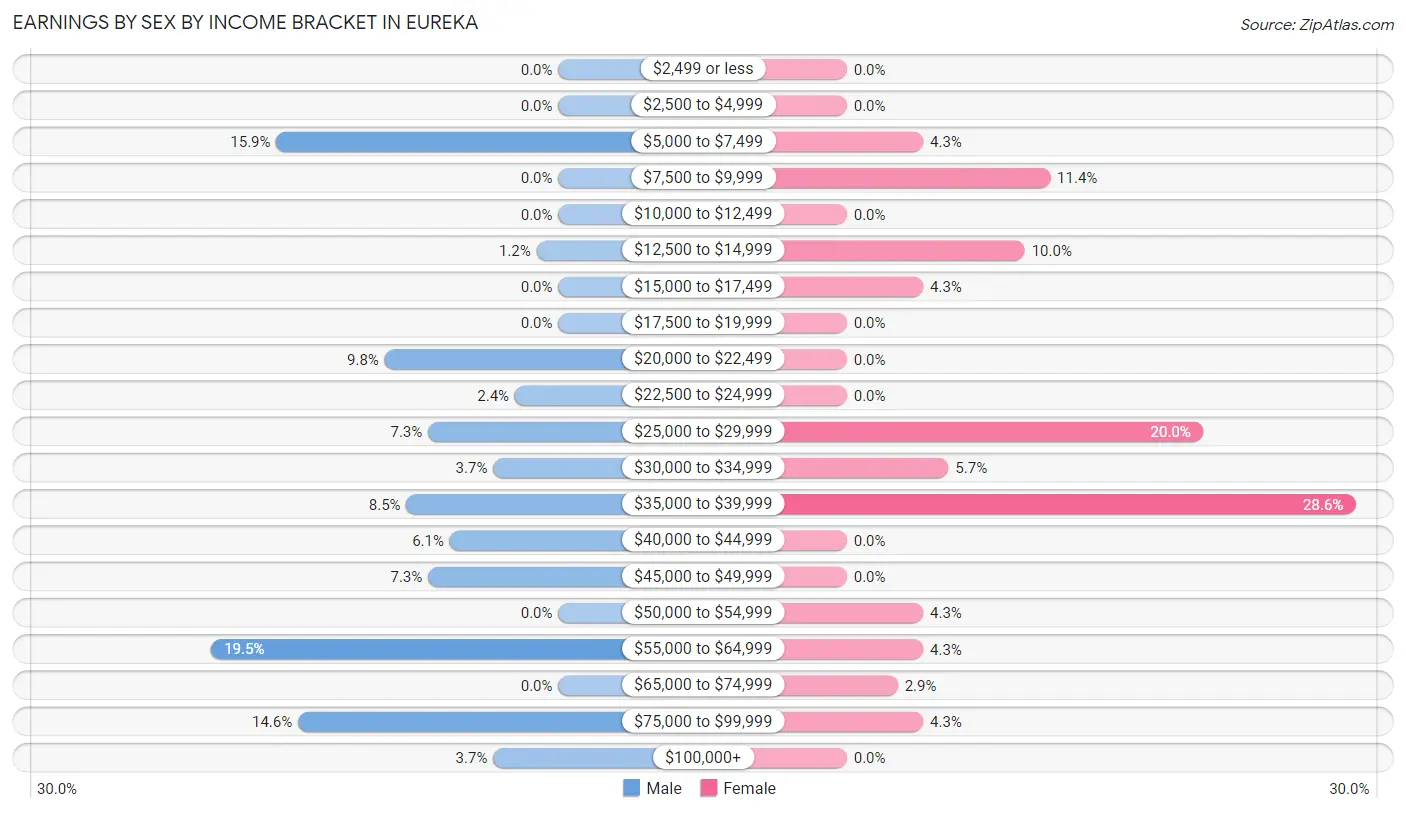
| Income | Male | Female |
| $2,499 or less | 0 (0.0%) | 0 (0.0%) |
| $2,500 to $4,999 | 0 (0.0%) | 0 (0.0%) |
| $5,000 to $7,499 | 13 (15.9%) | 3 (4.3%) |
| $7,500 to $9,999 | 0 (0.0%) | 8 (11.4%) |
| $10,000 to $12,499 | 0 (0.0%) | 0 (0.0%) |
| $12,500 to $14,999 | 1 (1.2%) | 7 (10.0%) |
| $15,000 to $17,499 | 0 (0.0%) | 3 (4.3%) |
| $17,500 to $19,999 | 0 (0.0%) | 0 (0.0%) |
| $20,000 to $22,499 | 8 (9.8%) | 0 (0.0%) |
| $22,500 to $24,999 | 2 (2.4%) | 0 (0.0%) |
| $25,000 to $29,999 | 6 (7.3%) | 14 (20.0%) |
| $30,000 to $34,999 | 3 (3.7%) | 4 (5.7%) |
| $35,000 to $39,999 | 7 (8.5%) | 20 (28.6%) |
| $40,000 to $44,999 | 5 (6.1%) | 0 (0.0%) |
| $45,000 to $49,999 | 6 (7.3%) | 0 (0.0%) |
| $50,000 to $54,999 | 0 (0.0%) | 3 (4.3%) |
| $55,000 to $64,999 | 16 (19.5%) | 3 (4.3%) |
| $65,000 to $74,999 | 0 (0.0%) | 2 (2.9%) |
| $75,000 to $99,999 | 12 (14.6%) | 3 (4.3%) |
| $100,000+ | 3 (3.7%) | 0 (0.0%) |
| Total | 82 (100.0%) | 70 (100.0%) |
Earnings by Sex by Educational Attainment in Eureka
Average earnings in Eureka are $45,625 for men and $29,583 for women, a difference of 35.2%. Men with an educational attainment of less than high school enjoy the highest average annual earnings of $58,068, while those with high school diploma education earn the least with $39,643. Women with an educational attainment of bachelor's degree earn the most with the average annual earnings of $39,000, while those with college or associate's degree education have the smallest earnings of $27,708.
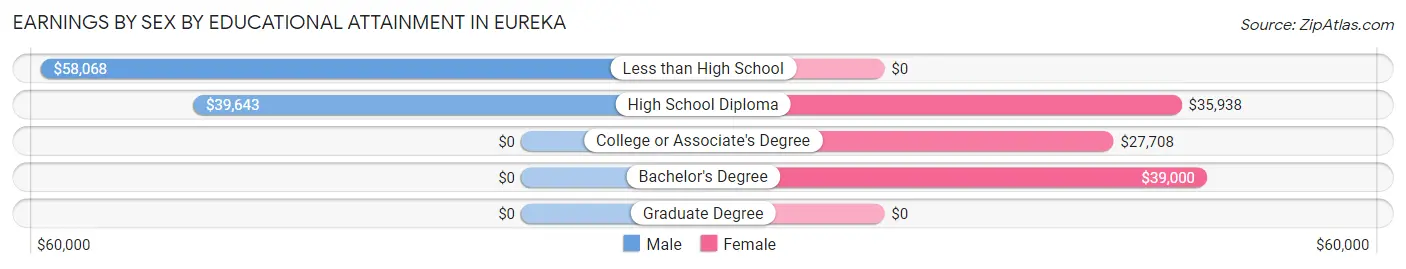
| Educational Attainment | Male Income | Female Income |
| Less than High School | $58,068 | $0 |
| High School Diploma | $39,643 | $35,938 |
| College or Associate's Degree | - | - |
| Bachelor's Degree | - | - |
| Graduate Degree | - | - |
| Total | $45,625 | $29,583 |
Family Income in Eureka
Family Income Brackets in Eureka
According to the Eureka family income data, there are 26 families falling into the $75,000 to $99,999 income range, which is the most common income bracket and makes up 34.7% of all families.
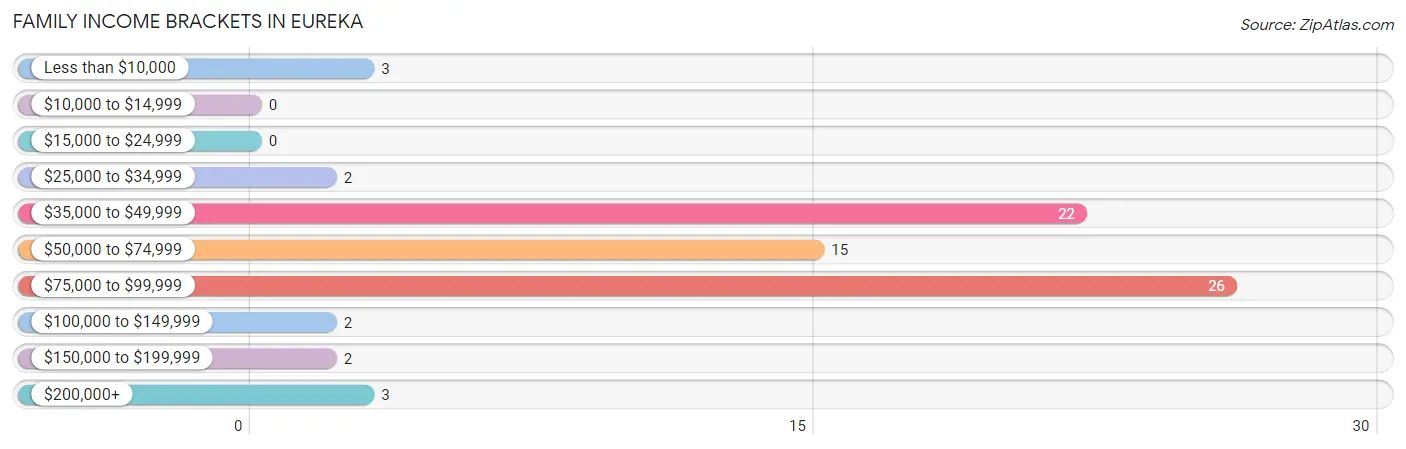
| Income Bracket | # Families | % Families |
| Less than $10,000 | 3 | 4.0% |
| $10,000 to $14,999 | 0 | 0.0% |
| $15,000 to $24,999 | 0 | 0.0% |
| $25,000 to $34,999 | 2 | 2.7% |
| $35,000 to $49,999 | 22 | 29.3% |
| $50,000 to $74,999 | 15 | 20.0% |
| $75,000 to $99,999 | 26 | 34.7% |
| $100,000 to $149,999 | 2 | 2.7% |
| $150,000 to $199,999 | 2 | 2.7% |
| $200,000+ | 3 | 4.0% |
Family Income by Famaliy Size in Eureka
4-person families (17 | 22.7%) account for the highest median family income in Eureka with $95,375 per family, while 2-person families (33 | 44.0%) have the highest median income of $31,458 per family member.
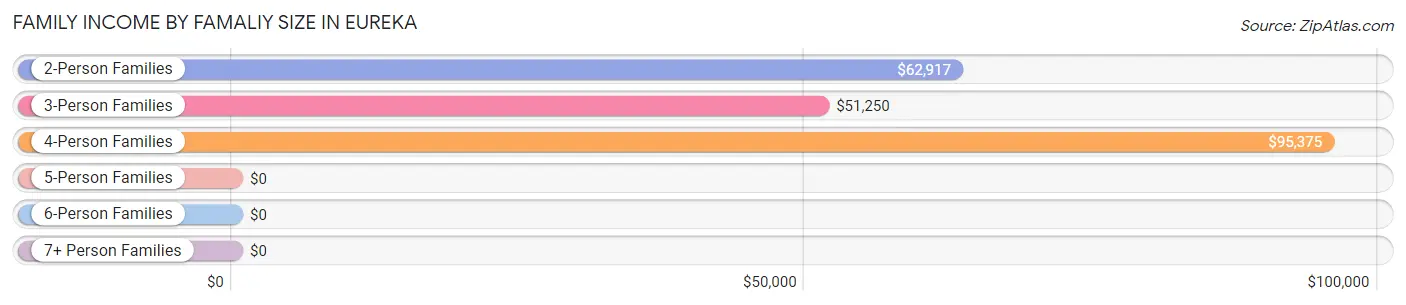
| Income Bracket | # Families | Median Income |
| 2-Person Families | 33 (44.0%) | $62,917 |
| 3-Person Families | 22 (29.3%) | $51,250 |
| 4-Person Families | 17 (22.7%) | $95,375 |
| 5-Person Families | 3 (4.0%) | $0 |
| 6-Person Families | 0 (0.0%) | $0 |
| 7+ Person Families | 0 (0.0%) | $0 |
| Total | 75 (100.0%) | $63,750 |
Family Income by Number of Earners in Eureka
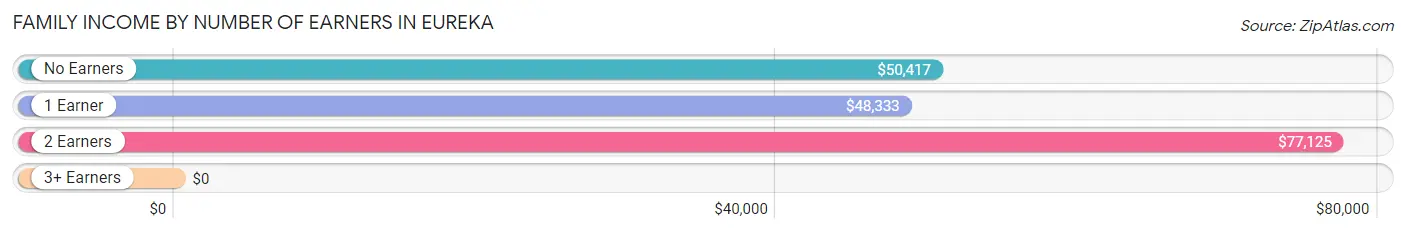
| Number of Earners | # Families | Median Income |
| No Earners | 24 (32.0%) | $50,417 |
| 1 Earner | 10 (13.3%) | $48,333 |
| 2 Earners | 41 (54.7%) | $77,125 |
| 3+ Earners | 0 (0.0%) | $0 |
| Total | 75 (100.0%) | $63,750 |
Household Income in Eureka
Household Income Brackets in Eureka
With 36 households falling in the category, the $35,000 to $49,999 income range is the most frequent in Eureka, accounting for 32.4% of all households.
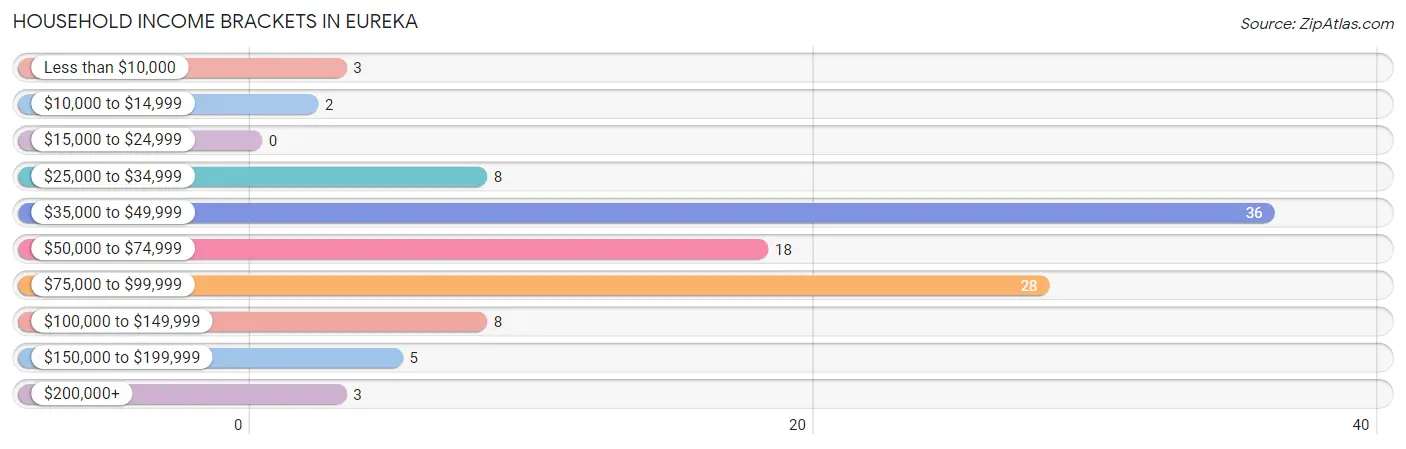
| Income Bracket | # Households | % Households |
| Less than $10,000 | 3 | 2.7% |
| $10,000 to $14,999 | 2 | 1.8% |
| $15,000 to $24,999 | 0 | 0.0% |
| $25,000 to $34,999 | 8 | 7.2% |
| $35,000 to $49,999 | 36 | 32.4% |
| $50,000 to $74,999 | 18 | 16.2% |
| $75,000 to $99,999 | 28 | 25.2% |
| $100,000 to $149,999 | 8 | 7.2% |
| $150,000 to $199,999 | 5 | 4.5% |
| $200,000+ | 3 | 2.7% |
Household Income by Householder Age in Eureka
The median household income in Eureka is $51,806, with the highest median household income of $75,417 found in the 25 to 44 years age bracket for the primary householder. A total of 56 households (50.4%) fall into this category. Meanwhile, the 15 to 24 years age bracket for the primary householder has the lowest median household income of $0, with 7 households (6.3%) in this group.
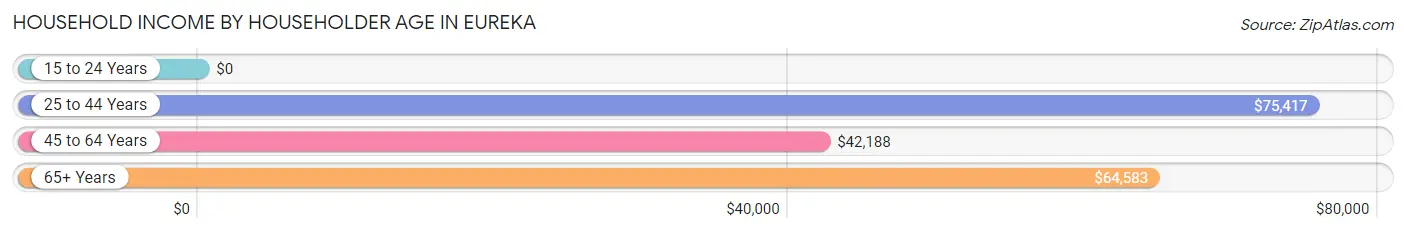
| Income Bracket | # Households | Median Income |
| 15 to 24 Years | 7 (6.3%) | $0 |
| 25 to 44 Years | 56 (50.4%) | $75,417 |
| 45 to 64 Years | 29 (26.1%) | $42,188 |
| 65+ Years | 19 (17.1%) | $64,583 |
| Total | 111 (100.0%) | $51,806 |
Poverty in Eureka
Income Below Poverty by Sex and Age in Eureka
With 12.6% poverty level for males and 4.5% for females among the residents of Eureka, 25 to 34 year old males and 75 year old and over females are the most vulnerable to poverty, with 13 males (38.2%) and 3 females (50.0%) in their respective age groups living below the poverty level.
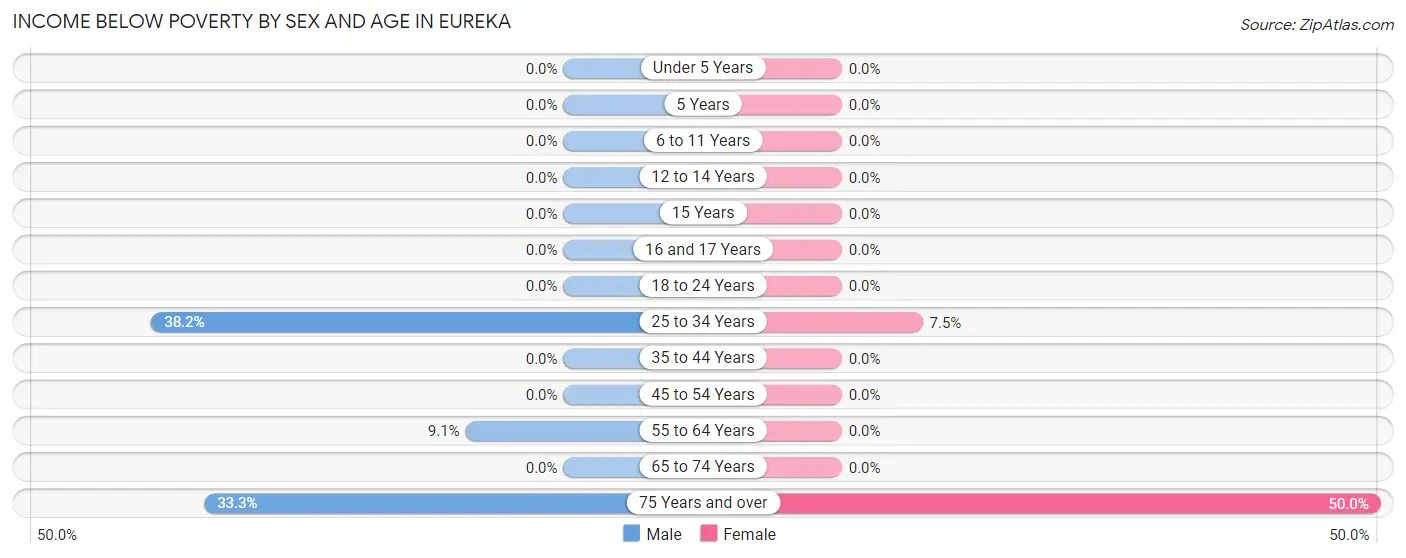
| Age Bracket | Male | Female |
| Under 5 Years | 0 (0.0%) | 0 (0.0%) |
| 5 Years | 0 (0.0%) | 0 (0.0%) |
| 6 to 11 Years | 0 (0.0%) | 0 (0.0%) |
| 12 to 14 Years | 0 (0.0%) | 0 (0.0%) |
| 15 Years | 0 (0.0%) | 0 (0.0%) |
| 16 and 17 Years | 0 (0.0%) | 0 (0.0%) |
| 18 to 24 Years | 0 (0.0%) | 0 (0.0%) |
| 25 to 34 Years | 13 (38.2%) | 3 (7.5%) |
| 35 to 44 Years | 0 (0.0%) | 0 (0.0%) |
| 45 to 54 Years | 0 (0.0%) | 0 (0.0%) |
| 55 to 64 Years | 2 (9.1%) | 0 (0.0%) |
| 65 to 74 Years | 0 (0.0%) | 0 (0.0%) |
| 75 Years and over | 3 (33.3%) | 3 (50.0%) |
| Total | 18 (12.6%) | 6 (4.5%) |
Income Above Poverty by Sex and Age in Eureka
According to the poverty statistics in Eureka, males aged under 5 years and females aged under 5 years are the age groups that are most secure financially, with 100.0% of males and 100.0% of females in these age groups living above the poverty line.
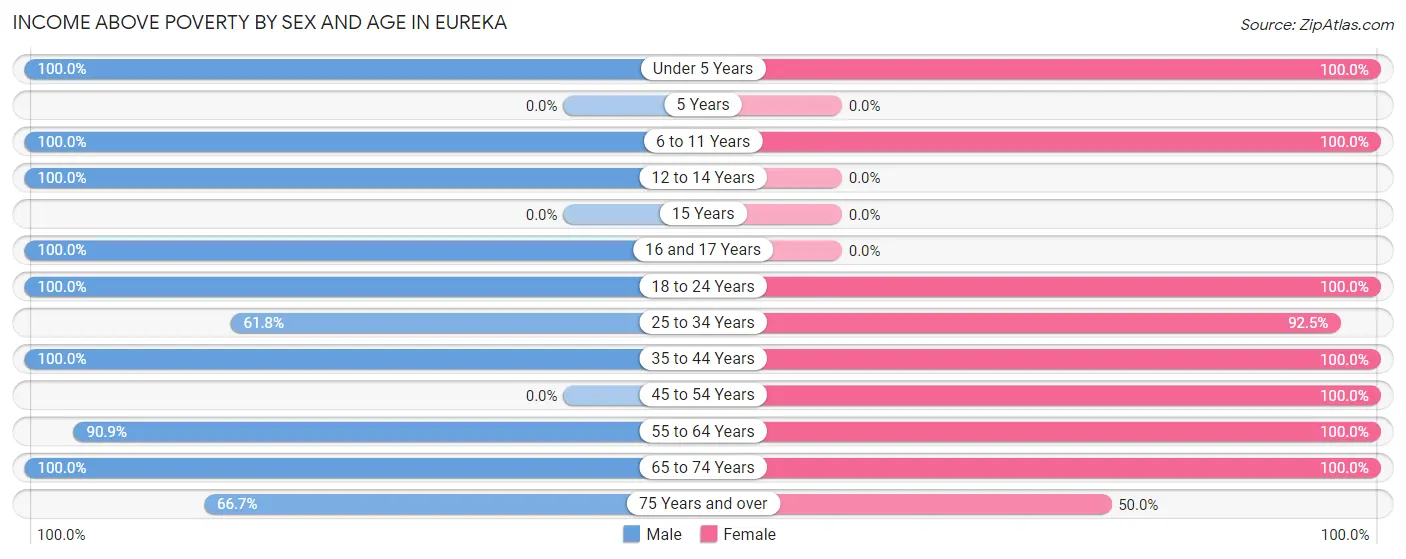
| Age Bracket | Male | Female |
| Under 5 Years | 9 (100.0%) | 23 (100.0%) |
| 5 Years | 0 (0.0%) | 0 (0.0%) |
| 6 to 11 Years | 14 (100.0%) | 10 (100.0%) |
| 12 to 14 Years | 14 (100.0%) | 0 (0.0%) |
| 15 Years | 0 (0.0%) | 0 (0.0%) |
| 16 and 17 Years | 8 (100.0%) | 0 (0.0%) |
| 18 to 24 Years | 3 (100.0%) | 4 (100.0%) |
| 25 to 34 Years | 21 (61.8%) | 37 (92.5%) |
| 35 to 44 Years | 20 (100.0%) | 11 (100.0%) |
| 45 to 54 Years | 0 (0.0%) | 7 (100.0%) |
| 55 to 64 Years | 20 (90.9%) | 27 (100.0%) |
| 65 to 74 Years | 10 (100.0%) | 5 (100.0%) |
| 75 Years and over | 6 (66.7%) | 3 (50.0%) |
| Total | 125 (87.4%) | 127 (95.5%) |
Income Below Poverty Among Married-Couple Families in Eureka
The poverty statistics for married-couple families in Eureka show that 4.9% or 3 of the total 61 families live below the poverty line. Families with no children have the highest poverty rate of 9.1%, comprising of 3 families. On the other hand, families with 1 or 2 children have the lowest poverty rate of 0.0%, which includes 0 families.
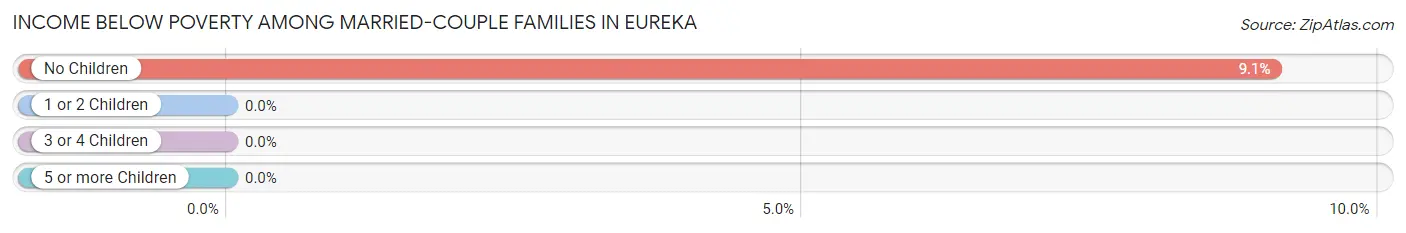
| Children | Above Poverty | Below Poverty |
| No Children | 30 (90.9%) | 3 (9.1%) |
| 1 or 2 Children | 25 (100.0%) | 0 (0.0%) |
| 3 or 4 Children | 3 (100.0%) | 0 (0.0%) |
| 5 or more Children | 0 (0.0%) | 0 (0.0%) |
| Total | 58 (95.1%) | 3 (4.9%) |
Income Below Poverty Among Single-Parent Households in Eureka
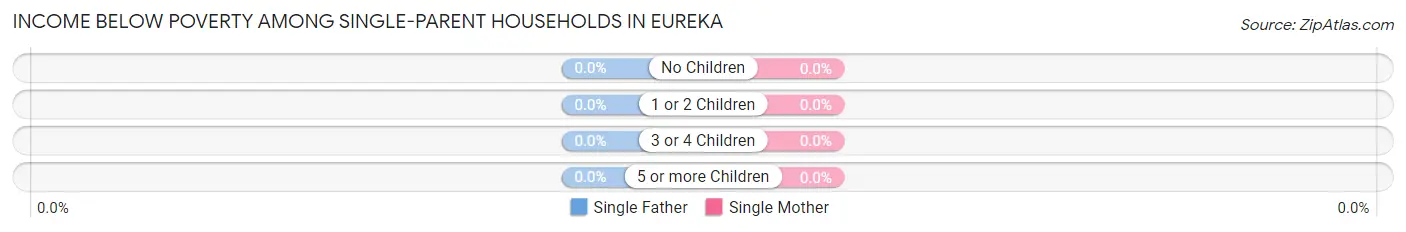
| Children | Single Father | Single Mother |
| No Children | 0 (0.0%) | 0 (0.0%) |
| 1 or 2 Children | 0 (0.0%) | 0 (0.0%) |
| 3 or 4 Children | 0 (0.0%) | 0 (0.0%) |
| 5 or more Children | 0 (0.0%) | 0 (0.0%) |
| Total | 0 (0.0%) | 0 (0.0%) |
Income Below Poverty Among Married-Couple vs Single-Parent Households in Eureka
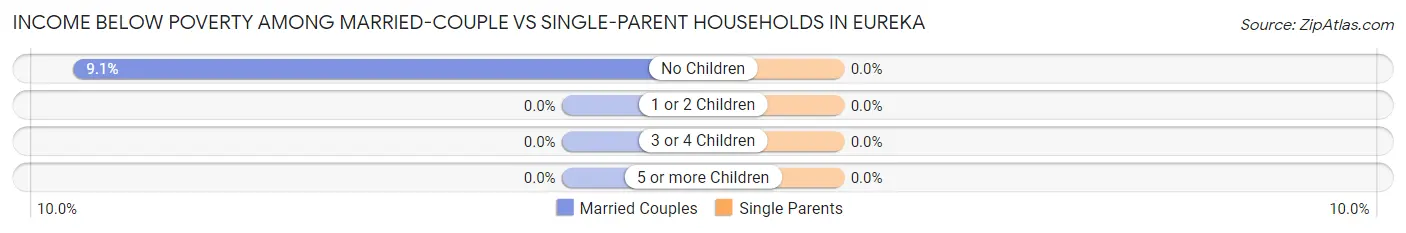
| Children | Married-Couple Families | Single-Parent Households |
| No Children | 3 (9.1%) | 0 (0.0%) |
| 1 or 2 Children | 0 (0.0%) | 0 (0.0%) |
| 3 or 4 Children | 0 (0.0%) | 0 (0.0%) |
| 5 or more Children | 0 (0.0%) | 0 (0.0%) |
| Total | 3 (4.9%) | 0 (0.0%) |
Race in Eureka
The most populous races in Eureka are White / Caucasian (269 | 96.1%), Hispanic or Latino (13 | 4.6%), and Black / African American (11 | 3.9%).
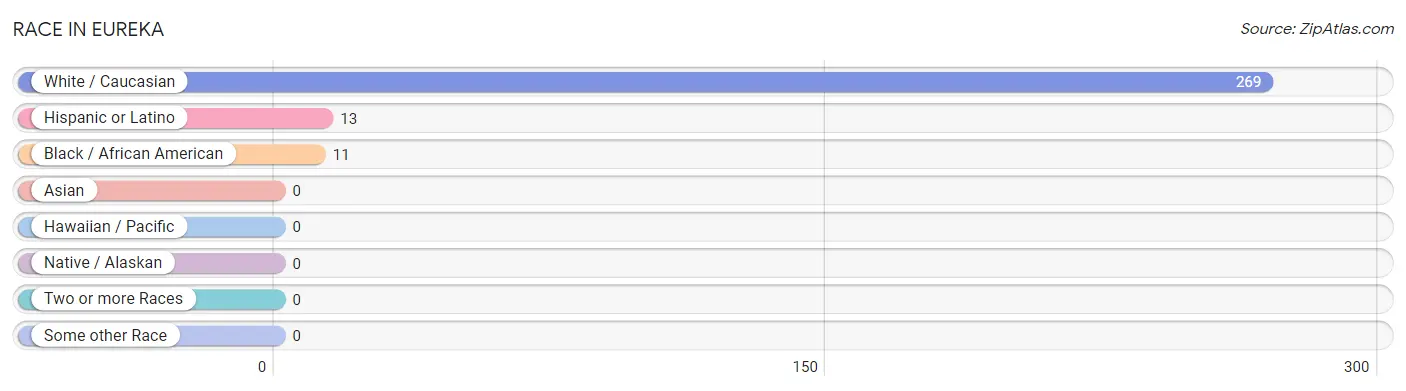
| Race | # Population | % Population |
| Asian | 0 | 0.0% |
| Black / African American | 11 | 3.9% |
| Hawaiian / Pacific | 0 | 0.0% |
| Hispanic or Latino | 13 | 4.6% |
| Native / Alaskan | 0 | 0.0% |
| White / Caucasian | 269 | 96.1% |
| Two or more Races | 0 | 0.0% |
| Some other Race | 0 | 0.0% |
| Total | 280 | 100.0% |
Ancestry in Eureka
The most populous ancestries reported in Eureka are German (126 | 45.0%), American (24 | 8.6%), Polish (23 | 8.2%), Irish (17 | 6.1%), and English (15 | 5.4%), together accounting for 73.2% of all Eureka residents.
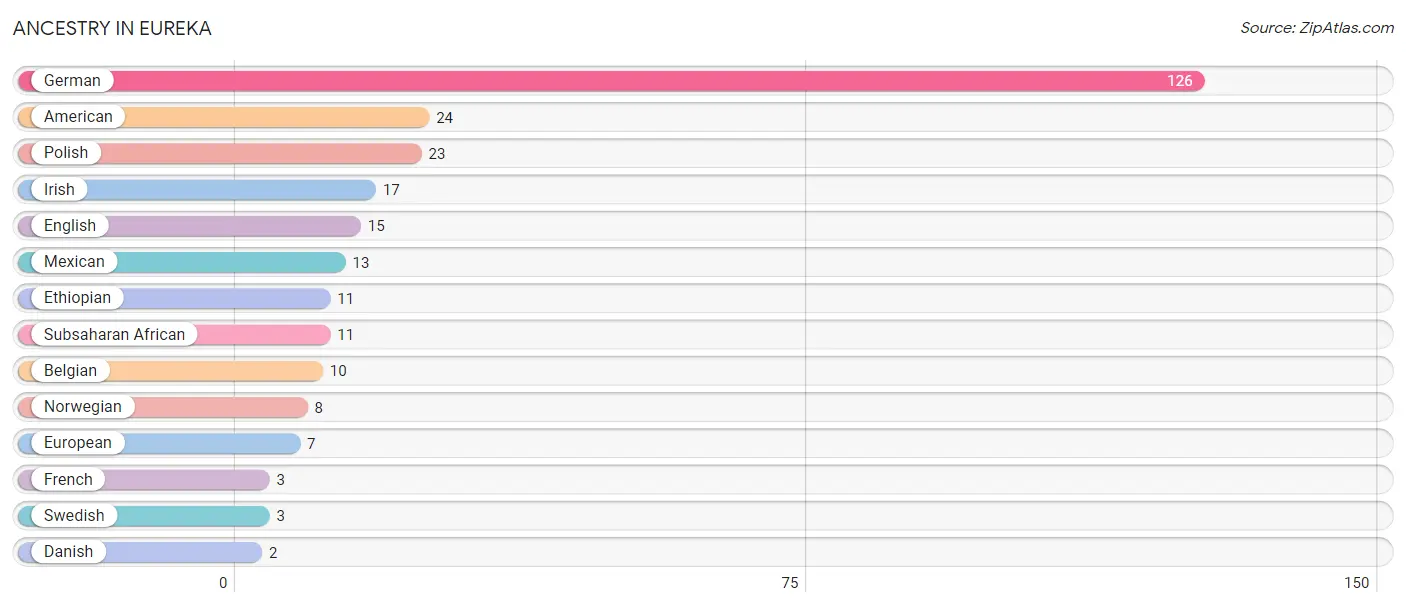
| Ancestry | # Population | % Population |
| American | 24 | 8.6% |
| Belgian | 10 | 3.6% |
| Danish | 2 | 0.7% |
| English | 15 | 5.4% |
| Ethiopian | 11 | 3.9% |
| European | 7 | 2.5% |
| French | 3 | 1.1% |
| German | 126 | 45.0% |
| Irish | 17 | 6.1% |
| Mexican | 13 | 4.6% |
| Norwegian | 8 | 2.9% |
| Polish | 23 | 8.2% |
| Subsaharan African | 11 | 3.9% |
| Swedish | 3 | 1.1% | View All 14 Rows |
Immigrants in Eureka
The most numerous immigrant groups reported in Eureka came from Africa (11 | 3.9%), Eastern Africa (11 | 3.9%), Ethiopia (11 | 3.9%), Central America (3 | 1.1%), and Latin America (3 | 1.1%), together accounting for 13.9% of all Eureka residents.
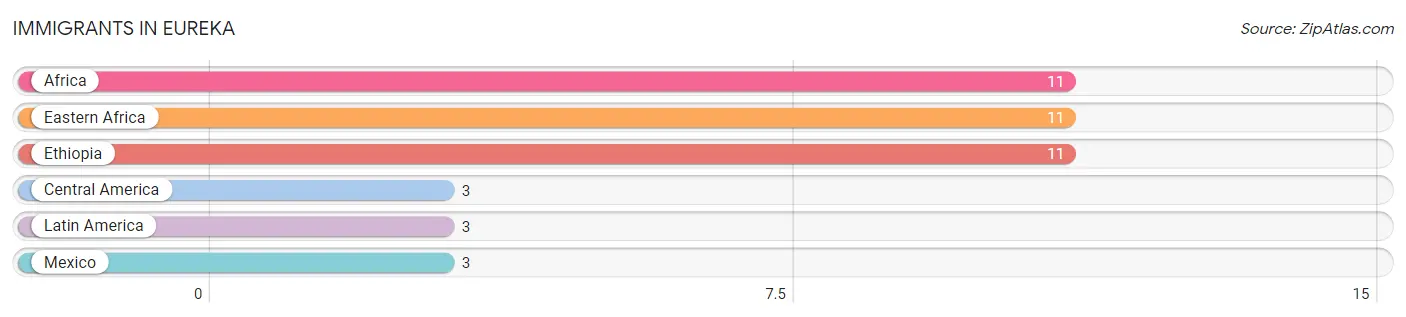
| Immigration Origin | # Population | % Population |
| Africa | 11 | 3.9% |
| Central America | 3 | 1.1% |
| Eastern Africa | 11 | 3.9% |
| Ethiopia | 11 | 3.9% |
| Latin America | 3 | 1.1% |
| Mexico | 3 | 1.1% | View All 6 Rows |
Sex and Age in Eureka
Sex and Age in Eureka
The most populous age groups in Eureka are 30 to 34 Years (21 | 14.5%) for men and Under 5 Years (23 | 17.0%) for women.
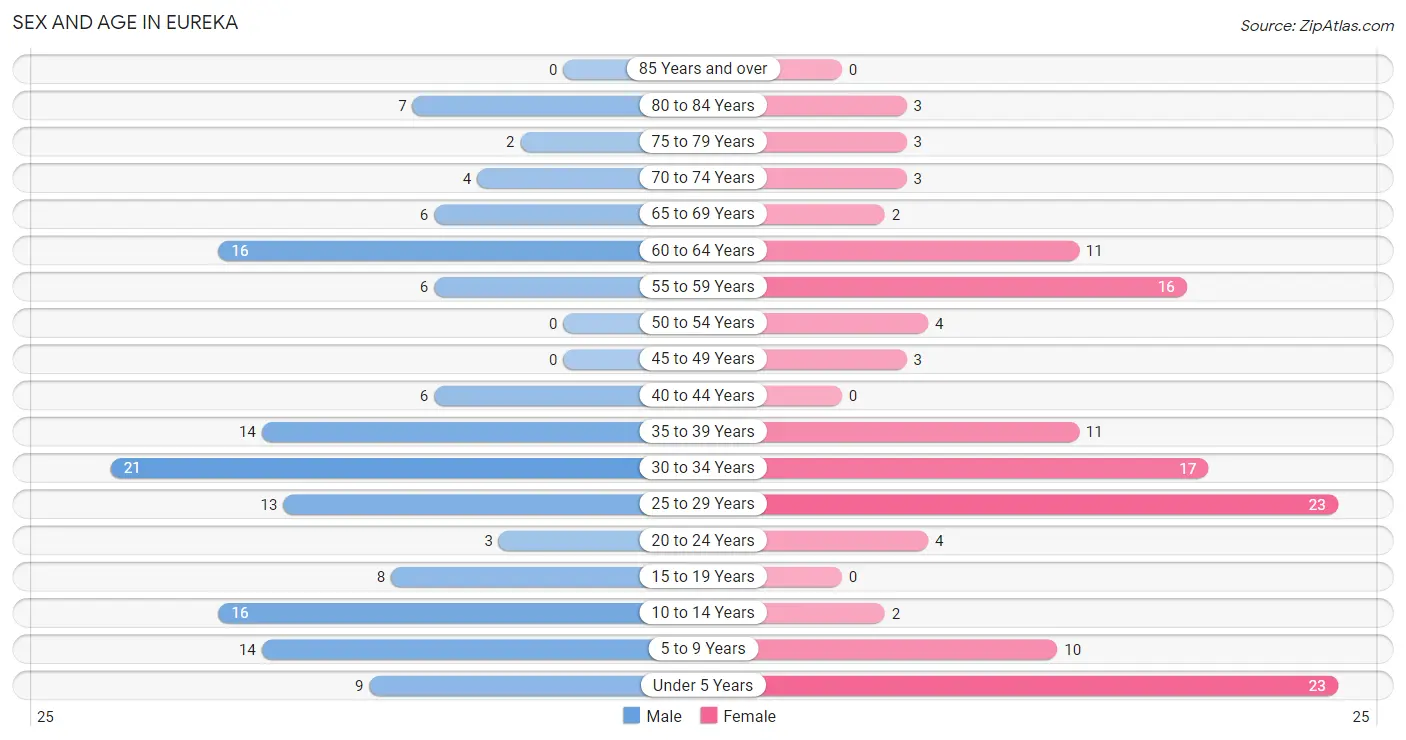
| Age Bracket | Male | Female |
| Under 5 Years | 9 (6.2%) | 23 (17.0%) |
| 5 to 9 Years | 14 (9.7%) | 10 (7.4%) |
| 10 to 14 Years | 16 (11.0%) | 2 (1.5%) |
| 15 to 19 Years | 8 (5.5%) | 0 (0.0%) |
| 20 to 24 Years | 3 (2.1%) | 4 (3.0%) |
| 25 to 29 Years | 13 (9.0%) | 23 (17.0%) |
| 30 to 34 Years | 21 (14.5%) | 17 (12.6%) |
| 35 to 39 Years | 14 (9.7%) | 11 (8.2%) |
| 40 to 44 Years | 6 (4.1%) | 0 (0.0%) |
| 45 to 49 Years | 0 (0.0%) | 3 (2.2%) |
| 50 to 54 Years | 0 (0.0%) | 4 (3.0%) |
| 55 to 59 Years | 6 (4.1%) | 16 (11.8%) |
| 60 to 64 Years | 16 (11.0%) | 11 (8.2%) |
| 65 to 69 Years | 6 (4.1%) | 2 (1.5%) |
| 70 to 74 Years | 4 (2.8%) | 3 (2.2%) |
| 75 to 79 Years | 2 (1.4%) | 3 (2.2%) |
| 80 to 84 Years | 7 (4.8%) | 3 (2.2%) |
| 85 Years and over | 0 (0.0%) | 0 (0.0%) |
| Total | 145 (100.0%) | 135 (100.0%) |
Families and Households in Eureka
Median Family Size in Eureka
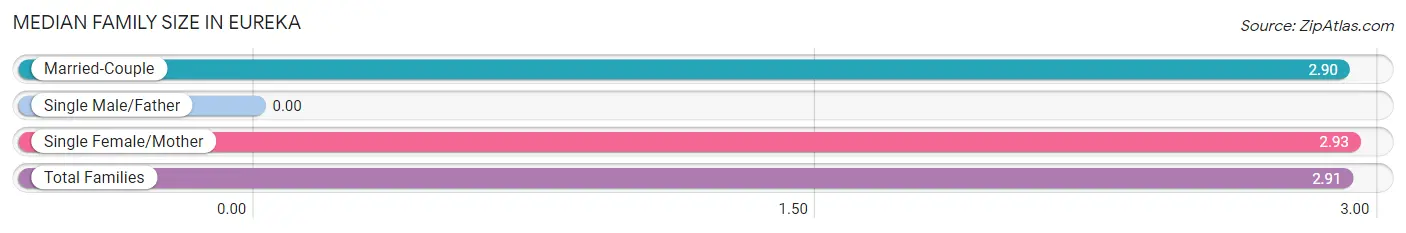
| Family Type | # Families | Family Size |
| Married-Couple | 61 (81.3%) | 2.90 |
| Single Male/Father | 0 (0.0%) | - |
| Single Female/Mother | 14 (18.7%) | 2.93 |
| Total Families | 75 (100.0%) | 2.91 |
Median Household Size in Eureka
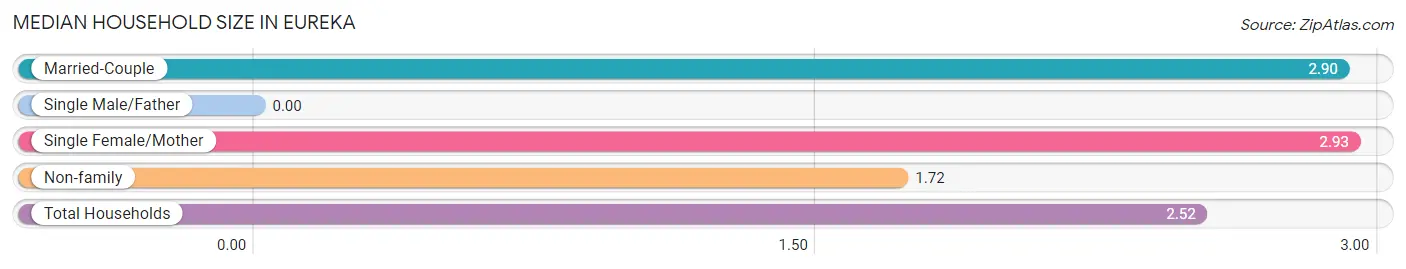
| Household Type | # Households | Household Size |
| Married-Couple | 61 (54.9%) | 2.90 |
| Single Male/Father | 0 (0.0%) | - |
| Single Female/Mother | 14 (12.6%) | 2.93 |
| Non-family | 36 (32.4%) | 1.72 |
| Total Households | 111 (100.0%) | 2.52 |
Household Size by Marriage Status in Eureka
Out of a total of 111 households in Eureka, 75 (67.6%) are family households, while 36 (32.4%) are nonfamily households. The most numerous type of family households are 2-person households, comprising 33, and the most common type of nonfamily households are 2-person households, comprising 22.
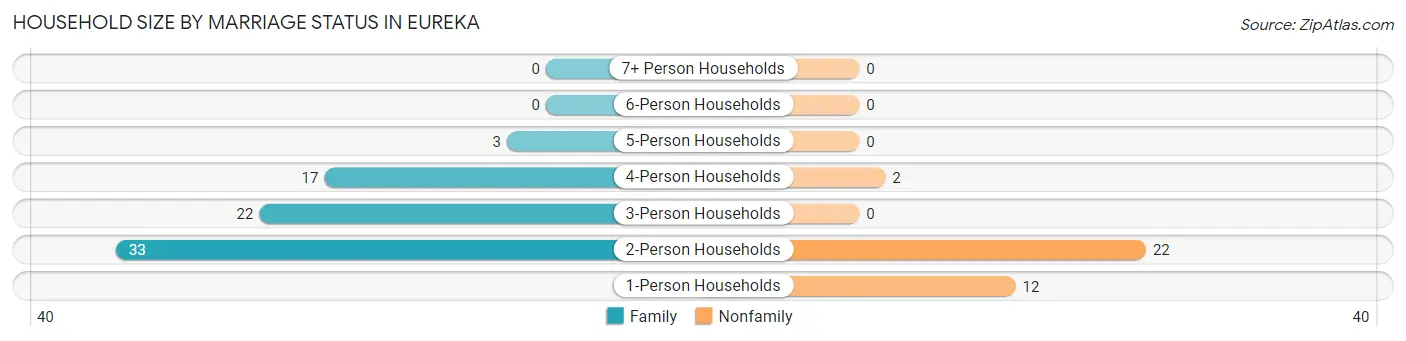
| Household Size | Family Households | Nonfamily Households |
| 1-Person Households | - | 12 (10.8%) |
| 2-Person Households | 33 (29.7%) | 22 (19.8%) |
| 3-Person Households | 22 (19.8%) | 0 (0.0%) |
| 4-Person Households | 17 (15.3%) | 2 (1.8%) |
| 5-Person Households | 3 (2.7%) | 0 (0.0%) |
| 6-Person Households | 0 (0.0%) | 0 (0.0%) |
| 7+ Person Households | 0 (0.0%) | 0 (0.0%) |
| Total | 75 (67.6%) | 36 (32.4%) |
Female Fertility in Eureka
Fertility by Age in Eureka
Average fertility rate in Eureka is 172.0 births per 1,000 women. Women in the age bracket of 20 to 34 years have the highest fertility rate with 227.0 births per 1,000 women. Women in the age bracket of 20 to 34 years acount for 100.0% of all women with births.
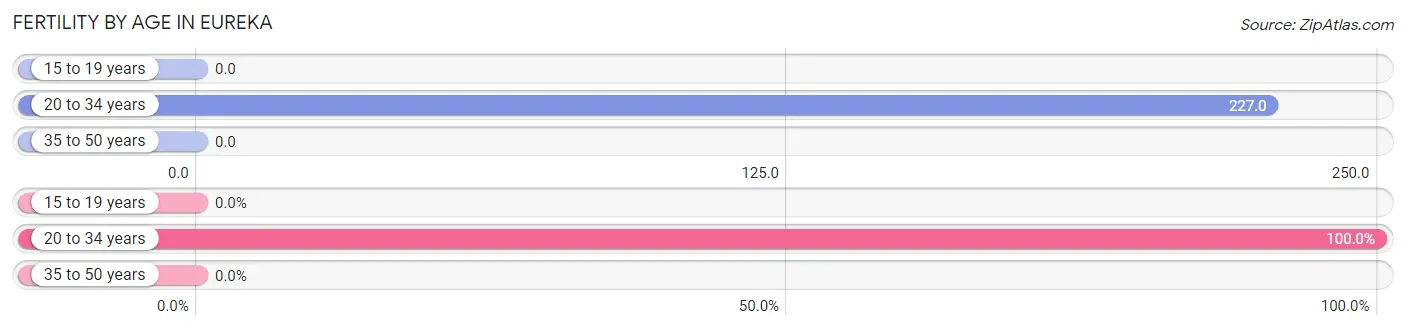
| Age Bracket | Women with Births | Births / 1,000 Women |
| 15 to 19 years | 0 (0.0%) | 0.0 |
| 20 to 34 years | 10 (100.0%) | 227.0 |
| 35 to 50 years | 0 (0.0%) | 0.0 |
| Total | 10 (100.0%) | 172.0 |
Fertility by Age by Marriage Status in Eureka
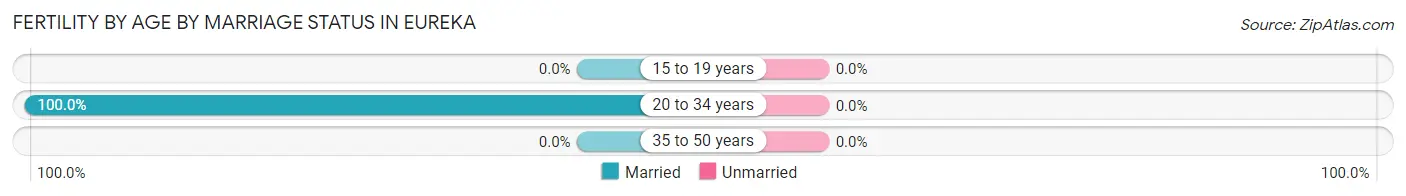
| Age Bracket | Married | Unmarried |
| 15 to 19 years | 0 (0.0%) | 0 (0.0%) |
| 20 to 34 years | 10 (100.0%) | 0 (0.0%) |
| 35 to 50 years | 0 (0.0%) | 0 (0.0%) |
| Total | 10 (100.0%) | 0 (0.0%) |
Fertility by Education in Eureka
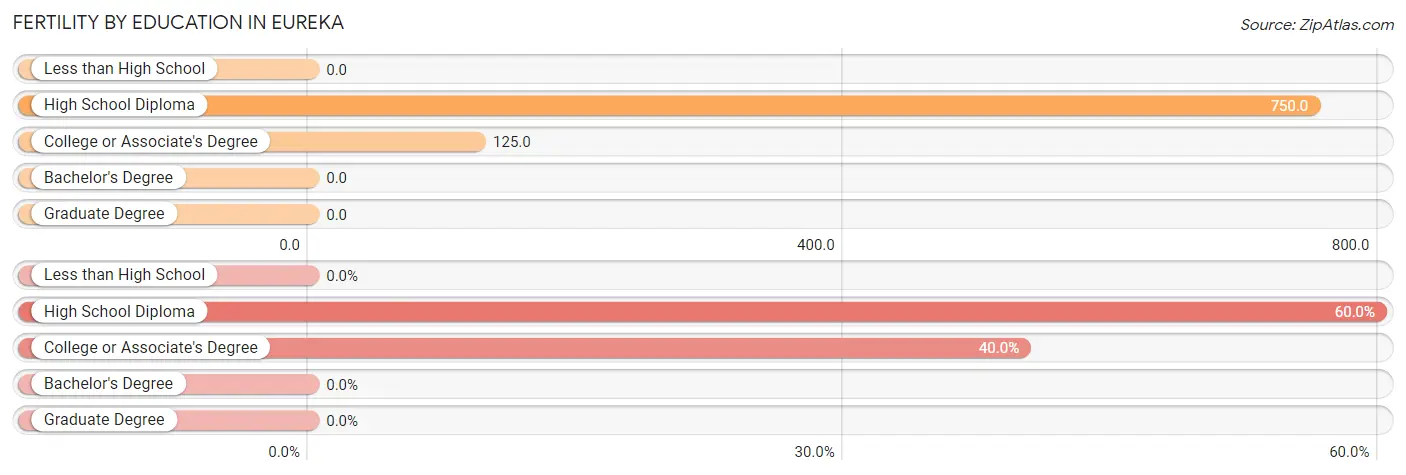
| Educational Attainment | Women with Births | Births / 1,000 Women |
| Less than High School | 0 (0.0%) | 0.0 |
| High School Diploma | 6 (60.0%) | 750.0 |
| College or Associate's Degree | 4 (40.0%) | 125.0 |
| Bachelor's Degree | 0 (0.0%) | 0.0 |
| Graduate Degree | 0 (0.0%) | 0.0 |
| Total | 10 (100.0%) | 172.0 |
Fertility by Education by Marriage Status in Eureka
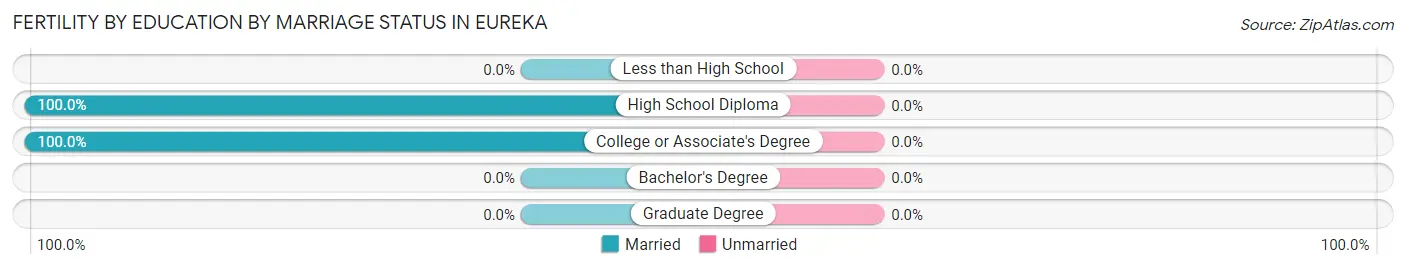
| Educational Attainment | Married | Unmarried |
| Less than High School | 0 (0.0%) | 0 (0.0%) |
| High School Diploma | 6 (100.0%) | 0 (0.0%) |
| College or Associate's Degree | 4 (100.0%) | 0 (0.0%) |
| Bachelor's Degree | 0 (0.0%) | 0 (0.0%) |
| Graduate Degree | 0 (0.0%) | 0 (0.0%) |
| Total | 10 (100.0%) | 0 (0.0%) |
Employment Characteristics in Eureka
Employment by Class of Employer in Eureka
Among the 144 employed individuals in Eureka, private company employees (116 | 80.6%), not-for-profit organizations (11 | 7.6%), and self-employed (incorporated) (7 | 4.9%) make up the most common classes of employment.
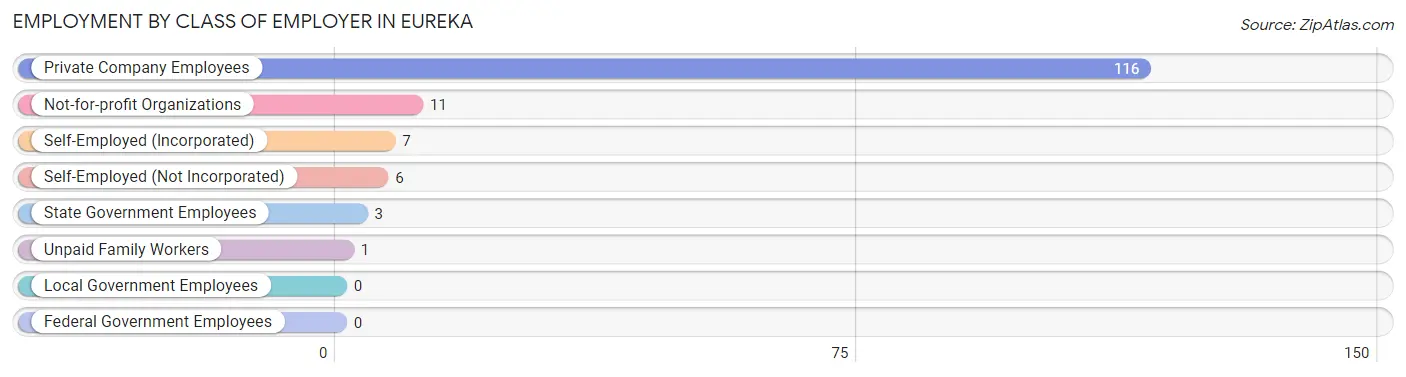
| Employer Class | # Employees | % Employees |
| Private Company Employees | 116 | 80.6% |
| Self-Employed (Incorporated) | 7 | 4.9% |
| Self-Employed (Not Incorporated) | 6 | 4.2% |
| Not-for-profit Organizations | 11 | 7.6% |
| Local Government Employees | 0 | 0.0% |
| State Government Employees | 3 | 2.1% |
| Federal Government Employees | 0 | 0.0% |
| Unpaid Family Workers | 1 | 0.7% |
| Total | 144 | 100.0% |
Employment Status by Age in Eureka
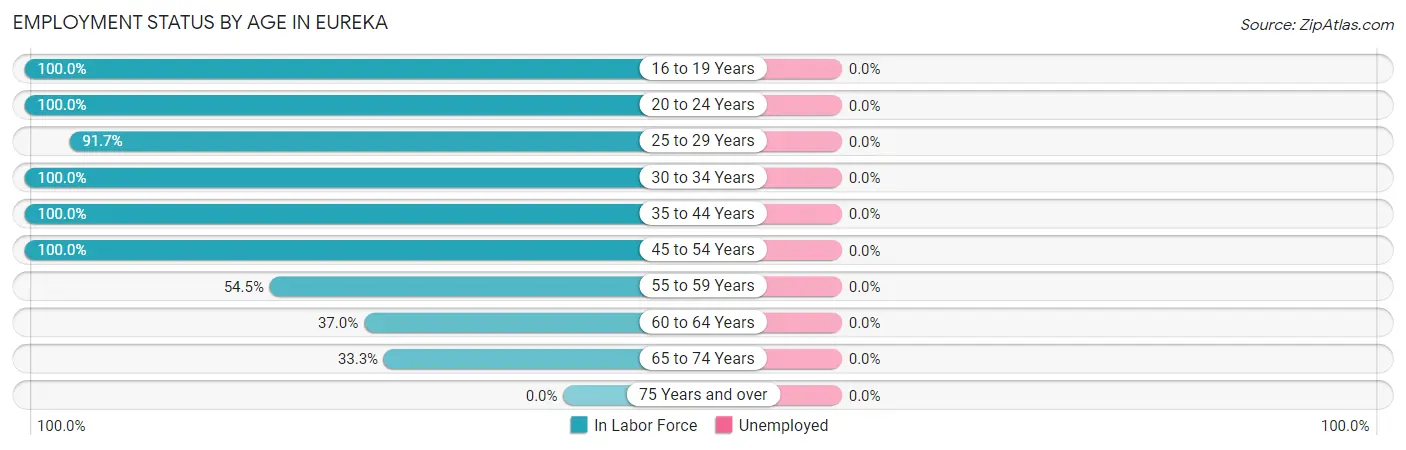
| Age Bracket | In Labor Force | Unemployed |
| 16 to 19 Years | 8 (100.0%) | 0 (0.0%) |
| 20 to 24 Years | 7 (100.0%) | 0 (0.0%) |
| 25 to 29 Years | 33 (91.7%) | 0 (0.0%) |
| 30 to 34 Years | 38 (100.0%) | 0 (0.0%) |
| 35 to 44 Years | 31 (100.0%) | 0 (0.0%) |
| 45 to 54 Years | 7 (100.0%) | 0 (0.0%) |
| 55 to 59 Years | 12 (54.5%) | 0 (0.0%) |
| 60 to 64 Years | 10 (37.0%) | 0 (0.0%) |
| 65 to 74 Years | 5 (33.3%) | 0 (0.0%) |
| 75 Years and over | 0 (0.0%) | 0 (0.0%) |
| Total | 151 (73.3%) | 0 (0.0%) |
Employment Status by Educational Attainment in Eureka
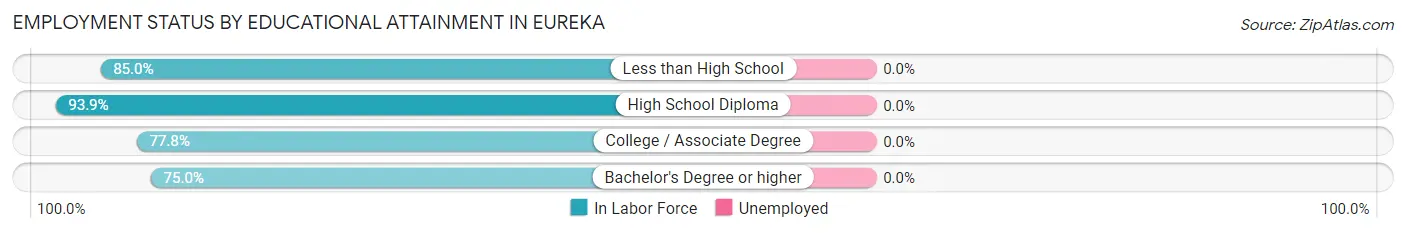
| Educational Attainment | In Labor Force | Unemployed |
| Less than High School | 17 (85.0%) | 0 (0.0%) |
| High School Diploma | 31 (93.9%) | 0 (0.0%) |
| College / Associate Degree | 56 (77.8%) | 0 (0.0%) |
| Bachelor's Degree or higher | 27 (75.0%) | 0 (0.0%) |
| Total | 131 (81.4%) | 0 (0.0%) |
Employment Occupations by Sex in Eureka
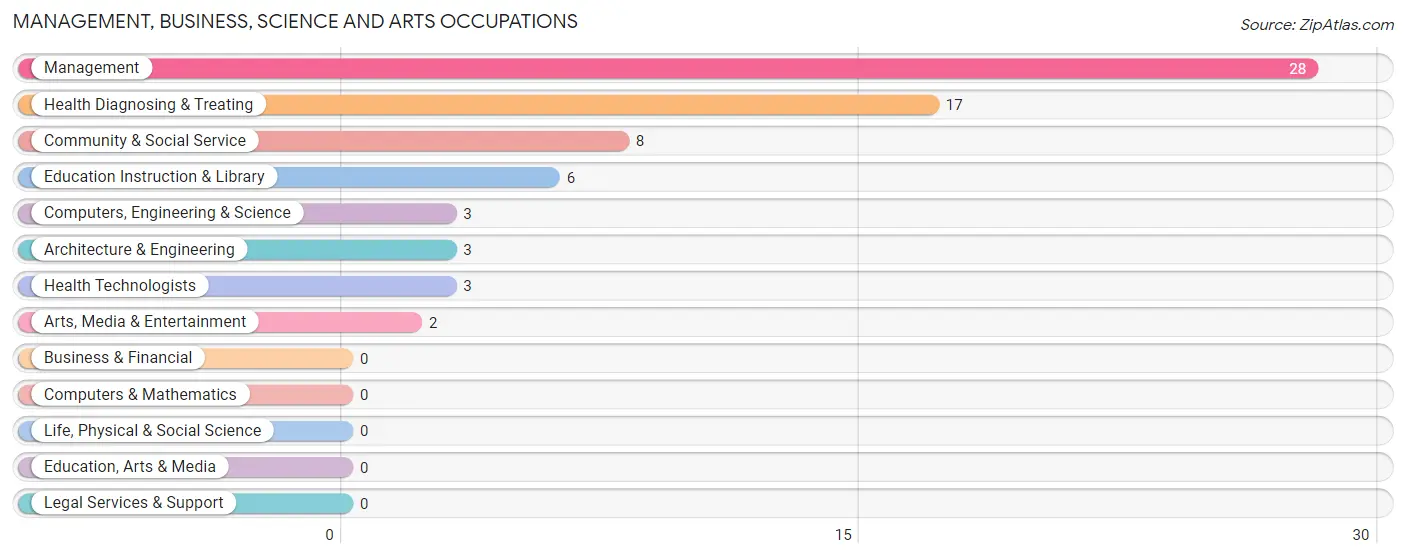
Management, Business, Science and Arts Occupations
The most common Management, Business, Science and Arts occupations in Eureka are Management (28 | 18.5%), Health Diagnosing & Treating (17 | 11.3%), Community & Social Service (8 | 5.3%), Education Instruction & Library (6 | 4.0%), and Computers, Engineering & Science (3 | 2.0%).
Management, Business, Science and Arts Occupations by Sex
Within the Management, Business, Science and Arts occupations in Eureka, the most male-oriented occupations are Computers, Engineering & Science (100.0%), Architecture & Engineering (100.0%), and Management (57.1%), while the most female-oriented occupations are Community & Social Service (100.0%), Education Instruction & Library (100.0%), and Arts, Media & Entertainment (100.0%).
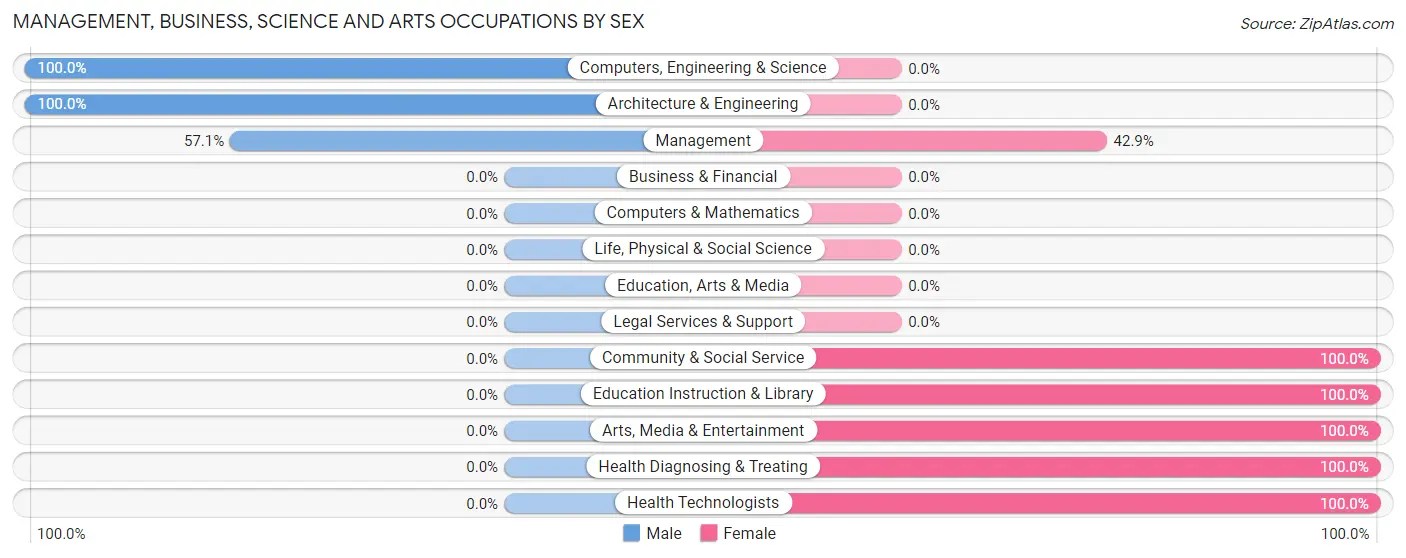
| Occupation | Male | Female |
| Management | 16 (57.1%) | 12 (42.9%) |
| Business & Financial | 0 (0.0%) | 0 (0.0%) |
| Computers, Engineering & Science | 3 (100.0%) | 0 (0.0%) |
| Computers & Mathematics | 0 (0.0%) | 0 (0.0%) |
| Architecture & Engineering | 3 (100.0%) | 0 (0.0%) |
| Life, Physical & Social Science | 0 (0.0%) | 0 (0.0%) |
| Community & Social Service | 0 (0.0%) | 8 (100.0%) |
| Education, Arts & Media | 0 (0.0%) | 0 (0.0%) |
| Legal Services & Support | 0 (0.0%) | 0 (0.0%) |
| Education Instruction & Library | 0 (0.0%) | 6 (100.0%) |
| Arts, Media & Entertainment | 0 (0.0%) | 2 (100.0%) |
| Health Diagnosing & Treating | 0 (0.0%) | 17 (100.0%) |
| Health Technologists | 0 (0.0%) | 3 (100.0%) |
| Total (Category) | 19 (33.9%) | 37 (66.1%) |
| Total (Overall) | 81 (53.6%) | 70 (46.4%) |
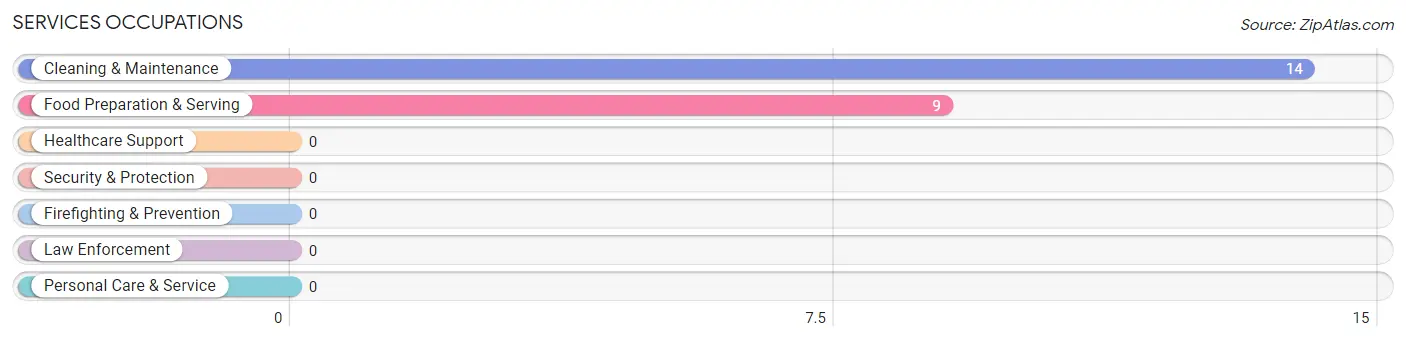
Services Occupations
The most common Services occupations in Eureka are Cleaning & Maintenance (14 | 9.3%), and Food Preparation & Serving (9 | 6.0%).
Services Occupations by Sex
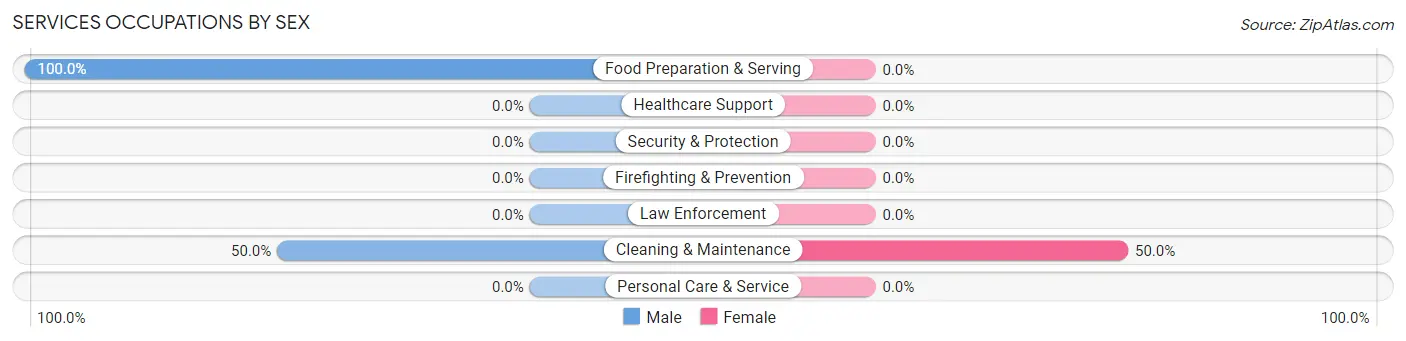
| Occupation | Male | Female |
| Healthcare Support | 0 (0.0%) | 0 (0.0%) |
| Security & Protection | 0 (0.0%) | 0 (0.0%) |
| Firefighting & Prevention | 0 (0.0%) | 0 (0.0%) |
| Law Enforcement | 0 (0.0%) | 0 (0.0%) |
| Food Preparation & Serving | 9 (100.0%) | 0 (0.0%) |
| Cleaning & Maintenance | 7 (50.0%) | 7 (50.0%) |
| Personal Care & Service | 0 (0.0%) | 0 (0.0%) |
| Total (Category) | 16 (69.6%) | 7 (30.4%) |
| Total (Overall) | 81 (53.6%) | 70 (46.4%) |
Sales and Office Occupations
The most common Sales and Office occupations in Eureka are Office & Administration (14 | 9.3%), and Sales & Related (12 | 8.0%).
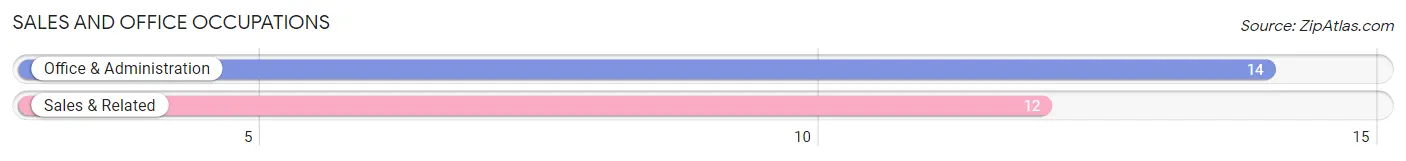
Sales and Office Occupations by Sex

| Occupation | Male | Female |
| Sales & Related | 4 (33.3%) | 8 (66.7%) |
| Office & Administration | 2 (14.3%) | 12 (85.7%) |
| Total (Category) | 6 (23.1%) | 20 (76.9%) |
| Total (Overall) | 81 (53.6%) | 70 (46.4%) |
Natural Resources, Construction and Maintenance Occupations
The most common Natural Resources, Construction and Maintenance occupations in Eureka are Construction & Extraction (13 | 8.6%), and Installation, Maintenance & Repair (6 | 4.0%).
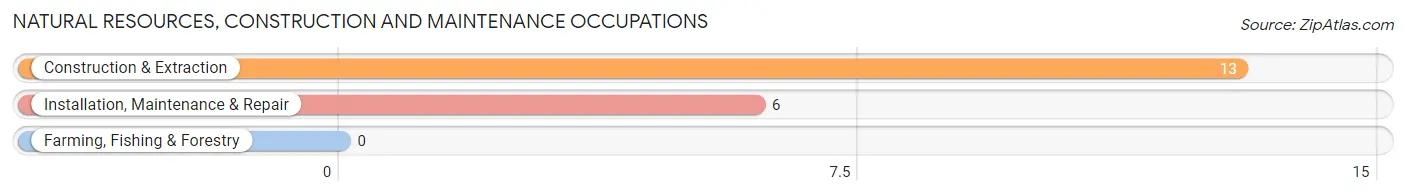
Natural Resources, Construction and Maintenance Occupations by Sex
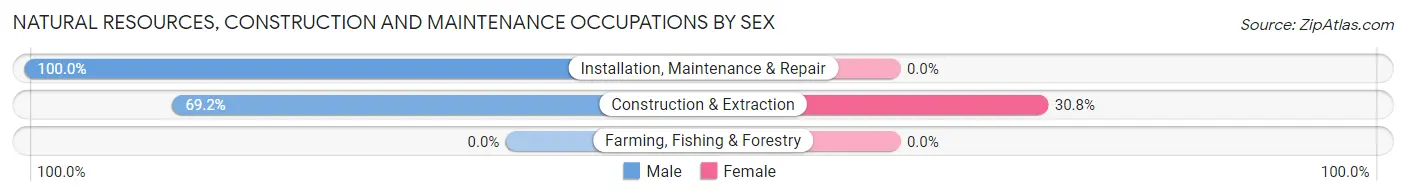
| Occupation | Male | Female |
| Farming, Fishing & Forestry | 0 (0.0%) | 0 (0.0%) |
| Construction & Extraction | 9 (69.2%) | 4 (30.8%) |
| Installation, Maintenance & Repair | 6 (100.0%) | 0 (0.0%) |
| Total (Category) | 15 (78.9%) | 4 (21.0%) |
| Total (Overall) | 81 (53.6%) | 70 (46.4%) |
Production, Transportation and Moving Occupations
The most common Production, Transportation and Moving occupations in Eureka are Production (24 | 15.9%), and Transportation (3 | 2.0%).
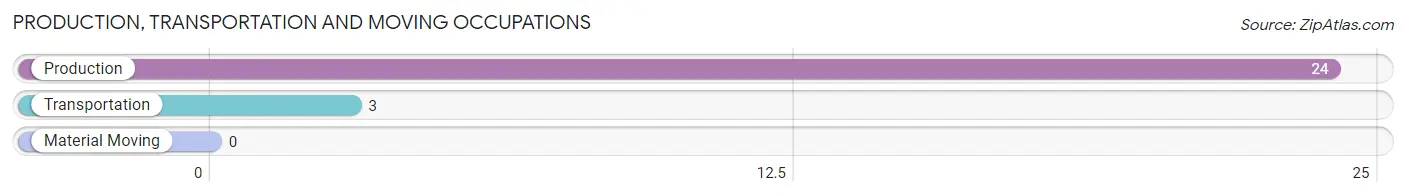
Production, Transportation and Moving Occupations by Sex
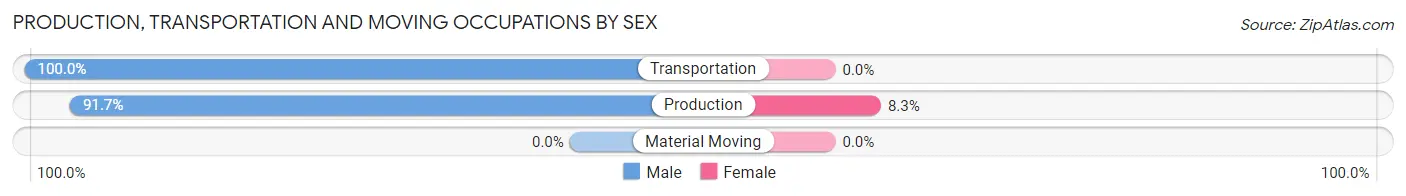
| Occupation | Male | Female |
| Production | 22 (91.7%) | 2 (8.3%) |
| Transportation | 3 (100.0%) | 0 (0.0%) |
| Material Moving | 0 (0.0%) | 0 (0.0%) |
| Total (Category) | 25 (92.6%) | 2 (7.4%) |
| Total (Overall) | 81 (53.6%) | 70 (46.4%) |
Employment Industries by Sex in Eureka
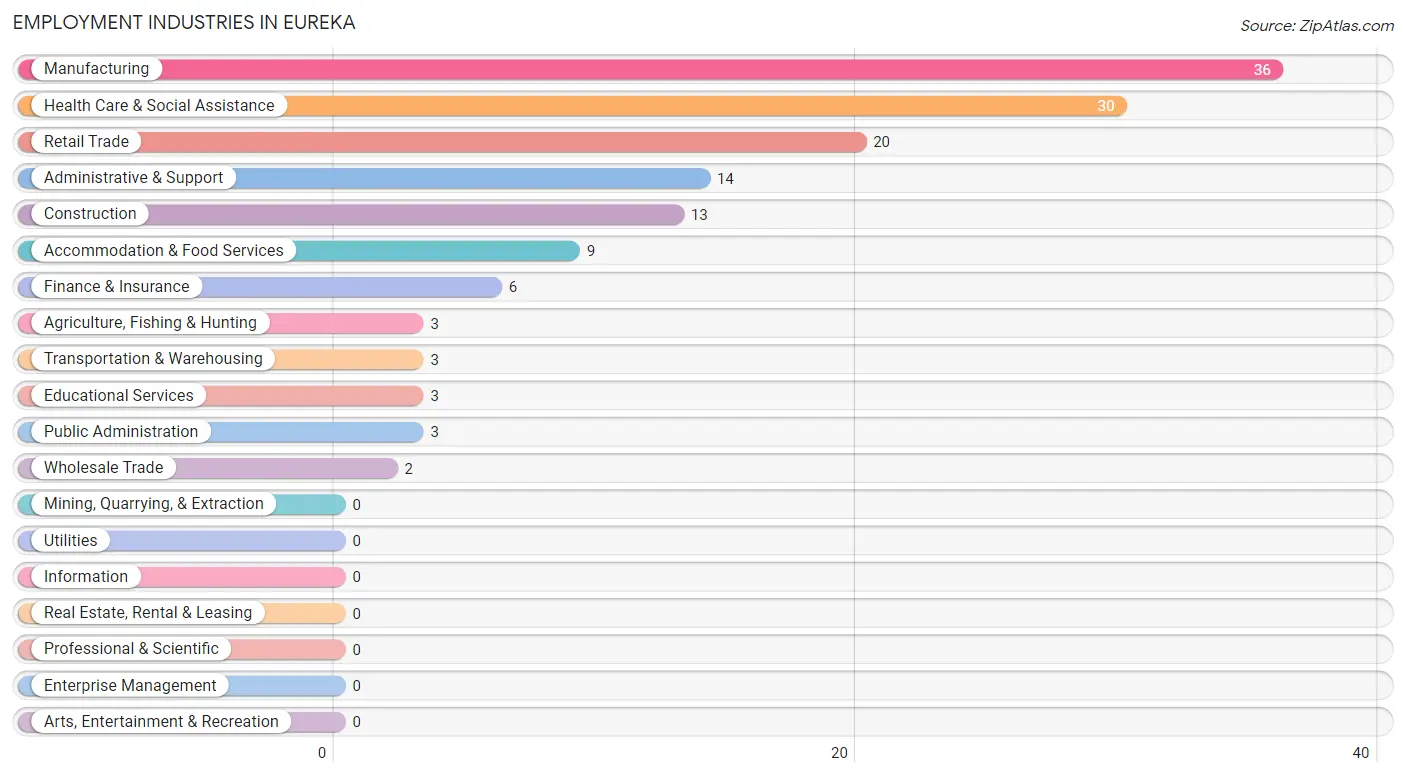
Employment Industries in Eureka
The major employment industries in Eureka include Manufacturing (36 | 23.8%), Health Care & Social Assistance (30 | 19.9%), Retail Trade (20 | 13.3%), Administrative & Support (14 | 9.3%), and Construction (13 | 8.6%).
Employment Industries by Sex in Eureka
The Eureka industries that see more men than women are Agriculture, Fishing & Hunting (100.0%), Wholesale Trade (100.0%), and Transportation & Warehousing (100.0%), whereas the industries that tend to have a higher number of women are Finance & Insurance (100.0%), Educational Services (100.0%), and Health Care & Social Assistance (100.0%).
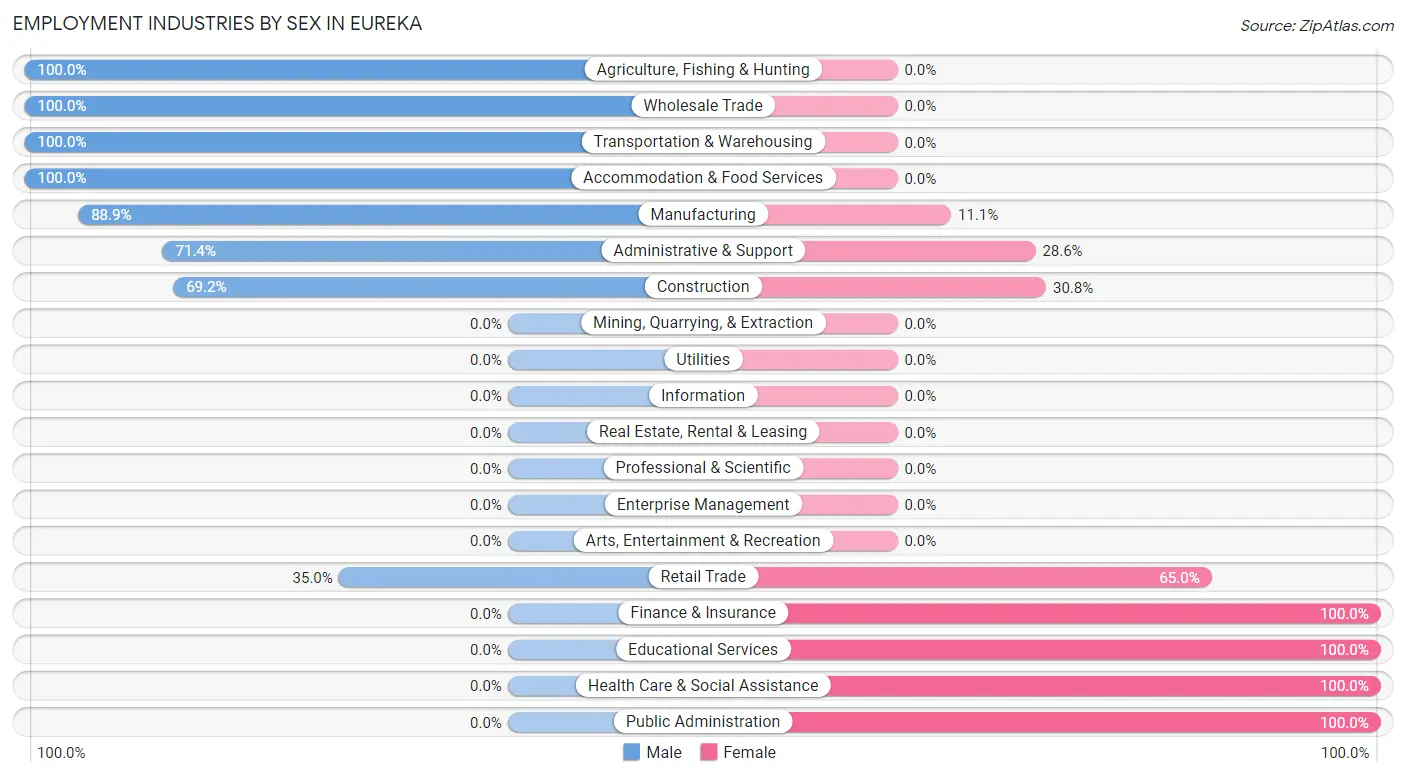
| Industry | Male | Female |
| Agriculture, Fishing & Hunting | 3 (100.0%) | 0 (0.0%) |
| Mining, Quarrying, & Extraction | 0 (0.0%) | 0 (0.0%) |
| Construction | 9 (69.2%) | 4 (30.8%) |
| Manufacturing | 32 (88.9%) | 4 (11.1%) |
| Wholesale Trade | 2 (100.0%) | 0 (0.0%) |
| Retail Trade | 7 (35.0%) | 13 (65.0%) |
| Transportation & Warehousing | 3 (100.0%) | 0 (0.0%) |
| Utilities | 0 (0.0%) | 0 (0.0%) |
| Information | 0 (0.0%) | 0 (0.0%) |
| Finance & Insurance | 0 (0.0%) | 6 (100.0%) |
| Real Estate, Rental & Leasing | 0 (0.0%) | 0 (0.0%) |
| Professional & Scientific | 0 (0.0%) | 0 (0.0%) |
| Enterprise Management | 0 (0.0%) | 0 (0.0%) |
| Administrative & Support | 10 (71.4%) | 4 (28.6%) |
| Educational Services | 0 (0.0%) | 3 (100.0%) |
| Health Care & Social Assistance | 0 (0.0%) | 30 (100.0%) |
| Arts, Entertainment & Recreation | 0 (0.0%) | 0 (0.0%) |
| Accommodation & Food Services | 9 (100.0%) | 0 (0.0%) |
| Public Administration | 0 (0.0%) | 3 (100.0%) |
| Total | 81 (53.6%) | 70 (46.4%) |
Education in Eureka
School Enrollment in Eureka
The most common levels of schooling among the 50 students in Eureka are kindergarten (13 | 26.0%), elementary school (11 | 22.0%), and high school (8 | 16.0%).
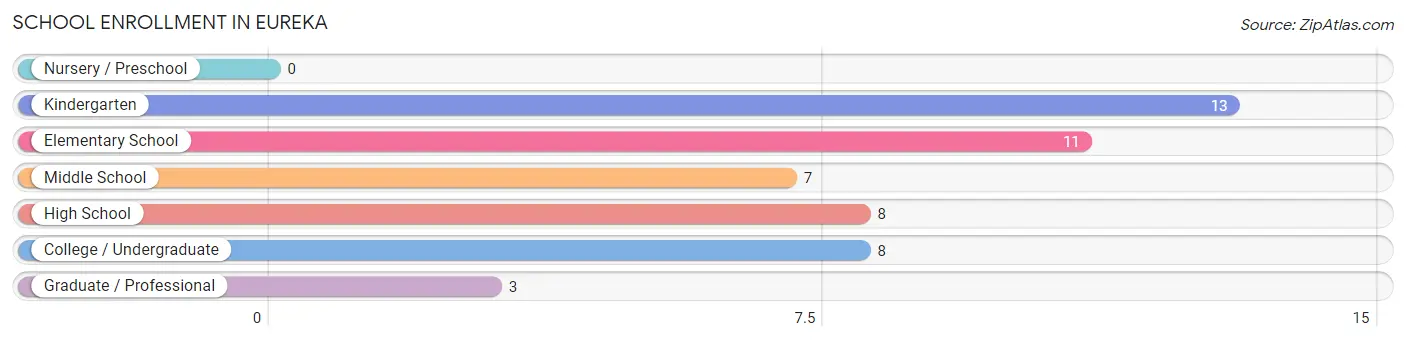
| School Level | # Students | % Students |
| Nursery / Preschool | 0 | 0.0% |
| Kindergarten | 13 | 26.0% |
| Elementary School | 11 | 22.0% |
| Middle School | 7 | 14.0% |
| High School | 8 | 16.0% |
| College / Undergraduate | 8 | 16.0% |
| Graduate / Professional | 3 | 6.0% |
| Total | 50 | 100.0% |
School Enrollment by Age by Funding Source in Eureka
Out of a total of 50 students who are enrolled in schools in Eureka, 11 (22.0%) attend a private institution, while the remaining 39 (78.0%) are enrolled in public schools. The age group of 25 to 34 year olds has the highest likelihood of being enrolled in private schools, with 3 (100.0% in the age bracket) enrolled. Conversely, the age group of 15 to 17 year olds has the lowest likelihood of being enrolled in a private school, with 8 (100.0% in the age bracket) attending a public institution.
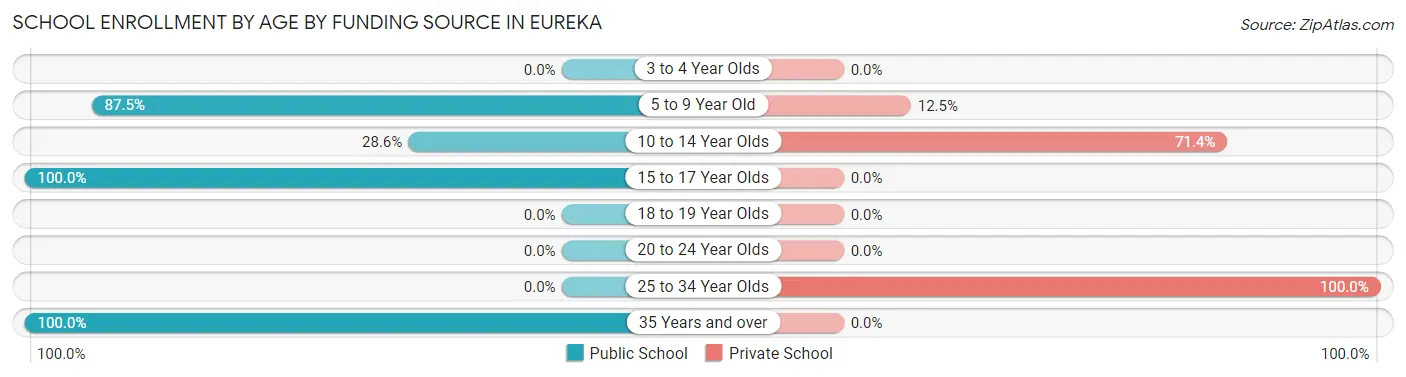
| Age Bracket | Public School | Private School |
| 3 to 4 Year Olds | 0 (0.0%) | 0 (0.0%) |
| 5 to 9 Year Old | 21 (87.5%) | 3 (12.5%) |
| 10 to 14 Year Olds | 2 (28.6%) | 5 (71.4%) |
| 15 to 17 Year Olds | 8 (100.0%) | 0 (0.0%) |
| 18 to 19 Year Olds | 0 (0.0%) | 0 (0.0%) |
| 20 to 24 Year Olds | 0 (0.0%) | 0 (0.0%) |
| 25 to 34 Year Olds | 0 (0.0%) | 3 (100.0%) |
| 35 Years and over | 8 (100.0%) | 0 (0.0%) |
| Total | 39 (78.0%) | 11 (22.0%) |
Educational Attainment by Field of Study in Eureka
Literature & languages (12 | 30.8%), arts & humanities (10 | 25.6%), bio, nature & agricultural (6 | 15.4%), education (6 | 15.4%), and engineering (3 | 7.7%) are the most common fields of study among 39 individuals in Eureka who have obtained a bachelor's degree or higher.
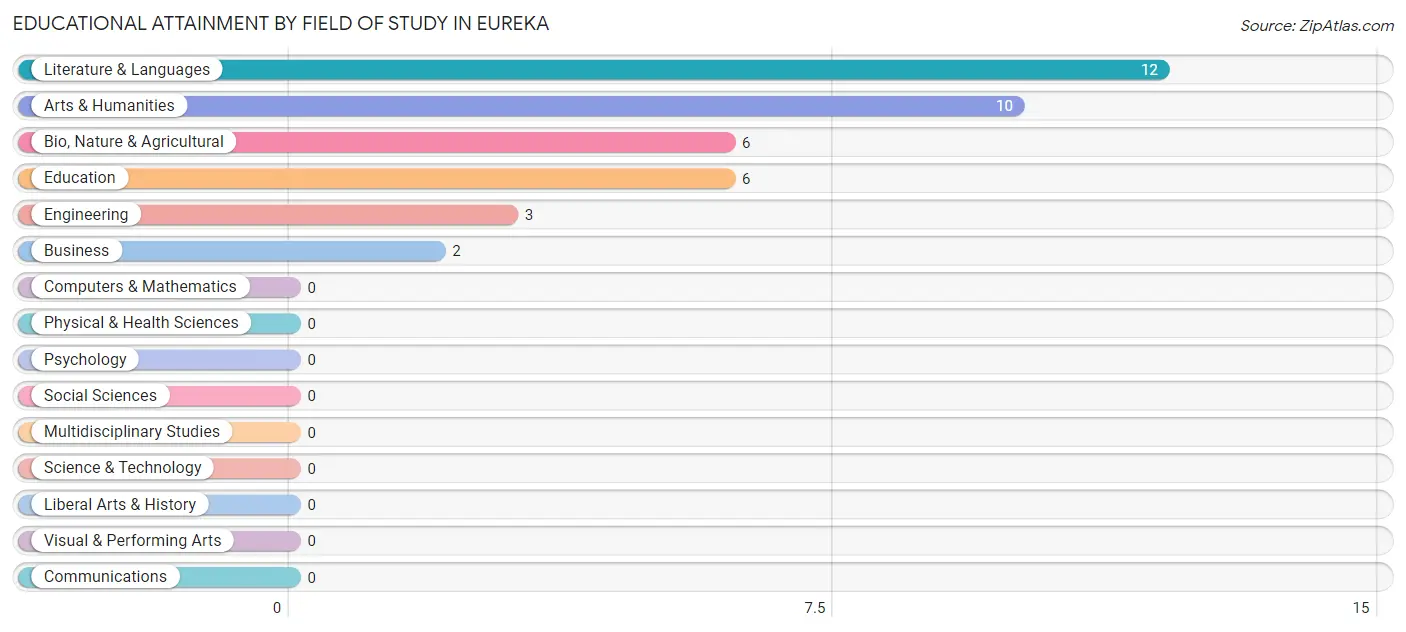
| Field of Study | # Graduates | % Graduates |
| Computers & Mathematics | 0 | 0.0% |
| Bio, Nature & Agricultural | 6 | 15.4% |
| Physical & Health Sciences | 0 | 0.0% |
| Psychology | 0 | 0.0% |
| Social Sciences | 0 | 0.0% |
| Engineering | 3 | 7.7% |
| Multidisciplinary Studies | 0 | 0.0% |
| Science & Technology | 0 | 0.0% |
| Business | 2 | 5.1% |
| Education | 6 | 15.4% |
| Literature & Languages | 12 | 30.8% |
| Liberal Arts & History | 0 | 0.0% |
| Visual & Performing Arts | 0 | 0.0% |
| Communications | 0 | 0.0% |
| Arts & Humanities | 10 | 25.6% |
| Total | 39 | 100.0% |
Transportation & Commute in Eureka
Vehicle Availability by Sex in Eureka
The most prevalent vehicle ownership categories in Eureka are males with 2 vehicles (37, accounting for 45.7%) and females with 2 vehicles (26, making up 58.7%).
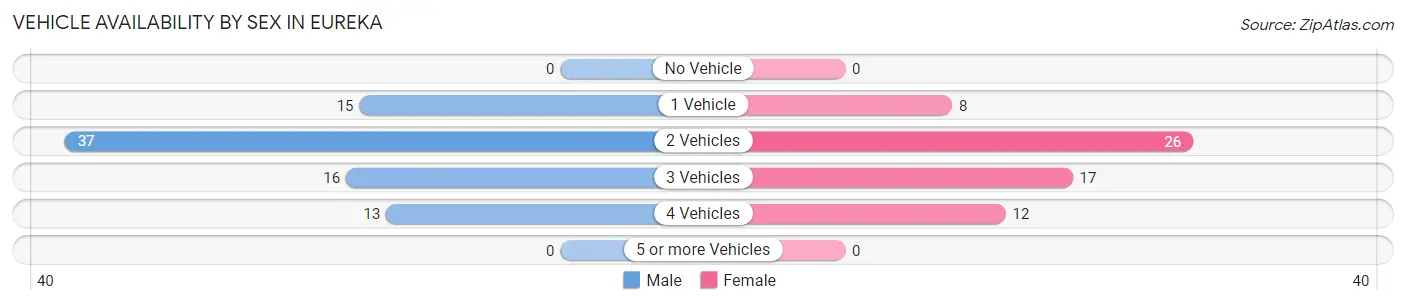
| Vehicles Available | Male | Female |
| No Vehicle | 0 (0.0%) | 0 (0.0%) |
| 1 Vehicle | 15 (18.5%) | 8 (12.7%) |
| 2 Vehicles | 37 (45.7%) | 26 (41.3%) |
| 3 Vehicles | 16 (19.8%) | 17 (27.0%) |
| 4 Vehicles | 13 (16.1%) | 12 (19.1%) |
| 5 or more Vehicles | 0 (0.0%) | 0 (0.0%) |
| Total | 81 (100.0%) | 63 (100.0%) |
Commute Time in Eureka
The most frequently occuring commute durations in Eureka are 20 to 24 minutes (31 commuters, 22.0%), 45 to 59 minutes (21 commuters, 14.9%), and 15 to 19 minutes (19 commuters, 13.5%).
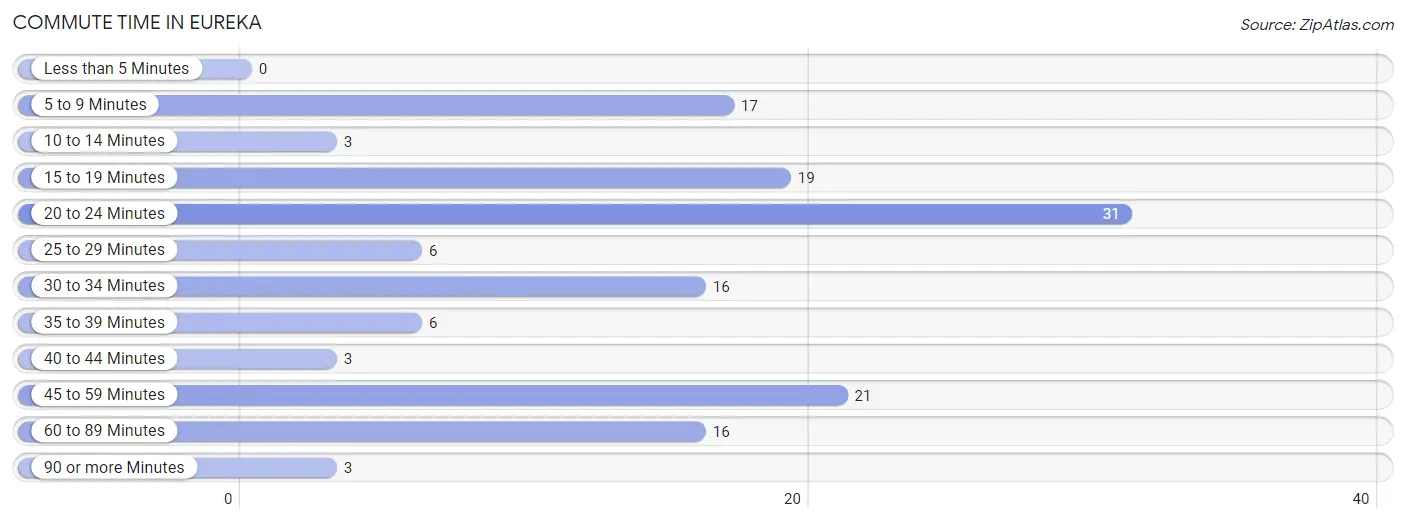
| Commute Time | # Commuters | % Commuters |
| Less than 5 Minutes | 0 | 0.0% |
| 5 to 9 Minutes | 17 | 12.1% |
| 10 to 14 Minutes | 3 | 2.1% |
| 15 to 19 Minutes | 19 | 13.5% |
| 20 to 24 Minutes | 31 | 22.0% |
| 25 to 29 Minutes | 6 | 4.3% |
| 30 to 34 Minutes | 16 | 11.4% |
| 35 to 39 Minutes | 6 | 4.3% |
| 40 to 44 Minutes | 3 | 2.1% |
| 45 to 59 Minutes | 21 | 14.9% |
| 60 to 89 Minutes | 16 | 11.4% |
| 90 or more Minutes | 3 | 2.1% |
Commute Time by Sex in Eureka
The most common commute times in Eureka are 15 to 19 minutes (17 commuters, 21.0%) for males and 45 to 59 minutes (19 commuters, 31.7%) for females.
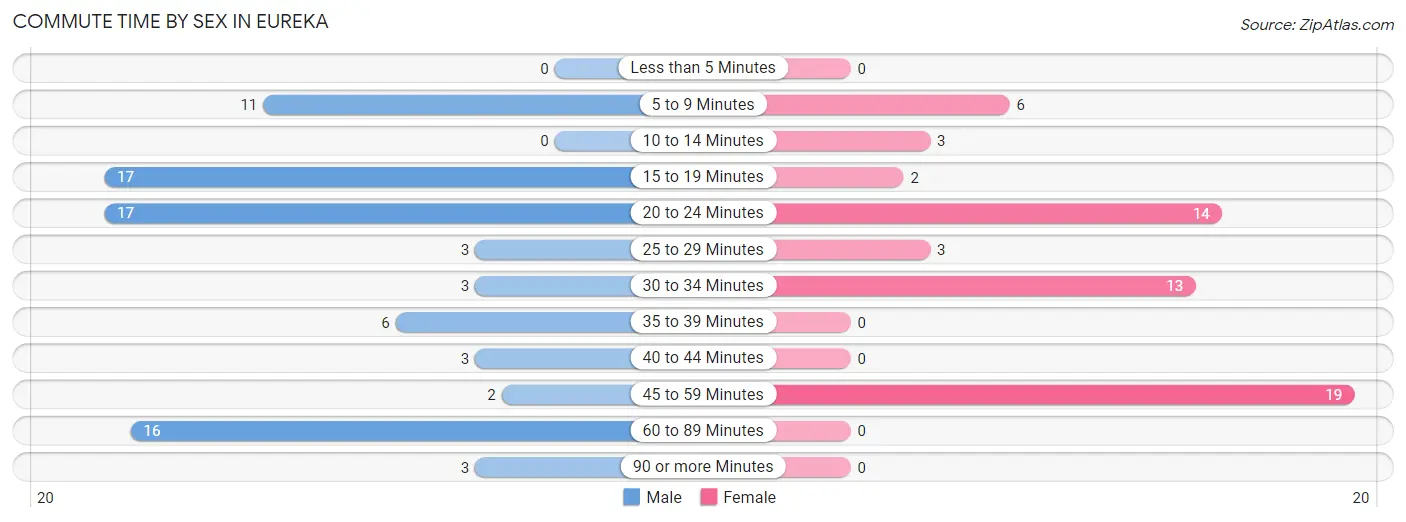
| Commute Time | Male | Female |
| Less than 5 Minutes | 0 (0.0%) | 0 (0.0%) |
| 5 to 9 Minutes | 11 (13.6%) | 6 (10.0%) |
| 10 to 14 Minutes | 0 (0.0%) | 3 (5.0%) |
| 15 to 19 Minutes | 17 (21.0%) | 2 (3.3%) |
| 20 to 24 Minutes | 17 (21.0%) | 14 (23.3%) |
| 25 to 29 Minutes | 3 (3.7%) | 3 (5.0%) |
| 30 to 34 Minutes | 3 (3.7%) | 13 (21.7%) |
| 35 to 39 Minutes | 6 (7.4%) | 0 (0.0%) |
| 40 to 44 Minutes | 3 (3.7%) | 0 (0.0%) |
| 45 to 59 Minutes | 2 (2.5%) | 19 (31.7%) |
| 60 to 89 Minutes | 16 (19.8%) | 0 (0.0%) |
| 90 or more Minutes | 3 (3.7%) | 0 (0.0%) |
Time of Departure to Work by Sex in Eureka
The most frequent times of departure to work in Eureka are 5:30 AM to 5:59 AM (28, 34.6%) for males and 7:00 AM to 7:29 AM (17, 28.3%) for females.
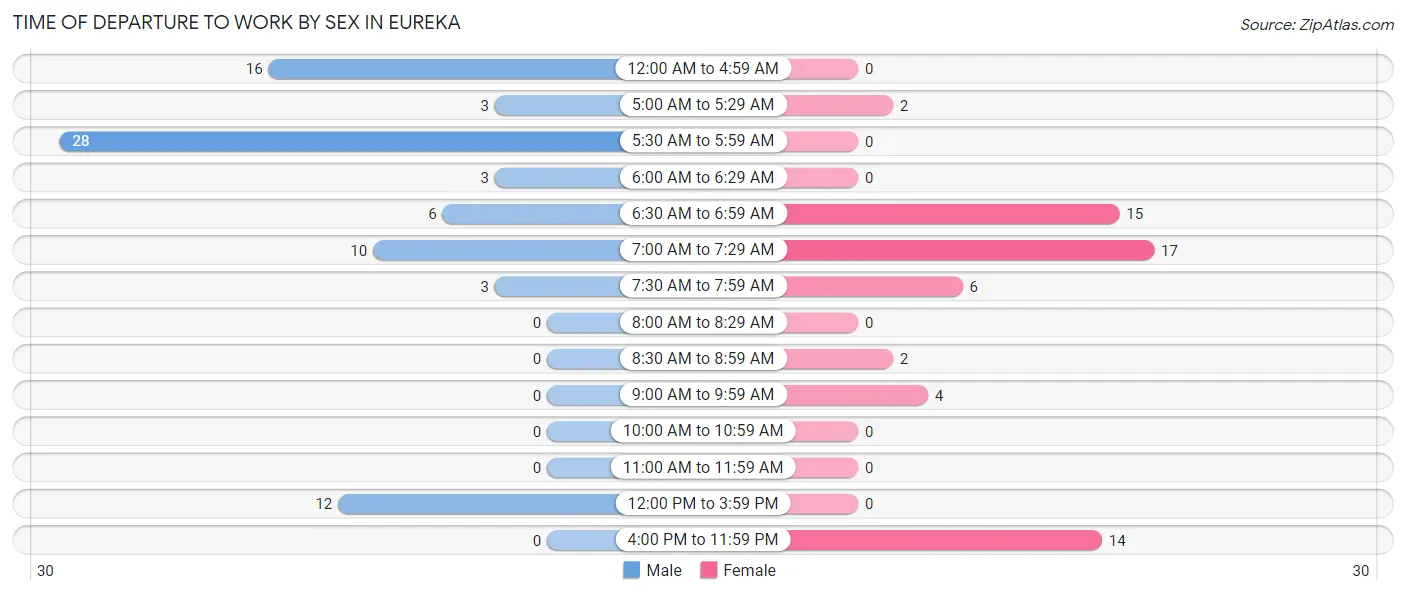
| Time of Departure | Male | Female |
| 12:00 AM to 4:59 AM | 16 (19.8%) | 0 (0.0%) |
| 5:00 AM to 5:29 AM | 3 (3.7%) | 2 (3.3%) |
| 5:30 AM to 5:59 AM | 28 (34.6%) | 0 (0.0%) |
| 6:00 AM to 6:29 AM | 3 (3.7%) | 0 (0.0%) |
| 6:30 AM to 6:59 AM | 6 (7.4%) | 15 (25.0%) |
| 7:00 AM to 7:29 AM | 10 (12.3%) | 17 (28.3%) |
| 7:30 AM to 7:59 AM | 3 (3.7%) | 6 (10.0%) |
| 8:00 AM to 8:29 AM | 0 (0.0%) | 0 (0.0%) |
| 8:30 AM to 8:59 AM | 0 (0.0%) | 2 (3.3%) |
| 9:00 AM to 9:59 AM | 0 (0.0%) | 4 (6.7%) |
| 10:00 AM to 10:59 AM | 0 (0.0%) | 0 (0.0%) |
| 11:00 AM to 11:59 AM | 0 (0.0%) | 0 (0.0%) |
| 12:00 PM to 3:59 PM | 12 (14.8%) | 0 (0.0%) |
| 4:00 PM to 11:59 PM | 0 (0.0%) | 14 (23.3%) |
| Total | 81 (100.0%) | 60 (100.0%) |
Housing Occupancy in Eureka
Occupancy by Ownership in Eureka
Of the total 111 dwellings in Eureka, owner-occupied units account for 86 (77.5%), while renter-occupied units make up 25 (22.5%).
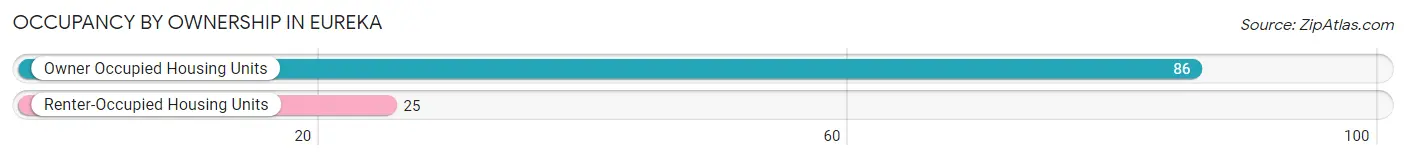
| Occupancy | # Housing Units | % Housing Units |
| Owner Occupied Housing Units | 86 | 77.5% |
| Renter-Occupied Housing Units | 25 | 22.5% |
| Total Occupied Housing Units | 111 | 100.0% |
Occupancy by Household Size in Eureka
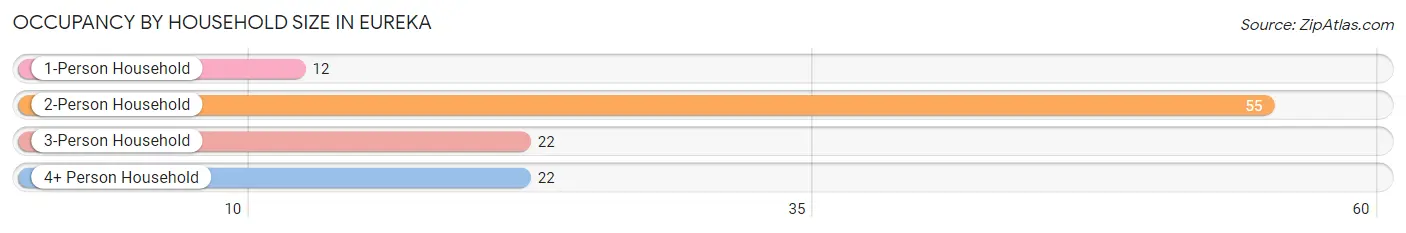
| Household Size | # Housing Units | % Housing Units |
| 1-Person Household | 12 | 10.8% |
| 2-Person Household | 55 | 49.5% |
| 3-Person Household | 22 | 19.8% |
| 4+ Person Household | 22 | 19.8% |
| Total Housing Units | 111 | 100.0% |
Occupancy by Ownership by Household Size in Eureka
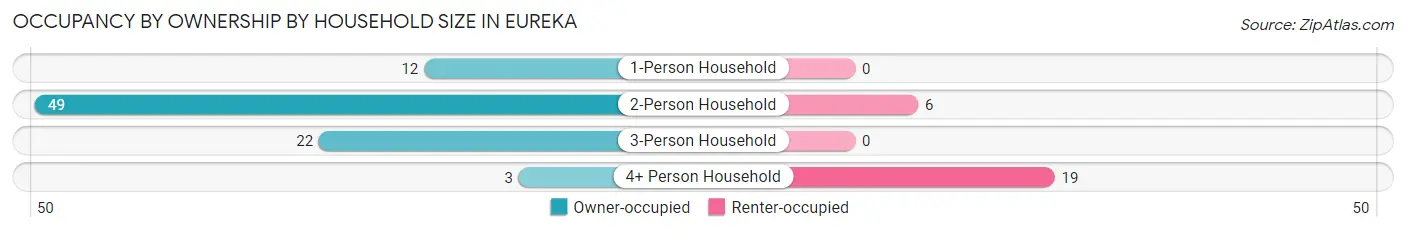
| Household Size | Owner-occupied | Renter-occupied |
| 1-Person Household | 12 (100.0%) | 0 (0.0%) |
| 2-Person Household | 49 (89.1%) | 6 (10.9%) |
| 3-Person Household | 22 (100.0%) | 0 (0.0%) |
| 4+ Person Household | 3 (13.6%) | 19 (86.4%) |
| Total Housing Units | 86 (77.5%) | 25 (22.5%) |
Occupancy by Educational Attainment in Eureka
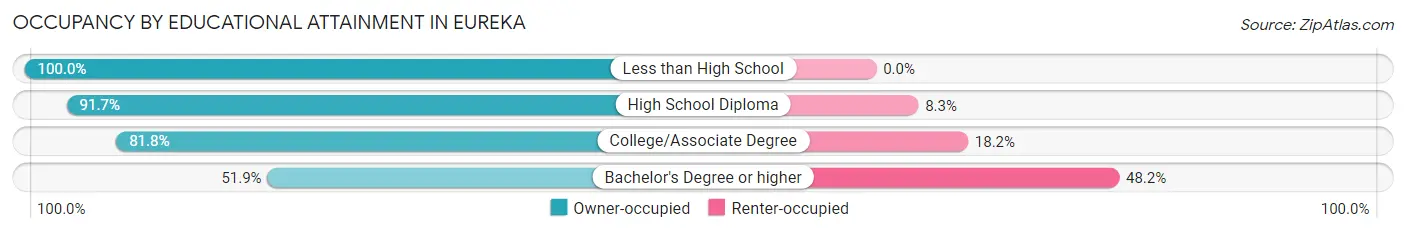
| Household Size | Owner-occupied | Renter-occupied |
| Less than High School | 5 (100.0%) | 0 (0.0%) |
| High School Diploma | 22 (91.7%) | 2 (8.3%) |
| College/Associate Degree | 45 (81.8%) | 10 (18.2%) |
| Bachelor's Degree or higher | 14 (51.8%) | 13 (48.1%) |
Occupancy by Age of Householder in Eureka
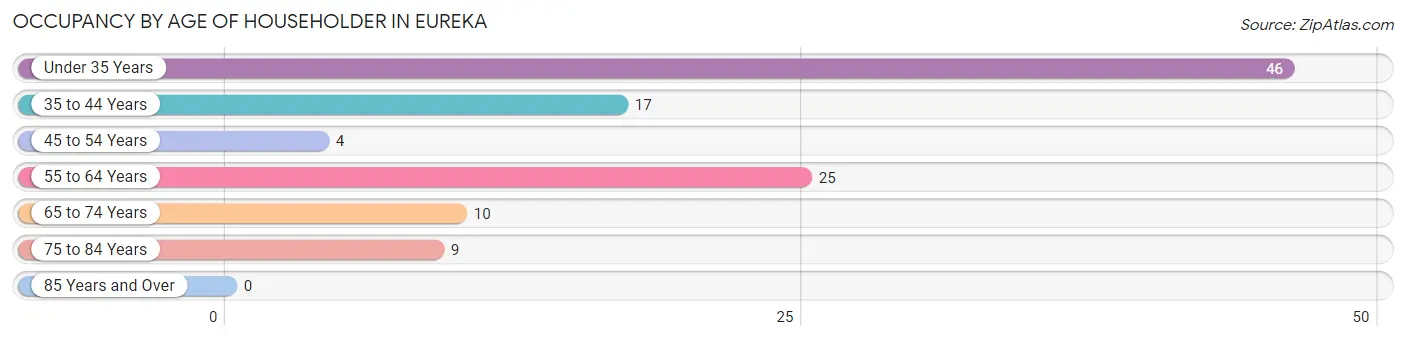
| Age Bracket | # Households | % Households |
| Under 35 Years | 46 | 41.4% |
| 35 to 44 Years | 17 | 15.3% |
| 45 to 54 Years | 4 | 3.6% |
| 55 to 64 Years | 25 | 22.5% |
| 65 to 74 Years | 10 | 9.0% |
| 75 to 84 Years | 9 | 8.1% |
| 85 Years and Over | 0 | 0.0% |
| Total | 111 | 100.0% |
Housing Finances in Eureka
Median Income by Occupancy in Eureka
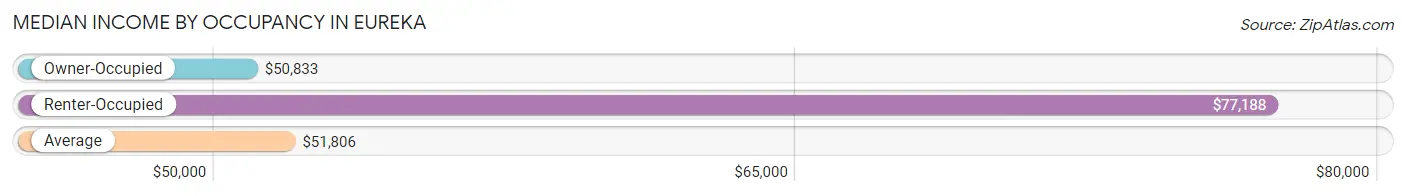
| Occupancy Type | # Households | Median Income |
| Owner-Occupied | 86 (77.5%) | $50,833 |
| Renter-Occupied | 25 (22.5%) | $77,188 |
| Average | 111 (100.0%) | $51,806 |
Occupancy by Householder Income Bracket in Eureka
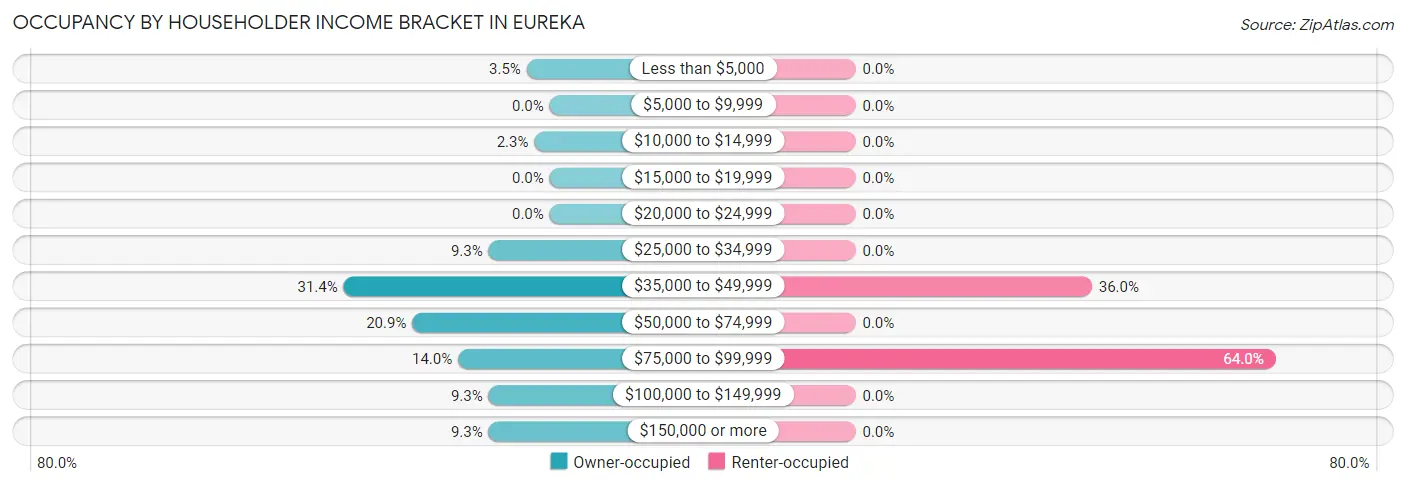
| Income Bracket | Owner-occupied | Renter-occupied |
| Less than $5,000 | 3 (3.5%) | 0 (0.0%) |
| $5,000 to $9,999 | 0 (0.0%) | 0 (0.0%) |
| $10,000 to $14,999 | 2 (2.3%) | 0 (0.0%) |
| $15,000 to $19,999 | 0 (0.0%) | 0 (0.0%) |
| $20,000 to $24,999 | 0 (0.0%) | 0 (0.0%) |
| $25,000 to $34,999 | 8 (9.3%) | 0 (0.0%) |
| $35,000 to $49,999 | 27 (31.4%) | 9 (36.0%) |
| $50,000 to $74,999 | 18 (20.9%) | 0 (0.0%) |
| $75,000 to $99,999 | 12 (14.0%) | 16 (64.0%) |
| $100,000 to $149,999 | 8 (9.3%) | 0 (0.0%) |
| $150,000 or more | 8 (9.3%) | 0 (0.0%) |
| Total | 86 (100.0%) | 25 (100.0%) |
Monthly Housing Cost Tiers in Eureka
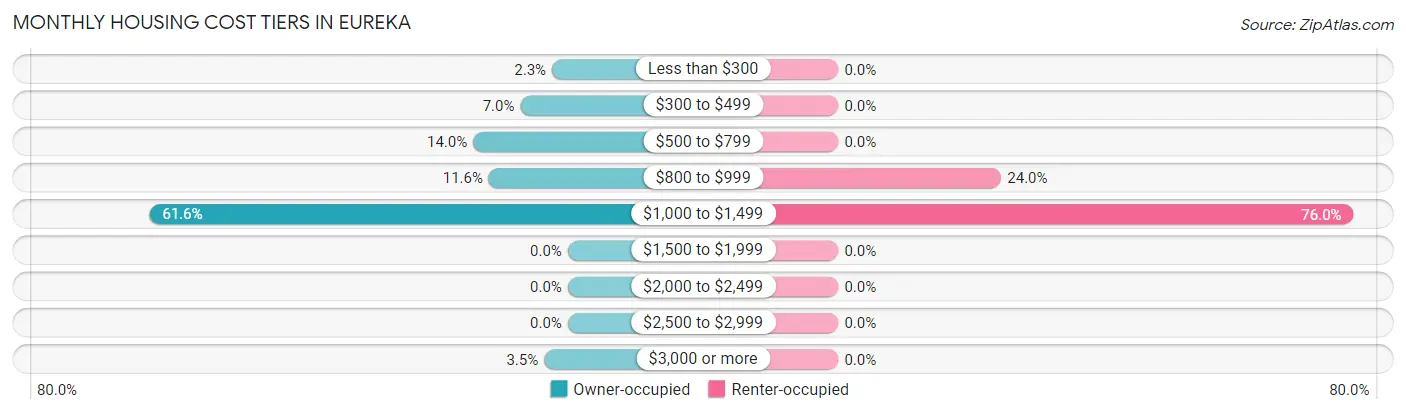
| Monthly Cost | Owner-occupied | Renter-occupied |
| Less than $300 | 2 (2.3%) | 0 (0.0%) |
| $300 to $499 | 6 (7.0%) | 0 (0.0%) |
| $500 to $799 | 12 (14.0%) | 0 (0.0%) |
| $800 to $999 | 10 (11.6%) | 6 (24.0%) |
| $1,000 to $1,499 | 53 (61.6%) | 19 (76.0%) |
| $1,500 to $1,999 | 0 (0.0%) | 0 (0.0%) |
| $2,000 to $2,499 | 0 (0.0%) | 0 (0.0%) |
| $2,500 to $2,999 | 0 (0.0%) | 0 (0.0%) |
| $3,000 or more | 3 (3.5%) | 0 (0.0%) |
| Total | 86 (100.0%) | 25 (100.0%) |
Physical Housing Characteristics in Eureka
Housing Structures in Eureka
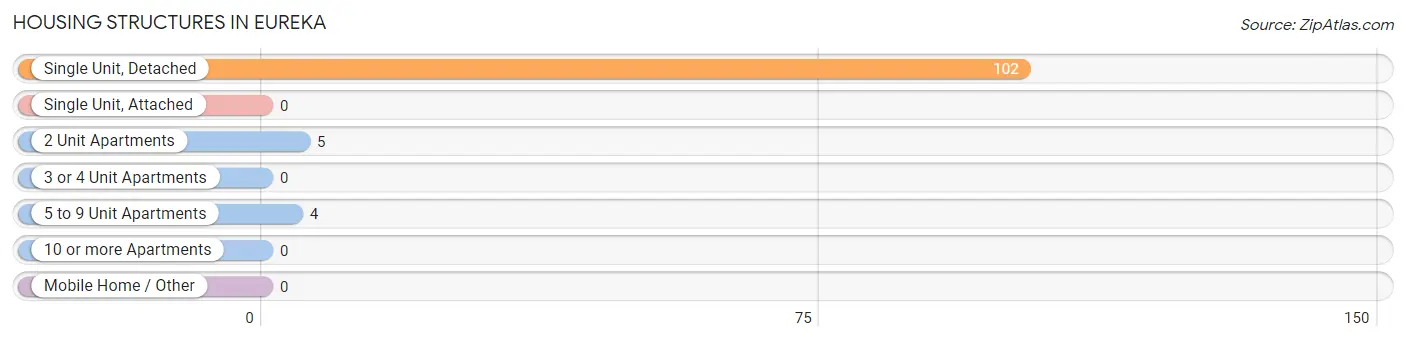
| Structure Type | # Housing Units | % Housing Units |
| Single Unit, Detached | 102 | 91.9% |
| Single Unit, Attached | 0 | 0.0% |
| 2 Unit Apartments | 5 | 4.5% |
| 3 or 4 Unit Apartments | 0 | 0.0% |
| 5 to 9 Unit Apartments | 4 | 3.6% |
| 10 or more Apartments | 0 | 0.0% |
| Mobile Home / Other | 0 | 0.0% |
| Total | 111 | 100.0% |
Housing Structures by Occupancy in Eureka
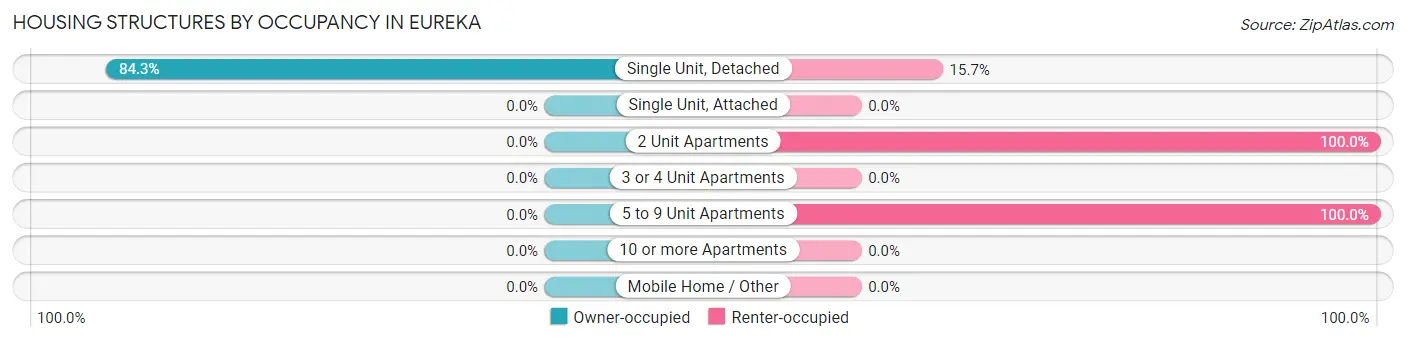
| Structure Type | Owner-occupied | Renter-occupied |
| Single Unit, Detached | 86 (84.3%) | 16 (15.7%) |
| Single Unit, Attached | 0 (0.0%) | 0 (0.0%) |
| 2 Unit Apartments | 0 (0.0%) | 5 (100.0%) |
| 3 or 4 Unit Apartments | 0 (0.0%) | 0 (0.0%) |
| 5 to 9 Unit Apartments | 0 (0.0%) | 4 (100.0%) |
| 10 or more Apartments | 0 (0.0%) | 0 (0.0%) |
| Mobile Home / Other | 0 (0.0%) | 0 (0.0%) |
| Total | 86 (77.5%) | 25 (22.5%) |
Housing Structures by Number of Rooms in Eureka
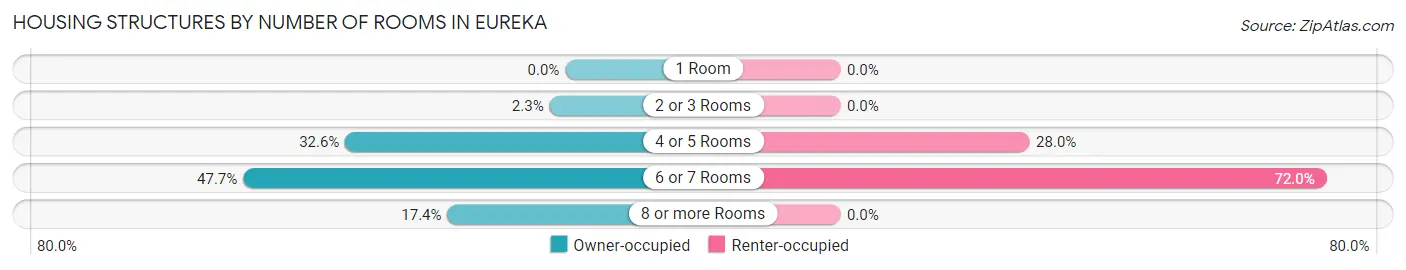
| Number of Rooms | Owner-occupied | Renter-occupied |
| 1 Room | 0 (0.0%) | 0 (0.0%) |
| 2 or 3 Rooms | 2 (2.3%) | 0 (0.0%) |
| 4 or 5 Rooms | 28 (32.6%) | 7 (28.0%) |
| 6 or 7 Rooms | 41 (47.7%) | 18 (72.0%) |
| 8 or more Rooms | 15 (17.4%) | 0 (0.0%) |
| Total | 86 (100.0%) | 25 (100.0%) |
Housing Structure by Heating Type in Eureka
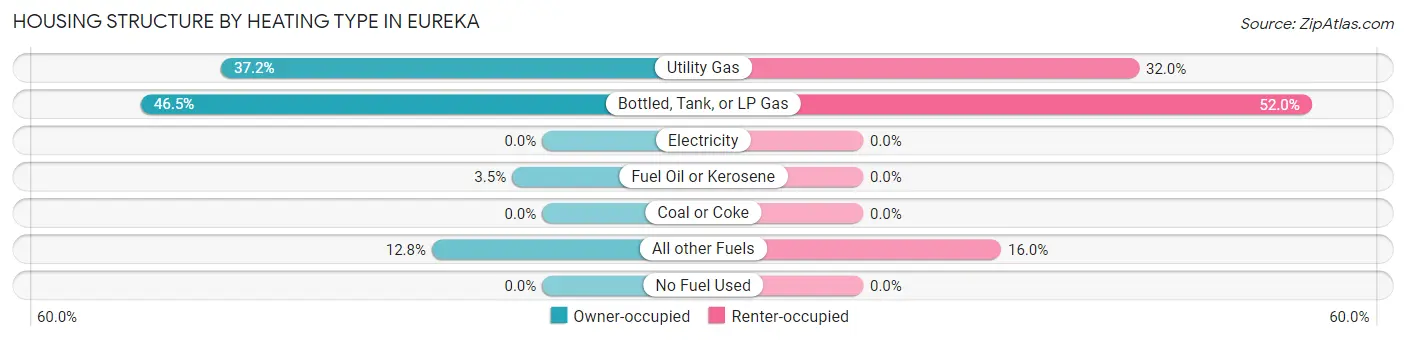
| Heating Type | Owner-occupied | Renter-occupied |
| Utility Gas | 32 (37.2%) | 8 (32.0%) |
| Bottled, Tank, or LP Gas | 40 (46.5%) | 13 (52.0%) |
| Electricity | 0 (0.0%) | 0 (0.0%) |
| Fuel Oil or Kerosene | 3 (3.5%) | 0 (0.0%) |
| Coal or Coke | 0 (0.0%) | 0 (0.0%) |
| All other Fuels | 11 (12.8%) | 4 (16.0%) |
| No Fuel Used | 0 (0.0%) | 0 (0.0%) |
| Total | 86 (100.0%) | 25 (100.0%) |
Household Vehicle Usage in Eureka
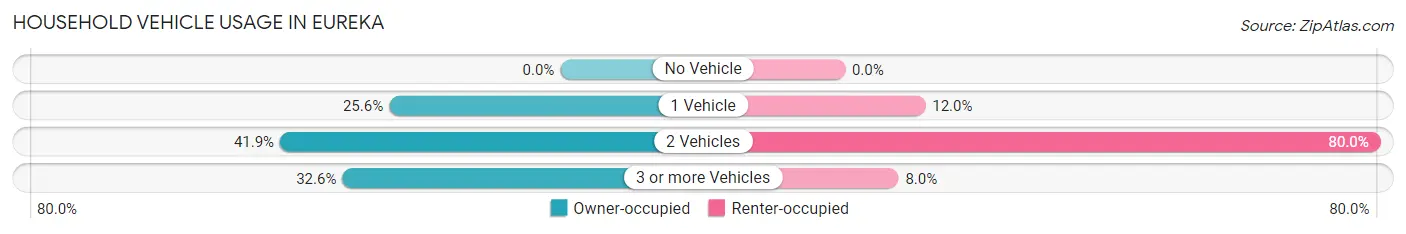
| Vehicles per Household | Owner-occupied | Renter-occupied |
| No Vehicle | 0 (0.0%) | 0 (0.0%) |
| 1 Vehicle | 22 (25.6%) | 3 (12.0%) |
| 2 Vehicles | 36 (41.9%) | 20 (80.0%) |
| 3 or more Vehicles | 28 (32.6%) | 2 (8.0%) |
| Total | 86 (100.0%) | 25 (100.0%) |
Real Estate & Mortgages in Eureka
Real Estate and Mortgage Overview in Eureka
| Characteristic | Without Mortgage | With Mortgage |
| Housing Units | 12 | 74 |
| Median Property Value | $125,000 | $153,300 |
| Median Household Income | $68,333 | $6 |
| Monthly Housing Costs | $400 | $3 |
| Real Estate Taxes | $1,929 | $0 |
Property Value by Mortgage Status in Eureka
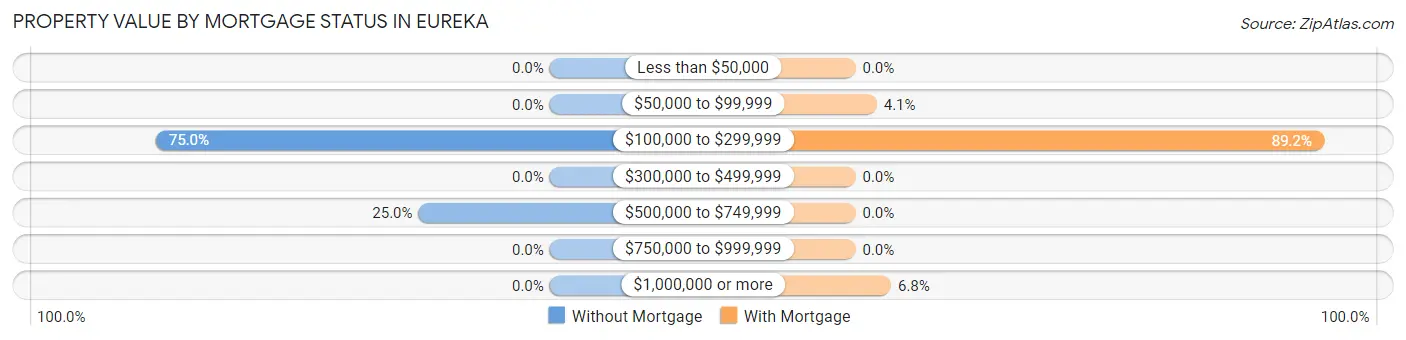
| Property Value | Without Mortgage | With Mortgage |
| Less than $50,000 | 0 (0.0%) | 0 (0.0%) |
| $50,000 to $99,999 | 0 (0.0%) | 3 (4.1%) |
| $100,000 to $299,999 | 9 (75.0%) | 66 (89.2%) |
| $300,000 to $499,999 | 0 (0.0%) | 0 (0.0%) |
| $500,000 to $749,999 | 3 (25.0%) | 0 (0.0%) |
| $750,000 to $999,999 | 0 (0.0%) | 0 (0.0%) |
| $1,000,000 or more | 0 (0.0%) | 5 (6.8%) |
| Total | 12 (100.0%) | 74 (100.0%) |
Household Income by Mortgage Status in Eureka
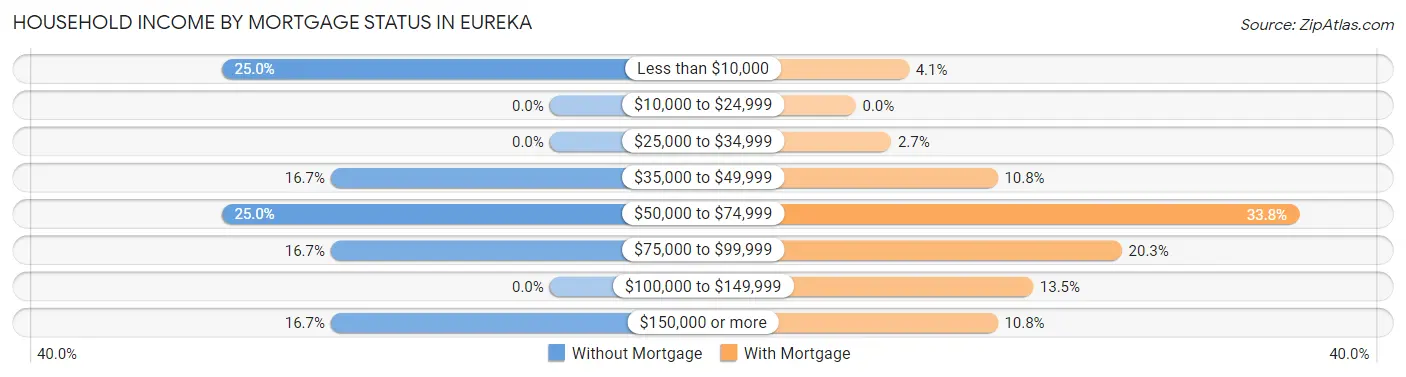
| Household Income | Without Mortgage | With Mortgage |
| Less than $10,000 | 3 (25.0%) | 3 (4.1%) |
| $10,000 to $24,999 | 0 (0.0%) | 0 (0.0%) |
| $25,000 to $34,999 | 0 (0.0%) | 2 (2.7%) |
| $35,000 to $49,999 | 2 (16.7%) | 8 (10.8%) |
| $50,000 to $74,999 | 3 (25.0%) | 25 (33.8%) |
| $75,000 to $99,999 | 2 (16.7%) | 15 (20.3%) |
| $100,000 to $149,999 | 0 (0.0%) | 10 (13.5%) |
| $150,000 or more | 2 (16.7%) | 8 (10.8%) |
| Total | 12 (100.0%) | 74 (100.0%) |
Property Value to Household Income Ratio in Eureka
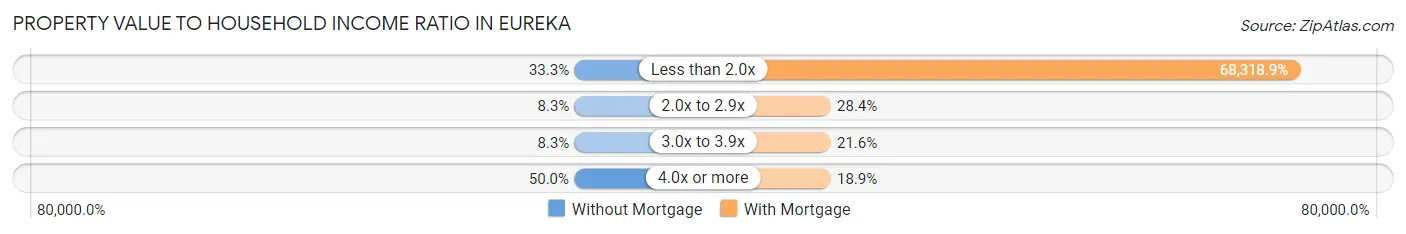
| Value-to-Income Ratio | Without Mortgage | With Mortgage |
| Less than 2.0x | 4 (33.3%) | 50,556 (68,318.9%) |
| 2.0x to 2.9x | 1 (8.3%) | 21 (28.4%) |
| 3.0x to 3.9x | 1 (8.3%) | 16 (21.6%) |
| 4.0x or more | 6 (50.0%) | 14 (18.9%) |
| Total | 12 (100.0%) | 74 (100.0%) |
Real Estate Taxes by Mortgage Status in Eureka
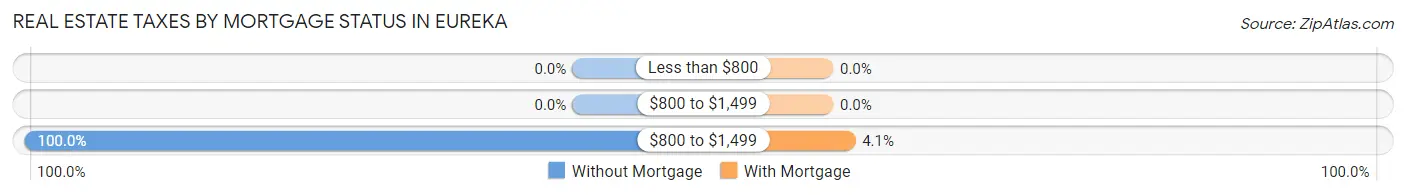
| Property Taxes | Without Mortgage | With Mortgage |
| Less than $800 | 0 (0.0%) | 0 (0.0%) |
| $800 to $1,499 | 0 (0.0%) | 0 (0.0%) |
| $800 to $1,499 | 12 (100.0%) | 3 (4.1%) |
| Total | 12 (100.0%) | 74 (100.0%) |
Health & Disability in Eureka
Health Insurance Coverage by Age in Eureka
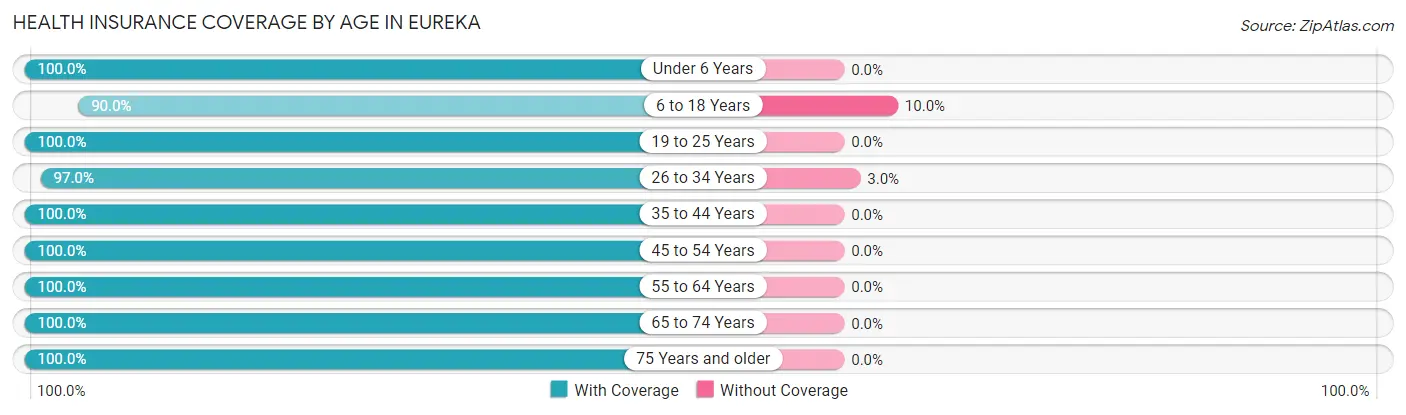
| Age Bracket | With Coverage | Without Coverage |
| Under 6 Years | 32 (100.0%) | 0 (0.0%) |
| 6 to 18 Years | 45 (90.0%) | 5 (10.0%) |
| 19 to 25 Years | 14 (100.0%) | 0 (0.0%) |
| 26 to 34 Years | 65 (97.0%) | 2 (3.0%) |
| 35 to 44 Years | 31 (100.0%) | 0 (0.0%) |
| 45 to 54 Years | 7 (100.0%) | 0 (0.0%) |
| 55 to 64 Years | 49 (100.0%) | 0 (0.0%) |
| 65 to 74 Years | 15 (100.0%) | 0 (0.0%) |
| 75 Years and older | 15 (100.0%) | 0 (0.0%) |
| Total | 273 (97.5%) | 7 (2.5%) |
Health Insurance Coverage by Citizenship Status in Eureka
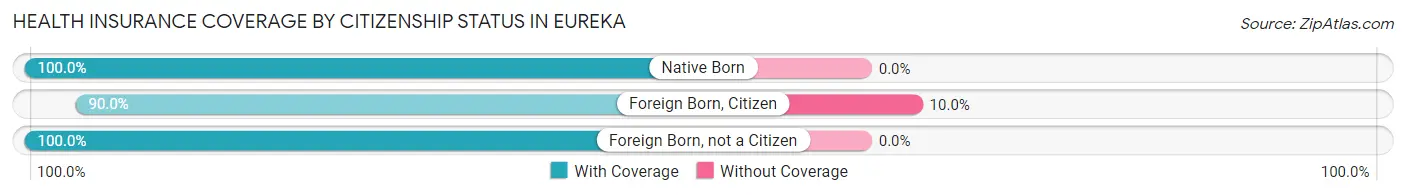
| Citizenship Status | With Coverage | Without Coverage |
| Native Born | 32 (100.0%) | 0 (0.0%) |
| Foreign Born, Citizen | 45 (90.0%) | 5 (10.0%) |
| Foreign Born, not a Citizen | 14 (100.0%) | 0 (0.0%) |
Health Insurance Coverage by Household Income in Eureka
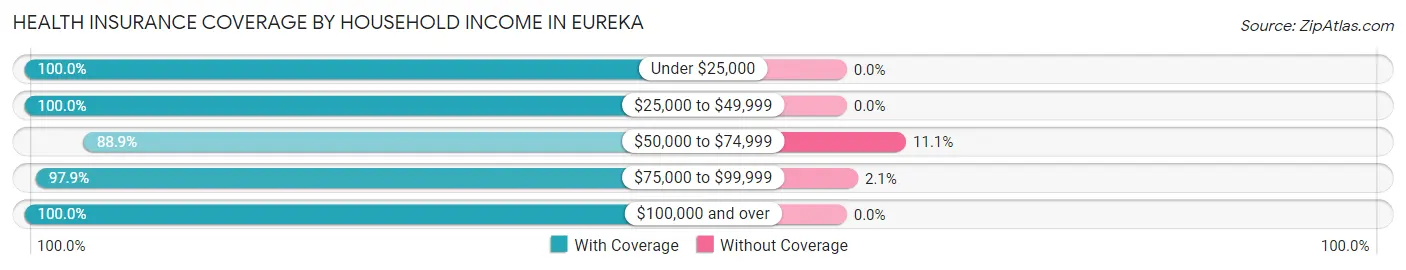
| Household Income | With Coverage | Without Coverage |
| Under $25,000 | 8 (100.0%) | 0 (0.0%) |
| $25,000 to $49,999 | 97 (100.0%) | 0 (0.0%) |
| $50,000 to $74,999 | 40 (88.9%) | 5 (11.1%) |
| $75,000 to $99,999 | 93 (97.9%) | 2 (2.1%) |
| $100,000 and over | 35 (100.0%) | 0 (0.0%) |
Public vs Private Health Insurance Coverage by Age in Eureka
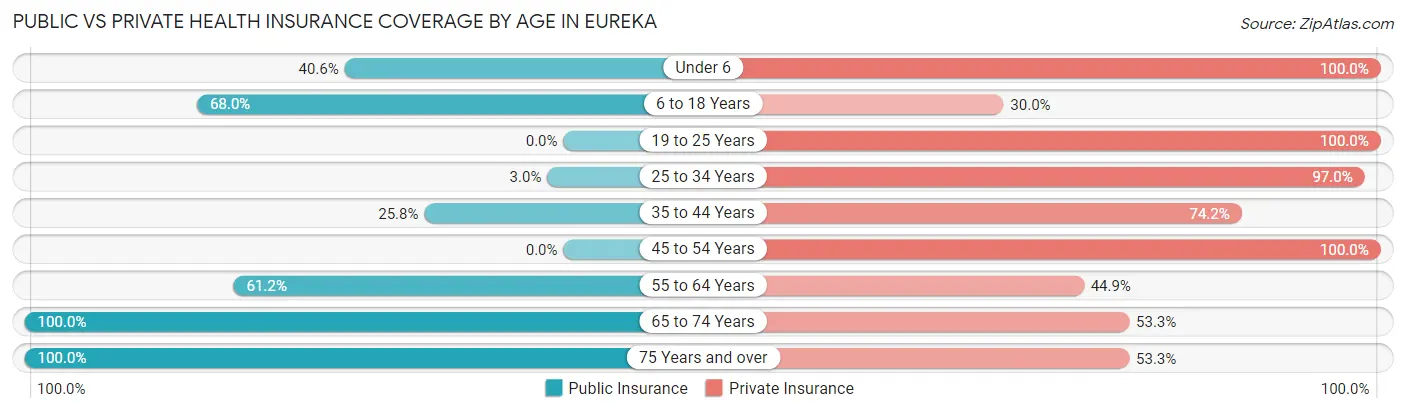
| Age Bracket | Public Insurance | Private Insurance |
| Under 6 | 13 (40.6%) | 32 (100.0%) |
| 6 to 18 Years | 34 (68.0%) | 15 (30.0%) |
| 19 to 25 Years | 0 (0.0%) | 14 (100.0%) |
| 25 to 34 Years | 2 (3.0%) | 65 (97.0%) |
| 35 to 44 Years | 8 (25.8%) | 23 (74.2%) |
| 45 to 54 Years | 0 (0.0%) | 7 (100.0%) |
| 55 to 64 Years | 30 (61.2%) | 22 (44.9%) |
| 65 to 74 Years | 15 (100.0%) | 8 (53.3%) |
| 75 Years and over | 15 (100.0%) | 8 (53.3%) |
| Total | 117 (41.8%) | 194 (69.3%) |
Disability Status by Sex by Age in Eureka
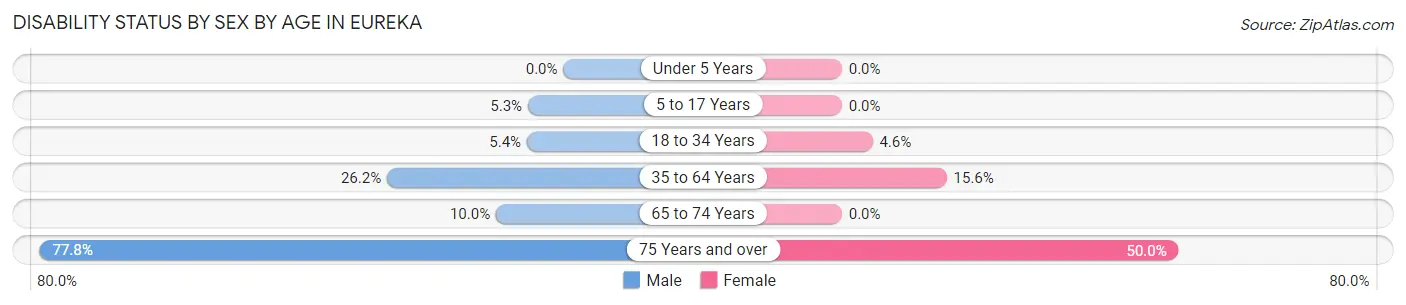
| Age Bracket | Male | Female |
| Under 5 Years | 0 (0.0%) | 0 (0.0%) |
| 5 to 17 Years | 2 (5.3%) | 0 (0.0%) |
| 18 to 34 Years | 2 (5.4%) | 2 (4.5%) |
| 35 to 64 Years | 11 (26.2%) | 7 (15.6%) |
| 65 to 74 Years | 1 (10.0%) | 0 (0.0%) |
| 75 Years and over | 7 (77.8%) | 3 (50.0%) |
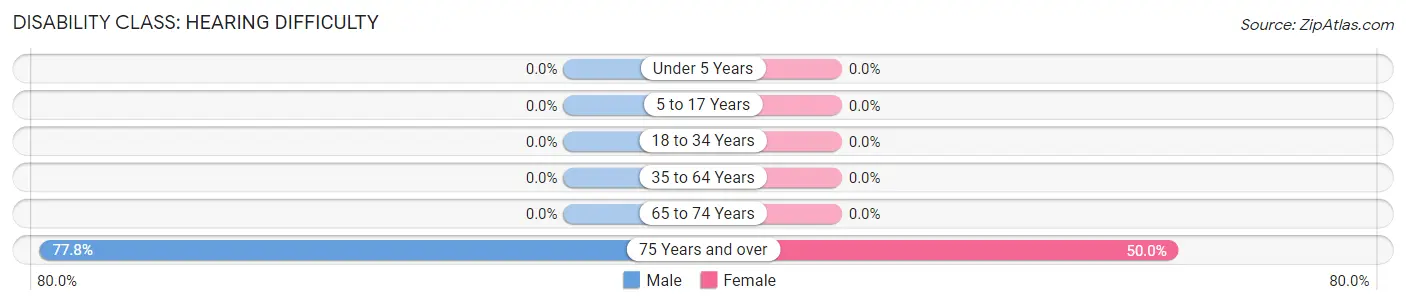
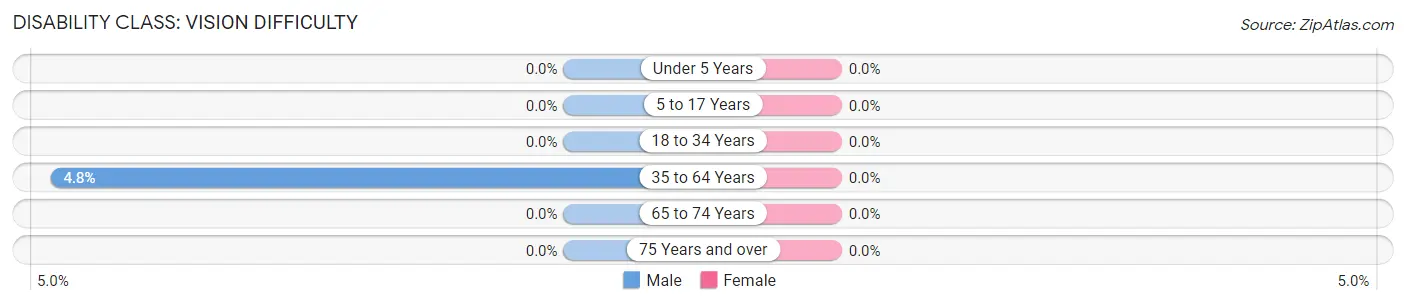
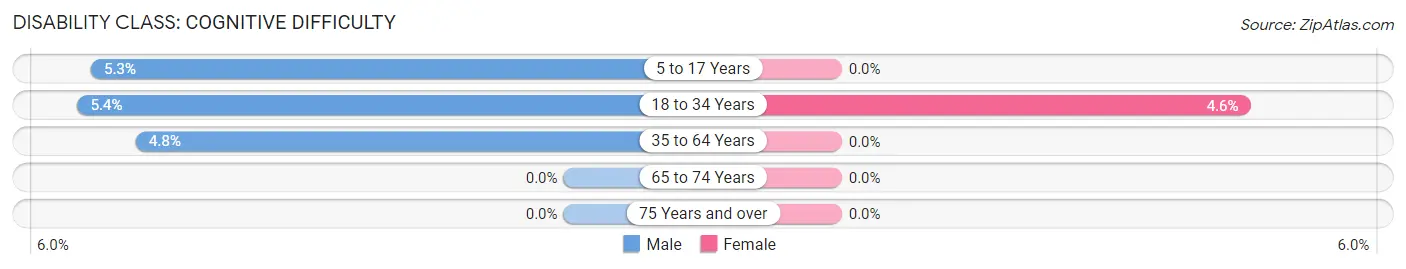
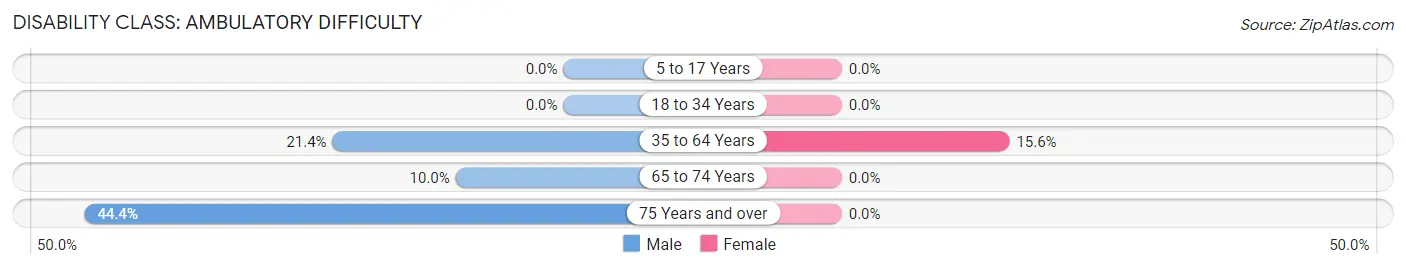
Disability Class by Sex by Age in Eureka
Disability Class: Hearing Difficulty
| Age Bracket | Male | Female |
| Under 5 Years | 0 (0.0%) | 0 (0.0%) |
| 5 to 17 Years | 0 (0.0%) | 0 (0.0%) |
| 18 to 34 Years | 0 (0.0%) | 0 (0.0%) |
| 35 to 64 Years | 0 (0.0%) | 0 (0.0%) |
| 65 to 74 Years | 0 (0.0%) | 0 (0.0%) |
| 75 Years and over | 7 (77.8%) | 3 (50.0%) |
Disability Class: Vision Difficulty
| Age Bracket | Male | Female |
| Under 5 Years | 0 (0.0%) | 0 (0.0%) |
| 5 to 17 Years | 0 (0.0%) | 0 (0.0%) |
| 18 to 34 Years | 0 (0.0%) | 0 (0.0%) |
| 35 to 64 Years | 2 (4.8%) | 0 (0.0%) |
| 65 to 74 Years | 0 (0.0%) | 0 (0.0%) |
| 75 Years and over | 0 (0.0%) | 0 (0.0%) |
Disability Class: Cognitive Difficulty
| Age Bracket | Male | Female |
| 5 to 17 Years | 2 (5.3%) | 0 (0.0%) |
| 18 to 34 Years | 2 (5.4%) | 2 (4.5%) |
| 35 to 64 Years | 2 (4.8%) | 0 (0.0%) |
| 65 to 74 Years | 0 (0.0%) | 0 (0.0%) |
| 75 Years and over | 0 (0.0%) | 0 (0.0%) |
Disability Class: Ambulatory Difficulty
| Age Bracket | Male | Female |
| 5 to 17 Years | 0 (0.0%) | 0 (0.0%) |
| 18 to 34 Years | 0 (0.0%) | 0 (0.0%) |
| 35 to 64 Years | 9 (21.4%) | 7 (15.6%) |
| 65 to 74 Years | 1 (10.0%) | 0 (0.0%) |
| 75 Years and over | 4 (44.4%) | 0 (0.0%) |
Disability Class: Self-Care Difficulty
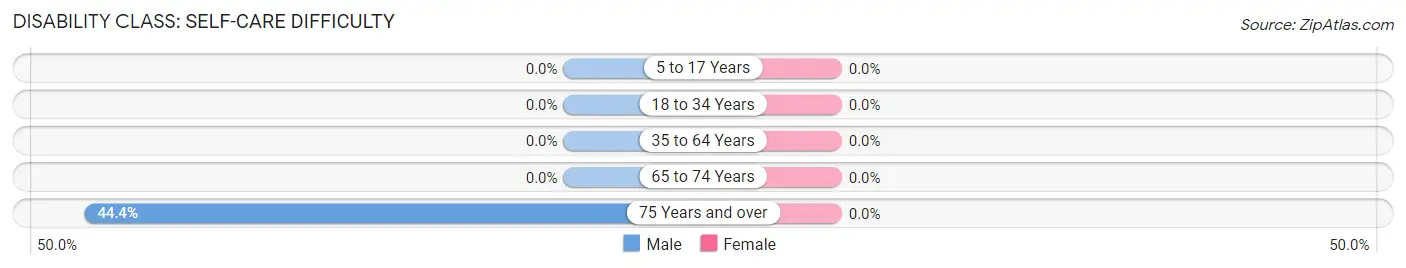
| Age Bracket | Male | Female |
| 5 to 17 Years | 0 (0.0%) | 0 (0.0%) |
| 18 to 34 Years | 0 (0.0%) | 0 (0.0%) |
| 35 to 64 Years | 0 (0.0%) | 0 (0.0%) |
| 65 to 74 Years | 0 (0.0%) | 0 (0.0%) |
| 75 Years and over | 4 (44.4%) | 0 (0.0%) |
Technology Access in Eureka
Computing Device Access in Eureka
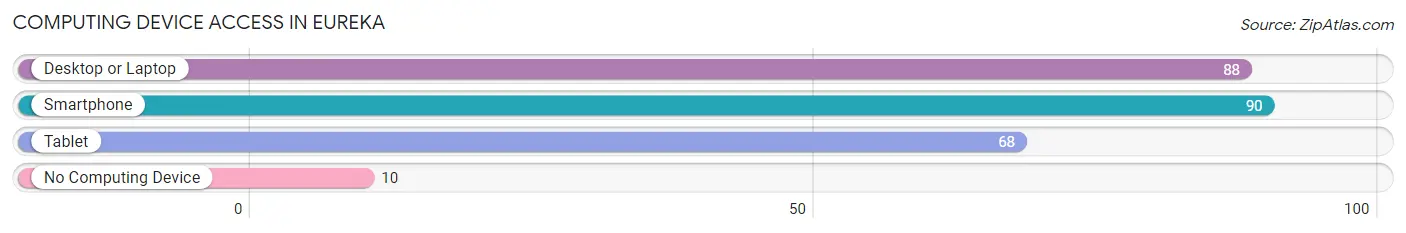
| Device Type | # Households | % Households |
| Desktop or Laptop | 88 | 79.3% |
| Smartphone | 90 | 81.1% |
| Tablet | 68 | 61.3% |
| No Computing Device | 10 | 9.0% |
| Total | 111 | 100.0% |
Internet Access in Eureka
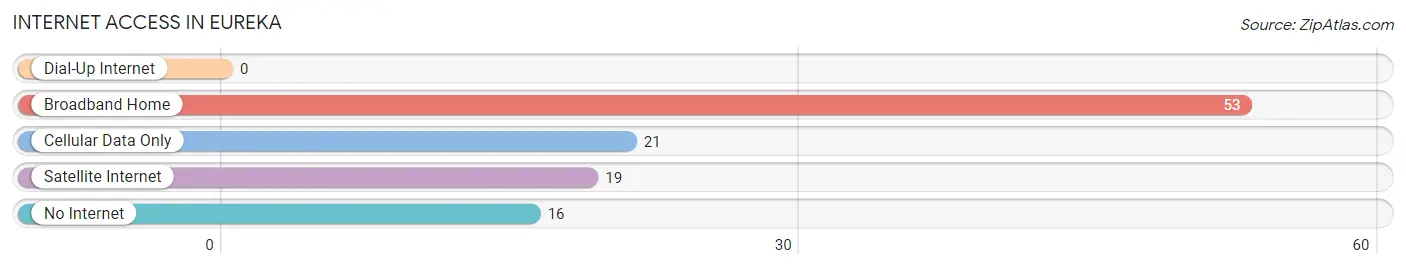
| Internet Type | # Households | % Households |
| Dial-Up Internet | 0 | 0.0% |
| Broadband Home | 53 | 47.7% |
| Cellular Data Only | 21 | 18.9% |
| Satellite Internet | 19 | 17.1% |
| No Internet | 16 | 14.4% |
| Total | 111 | 100.0% |
Eureka Summary
Eureka, Wisconsin is a small town located in the northwest corner of the state, in the county of Polk. It is situated on the banks of the Eau Claire River, and is surrounded by rolling hills and lush forests. The town has a population of just over 1,000 people, and is known for its small-town charm and friendly atmosphere.
Geography
Eureka is located in the northwest corner of Wisconsin, in Polk County. It is situated on the banks of the Eau Claire River, and is surrounded by rolling hills and lush forests. The town is located about 25 miles from the city of Eau Claire, and is about an hour and a half drive from the Twin Cities of Minneapolis and St. Paul. The town is also close to the Wisconsin-Minnesota border, and is about a two-hour drive from the city of Duluth, Minnesota.
The town of Eureka is located in a rural area, and is surrounded by farmland and small towns. The nearest major city is Eau Claire, which is about 25 miles away. The town is also close to the Chippewa River, which is a popular destination for fishing and boating.
History
The town of Eureka was founded in 1854 by a group of settlers from New York. The settlers were looking for a place to settle and start a new life, and they chose the area around the Eau Claire River. The town was named after the Greek word for “discovery”, and the settlers were hoping to find a new life in the area.
The town quickly grew, and by the late 1800s it had become a thriving community. The town was home to a variety of businesses, including a sawmill, a gristmill, a blacksmith shop, and a general store. The town also had a school, a post office, and a church.
In the early 1900s, the town began to decline as the population moved away to larger cities. The town was hit hard by the Great Depression, and many of the businesses closed. The town was able to survive, however, and by the 1950s it had begun to recover.
Economy
The economy of Eureka is largely based on agriculture and tourism. The town is home to several farms, which produce a variety of crops, including corn, soybeans, and hay. The town is also home to several small businesses, including a grocery store, a hardware store, and a restaurant.
The town is also a popular destination for tourists, who come to enjoy the small-town charm and the natural beauty of the area. The town is home to several parks, including the Eau Claire River Park, which is a popular spot for fishing and boating. The town also hosts several festivals throughout the year, including the Eureka Days Festival in August.
Demographics
As of the 2010 census, the population of Eureka was 1,072. The town is predominantly white, with 95.3% of the population being white. The town also has a small Hispanic population, with 2.2% of the population being Hispanic or Latino. The median household income in the town is $45,000, and the median home value is $125,000.
Conclusion
Eureka, Wisconsin is a small town located in the northwest corner of the state, in the county of Polk. It is situated on the banks of the Eau Claire River, and is surrounded by rolling hills and lush forests. The town has a population of just over 1,000 people, and is known for its small-town charm and friendly atmosphere. The economy of the town is largely based on agriculture and tourism, and the town is home to several small businesses. The town is also a popular destination for tourists, who come to enjoy the small-town charm and the natural beauty of the area.
Common Questions
What is Per Capita Income in Eureka?
Per Capita income in Eureka is $28,377.
What is the Median Family Income in Eureka?
Median Family Income in Eureka is $63,750.
What is the Median Household income in Eureka?
Median Household Income in Eureka is $51,806.
What is Income or Wage Gap in Eureka?
Income or Wage Gap in Eureka is 22.8%.
Women in Eureka earn 77.2 cents for every dollar earned by a man.
What is Inequality or Gini Index in Eureka?
Inequality or Gini Index in Eureka is 0.35.
What is the Total Population of Eureka?
Total Population of Eureka is 280.
What is the Total Male Population of Eureka?
Total Male Population of Eureka is 145.
What is the Total Female Population of Eureka?
Total Female Population of Eureka is 135.
What is the Ratio of Males per 100 Females in Eureka?
There are 107.41 Males per 100 Females in Eureka.
What is the Ratio of Females per 100 Males in Eureka?
There are 93.10 Females per 100 Males in Eureka.
What is the Median Population Age in Eureka?
Median Population Age in Eureka is 31.9 Years.
What is the Average Family Size in Eureka
Average Family Size in Eureka is 2.9 People.
What is the Average Household Size in Eureka
Average Household Size in Eureka is 2.5 People.
How Large is the Labor Force in Eureka?
There are 151 People in the Labor Forcein in Eureka.
What is the Percentage of People in the Labor Force in Eureka?
73.3% of People are in the Labor Force in Eureka.