Pebble Creek, FL Map & Demographics
Pebble Creek Map
Pebble Creek Overview
$38,269
PER CAPITA INCOME
$122,203
AVG FAMILY INCOME
$108,307
AVG HOUSEHOLD INCOME
31.4%
WAGE / INCOME GAP [ % ]
68.6¢/ $1
WAGE / INCOME GAP [ $ ]
0.35
INEQUALITY / GINI INDEX
10,976
TOTAL POPULATION
5,499
MALE POPULATION
5,477
FEMALE POPULATION
100.40
MALES / 100 FEMALES
99.60
FEMALES / 100 MALES
38.4
MEDIAN AGE
3.5
AVG FAMILY SIZE
3.1
AVG HOUSEHOLD SIZE
5,636
LABOR FORCE [ PEOPLE ]
70.7%
PERCENT IN LABOR FORCE
2.9%
UNEMPLOYMENT RATE
Income in Pebble Creek
Income Overview in Pebble Creek
Per Capita Income in Pebble Creek is $38,269, while median incomes of families and households are $122,203 and $108,307 respectively.
| Characteristic | Number | Measure |
| Per Capita Income | 10,976 | $38,269 |
| Median Family Income | 2,740 | $122,203 |
| Mean Family Income | 2,740 | $125,182 |
| Median Household Income | 3,567 | $108,307 |
| Mean Household Income | 3,567 | $114,570 |
| Income Deficit | 2,740 | $0 |
| Wage / Income Gap (%) | 10,976 | 31.45% |
| Wage / Income Gap ($) | 10,976 | 68.55¢ per $1 |
| Gini / Inequality Index | 10,976 | 0.35 |
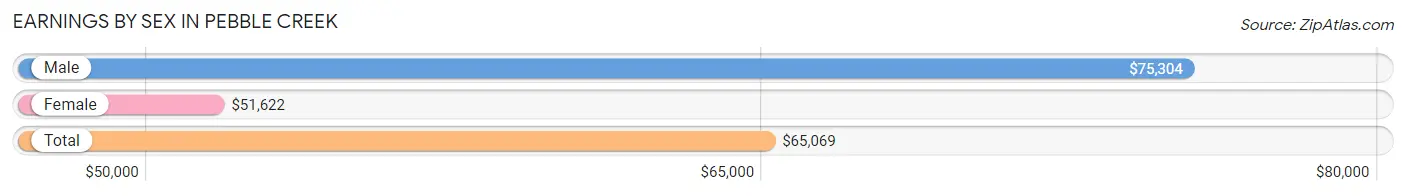
Earnings by Sex in Pebble Creek
Average Earnings in Pebble Creek are $65,069, $75,304 for men and $51,622 for women, a difference of 31.5%.
| Sex | Number | Average Earnings |
| Male | 3,201 (56.7%) | $75,304 |
| Female | 2,446 (43.3%) | $51,622 |
| Total | 5,647 (100.0%) | $65,069 |
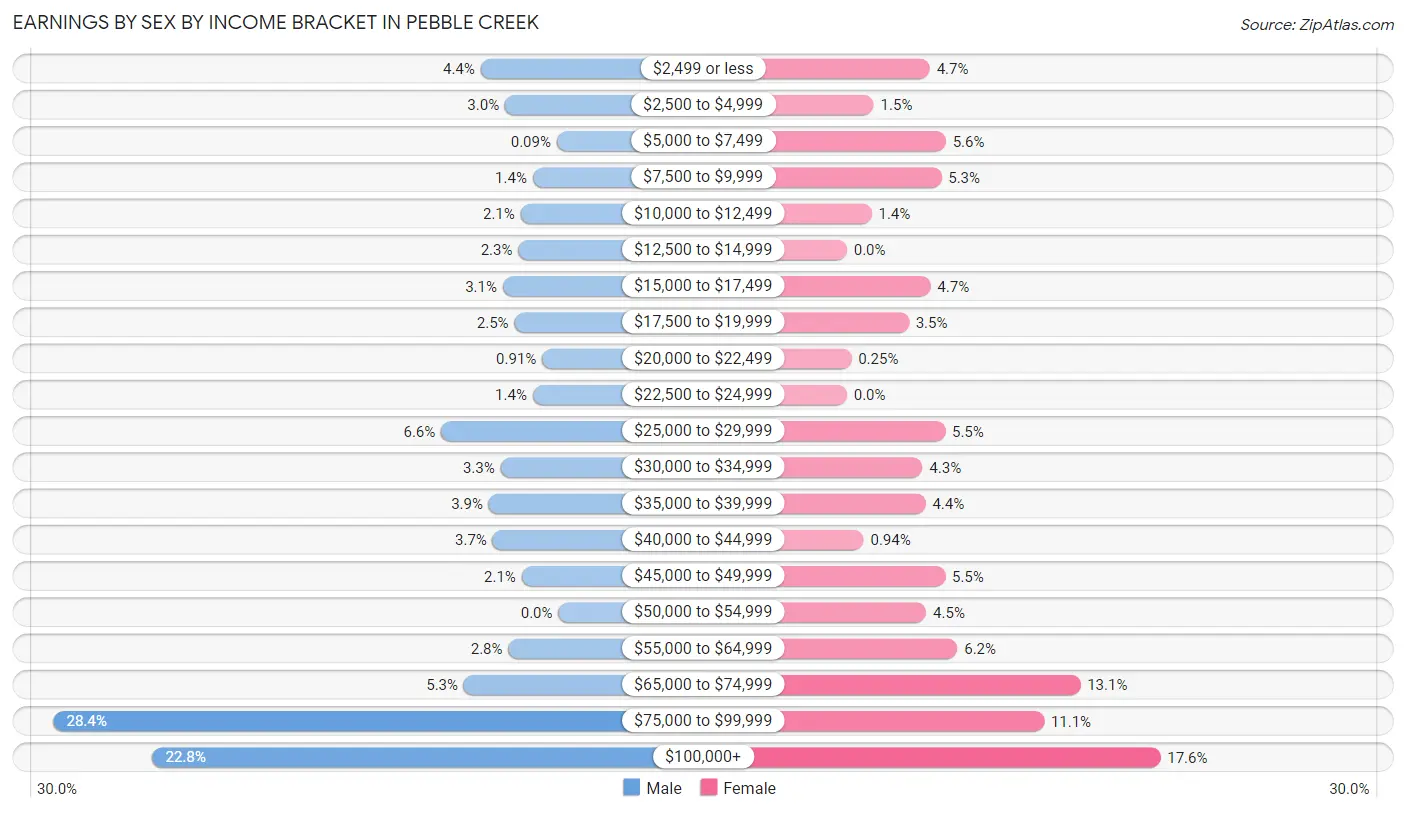
Earnings by Sex by Income Bracket in Pebble Creek
The most common earnings brackets in Pebble Creek are $75,000 to $99,999 for men (908 | 28.4%) and $100,000+ for women (431 | 17.6%).
| Income | Male | Female |
| $2,499 or less | 140 (4.4%) | 114 (4.7%) |
| $2,500 to $4,999 | 96 (3.0%) | 37 (1.5%) |
| $5,000 to $7,499 | 3 (0.1%) | 136 (5.6%) |
| $7,500 to $9,999 | 46 (1.4%) | 130 (5.3%) |
| $10,000 to $12,499 | 68 (2.1%) | 34 (1.4%) |
| $12,500 to $14,999 | 72 (2.2%) | 0 (0.0%) |
| $15,000 to $17,499 | 100 (3.1%) | 115 (4.7%) |
| $17,500 to $19,999 | 79 (2.5%) | 85 (3.5%) |
| $20,000 to $22,499 | 29 (0.9%) | 6 (0.3%) |
| $22,500 to $24,999 | 46 (1.4%) | 0 (0.0%) |
| $25,000 to $29,999 | 211 (6.6%) | 135 (5.5%) |
| $30,000 to $34,999 | 104 (3.3%) | 104 (4.3%) |
| $35,000 to $39,999 | 125 (3.9%) | 108 (4.4%) |
| $40,000 to $44,999 | 118 (3.7%) | 23 (0.9%) |
| $45,000 to $49,999 | 66 (2.1%) | 135 (5.5%) |
| $50,000 to $54,999 | 0 (0.0%) | 109 (4.5%) |
| $55,000 to $64,999 | 90 (2.8%) | 152 (6.2%) |
| $65,000 to $74,999 | 170 (5.3%) | 321 (13.1%) |
| $75,000 to $99,999 | 908 (28.4%) | 271 (11.1%) |
| $100,000+ | 730 (22.8%) | 431 (17.6%) |
| Total | 3,201 (100.0%) | 2,446 (100.0%) |
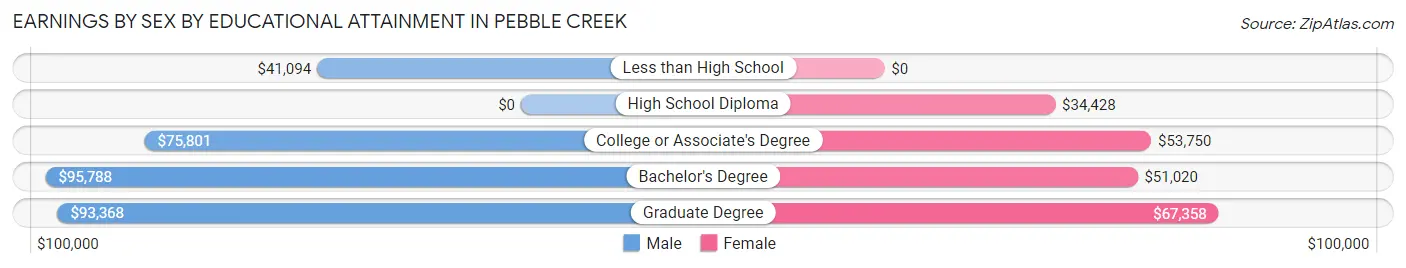
Earnings by Sex by Educational Attainment in Pebble Creek
Average earnings in Pebble Creek are $76,603 for men and $60,609 for women, a difference of 20.9%. Men with an educational attainment of bachelor's degree enjoy the highest average annual earnings of $95,788, while those with less than high school education earn the least with $41,094. Women with an educational attainment of graduate degree earn the most with the average annual earnings of $67,358, while those with high school diploma education have the smallest earnings of $34,428.
| Educational Attainment | Male Income | Female Income |
| Less than High School | $41,094 | $0 |
| High School Diploma | - | - |
| College or Associate's Degree | $75,801 | $53,750 |
| Bachelor's Degree | $95,788 | $51,020 |
| Graduate Degree | $93,368 | $67,358 |
| Total | $76,603 | $60,609 |
Family Income in Pebble Creek
Family Income Brackets in Pebble Creek
According to the Pebble Creek family income data, there are 803 families falling into the $100,000 to $149,999 income range, which is the most common income bracket and makes up 29.3% of all families. Conversely, the $10,000 to $14,999 income bracket is the least frequent group with only 58 families (2.1%) belonging to this category.
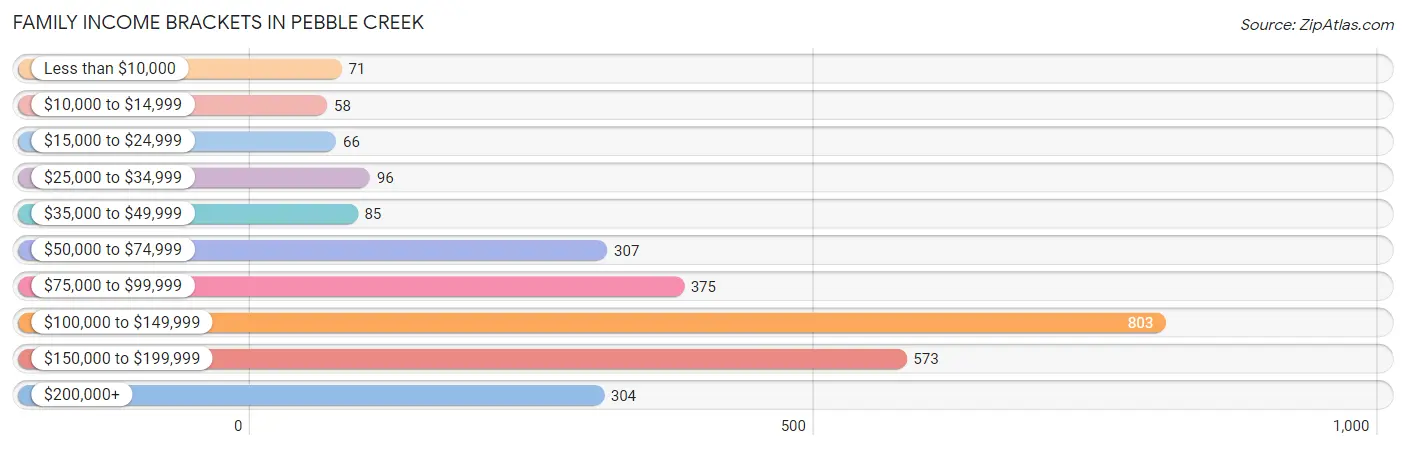
| Income Bracket | # Families | % Families |
| Less than $10,000 | 71 | 2.6% |
| $10,000 to $14,999 | 58 | 2.1% |
| $15,000 to $24,999 | 66 | 2.4% |
| $25,000 to $34,999 | 96 | 3.5% |
| $35,000 to $49,999 | 85 | 3.1% |
| $50,000 to $74,999 | 307 | 11.2% |
| $75,000 to $99,999 | 375 | 13.7% |
| $100,000 to $149,999 | 803 | 29.3% |
| $150,000 to $199,999 | 573 | 20.9% |
| $200,000+ | 304 | 11.1% |
Family Income by Famaliy Size in Pebble Creek
6-person families (81 | 3.0%) account for the highest median family income in Pebble Creek with $152,625 per family, while 3-person families (535 | 19.5%) have the highest median income of $44,737 per family member.
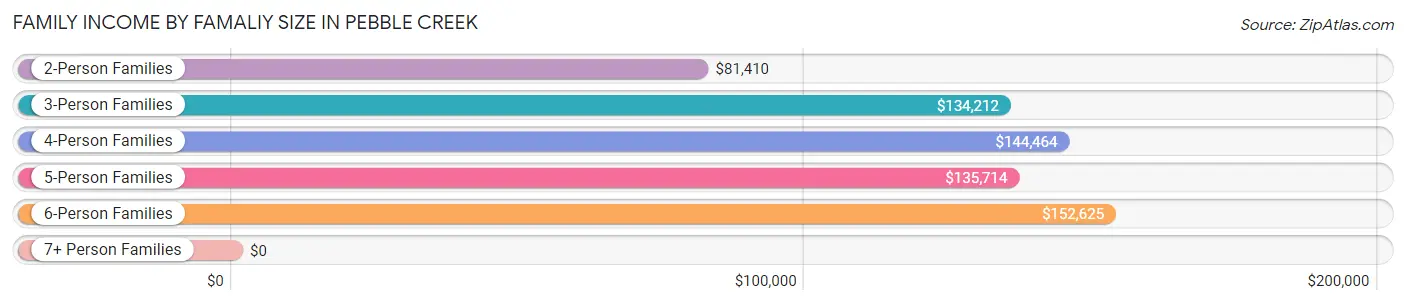
| Income Bracket | # Families | Median Income |
| 2-Person Families | 956 (34.9%) | $81,410 |
| 3-Person Families | 535 (19.5%) | $134,212 |
| 4-Person Families | 863 (31.5%) | $144,464 |
| 5-Person Families | 200 (7.3%) | $135,714 |
| 6-Person Families | 81 (3.0%) | $152,625 |
| 7+ Person Families | 105 (3.8%) | $0 |
| Total | 2,740 (100.0%) | $122,203 |
Family Income by Number of Earners in Pebble Creek
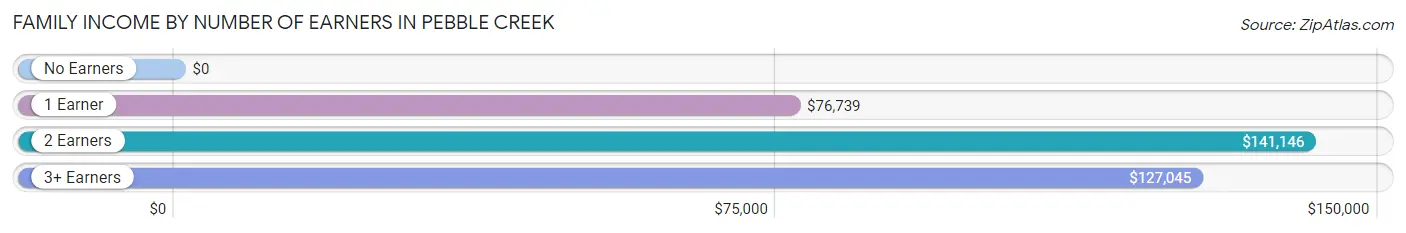
| Number of Earners | # Families | Median Income |
| No Earners | 280 (10.2%) | $0 |
| 1 Earner | 940 (34.3%) | $76,739 |
| 2 Earners | 1,240 (45.3%) | $141,146 |
| 3+ Earners | 280 (10.2%) | $127,045 |
| Total | 2,740 (100.0%) | $122,203 |
Household Income in Pebble Creek
Household Income Brackets in Pebble Creek
With 877 households falling in the category, the $100,000 to $149,999 income range is the most frequent in Pebble Creek, accounting for 24.6% of all households. In contrast, only 11 households (0.3%) fall into the $10,000 to $14,999 income bracket, making it the least populous group.
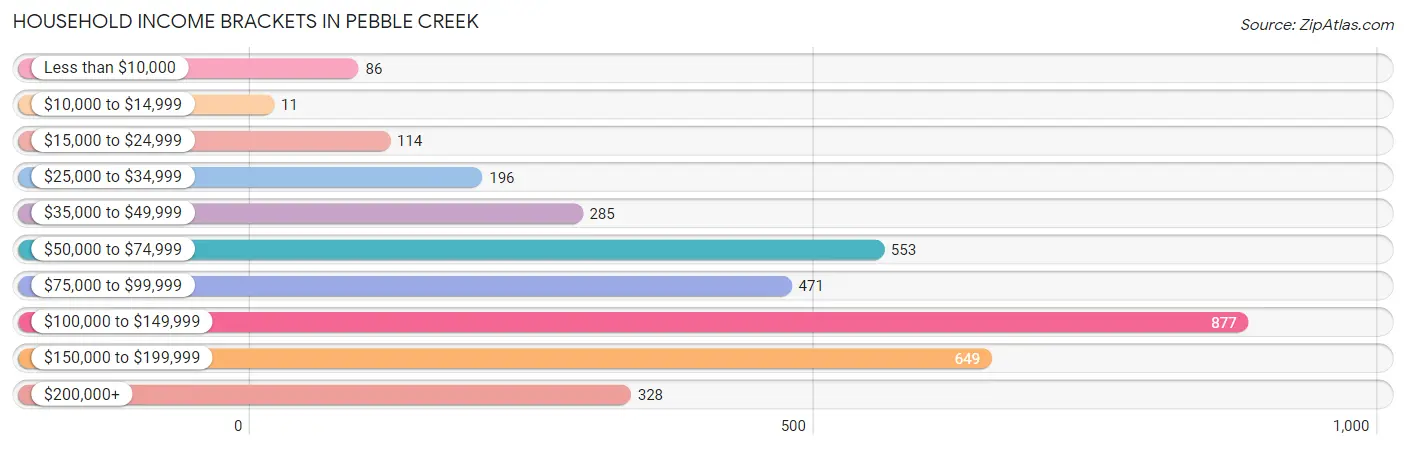
| Income Bracket | # Households | % Households |
| Less than $10,000 | 86 | 2.4% |
| $10,000 to $14,999 | 11 | 0.3% |
| $15,000 to $24,999 | 114 | 3.2% |
| $25,000 to $34,999 | 196 | 5.5% |
| $35,000 to $49,999 | 285 | 8.0% |
| $50,000 to $74,999 | 553 | 15.5% |
| $75,000 to $99,999 | 471 | 13.2% |
| $100,000 to $149,999 | 877 | 24.6% |
| $150,000 to $199,999 | 649 | 18.2% |
| $200,000+ | 328 | 9.2% |
Household Income by Householder Age in Pebble Creek
The median household income in Pebble Creek is $108,307, with the highest median household income of $128,032 found in the 25 to 44 years age bracket for the primary householder. A total of 1,340 households (37.6%) fall into this category. Meanwhile, the 15 to 24 years age bracket for the primary householder has the lowest median household income of $0, with 10 households (0.3%) in this group.
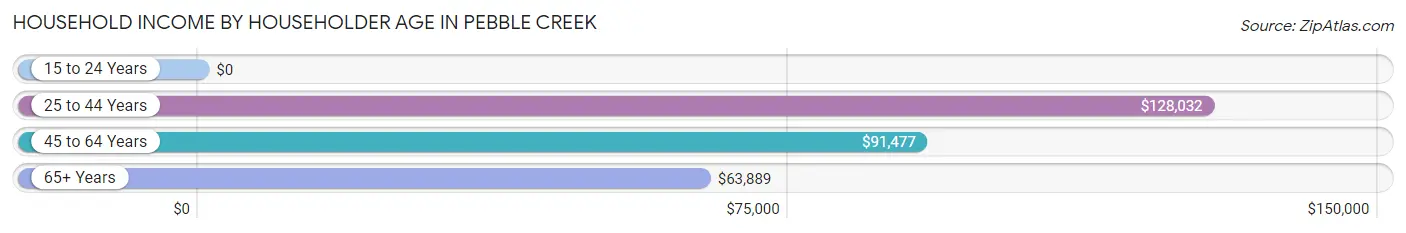
| Income Bracket | # Households | Median Income |
| 15 to 24 Years | 10 (0.3%) | $0 |
| 25 to 44 Years | 1,340 (37.6%) | $128,032 |
| 45 to 64 Years | 1,661 (46.6%) | $91,477 |
| 65+ Years | 556 (15.6%) | $63,889 |
| Total | 3,567 (100.0%) | $108,307 |
Poverty in Pebble Creek
Income Below Poverty by Sex and Age in Pebble Creek
With 7.3% poverty level for males and 8.6% for females among the residents of Pebble Creek, 18 to 24 year old males and 5 year old females are the most vulnerable to poverty, with 139 males (35.8%) and 12 females (34.3%) in their respective age groups living below the poverty level.
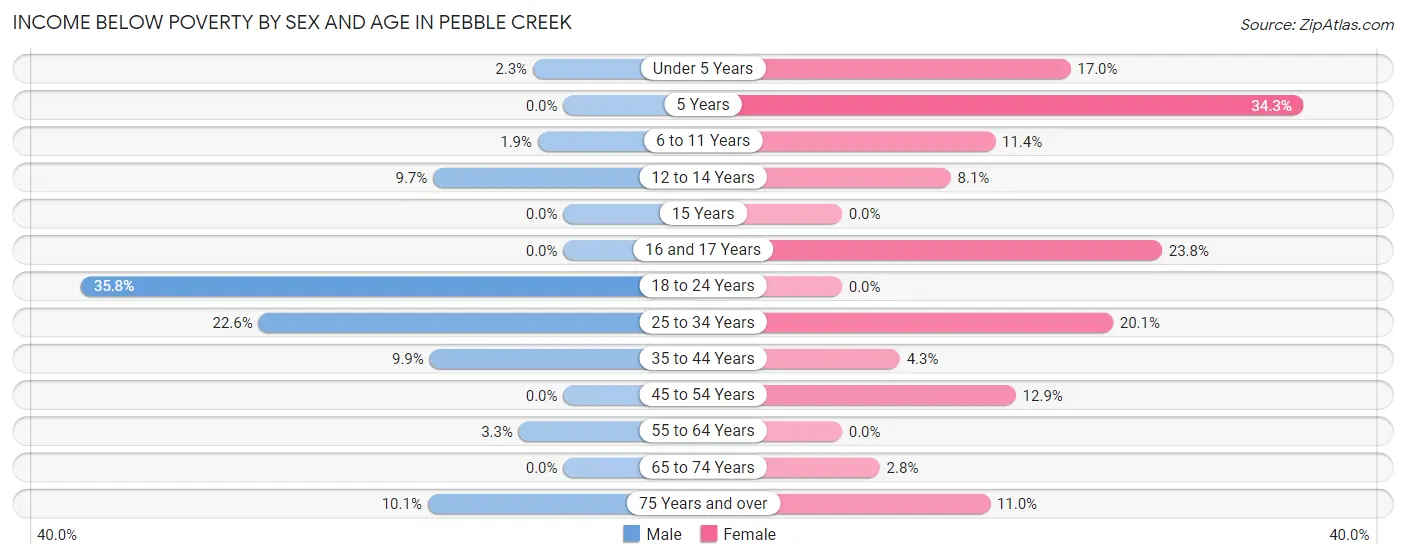
| Age Bracket | Male | Female |
| Under 5 Years | 12 (2.3%) | 74 (17.0%) |
| 5 Years | 0 (0.0%) | 12 (34.3%) |
| 6 to 11 Years | 11 (1.9%) | 70 (11.4%) |
| 12 to 14 Years | 32 (9.7%) | 21 (8.1%) |
| 15 Years | 0 (0.0%) | 0 (0.0%) |
| 16 and 17 Years | 0 (0.0%) | 24 (23.8%) |
| 18 to 24 Years | 139 (35.8%) | 0 (0.0%) |
| 25 to 34 Years | 55 (22.6%) | 98 (20.1%) |
| 35 to 44 Years | 122 (9.9%) | 49 (4.3%) |
| 45 to 54 Years | 0 (0.0%) | 90 (12.9%) |
| 55 to 64 Years | 16 (3.3%) | 0 (0.0%) |
| 65 to 74 Years | 0 (0.0%) | 10 (2.8%) |
| 75 Years and over | 14 (10.1%) | 23 (11.0%) |
| Total | 401 (7.3%) | 471 (8.6%) |
Income Above Poverty by Sex and Age in Pebble Creek
According to the poverty statistics in Pebble Creek, males aged 5 years and females aged 15 years are the age groups that are most secure financially, with 100.0% of males and 100.0% of females in these age groups living above the poverty line.
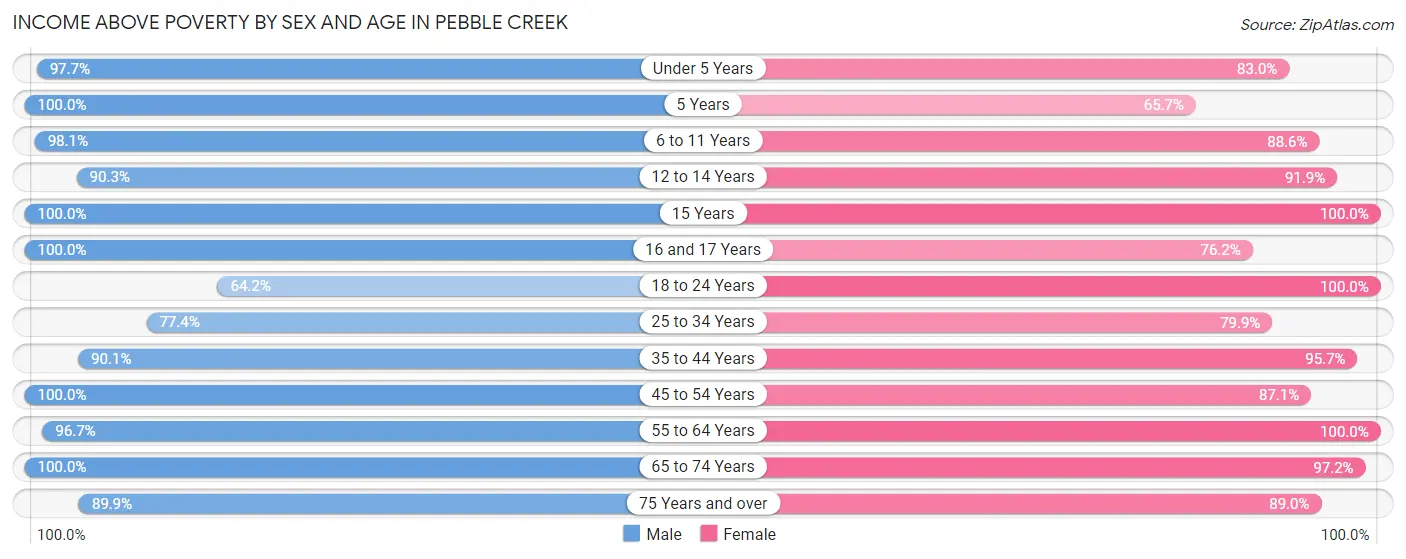
| Age Bracket | Male | Female |
| Under 5 Years | 520 (97.7%) | 362 (83.0%) |
| 5 Years | 75 (100.0%) | 23 (65.7%) |
| 6 to 11 Years | 571 (98.1%) | 545 (88.6%) |
| 12 to 14 Years | 299 (90.3%) | 239 (91.9%) |
| 15 Years | 33 (100.0%) | 91 (100.0%) |
| 16 and 17 Years | 68 (100.0%) | 77 (76.2%) |
| 18 to 24 Years | 249 (64.2%) | 299 (100.0%) |
| 25 to 34 Years | 188 (77.4%) | 389 (79.9%) |
| 35 to 44 Years | 1,107 (90.1%) | 1,090 (95.7%) |
| 45 to 54 Years | 825 (100.0%) | 607 (87.1%) |
| 55 to 64 Years | 467 (96.7%) | 738 (100.0%) |
| 65 to 74 Years | 571 (100.0%) | 346 (97.2%) |
| 75 Years and over | 125 (89.9%) | 186 (89.0%) |
| Total | 5,098 (92.7%) | 4,992 (91.4%) |
Income Below Poverty Among Married-Couple Families in Pebble Creek
The poverty statistics for married-couple families in Pebble Creek show that 3.6% or 82 of the total 2,291 families live below the poverty line. Families with no children have the highest poverty rate of 5.6%, comprising of 54 families. On the other hand, families with 1 or 2 children have the lowest poverty rate of 1.6%, which includes 18 families.
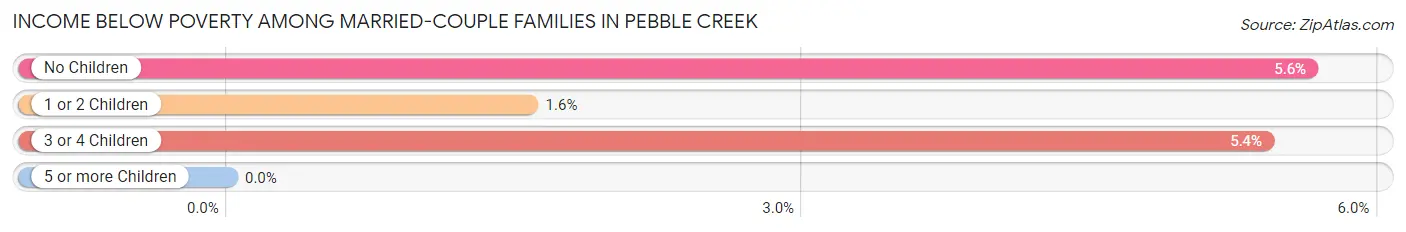
| Children | Above Poverty | Below Poverty |
| No Children | 904 (94.4%) | 54 (5.6%) |
| 1 or 2 Children | 1,130 (98.4%) | 18 (1.6%) |
| 3 or 4 Children | 175 (94.6%) | 10 (5.4%) |
| 5 or more Children | 0 (0.0%) | 0 (0.0%) |
| Total | 2,209 (96.4%) | 82 (3.6%) |
Income Below Poverty Among Single-Parent Households in Pebble Creek
According to the poverty data in Pebble Creek, 32.9% or 48 single-father households and 27.7% or 84 single-mother households are living below the poverty line. Among single-father households, those with 1 or 2 children have the highest poverty rate, with 48 households (64.9%) experiencing poverty. Likewise, among single-mother households, those with 1 or 2 children have the highest poverty rate, with 73 households (36.9%) falling below the poverty line.
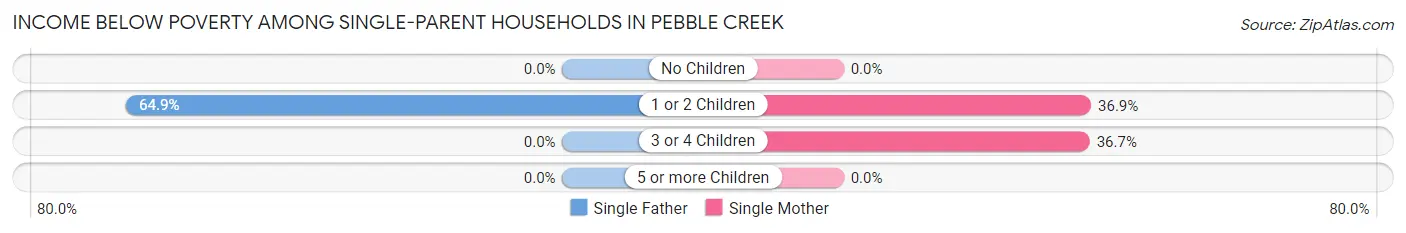
| Children | Single Father | Single Mother |
| No Children | 0 (0.0%) | 0 (0.0%) |
| 1 or 2 Children | 48 (64.9%) | 73 (36.9%) |
| 3 or 4 Children | 0 (0.0%) | 11 (36.7%) |
| 5 or more Children | 0 (0.0%) | 0 (0.0%) |
| Total | 48 (32.9%) | 84 (27.7%) |
Income Below Poverty Among Married-Couple vs Single-Parent Households in Pebble Creek
The poverty data for Pebble Creek shows that 82 of the married-couple family households (3.6%) and 132 of the single-parent households (29.4%) are living below the poverty level. Within the married-couple family households, those with no children have the highest poverty rate, with 54 households (5.6%) falling below the poverty line. Among the single-parent households, those with 1 or 2 children have the highest poverty rate, with 121 household (44.5%) living below poverty.
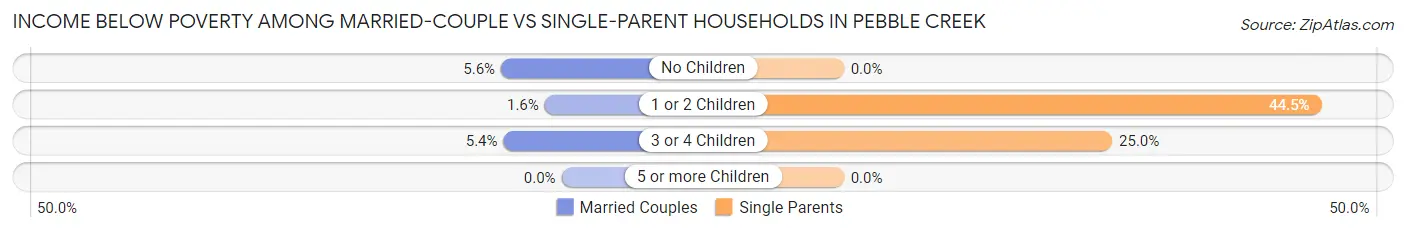
| Children | Married-Couple Families | Single-Parent Households |
| No Children | 54 (5.6%) | 0 (0.0%) |
| 1 or 2 Children | 18 (1.6%) | 121 (44.5%) |
| 3 or 4 Children | 10 (5.4%) | 11 (25.0%) |
| 5 or more Children | 0 (0.0%) | 0 (0.0%) |
| Total | 82 (3.6%) | 132 (29.4%) |
Race in Pebble Creek
The most populous races in Pebble Creek are White / Caucasian (5,565 | 50.7%), Hispanic or Latino (2,953 | 26.9%), and Two or more Races (2,002 | 18.2%).
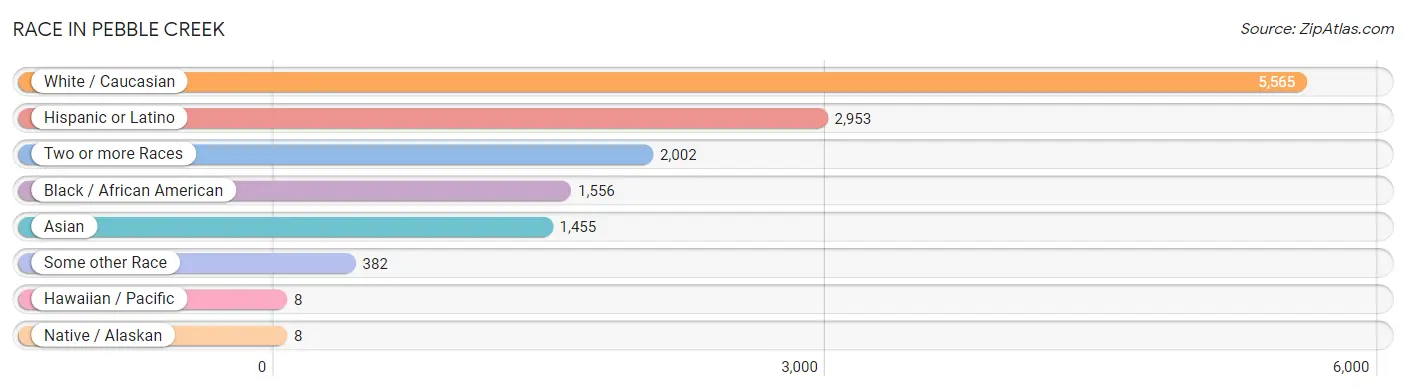
| Race | # Population | % Population |
| Asian | 1,455 | 13.3% |
| Black / African American | 1,556 | 14.2% |
| Hawaiian / Pacific | 8 | 0.1% |
| Hispanic or Latino | 2,953 | 26.9% |
| Native / Alaskan | 8 | 0.1% |
| White / Caucasian | 5,565 | 50.7% |
| Two or more Races | 2,002 | 18.2% |
| Some other Race | 382 | 3.5% |
| Total | 10,976 | 100.0% |
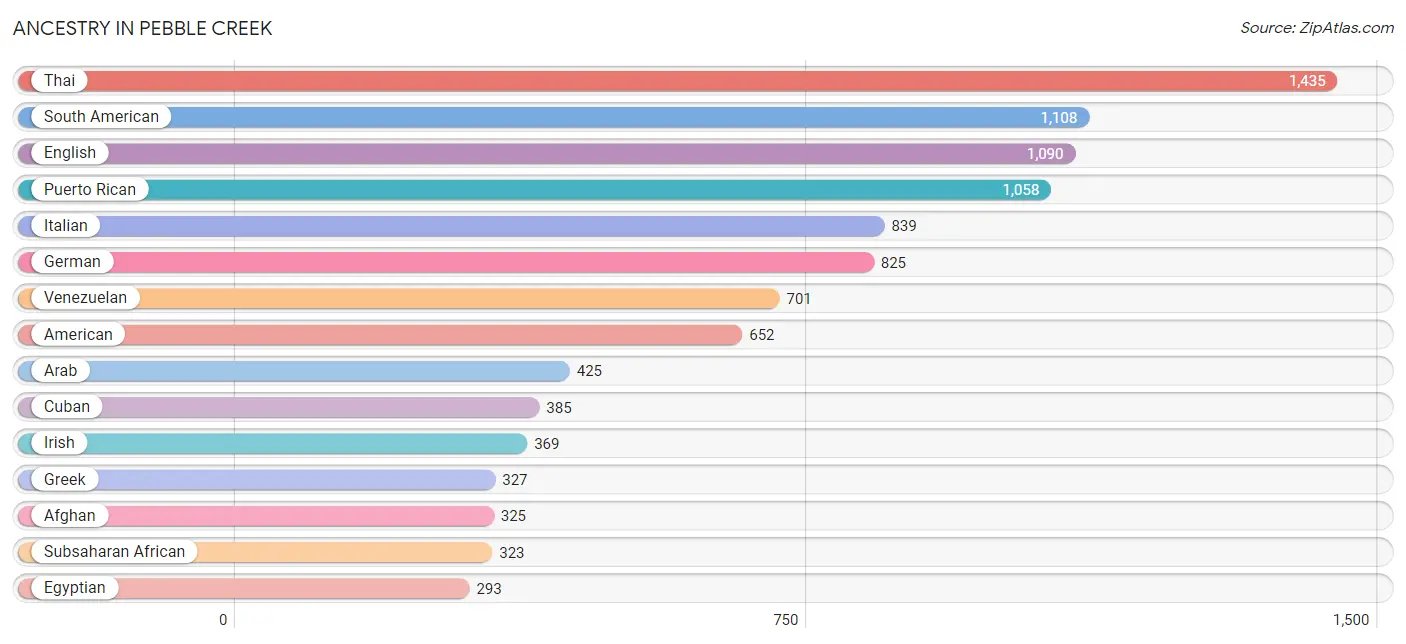
Ancestry in Pebble Creek
The most populous ancestries reported in Pebble Creek are Thai (1,435 | 13.1%), South American (1,108 | 10.1%), English (1,090 | 9.9%), Puerto Rican (1,058 | 9.6%), and Italian (839 | 7.6%), together accounting for 50.4% of all Pebble Creek residents.
| Ancestry | # Population | % Population |
| Afghan | 325 | 3.0% |
| African | 6 | 0.1% |
| American | 652 | 5.9% |
| Arab | 425 | 3.9% |
| Bahamian | 11 | 0.1% |
| Barbadian | 34 | 0.3% |
| Belgian | 20 | 0.2% |
| Bolivian | 38 | 0.4% |
| Brazilian | 7 | 0.1% |
| British | 42 | 0.4% |
| British West Indian | 132 | 1.2% |
| Burmese | 119 | 1.1% |
| Celtic | 9 | 0.1% |
| Central American | 81 | 0.7% |
| Cherokee | 19 | 0.2% |
| Colombian | 67 | 0.6% |
| Cuban | 385 | 3.5% |
| Czech | 94 | 0.9% |
| Dominican | 269 | 2.5% |
| Dutch | 86 | 0.8% |
| Eastern European | 19 | 0.2% |
| Ecuadorian | 219 | 2.0% |
| Egyptian | 293 | 2.7% |
| English | 1,090 | 9.9% |
| Ethiopian | 255 | 2.3% |
| European | 136 | 1.2% |
| French | 110 | 1.0% |
| French Canadian | 32 | 0.3% |
| German | 825 | 7.5% |
| Greek | 327 | 3.0% |
| Guatemalan | 81 | 0.7% |
| Haitian | 189 | 1.7% |
| Hungarian | 23 | 0.2% |
| Indian (Asian) | 105 | 1.0% |
| Irish | 369 | 3.4% |
| Iroquois | 11 | 0.1% |
| Italian | 839 | 7.6% |
| Jamaican | 191 | 1.7% |
| Jordanian | 30 | 0.3% |
| Korean | 160 | 1.5% |
| Mexican | 26 | 0.2% |
| Norwegian | 13 | 0.1% |
| Palestinian | 81 | 0.7% |
| Peruvian | 83 | 0.8% |
| Polish | 268 | 2.4% |
| Portuguese | 20 | 0.2% |
| Puerto Rican | 1,058 | 9.6% |
| Russian | 31 | 0.3% |
| Scandinavian | 32 | 0.3% |
| Scotch-Irish | 27 | 0.3% |
| Scottish | 67 | 0.6% |
| Slovak | 17 | 0.2% |
| South African | 62 | 0.6% |
| South American | 1,108 | 10.1% |
| Spanish | 19 | 0.2% |
| Sri Lankan | 28 | 0.3% |
| Subsaharan African | 323 | 2.9% |
| Swedish | 49 | 0.4% |
| Swiss | 21 | 0.2% |
| Thai | 1,435 | 13.1% |
| Trinidadian and Tobagonian | 35 | 0.3% |
| Ukrainian | 36 | 0.3% |
| Venezuelan | 701 | 6.4% |
| Vietnamese | 110 | 1.0% |
| Welsh | 19 | 0.2% |
| West Indian | 12 | 0.1% | View All 66 Rows |
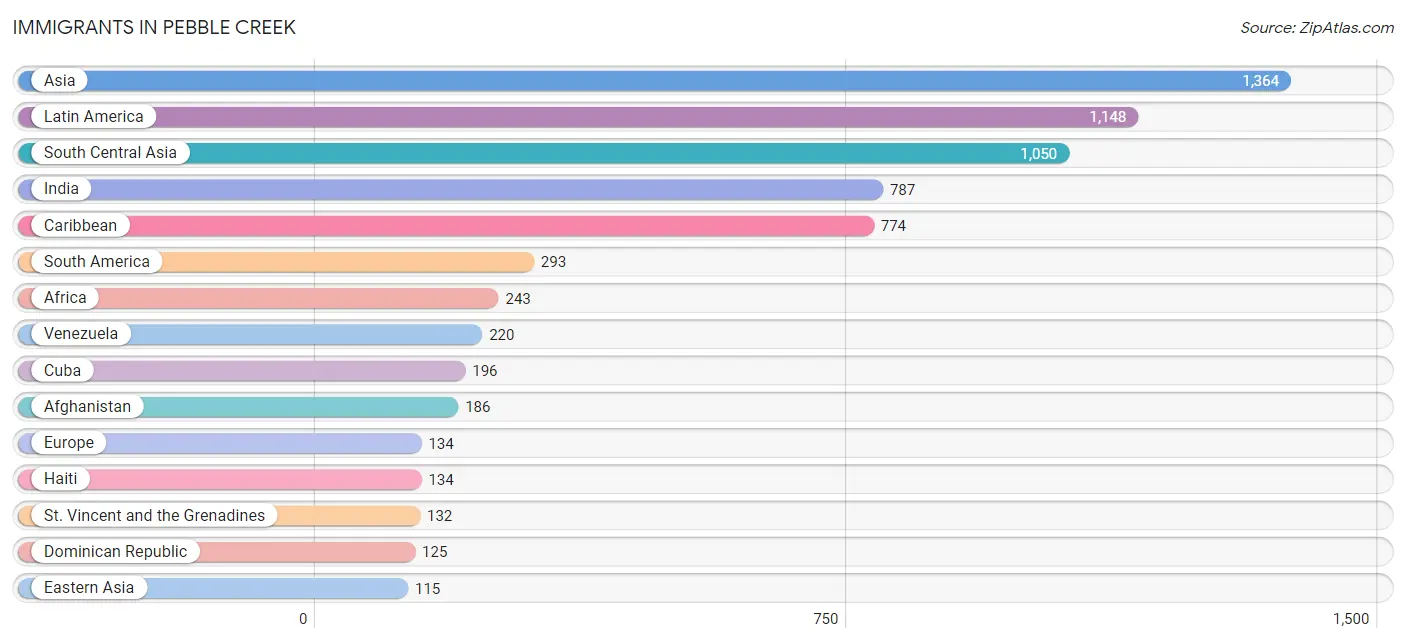
Immigrants in Pebble Creek
The most numerous immigrant groups reported in Pebble Creek came from Asia (1,364 | 12.4%), Latin America (1,148 | 10.5%), South Central Asia (1,050 | 9.6%), India (787 | 7.2%), and Caribbean (774 | 7.0%), together accounting for 46.7% of all Pebble Creek residents.
| Immigration Origin | # Population | % Population |
| Afghanistan | 186 | 1.7% |
| Africa | 243 | 2.2% |
| Asia | 1,364 | 12.4% |
| Bahamas | 11 | 0.1% |
| Bangladesh | 77 | 0.7% |
| Barbados | 34 | 0.3% |
| Bolivia | 10 | 0.1% |
| Brazil | 21 | 0.2% |
| Canada | 65 | 0.6% |
| Caribbean | 774 | 7.0% |
| Central America | 81 | 0.7% |
| China | 78 | 0.7% |
| Colombia | 11 | 0.1% |
| Cuba | 196 | 1.8% |
| Dominican Republic | 125 | 1.1% |
| Eastern Africa | 59 | 0.5% |
| Eastern Asia | 115 | 1.1% |
| Eastern Europe | 32 | 0.3% |
| Egypt | 79 | 0.7% |
| England | 71 | 0.6% |
| Ethiopia | 59 | 0.5% |
| Europe | 134 | 1.2% |
| Germany | 31 | 0.3% |
| Guatemala | 81 | 0.7% |
| Haiti | 134 | 1.2% |
| India | 787 | 7.2% |
| Iraq | 41 | 0.4% |
| Jamaica | 107 | 1.0% |
| Jordan | 30 | 0.3% |
| Korea | 37 | 0.3% |
| Latin America | 1,148 | 10.5% |
| Nigeria | 12 | 0.1% |
| Northern Africa | 79 | 0.7% |
| Northern Europe | 71 | 0.6% |
| Peru | 31 | 0.3% |
| Philippines | 70 | 0.6% |
| South Africa | 80 | 0.7% |
| South America | 293 | 2.7% |
| South Central Asia | 1,050 | 9.6% |
| South Eastern Asia | 79 | 0.7% |
| St. Vincent and the Grenadines | 132 | 1.2% |
| Trinidad and Tobago | 35 | 0.3% |
| Turkey | 8 | 0.1% |
| Ukraine | 32 | 0.3% |
| Venezuela | 220 | 2.0% |
| Vietnam | 9 | 0.1% |
| Western Africa | 12 | 0.1% |
| Western Asia | 79 | 0.7% |
| Western Europe | 31 | 0.3% | View All 49 Rows |
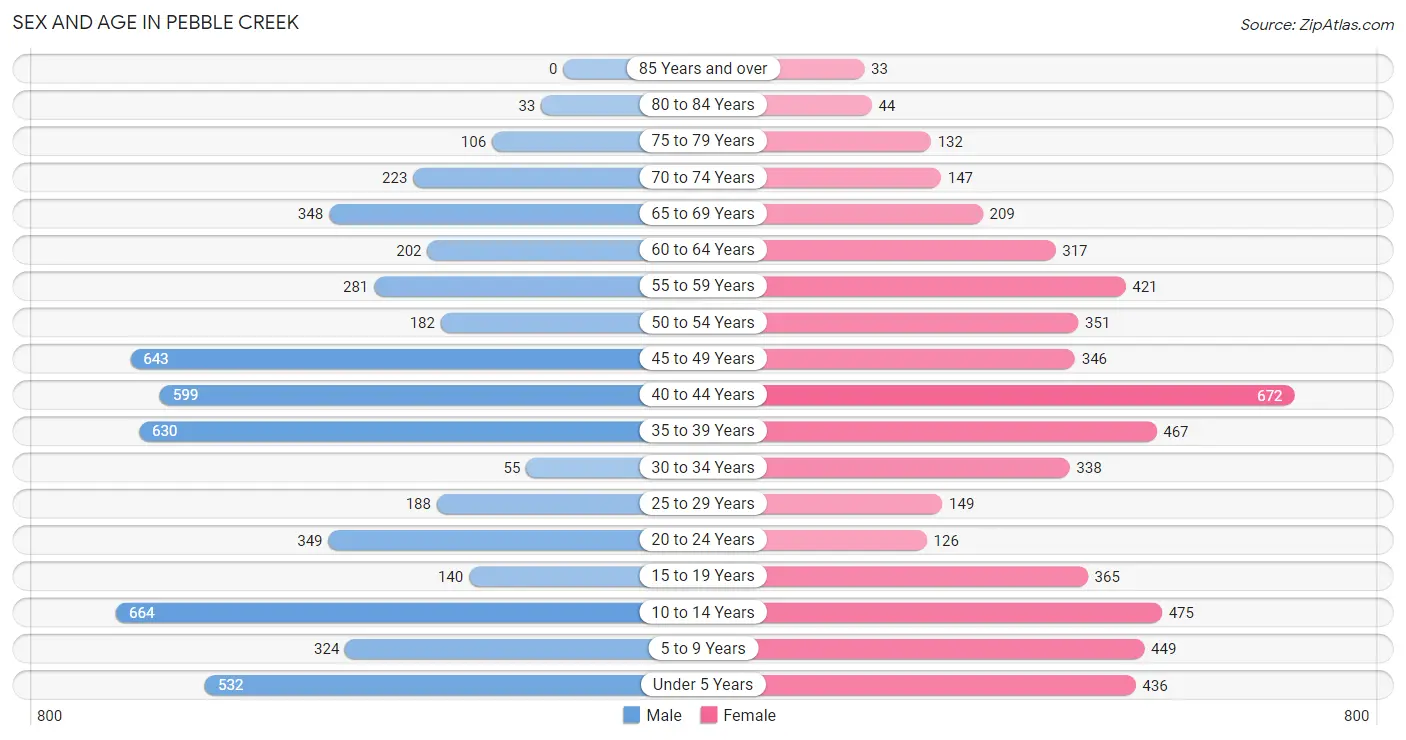
Sex and Age in Pebble Creek
Sex and Age in Pebble Creek
The most populous age groups in Pebble Creek are 10 to 14 Years (664 | 12.1%) for men and 40 to 44 Years (672 | 12.3%) for women.
| Age Bracket | Male | Female |
| Under 5 Years | 532 (9.7%) | 436 (8.0%) |
| 5 to 9 Years | 324 (5.9%) | 449 (8.2%) |
| 10 to 14 Years | 664 (12.1%) | 475 (8.7%) |
| 15 to 19 Years | 140 (2.5%) | 365 (6.7%) |
| 20 to 24 Years | 349 (6.4%) | 126 (2.3%) |
| 25 to 29 Years | 188 (3.4%) | 149 (2.7%) |
| 30 to 34 Years | 55 (1.0%) | 338 (6.2%) |
| 35 to 39 Years | 630 (11.5%) | 467 (8.5%) |
| 40 to 44 Years | 599 (10.9%) | 672 (12.3%) |
| 45 to 49 Years | 643 (11.7%) | 346 (6.3%) |
| 50 to 54 Years | 182 (3.3%) | 351 (6.4%) |
| 55 to 59 Years | 281 (5.1%) | 421 (7.7%) |
| 60 to 64 Years | 202 (3.7%) | 317 (5.8%) |
| 65 to 69 Years | 348 (6.3%) | 209 (3.8%) |
| 70 to 74 Years | 223 (4.1%) | 147 (2.7%) |
| 75 to 79 Years | 106 (1.9%) | 132 (2.4%) |
| 80 to 84 Years | 33 (0.6%) | 44 (0.8%) |
| 85 Years and over | 0 (0.0%) | 33 (0.6%) |
| Total | 5,499 (100.0%) | 5,477 (100.0%) |
Families and Households in Pebble Creek
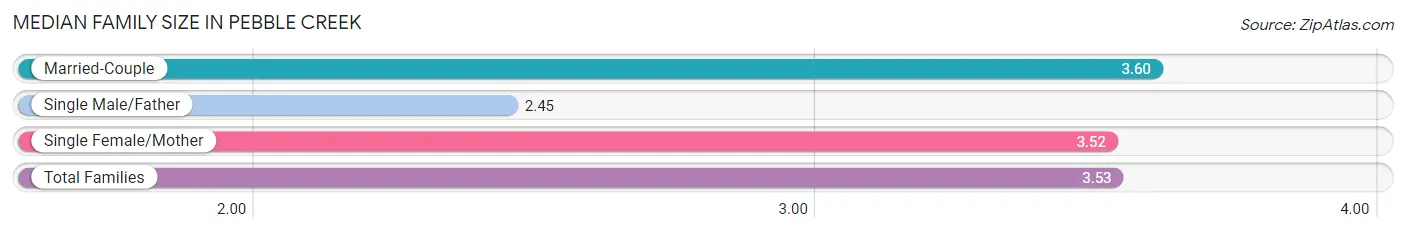
Median Family Size in Pebble Creek
The median family size in Pebble Creek is 3.53 persons per family, with married-couple families (2,291 | 83.6%) accounting for the largest median family size of 3.6 persons per family. On the other hand, single male/father families (146 | 5.3%) represent the smallest median family size with 2.45 persons per family.
| Family Type | # Families | Family Size |
| Married-Couple | 2,291 (83.6%) | 3.60 |
| Single Male/Father | 146 (5.3%) | 2.45 |
| Single Female/Mother | 303 (11.1%) | 3.52 |
| Total Families | 2,740 (100.0%) | 3.53 |
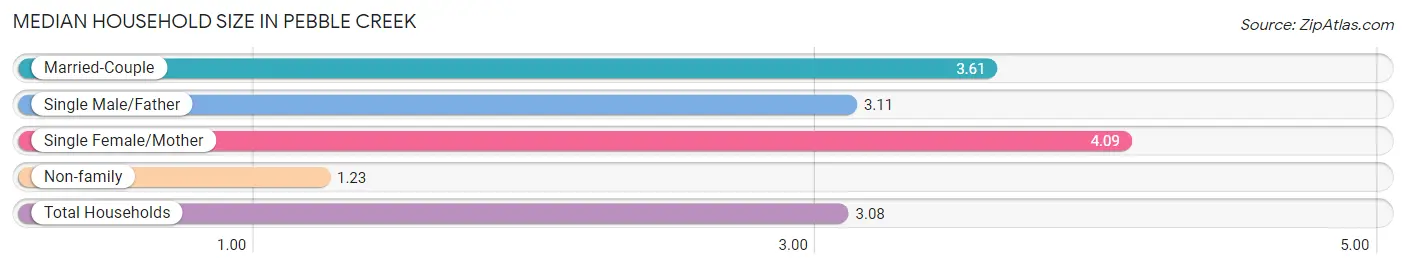
Median Household Size in Pebble Creek
The median household size in Pebble Creek is 3.08 persons per household, with single female/mother households (303 | 8.5%) accounting for the largest median household size of 4.09 persons per household. non-family households (827 | 23.2%) represent the smallest median household size with 1.23 persons per household.
| Household Type | # Households | Household Size |
| Married-Couple | 2,291 (64.2%) | 3.61 |
| Single Male/Father | 146 (4.1%) | 3.11 |
| Single Female/Mother | 303 (8.5%) | 4.09 |
| Non-family | 827 (23.2%) | 1.23 |
| Total Households | 3,567 (100.0%) | 3.08 |
Household Size by Marriage Status in Pebble Creek
Out of a total of 3,567 households in Pebble Creek, 2,740 (76.8%) are family households, while 827 (23.2%) are nonfamily households. The most numerous type of family households are 2-person households, comprising 835, and the most common type of nonfamily households are 1-person households, comprising 688.
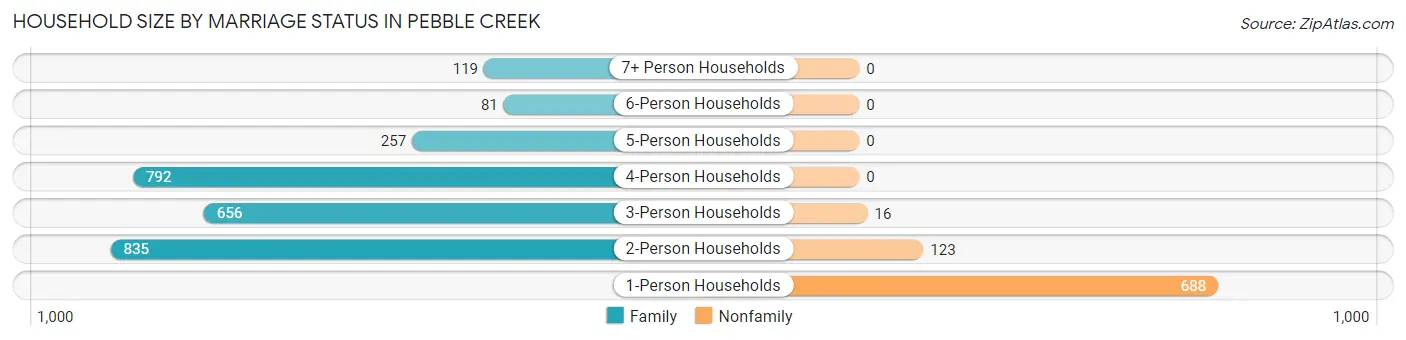
| Household Size | Family Households | Nonfamily Households |
| 1-Person Households | - | 688 (19.3%) |
| 2-Person Households | 835 (23.4%) | 123 (3.5%) |
| 3-Person Households | 656 (18.4%) | 16 (0.4%) |
| 4-Person Households | 792 (22.2%) | 0 (0.0%) |
| 5-Person Households | 257 (7.2%) | 0 (0.0%) |
| 6-Person Households | 81 (2.3%) | 0 (0.0%) |
| 7+ Person Households | 119 (3.3%) | 0 (0.0%) |
| Total | 2,740 (76.8%) | 827 (23.2%) |
Female Fertility in Pebble Creek
Fertility by Age in Pebble Creek
Average fertility rate in Pebble Creek is 34.0 births per 1,000 women. Women in the age bracket of 20 to 34 years have the highest fertility rate with 116.0 births per 1,000 women. Women in the age bracket of 20 to 34 years acount for 82.6% of all women with births.
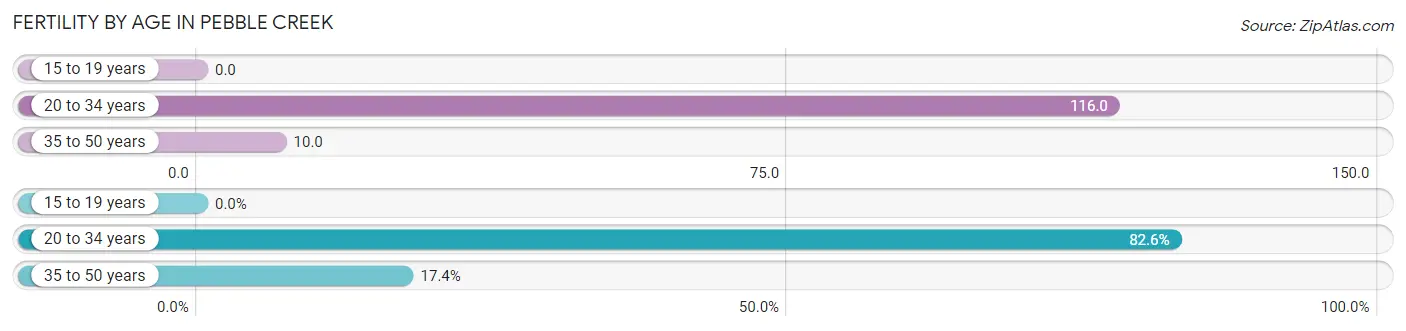
| Age Bracket | Women with Births | Births / 1,000 Women |
| 15 to 19 years | 0 (0.0%) | 0.0 |
| 20 to 34 years | 71 (82.6%) | 116.0 |
| 35 to 50 years | 15 (17.4%) | 10.0 |
| Total | 86 (100.0%) | 34.0 |
Fertility by Age by Marriage Status in Pebble Creek
45.3% of women with births (86) in Pebble Creek are married. The highest percentage of unmarried women with births falls into 20 to 34 years age bracket with 66.2% of them unmarried at the time of birth, while the lowest percentage of unmarried women with births belong to 35 to 50 years age bracket with 0.0% of them unmarried.
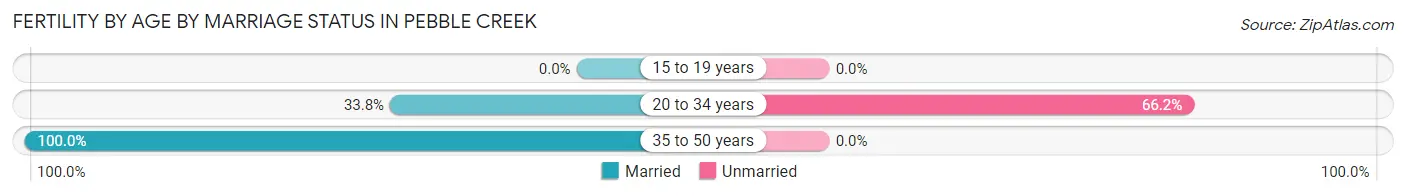
| Age Bracket | Married | Unmarried |
| 15 to 19 years | 0 (0.0%) | 0 (0.0%) |
| 20 to 34 years | 24 (33.8%) | 47 (66.2%) |
| 35 to 50 years | 15 (100.0%) | 0 (0.0%) |
| Total | 39 (45.4%) | 47 (54.6%) |
Fertility by Education in Pebble Creek
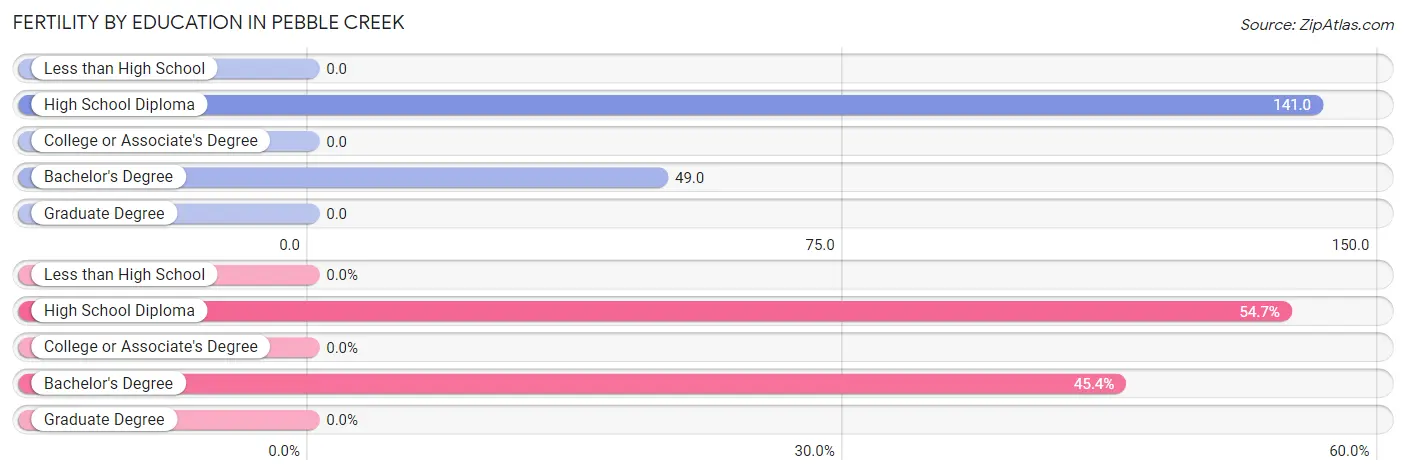
| Educational Attainment | Women with Births | Births / 1,000 Women |
| Less than High School | 0 (0.0%) | 0.0 |
| High School Diploma | 47 (54.6%) | 141.0 |
| College or Associate's Degree | 0 (0.0%) | 0.0 |
| Bachelor's Degree | 39 (45.4%) | 49.0 |
| Graduate Degree | 0 (0.0%) | 0.0 |
| Total | 86 (100.0%) | 34.0 |
Fertility by Education by Marriage Status in Pebble Creek
54.6% of women with births in Pebble Creek are unmarried. Women with the educational attainment of bachelor's degree are most likely to be married with 100.0% of them married at childbirth, while women with the educational attainment of high school diploma are least likely to be married with 100.0% of them unmarried at childbirth.
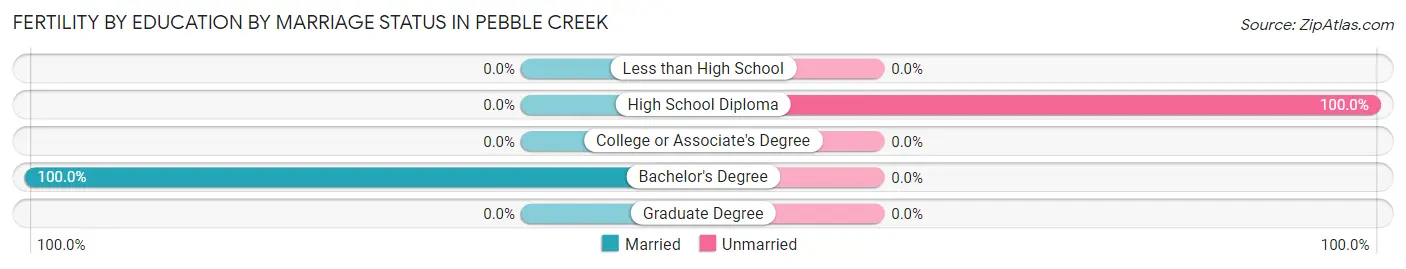
| Educational Attainment | Married | Unmarried |
| Less than High School | 0 (0.0%) | 0 (0.0%) |
| High School Diploma | 0 (0.0%) | 47 (100.0%) |
| College or Associate's Degree | 0 (0.0%) | 0 (0.0%) |
| Bachelor's Degree | 39 (100.0%) | 0 (0.0%) |
| Graduate Degree | 0 (0.0%) | 0 (0.0%) |
| Total | 39 (45.4%) | 47 (54.6%) |
Employment Characteristics in Pebble Creek
Employment by Class of Employer in Pebble Creek
Among the 5,468 employed individuals in Pebble Creek, private company employees (3,696 | 67.6%), not-for-profit organizations (638 | 11.7%), and self-employed (incorporated) (371 | 6.8%) make up the most common classes of employment.
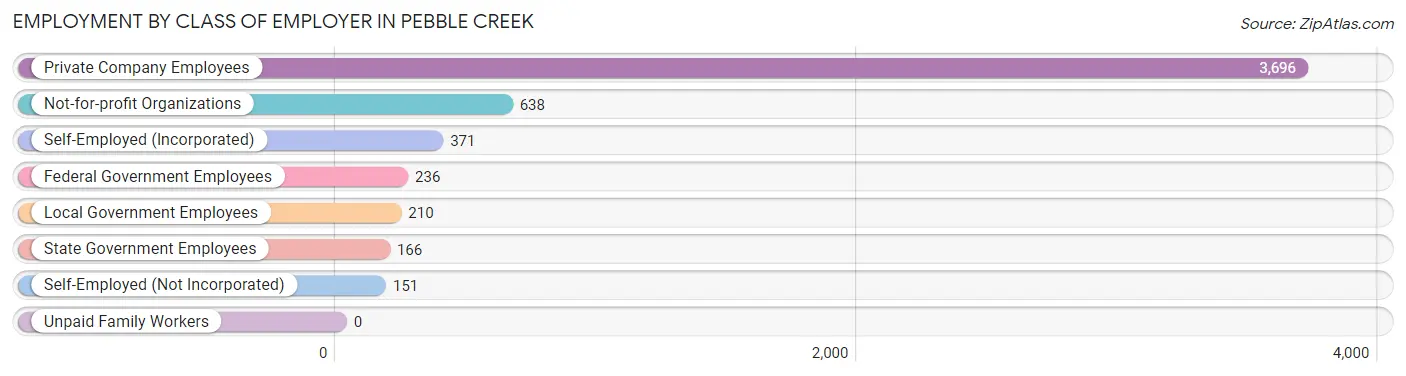
| Employer Class | # Employees | % Employees |
| Private Company Employees | 3,696 | 67.6% |
| Self-Employed (Incorporated) | 371 | 6.8% |
| Self-Employed (Not Incorporated) | 151 | 2.8% |
| Not-for-profit Organizations | 638 | 11.7% |
| Local Government Employees | 210 | 3.8% |
| State Government Employees | 166 | 3.0% |
| Federal Government Employees | 236 | 4.3% |
| Unpaid Family Workers | 0 | 0.0% |
| Total | 5,468 | 100.0% |
Employment Status by Age in Pebble Creek
According to the labor force statistics for Pebble Creek, out of the total population over 16 years of age (7,972), 70.7% or 5,636 individuals are in the labor force, with 2.9% or 163 of them unemployed. The age group with the highest labor force participation rate is 35 to 44 years, with 91.2% or 2,160 individuals in the labor force. Within the labor force, the 16 to 19 years age range has the highest percentage of unemployed individuals, with 10.1% or 24 of them being unemployed.
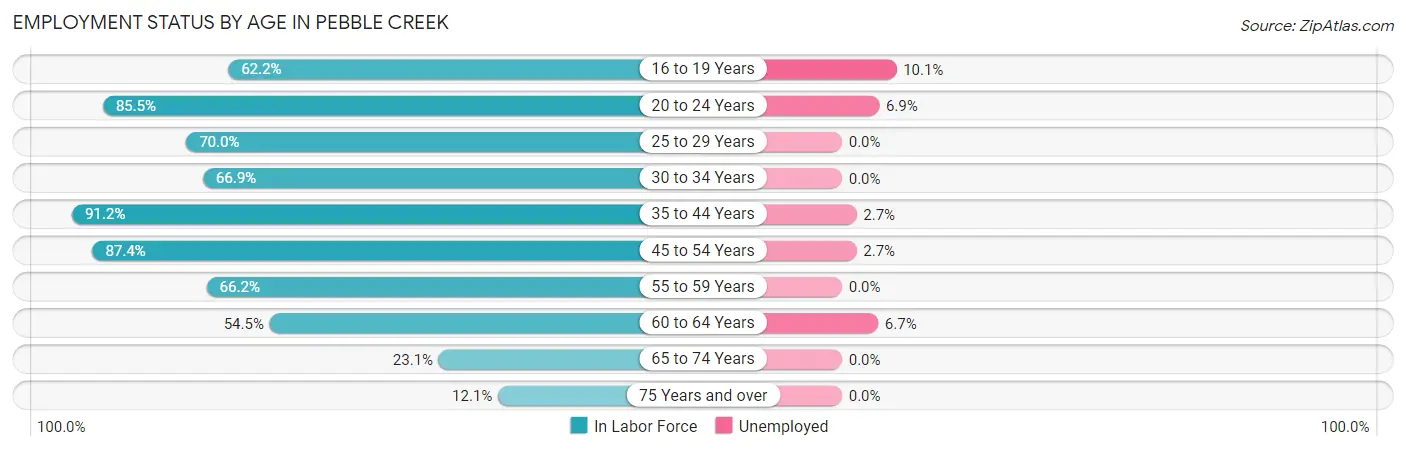
| Age Bracket | In Labor Force | Unemployed |
| 16 to 19 Years | 237 (62.2%) | 24 (10.1%) |
| 20 to 24 Years | 406 (85.5%) | 28 (6.9%) |
| 25 to 29 Years | 236 (70.0%) | 0 (0.0%) |
| 30 to 34 Years | 263 (66.9%) | 0 (0.0%) |
| 35 to 44 Years | 2,160 (91.2%) | 58 (2.7%) |
| 45 to 54 Years | 1,330 (87.4%) | 36 (2.7%) |
| 55 to 59 Years | 465 (66.2%) | 0 (0.0%) |
| 60 to 64 Years | 283 (54.5%) | 19 (6.7%) |
| 65 to 74 Years | 214 (23.1%) | 0 (0.0%) |
| 75 Years and over | 42 (12.1%) | 0 (0.0%) |
| Total | 5,636 (70.7%) | 163 (2.9%) |
Employment Status by Educational Attainment in Pebble Creek
According to labor force statistics for Pebble Creek, 81.1% of individuals (4,737) out of the total population between 25 and 64 years of age (5,841) are in the labor force, with 2.4% or 114 of them being unemployed. The group with the highest labor force participation rate are those with the educational attainment of bachelor's degree or higher, with 91.8% or 2,916 individuals in the labor force. Within the labor force, individuals with less than high school education have the highest percentage of unemployment, with 38.2% or 42 of them being unemployed.
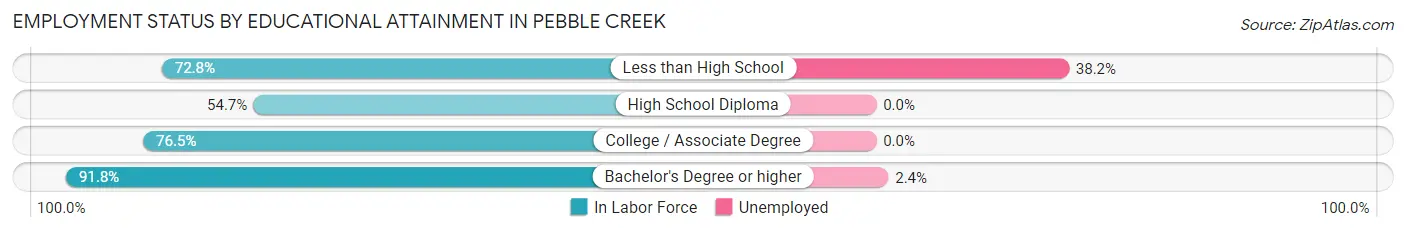
| Educational Attainment | In Labor Force | Unemployed |
| Less than High School | 110 (72.8%) | 58 (38.2%) |
| High School Diploma | 532 (54.7%) | 0 (0.0%) |
| College / Associate Degree | 1,179 (76.5%) | 0 (0.0%) |
| Bachelor's Degree or higher | 2,916 (91.8%) | 76 (2.4%) |
| Total | 4,737 (81.1%) | 140 (2.4%) |
Employment Occupations by Sex in Pebble Creek
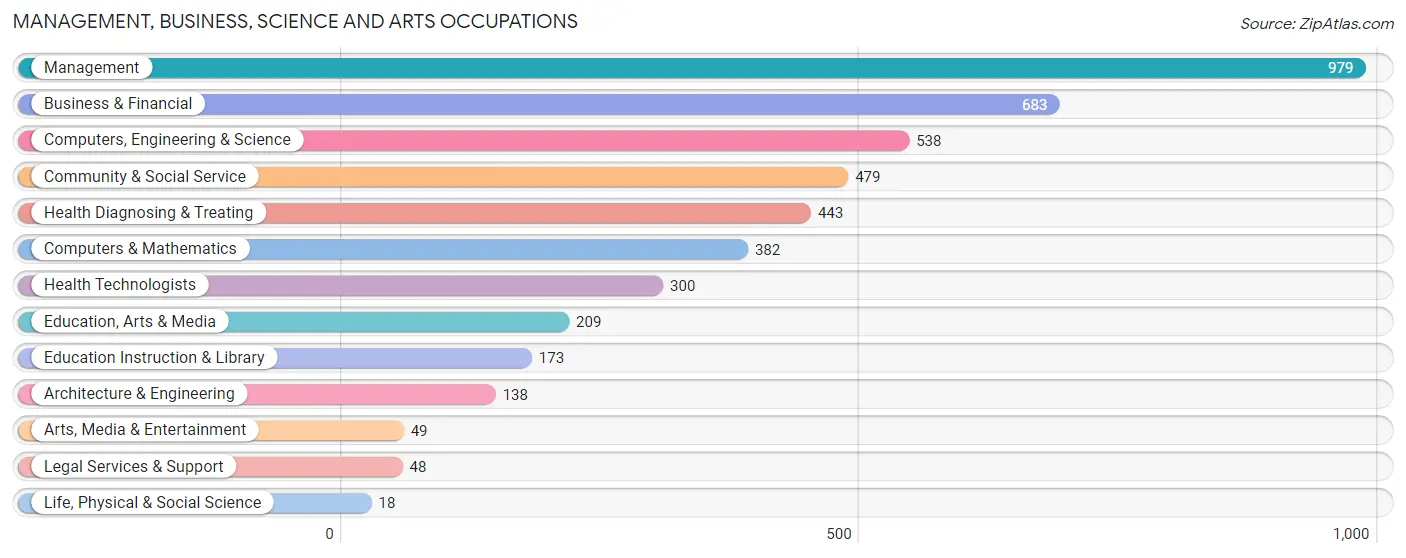
Management, Business, Science and Arts Occupations
The most common Management, Business, Science and Arts occupations in Pebble Creek are Management (979 | 17.9%), Business & Financial (683 | 12.5%), Computers, Engineering & Science (538 | 9.9%), Community & Social Service (479 | 8.8%), and Health Diagnosing & Treating (443 | 8.1%).
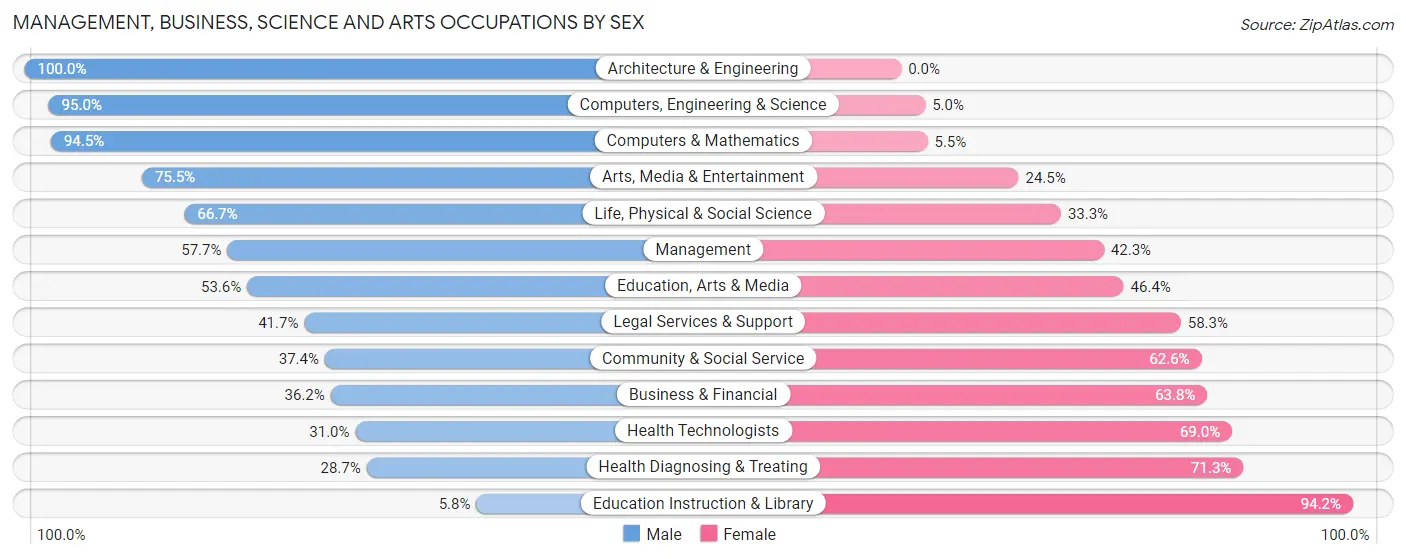
Management, Business, Science and Arts Occupations by Sex
Within the Management, Business, Science and Arts occupations in Pebble Creek, the most male-oriented occupations are Architecture & Engineering (100.0%), Computers, Engineering & Science (95.0%), and Computers & Mathematics (94.5%), while the most female-oriented occupations are Education Instruction & Library (94.2%), Health Diagnosing & Treating (71.3%), and Health Technologists (69.0%).
| Occupation | Male | Female |
| Management | 565 (57.7%) | 414 (42.3%) |
| Business & Financial | 247 (36.2%) | 436 (63.8%) |
| Computers, Engineering & Science | 511 (95.0%) | 27 (5.0%) |
| Computers & Mathematics | 361 (94.5%) | 21 (5.5%) |
| Architecture & Engineering | 138 (100.0%) | 0 (0.0%) |
| Life, Physical & Social Science | 12 (66.7%) | 6 (33.3%) |
| Community & Social Service | 179 (37.4%) | 300 (62.6%) |
| Education, Arts & Media | 112 (53.6%) | 97 (46.4%) |
| Legal Services & Support | 20 (41.7%) | 28 (58.3%) |
| Education Instruction & Library | 10 (5.8%) | 163 (94.2%) |
| Arts, Media & Entertainment | 37 (75.5%) | 12 (24.5%) |
| Health Diagnosing & Treating | 127 (28.7%) | 316 (71.3%) |
| Health Technologists | 93 (31.0%) | 207 (69.0%) |
| Total (Category) | 1,629 (52.2%) | 1,493 (47.8%) |
| Total (Overall) | 3,115 (57.1%) | 2,342 (42.9%) |
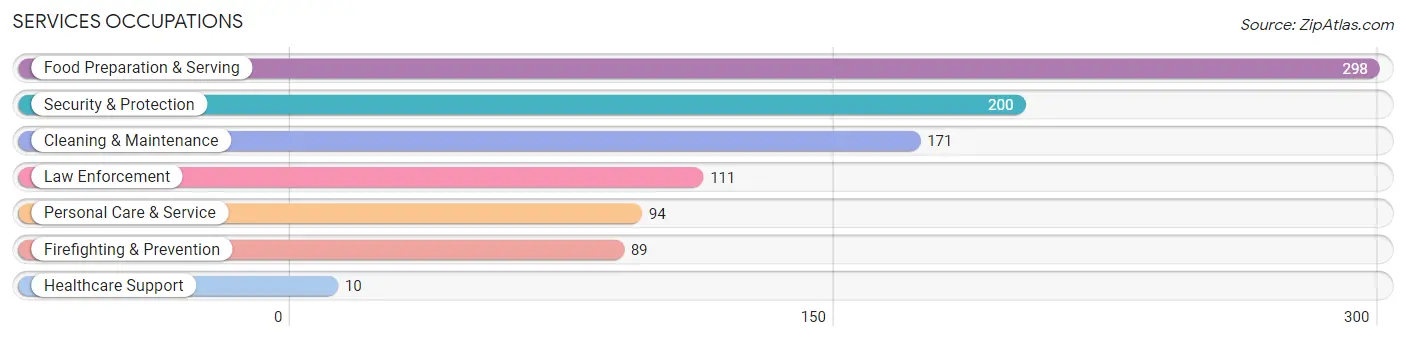
Services Occupations
The most common Services occupations in Pebble Creek are Food Preparation & Serving (298 | 5.5%), Security & Protection (200 | 3.7%), Cleaning & Maintenance (171 | 3.1%), Law Enforcement (111 | 2.0%), and Personal Care & Service (94 | 1.7%).
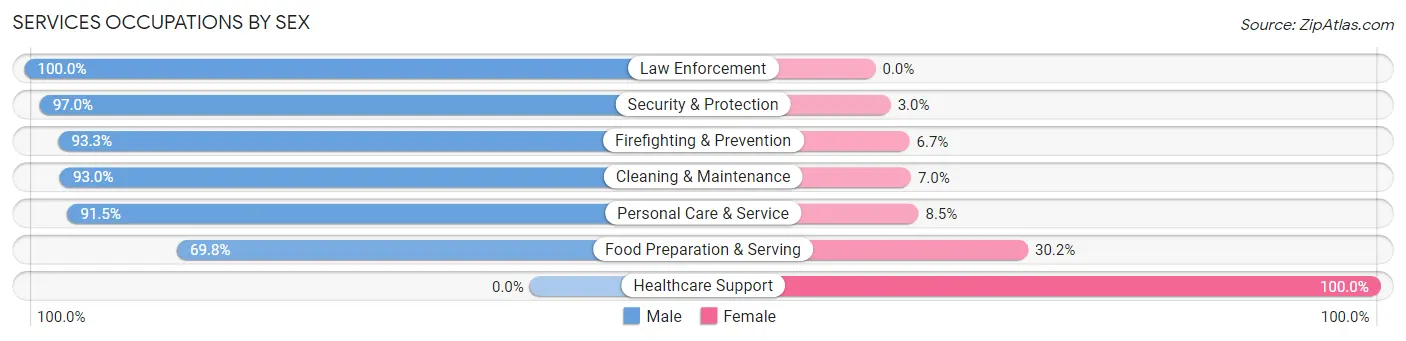
Services Occupations by Sex
Within the Services occupations in Pebble Creek, the most male-oriented occupations are Law Enforcement (100.0%), Security & Protection (97.0%), and Firefighting & Prevention (93.3%), while the most female-oriented occupations are Healthcare Support (100.0%), Food Preparation & Serving (30.2%), and Personal Care & Service (8.5%).
| Occupation | Male | Female |
| Healthcare Support | 0 (0.0%) | 10 (100.0%) |
| Security & Protection | 194 (97.0%) | 6 (3.0%) |
| Firefighting & Prevention | 83 (93.3%) | 6 (6.7%) |
| Law Enforcement | 111 (100.0%) | 0 (0.0%) |
| Food Preparation & Serving | 208 (69.8%) | 90 (30.2%) |
| Cleaning & Maintenance | 159 (93.0%) | 12 (7.0%) |
| Personal Care & Service | 86 (91.5%) | 8 (8.5%) |
| Total (Category) | 647 (83.7%) | 126 (16.3%) |
| Total (Overall) | 3,115 (57.1%) | 2,342 (42.9%) |
Sales and Office Occupations
The most common Sales and Office occupations in Pebble Creek are Sales & Related (793 | 14.5%), and Office & Administration (492 | 9.0%).
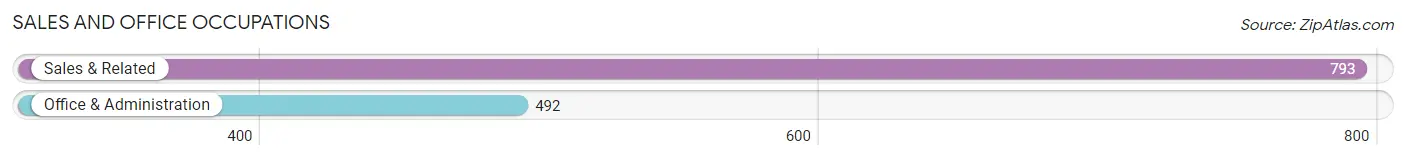
Sales and Office Occupations by Sex
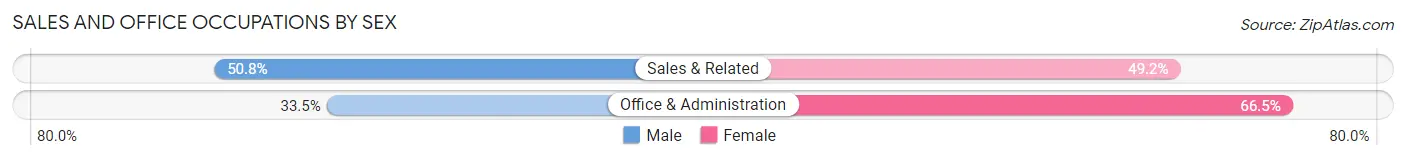
| Occupation | Male | Female |
| Sales & Related | 403 (50.8%) | 390 (49.2%) |
| Office & Administration | 165 (33.5%) | 327 (66.5%) |
| Total (Category) | 568 (44.2%) | 717 (55.8%) |
| Total (Overall) | 3,115 (57.1%) | 2,342 (42.9%) |
Natural Resources, Construction and Maintenance Occupations
The most common Natural Resources, Construction and Maintenance occupations in Pebble Creek are Construction & Extraction (100 | 1.8%), and Installation, Maintenance & Repair (73 | 1.3%).
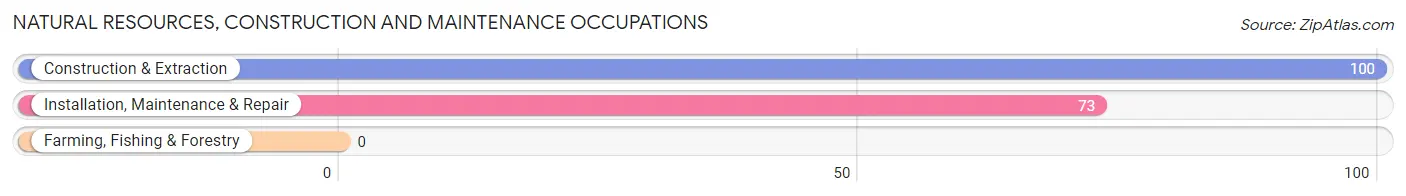
Natural Resources, Construction and Maintenance Occupations by Sex
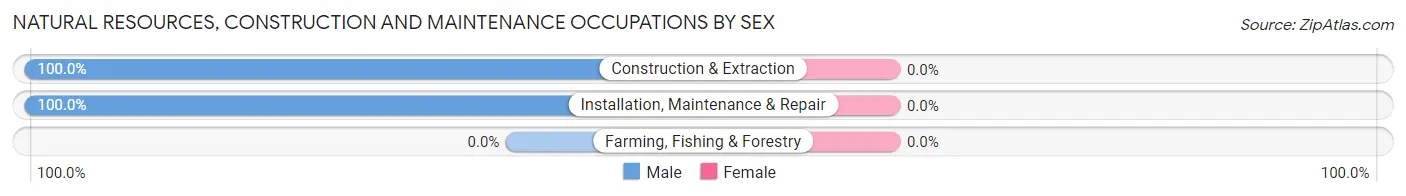
| Occupation | Male | Female |
| Farming, Fishing & Forestry | 0 (0.0%) | 0 (0.0%) |
| Construction & Extraction | 100 (100.0%) | 0 (0.0%) |
| Installation, Maintenance & Repair | 73 (100.0%) | 0 (0.0%) |
| Total (Category) | 173 (100.0%) | 0 (0.0%) |
| Total (Overall) | 3,115 (57.1%) | 2,342 (42.9%) |
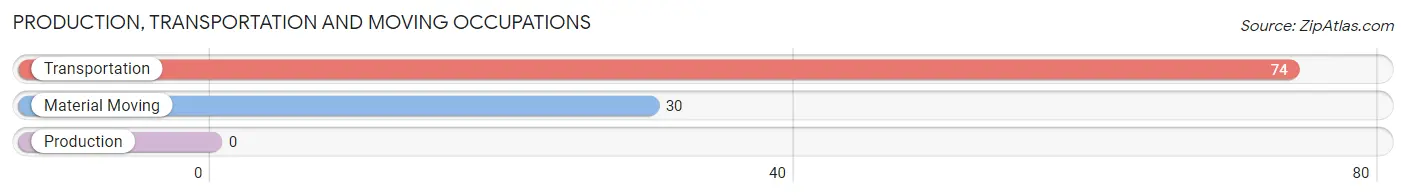
Production, Transportation and Moving Occupations
The most common Production, Transportation and Moving occupations in Pebble Creek are Transportation (74 | 1.4%), and Material Moving (30 | 0.5%).
Production, Transportation and Moving Occupations by Sex
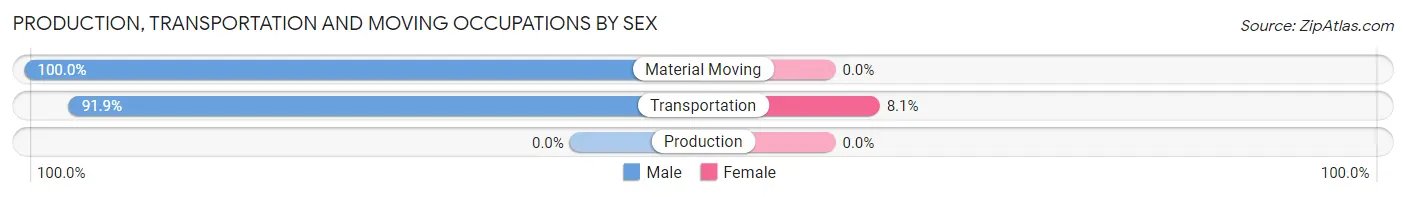
| Occupation | Male | Female |
| Production | 0 (0.0%) | 0 (0.0%) |
| Transportation | 68 (91.9%) | 6 (8.1%) |
| Material Moving | 30 (100.0%) | 0 (0.0%) |
| Total (Category) | 98 (94.2%) | 6 (5.8%) |
| Total (Overall) | 3,115 (57.1%) | 2,342 (42.9%) |
Employment Industries by Sex in Pebble Creek
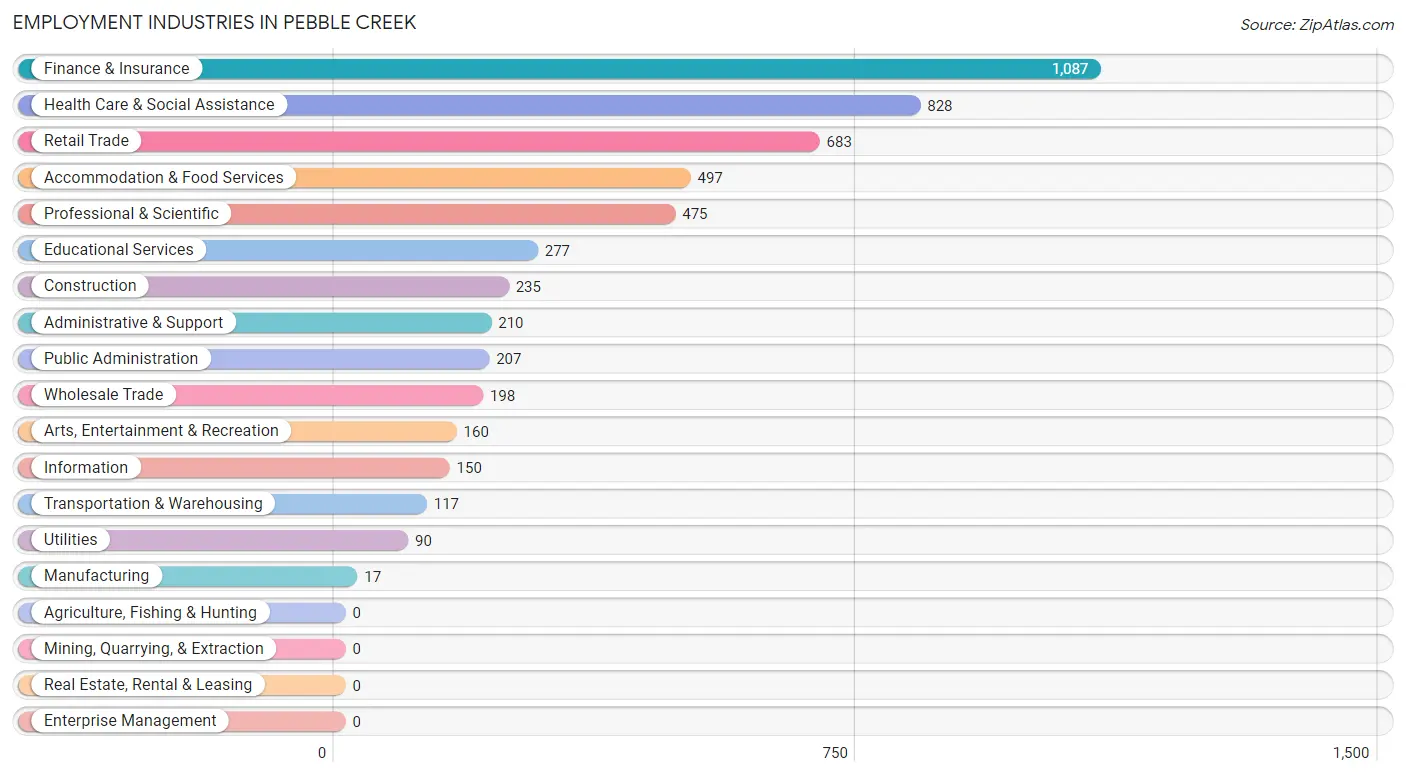
Employment Industries in Pebble Creek
The major employment industries in Pebble Creek include Finance & Insurance (1,087 | 19.9%), Health Care & Social Assistance (828 | 15.2%), Retail Trade (683 | 12.5%), Accommodation & Food Services (497 | 9.1%), and Professional & Scientific (475 | 8.7%).
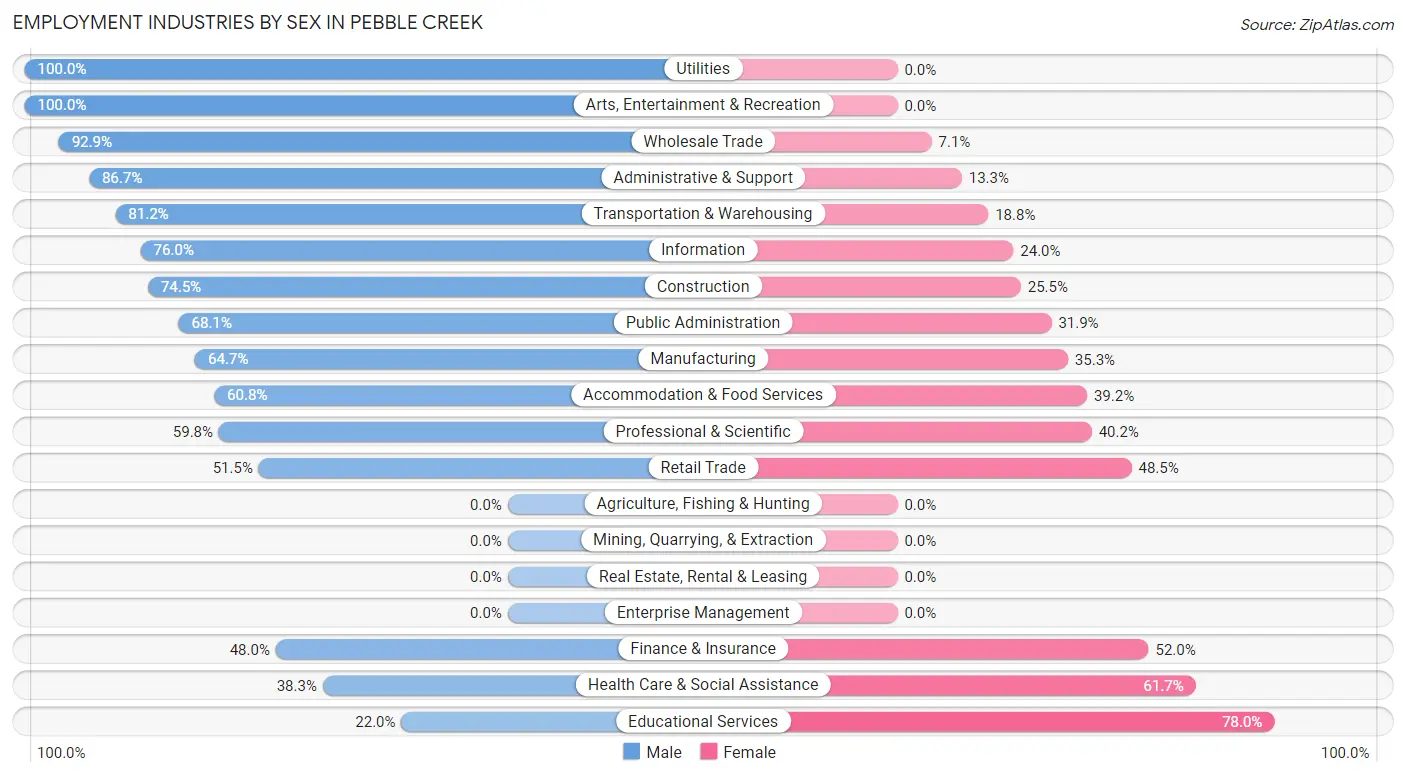
Employment Industries by Sex in Pebble Creek
The Pebble Creek industries that see more men than women are Utilities (100.0%), Arts, Entertainment & Recreation (100.0%), and Wholesale Trade (92.9%), whereas the industries that tend to have a higher number of women are Educational Services (78.0%), Health Care & Social Assistance (61.7%), and Finance & Insurance (52.0%).
| Industry | Male | Female |
| Agriculture, Fishing & Hunting | 0 (0.0%) | 0 (0.0%) |
| Mining, Quarrying, & Extraction | 0 (0.0%) | 0 (0.0%) |
| Construction | 175 (74.5%) | 60 (25.5%) |
| Manufacturing | 11 (64.7%) | 6 (35.3%) |
| Wholesale Trade | 184 (92.9%) | 14 (7.1%) |
| Retail Trade | 352 (51.5%) | 331 (48.5%) |
| Transportation & Warehousing | 95 (81.2%) | 22 (18.8%) |
| Utilities | 90 (100.0%) | 0 (0.0%) |
| Information | 114 (76.0%) | 36 (24.0%) |
| Finance & Insurance | 522 (48.0%) | 565 (52.0%) |
| Real Estate, Rental & Leasing | 0 (0.0%) | 0 (0.0%) |
| Professional & Scientific | 284 (59.8%) | 191 (40.2%) |
| Enterprise Management | 0 (0.0%) | 0 (0.0%) |
| Administrative & Support | 182 (86.7%) | 28 (13.3%) |
| Educational Services | 61 (22.0%) | 216 (78.0%) |
| Health Care & Social Assistance | 317 (38.3%) | 511 (61.7%) |
| Arts, Entertainment & Recreation | 160 (100.0%) | 0 (0.0%) |
| Accommodation & Food Services | 302 (60.8%) | 195 (39.2%) |
| Public Administration | 141 (68.1%) | 66 (31.9%) |
| Total | 3,115 (57.1%) | 2,342 (42.9%) |
Education in Pebble Creek
School Enrollment in Pebble Creek
The most common levels of schooling among the 3,062 students in Pebble Creek are middle school (906 | 29.6%), elementary school (807 | 26.4%), and high school (455 | 14.9%).
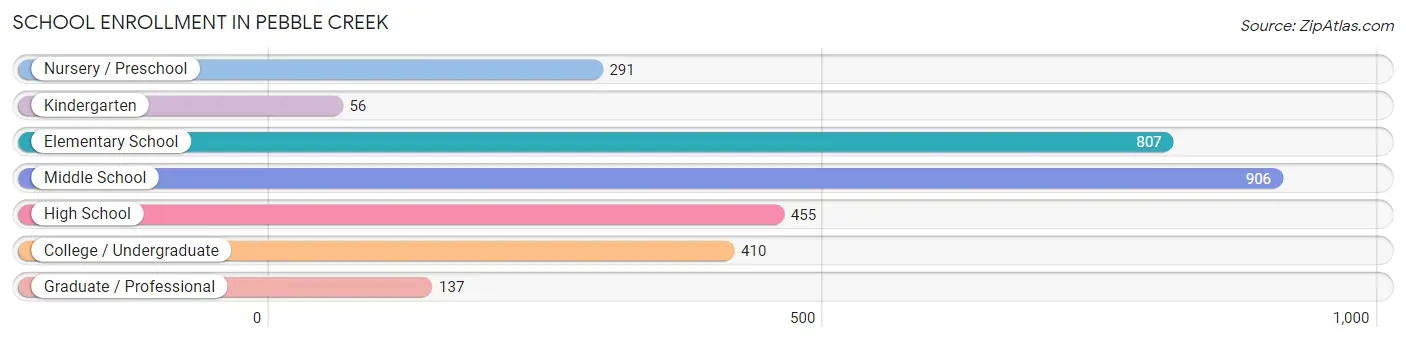
| School Level | # Students | % Students |
| Nursery / Preschool | 291 | 9.5% |
| Kindergarten | 56 | 1.8% |
| Elementary School | 807 | 26.4% |
| Middle School | 906 | 29.6% |
| High School | 455 | 14.9% |
| College / Undergraduate | 410 | 13.4% |
| Graduate / Professional | 137 | 4.5% |
| Total | 3,062 | 100.0% |
School Enrollment by Age by Funding Source in Pebble Creek
Out of a total of 3,062 students who are enrolled in schools in Pebble Creek, 389 (12.7%) attend a private institution, while the remaining 2,673 (87.3%) are enrolled in public schools. The age group of 35 years and over has the highest likelihood of being enrolled in private schools, with 89 (52.0% in the age bracket) enrolled. Conversely, the age group of 18 to 19 year olds has the lowest likelihood of being enrolled in a private school, with 174 (100.0% in the age bracket) attending a public institution.
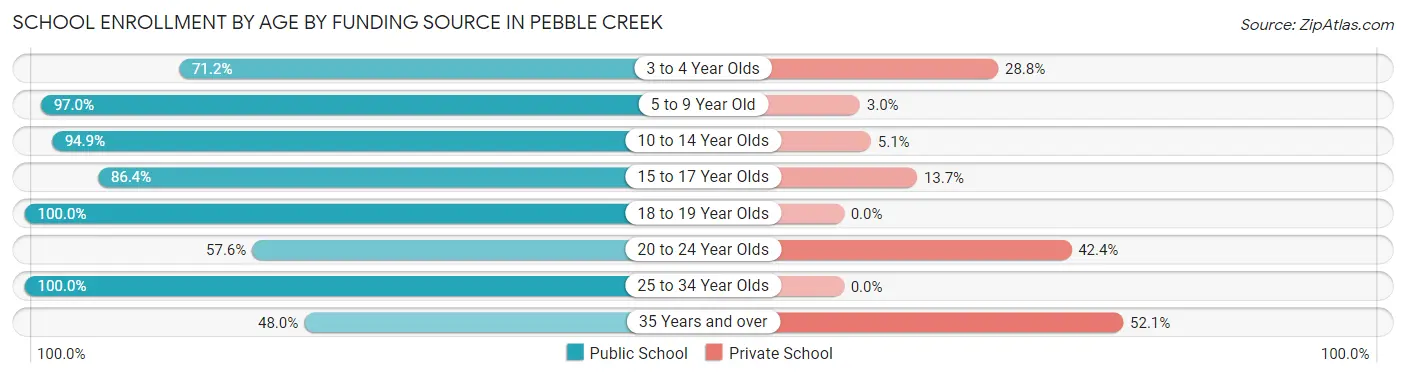
| Age Bracket | Public School | Private School |
| 3 to 4 Year Olds | 161 (71.2%) | 65 (28.8%) |
| 5 to 9 Year Old | 740 (97.0%) | 23 (3.0%) |
| 10 to 14 Year Olds | 1,069 (94.9%) | 57 (5.1%) |
| 15 to 17 Year Olds | 253 (86.4%) | 40 (13.7%) |
| 18 to 19 Year Olds | 174 (100.0%) | 0 (0.0%) |
| 20 to 24 Year Olds | 155 (57.6%) | 114 (42.4%) |
| 25 to 34 Year Olds | 40 (100.0%) | 0 (0.0%) |
| 35 Years and over | 82 (47.9%) | 89 (52.0%) |
| Total | 2,673 (87.3%) | 389 (12.7%) |
Educational Attainment by Field of Study in Pebble Creek
Engineering (600 | 15.3%), business (584 | 14.9%), science & technology (414 | 10.6%), social sciences (401 | 10.2%), and communications (296 | 7.5%) are the most common fields of study among 3,918 individuals in Pebble Creek who have obtained a bachelor's degree or higher.
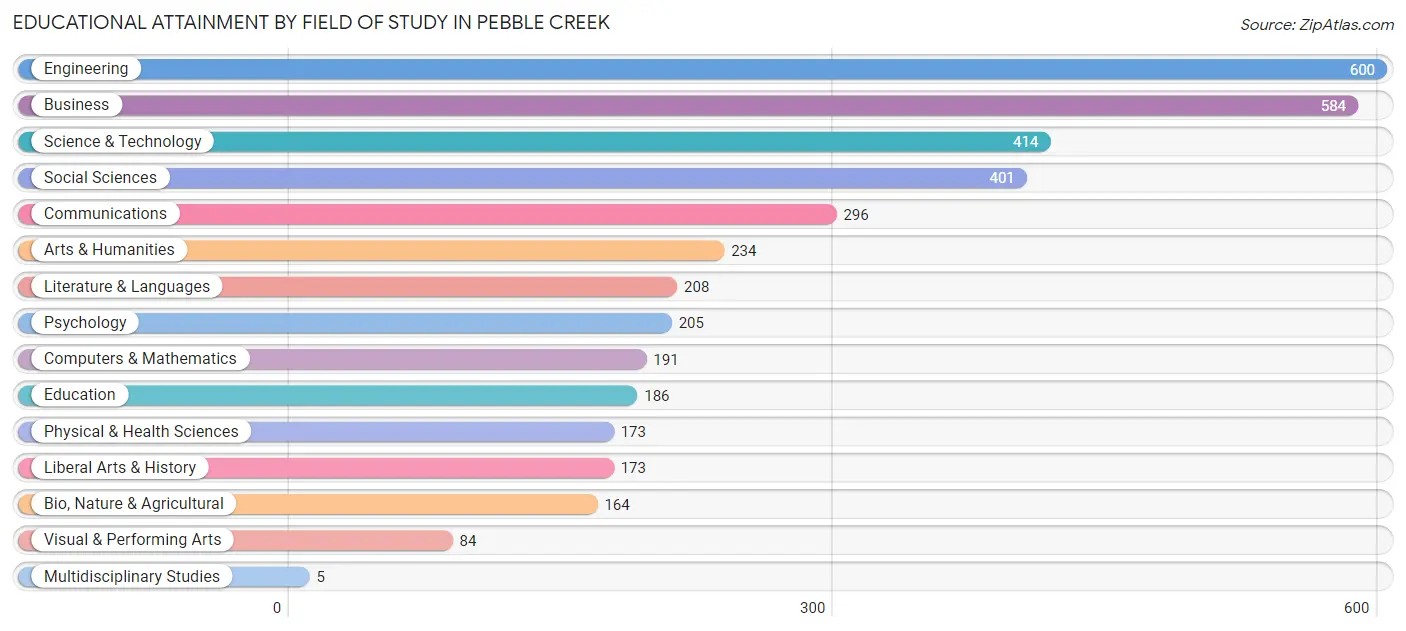
| Field of Study | # Graduates | % Graduates |
| Computers & Mathematics | 191 | 4.9% |
| Bio, Nature & Agricultural | 164 | 4.2% |
| Physical & Health Sciences | 173 | 4.4% |
| Psychology | 205 | 5.2% |
| Social Sciences | 401 | 10.2% |
| Engineering | 600 | 15.3% |
| Multidisciplinary Studies | 5 | 0.1% |
| Science & Technology | 414 | 10.6% |
| Business | 584 | 14.9% |
| Education | 186 | 4.8% |
| Literature & Languages | 208 | 5.3% |
| Liberal Arts & History | 173 | 4.4% |
| Visual & Performing Arts | 84 | 2.1% |
| Communications | 296 | 7.5% |
| Arts & Humanities | 234 | 6.0% |
| Total | 3,918 | 100.0% |
Transportation & Commute in Pebble Creek
Vehicle Availability by Sex in Pebble Creek
The most prevalent vehicle ownership categories in Pebble Creek are males with 2 vehicles (1,487, accounting for 47.6%) and females with 2 vehicles (1,142, making up 63.5%).
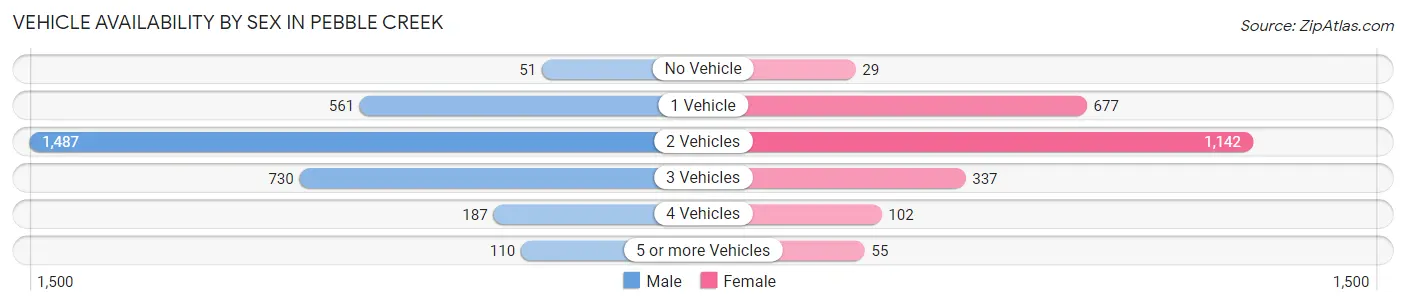
| Vehicles Available | Male | Female |
| No Vehicle | 51 (1.6%) | 29 (1.2%) |
| 1 Vehicle | 561 (17.9%) | 677 (28.9%) |
| 2 Vehicles | 1,487 (47.6%) | 1,142 (48.8%) |
| 3 Vehicles | 730 (23.4%) | 337 (14.4%) |
| 4 Vehicles | 187 (6.0%) | 102 (4.4%) |
| 5 or more Vehicles | 110 (3.5%) | 55 (2.4%) |
| Total | 3,126 (100.0%) | 2,342 (100.0%) |
Commute Time in Pebble Creek
The most frequently occuring commute durations in Pebble Creek are 30 to 34 minutes (740 commuters, 18.6%), 20 to 24 minutes (719 commuters, 18.1%), and 15 to 19 minutes (627 commuters, 15.8%).
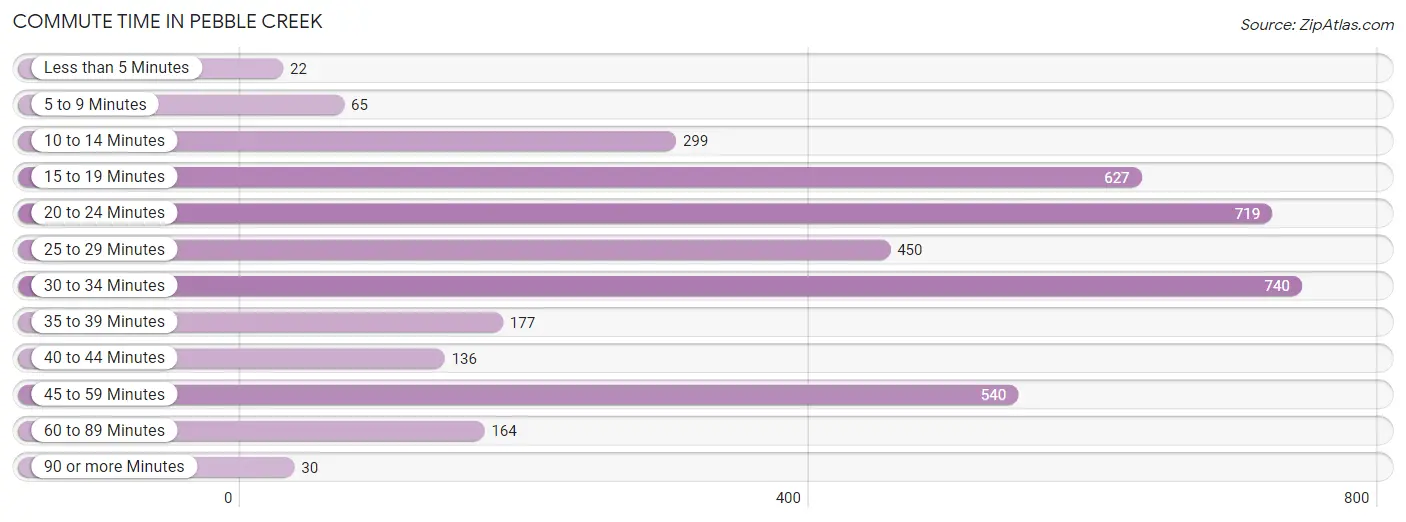
| Commute Time | # Commuters | % Commuters |
| Less than 5 Minutes | 22 | 0.5% |
| 5 to 9 Minutes | 65 | 1.6% |
| 10 to 14 Minutes | 299 | 7.5% |
| 15 to 19 Minutes | 627 | 15.8% |
| 20 to 24 Minutes | 719 | 18.1% |
| 25 to 29 Minutes | 450 | 11.3% |
| 30 to 34 Minutes | 740 | 18.6% |
| 35 to 39 Minutes | 177 | 4.5% |
| 40 to 44 Minutes | 136 | 3.4% |
| 45 to 59 Minutes | 540 | 13.6% |
| 60 to 89 Minutes | 164 | 4.1% |
| 90 or more Minutes | 30 | 0.8% |
Commute Time by Sex in Pebble Creek
The most common commute times in Pebble Creek are 30 to 34 minutes (556 commuters, 23.4%) for males and 20 to 24 minutes (338 commuters, 21.3%) for females.
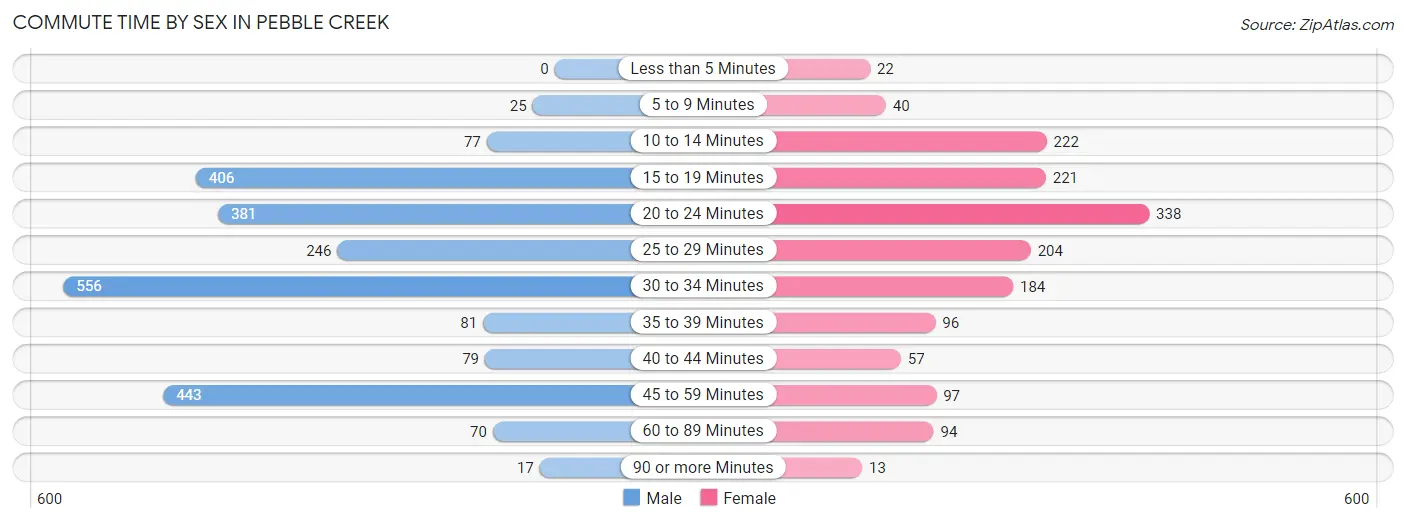
| Commute Time | Male | Female |
| Less than 5 Minutes | 0 (0.0%) | 22 (1.4%) |
| 5 to 9 Minutes | 25 (1.1%) | 40 (2.5%) |
| 10 to 14 Minutes | 77 (3.2%) | 222 (14.0%) |
| 15 to 19 Minutes | 406 (17.1%) | 221 (13.9%) |
| 20 to 24 Minutes | 381 (16.0%) | 338 (21.3%) |
| 25 to 29 Minutes | 246 (10.3%) | 204 (12.9%) |
| 30 to 34 Minutes | 556 (23.4%) | 184 (11.6%) |
| 35 to 39 Minutes | 81 (3.4%) | 96 (6.0%) |
| 40 to 44 Minutes | 79 (3.3%) | 57 (3.6%) |
| 45 to 59 Minutes | 443 (18.6%) | 97 (6.1%) |
| 60 to 89 Minutes | 70 (2.9%) | 94 (5.9%) |
| 90 or more Minutes | 17 (0.7%) | 13 (0.8%) |
Time of Departure to Work by Sex in Pebble Creek
The most frequent times of departure to work in Pebble Creek are 7:00 AM to 7:29 AM (486, 20.4%) for males and 7:00 AM to 7:29 AM (509, 32.1%) for females.
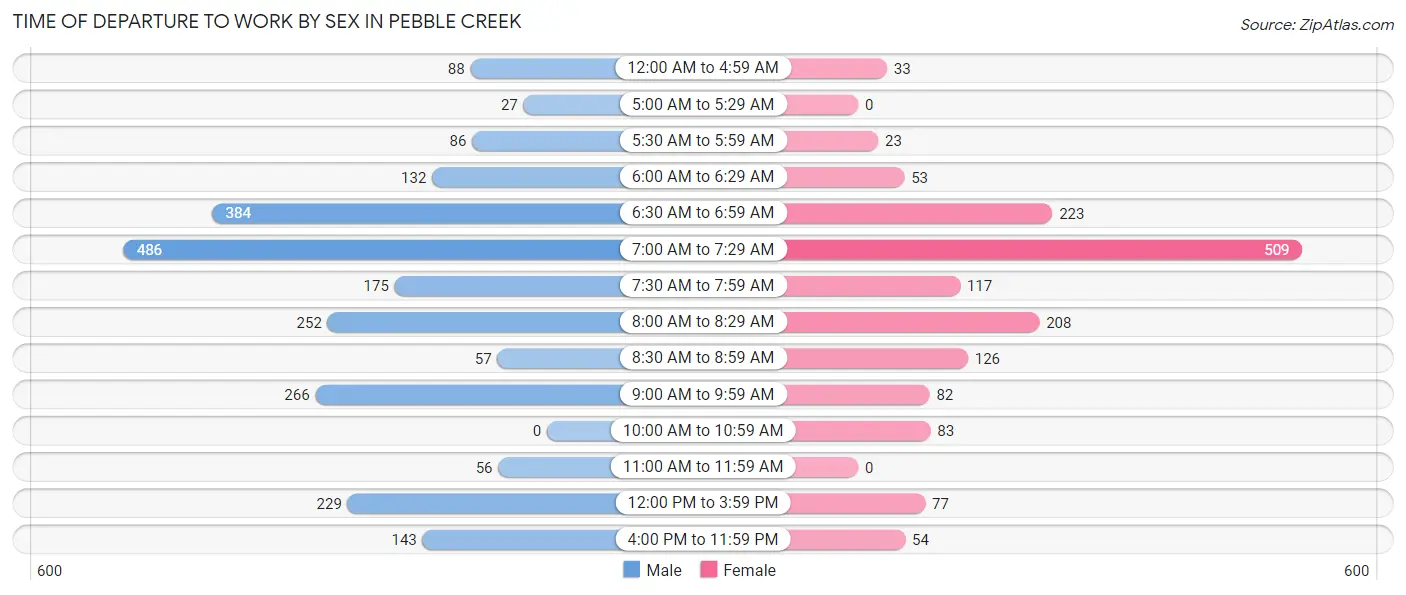
| Time of Departure | Male | Female |
| 12:00 AM to 4:59 AM | 88 (3.7%) | 33 (2.1%) |
| 5:00 AM to 5:29 AM | 27 (1.1%) | 0 (0.0%) |
| 5:30 AM to 5:59 AM | 86 (3.6%) | 23 (1.5%) |
| 6:00 AM to 6:29 AM | 132 (5.5%) | 53 (3.3%) |
| 6:30 AM to 6:59 AM | 384 (16.1%) | 223 (14.0%) |
| 7:00 AM to 7:29 AM | 486 (20.4%) | 509 (32.1%) |
| 7:30 AM to 7:59 AM | 175 (7.3%) | 117 (7.4%) |
| 8:00 AM to 8:29 AM | 252 (10.6%) | 208 (13.1%) |
| 8:30 AM to 8:59 AM | 57 (2.4%) | 126 (7.9%) |
| 9:00 AM to 9:59 AM | 266 (11.2%) | 82 (5.2%) |
| 10:00 AM to 10:59 AM | 0 (0.0%) | 83 (5.2%) |
| 11:00 AM to 11:59 AM | 56 (2.4%) | 0 (0.0%) |
| 12:00 PM to 3:59 PM | 229 (9.6%) | 77 (4.9%) |
| 4:00 PM to 11:59 PM | 143 (6.0%) | 54 (3.4%) |
| Total | 2,381 (100.0%) | 1,588 (100.0%) |
Housing Occupancy in Pebble Creek
Occupancy by Ownership in Pebble Creek
Of the total 3,567 dwellings in Pebble Creek, owner-occupied units account for 2,725 (76.4%), while renter-occupied units make up 842 (23.6%).
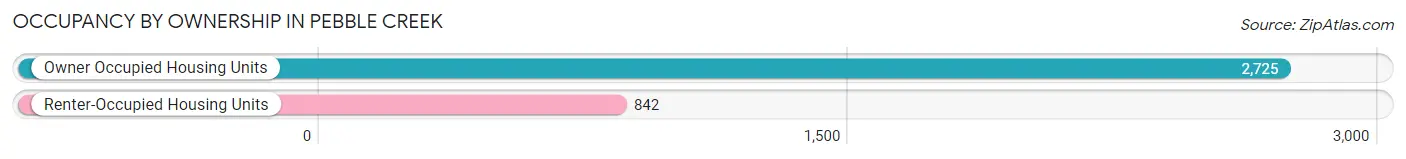
| Occupancy | # Housing Units | % Housing Units |
| Owner Occupied Housing Units | 2,725 | 76.4% |
| Renter-Occupied Housing Units | 842 | 23.6% |
| Total Occupied Housing Units | 3,567 | 100.0% |
Occupancy by Household Size in Pebble Creek
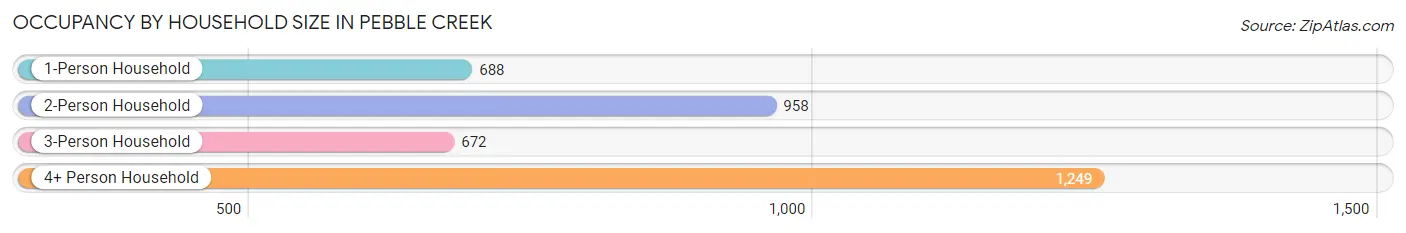
| Household Size | # Housing Units | % Housing Units |
| 1-Person Household | 688 | 19.3% |
| 2-Person Household | 958 | 26.9% |
| 3-Person Household | 672 | 18.8% |
| 4+ Person Household | 1,249 | 35.0% |
| Total Housing Units | 3,567 | 100.0% |
Occupancy by Ownership by Household Size in Pebble Creek
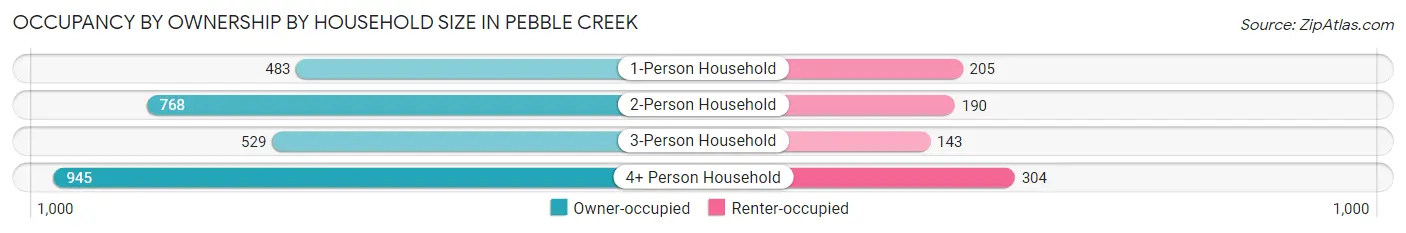
| Household Size | Owner-occupied | Renter-occupied |
| 1-Person Household | 483 (70.2%) | 205 (29.8%) |
| 2-Person Household | 768 (80.2%) | 190 (19.8%) |
| 3-Person Household | 529 (78.7%) | 143 (21.3%) |
| 4+ Person Household | 945 (75.7%) | 304 (24.3%) |
| Total Housing Units | 2,725 (76.4%) | 842 (23.6%) |
Occupancy by Educational Attainment in Pebble Creek
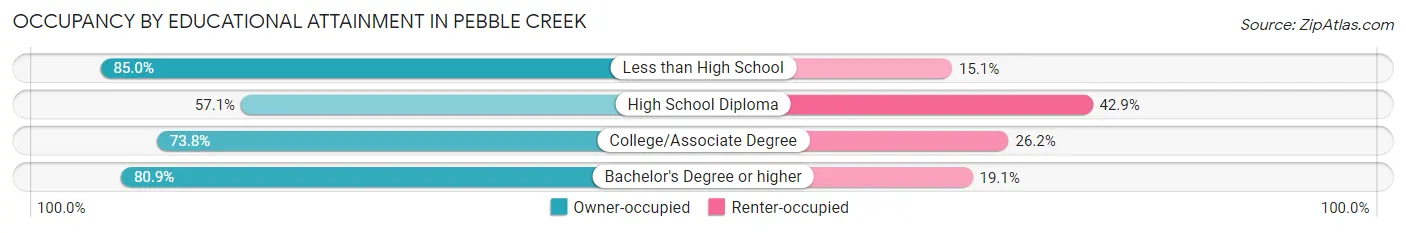
| Household Size | Owner-occupied | Renter-occupied |
| Less than High School | 79 (85.0%) | 14 (15.0%) |
| High School Diploma | 221 (57.1%) | 166 (42.9%) |
| College/Associate Degree | 745 (73.8%) | 265 (26.2%) |
| Bachelor's Degree or higher | 1,680 (80.9%) | 397 (19.1%) |
Occupancy by Age of Householder in Pebble Creek
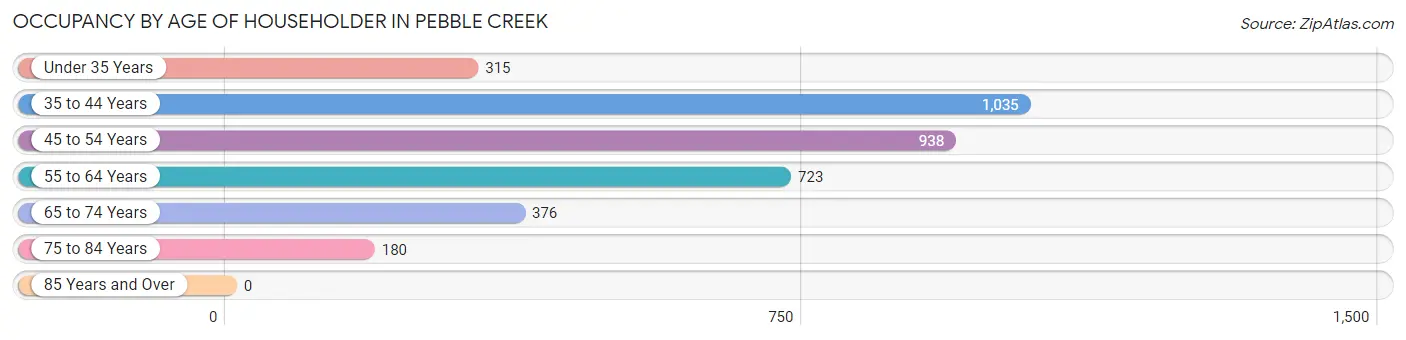
| Age Bracket | # Households | % Households |
| Under 35 Years | 315 | 8.8% |
| 35 to 44 Years | 1,035 | 29.0% |
| 45 to 54 Years | 938 | 26.3% |
| 55 to 64 Years | 723 | 20.3% |
| 65 to 74 Years | 376 | 10.5% |
| 75 to 84 Years | 180 | 5.1% |
| 85 Years and Over | 0 | 0.0% |
| Total | 3,567 | 100.0% |
Housing Finances in Pebble Creek
Median Income by Occupancy in Pebble Creek
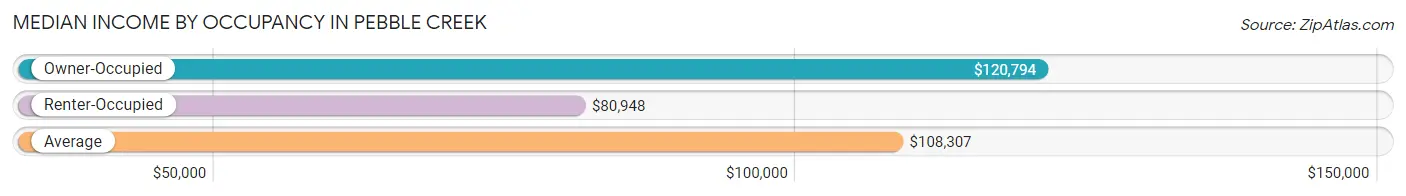
| Occupancy Type | # Households | Median Income |
| Owner-Occupied | 2,725 (76.4%) | $120,794 |
| Renter-Occupied | 842 (23.6%) | $80,948 |
| Average | 3,567 (100.0%) | $108,307 |
Occupancy by Householder Income Bracket in Pebble Creek
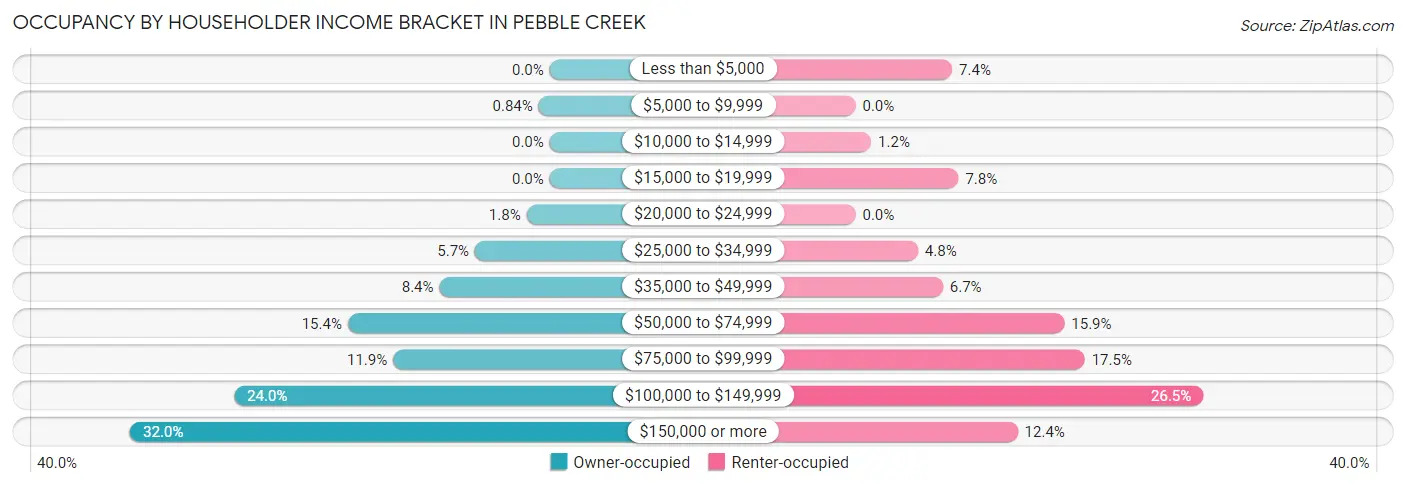
| Income Bracket | Owner-occupied | Renter-occupied |
| Less than $5,000 | 0 (0.0%) | 62 (7.4%) |
| $5,000 to $9,999 | 23 (0.8%) | 0 (0.0%) |
| $10,000 to $14,999 | 0 (0.0%) | 10 (1.2%) |
| $15,000 to $19,999 | 0 (0.0%) | 66 (7.8%) |
| $20,000 to $24,999 | 48 (1.8%) | 0 (0.0%) |
| $25,000 to $34,999 | 155 (5.7%) | 40 (4.8%) |
| $35,000 to $49,999 | 229 (8.4%) | 56 (6.7%) |
| $50,000 to $74,999 | 419 (15.4%) | 134 (15.9%) |
| $75,000 to $99,999 | 325 (11.9%) | 147 (17.5%) |
| $100,000 to $149,999 | 655 (24.0%) | 223 (26.5%) |
| $150,000 or more | 871 (32.0%) | 104 (12.3%) |
| Total | 2,725 (100.0%) | 842 (100.0%) |
Monthly Housing Cost Tiers in Pebble Creek
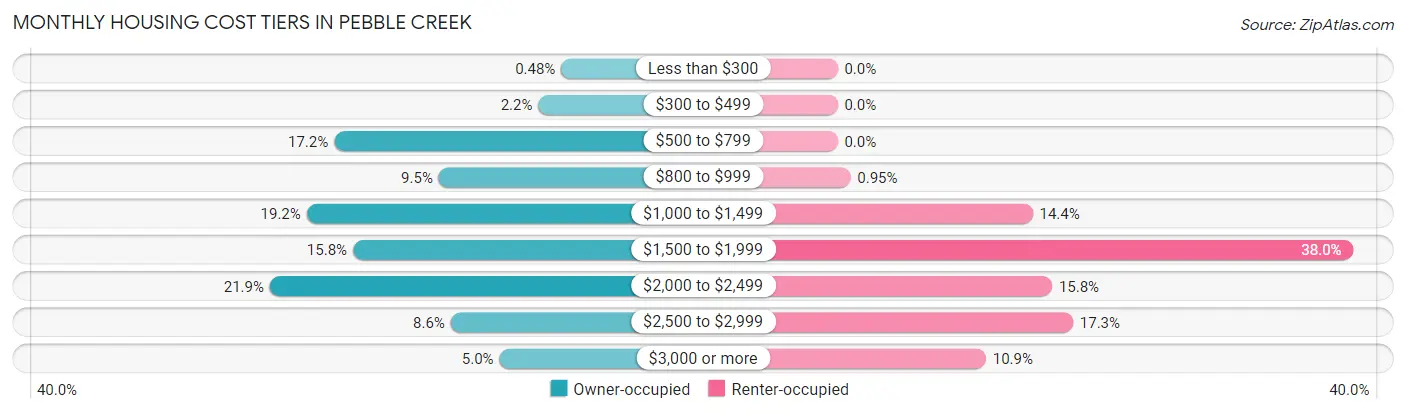
| Monthly Cost | Owner-occupied | Renter-occupied |
| Less than $300 | 13 (0.5%) | 0 (0.0%) |
| $300 to $499 | 59 (2.2%) | 0 (0.0%) |
| $500 to $799 | 469 (17.2%) | 0 (0.0%) |
| $800 to $999 | 259 (9.5%) | 8 (0.9%) |
| $1,000 to $1,499 | 524 (19.2%) | 121 (14.4%) |
| $1,500 to $1,999 | 431 (15.8%) | 320 (38.0%) |
| $2,000 to $2,499 | 598 (21.9%) | 133 (15.8%) |
| $2,500 to $2,999 | 235 (8.6%) | 146 (17.3%) |
| $3,000 or more | 137 (5.0%) | 92 (10.9%) |
| Total | 2,725 (100.0%) | 842 (100.0%) |
Physical Housing Characteristics in Pebble Creek
Housing Structures in Pebble Creek
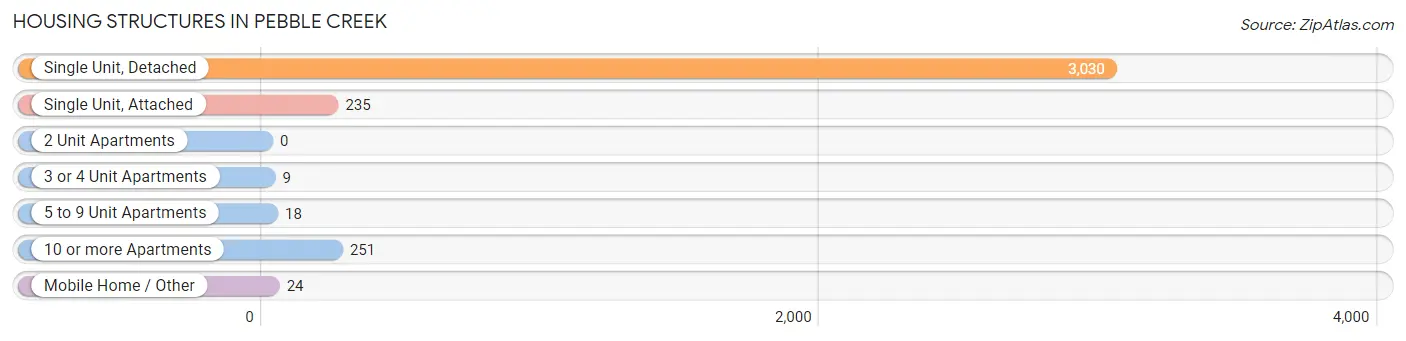
| Structure Type | # Housing Units | % Housing Units |
| Single Unit, Detached | 3,030 | 85.0% |
| Single Unit, Attached | 235 | 6.6% |
| 2 Unit Apartments | 0 | 0.0% |
| 3 or 4 Unit Apartments | 9 | 0.3% |
| 5 to 9 Unit Apartments | 18 | 0.5% |
| 10 or more Apartments | 251 | 7.0% |
| Mobile Home / Other | 24 | 0.7% |
| Total | 3,567 | 100.0% |
Housing Structures by Occupancy in Pebble Creek
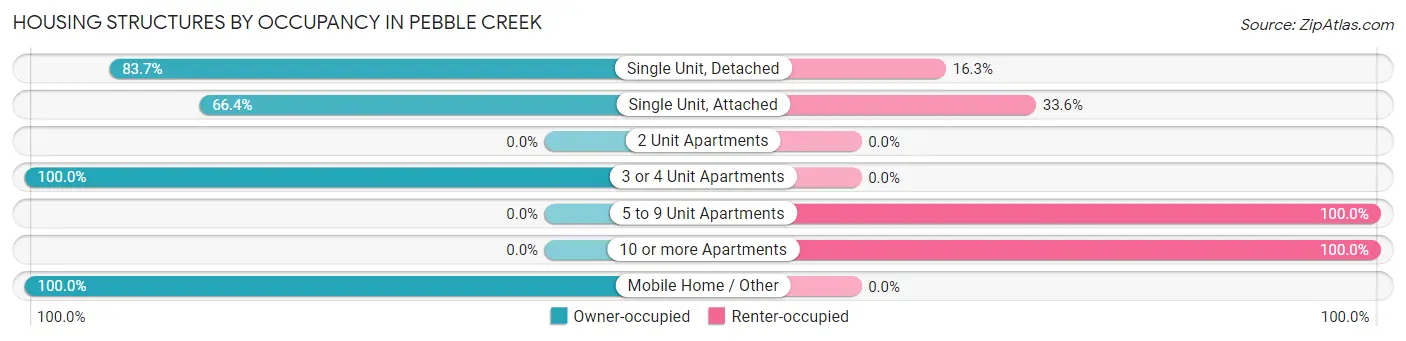
| Structure Type | Owner-occupied | Renter-occupied |
| Single Unit, Detached | 2,536 (83.7%) | 494 (16.3%) |
| Single Unit, Attached | 156 (66.4%) | 79 (33.6%) |
| 2 Unit Apartments | 0 (0.0%) | 0 (0.0%) |
| 3 or 4 Unit Apartments | 9 (100.0%) | 0 (0.0%) |
| 5 to 9 Unit Apartments | 0 (0.0%) | 18 (100.0%) |
| 10 or more Apartments | 0 (0.0%) | 251 (100.0%) |
| Mobile Home / Other | 24 (100.0%) | 0 (0.0%) |
| Total | 2,725 (76.4%) | 842 (23.6%) |
Housing Structures by Number of Rooms in Pebble Creek
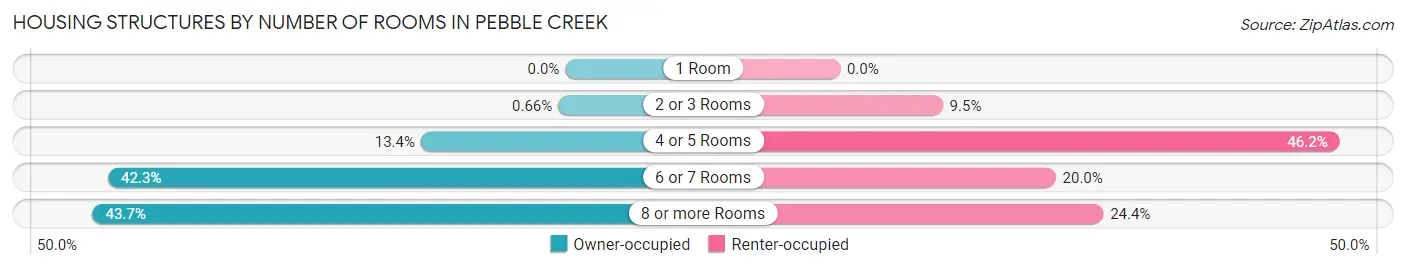
| Number of Rooms | Owner-occupied | Renter-occupied |
| 1 Room | 0 (0.0%) | 0 (0.0%) |
| 2 or 3 Rooms | 18 (0.7%) | 80 (9.5%) |
| 4 or 5 Rooms | 364 (13.4%) | 389 (46.2%) |
| 6 or 7 Rooms | 1,152 (42.3%) | 168 (20.0%) |
| 8 or more Rooms | 1,191 (43.7%) | 205 (24.3%) |
| Total | 2,725 (100.0%) | 842 (100.0%) |
Housing Structure by Heating Type in Pebble Creek
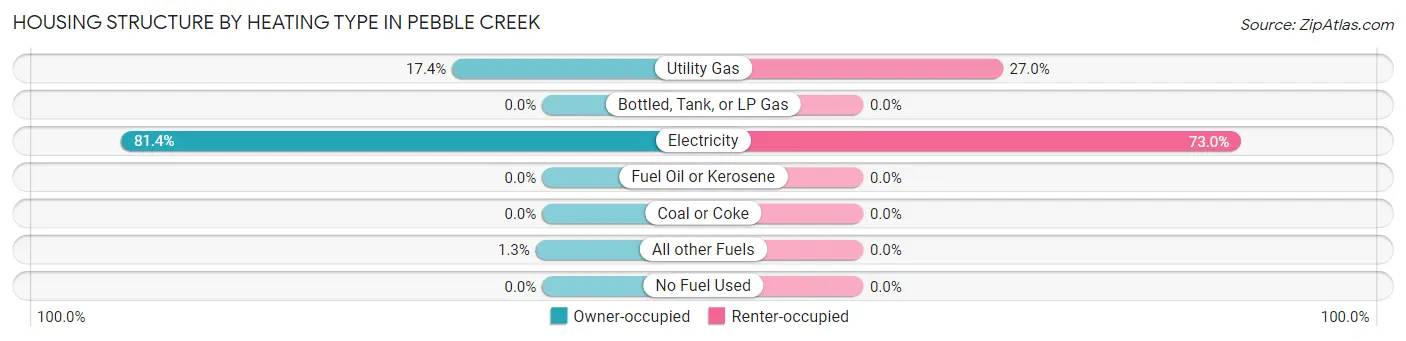
| Heating Type | Owner-occupied | Renter-occupied |
| Utility Gas | 474 (17.4%) | 227 (27.0%) |
| Bottled, Tank, or LP Gas | 0 (0.0%) | 0 (0.0%) |
| Electricity | 2,217 (81.4%) | 615 (73.0%) |
| Fuel Oil or Kerosene | 0 (0.0%) | 0 (0.0%) |
| Coal or Coke | 0 (0.0%) | 0 (0.0%) |
| All other Fuels | 34 (1.3%) | 0 (0.0%) |
| No Fuel Used | 0 (0.0%) | 0 (0.0%) |
| Total | 2,725 (100.0%) | 842 (100.0%) |
Household Vehicle Usage in Pebble Creek
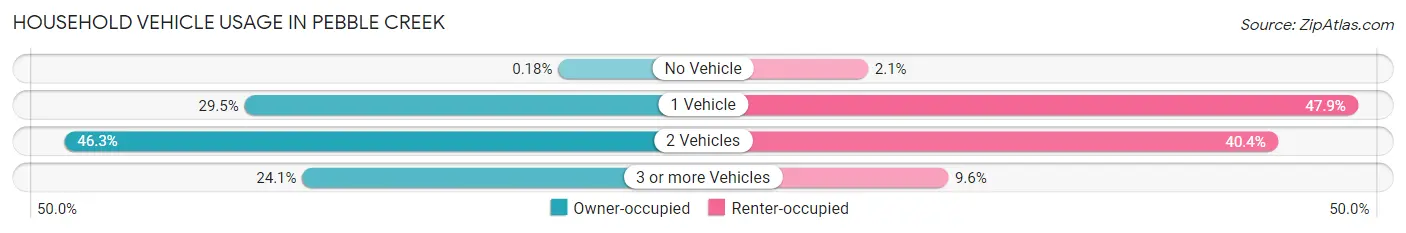
| Vehicles per Household | Owner-occupied | Renter-occupied |
| No Vehicle | 5 (0.2%) | 18 (2.1%) |
| 1 Vehicle | 803 (29.5%) | 403 (47.9%) |
| 2 Vehicles | 1,261 (46.3%) | 340 (40.4%) |
| 3 or more Vehicles | 656 (24.1%) | 81 (9.6%) |
| Total | 2,725 (100.0%) | 842 (100.0%) |
Real Estate & Mortgages in Pebble Creek
Real Estate and Mortgage Overview in Pebble Creek
| Characteristic | Without Mortgage | With Mortgage |
| Housing Units | 976 | 1,749 |
| Median Property Value | $344,200 | $370,300 |
| Median Household Income | $133,203 | $462 |
| Monthly Housing Costs | $792 | $137 |
| Real Estate Taxes | $4,825 | $79 |
Property Value by Mortgage Status in Pebble Creek
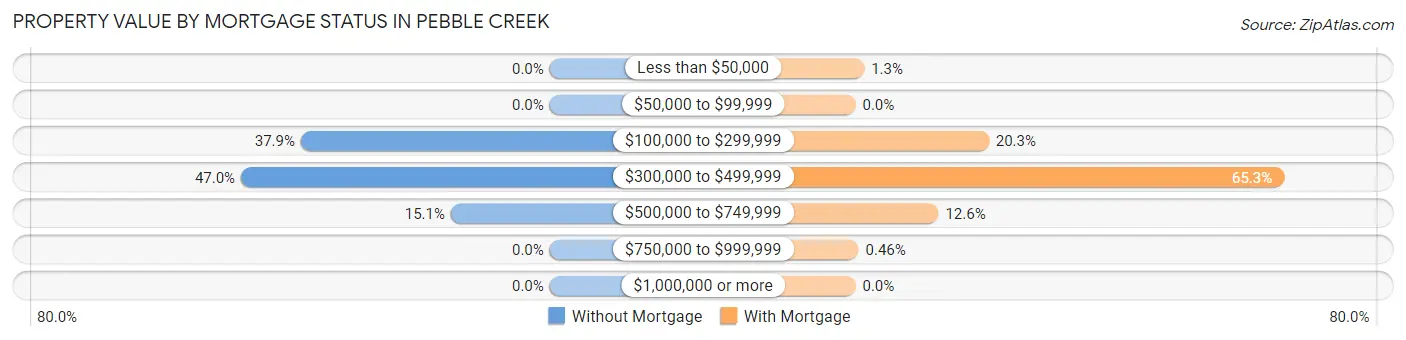
| Property Value | Without Mortgage | With Mortgage |
| Less than $50,000 | 0 (0.0%) | 23 (1.3%) |
| $50,000 to $99,999 | 0 (0.0%) | 0 (0.0%) |
| $100,000 to $299,999 | 370 (37.9%) | 355 (20.3%) |
| $300,000 to $499,999 | 459 (47.0%) | 1,142 (65.3%) |
| $500,000 to $749,999 | 147 (15.1%) | 221 (12.6%) |
| $750,000 to $999,999 | 0 (0.0%) | 8 (0.5%) |
| $1,000,000 or more | 0 (0.0%) | 0 (0.0%) |
| Total | 976 (100.0%) | 1,749 (100.0%) |
Household Income by Mortgage Status in Pebble Creek
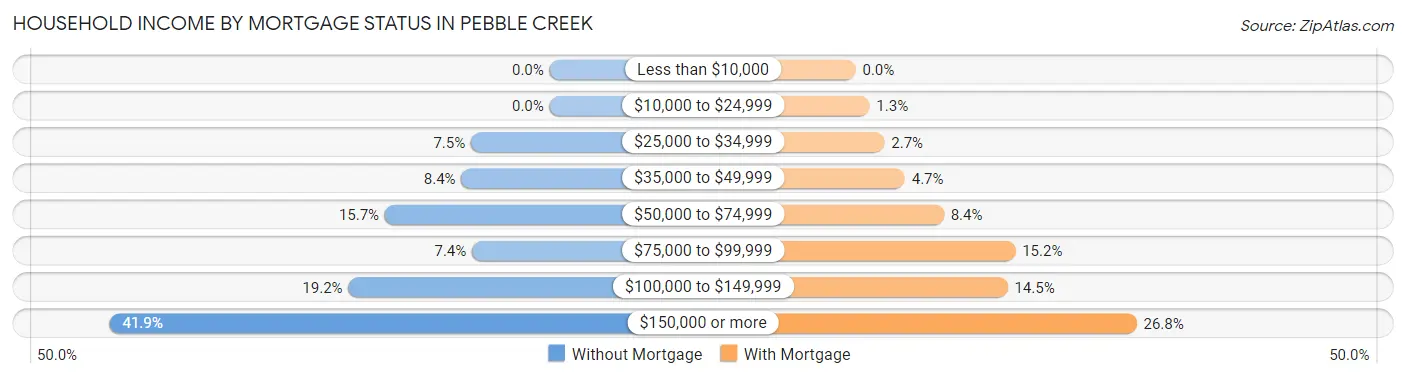
| Household Income | Without Mortgage | With Mortgage |
| Less than $10,000 | 0 (0.0%) | 0 (0.0%) |
| $10,000 to $24,999 | 0 (0.0%) | 23 (1.3%) |
| $25,000 to $34,999 | 73 (7.5%) | 48 (2.7%) |
| $35,000 to $49,999 | 82 (8.4%) | 82 (4.7%) |
| $50,000 to $74,999 | 153 (15.7%) | 147 (8.4%) |
| $75,000 to $99,999 | 72 (7.4%) | 266 (15.2%) |
| $100,000 to $149,999 | 187 (19.2%) | 253 (14.5%) |
| $150,000 or more | 409 (41.9%) | 468 (26.8%) |
| Total | 976 (100.0%) | 1,749 (100.0%) |
Property Value to Household Income Ratio in Pebble Creek
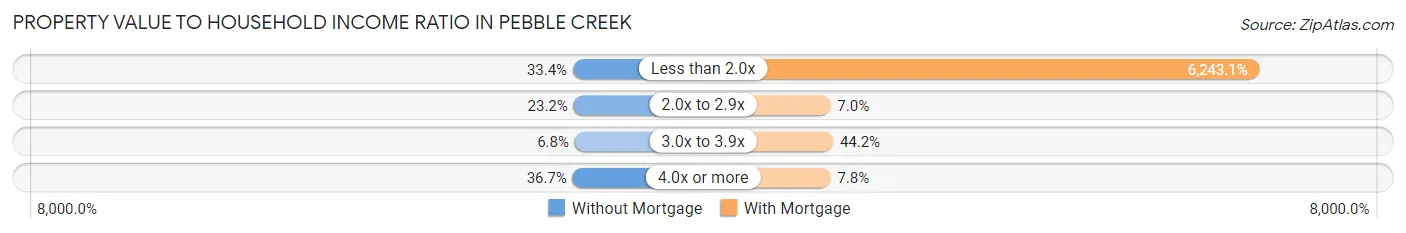
| Value-to-Income Ratio | Without Mortgage | With Mortgage |
| Less than 2.0x | 326 (33.4%) | 109,191 (6,243.1%) |
| 2.0x to 2.9x | 226 (23.2%) | 123 (7.0%) |
| 3.0x to 3.9x | 66 (6.8%) | 773 (44.2%) |
| 4.0x or more | 358 (36.7%) | 136 (7.8%) |
| Total | 976 (100.0%) | 1,749 (100.0%) |
Real Estate Taxes by Mortgage Status in Pebble Creek
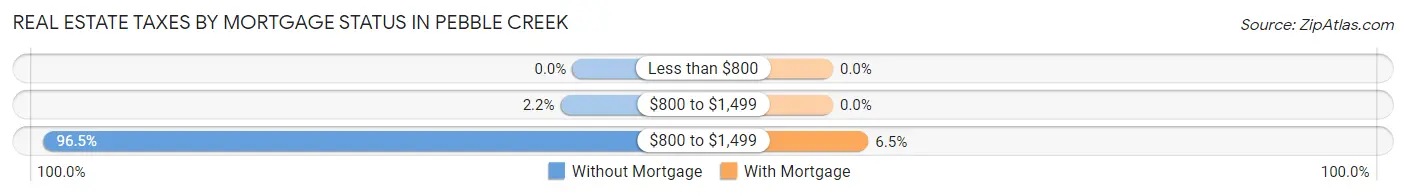
| Property Taxes | Without Mortgage | With Mortgage |
| Less than $800 | 0 (0.0%) | 0 (0.0%) |
| $800 to $1,499 | 21 (2.1%) | 0 (0.0%) |
| $800 to $1,499 | 942 (96.5%) | 113 (6.5%) |
| Total | 976 (100.0%) | 1,749 (100.0%) |
Health & Disability in Pebble Creek
Health Insurance Coverage by Age in Pebble Creek
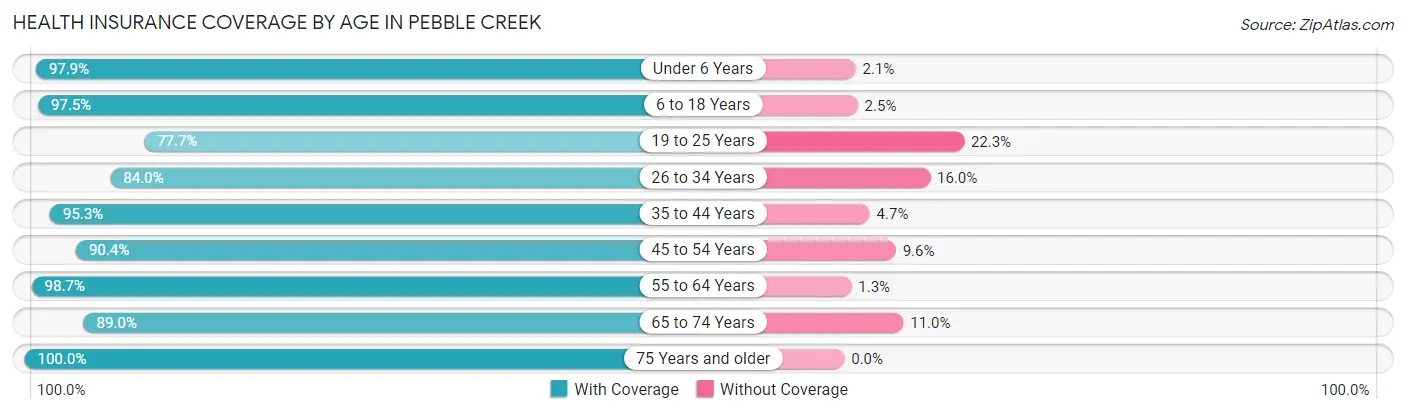
| Age Bracket | With Coverage | Without Coverage |
| Under 6 Years | 1,069 (97.9%) | 23 (2.1%) |
| 6 to 18 Years | 2,112 (97.5%) | 54 (2.5%) |
| 19 to 25 Years | 519 (77.7%) | 149 (22.3%) |
| 26 to 34 Years | 546 (84.0%) | 104 (16.0%) |
| 35 to 44 Years | 2,256 (95.3%) | 112 (4.7%) |
| 45 to 54 Years | 1,376 (90.4%) | 146 (9.6%) |
| 55 to 64 Years | 1,205 (98.7%) | 16 (1.3%) |
| 65 to 74 Years | 825 (89.0%) | 102 (11.0%) |
| 75 Years and older | 348 (100.0%) | 0 (0.0%) |
| Total | 10,256 (93.6%) | 706 (6.4%) |
Health Insurance Coverage by Citizenship Status in Pebble Creek
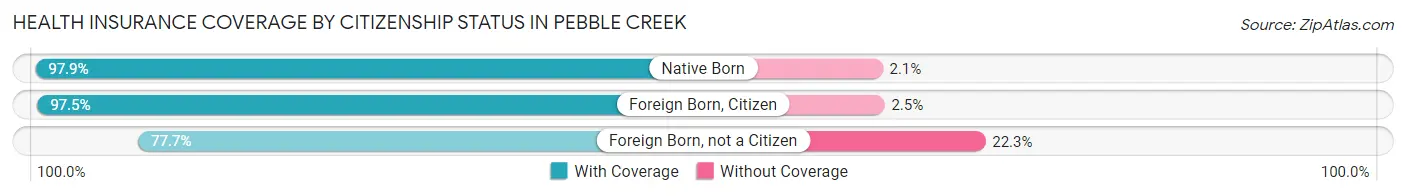
| Citizenship Status | With Coverage | Without Coverage |
| Native Born | 1,069 (97.9%) | 23 (2.1%) |
| Foreign Born, Citizen | 2,112 (97.5%) | 54 (2.5%) |
| Foreign Born, not a Citizen | 519 (77.7%) | 149 (22.3%) |
Health Insurance Coverage by Household Income in Pebble Creek
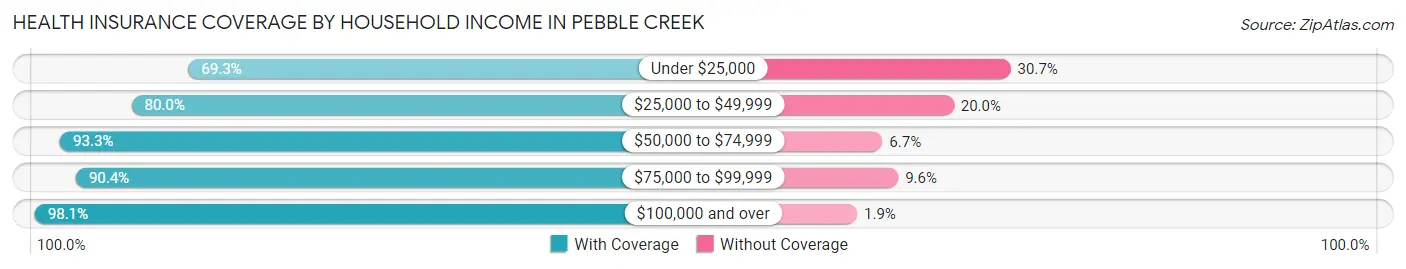
| Household Income | With Coverage | Without Coverage |
| Under $25,000 | 368 (69.3%) | 163 (30.7%) |
| $25,000 to $49,999 | 818 (80.0%) | 205 (20.0%) |
| $50,000 to $74,999 | 1,148 (93.3%) | 82 (6.7%) |
| $75,000 to $99,999 | 1,154 (90.4%) | 123 (9.6%) |
| $100,000 and over | 6,768 (98.1%) | 133 (1.9%) |
Public vs Private Health Insurance Coverage by Age in Pebble Creek
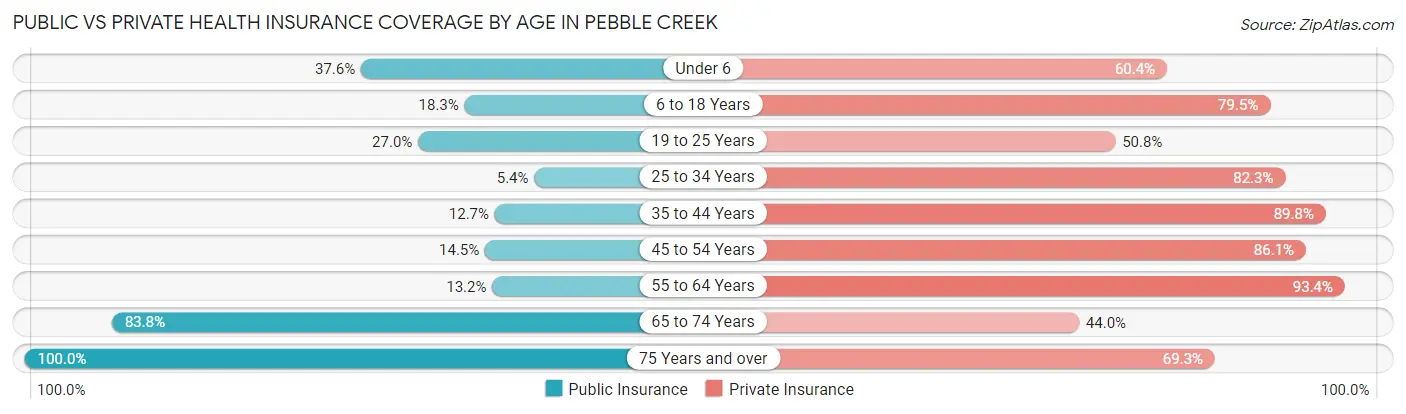
| Age Bracket | Public Insurance | Private Insurance |
| Under 6 | 410 (37.6%) | 659 (60.4%) |
| 6 to 18 Years | 397 (18.3%) | 1,722 (79.5%) |
| 19 to 25 Years | 180 (27.0%) | 339 (50.7%) |
| 25 to 34 Years | 35 (5.4%) | 535 (82.3%) |
| 35 to 44 Years | 301 (12.7%) | 2,127 (89.8%) |
| 45 to 54 Years | 221 (14.5%) | 1,311 (86.1%) |
| 55 to 64 Years | 161 (13.2%) | 1,140 (93.4%) |
| 65 to 74 Years | 777 (83.8%) | 408 (44.0%) |
| 75 Years and over | 348 (100.0%) | 241 (69.3%) |
| Total | 2,830 (25.8%) | 8,482 (77.4%) |
Disability Status by Sex by Age in Pebble Creek
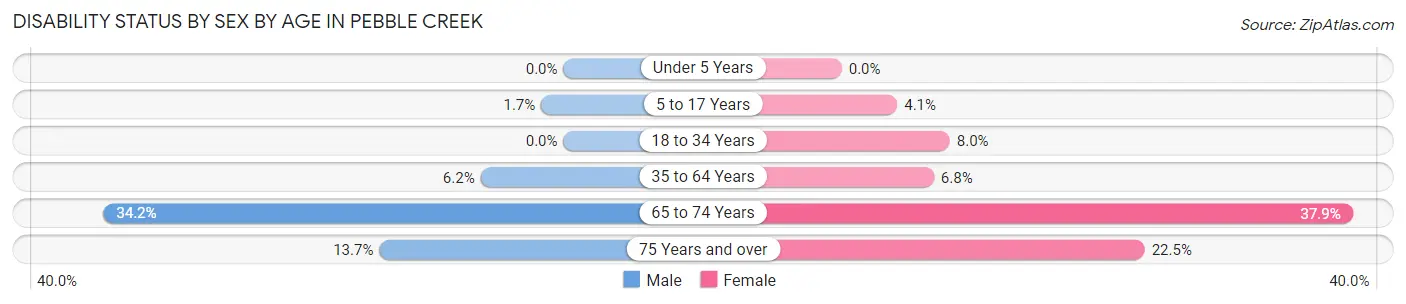
| Age Bracket | Male | Female |
| Under 5 Years | 0 (0.0%) | 0 (0.0%) |
| 5 to 17 Years | 18 (1.7%) | 46 (4.1%) |
| 18 to 34 Years | 0 (0.0%) | 63 (8.0%) |
| 35 to 64 Years | 156 (6.1%) | 176 (6.8%) |
| 65 to 74 Years | 195 (34.2%) | 135 (37.9%) |
| 75 Years and over | 19 (13.7%) | 47 (22.5%) |
Disability Class by Sex by Age in Pebble Creek
Disability Class: Hearing Difficulty
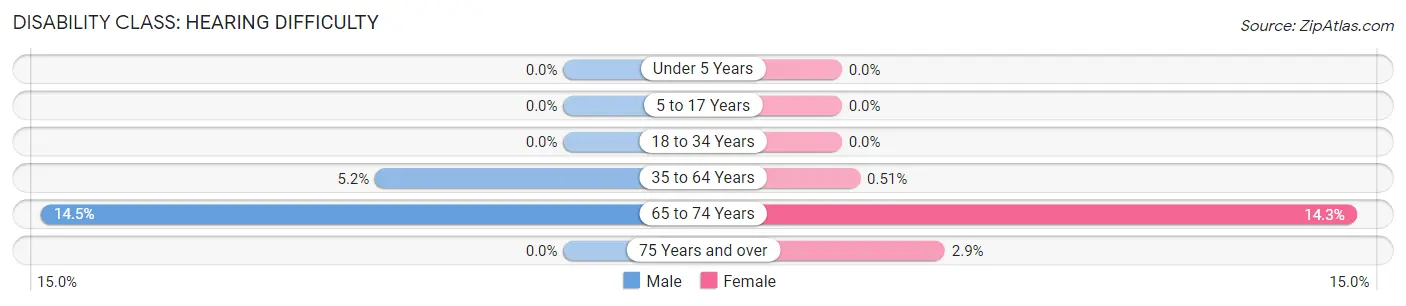
| Age Bracket | Male | Female |
| Under 5 Years | 0 (0.0%) | 0 (0.0%) |
| 5 to 17 Years | 0 (0.0%) | 0 (0.0%) |
| 18 to 34 Years | 0 (0.0%) | 0 (0.0%) |
| 35 to 64 Years | 133 (5.2%) | 13 (0.5%) |
| 65 to 74 Years | 83 (14.5%) | 51 (14.3%) |
| 75 Years and over | 0 (0.0%) | 6 (2.9%) |
Disability Class: Vision Difficulty
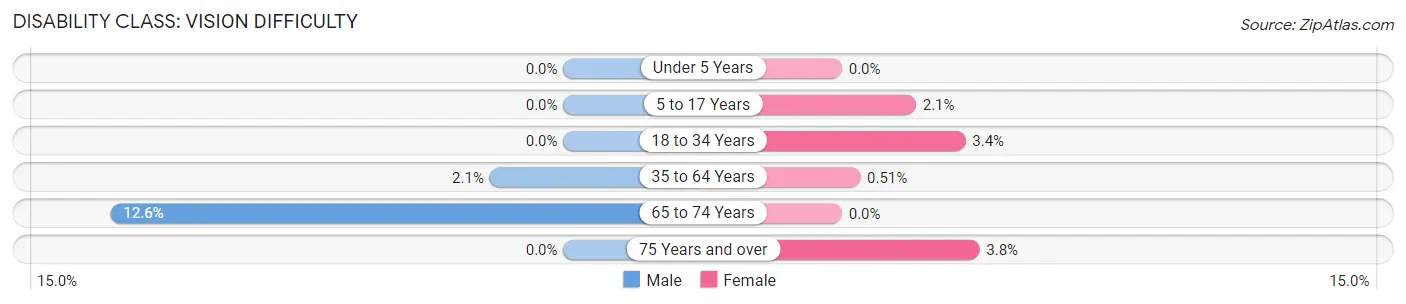
| Age Bracket | Male | Female |
| Under 5 Years | 0 (0.0%) | 0 (0.0%) |
| 5 to 17 Years | 0 (0.0%) | 23 (2.1%) |
| 18 to 34 Years | 0 (0.0%) | 27 (3.4%) |
| 35 to 64 Years | 52 (2.1%) | 13 (0.5%) |
| 65 to 74 Years | 72 (12.6%) | 0 (0.0%) |
| 75 Years and over | 0 (0.0%) | 8 (3.8%) |
Disability Class: Cognitive Difficulty
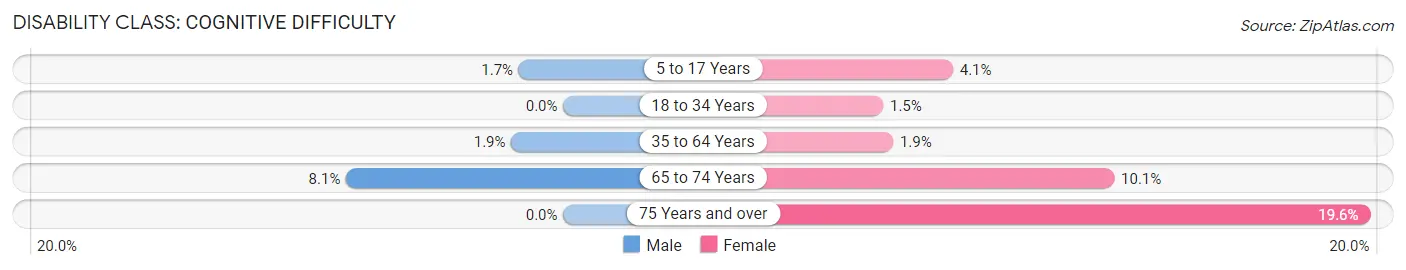
| Age Bracket | Male | Female |
| 5 to 17 Years | 18 (1.7%) | 46 (4.1%) |
| 18 to 34 Years | 0 (0.0%) | 12 (1.5%) |
| 35 to 64 Years | 49 (1.9%) | 49 (1.9%) |
| 65 to 74 Years | 46 (8.1%) | 36 (10.1%) |
| 75 Years and over | 0 (0.0%) | 41 (19.6%) |
Disability Class: Ambulatory Difficulty
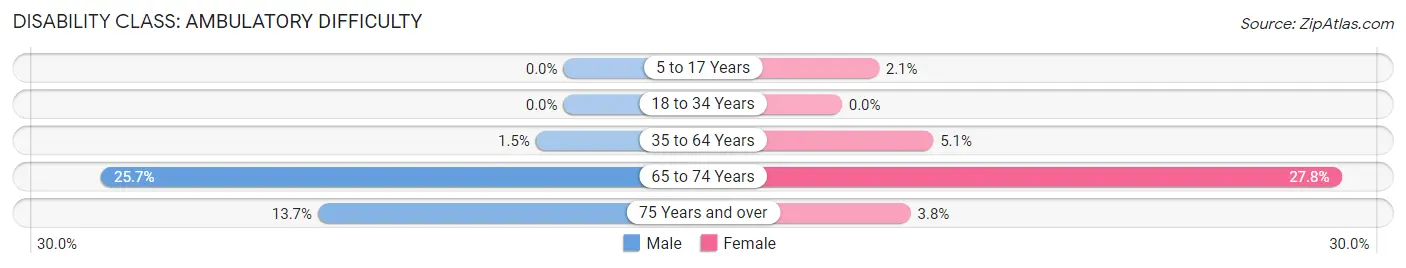
| Age Bracket | Male | Female |
| 5 to 17 Years | 0 (0.0%) | 23 (2.1%) |
| 18 to 34 Years | 0 (0.0%) | 0 (0.0%) |
| 35 to 64 Years | 39 (1.5%) | 131 (5.1%) |
| 65 to 74 Years | 147 (25.7%) | 99 (27.8%) |
| 75 Years and over | 19 (13.7%) | 8 (3.8%) |
Disability Class: Self-Care Difficulty
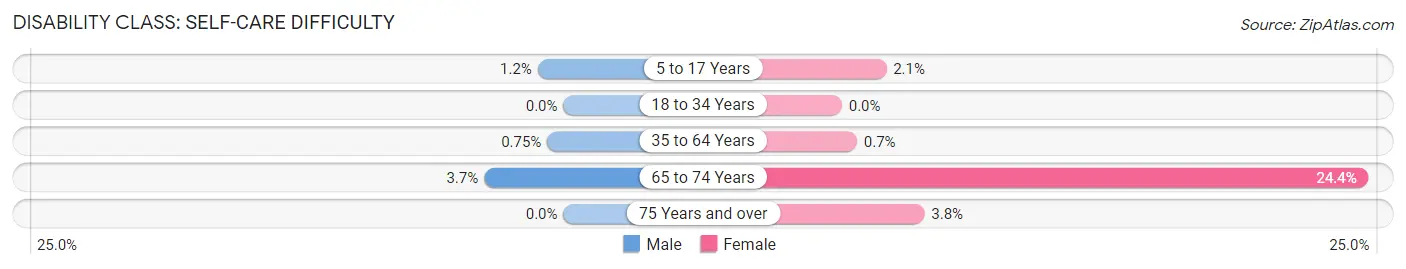
| Age Bracket | Male | Female |
| 5 to 17 Years | 13 (1.2%) | 23 (2.1%) |
| 18 to 34 Years | 0 (0.0%) | 0 (0.0%) |
| 35 to 64 Years | 19 (0.7%) | 18 (0.7%) |
| 65 to 74 Years | 21 (3.7%) | 87 (24.4%) |
| 75 Years and over | 0 (0.0%) | 8 (3.8%) |
Technology Access in Pebble Creek
Computing Device Access in Pebble Creek
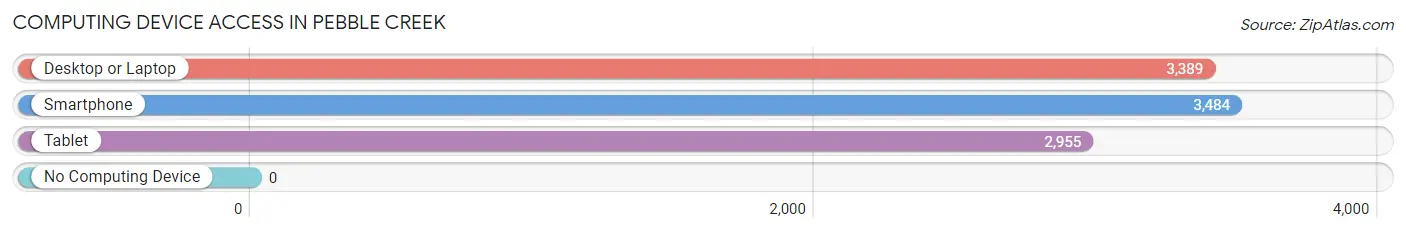
| Device Type | # Households | % Households |
| Desktop or Laptop | 3,389 | 95.0% |
| Smartphone | 3,484 | 97.7% |
| Tablet | 2,955 | 82.8% |
| No Computing Device | 0 | 0.0% |
| Total | 3,567 | 100.0% |
Internet Access in Pebble Creek
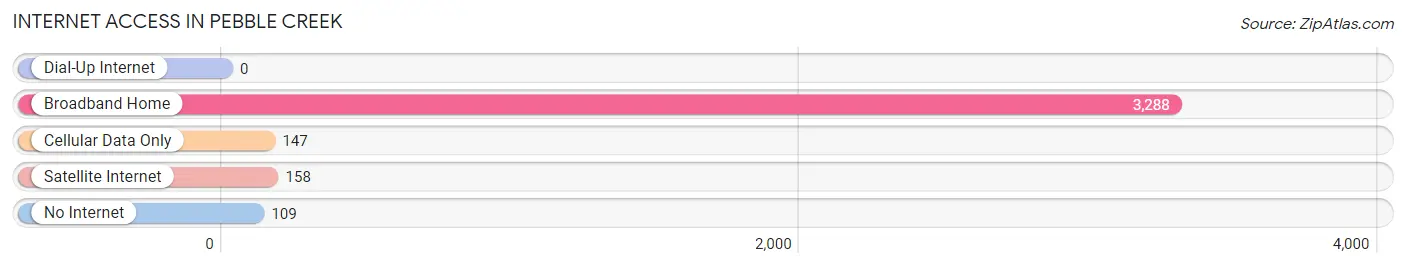
| Internet Type | # Households | % Households |
| Dial-Up Internet | 0 | 0.0% |
| Broadband Home | 3,288 | 92.2% |
| Cellular Data Only | 147 | 4.1% |
| Satellite Internet | 158 | 4.4% |
| No Internet | 109 | 3.1% |
| Total | 3,567 | 100.0% |
Pebble Creek Summary
Pebble Creek is a small unincorporated community located in Pasco County, Florida. It is situated approximately 25 miles north of Tampa and is part of the Tampa-St. Petersburg-Clearwater Metropolitan Statistical Area. The community is bordered by the Anclote River to the east and the Hillsborough River to the west.
History
The area that is now known as Pebble Creek was originally inhabited by the Tocobaga Indians. The first European settlers arrived in the area in the late 1800s and began to establish homesteads. The area was known as “Pebble Creek” due to the abundance of small pebbles found in the creek that ran through the area.
In the early 1900s, the area began to develop as a farming community. The first post office was established in the area in 1910 and the first school was built in 1912. The area continued to grow and by the 1950s, the population had grown to over 500 people.
Geography
Pebble Creek is located in Pasco County, Florida. It is situated approximately 25 miles north of Tampa and is part of the Tampa-St. Petersburg-Clearwater Metropolitan Statistical Area. The community is bordered by the Anclote River to the east and the Hillsborough River to the west.
The area is mostly flat and is covered in pine and palmetto trees. The soil is sandy and the climate is humid subtropical. The average temperature in the summer is around 90 degrees Fahrenheit and the average temperature in the winter is around 60 degrees Fahrenheit.
Economy
The economy of Pebble Creek is largely based on agriculture. The area is home to several farms that produce a variety of crops including citrus, vegetables, and hay. The area is also home to several nurseries that specialize in growing ornamental plants.
In addition to agriculture, the area is also home to several small businesses. These businesses include restaurants, convenience stores, and auto repair shops.
Demographics
As of the 2010 census, the population of Pebble Creek was 1,845. The racial makeup of the area was 94.3% White, 2.2% African American, 0.7% Native American, 0.7% Asian, 0.2% Pacific Islander, and 1.9% from other races. The median household income was $45,000 and the median age was 43.
Conclusion
Pebble Creek is a small unincorporated community located in Pasco County, Florida. It is situated approximately 25 miles north of Tampa and is part of the Tampa-St. Petersburg-Clearwater Metropolitan Statistical Area. The community is bordered by the Anclote River to the east and the Hillsborough River to the west. The area was originally inhabited by the Tocobaga Indians and was later settled by European settlers in the late 1800s. The economy of Pebble Creek is largely based on agriculture and small businesses. As of the 2010 census, the population of Pebble Creek was 1,845.
Common Questions
What is Per Capita Income in Pebble Creek?
Per Capita income in Pebble Creek is $38,269.
What is the Median Family Income in Pebble Creek?
Median Family Income in Pebble Creek is $122,203.
What is the Median Household income in Pebble Creek?
Median Household Income in Pebble Creek is $108,307.
What is Income or Wage Gap in Pebble Creek?
Income or Wage Gap in Pebble Creek is 31.4%.
Women in Pebble Creek earn 68.6 cents for every dollar earned by a man.
What is Inequality or Gini Index in Pebble Creek?
Inequality or Gini Index in Pebble Creek is 0.35.
What is the Total Population of Pebble Creek?
Total Population of Pebble Creek is 10,976.
What is the Total Male Population of Pebble Creek?
Total Male Population of Pebble Creek is 5,499.
What is the Total Female Population of Pebble Creek?
Total Female Population of Pebble Creek is 5,477.
What is the Ratio of Males per 100 Females in Pebble Creek?
There are 100.40 Males per 100 Females in Pebble Creek.
What is the Ratio of Females per 100 Males in Pebble Creek?
There are 99.60 Females per 100 Males in Pebble Creek.
What is the Median Population Age in Pebble Creek?
Median Population Age in Pebble Creek is 38.4 Years.
What is the Average Family Size in Pebble Creek
Average Family Size in Pebble Creek is 3.5 People.
What is the Average Household Size in Pebble Creek
Average Household Size in Pebble Creek is 3.1 People.
How Large is the Labor Force in Pebble Creek?
There are 5,636 People in the Labor Forcein in Pebble Creek.
What is the Percentage of People in the Labor Force in Pebble Creek?
70.7% of People are in the Labor Force in Pebble Creek.
What is the Unemployment Rate in Pebble Creek?
Unemployment Rate in Pebble Creek is 2.9%.