Clarkston, GA Map & Demographics
Clarkston Map
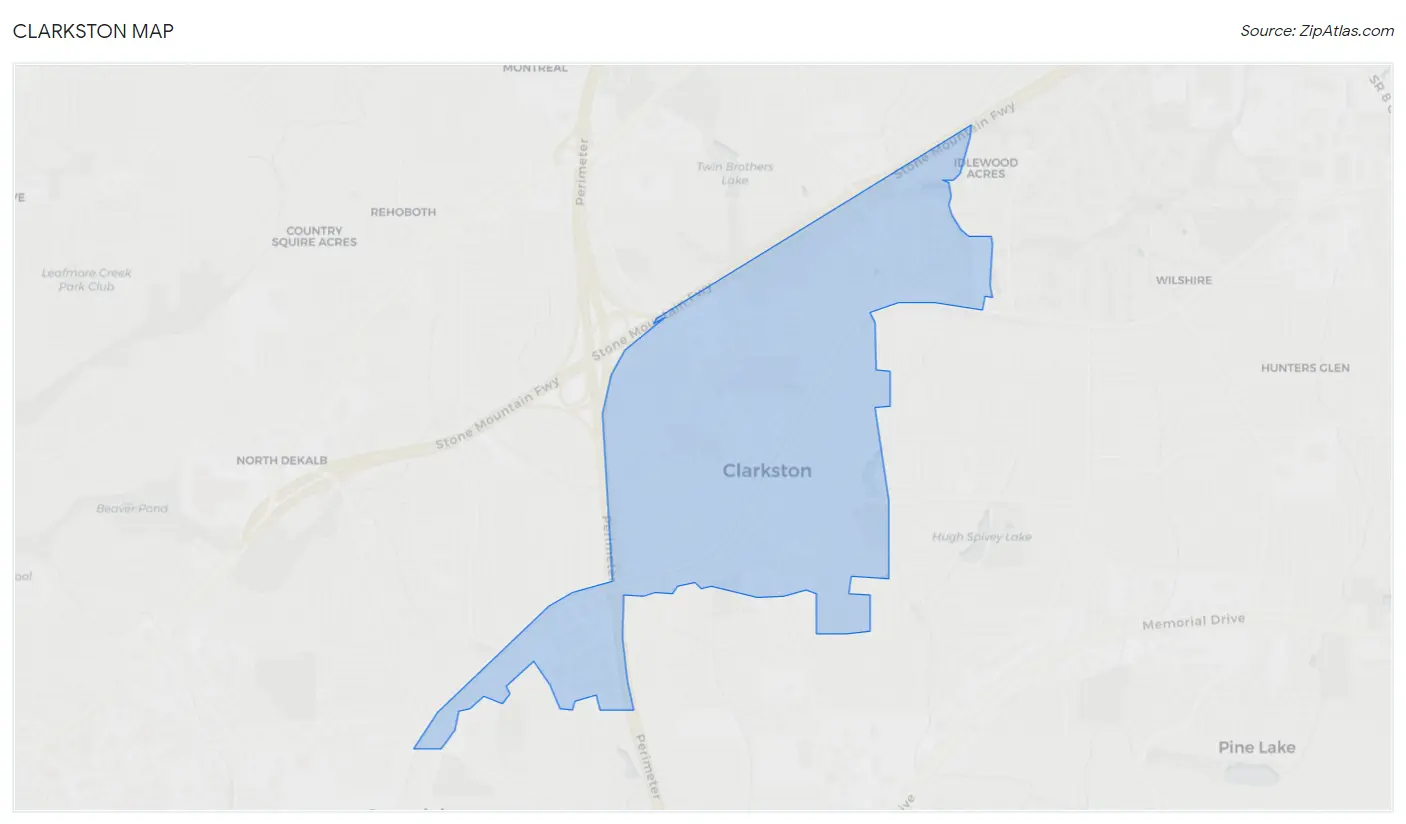
Clarkston Overview
$18,820
PER CAPITA INCOME
$51,730
AVG FAMILY INCOME
$51,122
AVG HOUSEHOLD INCOME
8.7%
WAGE / INCOME GAP [ % ]
91.3¢/ $1
WAGE / INCOME GAP [ $ ]
$11,990
FAMILY INCOME DEFICIT
0.43
INEQUALITY / GINI INDEX
14,553
TOTAL POPULATION
7,152
MALE POPULATION
7,401
FEMALE POPULATION
96.64
MALES / 100 FEMALES
103.48
FEMALES / 100 MALES
27.4
MEDIAN AGE
4.5
AVG FAMILY SIZE
3.8
AVG HOUSEHOLD SIZE
7,074
LABOR FORCE [ PEOPLE ]
71.4%
PERCENT IN LABOR FORCE
8.6%
UNEMPLOYMENT RATE
Clarkston Zip Codes
Income in Clarkston
Income Overview in Clarkston
Per Capita Income in Clarkston is $18,820, while median incomes of families and households are $51,730 and $51,122 respectively.
| Characteristic | Number | Measure |
| Per Capita Income | 14,553 | $18,820 |
| Median Family Income | 2,785 | $51,730 |
| Mean Family Income | 2,785 | $69,183 |
| Median Household Income | 3,807 | $51,122 |
| Mean Household Income | 3,807 | $65,752 |
| Income Deficit | 2,785 | $11,990 |
| Wage / Income Gap (%) | 14,553 | 8.66% |
| Wage / Income Gap ($) | 14,553 | 91.34¢ per $1 |
| Gini / Inequality Index | 14,553 | 0.43 |
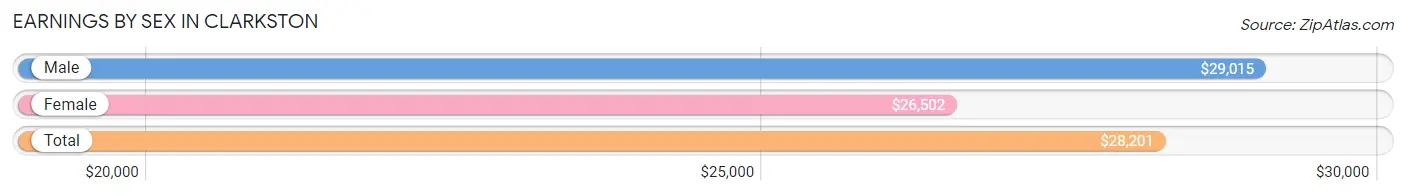
Earnings by Sex in Clarkston
Average Earnings in Clarkston are $28,201, $29,015 for men and $26,502 for women, a difference of 8.7%.
| Sex | Number | Average Earnings |
| Male | 3,886 (53.6%) | $29,015 |
| Female | 3,363 (46.4%) | $26,502 |
| Total | 7,249 (100.0%) | $28,201 |
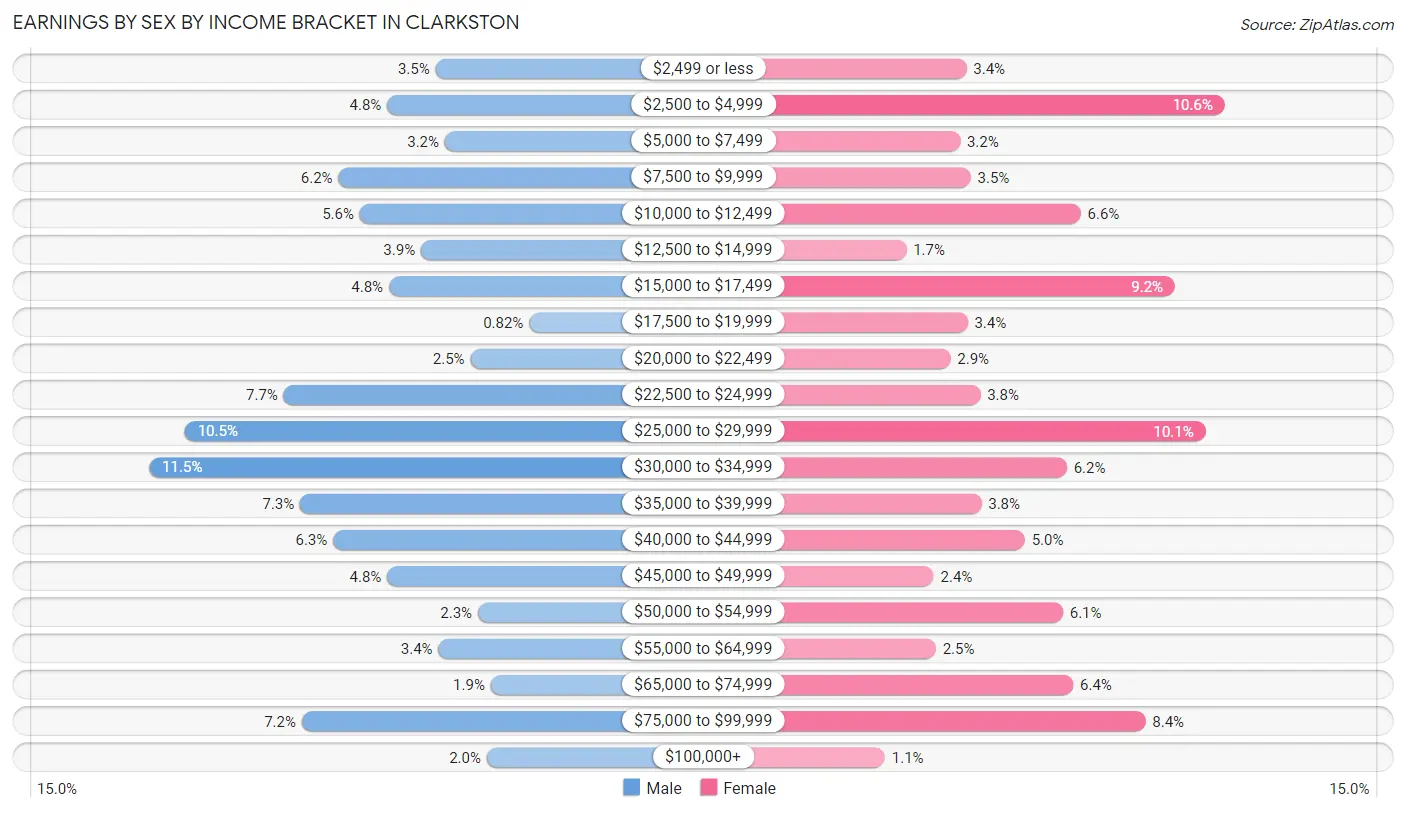
Earnings by Sex by Income Bracket in Clarkston
The most common earnings brackets in Clarkston are $30,000 to $34,999 for men (447 | 11.5%) and $2,500 to $4,999 for women (357 | 10.6%).
| Income | Male | Female |
| $2,499 or less | 134 (3.5%) | 113 (3.4%) |
| $2,500 to $4,999 | 187 (4.8%) | 357 (10.6%) |
| $5,000 to $7,499 | 124 (3.2%) | 107 (3.2%) |
| $7,500 to $9,999 | 240 (6.2%) | 117 (3.5%) |
| $10,000 to $12,499 | 217 (5.6%) | 221 (6.6%) |
| $12,500 to $14,999 | 150 (3.9%) | 56 (1.7%) |
| $15,000 to $17,499 | 185 (4.8%) | 310 (9.2%) |
| $17,500 to $19,999 | 32 (0.8%) | 114 (3.4%) |
| $20,000 to $22,499 | 96 (2.5%) | 98 (2.9%) |
| $22,500 to $24,999 | 300 (7.7%) | 126 (3.7%) |
| $25,000 to $29,999 | 408 (10.5%) | 339 (10.1%) |
| $30,000 to $34,999 | 447 (11.5%) | 208 (6.2%) |
| $35,000 to $39,999 | 282 (7.3%) | 127 (3.8%) |
| $40,000 to $44,999 | 246 (6.3%) | 168 (5.0%) |
| $45,000 to $49,999 | 187 (4.8%) | 82 (2.4%) |
| $50,000 to $54,999 | 88 (2.3%) | 204 (6.1%) |
| $55,000 to $64,999 | 131 (3.4%) | 84 (2.5%) |
| $65,000 to $74,999 | 74 (1.9%) | 214 (6.4%) |
| $75,000 to $99,999 | 280 (7.2%) | 282 (8.4%) |
| $100,000+ | 78 (2.0%) | 36 (1.1%) |
| Total | 3,886 (100.0%) | 3,363 (100.0%) |
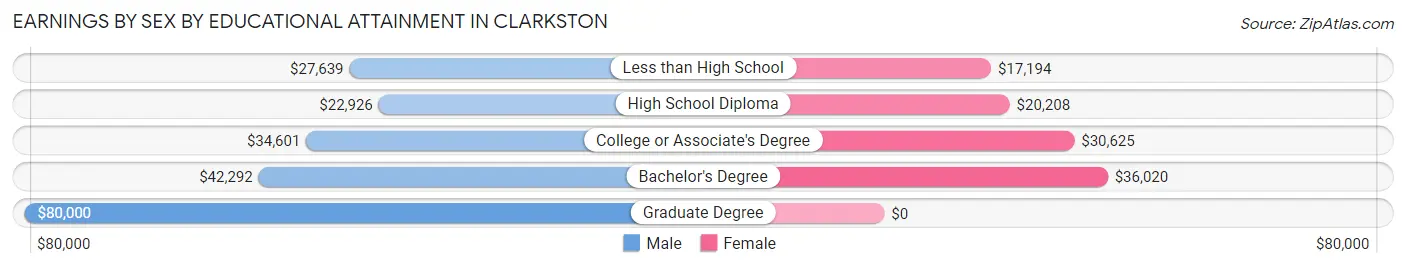
Earnings by Sex by Educational Attainment in Clarkston
Average earnings in Clarkston are $30,596 for men and $28,229 for women, a difference of 7.7%. Men with an educational attainment of graduate degree enjoy the highest average annual earnings of $80,000, while those with high school diploma education earn the least with $22,926. Women with an educational attainment of bachelor's degree earn the most with the average annual earnings of $36,020, while those with less than high school education have the smallest earnings of $17,194.
| Educational Attainment | Male Income | Female Income |
| Less than High School | $27,639 | $17,194 |
| High School Diploma | $22,926 | $20,208 |
| College or Associate's Degree | $34,601 | $30,625 |
| Bachelor's Degree | $42,292 | $36,020 |
| Graduate Degree | $80,000 | $0 |
| Total | $30,596 | $28,229 |
Family Income in Clarkston
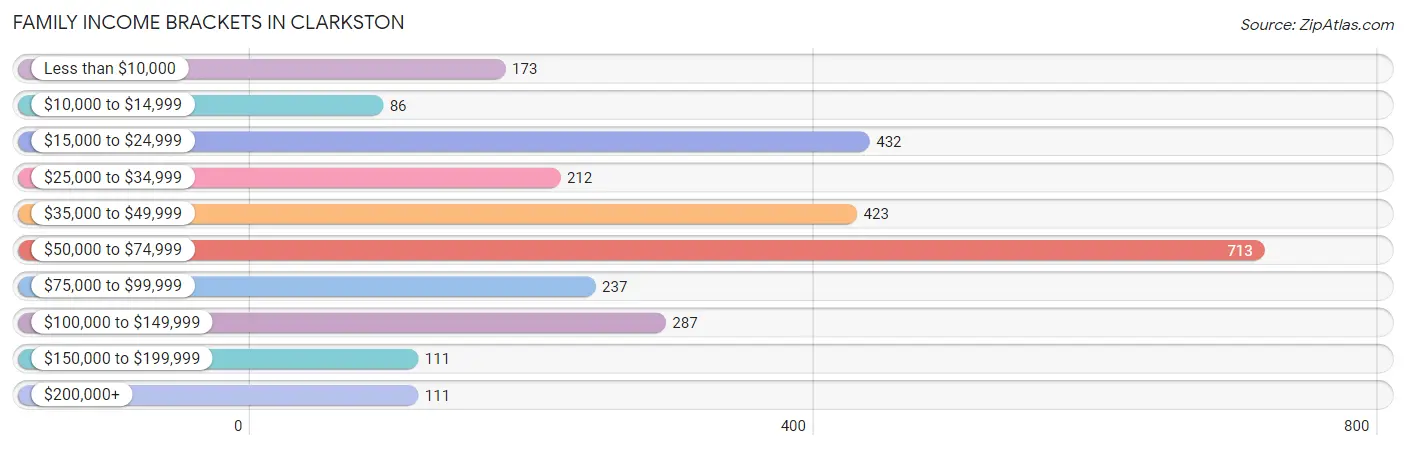
Family Income Brackets in Clarkston
According to the Clarkston family income data, there are 713 families falling into the $50,000 to $74,999 income range, which is the most common income bracket and makes up 25.6% of all families. Conversely, the $10,000 to $14,999 income bracket is the least frequent group with only 86 families (3.1%) belonging to this category.
| Income Bracket | # Families | % Families |
| Less than $10,000 | 173 | 6.2% |
| $10,000 to $14,999 | 86 | 3.1% |
| $15,000 to $24,999 | 432 | 15.5% |
| $25,000 to $34,999 | 212 | 7.6% |
| $35,000 to $49,999 | 423 | 15.2% |
| $50,000 to $74,999 | 713 | 25.6% |
| $75,000 to $99,999 | 237 | 8.5% |
| $100,000 to $149,999 | 287 | 10.3% |
| $150,000 to $199,999 | 111 | 4.0% |
| $200,000+ | 111 | 4.0% |
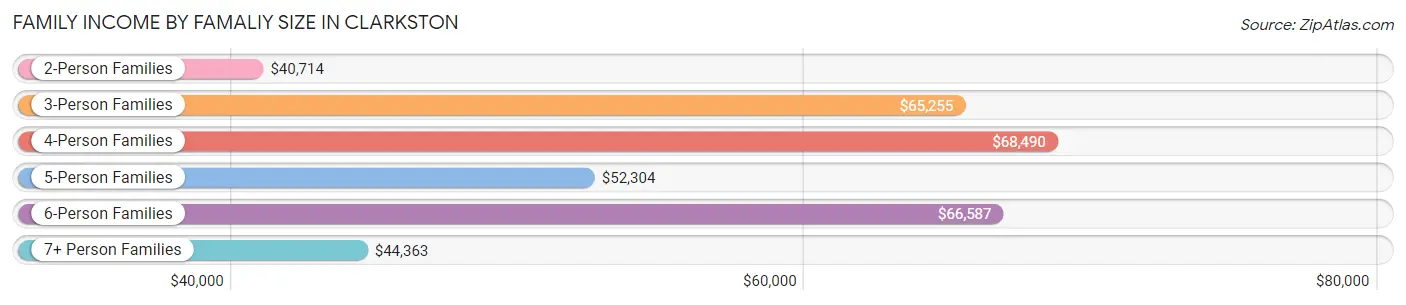
Family Income by Famaliy Size in Clarkston
4-person families (495 | 17.8%) account for the highest median family income in Clarkston with $68,490 per family, while 3-person families (392 | 14.1%) have the highest median income of $21,752 per family member.
| Income Bracket | # Families | Median Income |
| 2-Person Families | 946 (34.0%) | $40,714 |
| 3-Person Families | 392 (14.1%) | $65,255 |
| 4-Person Families | 495 (17.8%) | $68,490 |
| 5-Person Families | 408 (14.6%) | $52,304 |
| 6-Person Families | 301 (10.8%) | $66,587 |
| 7+ Person Families | 243 (8.7%) | $44,363 |
| Total | 2,785 (100.0%) | $51,730 |
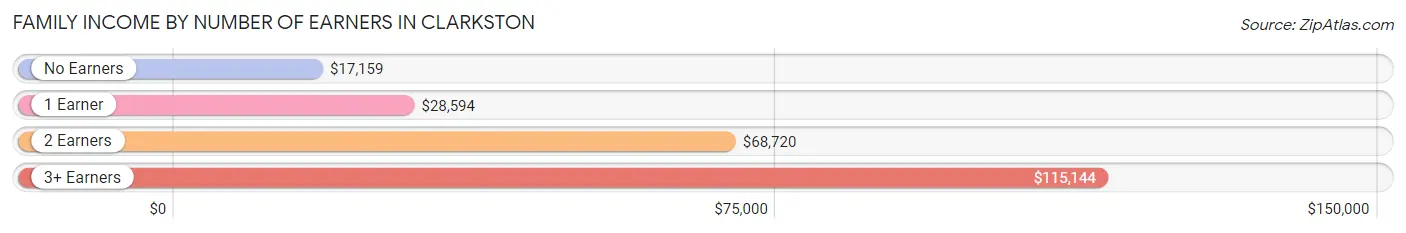
Family Income by Number of Earners in Clarkston
The median family income in Clarkston is $51,730, with families comprising 3+ earners (611) having the highest median family income of $115,144, while families with no earners (191) have the lowest median family income of $17,159, accounting for 21.9% and 6.9% of families, respectively.
| Number of Earners | # Families | Median Income |
| No Earners | 191 (6.9%) | $17,159 |
| 1 Earner | 1,129 (40.5%) | $28,594 |
| 2 Earners | 854 (30.7%) | $68,720 |
| 3+ Earners | 611 (21.9%) | $115,144 |
| Total | 2,785 (100.0%) | $51,730 |
Household Income in Clarkston
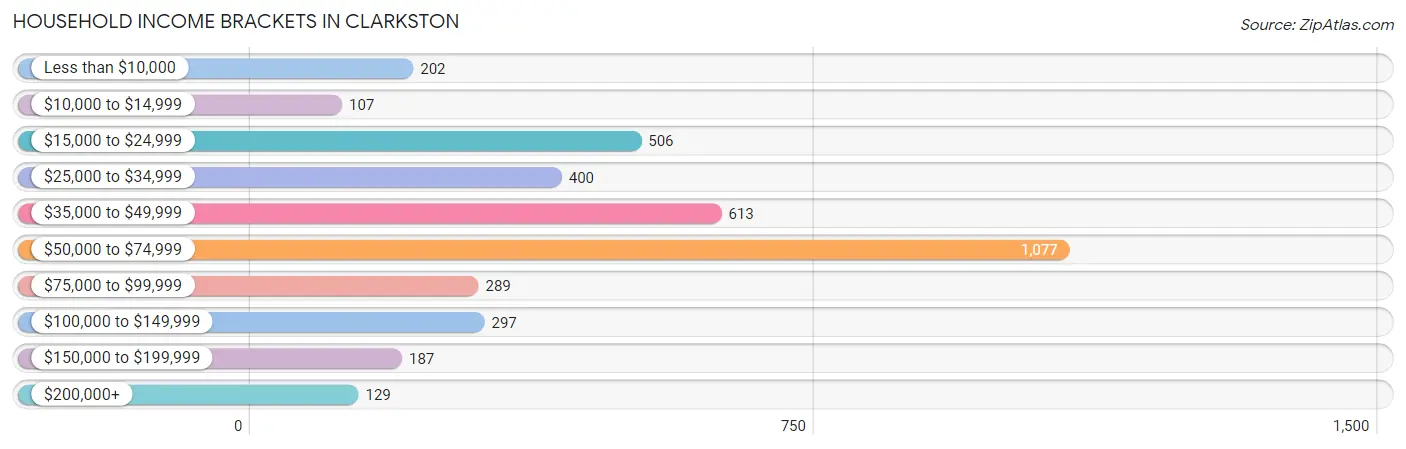
Household Income Brackets in Clarkston
With 1,077 households falling in the category, the $50,000 to $74,999 income range is the most frequent in Clarkston, accounting for 28.3% of all households. In contrast, only 107 households (2.8%) fall into the $10,000 to $14,999 income bracket, making it the least populous group.
| Income Bracket | # Households | % Households |
| Less than $10,000 | 202 | 5.3% |
| $10,000 to $14,999 | 107 | 2.8% |
| $15,000 to $24,999 | 506 | 13.3% |
| $25,000 to $34,999 | 400 | 10.5% |
| $35,000 to $49,999 | 613 | 16.1% |
| $50,000 to $74,999 | 1,077 | 28.3% |
| $75,000 to $99,999 | 289 | 7.6% |
| $100,000 to $149,999 | 297 | 7.8% |
| $150,000 to $199,999 | 187 | 4.9% |
| $200,000+ | 129 | 3.4% |
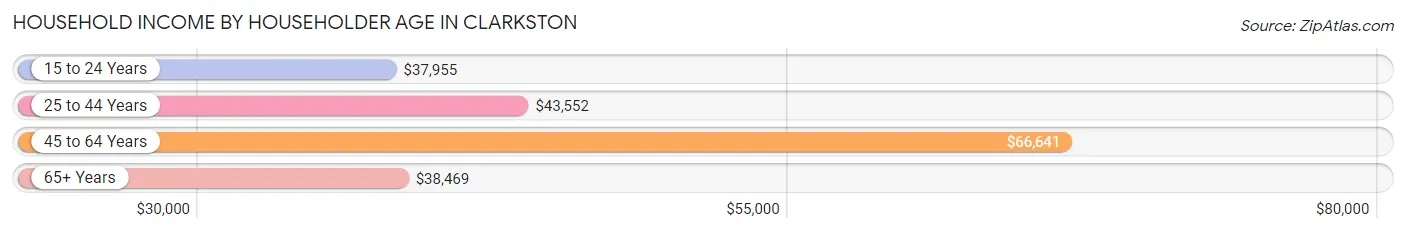
Household Income by Householder Age in Clarkston
The median household income in Clarkston is $51,122, with the highest median household income of $66,641 found in the 45 to 64 years age bracket for the primary householder. A total of 1,206 households (31.7%) fall into this category. Meanwhile, the 15 to 24 years age bracket for the primary householder has the lowest median household income of $37,955, with 92 households (2.4%) in this group.
| Income Bracket | # Households | Median Income |
| 15 to 24 Years | 92 (2.4%) | $37,955 |
| 25 to 44 Years | 2,285 (60.0%) | $43,552 |
| 45 to 64 Years | 1,206 (31.7%) | $66,641 |
| 65+ Years | 224 (5.9%) | $38,469 |
| Total | 3,807 (100.0%) | $51,122 |
Poverty in Clarkston
Income Below Poverty by Sex and Age in Clarkston
With 27.7% poverty level for males and 30.0% for females among the residents of Clarkston, 15 year old males and 12 to 14 year old females are the most vulnerable to poverty, with 77 males (77.8%) and 93 females (88.6%) in their respective age groups living below the poverty level.
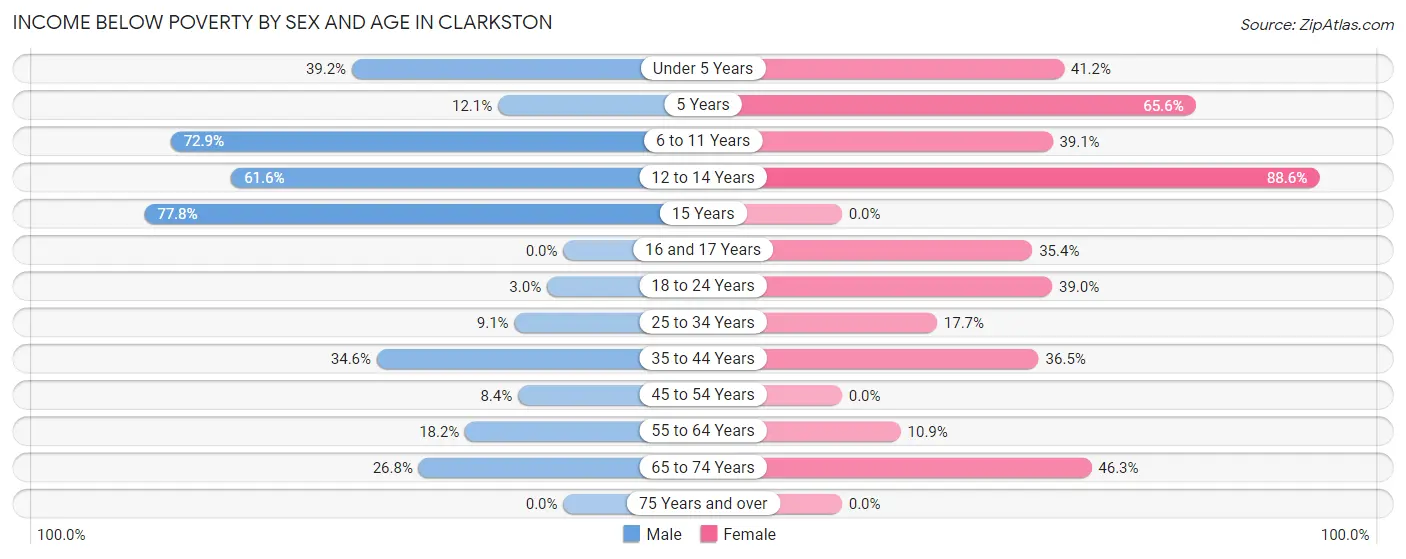
| Age Bracket | Male | Female |
| Under 5 Years | 330 (39.2%) | 429 (41.2%) |
| 5 Years | 12 (12.1%) | 107 (65.6%) |
| 6 to 11 Years | 556 (72.9%) | 346 (39.1%) |
| 12 to 14 Years | 270 (61.6%) | 93 (88.6%) |
| 15 Years | 77 (77.8%) | 0 (0.0%) |
| 16 and 17 Years | 0 (0.0%) | 105 (35.3%) |
| 18 to 24 Years | 28 (3.0%) | 192 (39.0%) |
| 25 to 34 Years | 131 (9.1%) | 319 (17.6%) |
| 35 to 44 Years | 358 (34.6%) | 387 (36.5%) |
| 45 to 54 Years | 57 (8.4%) | 0 (0.0%) |
| 55 to 64 Years | 90 (18.2%) | 75 (10.9%) |
| 65 to 74 Years | 62 (26.8%) | 151 (46.3%) |
| 75 Years and over | 0 (0.0%) | 0 (0.0%) |
| Total | 1,971 (27.7%) | 2,204 (30.0%) |
Income Above Poverty by Sex and Age in Clarkston
According to the poverty statistics in Clarkston, males aged 16 and 17 years and females aged 15 years are the age groups that are most secure financially, with 100.0% of males and 100.0% of females in these age groups living above the poverty line.
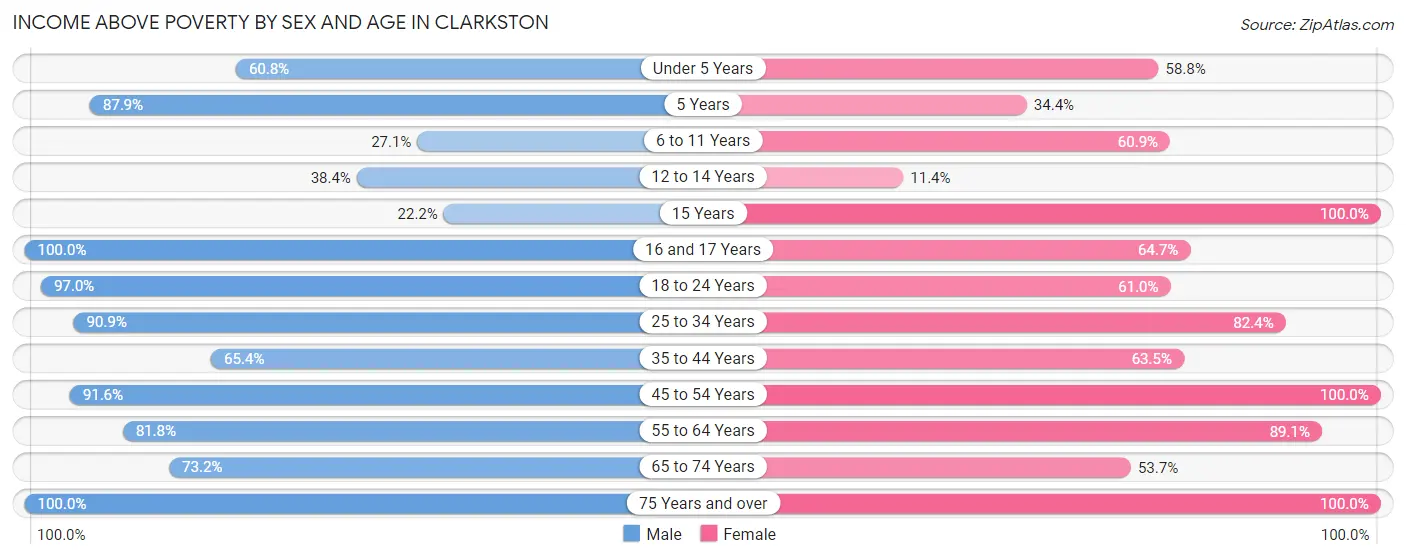
| Age Bracket | Male | Female |
| Under 5 Years | 511 (60.8%) | 612 (58.8%) |
| 5 Years | 87 (87.9%) | 56 (34.4%) |
| 6 to 11 Years | 207 (27.1%) | 539 (60.9%) |
| 12 to 14 Years | 168 (38.4%) | 12 (11.4%) |
| 15 Years | 22 (22.2%) | 110 (100.0%) |
| 16 and 17 Years | 52 (100.0%) | 192 (64.6%) |
| 18 to 24 Years | 893 (97.0%) | 300 (61.0%) |
| 25 to 34 Years | 1,312 (90.9%) | 1,488 (82.4%) |
| 35 to 44 Years | 676 (65.4%) | 672 (63.5%) |
| 45 to 54 Years | 621 (91.6%) | 339 (100.0%) |
| 55 to 64 Years | 404 (81.8%) | 612 (89.1%) |
| 65 to 74 Years | 169 (73.2%) | 175 (53.7%) |
| 75 Years and over | 14 (100.0%) | 23 (100.0%) |
| Total | 5,136 (72.3%) | 5,130 (70.0%) |
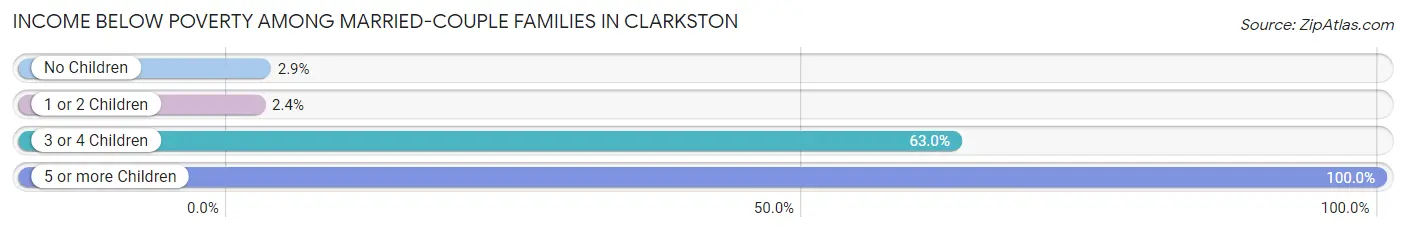
Income Below Poverty Among Married-Couple Families in Clarkston
The poverty statistics for married-couple families in Clarkston show that 22.9% or 396 of the total 1,731 families live below the poverty line. Families with 5 or more children have the highest poverty rate of 100.0%, comprising of 36 families. On the other hand, families with 1 or 2 children have the lowest poverty rate of 2.4%, which includes 16 families.
| Children | Above Poverty | Below Poverty |
| No Children | 478 (97.2%) | 14 (2.9%) |
| 1 or 2 Children | 663 (97.6%) | 16 (2.4%) |
| 3 or 4 Children | 194 (37.0%) | 330 (63.0%) |
| 5 or more Children | 0 (0.0%) | 36 (100.0%) |
| Total | 1,335 (77.1%) | 396 (22.9%) |
Income Below Poverty Among Single-Parent Households in Clarkston
According to the poverty data in Clarkston, 34.7% or 134 single-father households and 33.2% or 222 single-mother households are living below the poverty line. Among single-father households, those with 1 or 2 children have the highest poverty rate, with 134 households (56.8%) experiencing poverty. Likewise, among single-mother households, those with 3 or 4 children have the highest poverty rate, with 36 households (58.1%) falling below the poverty line.
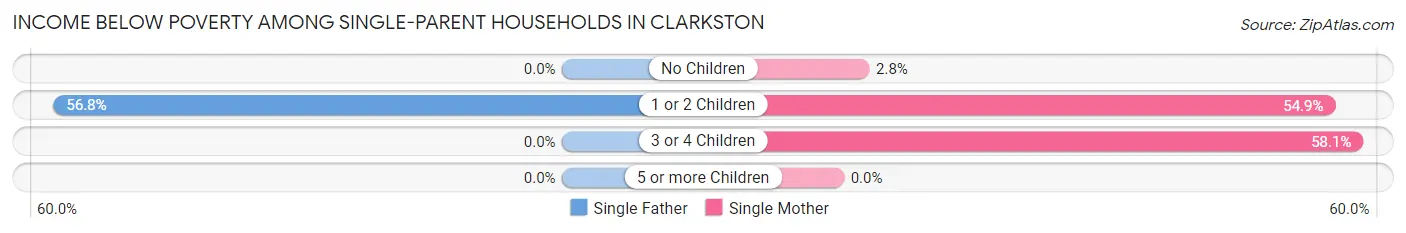
| Children | Single Father | Single Mother |
| No Children | 0 (0.0%) | 8 (2.8%) |
| 1 or 2 Children | 134 (56.8%) | 178 (54.9%) |
| 3 or 4 Children | 0 (0.0%) | 36 (58.1%) |
| 5 or more Children | 0 (0.0%) | 0 (0.0%) |
| Total | 134 (34.7%) | 222 (33.2%) |
Income Below Poverty Among Married-Couple vs Single-Parent Households in Clarkston
The poverty data for Clarkston shows that 396 of the married-couple family households (22.9%) and 356 of the single-parent households (33.8%) are living below the poverty level. Within the married-couple family households, those with 5 or more children have the highest poverty rate, with 36 households (100.0%) falling below the poverty line. Among the single-parent households, those with 3 or 4 children have the highest poverty rate, with 36 household (58.1%) living below poverty.
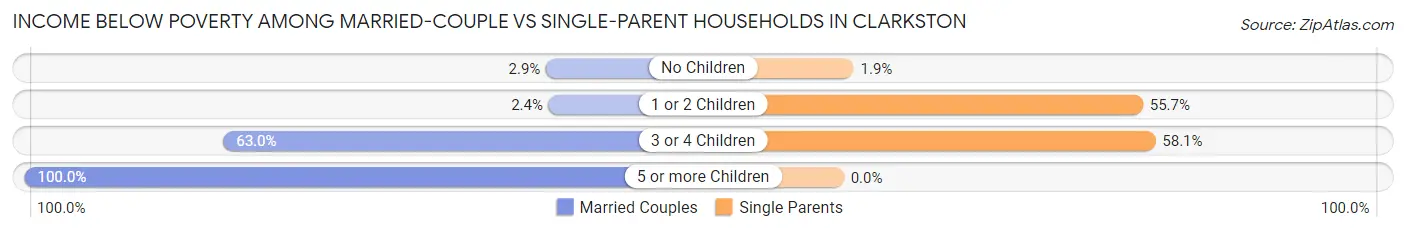
| Children | Married-Couple Families | Single-Parent Households |
| No Children | 14 (2.9%) | 8 (1.8%) |
| 1 or 2 Children | 16 (2.4%) | 312 (55.7%) |
| 3 or 4 Children | 330 (63.0%) | 36 (58.1%) |
| 5 or more Children | 36 (100.0%) | 0 (0.0%) |
| Total | 396 (22.9%) | 356 (33.8%) |
Race in Clarkston
The most populous races in Clarkston are Black / African American (10,174 | 69.9%), Asian (2,577 | 17.7%), and White / Caucasian (1,298 | 8.9%).
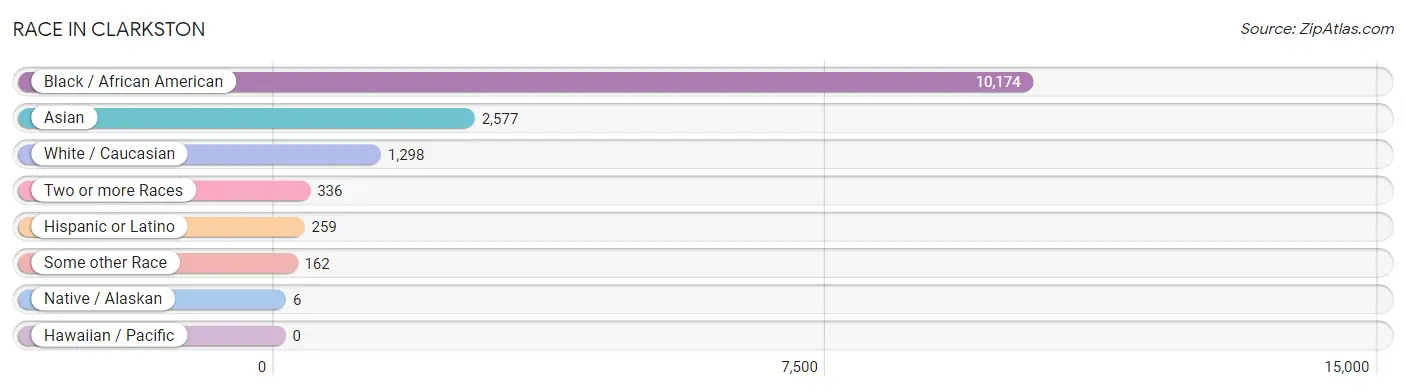
| Race | # Population | % Population |
| Asian | 2,577 | 17.7% |
| Black / African American | 10,174 | 69.9% |
| Hawaiian / Pacific | 0 | 0.0% |
| Hispanic or Latino | 259 | 1.8% |
| Native / Alaskan | 6 | 0.0% |
| White / Caucasian | 1,298 | 8.9% |
| Two or more Races | 336 | 2.3% |
| Some other Race | 162 | 1.1% |
| Total | 14,553 | 100.0% |
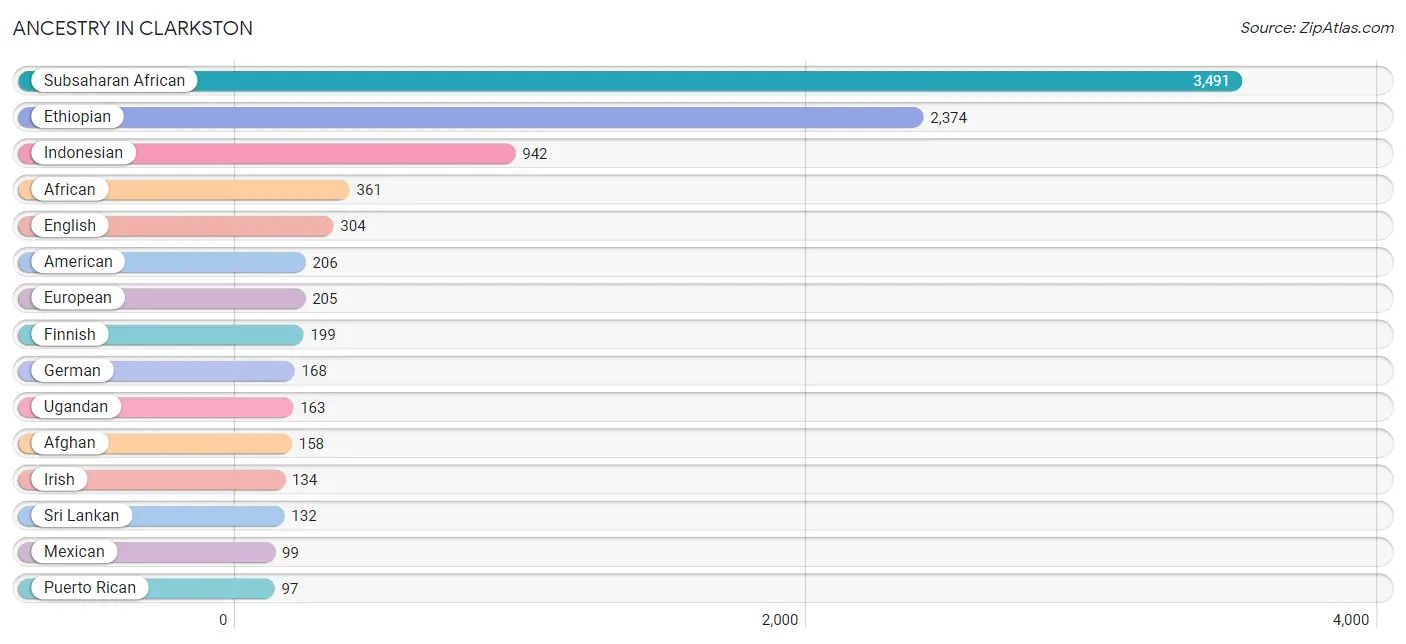
Ancestry in Clarkston
The most populous ancestries reported in Clarkston are Subsaharan African (3,491 | 24.0%), Ethiopian (2,374 | 16.3%), Indonesian (942 | 6.5%), African (361 | 2.5%), and English (304 | 2.1%), together accounting for 51.3% of all Clarkston residents.
| Ancestry | # Population | % Population |
| Afghan | 158 | 1.1% |
| African | 361 | 2.5% |
| American | 206 | 1.4% |
| Arab | 86 | 0.6% |
| Austrian | 5 | 0.0% |
| Barbadian | 15 | 0.1% |
| Bermudan | 21 | 0.1% |
| Burmese | 1 | 0.0% |
| Central American | 45 | 0.3% |
| Costa Rican | 6 | 0.0% |
| Danish | 16 | 0.1% |
| Dutch | 17 | 0.1% |
| Egyptian | 14 | 0.1% |
| English | 304 | 2.1% |
| Ethiopian | 2,374 | 16.3% |
| European | 205 | 1.4% |
| Finnish | 199 | 1.4% |
| French | 33 | 0.2% |
| German | 168 | 1.1% |
| Ghanaian | 78 | 0.5% |
| Guatemalan | 39 | 0.3% |
| Guyanese | 26 | 0.2% |
| Indian (Asian) | 5 | 0.0% |
| Indonesian | 942 | 6.5% |
| Iraqi | 12 | 0.1% |
| Irish | 134 | 0.9% |
| Italian | 21 | 0.1% |
| Jamaican | 48 | 0.3% |
| Japanese | 8 | 0.1% |
| Mexican | 99 | 0.7% |
| Native Hawaiian | 20 | 0.1% |
| Nigerian | 8 | 0.1% |
| Peruvian | 6 | 0.0% |
| Polish | 35 | 0.2% |
| Portuguese | 21 | 0.1% |
| Puerto Rican | 97 | 0.7% |
| Scotch-Irish | 47 | 0.3% |
| Scottish | 75 | 0.5% |
| Somali | 21 | 0.1% |
| South American | 6 | 0.0% |
| Sri Lankan | 132 | 0.9% |
| Subsaharan African | 3,491 | 24.0% |
| Sudanese | 59 | 0.4% |
| Swiss | 53 | 0.4% |
| Thai | 74 | 0.5% |
| Turkish | 18 | 0.1% |
| Ugandan | 163 | 1.1% | View All 47 Rows |
Immigrants in Clarkston
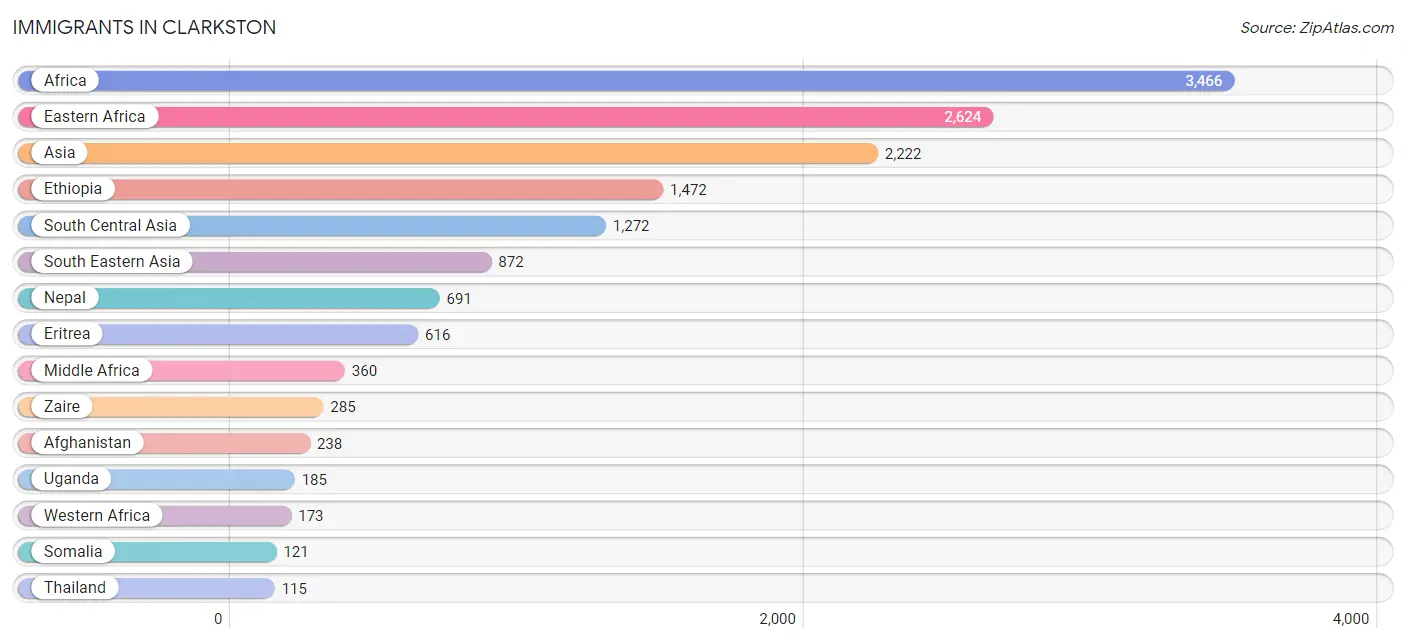
The most numerous immigrant groups reported in Clarkston came from Africa (3,466 | 23.8%), Eastern Africa (2,624 | 18.0%), Asia (2,222 | 15.3%), Ethiopia (1,472 | 10.1%), and South Central Asia (1,272 | 8.7%), together accounting for 76.0% of all Clarkston residents.
| Immigration Origin | # Population | % Population |
| Afghanistan | 238 | 1.6% |
| Africa | 3,466 | 23.8% |
| Asia | 2,222 | 15.3% |
| Bangladesh | 36 | 0.3% |
| Caribbean | 56 | 0.4% |
| Central America | 48 | 0.3% |
| Congo | 75 | 0.5% |
| Eastern Africa | 2,624 | 18.0% |
| England | 23 | 0.2% |
| Eritrea | 616 | 4.2% |
| Ethiopia | 1,472 | 10.1% |
| Europe | 23 | 0.2% |
| Ghana | 64 | 0.4% |
| Guatemala | 48 | 0.3% |
| India | 21 | 0.1% |
| Iran | 5 | 0.0% |
| Iraq | 41 | 0.3% |
| Jamaica | 48 | 0.3% |
| Latin America | 104 | 0.7% |
| Middle Africa | 360 | 2.5% |
| Nepal | 691 | 4.8% |
| Northern Africa | 42 | 0.3% |
| Northern Europe | 23 | 0.2% |
| Pakistan | 5 | 0.0% |
| Senegal | 25 | 0.2% |
| Somalia | 121 | 0.8% |
| South Central Asia | 1,272 | 8.7% |
| South Eastern Asia | 872 | 6.0% |
| Sudan | 27 | 0.2% |
| Syria | 11 | 0.1% |
| Thailand | 115 | 0.8% |
| Trinidad and Tobago | 8 | 0.1% |
| Uganda | 185 | 1.3% |
| Vietnam | 75 | 0.5% |
| Western Africa | 173 | 1.2% |
| Western Asia | 69 | 0.5% |
| Zaire | 285 | 2.0% | View All 37 Rows |
Sex and Age in Clarkston
Sex and Age in Clarkston
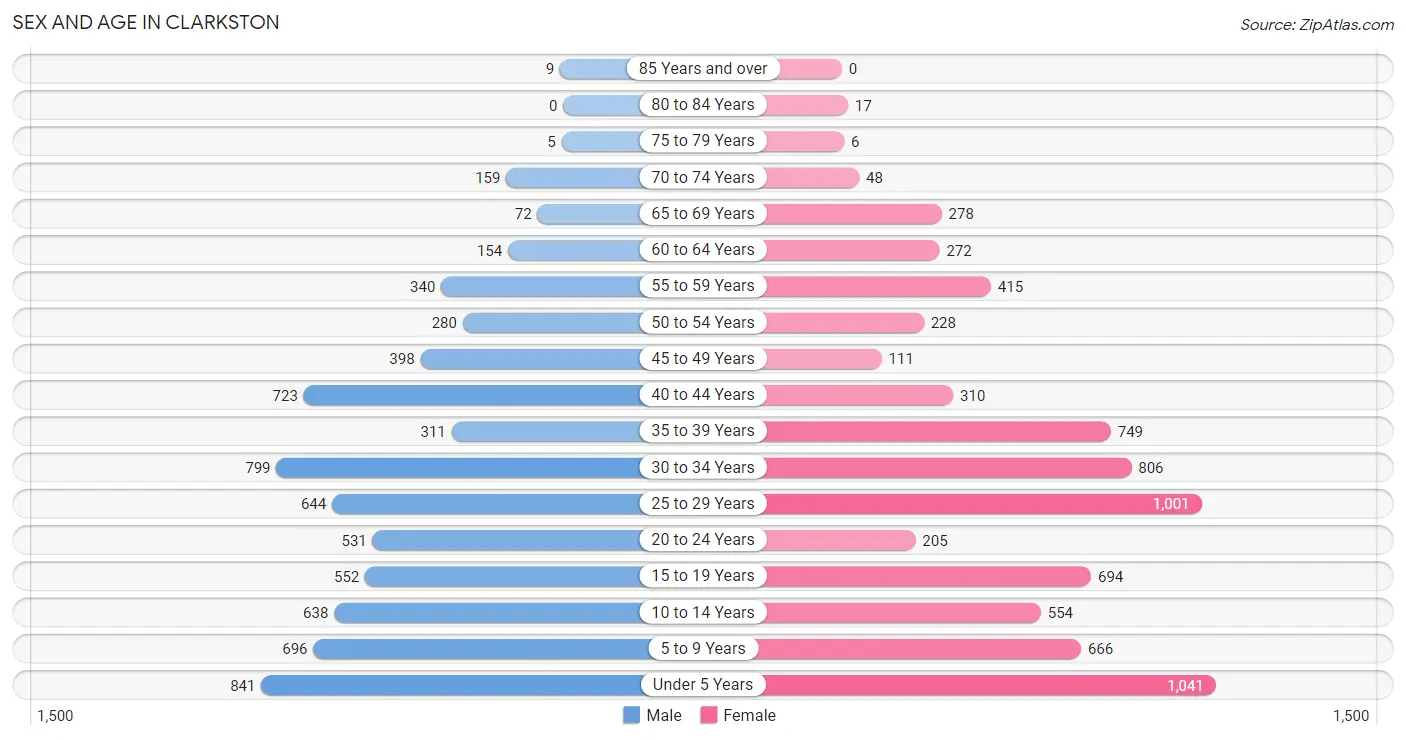
The most populous age groups in Clarkston are Under 5 Years (841 | 11.8%) for men and Under 5 Years (1,041 | 14.1%) for women.
| Age Bracket | Male | Female |
| Under 5 Years | 841 (11.8%) | 1,041 (14.1%) |
| 5 to 9 Years | 696 (9.7%) | 666 (9.0%) |
| 10 to 14 Years | 638 (8.9%) | 554 (7.5%) |
| 15 to 19 Years | 552 (7.7%) | 694 (9.4%) |
| 20 to 24 Years | 531 (7.4%) | 205 (2.8%) |
| 25 to 29 Years | 644 (9.0%) | 1,001 (13.5%) |
| 30 to 34 Years | 799 (11.2%) | 806 (10.9%) |
| 35 to 39 Years | 311 (4.3%) | 749 (10.1%) |
| 40 to 44 Years | 723 (10.1%) | 310 (4.2%) |
| 45 to 49 Years | 398 (5.6%) | 111 (1.5%) |
| 50 to 54 Years | 280 (3.9%) | 228 (3.1%) |
| 55 to 59 Years | 340 (4.8%) | 415 (5.6%) |
| 60 to 64 Years | 154 (2.1%) | 272 (3.7%) |
| 65 to 69 Years | 72 (1.0%) | 278 (3.8%) |
| 70 to 74 Years | 159 (2.2%) | 48 (0.6%) |
| 75 to 79 Years | 5 (0.1%) | 6 (0.1%) |
| 80 to 84 Years | 0 (0.0%) | 17 (0.2%) |
| 85 Years and over | 9 (0.1%) | 0 (0.0%) |
| Total | 7,152 (100.0%) | 7,401 (100.0%) |
Families and Households in Clarkston
Median Family Size in Clarkston
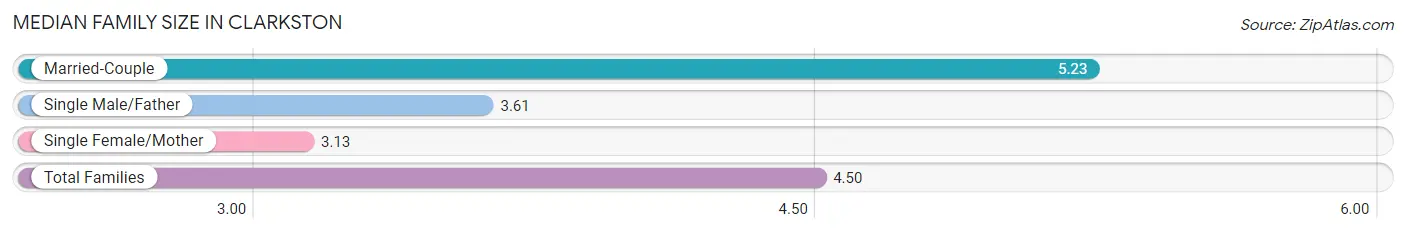
The median family size in Clarkston is 4.50 persons per family, with married-couple families (1,731 | 62.2%) accounting for the largest median family size of 5.23 persons per family. On the other hand, single female/mother families (668 | 24.0%) represent the smallest median family size with 3.13 persons per family.
| Family Type | # Families | Family Size |
| Married-Couple | 1,731 (62.2%) | 5.23 |
| Single Male/Father | 386 (13.9%) | 3.61 |
| Single Female/Mother | 668 (24.0%) | 3.13 |
| Total Families | 2,785 (100.0%) | 4.50 |
Median Household Size in Clarkston
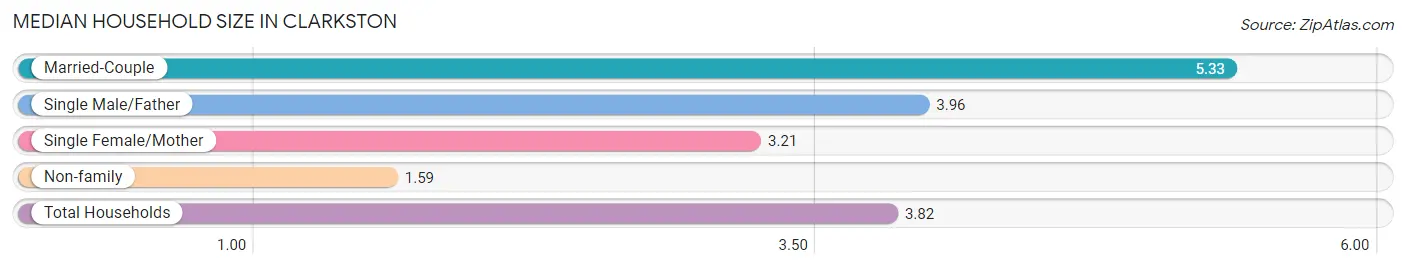
The median household size in Clarkston is 3.82 persons per household, with married-couple households (1,731 | 45.5%) accounting for the largest median household size of 5.33 persons per household. non-family households (1,022 | 26.9%) represent the smallest median household size with 1.59 persons per household.
| Household Type | # Households | Household Size |
| Married-Couple | 1,731 (45.5%) | 5.33 |
| Single Male/Father | 386 (10.1%) | 3.96 |
| Single Female/Mother | 668 (17.5%) | 3.21 |
| Non-family | 1,022 (26.9%) | 1.59 |
| Total Households | 3,807 (100.0%) | 3.82 |
Household Size by Marriage Status in Clarkston
Out of a total of 3,807 households in Clarkston, 2,785 (73.2%) are family households, while 1,022 (26.9%) are nonfamily households. The most numerous type of family households are 2-person households, comprising 769, and the most common type of nonfamily households are 1-person households, comprising 652.
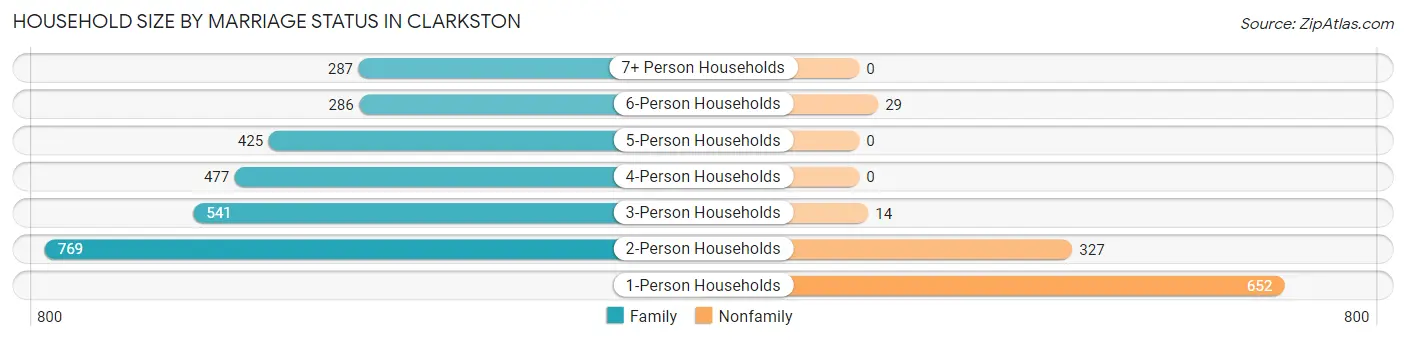
| Household Size | Family Households | Nonfamily Households |
| 1-Person Households | - | 652 (17.1%) |
| 2-Person Households | 769 (20.2%) | 327 (8.6%) |
| 3-Person Households | 541 (14.2%) | 14 (0.4%) |
| 4-Person Households | 477 (12.5%) | 0 (0.0%) |
| 5-Person Households | 425 (11.2%) | 0 (0.0%) |
| 6-Person Households | 286 (7.5%) | 29 (0.8%) |
| 7+ Person Households | 287 (7.5%) | 0 (0.0%) |
| Total | 2,785 (73.2%) | 1,022 (26.9%) |
Female Fertility in Clarkston
Fertility by Age in Clarkston
Average fertility rate in Clarkston is 127.0 births per 1,000 women. Women in the age bracket of 20 to 34 years have the highest fertility rate with 153.0 births per 1,000 women. Women in the age bracket of 20 to 34 years acount for 62.2% of all women with births.
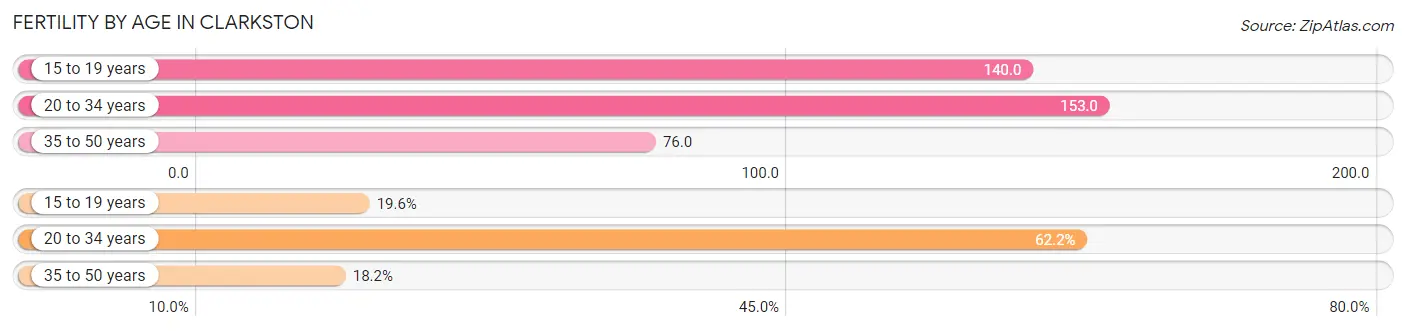
| Age Bracket | Women with Births | Births / 1,000 Women |
| 15 to 19 years | 97 (19.6%) | 140.0 |
| 20 to 34 years | 308 (62.2%) | 153.0 |
| 35 to 50 years | 90 (18.2%) | 76.0 |
| Total | 495 (100.0%) | 127.0 |
Fertility by Age by Marriage Status in Clarkston
76.2% of women with births (495) in Clarkston are married. The highest percentage of unmarried women with births falls into 20 to 34 years age bracket with 29.9% of them unmarried at the time of birth, while the lowest percentage of unmarried women with births belong to 35 to 50 years age bracket with 0.0% of them unmarried.
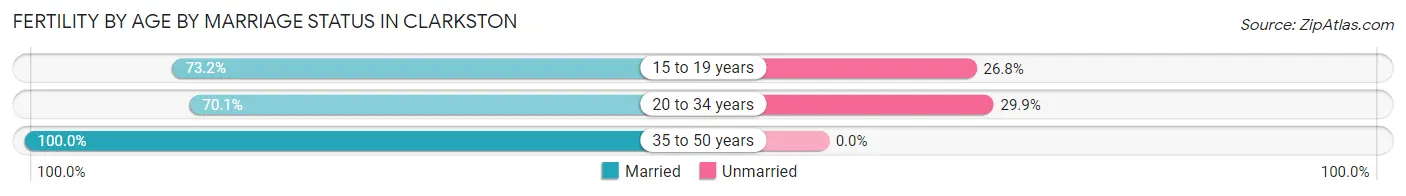
| Age Bracket | Married | Unmarried |
| 15 to 19 years | 71 (73.2%) | 26 (26.8%) |
| 20 to 34 years | 216 (70.1%) | 92 (29.9%) |
| 35 to 50 years | 90 (100.0%) | 0 (0.0%) |
| Total | 377 (76.2%) | 118 (23.8%) |
Fertility by Education in Clarkston
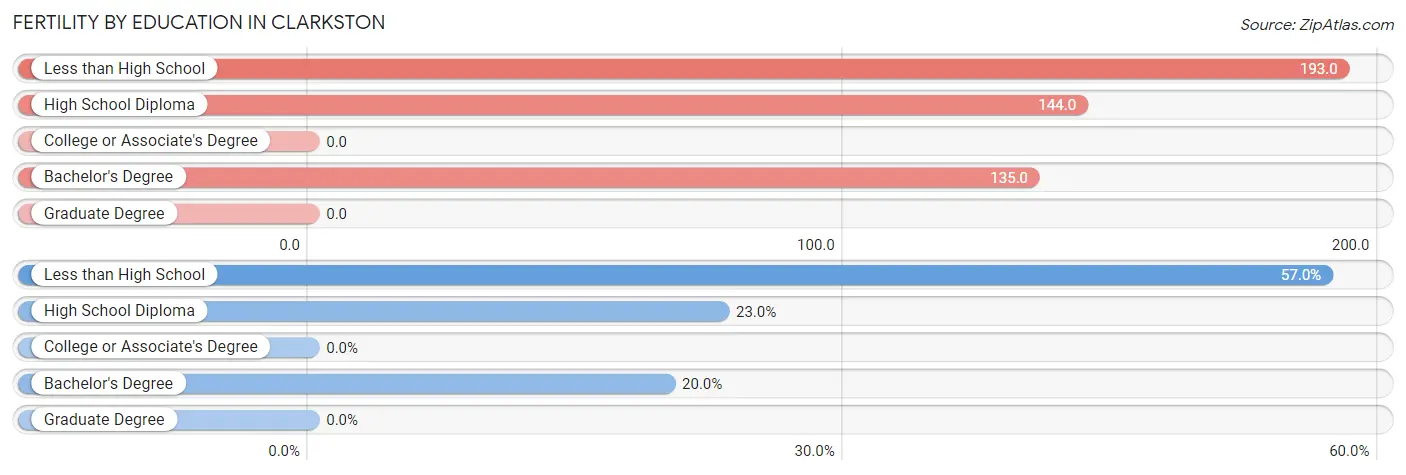
| Educational Attainment | Women with Births | Births / 1,000 Women |
| Less than High School | 282 (57.0%) | 193.0 |
| High School Diploma | 114 (23.0%) | 144.0 |
| College or Associate's Degree | 0 (0.0%) | 0.0 |
| Bachelor's Degree | 99 (20.0%) | 135.0 |
| Graduate Degree | 0 (0.0%) | 0.0 |
| Total | 495 (100.0%) | 127.0 |
Fertility by Education by Marriage Status in Clarkston
23.8% of women with births in Clarkston are unmarried. Women with the educational attainment of bachelor's degree are most likely to be married with 100.0% of them married at childbirth, while women with the educational attainment of less than high school are least likely to be married with 36.9% of them unmarried at childbirth.
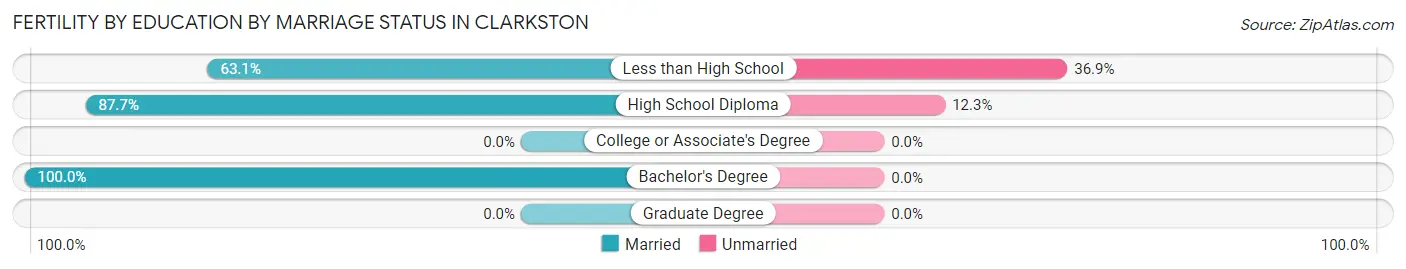
| Educational Attainment | Married | Unmarried |
| Less than High School | 178 (63.1%) | 104 (36.9%) |
| High School Diploma | 100 (87.7%) | 14 (12.3%) |
| College or Associate's Degree | 0 (0.0%) | 0 (0.0%) |
| Bachelor's Degree | 99 (100.0%) | 0 (0.0%) |
| Graduate Degree | 0 (0.0%) | 0 (0.0%) |
| Total | 377 (76.2%) | 118 (23.8%) |
Employment Characteristics in Clarkston
Employment by Class of Employer in Clarkston
Among the 6,100 employed individuals in Clarkston, private company employees (4,265 | 69.9%), local government employees (484 | 7.9%), and not-for-profit organizations (434 | 7.1%) make up the most common classes of employment.
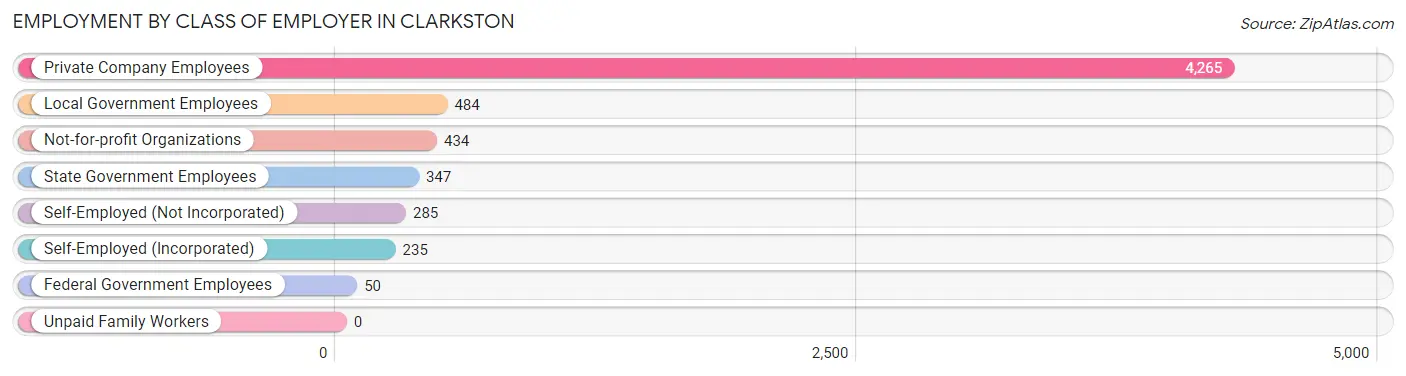
| Employer Class | # Employees | % Employees |
| Private Company Employees | 4,265 | 69.9% |
| Self-Employed (Incorporated) | 235 | 3.8% |
| Self-Employed (Not Incorporated) | 285 | 4.7% |
| Not-for-profit Organizations | 434 | 7.1% |
| Local Government Employees | 484 | 7.9% |
| State Government Employees | 347 | 5.7% |
| Federal Government Employees | 50 | 0.8% |
| Unpaid Family Workers | 0 | 0.0% |
| Total | 6,100 | 100.0% |
Employment Status by Age in Clarkston
According to the labor force statistics for Clarkston, out of the total population over 16 years of age (9,908), 71.4% or 7,074 individuals are in the labor force, with 8.6% or 608 of them unemployed. The age group with the highest labor force participation rate is 25 to 29 years, with 86.7% or 1,426 individuals in the labor force. Within the labor force, the 25 to 29 years age range has the highest percentage of unemployed individuals, with 19.3% or 275 of them being unemployed.
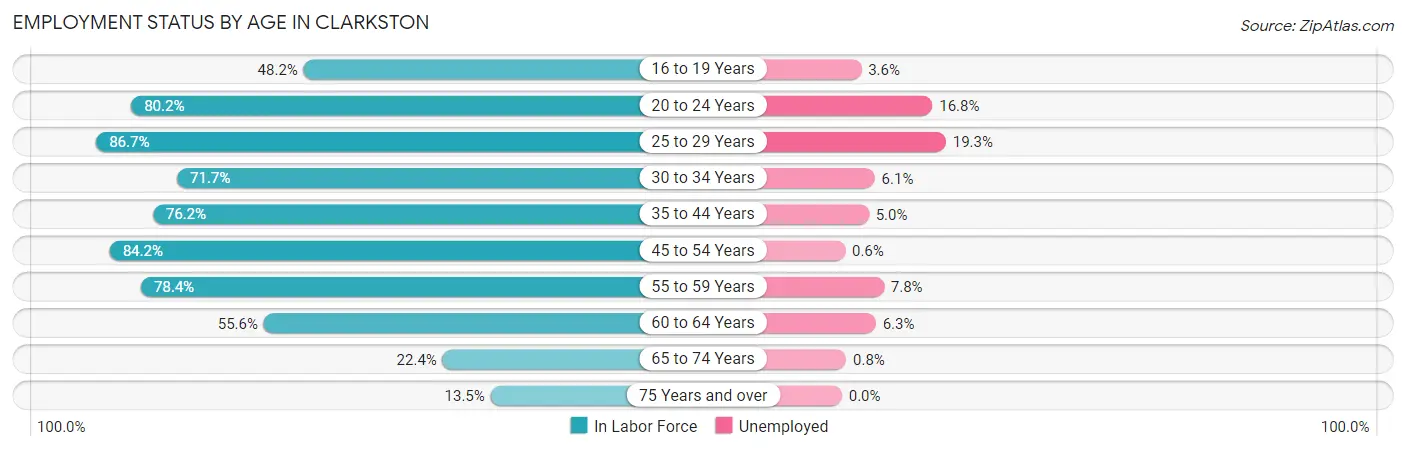
| Age Bracket | In Labor Force | Unemployed |
| 16 to 19 Years | 500 (48.2%) | 18 (3.6%) |
| 20 to 24 Years | 590 (80.2%) | 99 (16.8%) |
| 25 to 29 Years | 1,426 (86.7%) | 275 (19.3%) |
| 30 to 34 Years | 1,151 (71.7%) | 70 (6.1%) |
| 35 to 44 Years | 1,595 (76.2%) | 80 (5.0%) |
| 45 to 54 Years | 856 (84.2%) | 5 (0.6%) |
| 55 to 59 Years | 592 (78.4%) | 46 (7.8%) |
| 60 to 64 Years | 237 (55.6%) | 15 (6.3%) |
| 65 to 74 Years | 125 (22.4%) | 1 (0.8%) |
| 75 Years and over | 5 (13.5%) | 0 (0.0%) |
| Total | 7,074 (71.4%) | 608 (8.6%) |
Employment Status by Educational Attainment in Clarkston
According to labor force statistics for Clarkston, 77.7% of individuals (5,859) out of the total population between 25 and 64 years of age (7,541) are in the labor force, with 8.4% or 492 of them being unemployed. The group with the highest labor force participation rate are those with the educational attainment of bachelor's degree or higher, with 89.5% or 1,650 individuals in the labor force. Within the labor force, individuals with high school diploma education have the highest percentage of unemployment, with 16.8% or 250 of them being unemployed.
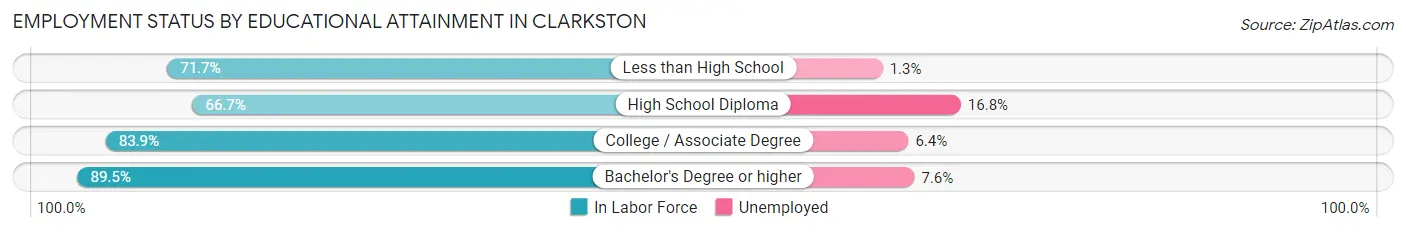
| Educational Attainment | In Labor Force | Unemployed |
| Less than High School | 1,119 (71.7%) | 20 (1.3%) |
| High School Diploma | 1,486 (66.7%) | 374 (16.8%) |
| College / Associate Degree | 1,602 (83.9%) | 122 (6.4%) |
| Bachelor's Degree or higher | 1,650 (89.5%) | 140 (7.6%) |
| Total | 5,859 (77.7%) | 633 (8.4%) |
Employment Occupations by Sex in Clarkston
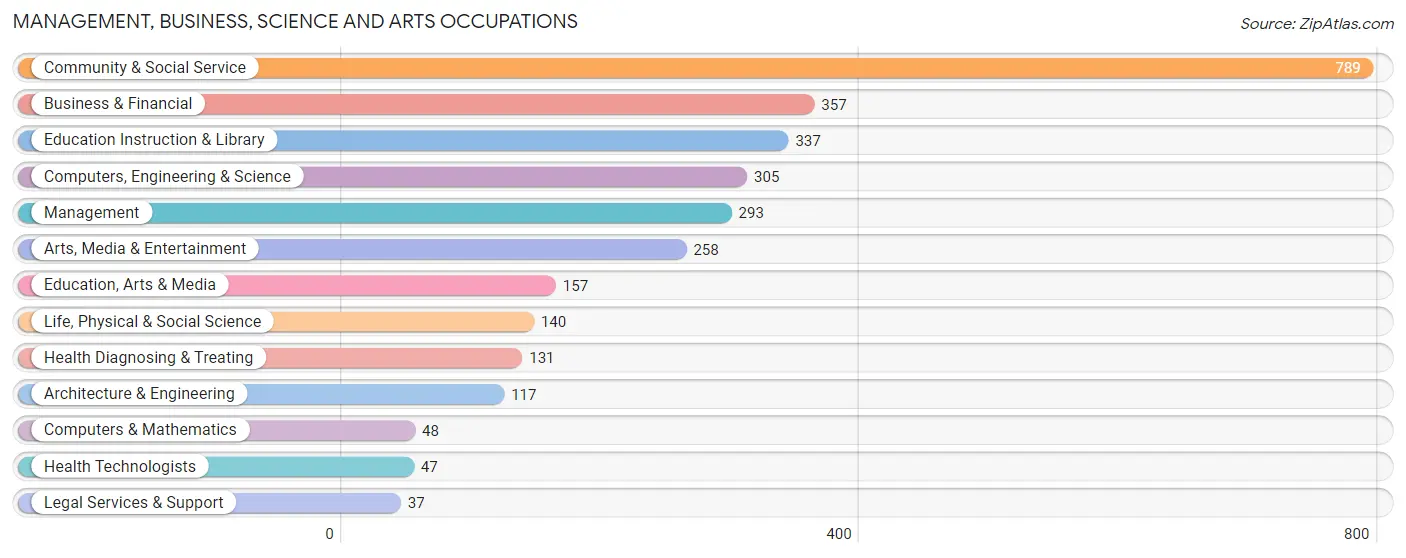
Management, Business, Science and Arts Occupations
The most common Management, Business, Science and Arts occupations in Clarkston are Community & Social Service (789 | 12.2%), Business & Financial (357 | 5.5%), Education Instruction & Library (337 | 5.2%), Computers, Engineering & Science (305 | 4.7%), and Management (293 | 4.5%).
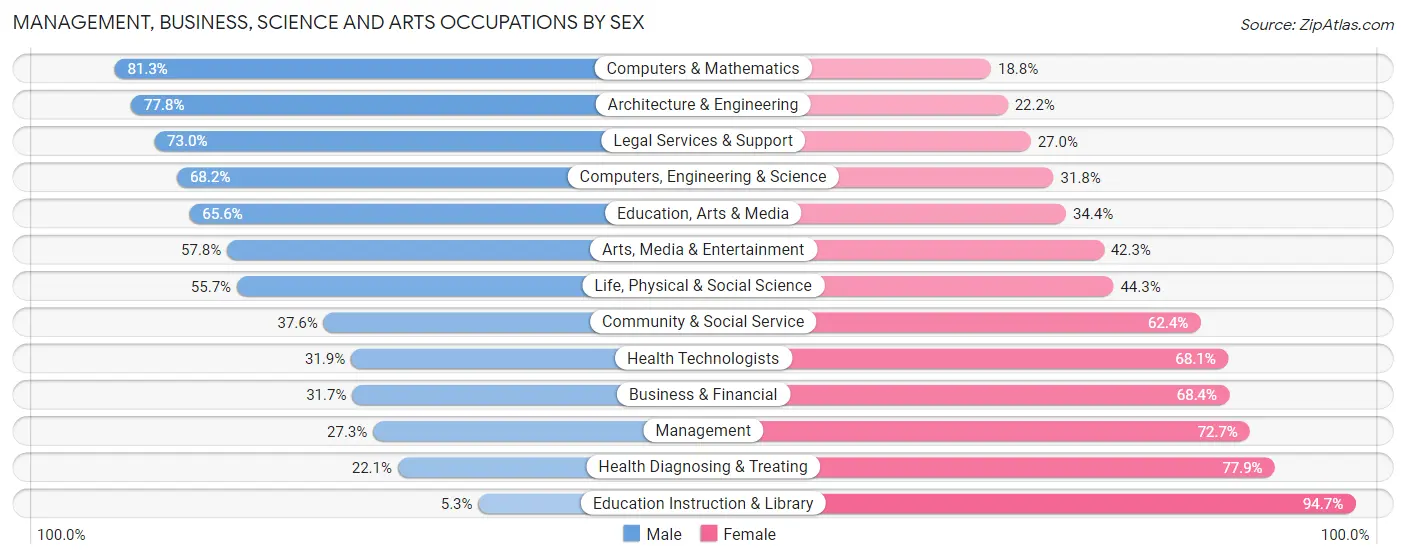
Management, Business, Science and Arts Occupations by Sex
Within the Management, Business, Science and Arts occupations in Clarkston, the most male-oriented occupations are Computers & Mathematics (81.2%), Architecture & Engineering (77.8%), and Legal Services & Support (73.0%), while the most female-oriented occupations are Education Instruction & Library (94.7%), Health Diagnosing & Treating (77.9%), and Management (72.7%).
| Occupation | Male | Female |
| Management | 80 (27.3%) | 213 (72.7%) |
| Business & Financial | 113 (31.7%) | 244 (68.3%) |
| Computers, Engineering & Science | 208 (68.2%) | 97 (31.8%) |
| Computers & Mathematics | 39 (81.2%) | 9 (18.8%) |
| Architecture & Engineering | 91 (77.8%) | 26 (22.2%) |
| Life, Physical & Social Science | 78 (55.7%) | 62 (44.3%) |
| Community & Social Service | 297 (37.6%) | 492 (62.4%) |
| Education, Arts & Media | 103 (65.6%) | 54 (34.4%) |
| Legal Services & Support | 27 (73.0%) | 10 (27.0%) |
| Education Instruction & Library | 18 (5.3%) | 319 (94.7%) |
| Arts, Media & Entertainment | 149 (57.8%) | 109 (42.2%) |
| Health Diagnosing & Treating | 29 (22.1%) | 102 (77.9%) |
| Health Technologists | 15 (31.9%) | 32 (68.1%) |
| Total (Category) | 727 (38.8%) | 1,148 (61.2%) |
| Total (Overall) | 3,473 (53.7%) | 2,994 (46.3%) |
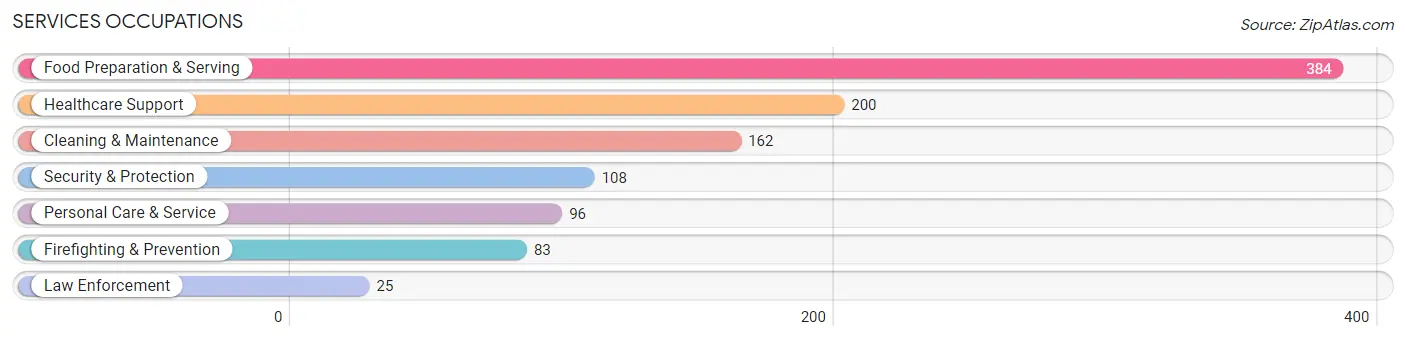
Services Occupations
The most common Services occupations in Clarkston are Food Preparation & Serving (384 | 5.9%), Healthcare Support (200 | 3.1%), Cleaning & Maintenance (162 | 2.5%), Security & Protection (108 | 1.7%), and Personal Care & Service (96 | 1.5%).
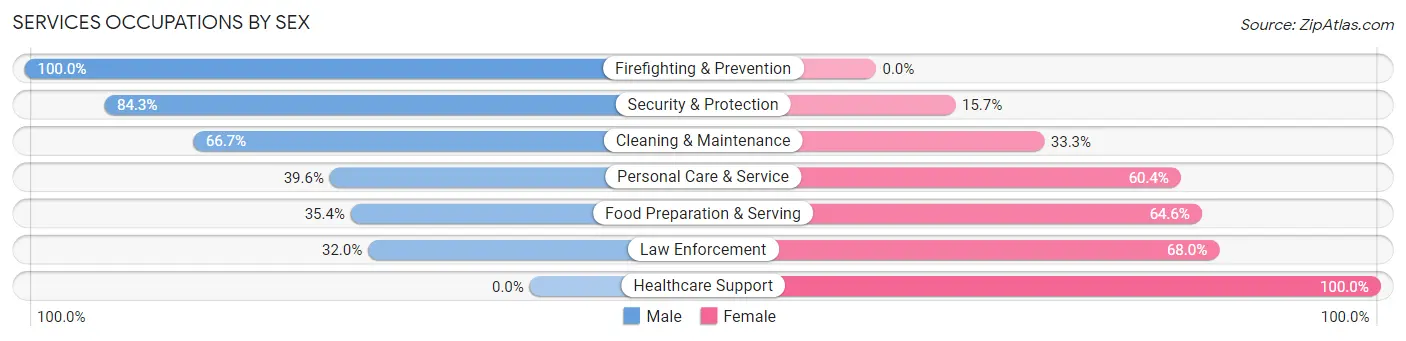
Services Occupations by Sex
Within the Services occupations in Clarkston, the most male-oriented occupations are Firefighting & Prevention (100.0%), Security & Protection (84.3%), and Cleaning & Maintenance (66.7%), while the most female-oriented occupations are Healthcare Support (100.0%), Law Enforcement (68.0%), and Food Preparation & Serving (64.6%).
| Occupation | Male | Female |
| Healthcare Support | 0 (0.0%) | 200 (100.0%) |
| Security & Protection | 91 (84.3%) | 17 (15.7%) |
| Firefighting & Prevention | 83 (100.0%) | 0 (0.0%) |
| Law Enforcement | 8 (32.0%) | 17 (68.0%) |
| Food Preparation & Serving | 136 (35.4%) | 248 (64.6%) |
| Cleaning & Maintenance | 108 (66.7%) | 54 (33.3%) |
| Personal Care & Service | 38 (39.6%) | 58 (60.4%) |
| Total (Category) | 373 (39.3%) | 577 (60.7%) |
| Total (Overall) | 3,473 (53.7%) | 2,994 (46.3%) |
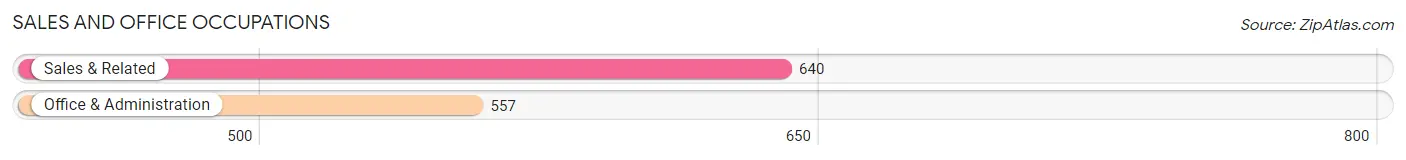
Sales and Office Occupations
The most common Sales and Office occupations in Clarkston are Sales & Related (640 | 9.9%), and Office & Administration (557 | 8.6%).
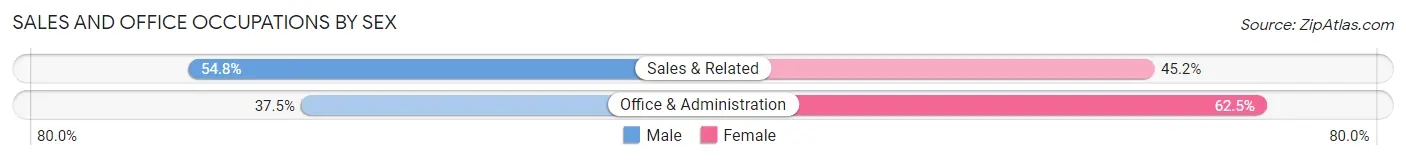
Sales and Office Occupations by Sex
| Occupation | Male | Female |
| Sales & Related | 351 (54.8%) | 289 (45.2%) |
| Office & Administration | 209 (37.5%) | 348 (62.5%) |
| Total (Category) | 560 (46.8%) | 637 (53.2%) |
| Total (Overall) | 3,473 (53.7%) | 2,994 (46.3%) |
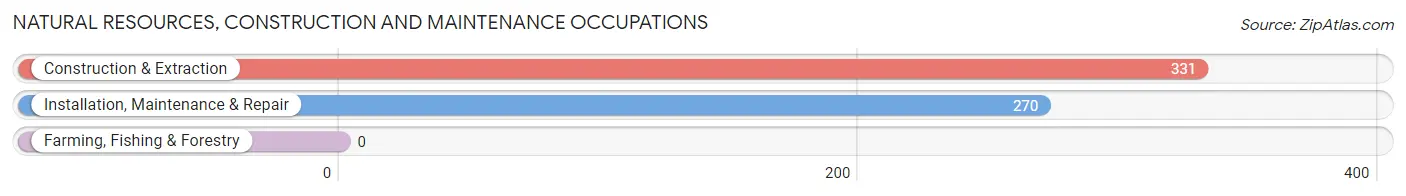
Natural Resources, Construction and Maintenance Occupations
The most common Natural Resources, Construction and Maintenance occupations in Clarkston are Construction & Extraction (331 | 5.1%), and Installation, Maintenance & Repair (270 | 4.2%).
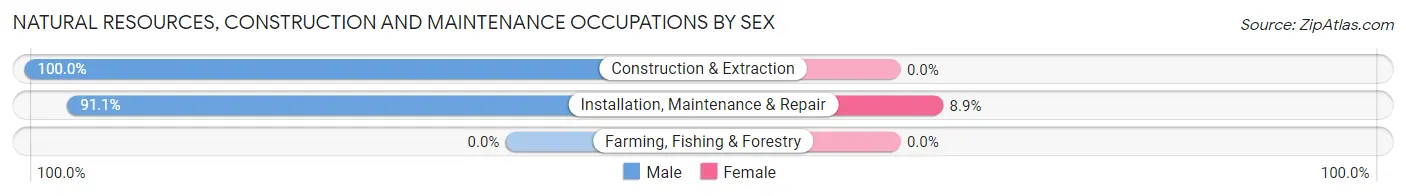
Natural Resources, Construction and Maintenance Occupations by Sex
| Occupation | Male | Female |
| Farming, Fishing & Forestry | 0 (0.0%) | 0 (0.0%) |
| Construction & Extraction | 331 (100.0%) | 0 (0.0%) |
| Installation, Maintenance & Repair | 246 (91.1%) | 24 (8.9%) |
| Total (Category) | 577 (96.0%) | 24 (4.0%) |
| Total (Overall) | 3,473 (53.7%) | 2,994 (46.3%) |
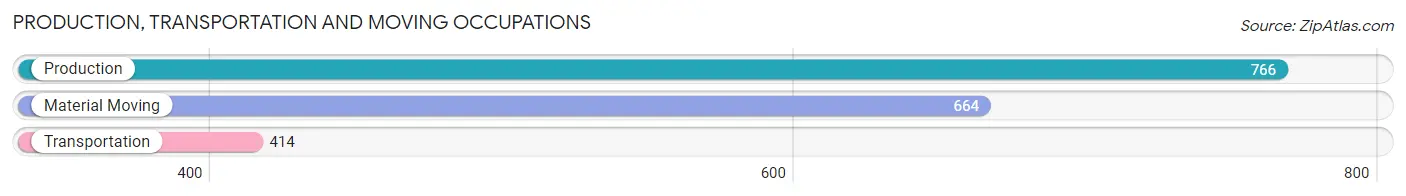
Production, Transportation and Moving Occupations
The most common Production, Transportation and Moving occupations in Clarkston are Production (766 | 11.8%), Material Moving (664 | 10.3%), and Transportation (414 | 6.4%).
Production, Transportation and Moving Occupations by Sex
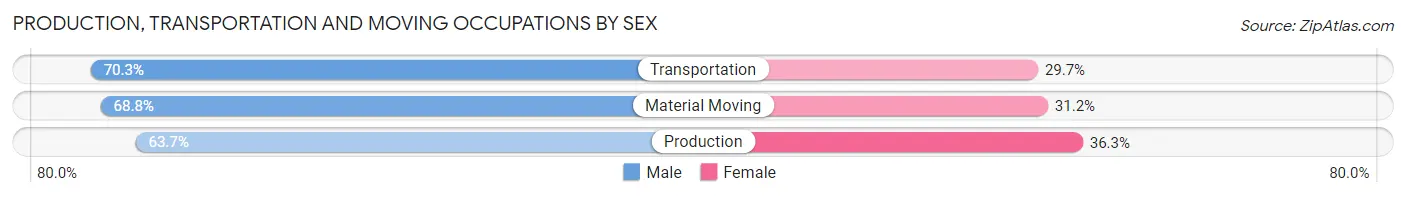
| Occupation | Male | Female |
| Production | 488 (63.7%) | 278 (36.3%) |
| Transportation | 291 (70.3%) | 123 (29.7%) |
| Material Moving | 457 (68.8%) | 207 (31.2%) |
| Total (Category) | 1,236 (67.0%) | 608 (33.0%) |
| Total (Overall) | 3,473 (53.7%) | 2,994 (46.3%) |
Employment Industries by Sex in Clarkston
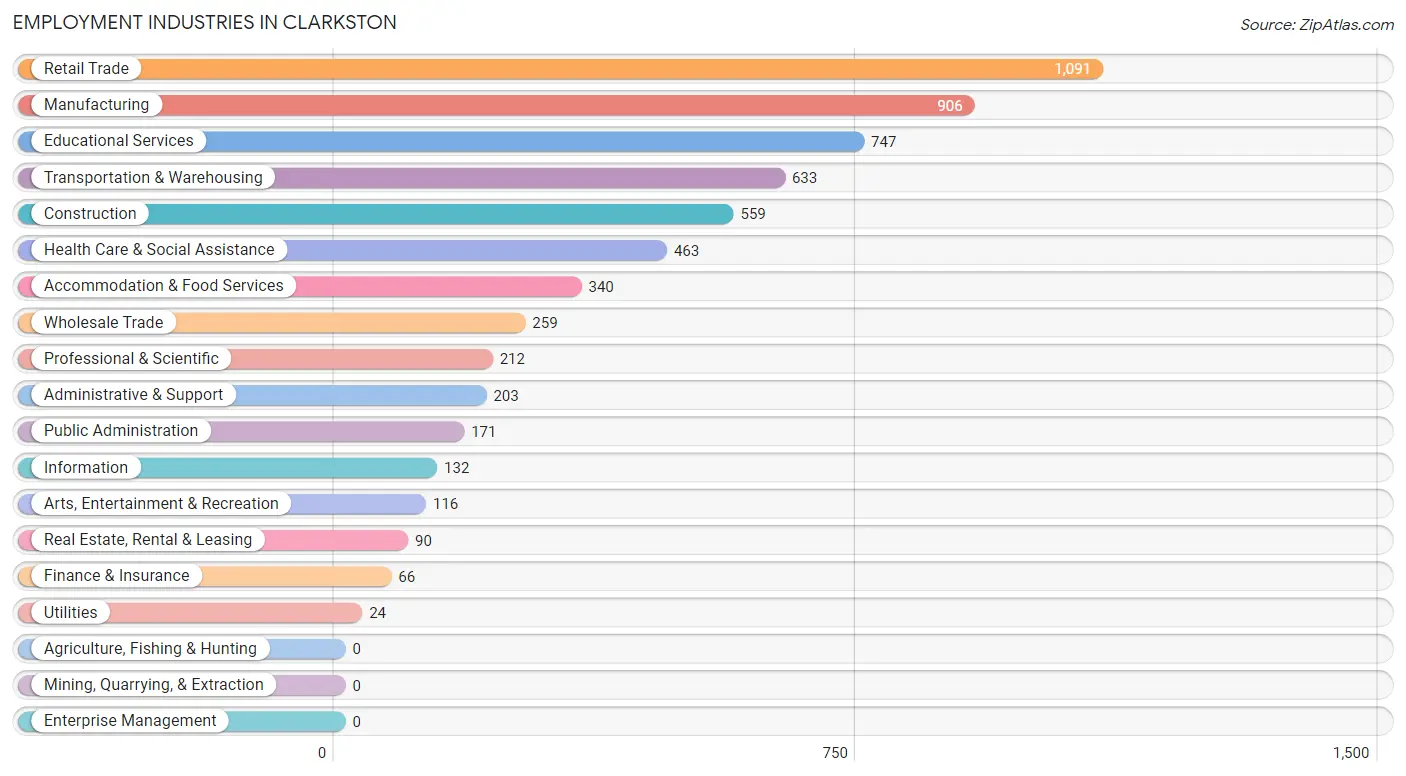
Employment Industries in Clarkston
The major employment industries in Clarkston include Retail Trade (1,091 | 16.9%), Manufacturing (906 | 14.0%), Educational Services (747 | 11.6%), Transportation & Warehousing (633 | 9.8%), and Construction (559 | 8.6%).
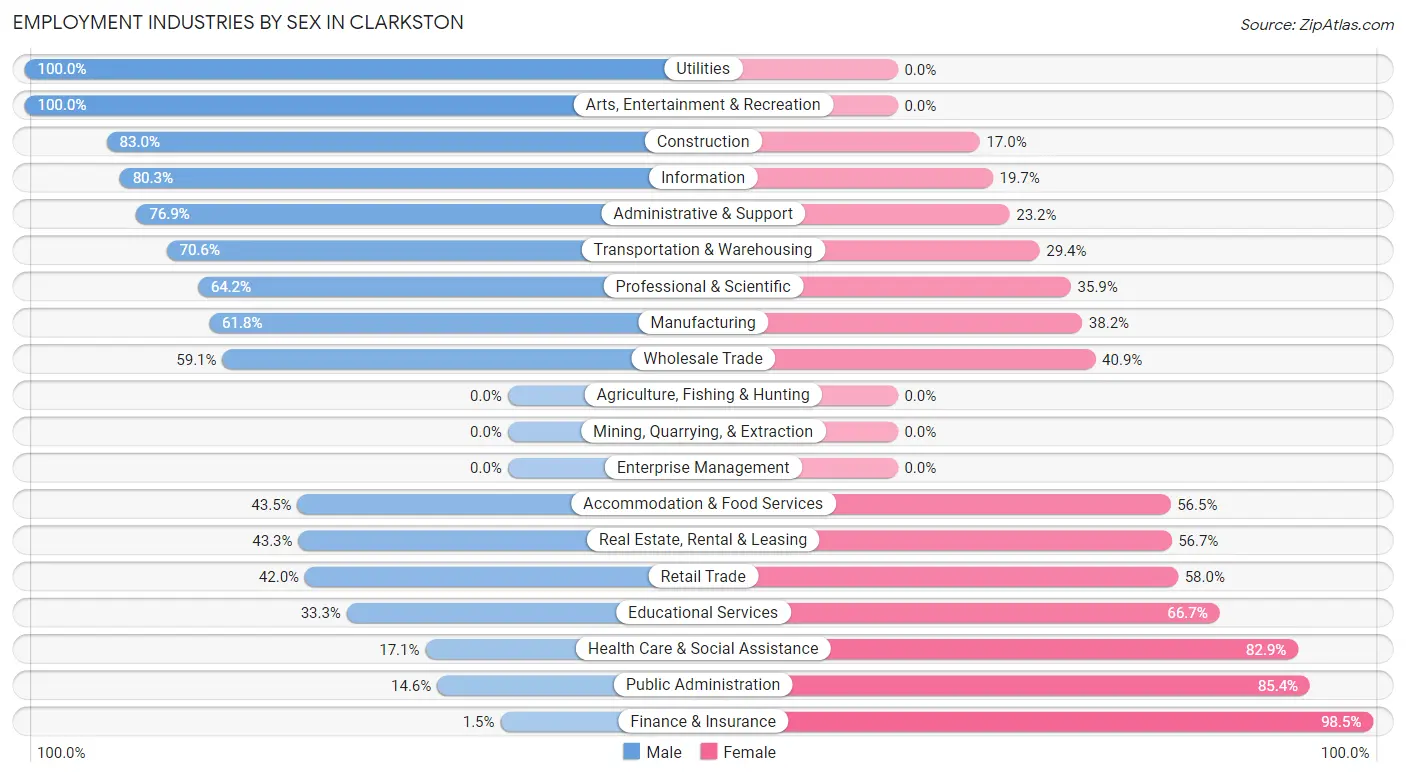
Employment Industries by Sex in Clarkston
The Clarkston industries that see more men than women are Utilities (100.0%), Arts, Entertainment & Recreation (100.0%), and Construction (83.0%), whereas the industries that tend to have a higher number of women are Finance & Insurance (98.5%), Public Administration (85.4%), and Health Care & Social Assistance (82.9%).
| Industry | Male | Female |
| Agriculture, Fishing & Hunting | 0 (0.0%) | 0 (0.0%) |
| Mining, Quarrying, & Extraction | 0 (0.0%) | 0 (0.0%) |
| Construction | 464 (83.0%) | 95 (17.0%) |
| Manufacturing | 560 (61.8%) | 346 (38.2%) |
| Wholesale Trade | 153 (59.1%) | 106 (40.9%) |
| Retail Trade | 458 (42.0%) | 633 (58.0%) |
| Transportation & Warehousing | 447 (70.6%) | 186 (29.4%) |
| Utilities | 24 (100.0%) | 0 (0.0%) |
| Information | 106 (80.3%) | 26 (19.7%) |
| Finance & Insurance | 1 (1.5%) | 65 (98.5%) |
| Real Estate, Rental & Leasing | 39 (43.3%) | 51 (56.7%) |
| Professional & Scientific | 136 (64.1%) | 76 (35.8%) |
| Enterprise Management | 0 (0.0%) | 0 (0.0%) |
| Administrative & Support | 156 (76.8%) | 47 (23.2%) |
| Educational Services | 249 (33.3%) | 498 (66.7%) |
| Health Care & Social Assistance | 79 (17.1%) | 384 (82.9%) |
| Arts, Entertainment & Recreation | 116 (100.0%) | 0 (0.0%) |
| Accommodation & Food Services | 148 (43.5%) | 192 (56.5%) |
| Public Administration | 25 (14.6%) | 146 (85.4%) |
| Total | 3,473 (53.7%) | 2,994 (46.3%) |
Education in Clarkston
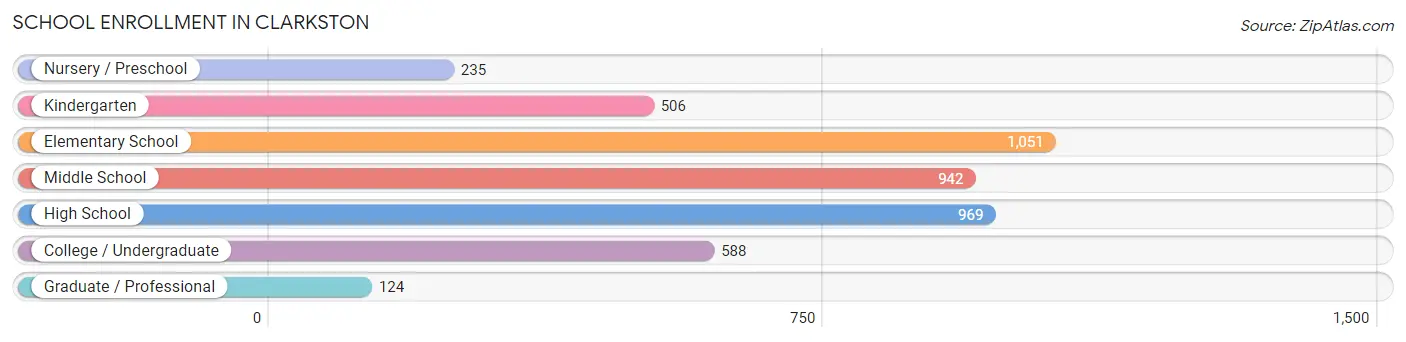
School Enrollment in Clarkston
The most common levels of schooling among the 4,415 students in Clarkston are elementary school (1,051 | 23.8%), high school (969 | 22.0%), and middle school (942 | 21.3%).
| School Level | # Students | % Students |
| Nursery / Preschool | 235 | 5.3% |
| Kindergarten | 506 | 11.5% |
| Elementary School | 1,051 | 23.8% |
| Middle School | 942 | 21.3% |
| High School | 969 | 22.0% |
| College / Undergraduate | 588 | 13.3% |
| Graduate / Professional | 124 | 2.8% |
| Total | 4,415 | 100.0% |
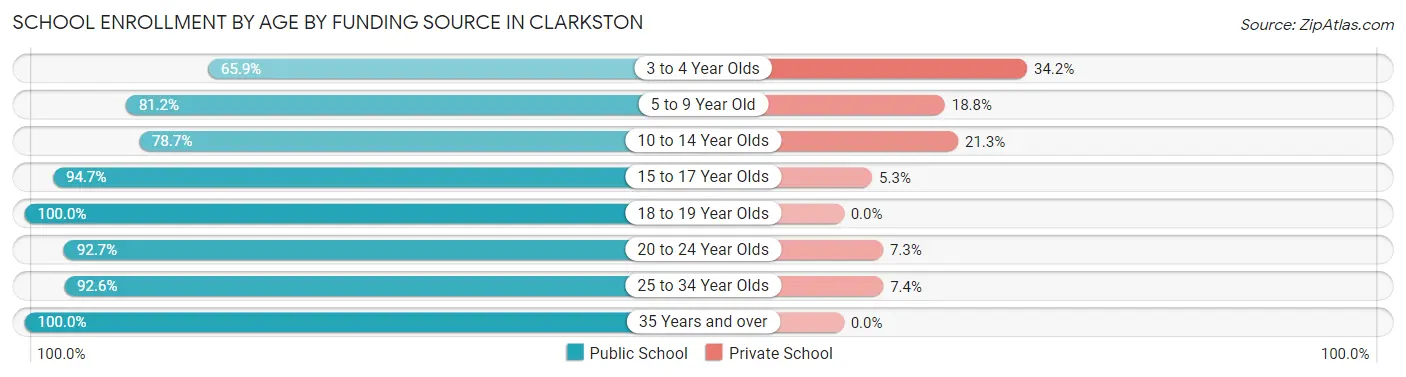
School Enrollment by Age by Funding Source in Clarkston
Out of a total of 4,415 students who are enrolled in schools in Clarkston, 658 (14.9%) attend a private institution, while the remaining 3,757 (85.1%) are enrolled in public schools. The age group of 3 to 4 year olds has the highest likelihood of being enrolled in private schools, with 97 (34.2% in the age bracket) enrolled. Conversely, the age group of 18 to 19 year olds has the lowest likelihood of being enrolled in a private school, with 372 (100.0% in the age bracket) attending a public institution.
| Age Bracket | Public School | Private School |
| 3 to 4 Year Olds | 187 (65.8%) | 97 (34.2%) |
| 5 to 9 Year Old | 1,034 (81.2%) | 240 (18.8%) |
| 10 to 14 Year Olds | 938 (78.7%) | 254 (21.3%) |
| 15 to 17 Year Olds | 535 (94.7%) | 30 (5.3%) |
| 18 to 19 Year Olds | 372 (100.0%) | 0 (0.0%) |
| 20 to 24 Year Olds | 266 (92.7%) | 21 (7.3%) |
| 25 to 34 Year Olds | 201 (92.6%) | 16 (7.4%) |
| 35 Years and over | 224 (100.0%) | 0 (0.0%) |
| Total | 3,757 (85.1%) | 658 (14.9%) |
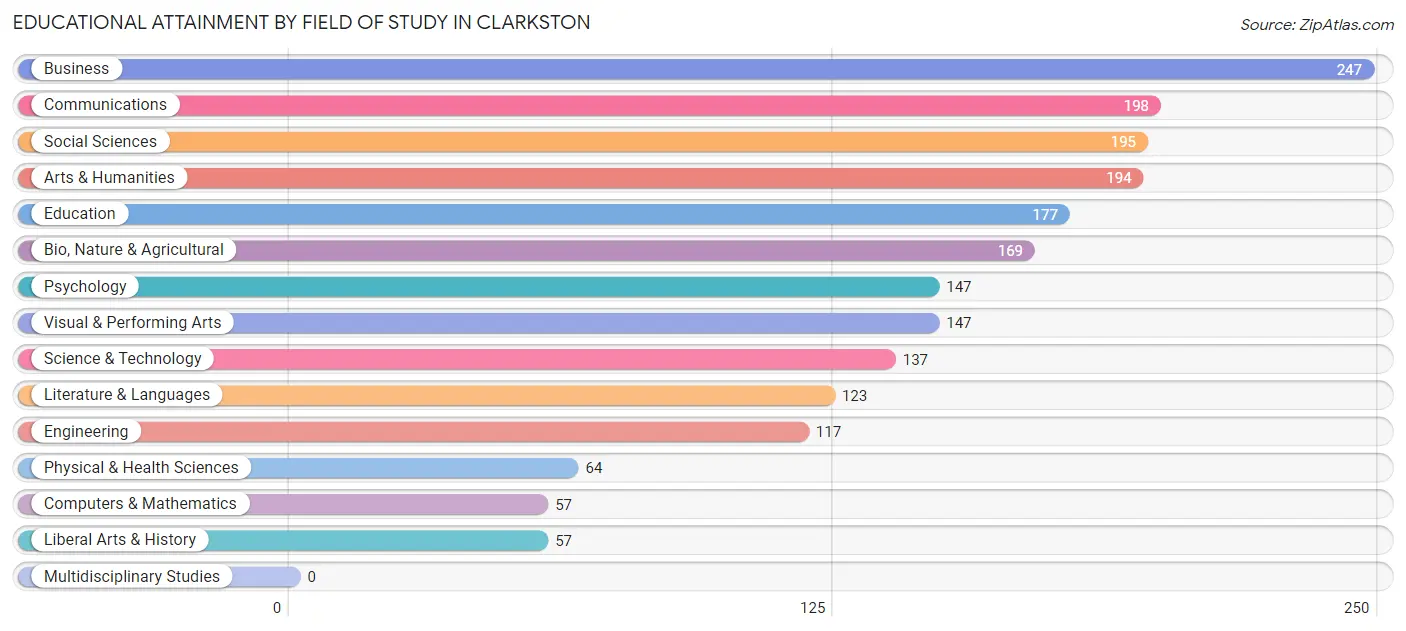
Educational Attainment by Field of Study in Clarkston
Business (247 | 12.2%), communications (198 | 9.8%), social sciences (195 | 9.6%), arts & humanities (194 | 9.6%), and education (177 | 8.7%) are the most common fields of study among 2,029 individuals in Clarkston who have obtained a bachelor's degree or higher.
| Field of Study | # Graduates | % Graduates |
| Computers & Mathematics | 57 | 2.8% |
| Bio, Nature & Agricultural | 169 | 8.3% |
| Physical & Health Sciences | 64 | 3.2% |
| Psychology | 147 | 7.2% |
| Social Sciences | 195 | 9.6% |
| Engineering | 117 | 5.8% |
| Multidisciplinary Studies | 0 | 0.0% |
| Science & Technology | 137 | 6.8% |
| Business | 247 | 12.2% |
| Education | 177 | 8.7% |
| Literature & Languages | 123 | 6.1% |
| Liberal Arts & History | 57 | 2.8% |
| Visual & Performing Arts | 147 | 7.2% |
| Communications | 198 | 9.8% |
| Arts & Humanities | 194 | 9.6% |
| Total | 2,029 | 100.0% |
Transportation & Commute in Clarkston
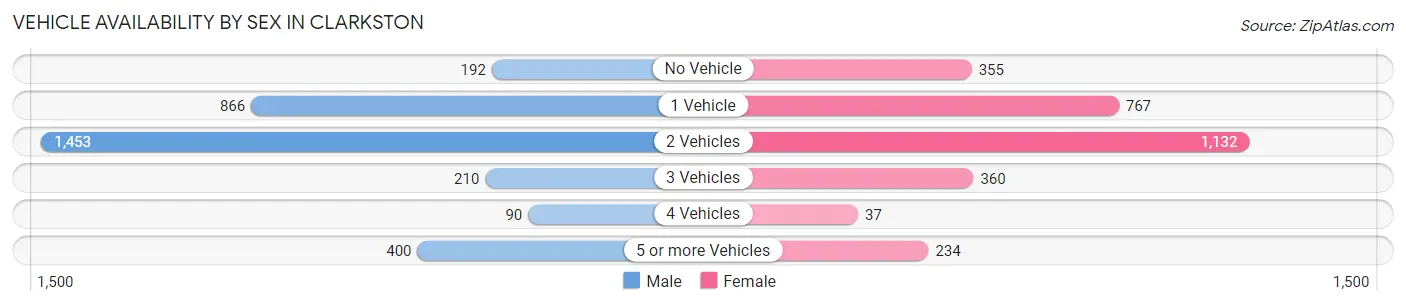
Vehicle Availability by Sex in Clarkston
The most prevalent vehicle ownership categories in Clarkston are males with 2 vehicles (1,453, accounting for 45.3%) and females with 2 vehicles (1,132, making up 50.4%).
| Vehicles Available | Male | Female |
| No Vehicle | 192 (6.0%) | 355 (12.3%) |
| 1 Vehicle | 866 (27.0%) | 767 (26.6%) |
| 2 Vehicles | 1,453 (45.3%) | 1,132 (39.2%) |
| 3 Vehicles | 210 (6.5%) | 360 (12.5%) |
| 4 Vehicles | 90 (2.8%) | 37 (1.3%) |
| 5 or more Vehicles | 400 (12.5%) | 234 (8.1%) |
| Total | 3,211 (100.0%) | 2,885 (100.0%) |
Commute Time in Clarkston
The most frequently occuring commute durations in Clarkston are 30 to 34 minutes (1,126 commuters, 20.4%), 20 to 24 minutes (806 commuters, 14.6%), and 60 to 89 minutes (753 commuters, 13.7%).
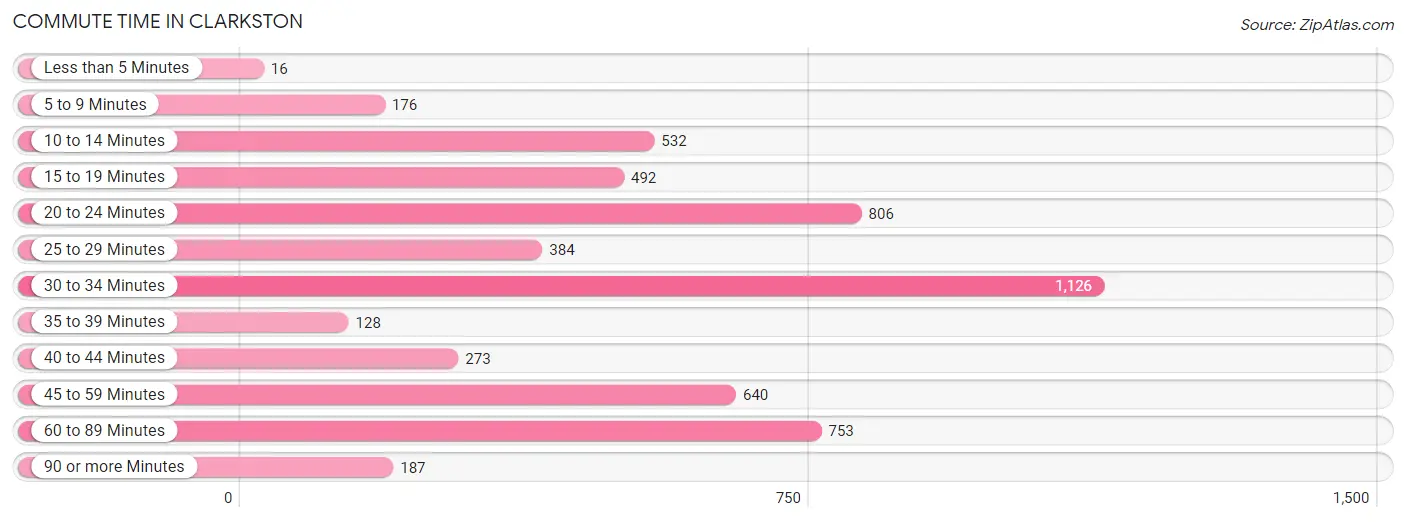
| Commute Time | # Commuters | % Commuters |
| Less than 5 Minutes | 16 | 0.3% |
| 5 to 9 Minutes | 176 | 3.2% |
| 10 to 14 Minutes | 532 | 9.7% |
| 15 to 19 Minutes | 492 | 8.9% |
| 20 to 24 Minutes | 806 | 14.6% |
| 25 to 29 Minutes | 384 | 7.0% |
| 30 to 34 Minutes | 1,126 | 20.4% |
| 35 to 39 Minutes | 128 | 2.3% |
| 40 to 44 Minutes | 273 | 5.0% |
| 45 to 59 Minutes | 640 | 11.6% |
| 60 to 89 Minutes | 753 | 13.7% |
| 90 or more Minutes | 187 | 3.4% |
Commute Time by Sex in Clarkston
The most common commute times in Clarkston are 30 to 34 minutes (814 commuters, 26.8%) for males and 20 to 24 minutes (384 commuters, 15.5%) for females.
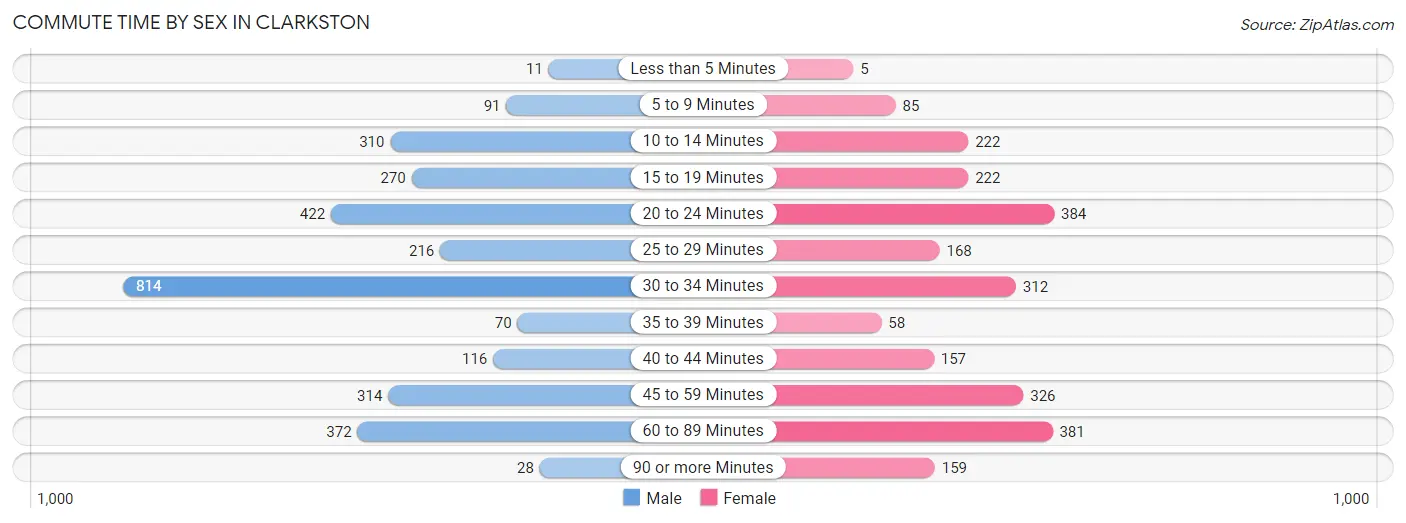
| Commute Time | Male | Female |
| Less than 5 Minutes | 11 (0.4%) | 5 (0.2%) |
| 5 to 9 Minutes | 91 (3.0%) | 85 (3.4%) |
| 10 to 14 Minutes | 310 (10.2%) | 222 (9.0%) |
| 15 to 19 Minutes | 270 (8.9%) | 222 (9.0%) |
| 20 to 24 Minutes | 422 (13.9%) | 384 (15.5%) |
| 25 to 29 Minutes | 216 (7.1%) | 168 (6.8%) |
| 30 to 34 Minutes | 814 (26.8%) | 312 (12.6%) |
| 35 to 39 Minutes | 70 (2.3%) | 58 (2.3%) |
| 40 to 44 Minutes | 116 (3.8%) | 157 (6.3%) |
| 45 to 59 Minutes | 314 (10.3%) | 326 (13.2%) |
| 60 to 89 Minutes | 372 (12.3%) | 381 (15.4%) |
| 90 or more Minutes | 28 (0.9%) | 159 (6.4%) |
Time of Departure to Work by Sex in Clarkston
The most frequent times of departure to work in Clarkston are 12:00 PM to 3:59 PM (472, 15.6%) for males and 6:00 AM to 6:29 AM (488, 19.7%) for females.
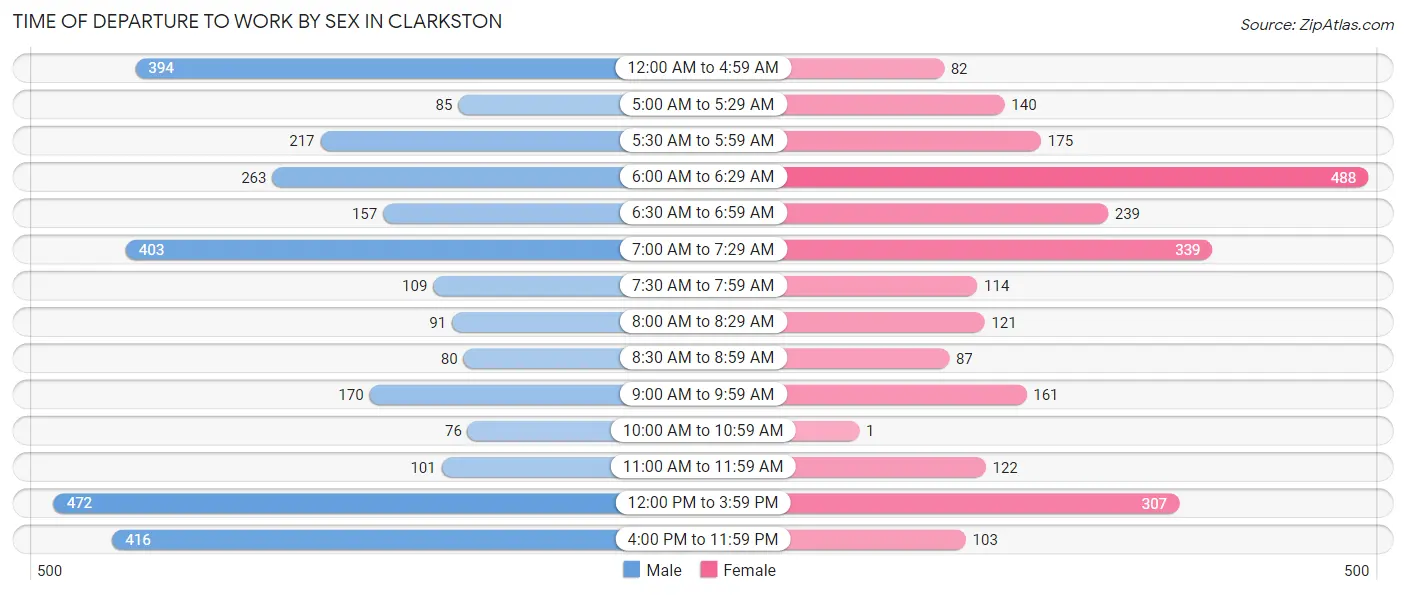
| Time of Departure | Male | Female |
| 12:00 AM to 4:59 AM | 394 (13.0%) | 82 (3.3%) |
| 5:00 AM to 5:29 AM | 85 (2.8%) | 140 (5.7%) |
| 5:30 AM to 5:59 AM | 217 (7.1%) | 175 (7.1%) |
| 6:00 AM to 6:29 AM | 263 (8.7%) | 488 (19.7%) |
| 6:30 AM to 6:59 AM | 157 (5.2%) | 239 (9.6%) |
| 7:00 AM to 7:29 AM | 403 (13.3%) | 339 (13.7%) |
| 7:30 AM to 7:59 AM | 109 (3.6%) | 114 (4.6%) |
| 8:00 AM to 8:29 AM | 91 (3.0%) | 121 (4.9%) |
| 8:30 AM to 8:59 AM | 80 (2.6%) | 87 (3.5%) |
| 9:00 AM to 9:59 AM | 170 (5.6%) | 161 (6.5%) |
| 10:00 AM to 10:59 AM | 76 (2.5%) | 1 (0.0%) |
| 11:00 AM to 11:59 AM | 101 (3.3%) | 122 (4.9%) |
| 12:00 PM to 3:59 PM | 472 (15.6%) | 307 (12.4%) |
| 4:00 PM to 11:59 PM | 416 (13.7%) | 103 (4.2%) |
| Total | 3,034 (100.0%) | 2,479 (100.0%) |
Housing Occupancy in Clarkston
Occupancy by Ownership in Clarkston
Of the total 3,807 dwellings in Clarkston, owner-occupied units account for 480 (12.6%), while renter-occupied units make up 3,327 (87.4%).
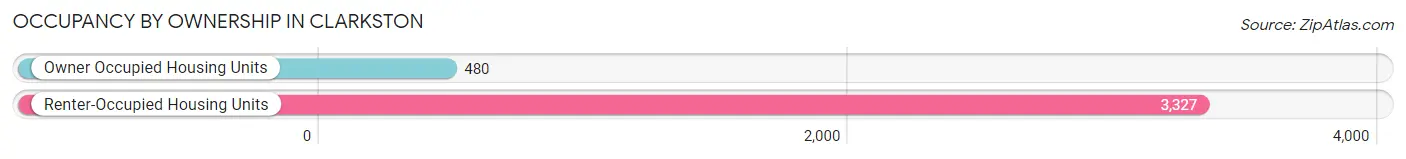
| Occupancy | # Housing Units | % Housing Units |
| Owner Occupied Housing Units | 480 | 12.6% |
| Renter-Occupied Housing Units | 3,327 | 87.4% |
| Total Occupied Housing Units | 3,807 | 100.0% |
Occupancy by Household Size in Clarkston
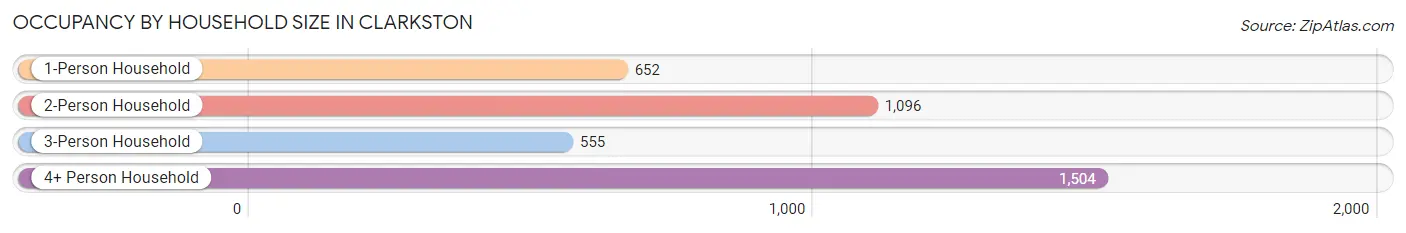
| Household Size | # Housing Units | % Housing Units |
| 1-Person Household | 652 | 17.1% |
| 2-Person Household | 1,096 | 28.8% |
| 3-Person Household | 555 | 14.6% |
| 4+ Person Household | 1,504 | 39.5% |
| Total Housing Units | 3,807 | 100.0% |
Occupancy by Ownership by Household Size in Clarkston
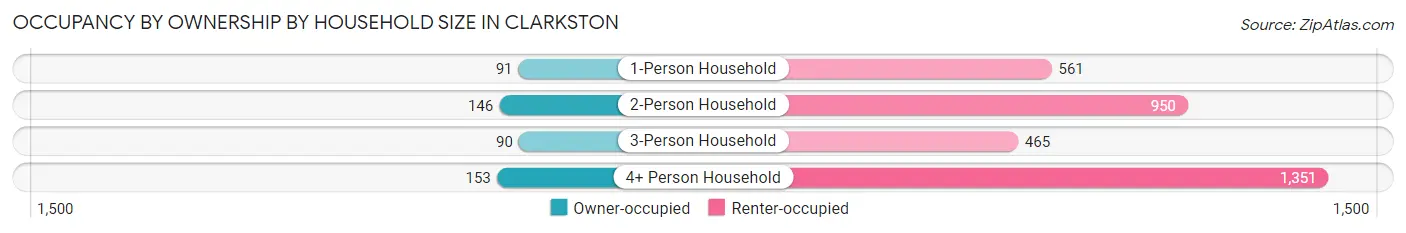
| Household Size | Owner-occupied | Renter-occupied |
| 1-Person Household | 91 (14.0%) | 561 (86.0%) |
| 2-Person Household | 146 (13.3%) | 950 (86.7%) |
| 3-Person Household | 90 (16.2%) | 465 (83.8%) |
| 4+ Person Household | 153 (10.2%) | 1,351 (89.8%) |
| Total Housing Units | 480 (12.6%) | 3,327 (87.4%) |
Occupancy by Educational Attainment in Clarkston
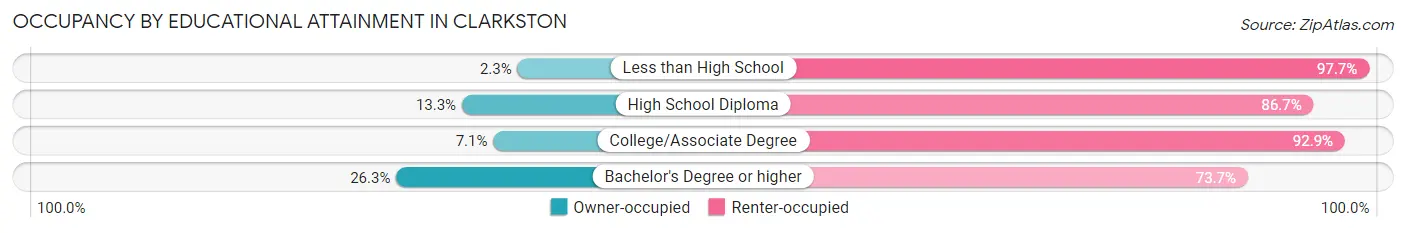
| Household Size | Owner-occupied | Renter-occupied |
| Less than High School | 18 (2.3%) | 776 (97.7%) |
| High School Diploma | 118 (13.3%) | 770 (86.7%) |
| College/Associate Degree | 79 (7.1%) | 1,039 (92.9%) |
| Bachelor's Degree or higher | 265 (26.3%) | 742 (73.7%) |
Occupancy by Age of Householder in Clarkston
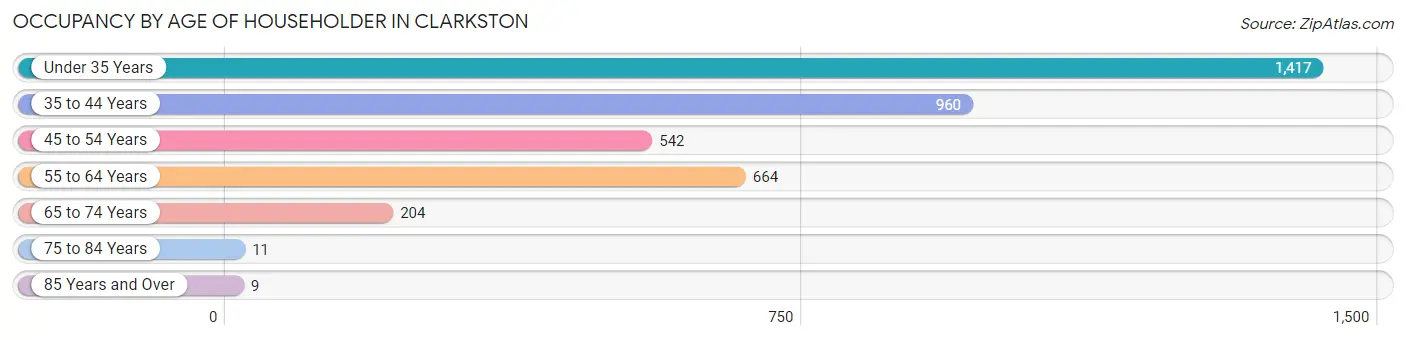
| Age Bracket | # Households | % Households |
| Under 35 Years | 1,417 | 37.2% |
| 35 to 44 Years | 960 | 25.2% |
| 45 to 54 Years | 542 | 14.2% |
| 55 to 64 Years | 664 | 17.4% |
| 65 to 74 Years | 204 | 5.4% |
| 75 to 84 Years | 11 | 0.3% |
| 85 Years and Over | 9 | 0.2% |
| Total | 3,807 | 100.0% |
Housing Finances in Clarkston
Median Income by Occupancy in Clarkston
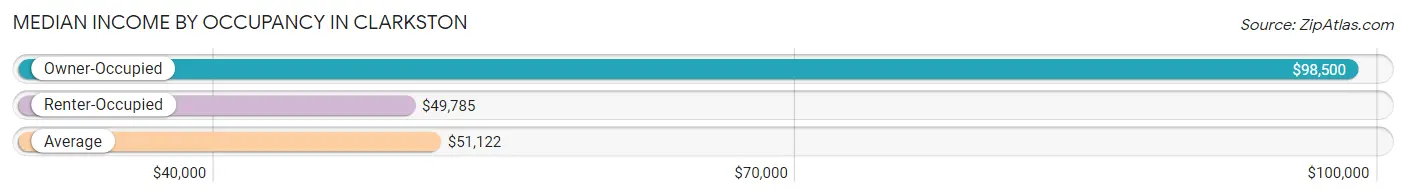
| Occupancy Type | # Households | Median Income |
| Owner-Occupied | 480 (12.6%) | $98,500 |
| Renter-Occupied | 3,327 (87.4%) | $49,785 |
| Average | 3,807 (100.0%) | $51,122 |
Occupancy by Householder Income Bracket in Clarkston
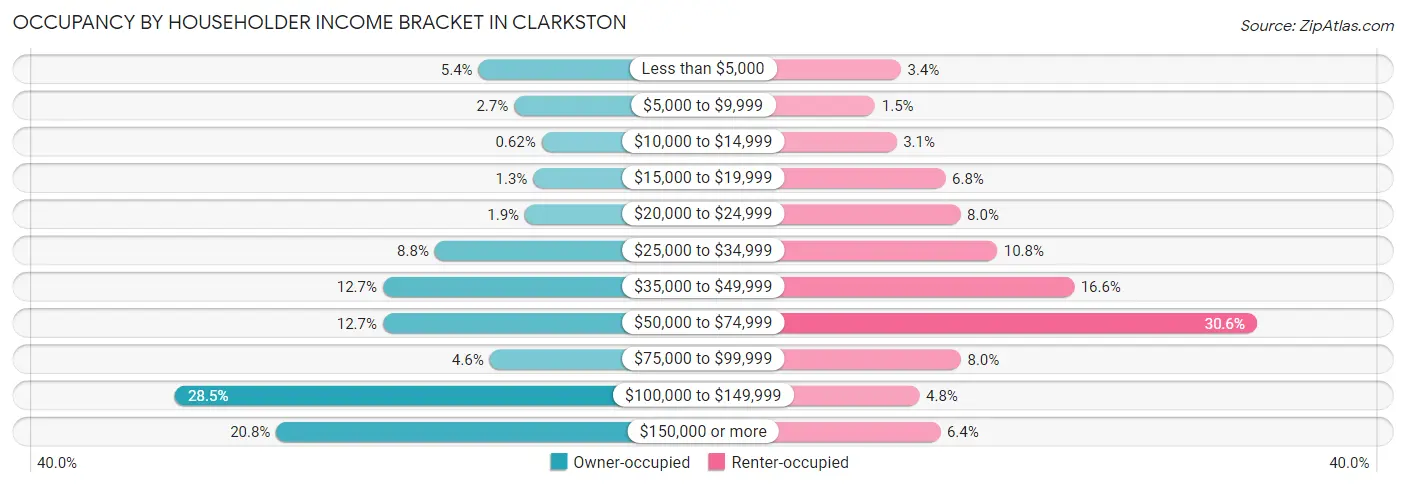
| Income Bracket | Owner-occupied | Renter-occupied |
| Less than $5,000 | 26 (5.4%) | 114 (3.4%) |
| $5,000 to $9,999 | 13 (2.7%) | 49 (1.5%) |
| $10,000 to $14,999 | 3 (0.6%) | 103 (3.1%) |
| $15,000 to $19,999 | 6 (1.3%) | 227 (6.8%) |
| $20,000 to $24,999 | 9 (1.9%) | 265 (8.0%) |
| $25,000 to $34,999 | 42 (8.7%) | 358 (10.8%) |
| $35,000 to $49,999 | 61 (12.7%) | 553 (16.6%) |
| $50,000 to $74,999 | 61 (12.7%) | 1,017 (30.6%) |
| $75,000 to $99,999 | 22 (4.6%) | 266 (8.0%) |
| $100,000 to $149,999 | 137 (28.5%) | 161 (4.8%) |
| $150,000 or more | 100 (20.8%) | 214 (6.4%) |
| Total | 480 (100.0%) | 3,327 (100.0%) |
Monthly Housing Cost Tiers in Clarkston
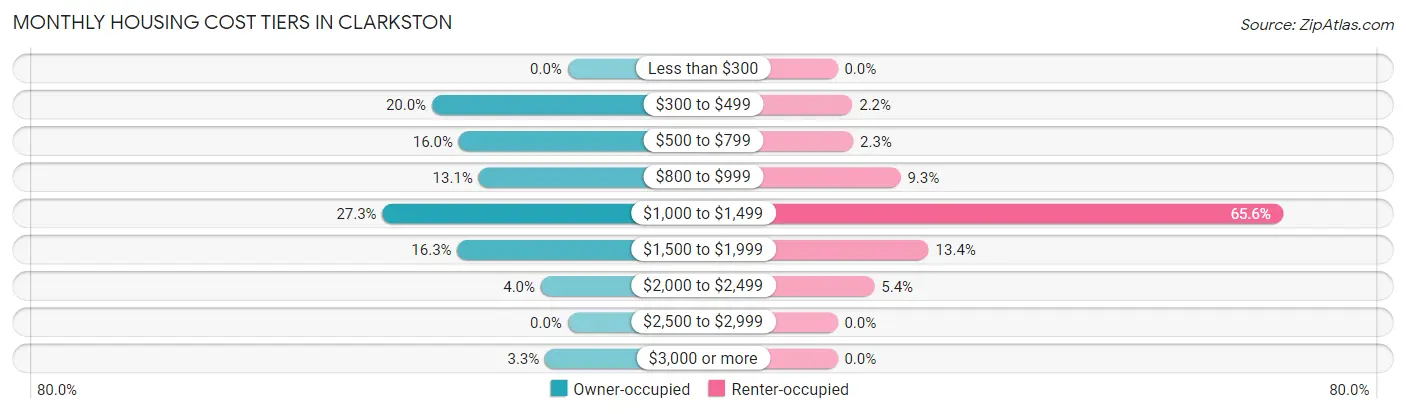
| Monthly Cost | Owner-occupied | Renter-occupied |
| Less than $300 | 0 (0.0%) | 0 (0.0%) |
| $300 to $499 | 96 (20.0%) | 73 (2.2%) |
| $500 to $799 | 77 (16.0%) | 77 (2.3%) |
| $800 to $999 | 63 (13.1%) | 309 (9.3%) |
| $1,000 to $1,499 | 131 (27.3%) | 2,182 (65.6%) |
| $1,500 to $1,999 | 78 (16.3%) | 447 (13.4%) |
| $2,000 to $2,499 | 19 (4.0%) | 181 (5.4%) |
| $2,500 to $2,999 | 0 (0.0%) | 0 (0.0%) |
| $3,000 or more | 16 (3.3%) | 0 (0.0%) |
| Total | 480 (100.0%) | 3,327 (100.0%) |
Physical Housing Characteristics in Clarkston
Housing Structures in Clarkston
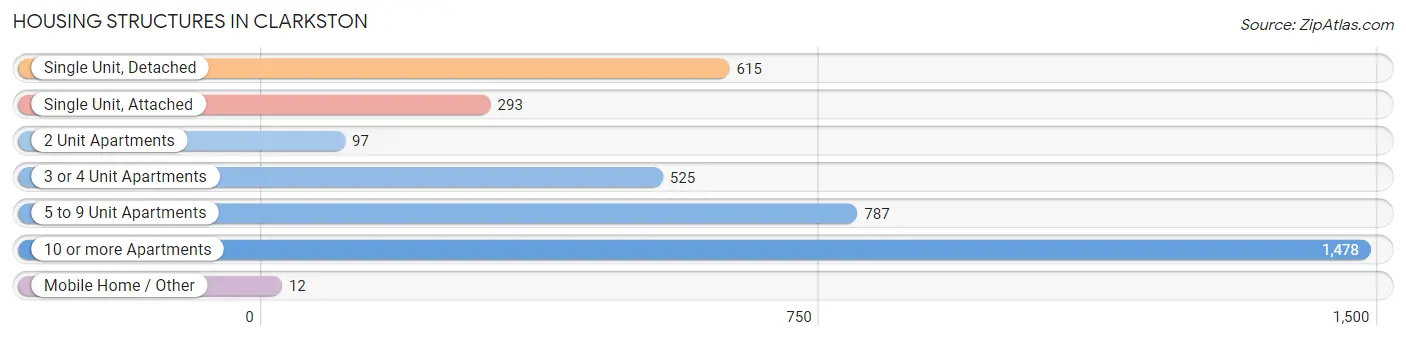
| Structure Type | # Housing Units | % Housing Units |
| Single Unit, Detached | 615 | 16.2% |
| Single Unit, Attached | 293 | 7.7% |
| 2 Unit Apartments | 97 | 2.5% |
| 3 or 4 Unit Apartments | 525 | 13.8% |
| 5 to 9 Unit Apartments | 787 | 20.7% |
| 10 or more Apartments | 1,478 | 38.8% |
| Mobile Home / Other | 12 | 0.3% |
| Total | 3,807 | 100.0% |
Housing Structures by Occupancy in Clarkston
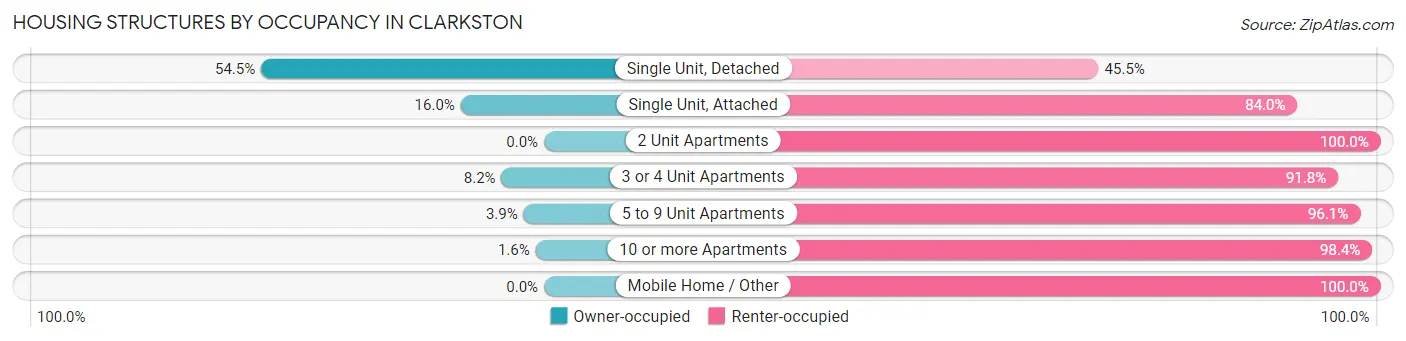
| Structure Type | Owner-occupied | Renter-occupied |
| Single Unit, Detached | 335 (54.5%) | 280 (45.5%) |
| Single Unit, Attached | 47 (16.0%) | 246 (84.0%) |
| 2 Unit Apartments | 0 (0.0%) | 97 (100.0%) |
| 3 or 4 Unit Apartments | 43 (8.2%) | 482 (91.8%) |
| 5 to 9 Unit Apartments | 31 (3.9%) | 756 (96.1%) |
| 10 or more Apartments | 24 (1.6%) | 1,454 (98.4%) |
| Mobile Home / Other | 0 (0.0%) | 12 (100.0%) |
| Total | 480 (12.6%) | 3,327 (87.4%) |
Housing Structures by Number of Rooms in Clarkston
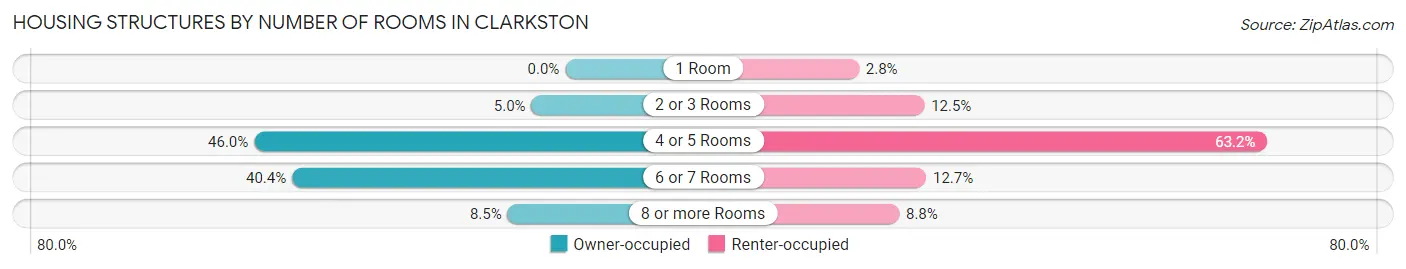
| Number of Rooms | Owner-occupied | Renter-occupied |
| 1 Room | 0 (0.0%) | 93 (2.8%) |
| 2 or 3 Rooms | 24 (5.0%) | 415 (12.5%) |
| 4 or 5 Rooms | 221 (46.0%) | 2,104 (63.2%) |
| 6 or 7 Rooms | 194 (40.4%) | 424 (12.7%) |
| 8 or more Rooms | 41 (8.5%) | 291 (8.7%) |
| Total | 480 (100.0%) | 3,327 (100.0%) |
Housing Structure by Heating Type in Clarkston
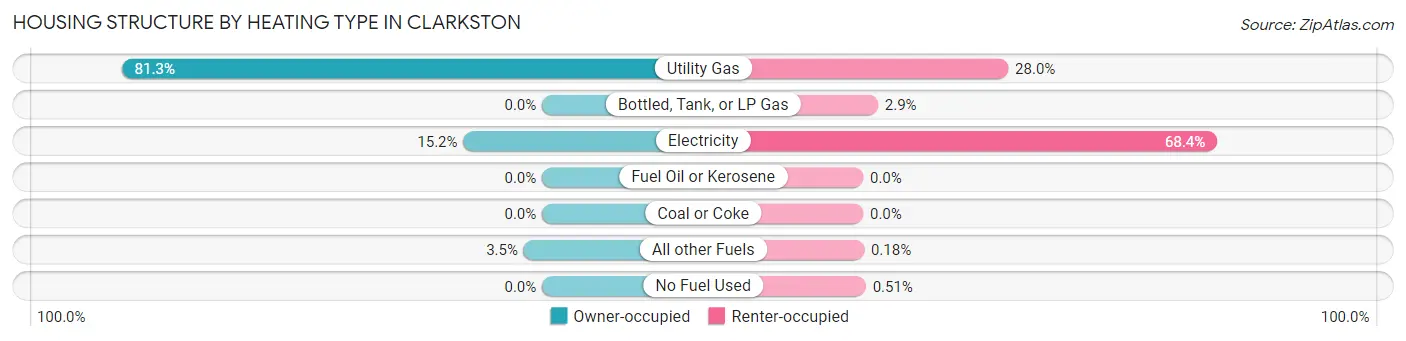
| Heating Type | Owner-occupied | Renter-occupied |
| Utility Gas | 390 (81.2%) | 933 (28.0%) |
| Bottled, Tank, or LP Gas | 0 (0.0%) | 95 (2.9%) |
| Electricity | 73 (15.2%) | 2,276 (68.4%) |
| Fuel Oil or Kerosene | 0 (0.0%) | 0 (0.0%) |
| Coal or Coke | 0 (0.0%) | 0 (0.0%) |
| All other Fuels | 17 (3.5%) | 6 (0.2%) |
| No Fuel Used | 0 (0.0%) | 17 (0.5%) |
| Total | 480 (100.0%) | 3,327 (100.0%) |
Household Vehicle Usage in Clarkston
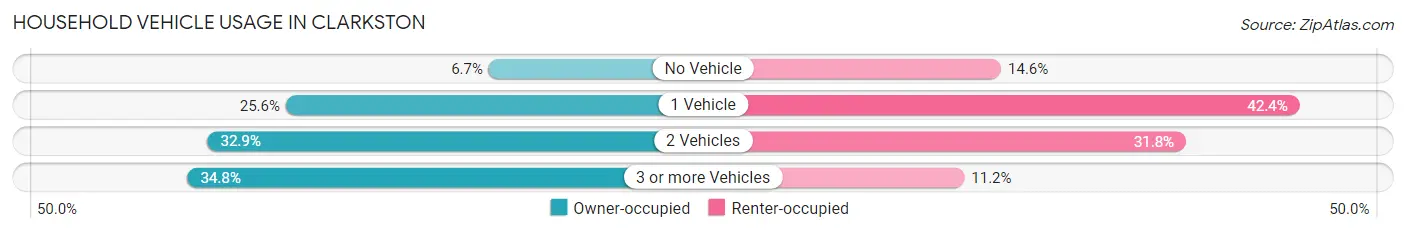
| Vehicles per Household | Owner-occupied | Renter-occupied |
| No Vehicle | 32 (6.7%) | 485 (14.6%) |
| 1 Vehicle | 123 (25.6%) | 1,412 (42.4%) |
| 2 Vehicles | 158 (32.9%) | 1,059 (31.8%) |
| 3 or more Vehicles | 167 (34.8%) | 371 (11.2%) |
| Total | 480 (100.0%) | 3,327 (100.0%) |
Real Estate & Mortgages in Clarkston
Real Estate and Mortgage Overview in Clarkston
| Characteristic | Without Mortgage | With Mortgage |
| Housing Units | 156 | 324 |
| Median Property Value | $176,300 | $264,800 |
| Median Household Income | - | - |
| Monthly Housing Costs | $478 | $16 |
| Real Estate Taxes | $2,143 | $22 |
Property Value by Mortgage Status in Clarkston
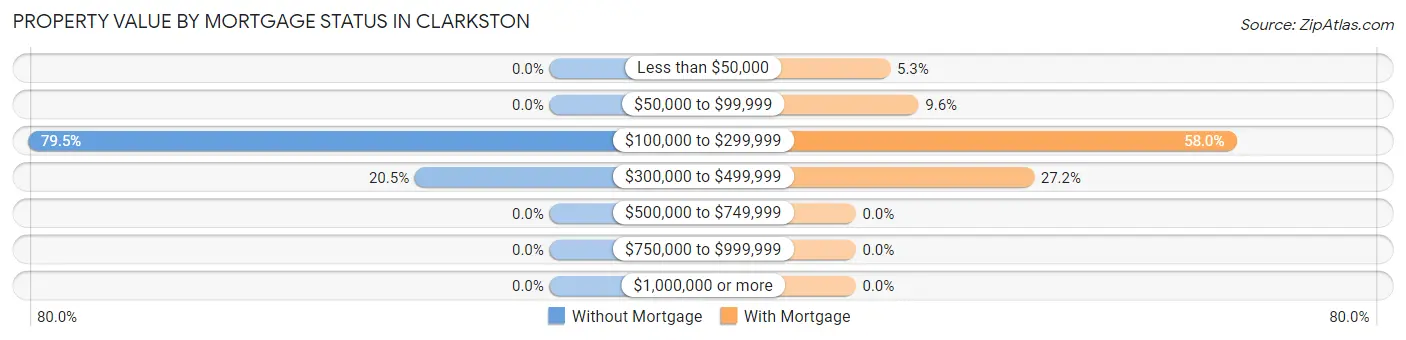
| Property Value | Without Mortgage | With Mortgage |
| Less than $50,000 | 0 (0.0%) | 17 (5.2%) |
| $50,000 to $99,999 | 0 (0.0%) | 31 (9.6%) |
| $100,000 to $299,999 | 124 (79.5%) | 188 (58.0%) |
| $300,000 to $499,999 | 32 (20.5%) | 88 (27.2%) |
| $500,000 to $749,999 | 0 (0.0%) | 0 (0.0%) |
| $750,000 to $999,999 | 0 (0.0%) | 0 (0.0%) |
| $1,000,000 or more | 0 (0.0%) | 0 (0.0%) |
| Total | 156 (100.0%) | 324 (100.0%) |
Household Income by Mortgage Status in Clarkston
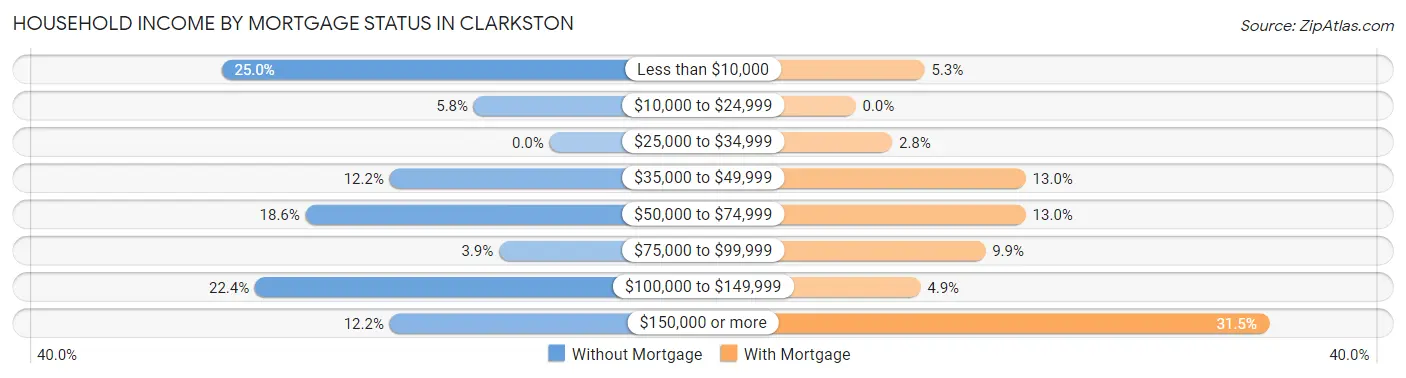
| Household Income | Without Mortgage | With Mortgage |
| Less than $10,000 | 39 (25.0%) | 17 (5.2%) |
| $10,000 to $24,999 | 9 (5.8%) | 0 (0.0%) |
| $25,000 to $34,999 | 0 (0.0%) | 9 (2.8%) |
| $35,000 to $49,999 | 19 (12.2%) | 42 (13.0%) |
| $50,000 to $74,999 | 29 (18.6%) | 42 (13.0%) |
| $75,000 to $99,999 | 6 (3.8%) | 32 (9.9%) |
| $100,000 to $149,999 | 35 (22.4%) | 16 (4.9%) |
| $150,000 or more | 19 (12.2%) | 102 (31.5%) |
| Total | 156 (100.0%) | 324 (100.0%) |
Property Value to Household Income Ratio in Clarkston
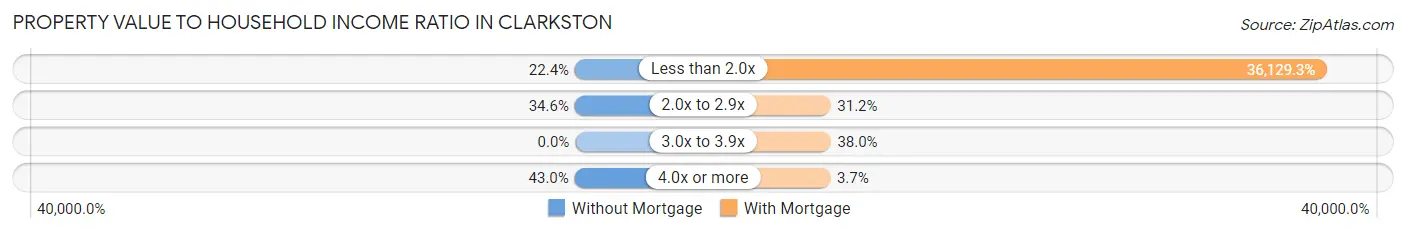
| Value-to-Income Ratio | Without Mortgage | With Mortgage |
| Less than 2.0x | 35 (22.4%) | 117,059 (36,129.3%) |
| 2.0x to 2.9x | 54 (34.6%) | 101 (31.2%) |
| 3.0x to 3.9x | 0 (0.0%) | 123 (38.0%) |
| 4.0x or more | 67 (42.9%) | 12 (3.7%) |
| Total | 156 (100.0%) | 324 (100.0%) |
Real Estate Taxes by Mortgage Status in Clarkston
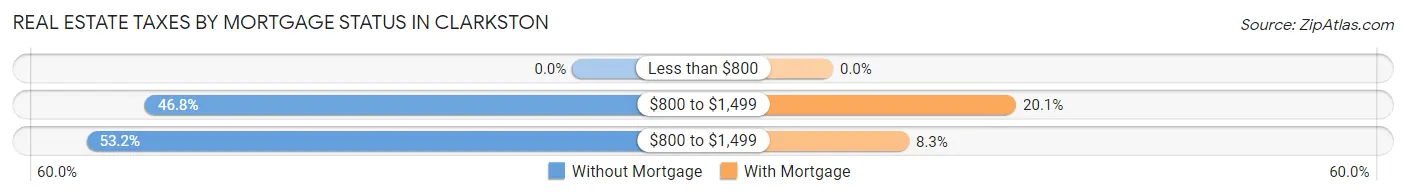
| Property Taxes | Without Mortgage | With Mortgage |
| Less than $800 | 0 (0.0%) | 0 (0.0%) |
| $800 to $1,499 | 73 (46.8%) | 65 (20.1%) |
| $800 to $1,499 | 83 (53.2%) | 27 (8.3%) |
| Total | 156 (100.0%) | 324 (100.0%) |
Health & Disability in Clarkston
Health Insurance Coverage by Age in Clarkston
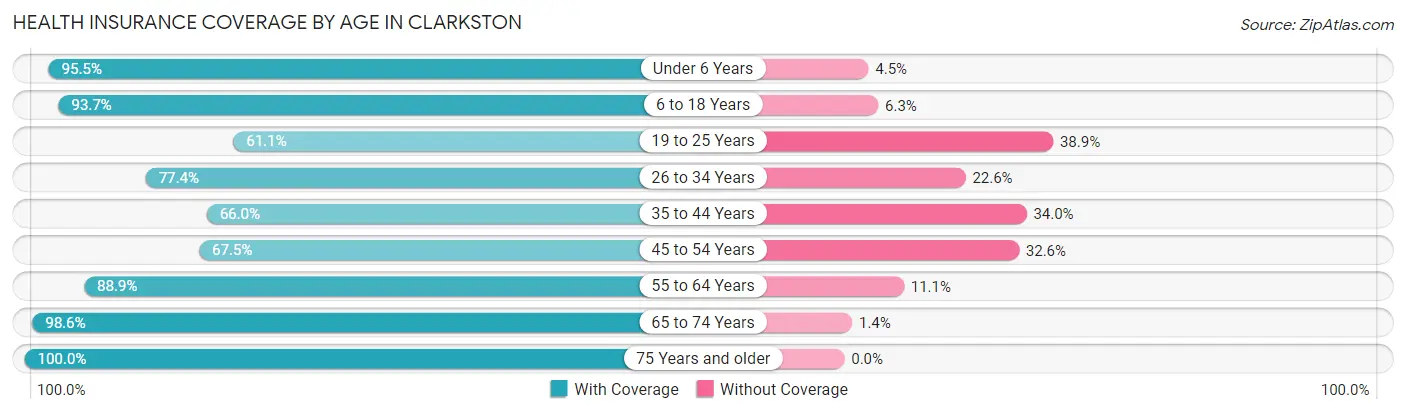
| Age Bracket | With Coverage | Without Coverage |
| Under 6 Years | 2,048 (95.5%) | 96 (4.5%) |
| 6 to 18 Years | 2,940 (93.7%) | 198 (6.3%) |
| 19 to 25 Years | 904 (61.1%) | 576 (38.9%) |
| 26 to 34 Years | 2,241 (77.4%) | 654 (22.6%) |
| 35 to 44 Years | 1,382 (66.0%) | 711 (34.0%) |
| 45 to 54 Years | 686 (67.4%) | 331 (32.6%) |
| 55 to 64 Years | 1,050 (88.9%) | 131 (11.1%) |
| 65 to 74 Years | 549 (98.6%) | 8 (1.4%) |
| 75 Years and older | 37 (100.0%) | 0 (0.0%) |
| Total | 11,837 (81.4%) | 2,705 (18.6%) |
Health Insurance Coverage by Citizenship Status in Clarkston
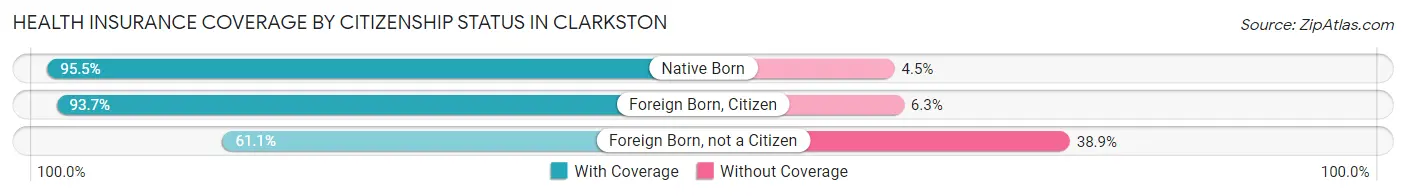
| Citizenship Status | With Coverage | Without Coverage |
| Native Born | 2,048 (95.5%) | 96 (4.5%) |
| Foreign Born, Citizen | 2,940 (93.7%) | 198 (6.3%) |
| Foreign Born, not a Citizen | 904 (61.1%) | 576 (38.9%) |
Health Insurance Coverage by Household Income in Clarkston
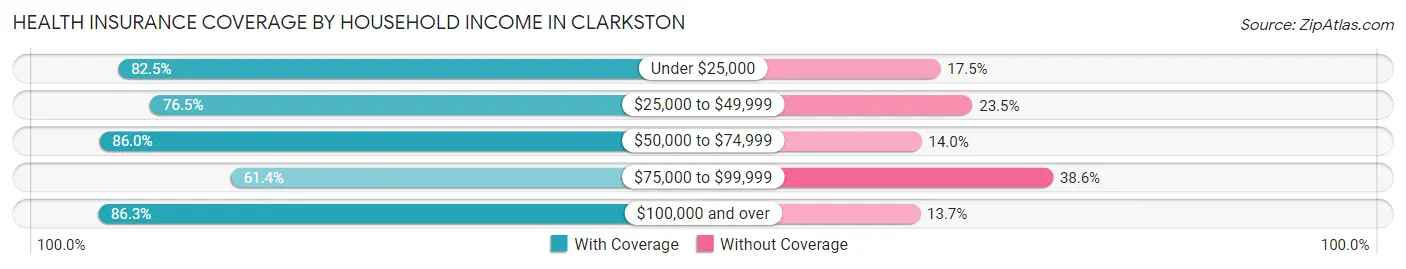
| Household Income | With Coverage | Without Coverage |
| Under $25,000 | 2,313 (82.5%) | 492 (17.5%) |
| $25,000 to $49,999 | 2,621 (76.5%) | 806 (23.5%) |
| $50,000 to $74,999 | 3,403 (86.0%) | 554 (14.0%) |
| $75,000 to $99,999 | 612 (61.4%) | 385 (38.6%) |
| $100,000 and over | 2,887 (86.3%) | 460 (13.7%) |
Public vs Private Health Insurance Coverage by Age in Clarkston
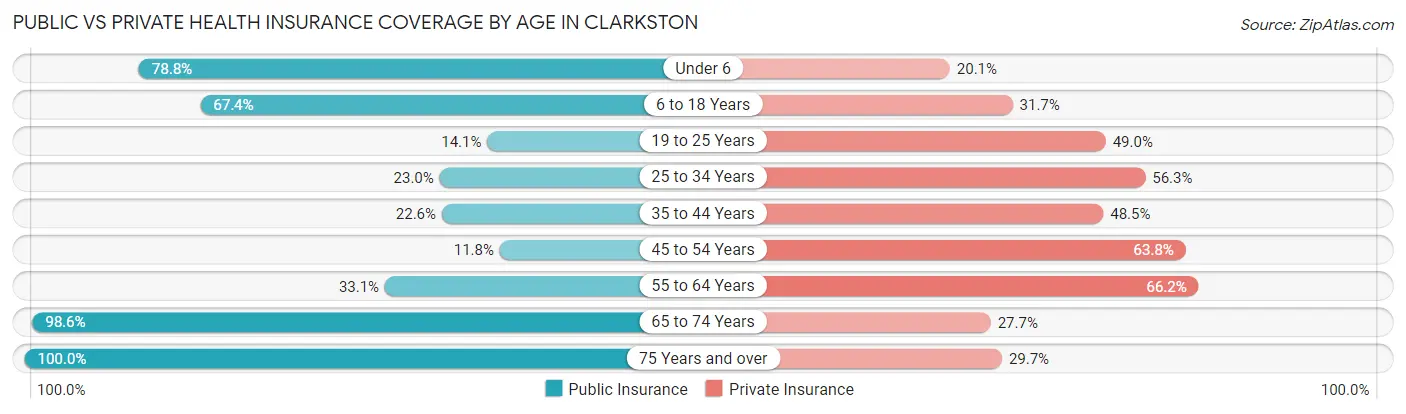
| Age Bracket | Public Insurance | Private Insurance |
| Under 6 | 1,689 (78.8%) | 430 (20.1%) |
| 6 to 18 Years | 2,114 (67.4%) | 995 (31.7%) |
| 19 to 25 Years | 209 (14.1%) | 725 (49.0%) |
| 25 to 34 Years | 665 (23.0%) | 1,631 (56.3%) |
| 35 to 44 Years | 472 (22.6%) | 1,016 (48.5%) |
| 45 to 54 Years | 120 (11.8%) | 649 (63.8%) |
| 55 to 64 Years | 391 (33.1%) | 782 (66.2%) |
| 65 to 74 Years | 549 (98.6%) | 154 (27.7%) |
| 75 Years and over | 37 (100.0%) | 11 (29.7%) |
| Total | 6,246 (42.9%) | 6,393 (44.0%) |
Disability Status by Sex by Age in Clarkston
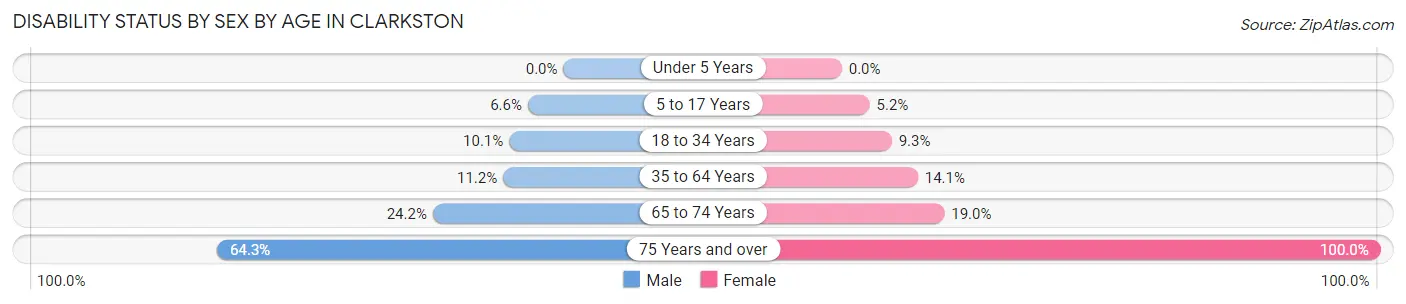
| Age Bracket | Male | Female |
| Under 5 Years | 0 (0.0%) | 0 (0.0%) |
| 5 to 17 Years | 98 (6.6%) | 84 (5.2%) |
| 18 to 34 Years | 238 (10.1%) | 213 (9.3%) |
| 35 to 64 Years | 247 (11.2%) | 294 (14.1%) |
| 65 to 74 Years | 56 (24.2%) | 62 (19.0%) |
| 75 Years and over | 9 (64.3%) | 23 (100.0%) |
Disability Class by Sex by Age in Clarkston
Disability Class: Hearing Difficulty
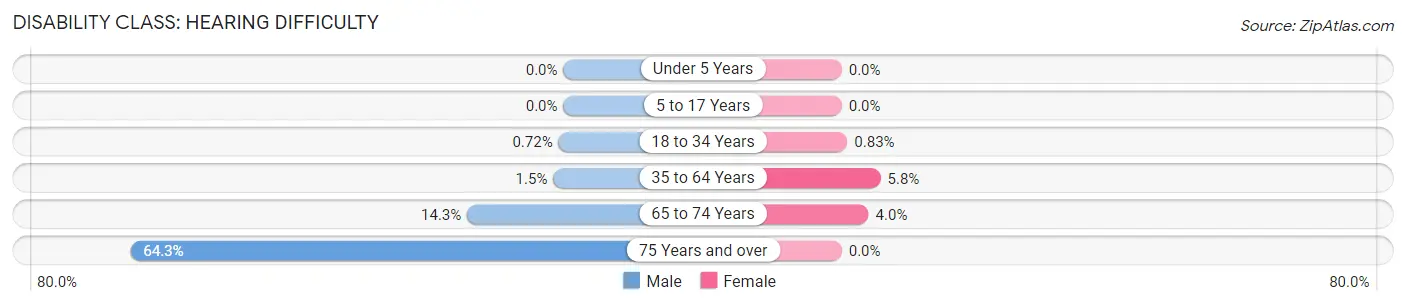
| Age Bracket | Male | Female |
| Under 5 Years | 0 (0.0%) | 0 (0.0%) |
| 5 to 17 Years | 0 (0.0%) | 0 (0.0%) |
| 18 to 34 Years | 17 (0.7%) | 19 (0.8%) |
| 35 to 64 Years | 33 (1.5%) | 120 (5.8%) |
| 65 to 74 Years | 33 (14.3%) | 13 (4.0%) |
| 75 Years and over | 9 (64.3%) | 0 (0.0%) |
Disability Class: Vision Difficulty
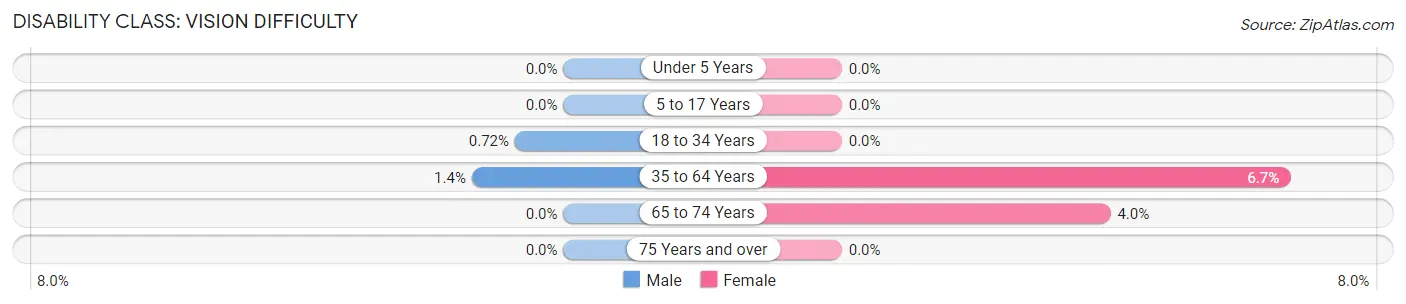
| Age Bracket | Male | Female |
| Under 5 Years | 0 (0.0%) | 0 (0.0%) |
| 5 to 17 Years | 0 (0.0%) | 0 (0.0%) |
| 18 to 34 Years | 17 (0.7%) | 0 (0.0%) |
| 35 to 64 Years | 30 (1.4%) | 139 (6.7%) |
| 65 to 74 Years | 0 (0.0%) | 13 (4.0%) |
| 75 Years and over | 0 (0.0%) | 0 (0.0%) |
Disability Class: Cognitive Difficulty
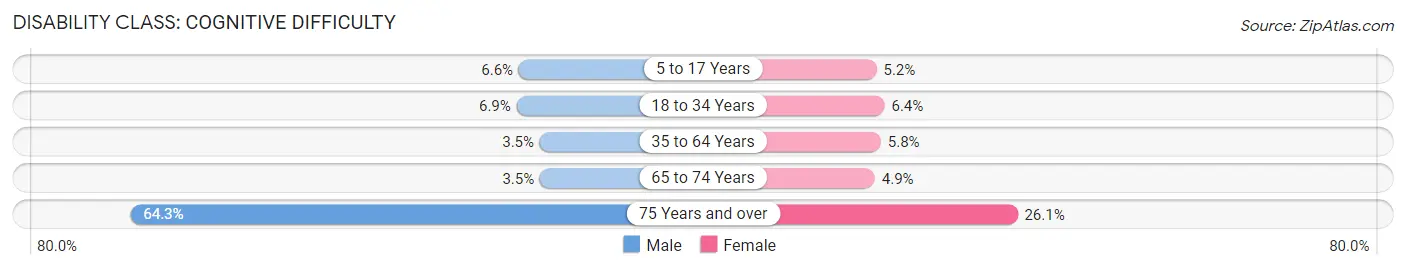
| Age Bracket | Male | Female |
| 5 to 17 Years | 98 (6.6%) | 84 (5.2%) |
| 18 to 34 Years | 164 (6.9%) | 146 (6.4%) |
| 35 to 64 Years | 77 (3.5%) | 121 (5.8%) |
| 65 to 74 Years | 8 (3.5%) | 16 (4.9%) |
| 75 Years and over | 9 (64.3%) | 6 (26.1%) |
Disability Class: Ambulatory Difficulty
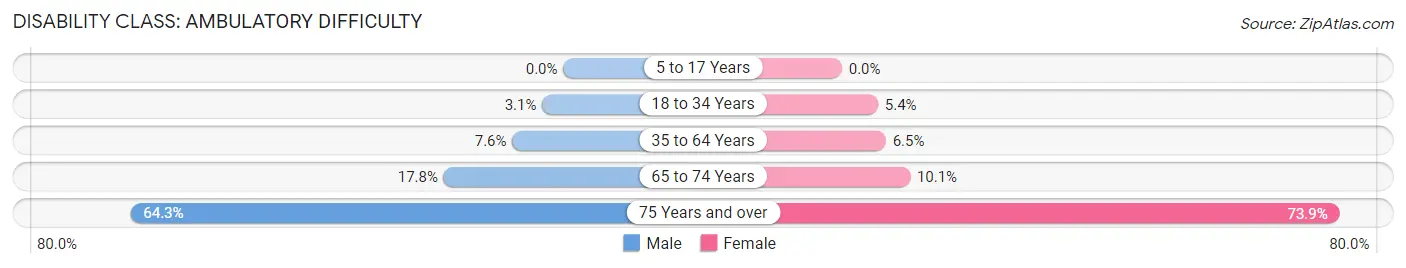
| Age Bracket | Male | Female |
| 5 to 17 Years | 0 (0.0%) | 0 (0.0%) |
| 18 to 34 Years | 74 (3.1%) | 123 (5.3%) |
| 35 to 64 Years | 167 (7.6%) | 136 (6.5%) |
| 65 to 74 Years | 41 (17.7%) | 33 (10.1%) |
| 75 Years and over | 9 (64.3%) | 17 (73.9%) |
Disability Class: Self-Care Difficulty
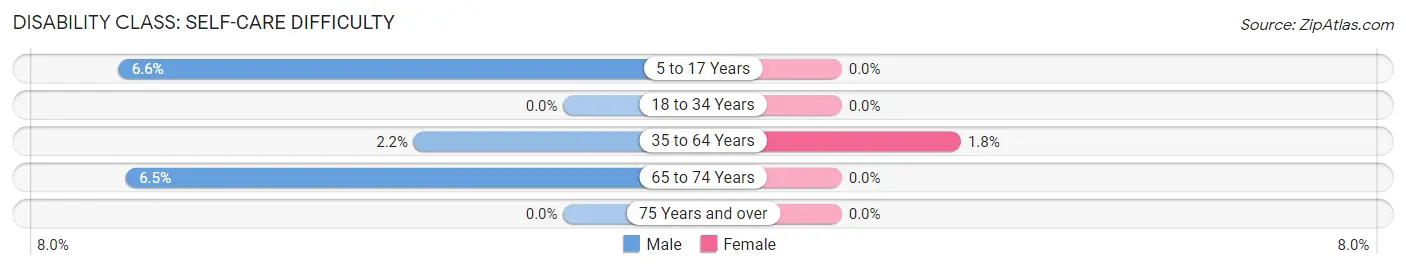
| Age Bracket | Male | Female |
| 5 to 17 Years | 98 (6.6%) | 0 (0.0%) |
| 18 to 34 Years | 0 (0.0%) | 0 (0.0%) |
| 35 to 64 Years | 49 (2.2%) | 37 (1.8%) |
| 65 to 74 Years | 15 (6.5%) | 0 (0.0%) |
| 75 Years and over | 0 (0.0%) | 0 (0.0%) |
Technology Access in Clarkston
Computing Device Access in Clarkston
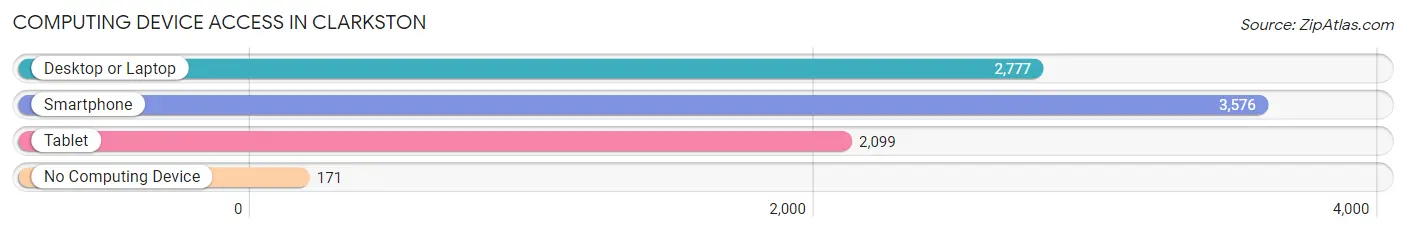
| Device Type | # Households | % Households |
| Desktop or Laptop | 2,777 | 72.9% |
| Smartphone | 3,576 | 93.9% |
| Tablet | 2,099 | 55.1% |
| No Computing Device | 171 | 4.5% |
| Total | 3,807 | 100.0% |
Internet Access in Clarkston
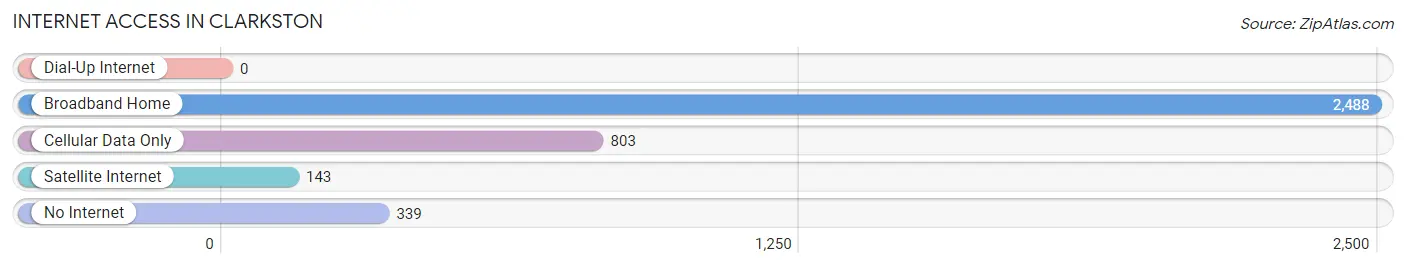
| Internet Type | # Households | % Households |
| Dial-Up Internet | 0 | 0.0% |
| Broadband Home | 2,488 | 65.3% |
| Cellular Data Only | 803 | 21.1% |
| Satellite Internet | 143 | 3.8% |
| No Internet | 339 | 8.9% |
| Total | 3,807 | 100.0% |
Clarkston Summary
Clarkston, Georgia is a small city located in DeKalb County, Georgia, United States. It is located just east of Atlanta and is part of the Atlanta metropolitan area. The city has a population of 13,445 as of the 2010 census.
History
The area that is now Clarkston was originally inhabited by the Creek Indians. The area was first settled by Europeans in the early 1800s. The city was named after a local family, the Clarks, who owned a large amount of land in the area. The city was officially incorporated in 1882.
In the late 1800s, the city was a popular destination for wealthy Atlantans looking to escape the hustle and bustle of the city. The city was known for its large estates and beautiful gardens.
In the early 1900s, the city began to attract immigrants from Europe, particularly from Eastern Europe. This influx of immigrants helped to shape the city’s culture and economy.
In the 1950s, the city began to attract African-Americans from the South. This influx of African-Americans helped to shape the city’s culture and economy.
In the 1970s, the city began to attract immigrants from Latin America and Asia. This influx of immigrants helped to shape the city’s culture and economy.
Geography
Clarkston is located in DeKalb County, Georgia, United States. It is located just east of Atlanta and is part of the Atlanta metropolitan area. The city has a total area of 2.2 square miles, all of which is land.
The city is located in the Piedmont region of Georgia. The city is located at the intersection of two major highways, I-285 and I-20.
Economy
The economy of Clarkston is largely based on retail and services. The city is home to several large retail stores, including Walmart, Target, and Home Depot. The city is also home to several restaurants, bars, and other businesses.
The city is also home to several industrial and manufacturing businesses. The city is home to several large companies, including Coca-Cola, Georgia-Pacific, and Georgia Power.
Demographics
As of the 2010 census, the city had a population of 13,445. The racial makeup of the city was 57.3% African-American, 28.2% White, 8.2% Hispanic or Latino, 4.2% Asian, and 0.3% Native American.
The median household income in the city was $37,945. The per capita income in the city was $20,945. The poverty rate in the city was 24.3%.
Conclusion
Clarkston, Georgia is a small city located in DeKalb County, Georgia, United States. It is located just east of Atlanta and is part of the Atlanta metropolitan area. The city has a population of 13,445 as of the 2010 census. The city has a diverse population and economy, with a large retail and service sector, as well as several industrial and manufacturing businesses. The city has a median household income of $37,945 and a poverty rate of 24.3%.
Common Questions
What is Per Capita Income in Clarkston?
Per Capita income in Clarkston is $18,820.
What is the Median Family Income in Clarkston?
Median Family Income in Clarkston is $51,730.
What is the Median Household income in Clarkston?
Median Household Income in Clarkston is $51,122.
What is Income or Wage Gap in Clarkston?
Income or Wage Gap in Clarkston is 8.7%.
Women in Clarkston earn 91.3 cents for every dollar earned by a man.
What is Family Income Deficit in Clarkston?
Family Income Deficit in Clarkston is $11,990.
Families that are below poverty line in Clarkston earn $11,990 less on average than the poverty threshold level.
What is Inequality or Gini Index in Clarkston?
Inequality or Gini Index in Clarkston is 0.43.
What is the Total Population of Clarkston?
Total Population of Clarkston is 14,553.
What is the Total Male Population of Clarkston?
Total Male Population of Clarkston is 7,152.
What is the Total Female Population of Clarkston?
Total Female Population of Clarkston is 7,401.
What is the Ratio of Males per 100 Females in Clarkston?
There are 96.64 Males per 100 Females in Clarkston.
What is the Ratio of Females per 100 Males in Clarkston?
There are 103.48 Females per 100 Males in Clarkston.
What is the Median Population Age in Clarkston?
Median Population Age in Clarkston is 27.4 Years.
What is the Average Family Size in Clarkston
Average Family Size in Clarkston is 4.5 People.
What is the Average Household Size in Clarkston
Average Household Size in Clarkston is 3.8 People.
How Large is the Labor Force in Clarkston?
There are 7,074 People in the Labor Forcein in Clarkston.
What is the Percentage of People in the Labor Force in Clarkston?
71.4% of People are in the Labor Force in Clarkston.
What is the Unemployment Rate in Clarkston?
Unemployment Rate in Clarkston is 8.6%.