Middletown, VA Map & Demographics
Middletown Map
Middletown Overview
$30,996
PER CAPITA INCOME
$64,018
AVG FAMILY INCOME
$54,198
AVG HOUSEHOLD INCOME
24.1%
WAGE / INCOME GAP [ % ]
75.9¢/ $1
WAGE / INCOME GAP [ $ ]
0.42
INEQUALITY / GINI INDEX
1,558
TOTAL POPULATION
692
MALE POPULATION
866
FEMALE POPULATION
79.91
MALES / 100 FEMALES
125.14
FEMALES / 100 MALES
39.5
MEDIAN AGE
2.9
AVG FAMILY SIZE
2.4
AVG HOUSEHOLD SIZE
882
LABOR FORCE [ PEOPLE ]
68.4%
PERCENT IN LABOR FORCE
Middletown Zip Codes
Middletown Area Codes
Income in Middletown
Income Overview in Middletown
Per Capita Income in Middletown is $30,996, while median incomes of families and households are $64,018 and $54,198 respectively.
| Characteristic | Number | Measure |
| Per Capita Income | 1,558 | $30,996 |
| Median Family Income | 391 | $64,018 |
| Mean Family Income | 391 | $77,101 |
| Median Household Income | 638 | $54,198 |
| Mean Household Income | 638 | $71,145 |
| Income Deficit | 391 | $0 |
| Wage / Income Gap (%) | 1,558 | 24.06% |
| Wage / Income Gap ($) | 1,558 | 75.94¢ per $1 |
| Gini / Inequality Index | 1,558 | 0.42 |
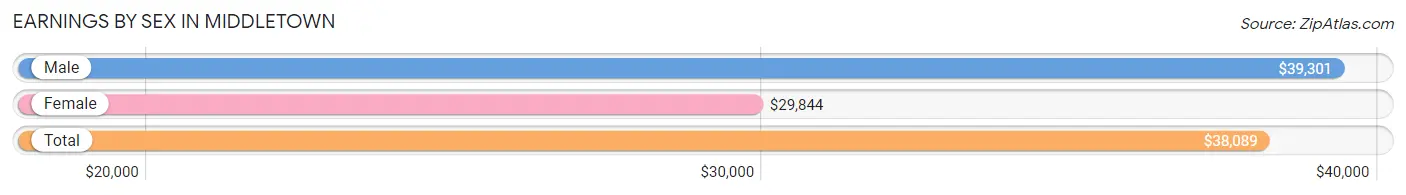
Earnings by Sex in Middletown
Average Earnings in Middletown are $38,089, $39,301 for men and $29,844 for women, a difference of 24.1%.
| Sex | Number | Average Earnings |
| Male | 451 (49.4%) | $39,301 |
| Female | 461 (50.5%) | $29,844 |
| Total | 912 (100.0%) | $38,089 |
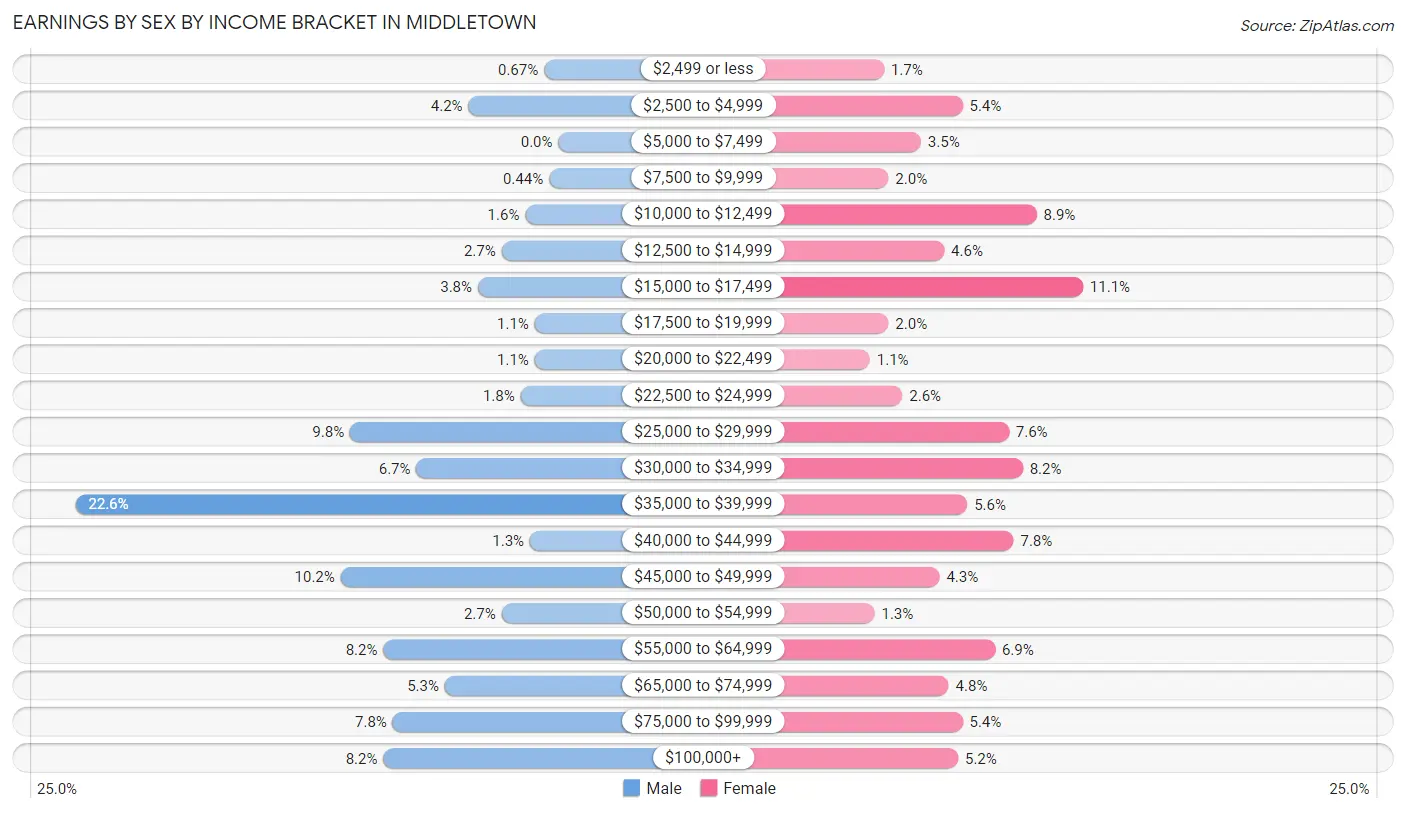
Earnings by Sex by Income Bracket in Middletown
The most common earnings brackets in Middletown are $35,000 to $39,999 for men (102 | 22.6%) and $15,000 to $17,499 for women (51 | 11.1%).
| Income | Male | Female |
| $2,499 or less | 3 (0.7%) | 8 (1.7%) |
| $2,500 to $4,999 | 19 (4.2%) | 25 (5.4%) |
| $5,000 to $7,499 | 0 (0.0%) | 16 (3.5%) |
| $7,500 to $9,999 | 2 (0.4%) | 9 (1.9%) |
| $10,000 to $12,499 | 7 (1.5%) | 41 (8.9%) |
| $12,500 to $14,999 | 12 (2.7%) | 21 (4.6%) |
| $15,000 to $17,499 | 17 (3.8%) | 51 (11.1%) |
| $17,500 to $19,999 | 5 (1.1%) | 9 (1.9%) |
| $20,000 to $22,499 | 5 (1.1%) | 5 (1.1%) |
| $22,500 to $24,999 | 8 (1.8%) | 12 (2.6%) |
| $25,000 to $29,999 | 44 (9.8%) | 35 (7.6%) |
| $30,000 to $34,999 | 30 (6.7%) | 38 (8.2%) |
| $35,000 to $39,999 | 102 (22.6%) | 26 (5.6%) |
| $40,000 to $44,999 | 6 (1.3%) | 36 (7.8%) |
| $45,000 to $49,999 | 46 (10.2%) | 20 (4.3%) |
| $50,000 to $54,999 | 12 (2.7%) | 6 (1.3%) |
| $55,000 to $64,999 | 37 (8.2%) | 32 (6.9%) |
| $65,000 to $74,999 | 24 (5.3%) | 22 (4.8%) |
| $75,000 to $99,999 | 35 (7.8%) | 25 (5.4%) |
| $100,000+ | 37 (8.2%) | 24 (5.2%) |
| Total | 451 (100.0%) | 461 (100.0%) |
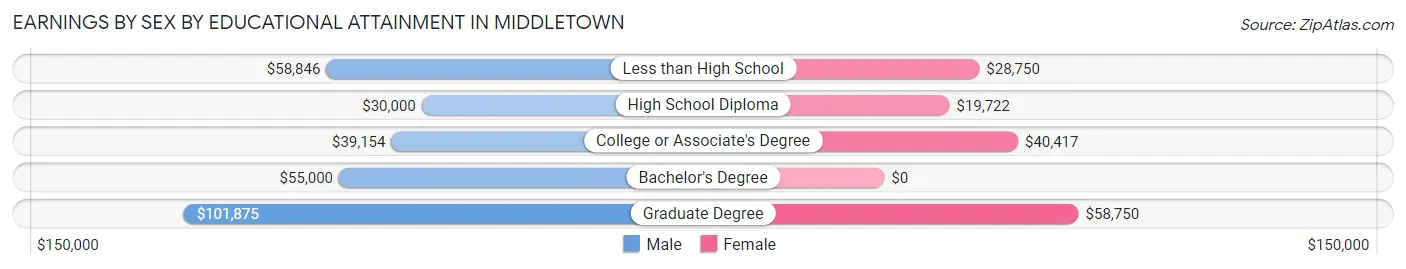
Earnings by Sex by Educational Attainment in Middletown
Average earnings in Middletown are $39,461 for men and $32,944 for women, a difference of 16.5%. Men with an educational attainment of graduate degree enjoy the highest average annual earnings of $101,875, while those with high school diploma education earn the least with $30,000. Women with an educational attainment of graduate degree earn the most with the average annual earnings of $58,750, while those with high school diploma education have the smallest earnings of $19,722.
| Educational Attainment | Male Income | Female Income |
| Less than High School | $58,846 | $28,750 |
| High School Diploma | $30,000 | $19,722 |
| College or Associate's Degree | $39,154 | $40,417 |
| Bachelor's Degree | $55,000 | $0 |
| Graduate Degree | $101,875 | $58,750 |
| Total | $39,461 | $32,944 |
Family Income in Middletown
Family Income Brackets in Middletown
According to the Middletown family income data, there are 74 families falling into the $50,000 to $74,999 income range, which is the most common income bracket and makes up 18.9% of all families. Conversely, the $200,000+ income bracket is the least frequent group with only 10 families (2.6%) belonging to this category.
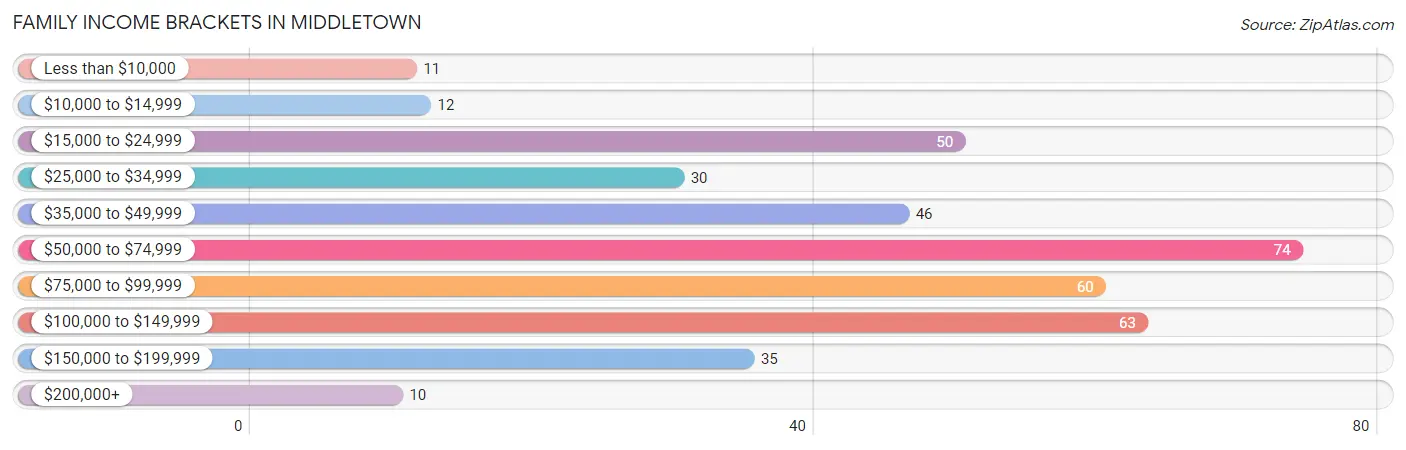
| Income Bracket | # Families | % Families |
| Less than $10,000 | 11 | 2.8% |
| $10,000 to $14,999 | 12 | 3.1% |
| $15,000 to $24,999 | 50 | 12.8% |
| $25,000 to $34,999 | 30 | 7.7% |
| $35,000 to $49,999 | 46 | 11.8% |
| $50,000 to $74,999 | 74 | 18.9% |
| $75,000 to $99,999 | 60 | 15.3% |
| $100,000 to $149,999 | 63 | 16.1% |
| $150,000 to $199,999 | 35 | 9.0% |
| $200,000+ | 10 | 2.6% |
Family Income by Famaliy Size in Middletown
4-person families (28 | 7.2%) account for the highest median family income in Middletown with $103,750 per family, while 2-person families (188 | 48.1%) have the highest median income of $34,904 per family member.
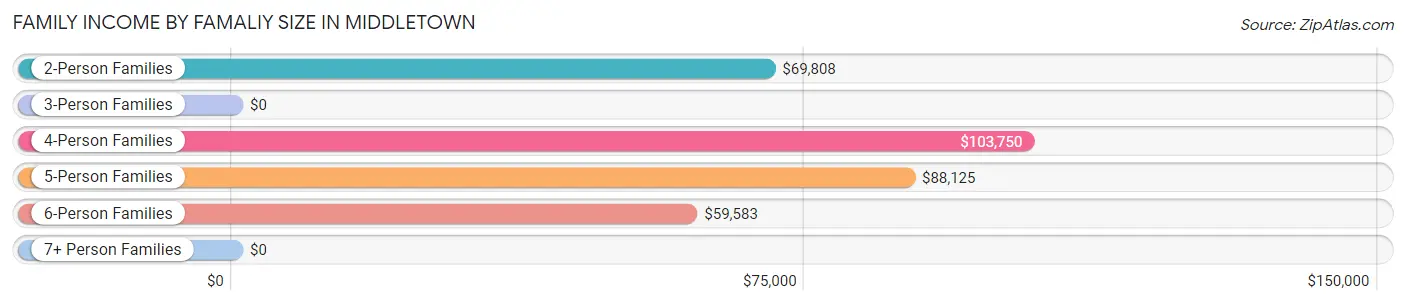
| Income Bracket | # Families | Median Income |
| 2-Person Families | 188 (48.1%) | $69,808 |
| 3-Person Families | 136 (34.8%) | $0 |
| 4-Person Families | 28 (7.2%) | $103,750 |
| 5-Person Families | 16 (4.1%) | $88,125 |
| 6-Person Families | 20 (5.1%) | $59,583 |
| 7+ Person Families | 3 (0.8%) | $0 |
| Total | 391 (100.0%) | $64,018 |
Family Income by Number of Earners in Middletown
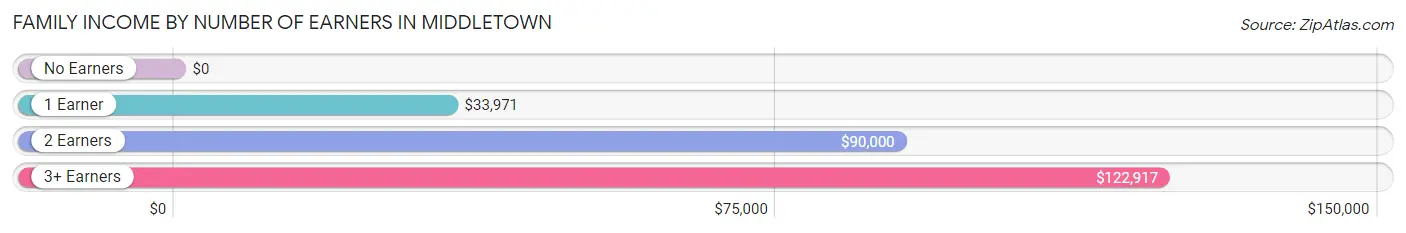
| Number of Earners | # Families | Median Income |
| No Earners | 22 (5.6%) | $0 |
| 1 Earner | 168 (43.0%) | $33,971 |
| 2 Earners | 172 (44.0%) | $90,000 |
| 3+ Earners | 29 (7.4%) | $122,917 |
| Total | 391 (100.0%) | $64,018 |
Household Income in Middletown
Household Income Brackets in Middletown
With 148 households falling in the category, the $50,000 to $74,999 income range is the most frequent in Middletown, accounting for 23.2% of all households. In contrast, only 12 households (1.9%) fall into the $10,000 to $14,999 income bracket, making it the least populous group.
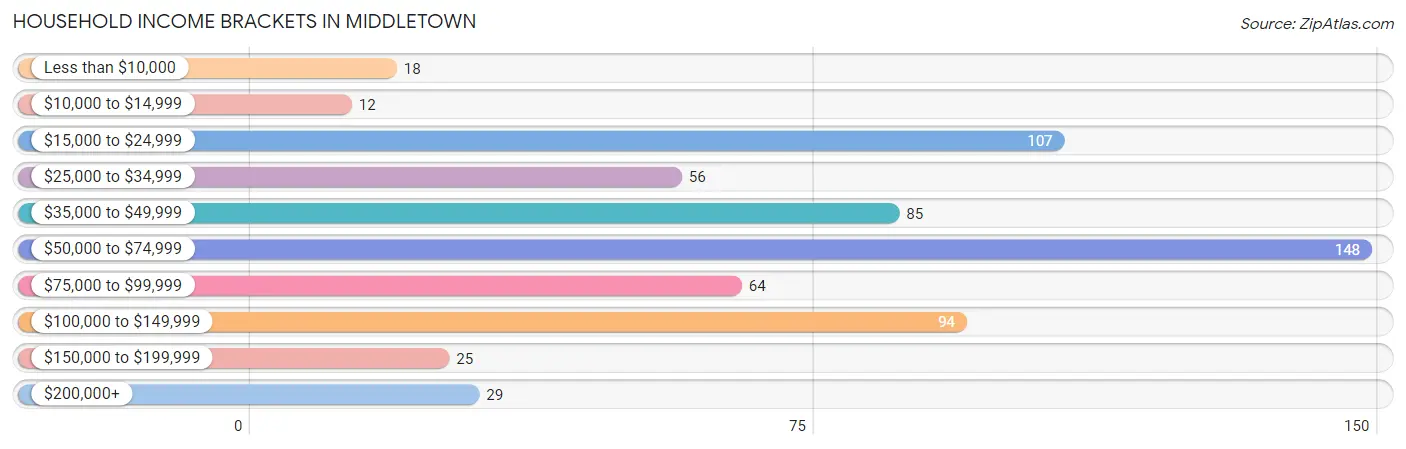
| Income Bracket | # Households | % Households |
| Less than $10,000 | 18 | 2.8% |
| $10,000 to $14,999 | 12 | 1.9% |
| $15,000 to $24,999 | 107 | 16.8% |
| $25,000 to $34,999 | 56 | 8.8% |
| $35,000 to $49,999 | 85 | 13.3% |
| $50,000 to $74,999 | 148 | 23.2% |
| $75,000 to $99,999 | 64 | 10.0% |
| $100,000 to $149,999 | 94 | 14.7% |
| $150,000 to $199,999 | 25 | 3.9% |
| $200,000+ | 29 | 4.5% |
Household Income by Householder Age in Middletown
The median household income in Middletown is $54,198, with the highest median household income of $75,417 found in the 45 to 64 years age bracket for the primary householder. A total of 212 households (33.2%) fall into this category. Meanwhile, the 65+ years age bracket for the primary householder has the lowest median household income of $0, with 151 households (23.7%) in this group.
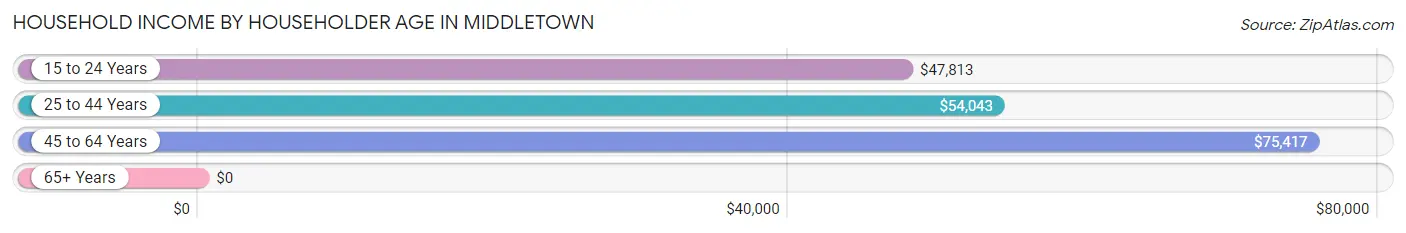
| Income Bracket | # Households | Median Income |
| 15 to 24 Years | 7 (1.1%) | $47,813 |
| 25 to 44 Years | 268 (42.0%) | $54,043 |
| 45 to 64 Years | 212 (33.2%) | $75,417 |
| 65+ Years | 151 (23.7%) | $0 |
| Total | 638 (100.0%) | $54,198 |
Poverty in Middletown
Income Below Poverty by Sex and Age in Middletown
With 8.1% poverty level for males and 23.7% for females among the residents of Middletown, 16 and 17 year old males and 15 year old females are the most vulnerable to poverty, with 6 males (35.3%) and 2 females (100.0%) in their respective age groups living below the poverty level.
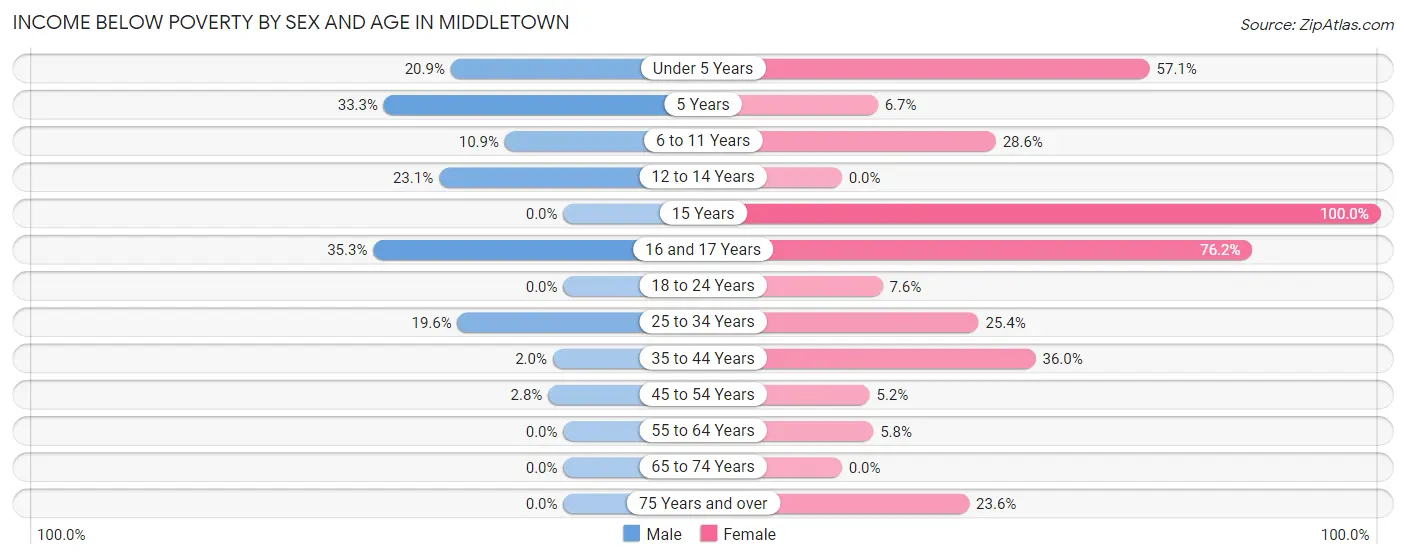
| Age Bracket | Male | Female |
| Under 5 Years | 14 (20.9%) | 36 (57.1%) |
| 5 Years | 1 (33.3%) | 1 (6.7%) |
| 6 to 11 Years | 5 (10.9%) | 6 (28.6%) |
| 12 to 14 Years | 3 (23.1%) | 0 (0.0%) |
| 15 Years | 0 (0.0%) | 2 (100.0%) |
| 16 and 17 Years | 6 (35.3%) | 48 (76.2%) |
| 18 to 24 Years | 0 (0.0%) | 4 (7.5%) |
| 25 to 34 Years | 22 (19.6%) | 33 (25.4%) |
| 35 to 44 Years | 3 (2.0%) | 50 (36.0%) |
| 45 to 54 Years | 2 (2.8%) | 5 (5.1%) |
| 55 to 64 Years | 0 (0.0%) | 7 (5.8%) |
| 65 to 74 Years | 0 (0.0%) | 0 (0.0%) |
| 75 Years and over | 0 (0.0%) | 13 (23.6%) |
| Total | 56 (8.1%) | 205 (23.7%) |
Income Above Poverty by Sex and Age in Middletown
According to the poverty statistics in Middletown, males aged 18 to 24 years and females aged 12 to 14 years are the age groups that are most secure financially, with 100.0% of males and 100.0% of females in these age groups living above the poverty line.
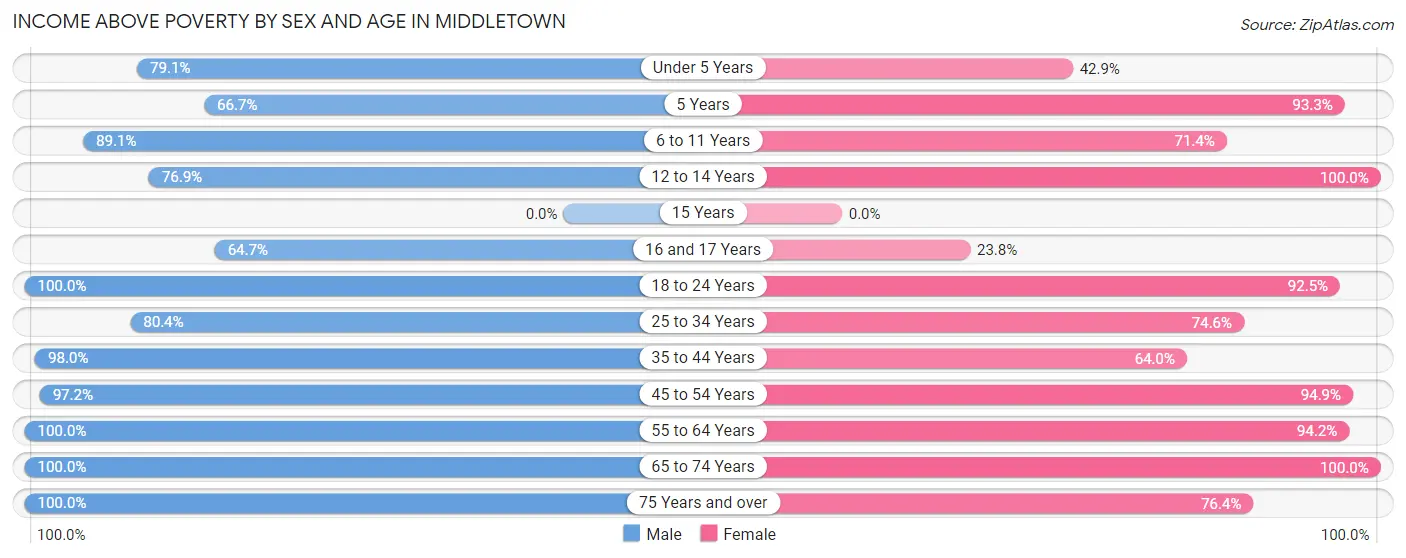
| Age Bracket | Male | Female |
| Under 5 Years | 53 (79.1%) | 27 (42.9%) |
| 5 Years | 2 (66.7%) | 14 (93.3%) |
| 6 to 11 Years | 41 (89.1%) | 15 (71.4%) |
| 12 to 14 Years | 10 (76.9%) | 38 (100.0%) |
| 15 Years | 0 (0.0%) | 0 (0.0%) |
| 16 and 17 Years | 11 (64.7%) | 15 (23.8%) |
| 18 to 24 Years | 39 (100.0%) | 49 (92.4%) |
| 25 to 34 Years | 90 (80.4%) | 97 (74.6%) |
| 35 to 44 Years | 150 (98.0%) | 89 (64.0%) |
| 45 to 54 Years | 69 (97.2%) | 92 (94.9%) |
| 55 to 64 Years | 97 (100.0%) | 113 (94.2%) |
| 65 to 74 Years | 45 (100.0%) | 70 (100.0%) |
| 75 Years and over | 29 (100.0%) | 42 (76.4%) |
| Total | 636 (91.9%) | 661 (76.3%) |
Income Below Poverty Among Married-Couple Families in Middletown
The poverty statistics for married-couple families in Middletown show that 2.4% or 5 of the total 209 families live below the poverty line. Families with 3 or 4 children have the highest poverty rate of 22.7%, comprising of 5 families. On the other hand, families with no children have the lowest poverty rate of 0.0%, which includes 0 families.
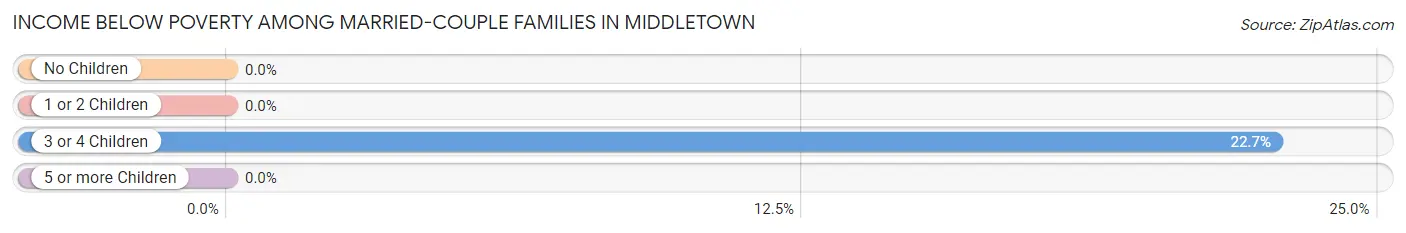
| Children | Above Poverty | Below Poverty |
| No Children | 127 (100.0%) | 0 (0.0%) |
| 1 or 2 Children | 60 (100.0%) | 0 (0.0%) |
| 3 or 4 Children | 17 (77.3%) | 5 (22.7%) |
| 5 or more Children | 0 (0.0%) | 0 (0.0%) |
| Total | 204 (97.6%) | 5 (2.4%) |
Income Below Poverty Among Single-Parent Households in Middletown
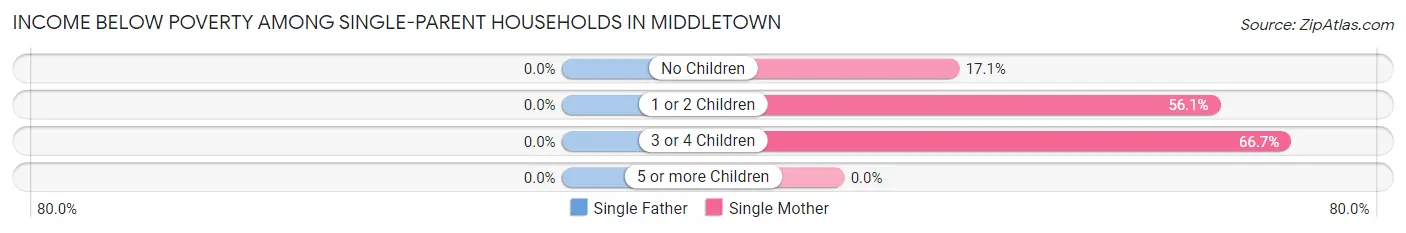
| Children | Single Father | Single Mother |
| No Children | 0 (0.0%) | 6 (17.1%) |
| 1 or 2 Children | 0 (0.0%) | 64 (56.1%) |
| 3 or 4 Children | 0 (0.0%) | 4 (66.7%) |
| 5 or more Children | 0 (0.0%) | 0 (0.0%) |
| Total | 0 (0.0%) | 74 (47.7%) |
Income Below Poverty Among Married-Couple vs Single-Parent Households in Middletown
The poverty data for Middletown shows that 5 of the married-couple family households (2.4%) and 74 of the single-parent households (40.7%) are living below the poverty level. Within the married-couple family households, those with 3 or 4 children have the highest poverty rate, with 5 households (22.7%) falling below the poverty line. Among the single-parent households, those with 3 or 4 children have the highest poverty rate, with 4 household (66.7%) living below poverty.
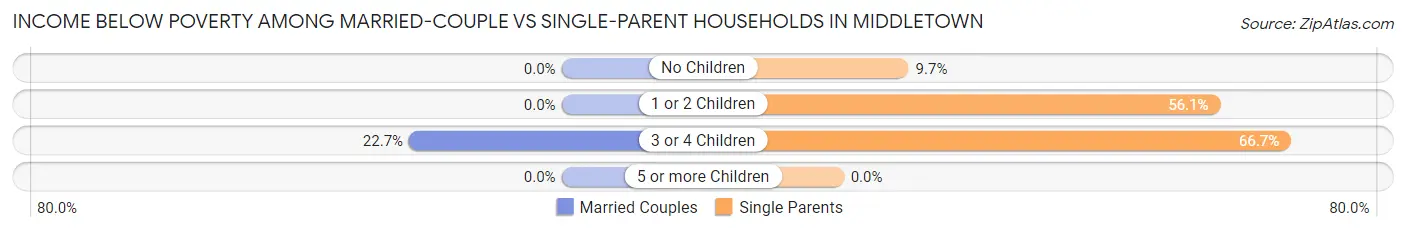
| Children | Married-Couple Families | Single-Parent Households |
| No Children | 0 (0.0%) | 6 (9.7%) |
| 1 or 2 Children | 0 (0.0%) | 64 (56.1%) |
| 3 or 4 Children | 5 (22.7%) | 4 (66.7%) |
| 5 or more Children | 0 (0.0%) | 0 (0.0%) |
| Total | 5 (2.4%) | 74 (40.7%) |
Race in Middletown
The most populous races in Middletown are White / Caucasian (1,354 | 86.9%), Hispanic or Latino (146 | 9.4%), and Two or more Races (82 | 5.3%).
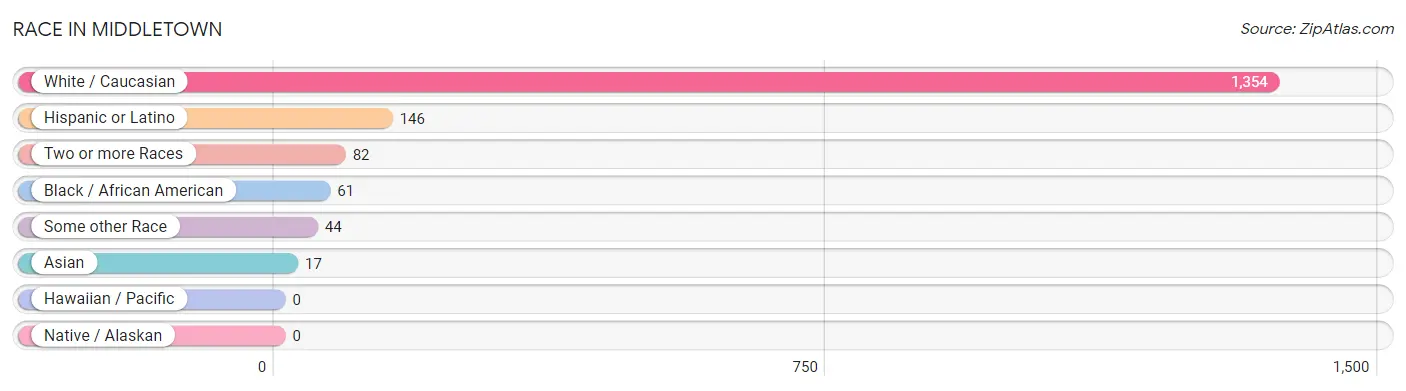
| Race | # Population | % Population |
| Asian | 17 | 1.1% |
| Black / African American | 61 | 3.9% |
| Hawaiian / Pacific | 0 | 0.0% |
| Hispanic or Latino | 146 | 9.4% |
| Native / Alaskan | 0 | 0.0% |
| White / Caucasian | 1,354 | 86.9% |
| Two or more Races | 82 | 5.3% |
| Some other Race | 44 | 2.8% |
| Total | 1,558 | 100.0% |
Ancestry in Middletown
The most populous ancestries reported in Middletown are American (324 | 20.8%), German (239 | 15.3%), Irish (138 | 8.9%), English (126 | 8.1%), and Central American (74 | 4.8%), together accounting for 57.8% of all Middletown residents.
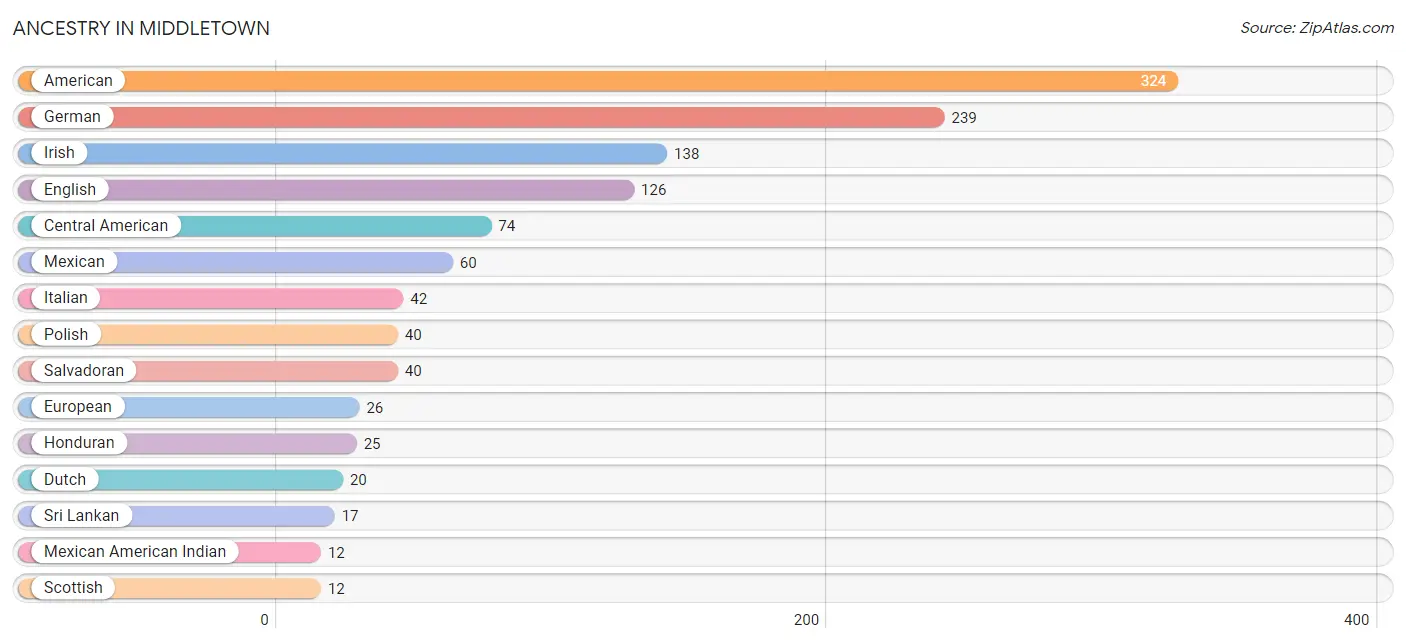
| Ancestry | # Population | % Population |
| American | 324 | 20.8% |
| Austrian | 5 | 0.3% |
| Bhutanese | 4 | 0.3% |
| British | 3 | 0.2% |
| Central American | 74 | 4.8% |
| Cherokee | 4 | 0.3% |
| Choctaw | 1 | 0.1% |
| Czechoslovakian | 4 | 0.3% |
| Dominican | 5 | 0.3% |
| Dutch | 20 | 1.3% |
| English | 126 | 8.1% |
| European | 26 | 1.7% |
| French | 2 | 0.1% |
| French Canadian | 4 | 0.3% |
| German | 239 | 15.3% |
| Guatemalan | 9 | 0.6% |
| Honduran | 25 | 1.6% |
| Irish | 138 | 8.9% |
| Italian | 42 | 2.7% |
| Korean | 5 | 0.3% |
| Mexican | 60 | 3.8% |
| Mexican American Indian | 12 | 0.8% |
| Polish | 40 | 2.6% |
| Puerto Rican | 7 | 0.4% |
| Russian | 5 | 0.3% |
| Salvadoran | 40 | 2.6% |
| Samoan | 4 | 0.3% |
| Scotch-Irish | 4 | 0.3% |
| Scottish | 12 | 0.8% |
| Slovak | 4 | 0.3% |
| Sri Lankan | 17 | 1.1% | View All 31 Rows |
Immigrants in Middletown
The most numerous immigrant groups reported in Middletown came from Latin America (73 | 4.7%), Central America (68 | 4.4%), Mexico (34 | 2.2%), El Salvador (22 | 1.4%), and Honduras (12 | 0.8%), together accounting for 13.4% of all Middletown residents.
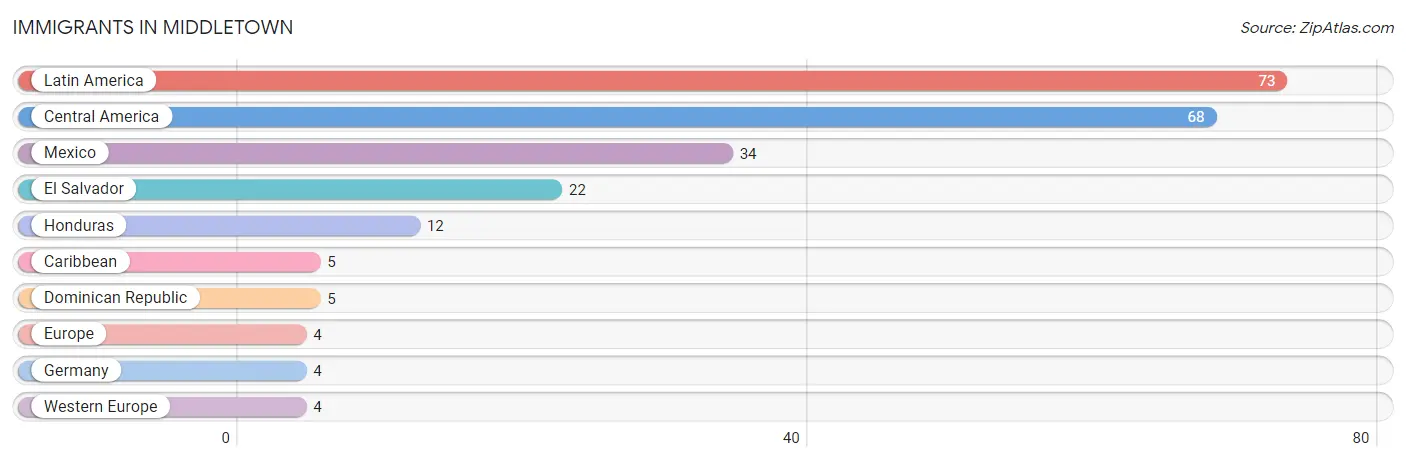
| Immigration Origin | # Population | % Population |
| Caribbean | 5 | 0.3% |
| Central America | 68 | 4.4% |
| Dominican Republic | 5 | 0.3% |
| El Salvador | 22 | 1.4% |
| Europe | 4 | 0.3% |
| Germany | 4 | 0.3% |
| Honduras | 12 | 0.8% |
| Latin America | 73 | 4.7% |
| Mexico | 34 | 2.2% |
| Western Europe | 4 | 0.3% | View All 10 Rows |
Sex and Age in Middletown
Sex and Age in Middletown
The most populous age groups in Middletown are 40 to 44 Years (130 | 18.8%) for men and 35 to 39 Years (108 | 12.5%) for women.
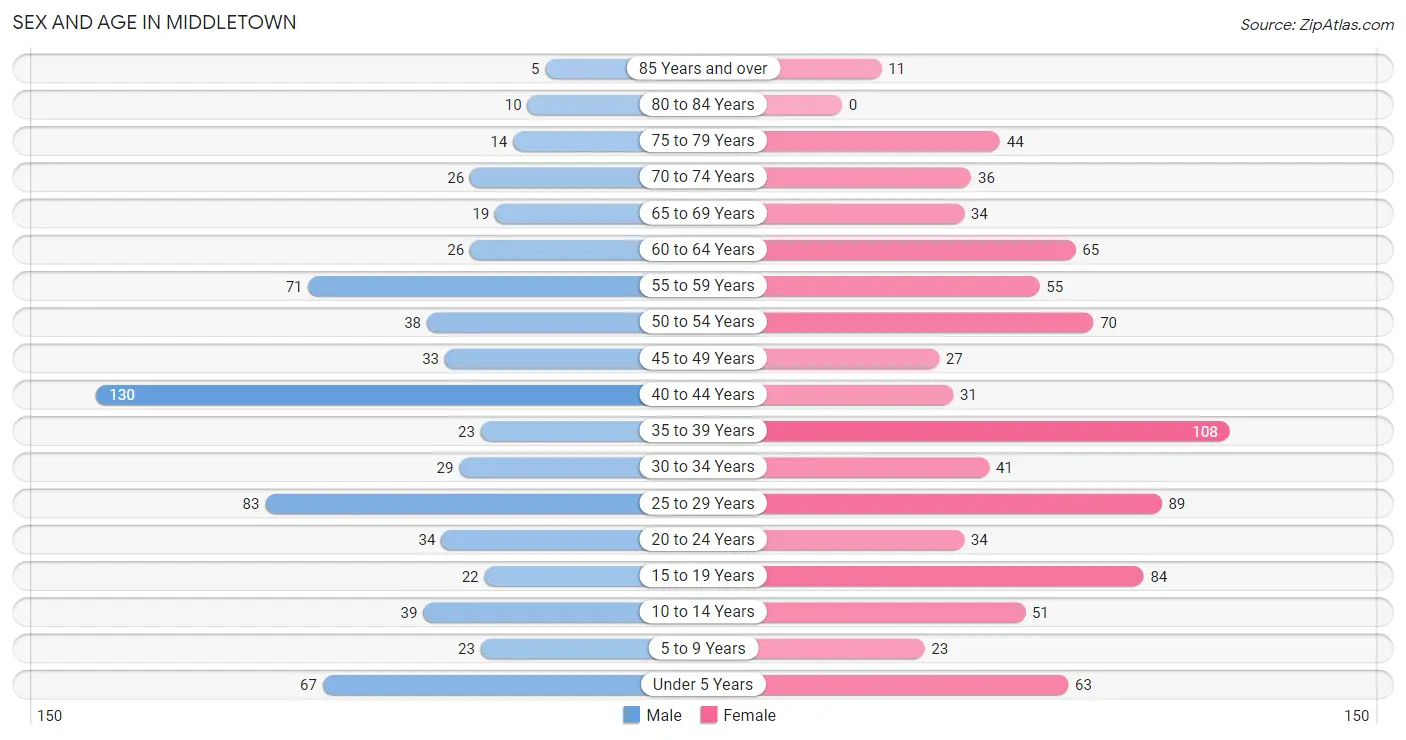
| Age Bracket | Male | Female |
| Under 5 Years | 67 (9.7%) | 63 (7.3%) |
| 5 to 9 Years | 23 (3.3%) | 23 (2.7%) |
| 10 to 14 Years | 39 (5.6%) | 51 (5.9%) |
| 15 to 19 Years | 22 (3.2%) | 84 (9.7%) |
| 20 to 24 Years | 34 (4.9%) | 34 (3.9%) |
| 25 to 29 Years | 83 (12.0%) | 89 (10.3%) |
| 30 to 34 Years | 29 (4.2%) | 41 (4.7%) |
| 35 to 39 Years | 23 (3.3%) | 108 (12.5%) |
| 40 to 44 Years | 130 (18.8%) | 31 (3.6%) |
| 45 to 49 Years | 33 (4.8%) | 27 (3.1%) |
| 50 to 54 Years | 38 (5.5%) | 70 (8.1%) |
| 55 to 59 Years | 71 (10.3%) | 55 (6.4%) |
| 60 to 64 Years | 26 (3.8%) | 65 (7.5%) |
| 65 to 69 Years | 19 (2.8%) | 34 (3.9%) |
| 70 to 74 Years | 26 (3.8%) | 36 (4.2%) |
| 75 to 79 Years | 14 (2.0%) | 44 (5.1%) |
| 80 to 84 Years | 10 (1.5%) | 0 (0.0%) |
| 85 Years and over | 5 (0.7%) | 11 (1.3%) |
| Total | 692 (100.0%) | 866 (100.0%) |
Families and Households in Middletown
Median Family Size in Middletown
The median family size in Middletown is 2.91 persons per family, with single female/mother families (155 | 39.6%) accounting for the largest median family size of 2.97 persons per family. On the other hand, single male/father families (27 | 6.9%) represent the smallest median family size with 2.22 persons per family.
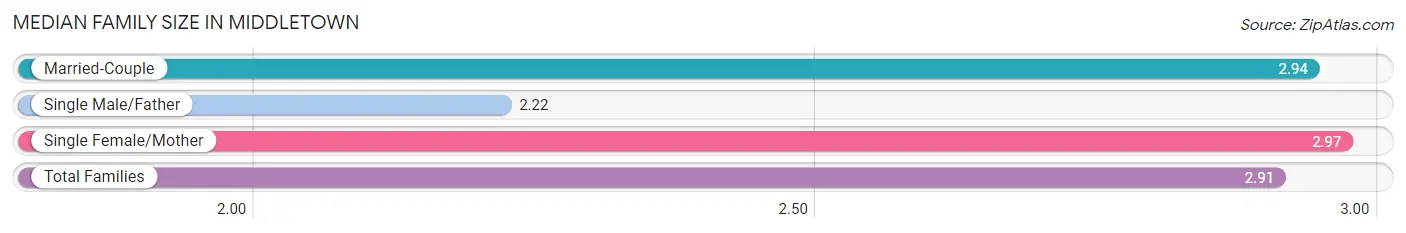
| Family Type | # Families | Family Size |
| Married-Couple | 209 (53.4%) | 2.94 |
| Single Male/Father | 27 (6.9%) | 2.22 |
| Single Female/Mother | 155 (39.6%) | 2.97 |
| Total Families | 391 (100.0%) | 2.91 |
Median Household Size in Middletown
The median household size in Middletown is 2.44 persons per household, with single female/mother households (155 | 24.3%) accounting for the largest median household size of 3.83 persons per household. non-family households (247 | 38.7%) represent the smallest median household size with 1.13 persons per household.
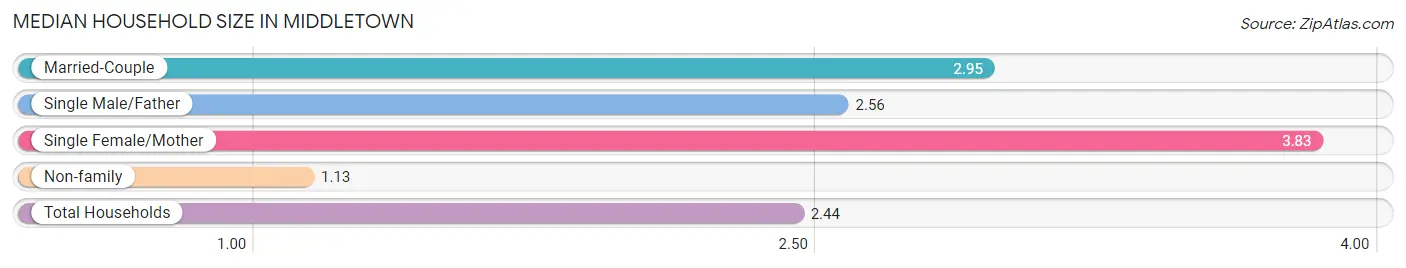
| Household Type | # Households | Household Size |
| Married-Couple | 209 (32.8%) | 2.95 |
| Single Male/Father | 27 (4.2%) | 2.56 |
| Single Female/Mother | 155 (24.3%) | 3.83 |
| Non-family | 247 (38.7%) | 1.13 |
| Total Households | 638 (100.0%) | 2.44 |
Household Size by Marriage Status in Middletown
Out of a total of 638 households in Middletown, 391 (61.3%) are family households, while 247 (38.7%) are nonfamily households. The most numerous type of family households are 2-person households, comprising 170, and the most common type of nonfamily households are 1-person households, comprising 224.
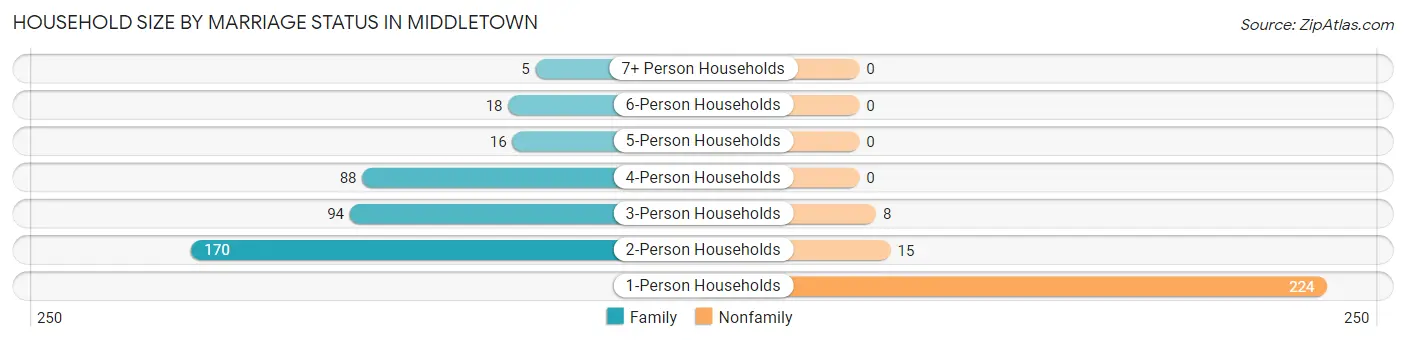
| Household Size | Family Households | Nonfamily Households |
| 1-Person Households | - | 224 (35.1%) |
| 2-Person Households | 170 (26.7%) | 15 (2.4%) |
| 3-Person Households | 94 (14.7%) | 8 (1.3%) |
| 4-Person Households | 88 (13.8%) | 0 (0.0%) |
| 5-Person Households | 16 (2.5%) | 0 (0.0%) |
| 6-Person Households | 18 (2.8%) | 0 (0.0%) |
| 7+ Person Households | 5 (0.8%) | 0 (0.0%) |
| Total | 391 (61.3%) | 247 (38.7%) |
Female Fertility in Middletown
Fertility by Age in Middletown
Average fertility rate in Middletown is 91.0 births per 1,000 women. Women in the age bracket of 20 to 34 years have the highest fertility rate with 220.0 births per 1,000 women. Women in the age bracket of 20 to 34 years acount for 92.3% of all women with births.
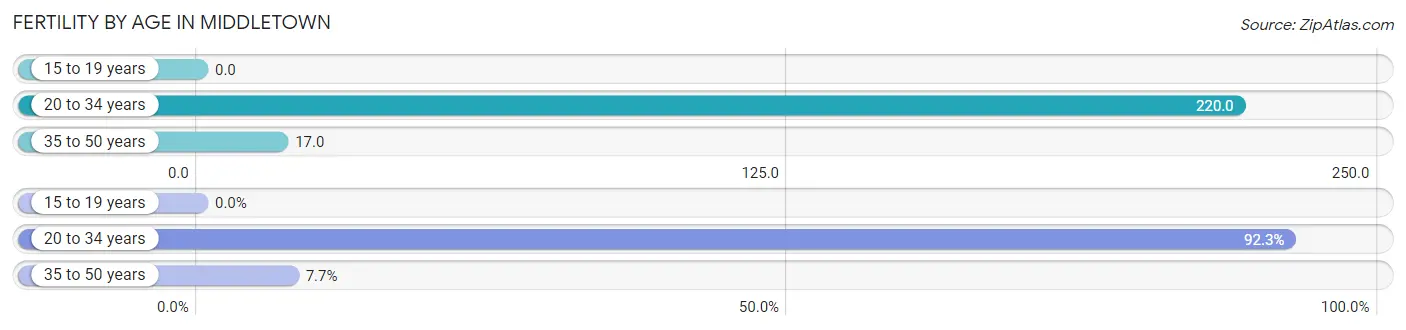
| Age Bracket | Women with Births | Births / 1,000 Women |
| 15 to 19 years | 0 (0.0%) | 0.0 |
| 20 to 34 years | 36 (92.3%) | 220.0 |
| 35 to 50 years | 3 (7.7%) | 17.0 |
| Total | 39 (100.0%) | 91.0 |
Fertility by Age by Marriage Status in Middletown
38.5% of women with births (39) in Middletown are married. The highest percentage of unmarried women with births falls into 20 to 34 years age bracket with 66.7% of them unmarried at the time of birth, while the lowest percentage of unmarried women with births belong to 35 to 50 years age bracket with 0.0% of them unmarried.
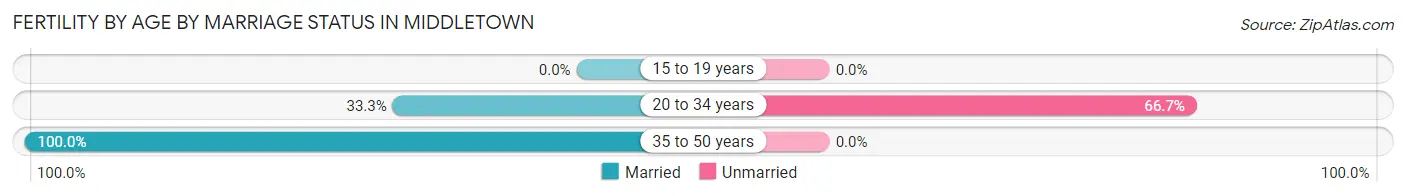
| Age Bracket | Married | Unmarried |
| 15 to 19 years | 0 (0.0%) | 0 (0.0%) |
| 20 to 34 years | 12 (33.3%) | 24 (66.7%) |
| 35 to 50 years | 3 (100.0%) | 0 (0.0%) |
| Total | 15 (38.5%) | 24 (61.5%) |
Fertility by Education in Middletown
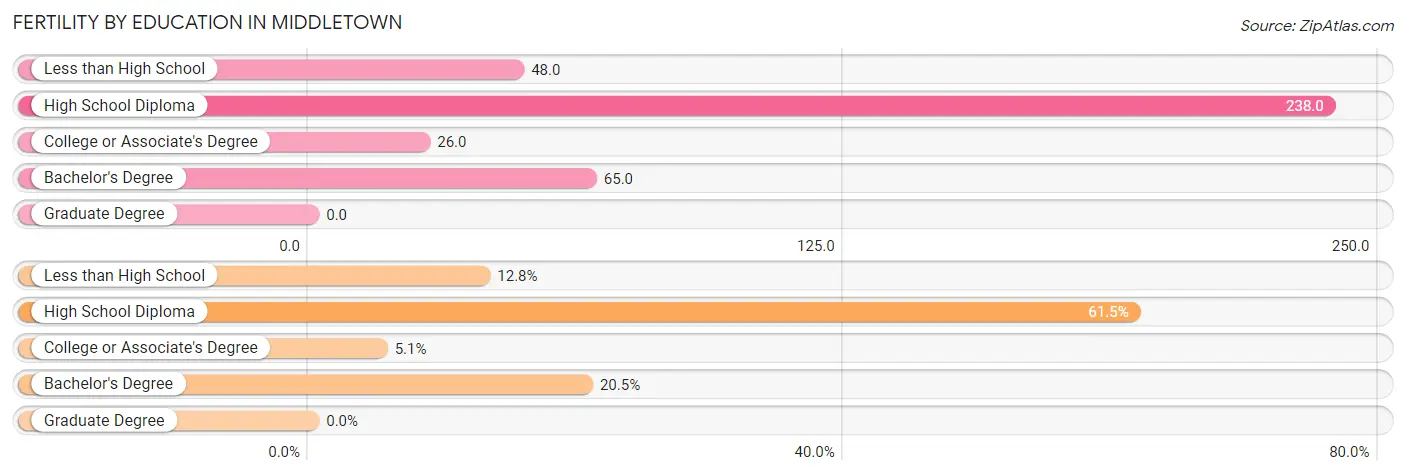
| Educational Attainment | Women with Births | Births / 1,000 Women |
| Less than High School | 5 (12.8%) | 48.0 |
| High School Diploma | 24 (61.5%) | 238.0 |
| College or Associate's Degree | 2 (5.1%) | 26.0 |
| Bachelor's Degree | 8 (20.5%) | 65.0 |
| Graduate Degree | 0 (0.0%) | 0.0 |
| Total | 39 (100.0%) | 91.0 |
Fertility by Education by Marriage Status in Middletown
61.5% of women with births in Middletown are unmarried. Women with the educational attainment of less than high school are most likely to be married with 100.0% of them married at childbirth, while women with the educational attainment of high school diploma are least likely to be married with 100.0% of them unmarried at childbirth.
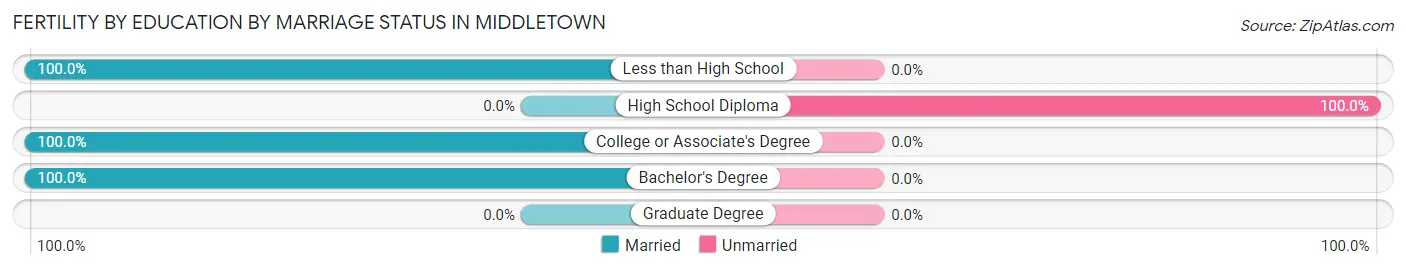
| Educational Attainment | Married | Unmarried |
| Less than High School | 5 (100.0%) | 0 (0.0%) |
| High School Diploma | 0 (0.0%) | 24 (100.0%) |
| College or Associate's Degree | 2 (100.0%) | 0 (0.0%) |
| Bachelor's Degree | 8 (100.0%) | 0 (0.0%) |
| Graduate Degree | 0 (0.0%) | 0 (0.0%) |
| Total | 15 (38.5%) | 24 (61.5%) |
Employment Characteristics in Middletown
Employment by Class of Employer in Middletown
Among the 882 employed individuals in Middletown, private company employees (662 | 75.1%), local government employees (85 | 9.6%), and not-for-profit organizations (38 | 4.3%) make up the most common classes of employment.
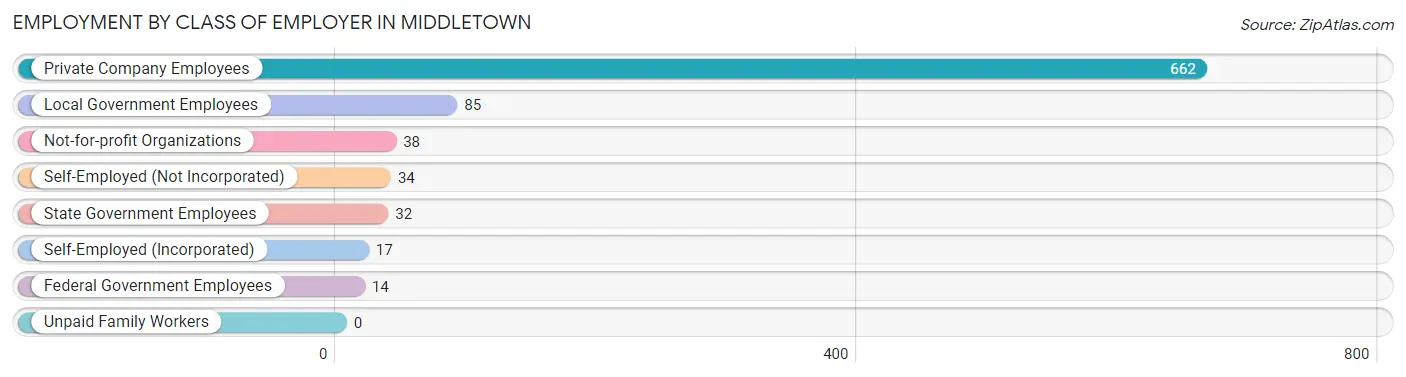
| Employer Class | # Employees | % Employees |
| Private Company Employees | 662 | 75.1% |
| Self-Employed (Incorporated) | 17 | 1.9% |
| Self-Employed (Not Incorporated) | 34 | 3.8% |
| Not-for-profit Organizations | 38 | 4.3% |
| Local Government Employees | 85 | 9.6% |
| State Government Employees | 32 | 3.6% |
| Federal Government Employees | 14 | 1.6% |
| Unpaid Family Workers | 0 | 0.0% |
| Total | 882 | 100.0% |
Employment Status by Age in Middletown
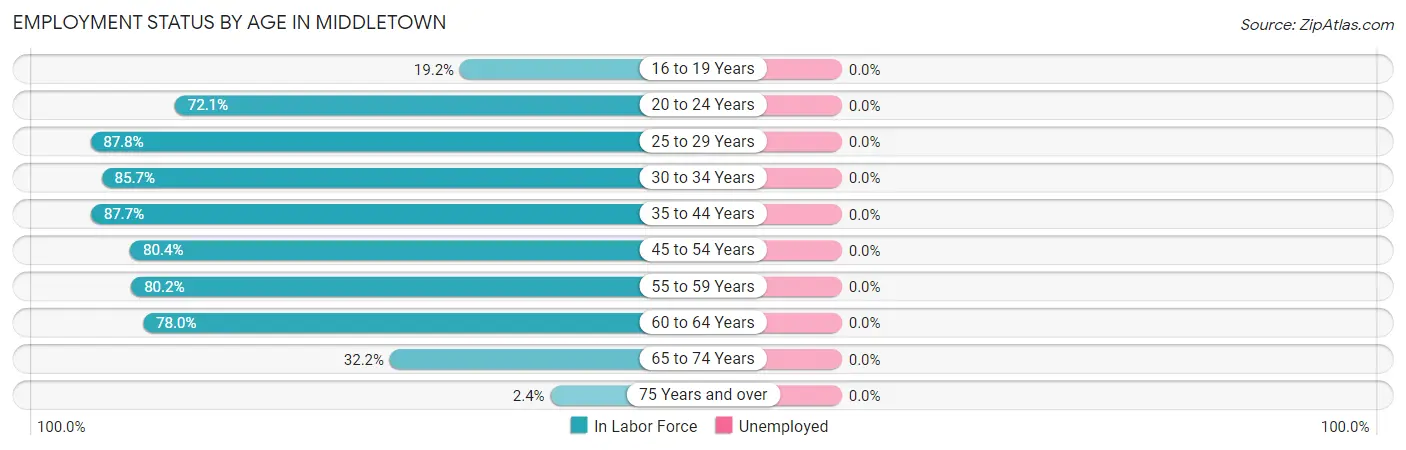
| Age Bracket | In Labor Force | Unemployed |
| 16 to 19 Years | 20 (19.2%) | 0 (0.0%) |
| 20 to 24 Years | 49 (72.1%) | 0 (0.0%) |
| 25 to 29 Years | 151 (87.8%) | 0 (0.0%) |
| 30 to 34 Years | 60 (85.7%) | 0 (0.0%) |
| 35 to 44 Years | 256 (87.7%) | 0 (0.0%) |
| 45 to 54 Years | 135 (80.4%) | 0 (0.0%) |
| 55 to 59 Years | 101 (80.2%) | 0 (0.0%) |
| 60 to 64 Years | 71 (78.0%) | 0 (0.0%) |
| 65 to 74 Years | 37 (32.2%) | 0 (0.0%) |
| 75 Years and over | 2 (2.4%) | 0 (0.0%) |
| Total | 882 (68.4%) | 0 (0.0%) |
Employment Status by Educational Attainment in Middletown
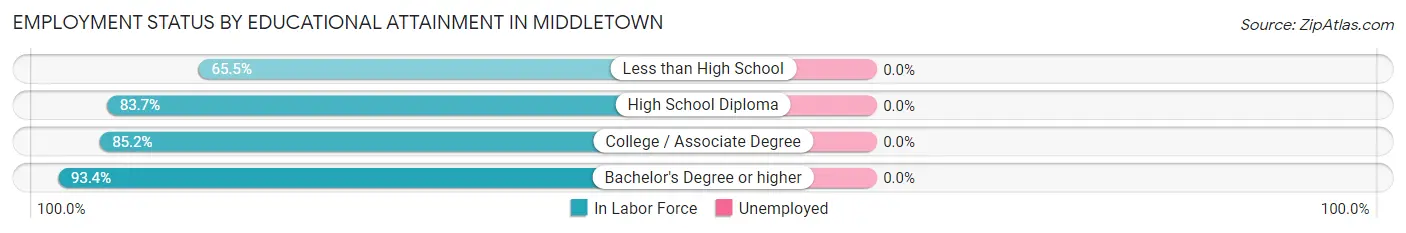
| Educational Attainment | In Labor Force | Unemployed |
| Less than High School | 74 (65.5%) | 0 (0.0%) |
| High School Diploma | 241 (83.7%) | 0 (0.0%) |
| College / Associate Degree | 260 (85.2%) | 0 (0.0%) |
| Bachelor's Degree or higher | 199 (93.4%) | 0 (0.0%) |
| Total | 774 (84.2%) | 0 (0.0%) |
Employment Occupations by Sex in Middletown
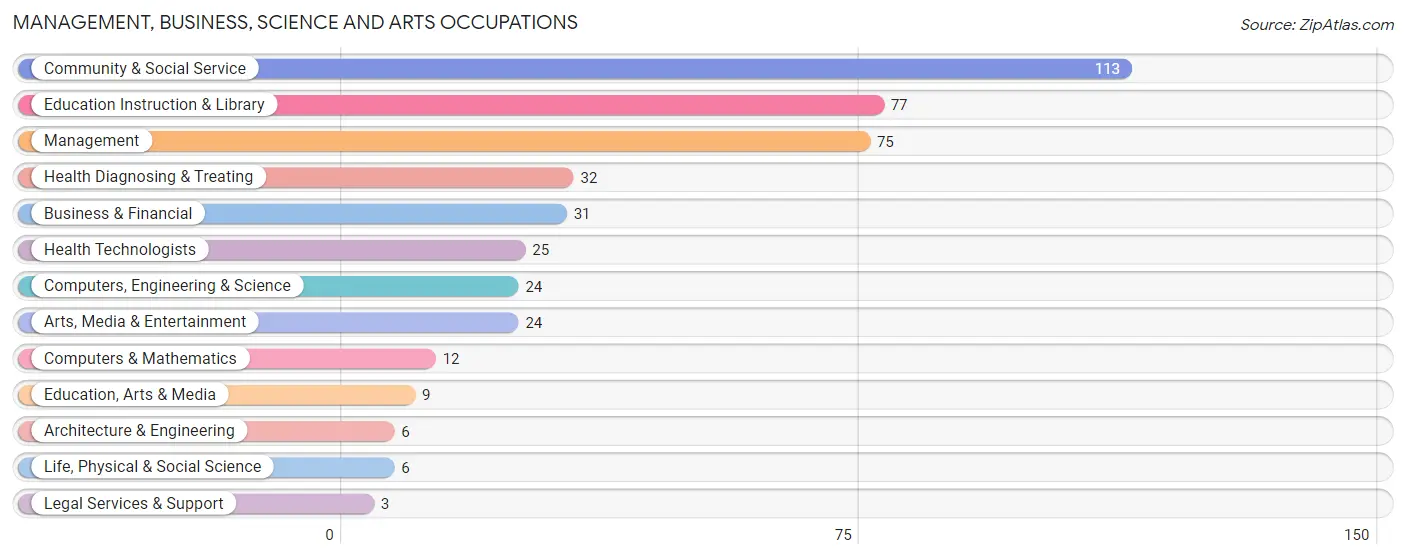
Management, Business, Science and Arts Occupations
The most common Management, Business, Science and Arts occupations in Middletown are Community & Social Service (113 | 12.8%), Education Instruction & Library (77 | 8.7%), Management (75 | 8.5%), Health Diagnosing & Treating (32 | 3.6%), and Business & Financial (31 | 3.5%).
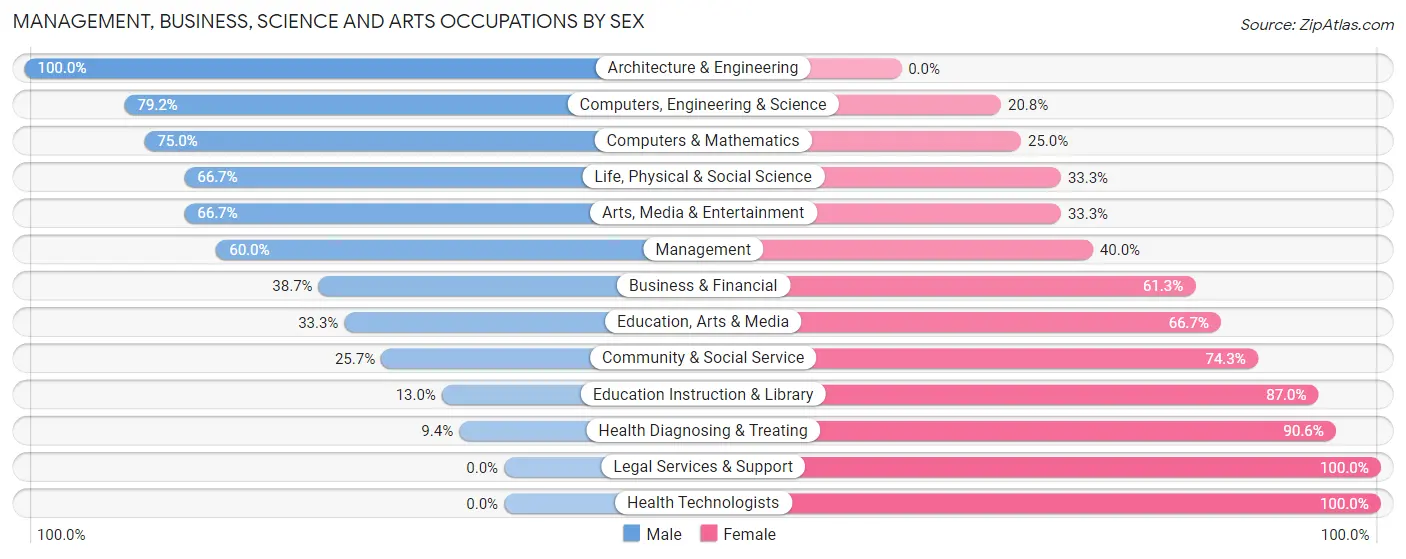
Management, Business, Science and Arts Occupations by Sex
Within the Management, Business, Science and Arts occupations in Middletown, the most male-oriented occupations are Architecture & Engineering (100.0%), Computers, Engineering & Science (79.2%), and Computers & Mathematics (75.0%), while the most female-oriented occupations are Legal Services & Support (100.0%), Health Technologists (100.0%), and Health Diagnosing & Treating (90.6%).
| Occupation | Male | Female |
| Management | 45 (60.0%) | 30 (40.0%) |
| Business & Financial | 12 (38.7%) | 19 (61.3%) |
| Computers, Engineering & Science | 19 (79.2%) | 5 (20.8%) |
| Computers & Mathematics | 9 (75.0%) | 3 (25.0%) |
| Architecture & Engineering | 6 (100.0%) | 0 (0.0%) |
| Life, Physical & Social Science | 4 (66.7%) | 2 (33.3%) |
| Community & Social Service | 29 (25.7%) | 84 (74.3%) |
| Education, Arts & Media | 3 (33.3%) | 6 (66.7%) |
| Legal Services & Support | 0 (0.0%) | 3 (100.0%) |
| Education Instruction & Library | 10 (13.0%) | 67 (87.0%) |
| Arts, Media & Entertainment | 16 (66.7%) | 8 (33.3%) |
| Health Diagnosing & Treating | 3 (9.4%) | 29 (90.6%) |
| Health Technologists | 0 (0.0%) | 25 (100.0%) |
| Total (Category) | 108 (39.3%) | 167 (60.7%) |
| Total (Overall) | 447 (50.7%) | 435 (49.3%) |
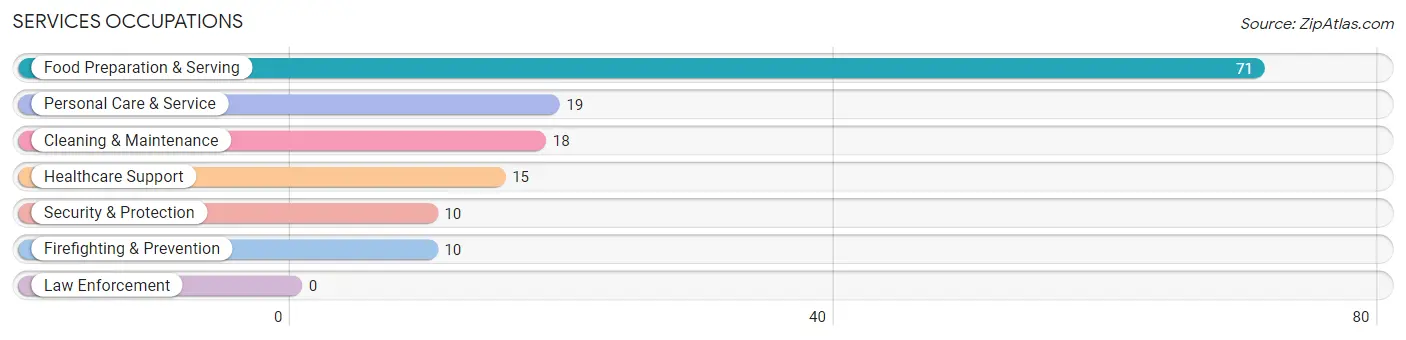
Services Occupations
The most common Services occupations in Middletown are Food Preparation & Serving (71 | 8.1%), Personal Care & Service (19 | 2.1%), Cleaning & Maintenance (18 | 2.0%), Healthcare Support (15 | 1.7%), and Security & Protection (10 | 1.1%).
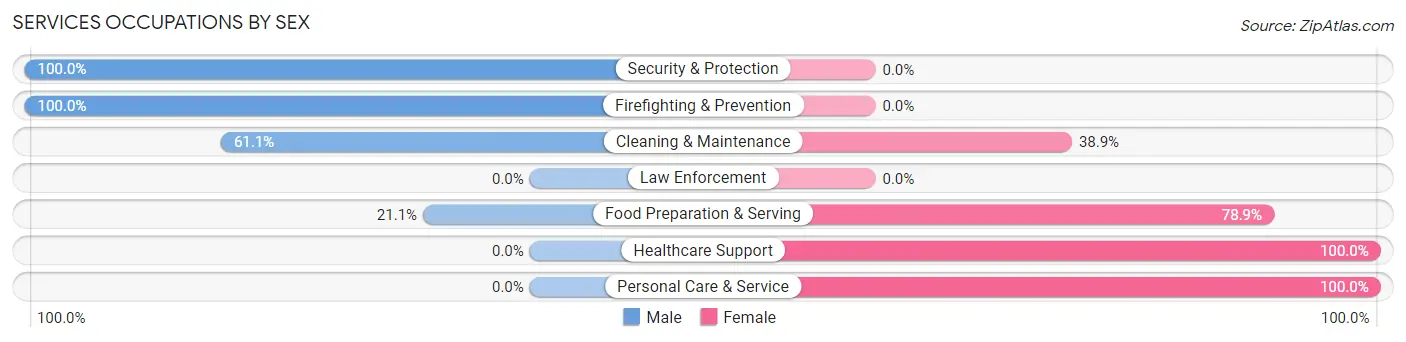
Services Occupations by Sex
Within the Services occupations in Middletown, the most male-oriented occupations are Security & Protection (100.0%), Firefighting & Prevention (100.0%), and Cleaning & Maintenance (61.1%), while the most female-oriented occupations are Healthcare Support (100.0%), Personal Care & Service (100.0%), and Food Preparation & Serving (78.9%).
| Occupation | Male | Female |
| Healthcare Support | 0 (0.0%) | 15 (100.0%) |
| Security & Protection | 10 (100.0%) | 0 (0.0%) |
| Firefighting & Prevention | 10 (100.0%) | 0 (0.0%) |
| Law Enforcement | 0 (0.0%) | 0 (0.0%) |
| Food Preparation & Serving | 15 (21.1%) | 56 (78.9%) |
| Cleaning & Maintenance | 11 (61.1%) | 7 (38.9%) |
| Personal Care & Service | 0 (0.0%) | 19 (100.0%) |
| Total (Category) | 36 (27.1%) | 97 (72.9%) |
| Total (Overall) | 447 (50.7%) | 435 (49.3%) |
Sales and Office Occupations
The most common Sales and Office occupations in Middletown are Office & Administration (91 | 10.3%), and Sales & Related (45 | 5.1%).
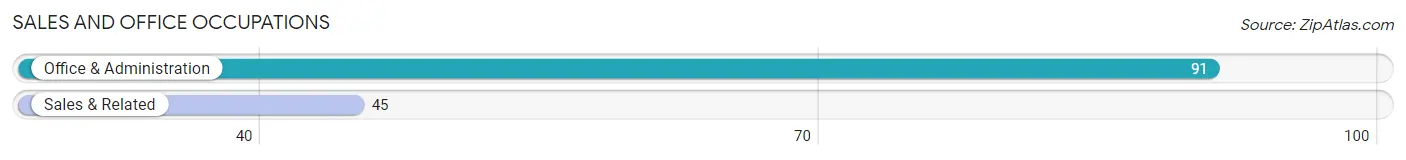
Sales and Office Occupations by Sex
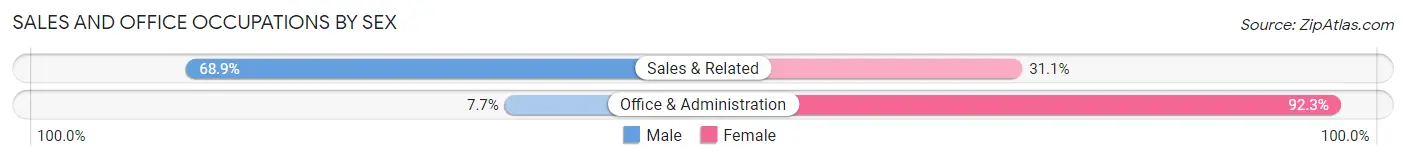
| Occupation | Male | Female |
| Sales & Related | 31 (68.9%) | 14 (31.1%) |
| Office & Administration | 7 (7.7%) | 84 (92.3%) |
| Total (Category) | 38 (27.9%) | 98 (72.1%) |
| Total (Overall) | 447 (50.7%) | 435 (49.3%) |
Natural Resources, Construction and Maintenance Occupations
The most common Natural Resources, Construction and Maintenance occupations in Middletown are Construction & Extraction (84 | 9.5%), and Installation, Maintenance & Repair (11 | 1.3%).
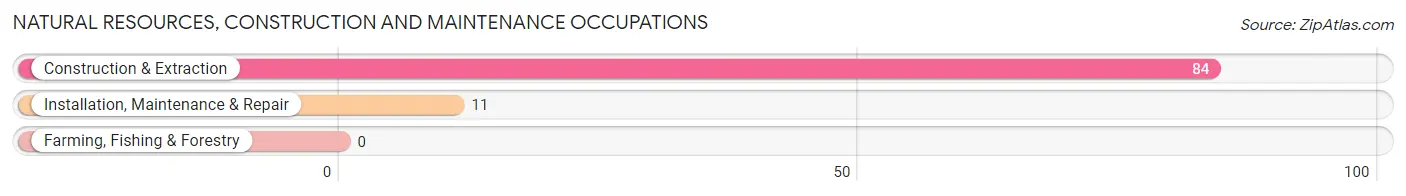
Natural Resources, Construction and Maintenance Occupations by Sex
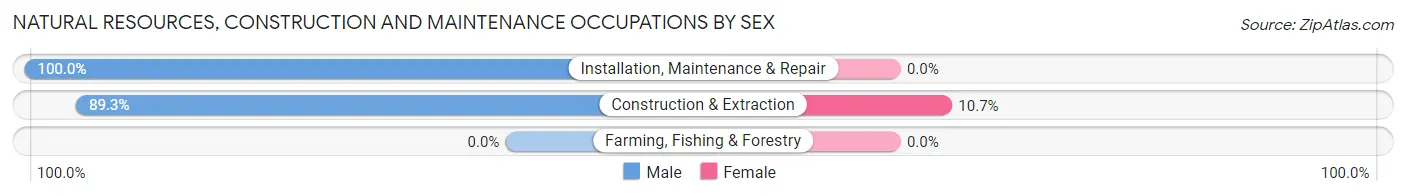
| Occupation | Male | Female |
| Farming, Fishing & Forestry | 0 (0.0%) | 0 (0.0%) |
| Construction & Extraction | 75 (89.3%) | 9 (10.7%) |
| Installation, Maintenance & Repair | 11 (100.0%) | 0 (0.0%) |
| Total (Category) | 86 (90.5%) | 9 (9.5%) |
| Total (Overall) | 447 (50.7%) | 435 (49.3%) |
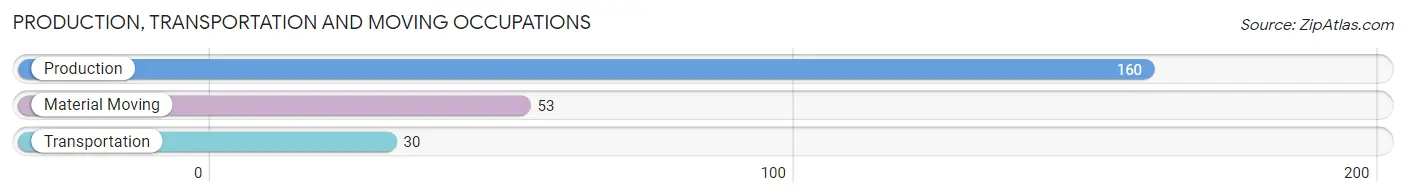
Production, Transportation and Moving Occupations
The most common Production, Transportation and Moving occupations in Middletown are Production (160 | 18.1%), Material Moving (53 | 6.0%), and Transportation (30 | 3.4%).
Production, Transportation and Moving Occupations by Sex
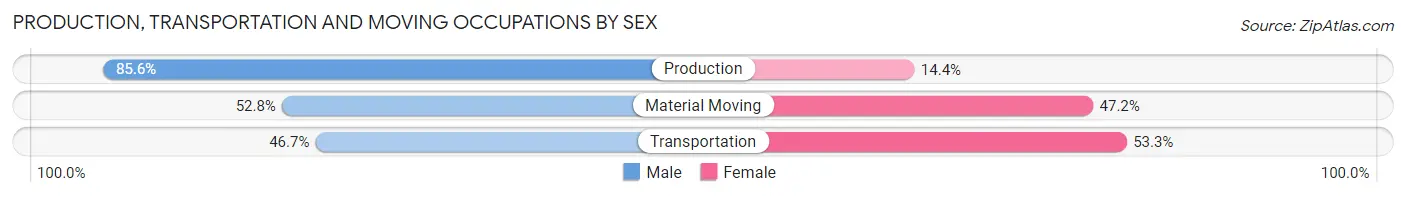
| Occupation | Male | Female |
| Production | 137 (85.6%) | 23 (14.4%) |
| Transportation | 14 (46.7%) | 16 (53.3%) |
| Material Moving | 28 (52.8%) | 25 (47.2%) |
| Total (Category) | 179 (73.7%) | 64 (26.3%) |
| Total (Overall) | 447 (50.7%) | 435 (49.3%) |
Employment Industries by Sex in Middletown
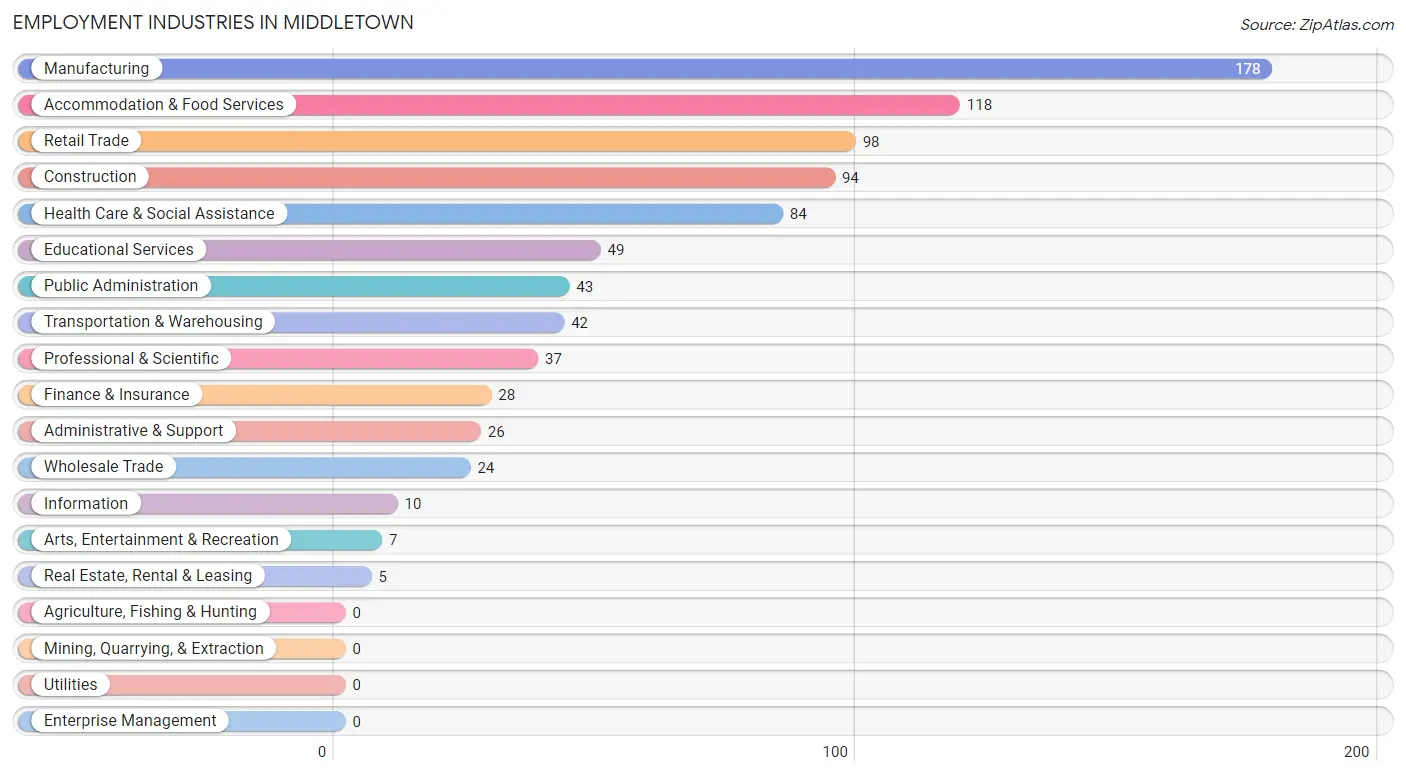
Employment Industries in Middletown
The major employment industries in Middletown include Manufacturing (178 | 20.2%), Accommodation & Food Services (118 | 13.4%), Retail Trade (98 | 11.1%), Construction (94 | 10.7%), and Health Care & Social Assistance (84 | 9.5%).
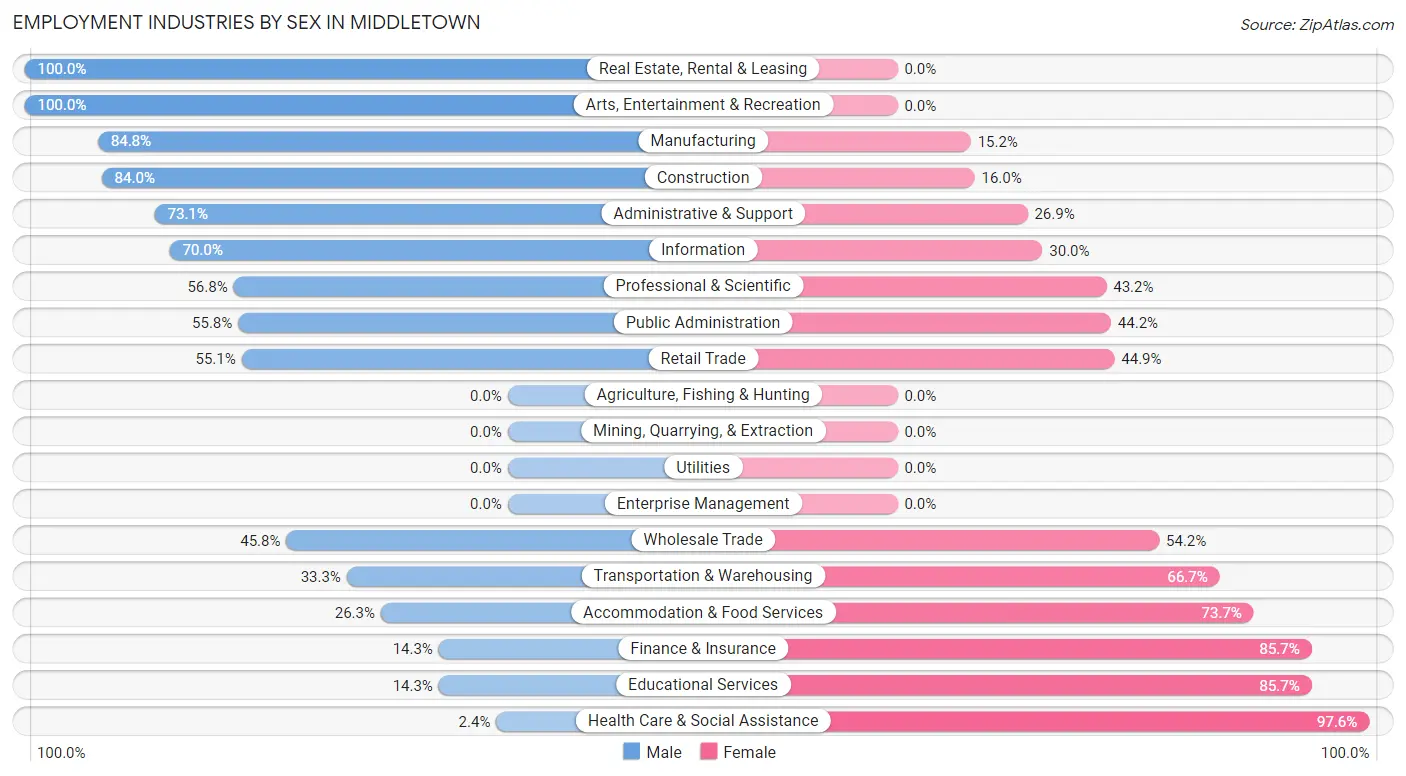
Employment Industries by Sex in Middletown
The Middletown industries that see more men than women are Real Estate, Rental & Leasing (100.0%), Arts, Entertainment & Recreation (100.0%), and Manufacturing (84.8%), whereas the industries that tend to have a higher number of women are Health Care & Social Assistance (97.6%), Finance & Insurance (85.7%), and Educational Services (85.7%).
| Industry | Male | Female |
| Agriculture, Fishing & Hunting | 0 (0.0%) | 0 (0.0%) |
| Mining, Quarrying, & Extraction | 0 (0.0%) | 0 (0.0%) |
| Construction | 79 (84.0%) | 15 (16.0%) |
| Manufacturing | 151 (84.8%) | 27 (15.2%) |
| Wholesale Trade | 11 (45.8%) | 13 (54.2%) |
| Retail Trade | 54 (55.1%) | 44 (44.9%) |
| Transportation & Warehousing | 14 (33.3%) | 28 (66.7%) |
| Utilities | 0 (0.0%) | 0 (0.0%) |
| Information | 7 (70.0%) | 3 (30.0%) |
| Finance & Insurance | 4 (14.3%) | 24 (85.7%) |
| Real Estate, Rental & Leasing | 5 (100.0%) | 0 (0.0%) |
| Professional & Scientific | 21 (56.8%) | 16 (43.2%) |
| Enterprise Management | 0 (0.0%) | 0 (0.0%) |
| Administrative & Support | 19 (73.1%) | 7 (26.9%) |
| Educational Services | 7 (14.3%) | 42 (85.7%) |
| Health Care & Social Assistance | 2 (2.4%) | 82 (97.6%) |
| Arts, Entertainment & Recreation | 7 (100.0%) | 0 (0.0%) |
| Accommodation & Food Services | 31 (26.3%) | 87 (73.7%) |
| Public Administration | 24 (55.8%) | 19 (44.2%) |
| Total | 447 (50.7%) | 435 (49.3%) |
Education in Middletown
School Enrollment in Middletown
The most common levels of schooling among the 264 students in Middletown are high school (103 | 39.0%), middle school (65 | 24.6%), and elementary school (29 | 11.0%).
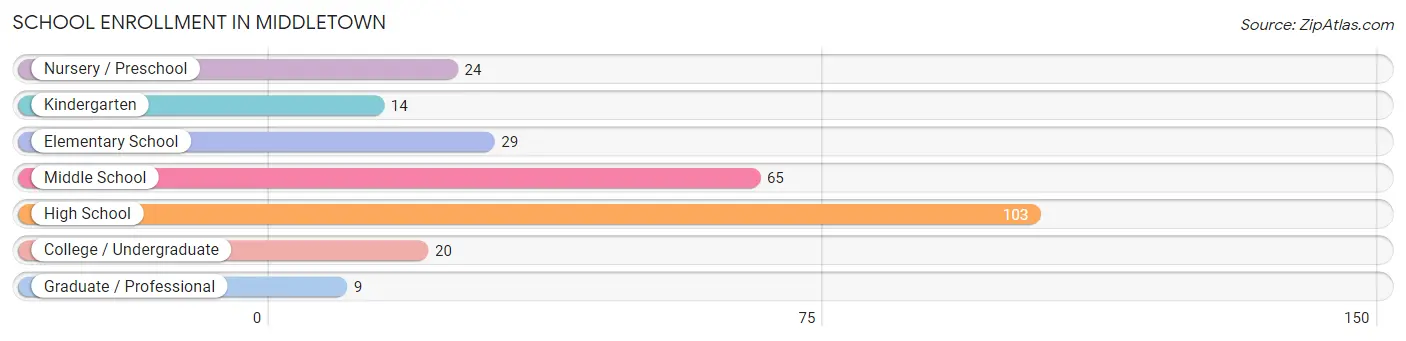
| School Level | # Students | % Students |
| Nursery / Preschool | 24 | 9.1% |
| Kindergarten | 14 | 5.3% |
| Elementary School | 29 | 11.0% |
| Middle School | 65 | 24.6% |
| High School | 103 | 39.0% |
| College / Undergraduate | 20 | 7.6% |
| Graduate / Professional | 9 | 3.4% |
| Total | 264 | 100.0% |
School Enrollment by Age by Funding Source in Middletown
Out of a total of 264 students who are enrolled in schools in Middletown, 21 (8.0%) attend a private institution, while the remaining 243 (92.0%) are enrolled in public schools. The age group of 25 to 34 year olds has the highest likelihood of being enrolled in private schools, with 5 (41.7% in the age bracket) enrolled. Conversely, the age group of 10 to 14 year olds has the lowest likelihood of being enrolled in a private school, with 62 (100.0% in the age bracket) attending a public institution.
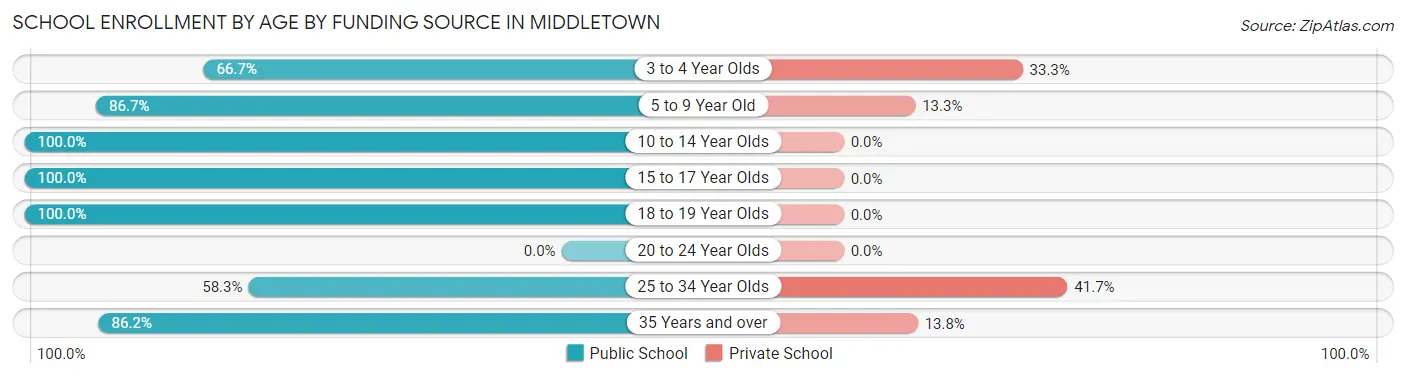
| Age Bracket | Public School | Private School |
| 3 to 4 Year Olds | 12 (66.7%) | 6 (33.3%) |
| 5 to 9 Year Old | 39 (86.7%) | 6 (13.3%) |
| 10 to 14 Year Olds | 62 (100.0%) | 0 (0.0%) |
| 15 to 17 Year Olds | 82 (100.0%) | 0 (0.0%) |
| 18 to 19 Year Olds | 16 (100.0%) | 0 (0.0%) |
| 20 to 24 Year Olds | 0 (0.0%) | 0 (0.0%) |
| 25 to 34 Year Olds | 7 (58.3%) | 5 (41.7%) |
| 35 Years and over | 25 (86.2%) | 4 (13.8%) |
| Total | 243 (92.0%) | 21 (8.0%) |
Educational Attainment by Field of Study in Middletown
Social sciences (59 | 23.3%), education (42 | 16.6%), business (25 | 9.9%), bio, nature & agricultural (24 | 9.5%), and science & technology (24 | 9.5%) are the most common fields of study among 253 individuals in Middletown who have obtained a bachelor's degree or higher.
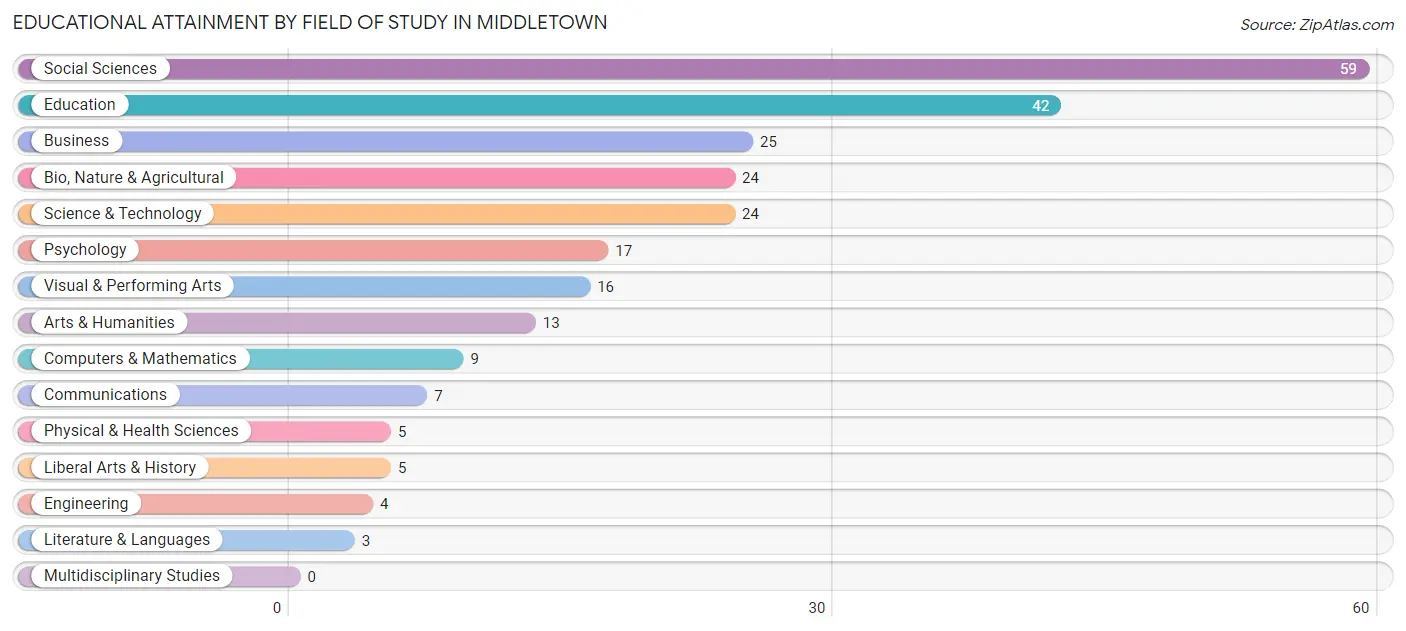
| Field of Study | # Graduates | % Graduates |
| Computers & Mathematics | 9 | 3.6% |
| Bio, Nature & Agricultural | 24 | 9.5% |
| Physical & Health Sciences | 5 | 2.0% |
| Psychology | 17 | 6.7% |
| Social Sciences | 59 | 23.3% |
| Engineering | 4 | 1.6% |
| Multidisciplinary Studies | 0 | 0.0% |
| Science & Technology | 24 | 9.5% |
| Business | 25 | 9.9% |
| Education | 42 | 16.6% |
| Literature & Languages | 3 | 1.2% |
| Liberal Arts & History | 5 | 2.0% |
| Visual & Performing Arts | 16 | 6.3% |
| Communications | 7 | 2.8% |
| Arts & Humanities | 13 | 5.1% |
| Total | 253 | 100.0% |
Transportation & Commute in Middletown
Vehicle Availability by Sex in Middletown
The most prevalent vehicle ownership categories in Middletown are males with 2 vehicles (262, accounting for 58.6%) and females with 2 vehicles (196, making up 60.2%).
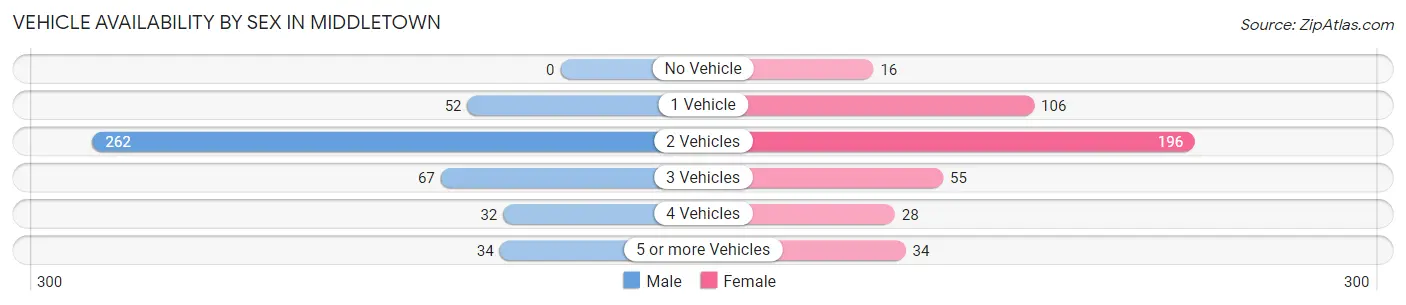
| Vehicles Available | Male | Female |
| No Vehicle | 0 (0.0%) | 16 (3.7%) |
| 1 Vehicle | 52 (11.6%) | 106 (24.4%) |
| 2 Vehicles | 262 (58.6%) | 196 (45.1%) |
| 3 Vehicles | 67 (15.0%) | 55 (12.6%) |
| 4 Vehicles | 32 (7.2%) | 28 (6.4%) |
| 5 or more Vehicles | 34 (7.6%) | 34 (7.8%) |
| Total | 447 (100.0%) | 435 (100.0%) |
Commute Time in Middletown
The most frequently occuring commute durations in Middletown are 20 to 24 minutes (344 commuters, 42.8%), 45 to 59 minutes (82 commuters, 10.2%), and 15 to 19 minutes (77 commuters, 9.6%).
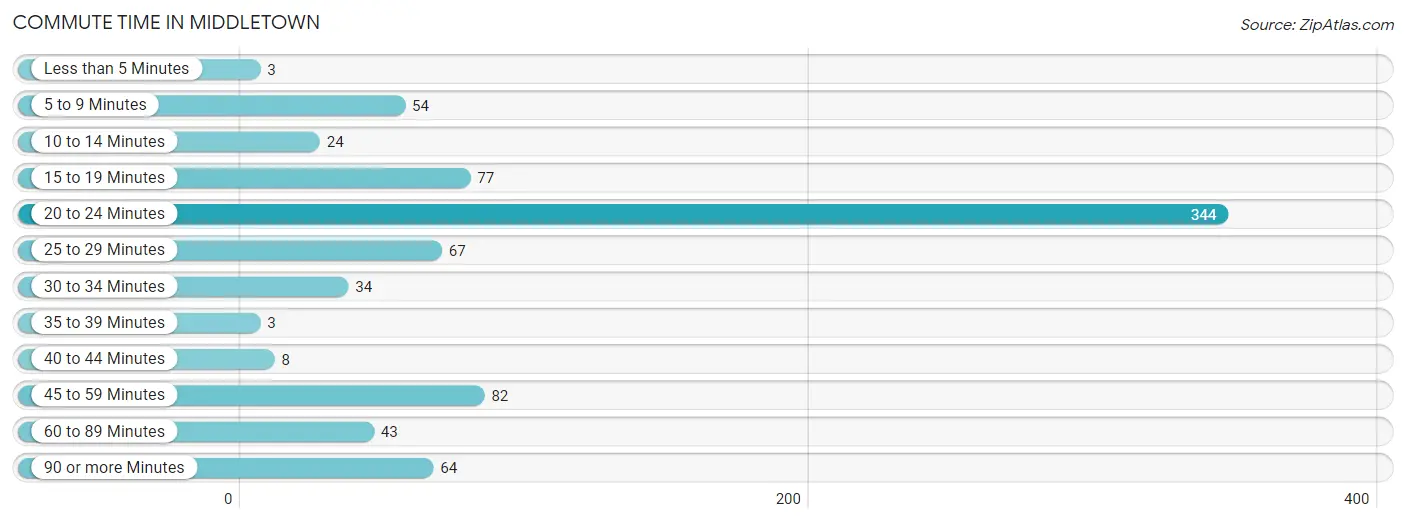
| Commute Time | # Commuters | % Commuters |
| Less than 5 Minutes | 3 | 0.4% |
| 5 to 9 Minutes | 54 | 6.7% |
| 10 to 14 Minutes | 24 | 3.0% |
| 15 to 19 Minutes | 77 | 9.6% |
| 20 to 24 Minutes | 344 | 42.8% |
| 25 to 29 Minutes | 67 | 8.3% |
| 30 to 34 Minutes | 34 | 4.2% |
| 35 to 39 Minutes | 3 | 0.4% |
| 40 to 44 Minutes | 8 | 1.0% |
| 45 to 59 Minutes | 82 | 10.2% |
| 60 to 89 Minutes | 43 | 5.3% |
| 90 or more Minutes | 64 | 8.0% |
Commute Time by Sex in Middletown
The most common commute times in Middletown are 20 to 24 minutes (165 commuters, 40.2%) for males and 20 to 24 minutes (179 commuters, 45.7%) for females.
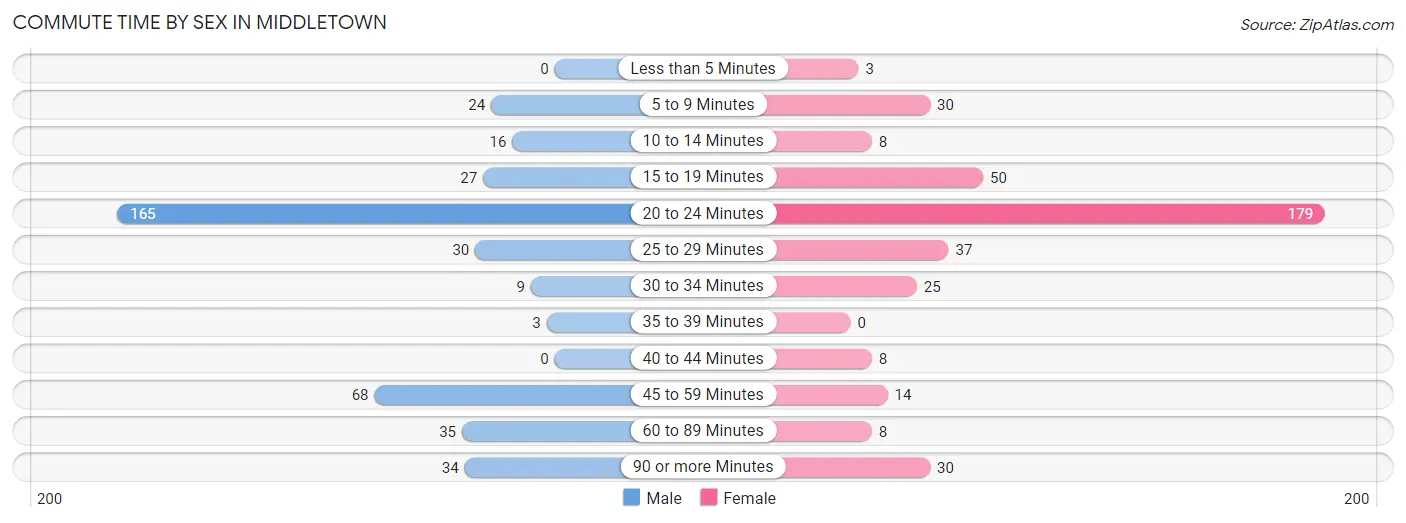
| Commute Time | Male | Female |
| Less than 5 Minutes | 0 (0.0%) | 3 (0.8%) |
| 5 to 9 Minutes | 24 (5.8%) | 30 (7.6%) |
| 10 to 14 Minutes | 16 (3.9%) | 8 (2.0%) |
| 15 to 19 Minutes | 27 (6.6%) | 50 (12.8%) |
| 20 to 24 Minutes | 165 (40.2%) | 179 (45.7%) |
| 25 to 29 Minutes | 30 (7.3%) | 37 (9.4%) |
| 30 to 34 Minutes | 9 (2.2%) | 25 (6.4%) |
| 35 to 39 Minutes | 3 (0.7%) | 0 (0.0%) |
| 40 to 44 Minutes | 0 (0.0%) | 8 (2.0%) |
| 45 to 59 Minutes | 68 (16.6%) | 14 (3.6%) |
| 60 to 89 Minutes | 35 (8.5%) | 8 (2.0%) |
| 90 or more Minutes | 34 (8.3%) | 30 (7.6%) |
Time of Departure to Work by Sex in Middletown
The most frequent times of departure to work in Middletown are 8:30 AM to 8:59 AM (101, 24.6%) for males and 7:00 AM to 7:29 AM (82, 20.9%) for females.
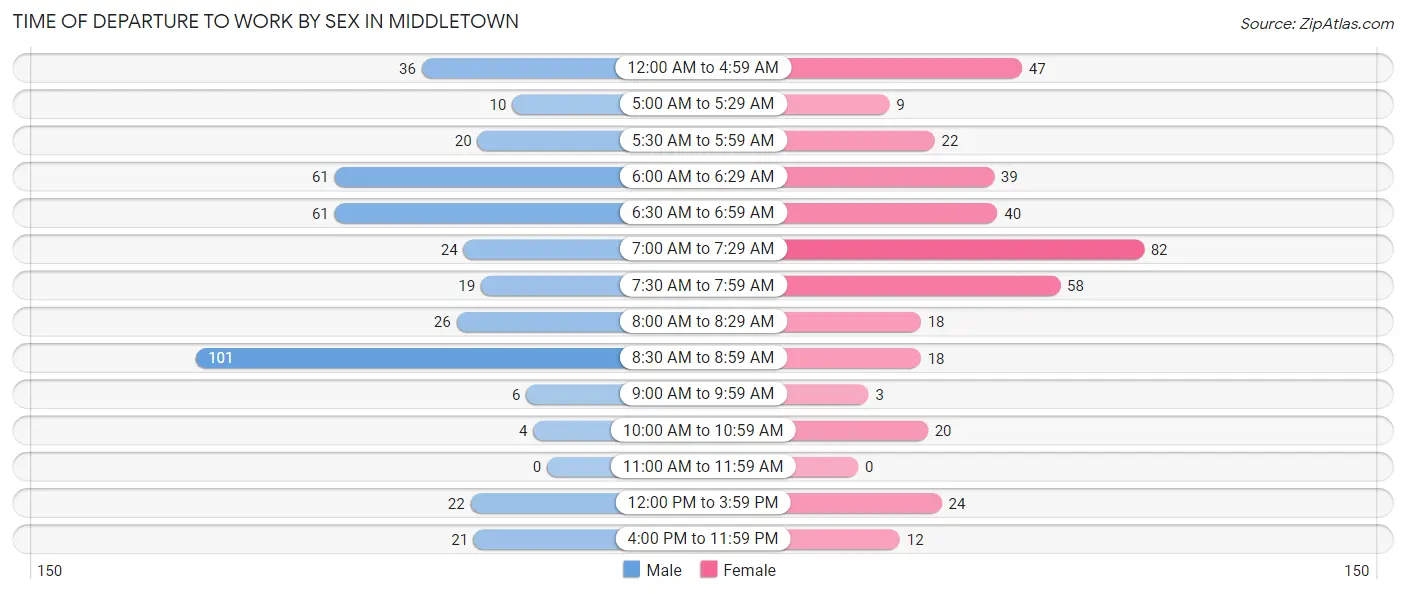
| Time of Departure | Male | Female |
| 12:00 AM to 4:59 AM | 36 (8.8%) | 47 (12.0%) |
| 5:00 AM to 5:29 AM | 10 (2.4%) | 9 (2.3%) |
| 5:30 AM to 5:59 AM | 20 (4.9%) | 22 (5.6%) |
| 6:00 AM to 6:29 AM | 61 (14.8%) | 39 (10.0%) |
| 6:30 AM to 6:59 AM | 61 (14.8%) | 40 (10.2%) |
| 7:00 AM to 7:29 AM | 24 (5.8%) | 82 (20.9%) |
| 7:30 AM to 7:59 AM | 19 (4.6%) | 58 (14.8%) |
| 8:00 AM to 8:29 AM | 26 (6.3%) | 18 (4.6%) |
| 8:30 AM to 8:59 AM | 101 (24.6%) | 18 (4.6%) |
| 9:00 AM to 9:59 AM | 6 (1.5%) | 3 (0.8%) |
| 10:00 AM to 10:59 AM | 4 (1.0%) | 20 (5.1%) |
| 11:00 AM to 11:59 AM | 0 (0.0%) | 0 (0.0%) |
| 12:00 PM to 3:59 PM | 22 (5.3%) | 24 (6.1%) |
| 4:00 PM to 11:59 PM | 21 (5.1%) | 12 (3.1%) |
| Total | 411 (100.0%) | 392 (100.0%) |
Housing Occupancy in Middletown
Occupancy by Ownership in Middletown
Of the total 638 dwellings in Middletown, owner-occupied units account for 328 (51.4%), while renter-occupied units make up 310 (48.6%).
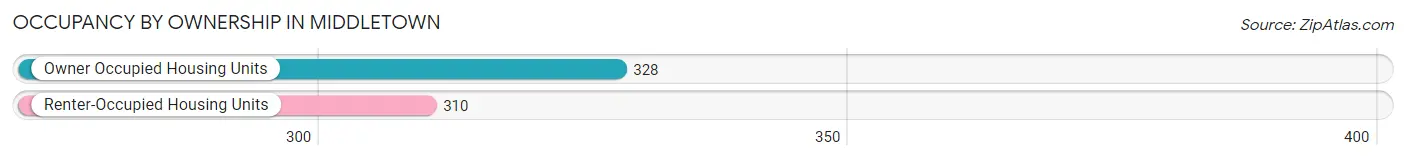
| Occupancy | # Housing Units | % Housing Units |
| Owner Occupied Housing Units | 328 | 51.4% |
| Renter-Occupied Housing Units | 310 | 48.6% |
| Total Occupied Housing Units | 638 | 100.0% |
Occupancy by Household Size in Middletown
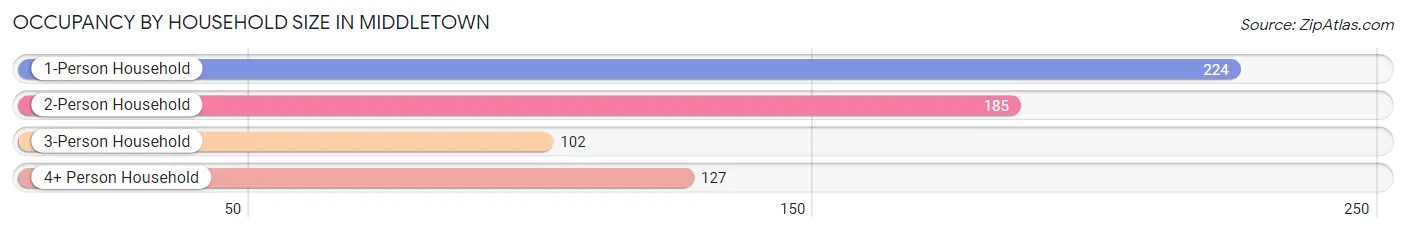
| Household Size | # Housing Units | % Housing Units |
| 1-Person Household | 224 | 35.1% |
| 2-Person Household | 185 | 29.0% |
| 3-Person Household | 102 | 16.0% |
| 4+ Person Household | 127 | 19.9% |
| Total Housing Units | 638 | 100.0% |
Occupancy by Ownership by Household Size in Middletown
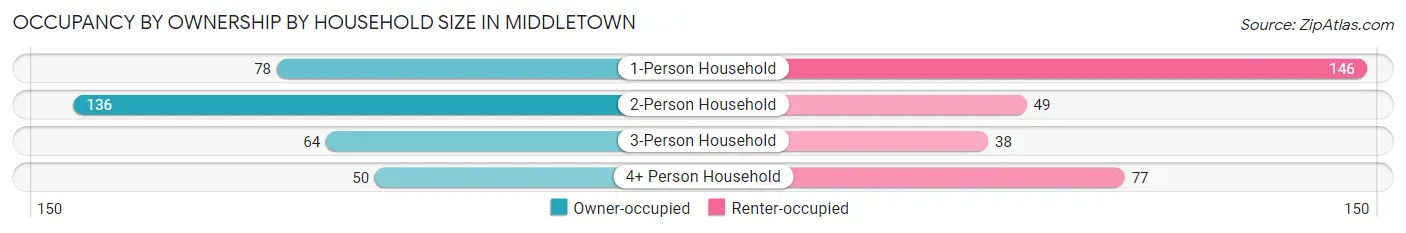
| Household Size | Owner-occupied | Renter-occupied |
| 1-Person Household | 78 (34.8%) | 146 (65.2%) |
| 2-Person Household | 136 (73.5%) | 49 (26.5%) |
| 3-Person Household | 64 (62.7%) | 38 (37.2%) |
| 4+ Person Household | 50 (39.4%) | 77 (60.6%) |
| Total Housing Units | 328 (51.4%) | 310 (48.6%) |
Occupancy by Educational Attainment in Middletown
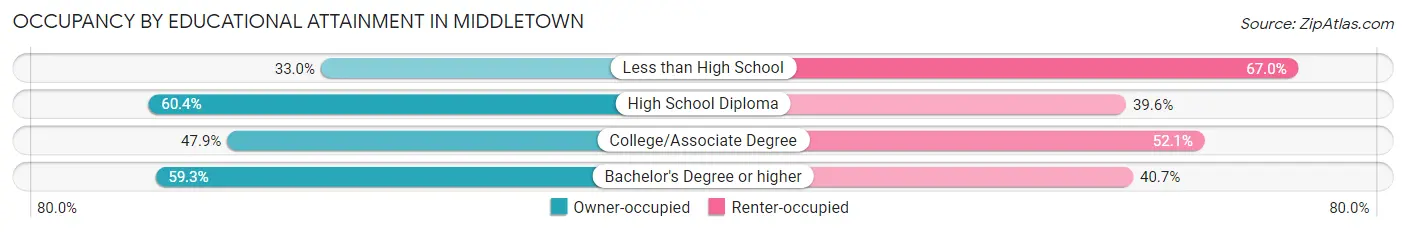
| Household Size | Owner-occupied | Renter-occupied |
| Less than High School | 35 (33.0%) | 71 (67.0%) |
| High School Diploma | 96 (60.4%) | 63 (39.6%) |
| College/Associate Degree | 101 (47.9%) | 110 (52.1%) |
| Bachelor's Degree or higher | 96 (59.3%) | 66 (40.7%) |
Occupancy by Age of Householder in Middletown
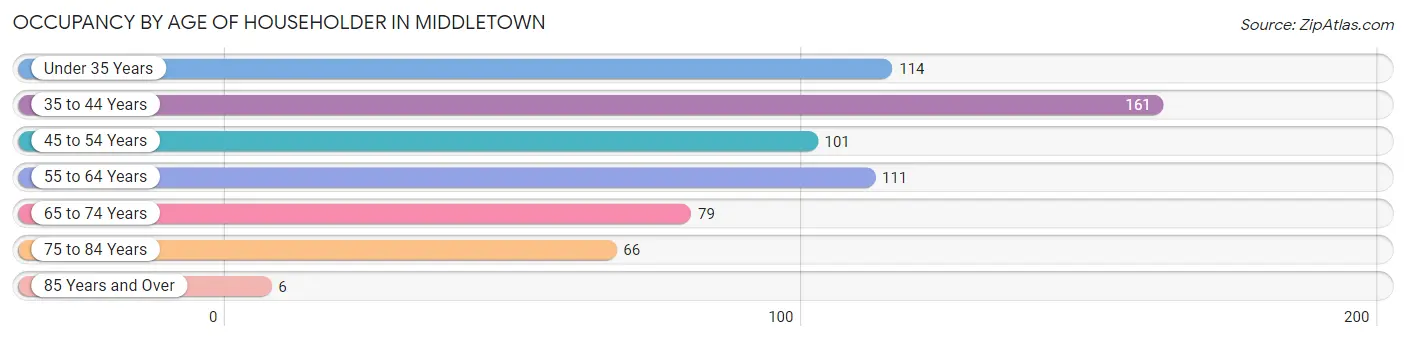
| Age Bracket | # Households | % Households |
| Under 35 Years | 114 | 17.9% |
| 35 to 44 Years | 161 | 25.2% |
| 45 to 54 Years | 101 | 15.8% |
| 55 to 64 Years | 111 | 17.4% |
| 65 to 74 Years | 79 | 12.4% |
| 75 to 84 Years | 66 | 10.3% |
| 85 Years and Over | 6 | 0.9% |
| Total | 638 | 100.0% |
Housing Finances in Middletown
Median Income by Occupancy in Middletown
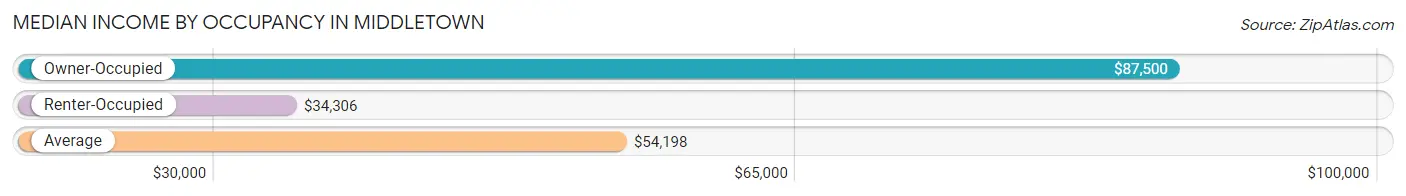
| Occupancy Type | # Households | Median Income |
| Owner-Occupied | 328 (51.4%) | $87,500 |
| Renter-Occupied | 310 (48.6%) | $34,306 |
| Average | 638 (100.0%) | $54,198 |
Occupancy by Householder Income Bracket in Middletown
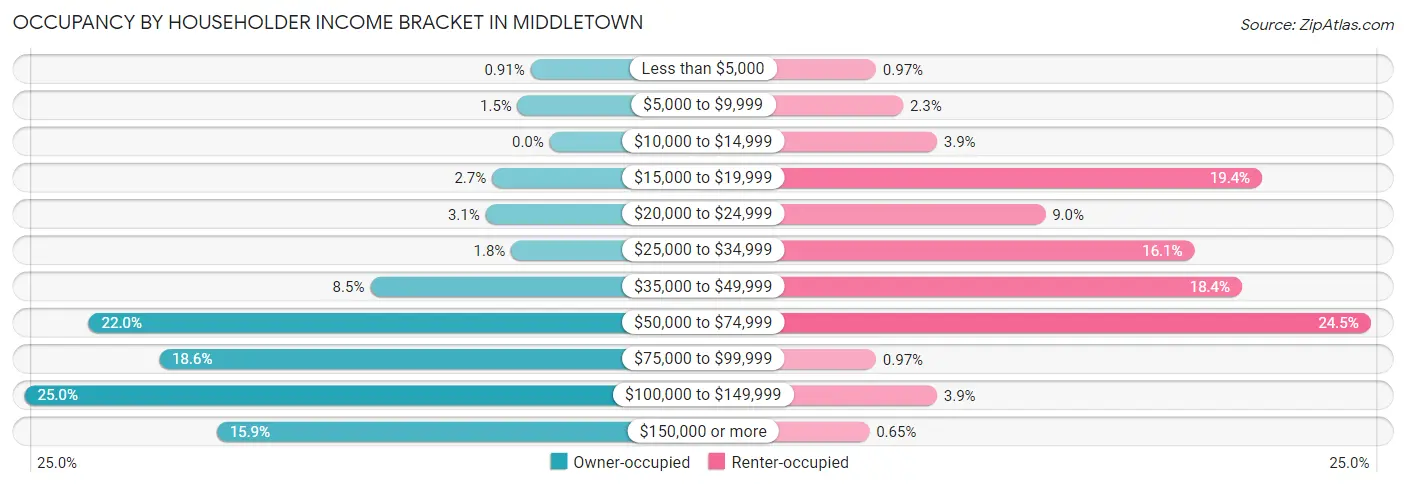
| Income Bracket | Owner-occupied | Renter-occupied |
| Less than $5,000 | 3 (0.9%) | 3 (1.0%) |
| $5,000 to $9,999 | 5 (1.5%) | 7 (2.3%) |
| $10,000 to $14,999 | 0 (0.0%) | 12 (3.9%) |
| $15,000 to $19,999 | 9 (2.7%) | 60 (19.4%) |
| $20,000 to $24,999 | 10 (3.0%) | 28 (9.0%) |
| $25,000 to $34,999 | 6 (1.8%) | 50 (16.1%) |
| $35,000 to $49,999 | 28 (8.5%) | 57 (18.4%) |
| $50,000 to $74,999 | 72 (22.0%) | 76 (24.5%) |
| $75,000 to $99,999 | 61 (18.6%) | 3 (1.0%) |
| $100,000 to $149,999 | 82 (25.0%) | 12 (3.9%) |
| $150,000 or more | 52 (15.9%) | 2 (0.6%) |
| Total | 328 (100.0%) | 310 (100.0%) |
Monthly Housing Cost Tiers in Middletown
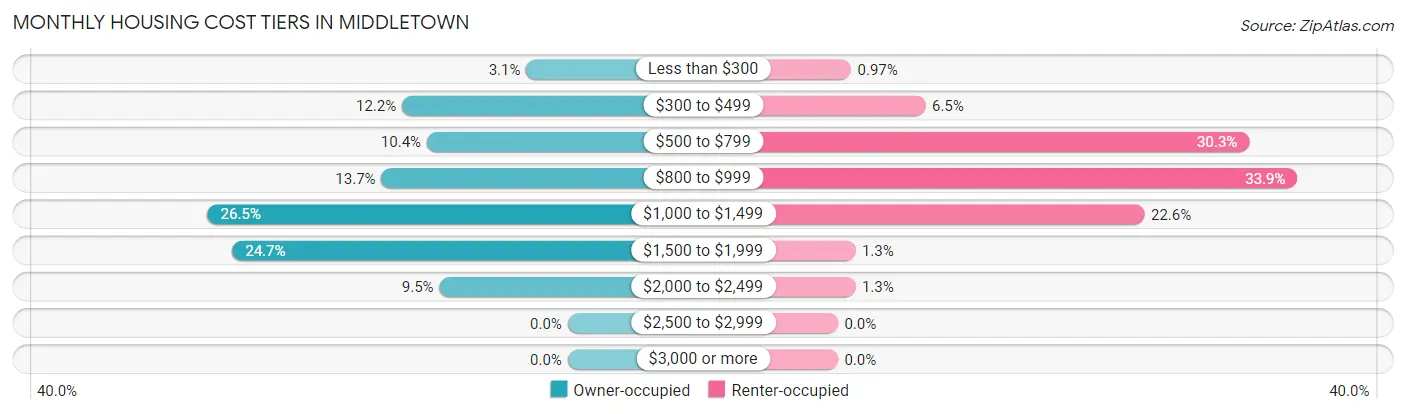
| Monthly Cost | Owner-occupied | Renter-occupied |
| Less than $300 | 10 (3.0%) | 3 (1.0%) |
| $300 to $499 | 40 (12.2%) | 20 (6.5%) |
| $500 to $799 | 34 (10.4%) | 94 (30.3%) |
| $800 to $999 | 45 (13.7%) | 105 (33.9%) |
| $1,000 to $1,499 | 87 (26.5%) | 70 (22.6%) |
| $1,500 to $1,999 | 81 (24.7%) | 4 (1.3%) |
| $2,000 to $2,499 | 31 (9.5%) | 4 (1.3%) |
| $2,500 to $2,999 | 0 (0.0%) | 0 (0.0%) |
| $3,000 or more | 0 (0.0%) | 0 (0.0%) |
| Total | 328 (100.0%) | 310 (100.0%) |
Physical Housing Characteristics in Middletown
Housing Structures in Middletown
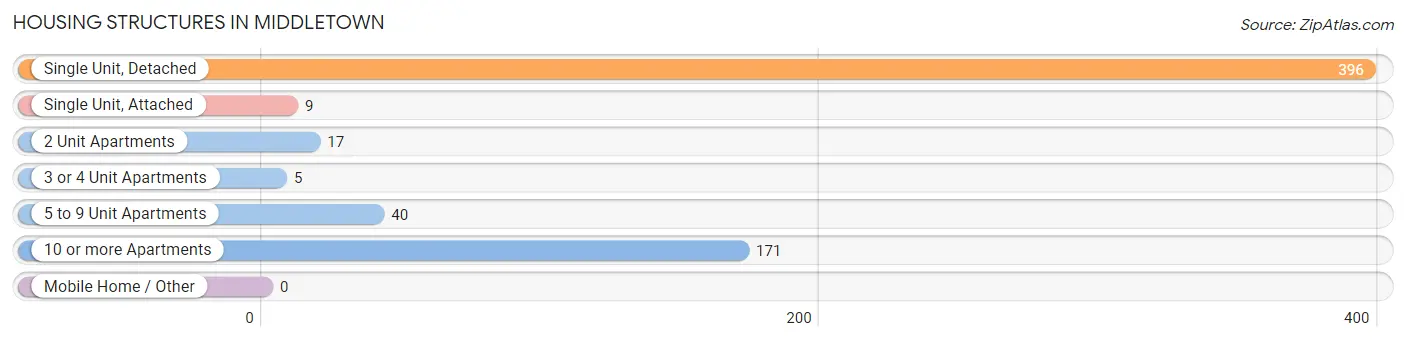
| Structure Type | # Housing Units | % Housing Units |
| Single Unit, Detached | 396 | 62.1% |
| Single Unit, Attached | 9 | 1.4% |
| 2 Unit Apartments | 17 | 2.7% |
| 3 or 4 Unit Apartments | 5 | 0.8% |
| 5 to 9 Unit Apartments | 40 | 6.3% |
| 10 or more Apartments | 171 | 26.8% |
| Mobile Home / Other | 0 | 0.0% |
| Total | 638 | 100.0% |
Housing Structures by Occupancy in Middletown
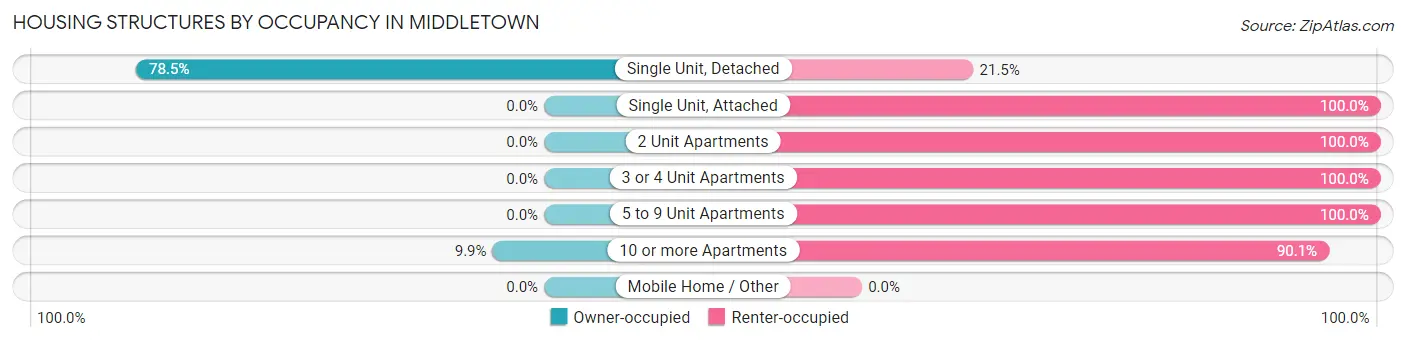
| Structure Type | Owner-occupied | Renter-occupied |
| Single Unit, Detached | 311 (78.5%) | 85 (21.5%) |
| Single Unit, Attached | 0 (0.0%) | 9 (100.0%) |
| 2 Unit Apartments | 0 (0.0%) | 17 (100.0%) |
| 3 or 4 Unit Apartments | 0 (0.0%) | 5 (100.0%) |
| 5 to 9 Unit Apartments | 0 (0.0%) | 40 (100.0%) |
| 10 or more Apartments | 17 (9.9%) | 154 (90.1%) |
| Mobile Home / Other | 0 (0.0%) | 0 (0.0%) |
| Total | 328 (51.4%) | 310 (48.6%) |
Housing Structures by Number of Rooms in Middletown
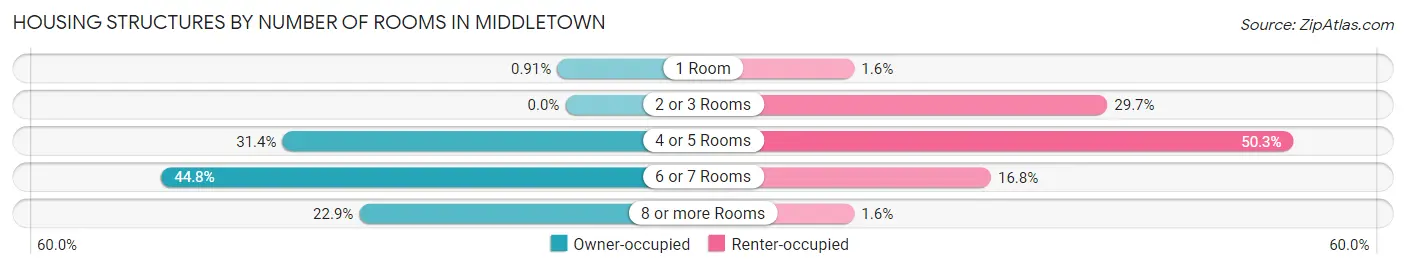
| Number of Rooms | Owner-occupied | Renter-occupied |
| 1 Room | 3 (0.9%) | 5 (1.6%) |
| 2 or 3 Rooms | 0 (0.0%) | 92 (29.7%) |
| 4 or 5 Rooms | 103 (31.4%) | 156 (50.3%) |
| 6 or 7 Rooms | 147 (44.8%) | 52 (16.8%) |
| 8 or more Rooms | 75 (22.9%) | 5 (1.6%) |
| Total | 328 (100.0%) | 310 (100.0%) |
Housing Structure by Heating Type in Middletown
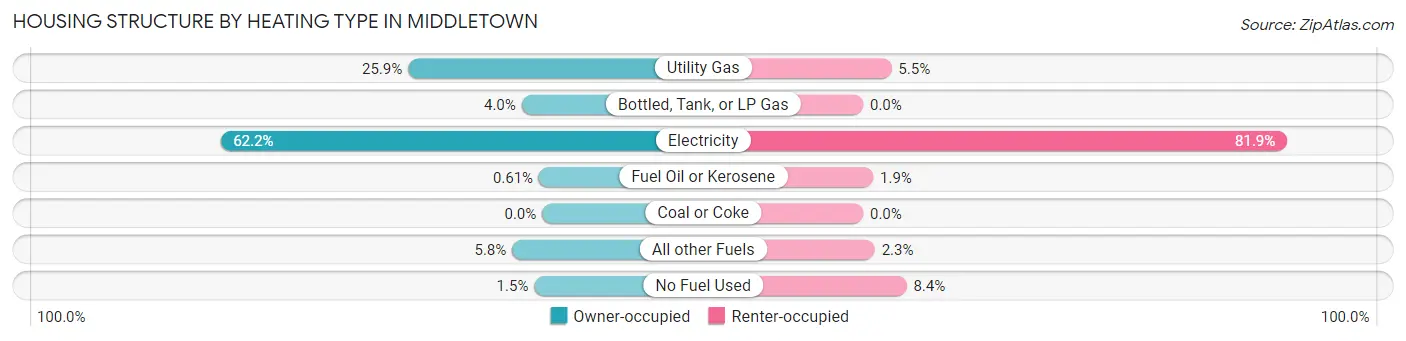
| Heating Type | Owner-occupied | Renter-occupied |
| Utility Gas | 85 (25.9%) | 17 (5.5%) |
| Bottled, Tank, or LP Gas | 13 (4.0%) | 0 (0.0%) |
| Electricity | 204 (62.2%) | 254 (81.9%) |
| Fuel Oil or Kerosene | 2 (0.6%) | 6 (1.9%) |
| Coal or Coke | 0 (0.0%) | 0 (0.0%) |
| All other Fuels | 19 (5.8%) | 7 (2.3%) |
| No Fuel Used | 5 (1.5%) | 26 (8.4%) |
| Total | 328 (100.0%) | 310 (100.0%) |
Household Vehicle Usage in Middletown
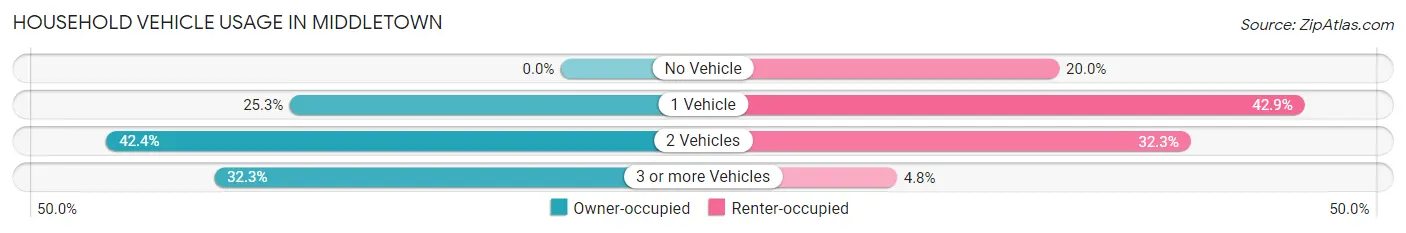
| Vehicles per Household | Owner-occupied | Renter-occupied |
| No Vehicle | 0 (0.0%) | 62 (20.0%) |
| 1 Vehicle | 83 (25.3%) | 133 (42.9%) |
| 2 Vehicles | 139 (42.4%) | 100 (32.3%) |
| 3 or more Vehicles | 106 (32.3%) | 15 (4.8%) |
| Total | 328 (100.0%) | 310 (100.0%) |
Real Estate & Mortgages in Middletown
Real Estate and Mortgage Overview in Middletown
| Characteristic | Without Mortgage | With Mortgage |
| Housing Units | 87 | 241 |
| Median Property Value | $222,100 | $266,200 |
| Median Household Income | $93,125 | $26 |
| Monthly Housing Costs | $463 | $0 |
| Real Estate Taxes | $1,423 | $0 |
Property Value by Mortgage Status in Middletown
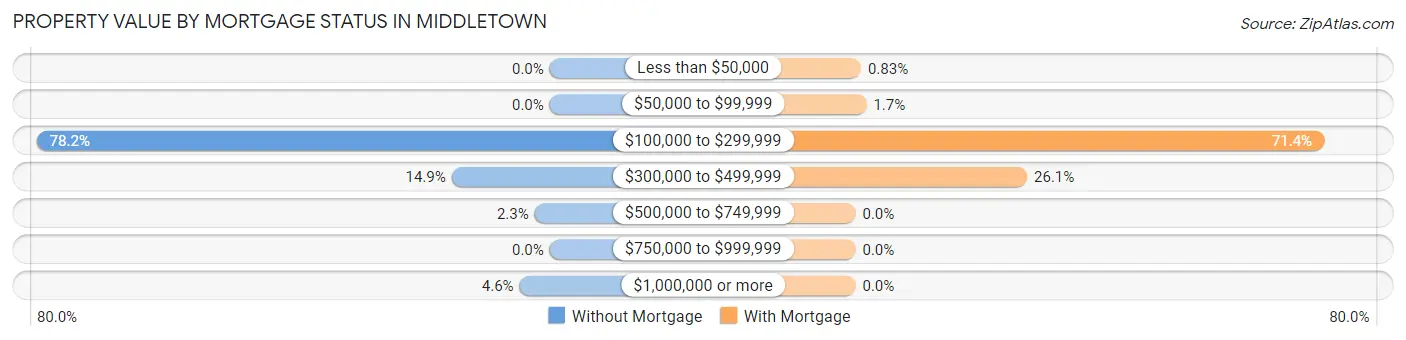
| Property Value | Without Mortgage | With Mortgage |
| Less than $50,000 | 0 (0.0%) | 2 (0.8%) |
| $50,000 to $99,999 | 0 (0.0%) | 4 (1.7%) |
| $100,000 to $299,999 | 68 (78.2%) | 172 (71.4%) |
| $300,000 to $499,999 | 13 (14.9%) | 63 (26.1%) |
| $500,000 to $749,999 | 2 (2.3%) | 0 (0.0%) |
| $750,000 to $999,999 | 0 (0.0%) | 0 (0.0%) |
| $1,000,000 or more | 4 (4.6%) | 0 (0.0%) |
| Total | 87 (100.0%) | 241 (100.0%) |
Household Income by Mortgage Status in Middletown
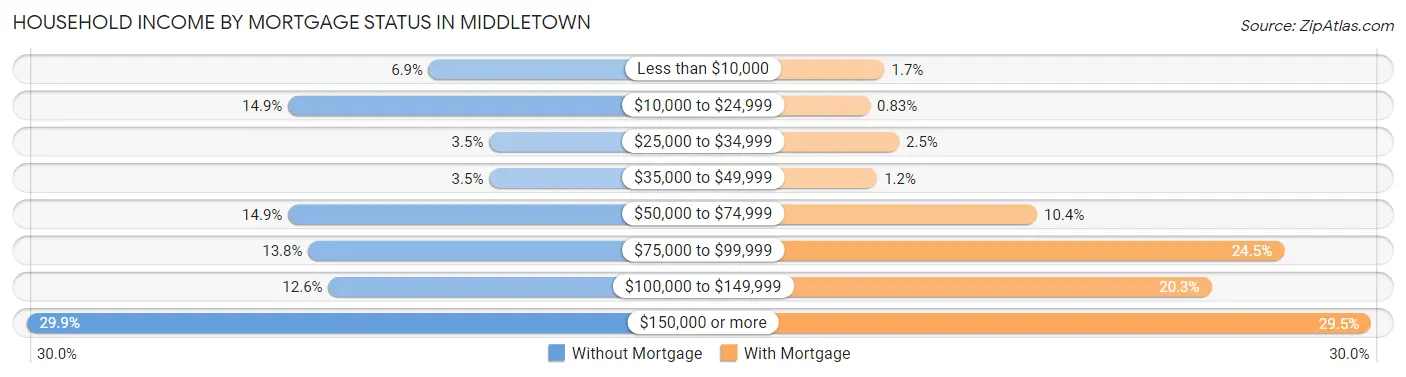
| Household Income | Without Mortgage | With Mortgage |
| Less than $10,000 | 6 (6.9%) | 4 (1.7%) |
| $10,000 to $24,999 | 13 (14.9%) | 2 (0.8%) |
| $25,000 to $34,999 | 3 (3.5%) | 6 (2.5%) |
| $35,000 to $49,999 | 3 (3.5%) | 3 (1.2%) |
| $50,000 to $74,999 | 13 (14.9%) | 25 (10.4%) |
| $75,000 to $99,999 | 12 (13.8%) | 59 (24.5%) |
| $100,000 to $149,999 | 11 (12.6%) | 49 (20.3%) |
| $150,000 or more | 26 (29.9%) | 71 (29.5%) |
| Total | 87 (100.0%) | 241 (100.0%) |
Property Value to Household Income Ratio in Middletown
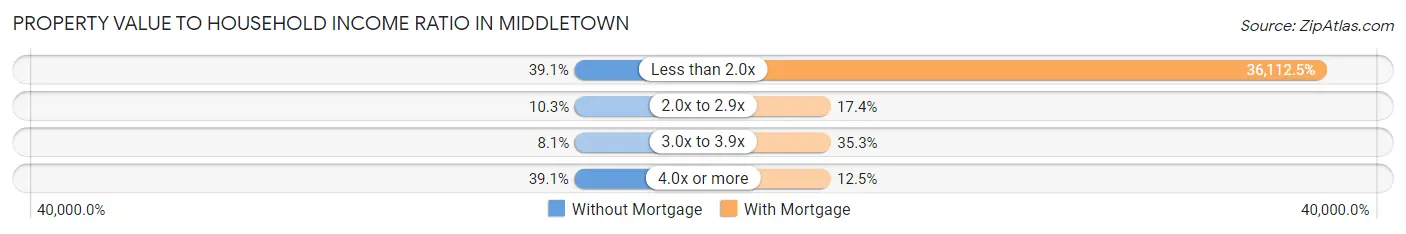
| Value-to-Income Ratio | Without Mortgage | With Mortgage |
| Less than 2.0x | 34 (39.1%) | 87,031 (36,112.5%) |
| 2.0x to 2.9x | 9 (10.3%) | 42 (17.4%) |
| 3.0x to 3.9x | 7 (8.1%) | 85 (35.3%) |
| 4.0x or more | 34 (39.1%) | 30 (12.4%) |
| Total | 87 (100.0%) | 241 (100.0%) |
Real Estate Taxes by Mortgage Status in Middletown
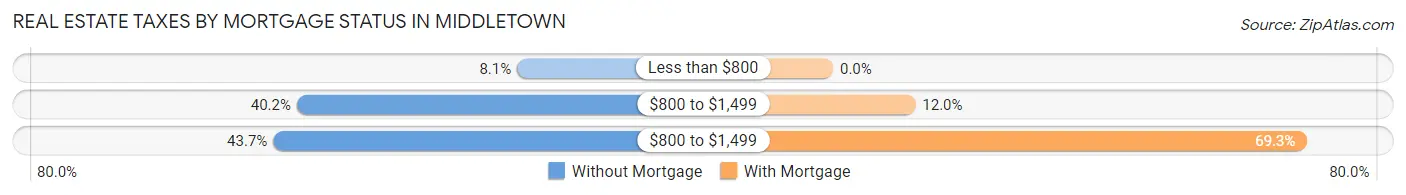
| Property Taxes | Without Mortgage | With Mortgage |
| Less than $800 | 7 (8.1%) | 0 (0.0%) |
| $800 to $1,499 | 35 (40.2%) | 29 (12.0%) |
| $800 to $1,499 | 38 (43.7%) | 167 (69.3%) |
| Total | 87 (100.0%) | 241 (100.0%) |
Health & Disability in Middletown
Health Insurance Coverage by Age in Middletown
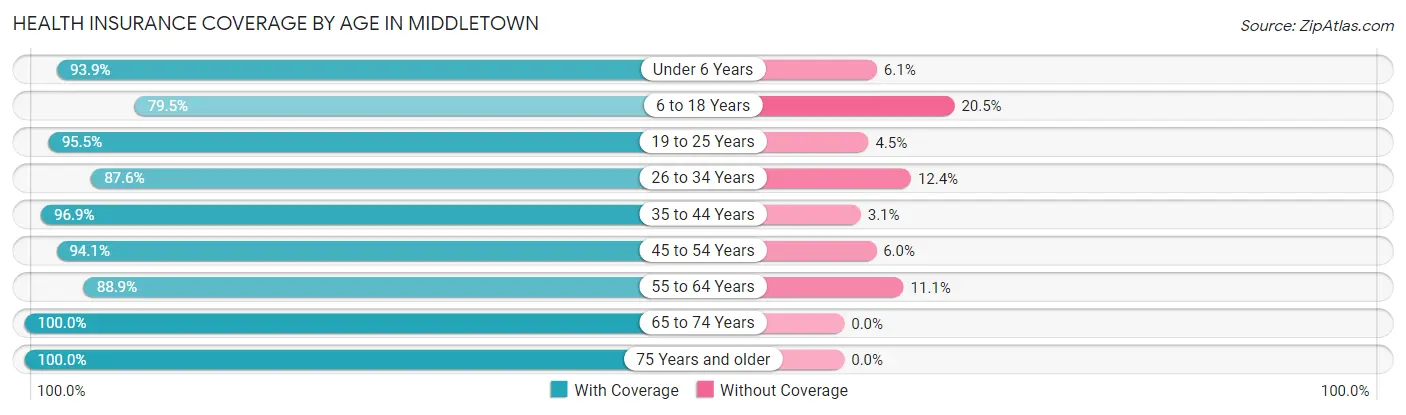
| Age Bracket | With Coverage | Without Coverage |
| Under 6 Years | 139 (93.9%) | 9 (6.1%) |
| 6 to 18 Years | 178 (79.5%) | 46 (20.5%) |
| 19 to 25 Years | 127 (95.5%) | 6 (4.5%) |
| 26 to 34 Years | 155 (87.6%) | 22 (12.4%) |
| 35 to 44 Years | 283 (96.9%) | 9 (3.1%) |
| 45 to 54 Years | 158 (94.1%) | 10 (5.9%) |
| 55 to 64 Years | 193 (88.9%) | 24 (11.1%) |
| 65 to 74 Years | 115 (100.0%) | 0 (0.0%) |
| 75 Years and older | 84 (100.0%) | 0 (0.0%) |
| Total | 1,432 (91.9%) | 126 (8.1%) |
Health Insurance Coverage by Citizenship Status in Middletown
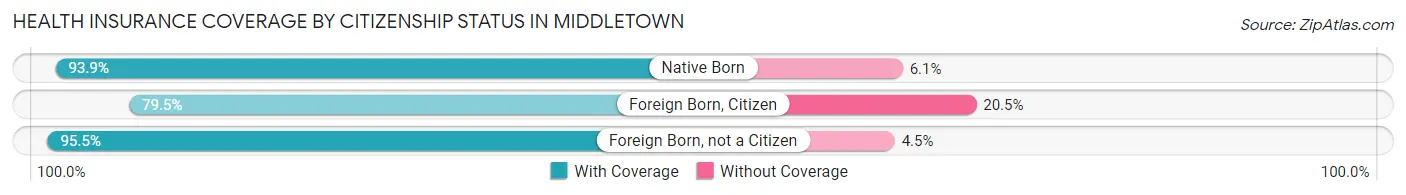
| Citizenship Status | With Coverage | Without Coverage |
| Native Born | 139 (93.9%) | 9 (6.1%) |
| Foreign Born, Citizen | 178 (79.5%) | 46 (20.5%) |
| Foreign Born, not a Citizen | 127 (95.5%) | 6 (4.5%) |
Health Insurance Coverage by Household Income in Middletown
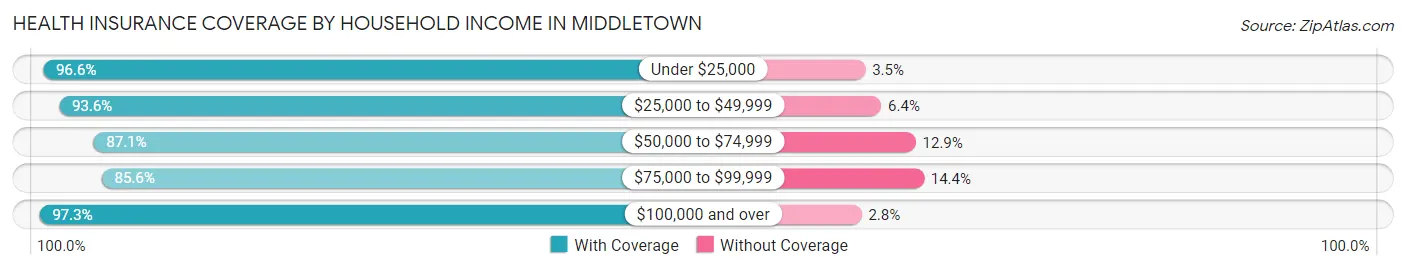
| Household Income | With Coverage | Without Coverage |
| Under $25,000 | 168 (96.6%) | 6 (3.5%) |
| $25,000 to $49,999 | 305 (93.6%) | 21 (6.4%) |
| $50,000 to $74,999 | 392 (87.1%) | 58 (12.9%) |
| $75,000 to $99,999 | 178 (85.6%) | 30 (14.4%) |
| $100,000 and over | 389 (97.3%) | 11 (2.8%) |
Public vs Private Health Insurance Coverage by Age in Middletown
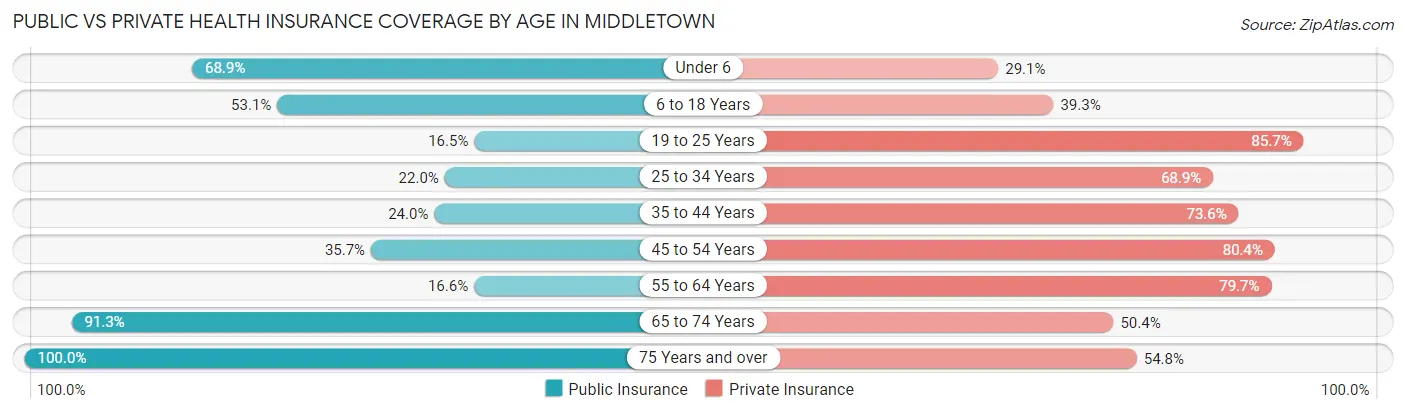
| Age Bracket | Public Insurance | Private Insurance |
| Under 6 | 102 (68.9%) | 43 (29.0%) |
| 6 to 18 Years | 119 (53.1%) | 88 (39.3%) |
| 19 to 25 Years | 22 (16.5%) | 114 (85.7%) |
| 25 to 34 Years | 39 (22.0%) | 122 (68.9%) |
| 35 to 44 Years | 70 (24.0%) | 215 (73.6%) |
| 45 to 54 Years | 60 (35.7%) | 135 (80.4%) |
| 55 to 64 Years | 36 (16.6%) | 173 (79.7%) |
| 65 to 74 Years | 105 (91.3%) | 58 (50.4%) |
| 75 Years and over | 84 (100.0%) | 46 (54.8%) |
| Total | 637 (40.9%) | 994 (63.8%) |
Disability Status by Sex by Age in Middletown
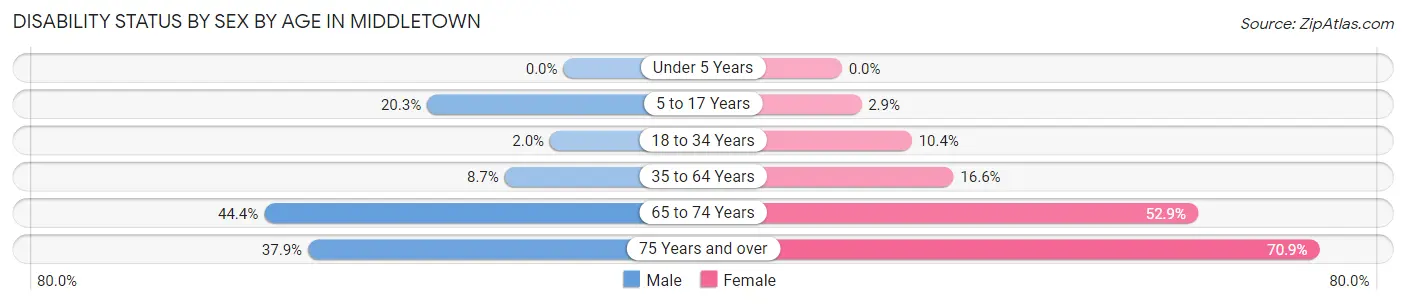
| Age Bracket | Male | Female |
| Under 5 Years | 0 (0.0%) | 0 (0.0%) |
| 5 to 17 Years | 16 (20.3%) | 4 (2.9%) |
| 18 to 34 Years | 3 (2.0%) | 19 (10.4%) |
| 35 to 64 Years | 28 (8.7%) | 59 (16.6%) |
| 65 to 74 Years | 20 (44.4%) | 37 (52.9%) |
| 75 Years and over | 11 (37.9%) | 39 (70.9%) |
Disability Class by Sex by Age in Middletown
Disability Class: Hearing Difficulty
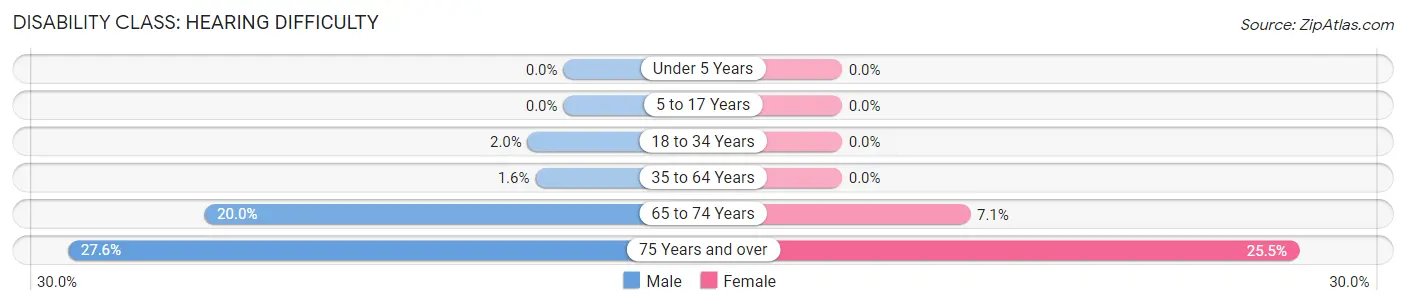
| Age Bracket | Male | Female |
| Under 5 Years | 0 (0.0%) | 0 (0.0%) |
| 5 to 17 Years | 0 (0.0%) | 0 (0.0%) |
| 18 to 34 Years | 3 (2.0%) | 0 (0.0%) |
| 35 to 64 Years | 5 (1.6%) | 0 (0.0%) |
| 65 to 74 Years | 9 (20.0%) | 5 (7.1%) |
| 75 Years and over | 8 (27.6%) | 14 (25.5%) |
Disability Class: Vision Difficulty
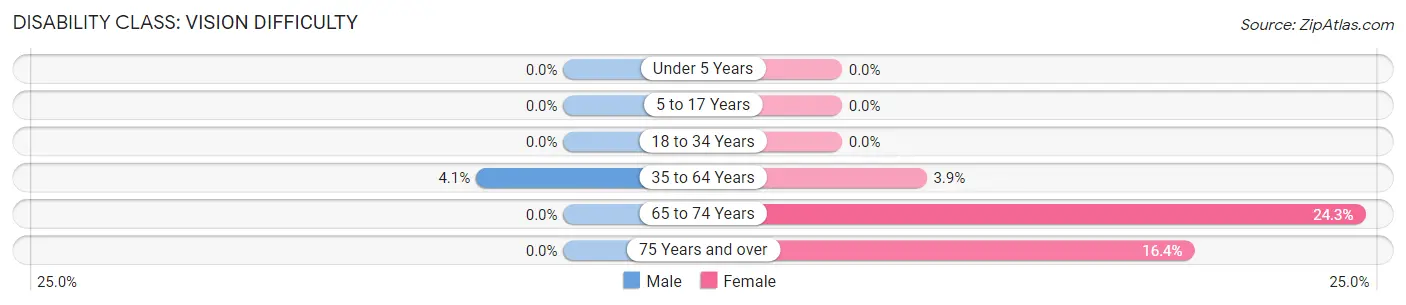
| Age Bracket | Male | Female |
| Under 5 Years | 0 (0.0%) | 0 (0.0%) |
| 5 to 17 Years | 0 (0.0%) | 0 (0.0%) |
| 18 to 34 Years | 0 (0.0%) | 0 (0.0%) |
| 35 to 64 Years | 13 (4.1%) | 14 (3.9%) |
| 65 to 74 Years | 0 (0.0%) | 17 (24.3%) |
| 75 Years and over | 0 (0.0%) | 9 (16.4%) |
Disability Class: Cognitive Difficulty

| Age Bracket | Male | Female |
| 5 to 17 Years | 14 (17.7%) | 4 (2.9%) |
| 18 to 34 Years | 3 (2.0%) | 16 (8.7%) |
| 35 to 64 Years | 10 (3.1%) | 14 (3.9%) |
| 65 to 74 Years | 3 (6.7%) | 4 (5.7%) |
| 75 Years and over | 0 (0.0%) | 34 (61.8%) |
Disability Class: Ambulatory Difficulty
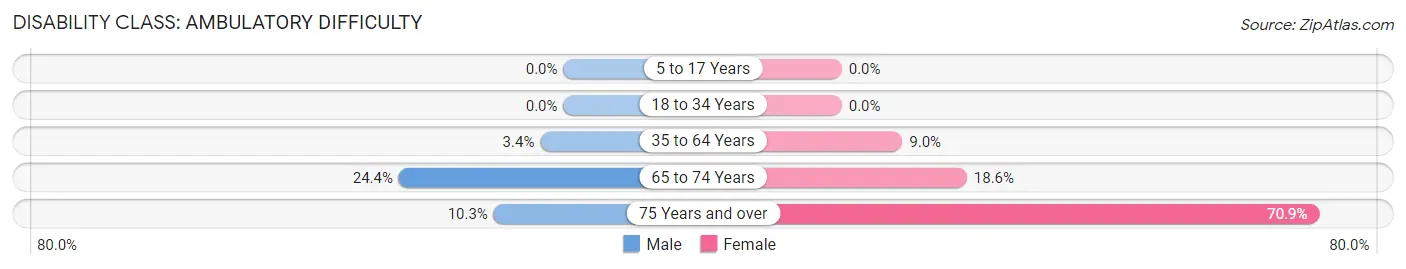
| Age Bracket | Male | Female |
| 5 to 17 Years | 0 (0.0%) | 0 (0.0%) |
| 18 to 34 Years | 0 (0.0%) | 0 (0.0%) |
| 35 to 64 Years | 11 (3.4%) | 32 (9.0%) |
| 65 to 74 Years | 11 (24.4%) | 13 (18.6%) |
| 75 Years and over | 3 (10.3%) | 39 (70.9%) |
Disability Class: Self-Care Difficulty
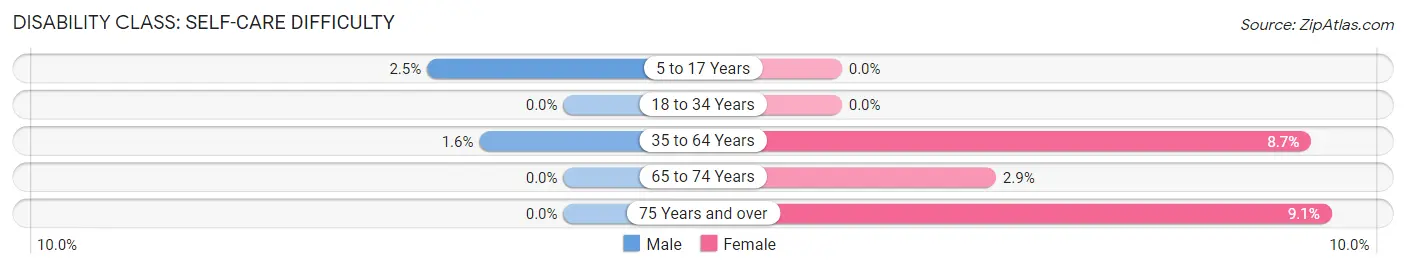
| Age Bracket | Male | Female |
| 5 to 17 Years | 2 (2.5%) | 0 (0.0%) |
| 18 to 34 Years | 0 (0.0%) | 0 (0.0%) |
| 35 to 64 Years | 5 (1.6%) | 31 (8.7%) |
| 65 to 74 Years | 0 (0.0%) | 2 (2.9%) |
| 75 Years and over | 0 (0.0%) | 5 (9.1%) |
Technology Access in Middletown
Computing Device Access in Middletown
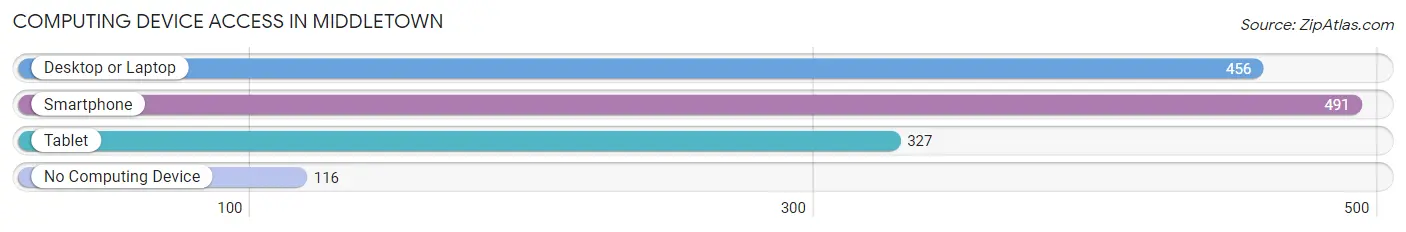
| Device Type | # Households | % Households |
| Desktop or Laptop | 456 | 71.5% |
| Smartphone | 491 | 77.0% |
| Tablet | 327 | 51.2% |
| No Computing Device | 116 | 18.2% |
| Total | 638 | 100.0% |
Internet Access in Middletown
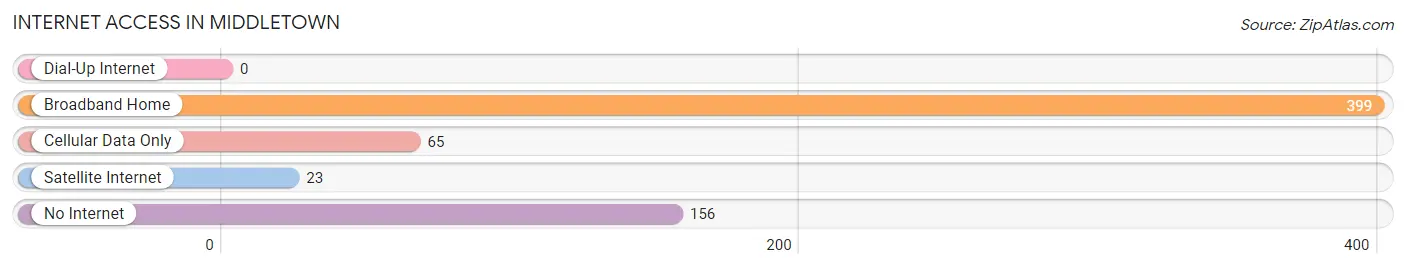
| Internet Type | # Households | % Households |
| Dial-Up Internet | 0 | 0.0% |
| Broadband Home | 399 | 62.5% |
| Cellular Data Only | 65 | 10.2% |
| Satellite Internet | 23 | 3.6% |
| No Internet | 156 | 24.4% |
| Total | 638 | 100.0% |
Middletown Summary
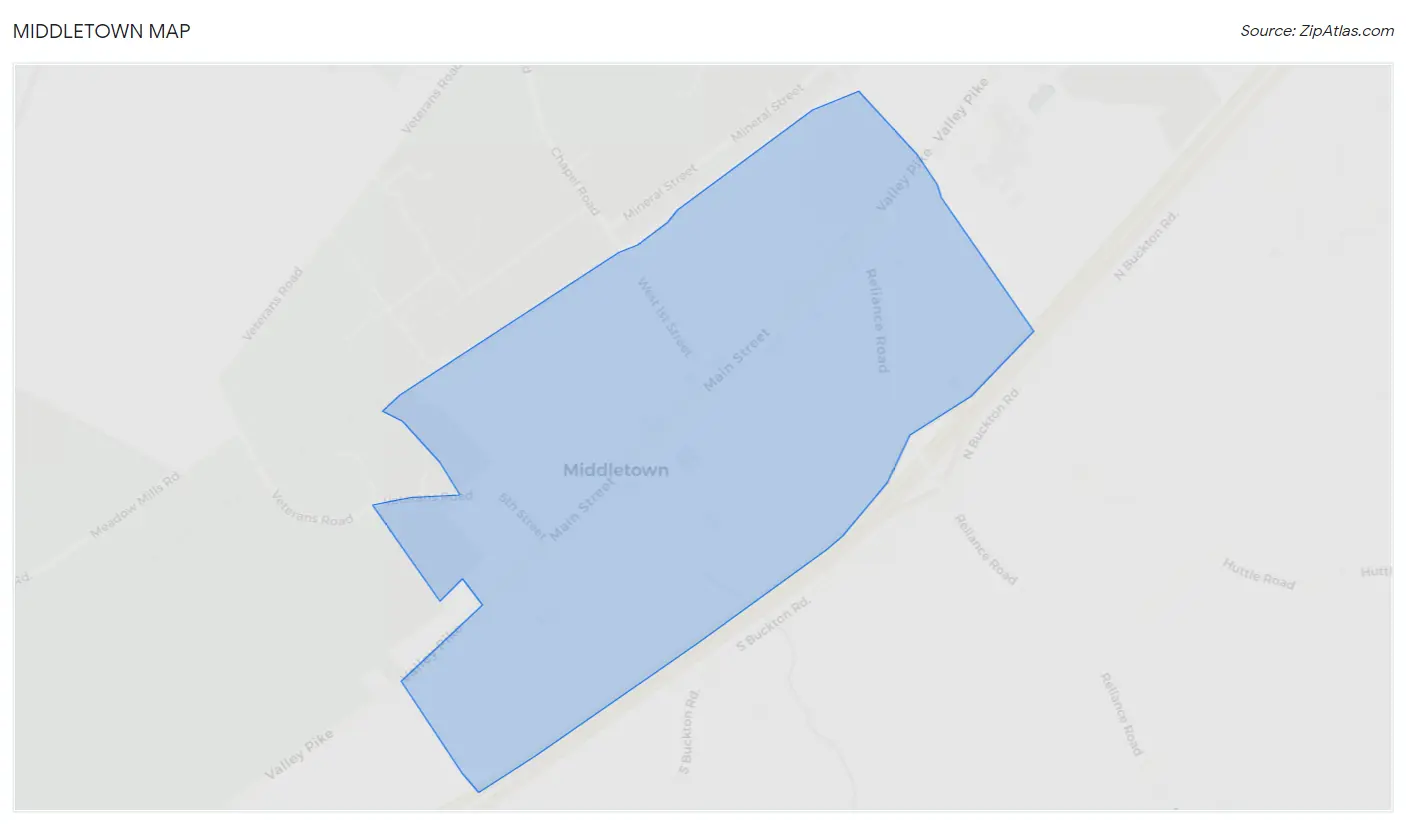
Middletown is a small town located in the Shenandoah Valley of Virginia, United States. It is situated in the northern part of Frederick County, approximately 10 miles south of Winchester and 70 miles west of Washington, D.C. The town is situated in the foothills of the Blue Ridge Mountains and is surrounded by rolling hills and farmland.
History
Middletown was first settled in 1750 by German immigrants who were attracted to the area by its fertile soil and abundant natural resources. The town was originally known as “Middle Town” due to its location between Winchester and Strasburg. The town was officially incorporated in 1810 and was named Middletown in 1817.
During the Civil War, Middletown was the site of several battles, including the Battle of Cedar Creek in October 1864. The town was also the site of a major Confederate victory in the Battle of New Market in May 1864.
Geography
Middletown is located in the northern part of Frederick County, Virginia. The town is situated in the foothills of the Blue Ridge Mountains and is surrounded by rolling hills and farmland. The town is located along the banks of the Shenandoah River and is approximately 10 miles south of Winchester and 70 miles west of Washington, D.C.
The climate in Middletown is characterized by hot, humid summers and cold, wet winters. The average annual temperature is around 54°F and the average annual precipitation is around 40 inches.
Economy
Middletown’s economy is largely based on agriculture and tourism. The town is home to several wineries, including the Middletown Winery, which produces award-winning wines. The town is also home to several small businesses, including antique stores, restaurants, and art galleries.
The town is also home to several large employers, including the Middletown Medical Center, which is a major employer in the area. The town is also home to several government agencies, including the U.S. Department of Agriculture and the U.S. Fish and Wildlife Service.
Demographics
As of the 2010 census, the population of Middletown was 4,319. The racial makeup of the town was 94.3% White, 2.2% African American, 0.3% Native American, 0.7% Asian, 0.1% Pacific Islander, and 2.4% from other races. The median household income was $50,945 and the median family income was $60,945.
Middletown is a small town with a rich history and a vibrant economy. The town is home to several wineries, small businesses, and large employers, making it an attractive place to live and work. The town is also home to a diverse population, making it a great place to explore and experience the culture of the Shenandoah Valley.
Common Questions
What is Per Capita Income in Middletown?
Per Capita income in Middletown is $30,996.
What is the Median Family Income in Middletown?
Median Family Income in Middletown is $64,018.
What is the Median Household income in Middletown?
Median Household Income in Middletown is $54,198.
What is Income or Wage Gap in Middletown?
Income or Wage Gap in Middletown is 24.1%.
Women in Middletown earn 75.9 cents for every dollar earned by a man.
What is Inequality or Gini Index in Middletown?
Inequality or Gini Index in Middletown is 0.42.
What is the Total Population of Middletown?
Total Population of Middletown is 1,558.
What is the Total Male Population of Middletown?
Total Male Population of Middletown is 692.
What is the Total Female Population of Middletown?
Total Female Population of Middletown is 866.
What is the Ratio of Males per 100 Females in Middletown?
There are 79.91 Males per 100 Females in Middletown.
What is the Ratio of Females per 100 Males in Middletown?
There are 125.14 Females per 100 Males in Middletown.
What is the Median Population Age in Middletown?
Median Population Age in Middletown is 39.5 Years.
What is the Average Family Size in Middletown
Average Family Size in Middletown is 2.9 People.
What is the Average Household Size in Middletown
Average Household Size in Middletown is 2.4 People.
How Large is the Labor Force in Middletown?
There are 882 People in the Labor Forcein in Middletown.
What is the Percentage of People in the Labor Force in Middletown?
68.4% of People are in the Labor Force in Middletown.