Zip Codes with the Highest Percentage of Population with a Degree in Visual and Performing Arts in Suffolk, VA
RELATED REPORTS & OPTIONS
Visual and Performing Arts
Suffolk
Compare Zip Codes
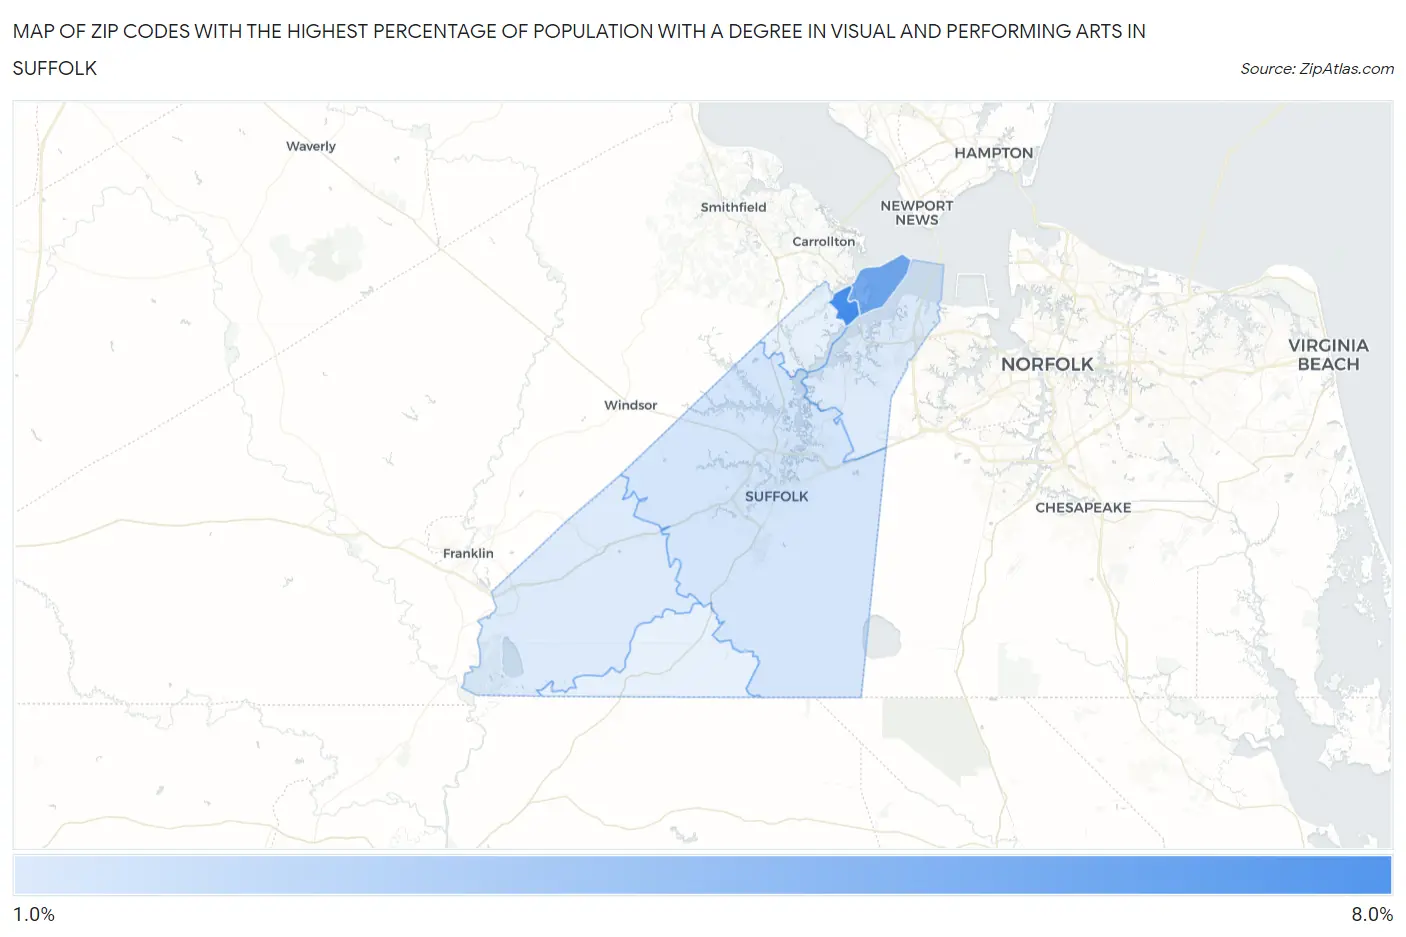
Map of Zip Codes with the Highest Percentage of Population with a Degree in Visual and Performing Arts in Suffolk
1.8%
6.2%
Zip Codes with the Highest Percentage of Population with a Degree in Visual and Performing Arts in Suffolk, VA
| Zip Code | % Graduates | vs State | vs National | |
| 1. | 23436 | 6.2% | 3.7%(+2.48)#119 | 4.3%(+1.95)#4,599 |
| 2. | 23433 | 4.8% | 3.7%(+1.04)#187 | 4.3%(+0.502)#7,183 |
| 3. | 23434 | 2.0% | 3.7%(-1.70)#463 | 4.3%(-2.24)#16,395 |
| 4. | 23435 | 1.8% | 3.7%(-1.93)#478 | 4.3%(-2.46)#17,174 |
| 5. | 23437 | 1.8% | 3.7%(-1.94)#479 | 4.3%(-2.47)#17,213 |
1
Common Questions
What are the Top 5 Zip Codes with the Highest Percentage of Population with a Degree in Visual and Performing Arts in Suffolk, VA?
Top 5 Zip Codes with the Highest Percentage of Population with a Degree in Visual and Performing Arts in Suffolk, VA are:
What zip code has the Highest Percentage of Population with a Degree in Visual and Performing Arts in Suffolk, VA?
23436 has the Highest Percentage of Population with a Degree in Visual and Performing Arts in Suffolk, VA with 6.2%.
What is the Percentage of Population with a Degree in Visual and Performing Arts in Suffolk, VA?
Percentage of Population with a Degree in Visual and Performing Arts in Suffolk is 2.0%.
What is the Percentage of Population with a Degree in Visual and Performing Arts in Virginia?
Percentage of Population with a Degree in Visual and Performing Arts in Virginia is 3.7%.
What is the Percentage of Population with a Degree in Visual and Performing Arts in the United States?
Percentage of Population with a Degree in Visual and Performing Arts in the United States is 4.3%.