Zip Codes with the Highest Percentage of Population with a Degree in Visual and Performing Arts in Chantilly, VA
RELATED REPORTS & OPTIONS
Visual and Performing Arts
Chantilly
Compare Zip Codes
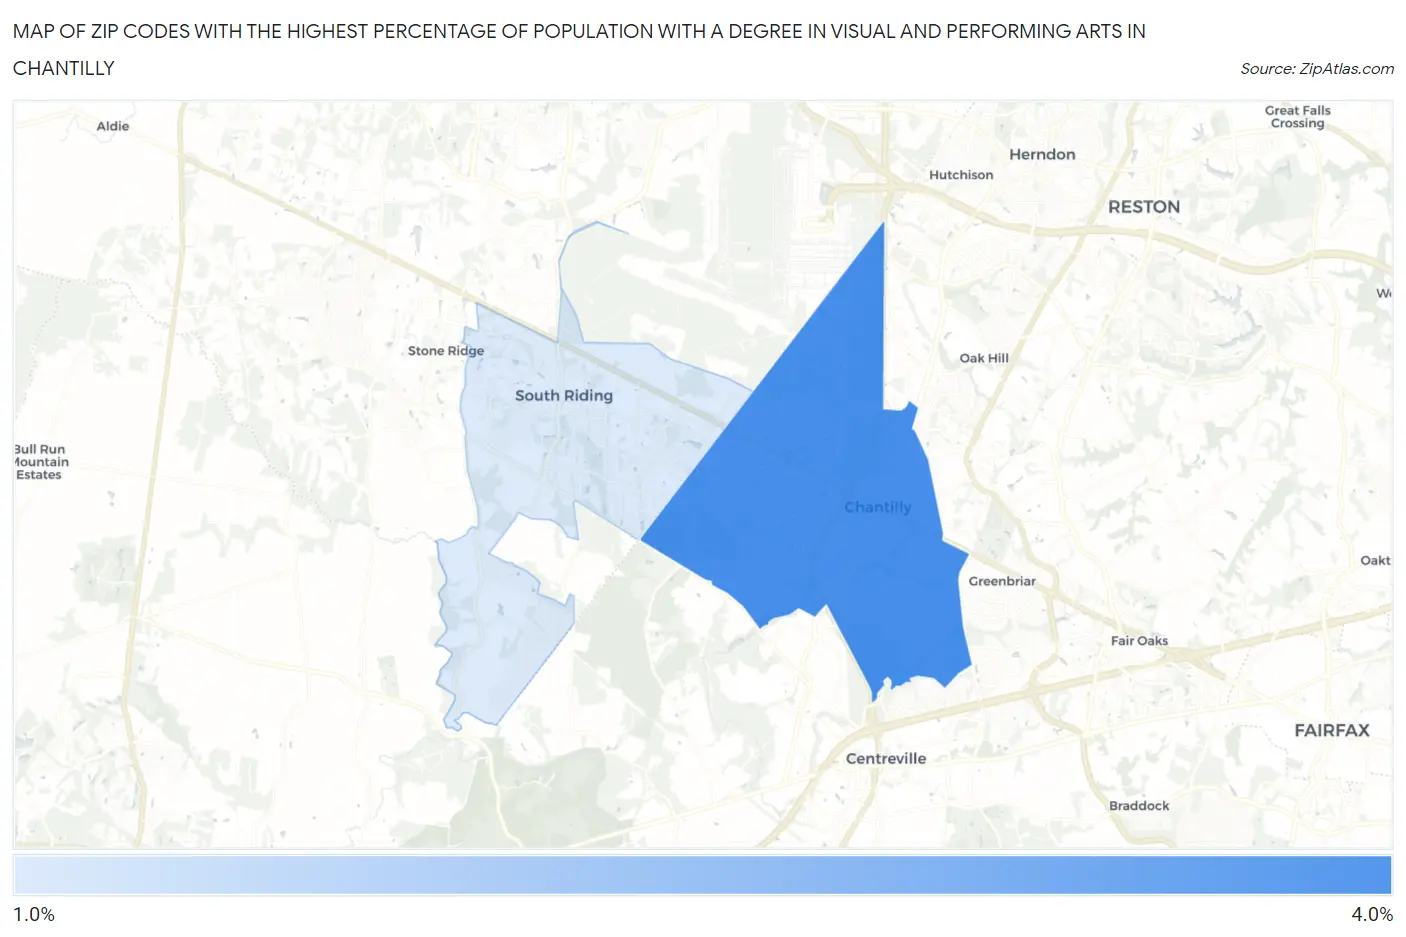
Map of Zip Codes with the Highest Percentage of Population with a Degree in Visual and Performing Arts in Chantilly
2.0%
3.6%
Zip Codes with the Highest Percentage of Population with a Degree in Visual and Performing Arts in Chantilly, VA
| Zip Code | % Graduates | vs State | vs National | |
| 1. | 20151 | 3.6% | 3.7%(-0.140)#276 | 4.3%(-0.675)#10,573 |
| 2. | 20152 | 2.0% | 3.7%(-1.75)#465 | 4.3%(-2.29)#16,561 |
1
Common Questions
What are the Top Zip Codes with the Highest Percentage of Population with a Degree in Visual and Performing Arts in Chantilly, VA?
Top Zip Codes with the Highest Percentage of Population with a Degree in Visual and Performing Arts in Chantilly, VA are:
What zip code has the Highest Percentage of Population with a Degree in Visual and Performing Arts in Chantilly, VA?
20151 has the Highest Percentage of Population with a Degree in Visual and Performing Arts in Chantilly, VA with 3.6%.
What is the Percentage of Population with a Degree in Visual and Performing Arts in Chantilly, VA?
Percentage of Population with a Degree in Visual and Performing Arts in Chantilly is 4.2%.
What is the Percentage of Population with a Degree in Visual and Performing Arts in Virginia?
Percentage of Population with a Degree in Visual and Performing Arts in Virginia is 3.7%.
What is the Percentage of Population with a Degree in Visual and Performing Arts in the United States?
Percentage of Population with a Degree in Visual and Performing Arts in the United States is 4.3%.