Zip Codes with the Highest Percentage of Population with a Degree in Visual and Performing Arts in Roanoke, VA
RELATED REPORTS & OPTIONS
Visual and Performing Arts
Roanoke
Compare Zip Codes
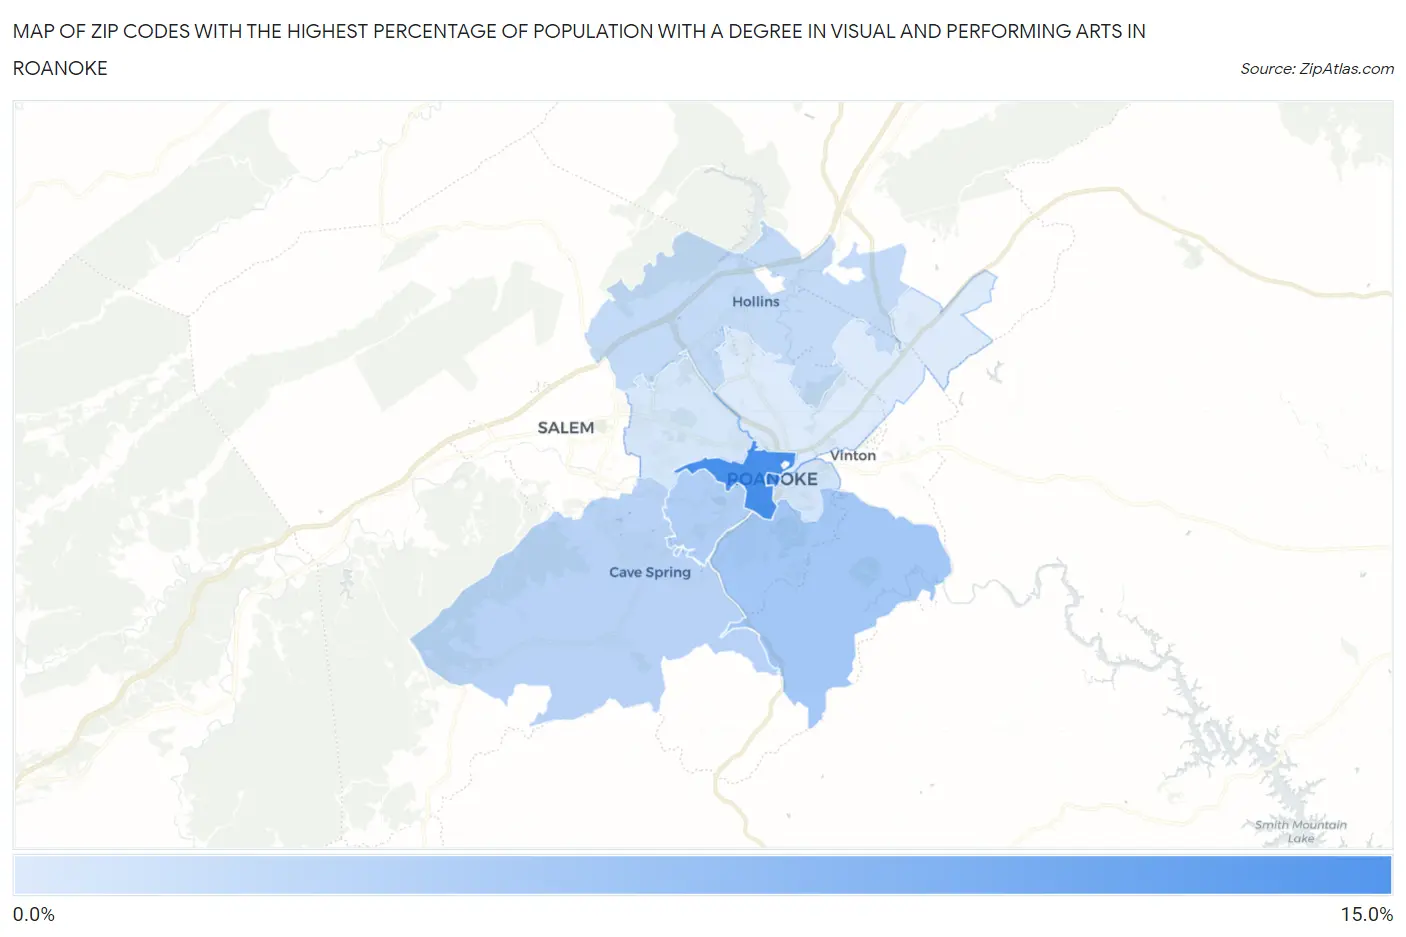
Map of Zip Codes with the Highest Percentage of Population with a Degree in Visual and Performing Arts in Roanoke
1.3%
12.8%
Zip Codes with the Highest Percentage of Population with a Degree in Visual and Performing Arts in Roanoke, VA
| Zip Code | % Graduates | vs State | vs National | |
| 1. | 24016 | 12.8% | 3.7%(+9.08)#40 | 4.3%(+8.54)#1,136 |
| 2. | 24011 | 11.3% | 3.7%(+7.55)#51 | 4.3%(+7.01)#1,450 |
| 3. | 24014 | 5.6% | 3.7%(+1.89)#143 | 4.3%(+1.35)#5,495 |
| 4. | 24015 | 4.5% | 3.7%(+0.803)#197 | 4.3%(+0.268)#7,760 |
| 5. | 24018 | 4.1% | 3.7%(+0.360)#232 | 4.3%(-0.176)#9,014 |
| 6. | 24019 | 3.1% | 3.7%(-0.606)#328 | 4.3%(-1.14)#12,308 |
| 7. | 24013 | 1.9% | 3.7%(-1.78)#467 | 4.3%(-2.32)#16,676 |
| 8. | 24017 | 1.8% | 3.7%(-1.92)#477 | 4.3%(-2.45)#17,152 |
| 9. | 24012 | 1.3% | 3.7%(-2.41)#510 | 4.3%(-2.94)#18,732 |
1
Common Questions
What are the Top 5 Zip Codes with the Highest Percentage of Population with a Degree in Visual and Performing Arts in Roanoke, VA?
Top 5 Zip Codes with the Highest Percentage of Population with a Degree in Visual and Performing Arts in Roanoke, VA are:
What zip code has the Highest Percentage of Population with a Degree in Visual and Performing Arts in Roanoke, VA?
24016 has the Highest Percentage of Population with a Degree in Visual and Performing Arts in Roanoke, VA with 12.8%.
What is the Percentage of Population with a Degree in Visual and Performing Arts in Roanoke, VA?
Percentage of Population with a Degree in Visual and Performing Arts in Roanoke is 4.8%.
What is the Percentage of Population with a Degree in Visual and Performing Arts in Virginia?
Percentage of Population with a Degree in Visual and Performing Arts in Virginia is 3.7%.
What is the Percentage of Population with a Degree in Visual and Performing Arts in the United States?
Percentage of Population with a Degree in Visual and Performing Arts in the United States is 4.3%.