Zip Codes with the Highest Percentage of Population with a Degree in Visual and Performing Arts in Manassas, VA
RELATED REPORTS & OPTIONS
Visual and Performing Arts
Manassas
Compare Zip Codes
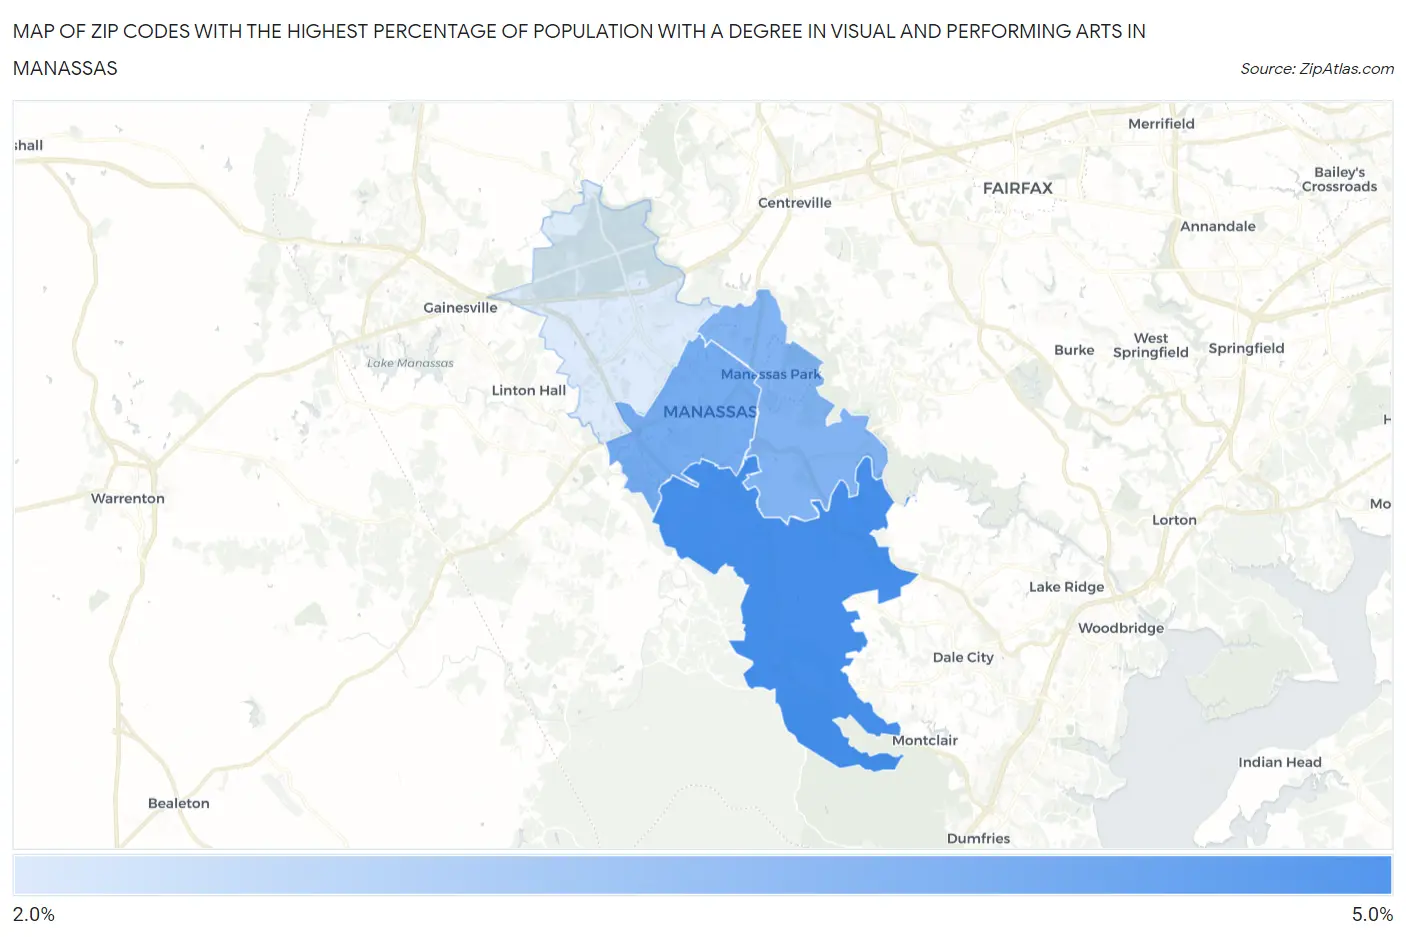
Map of Zip Codes with the Highest Percentage of Population with a Degree in Visual and Performing Arts in Manassas
2.0%
4.3%
Zip Codes with the Highest Percentage of Population with a Degree in Visual and Performing Arts in Manassas, VA
| Zip Code | % Graduates | vs State | vs National | |
| 1. | 20112 | 4.3% | 3.7%(+0.552)#217 | 4.3%(+0.017)#8,438 |
| 2. | 20110 | 3.6% | 3.7%(-0.152)#281 | 4.3%(-0.687)#10,635 |
| 3. | 20111 | 3.4% | 3.7%(-0.312)#301 | 4.3%(-0.848)#11,243 |
| 4. | 20109 | 2.0% | 3.7%(-1.67)#459 | 4.3%(-2.20)#16,271 |
1
Common Questions
What are the Top 3 Zip Codes with the Highest Percentage of Population with a Degree in Visual and Performing Arts in Manassas, VA?
Top 3 Zip Codes with the Highest Percentage of Population with a Degree in Visual and Performing Arts in Manassas, VA are:
What zip code has the Highest Percentage of Population with a Degree in Visual and Performing Arts in Manassas, VA?
20112 has the Highest Percentage of Population with a Degree in Visual and Performing Arts in Manassas, VA with 4.3%.
What is the Percentage of Population with a Degree in Visual and Performing Arts in Manassas, VA?
Percentage of Population with a Degree in Visual and Performing Arts in Manassas is 4.1%.
What is the Percentage of Population with a Degree in Visual and Performing Arts in Virginia?
Percentage of Population with a Degree in Visual and Performing Arts in Virginia is 3.7%.
What is the Percentage of Population with a Degree in Visual and Performing Arts in the United States?
Percentage of Population with a Degree in Visual and Performing Arts in the United States is 4.3%.