Zip Codes with the Highest Percentage of Population with a Degree in Visual and Performing Arts in Richmond, VA

RELATED REPORTS & OPTIONS

Visual and Performing Arts
Population
Families and Households
Female Fertility
Female Fertility (Unmarried)
Race (Community Size)
Race (Percentage)
Ancestry (Community Size)
AfghanAfricanAlaskan AthabascanAmericanArabArgentineanArmenianAustralianAustrianBarbadianBelgianBelizeanBhutaneseBlackfeetBolivianBrazilianBritishBritish West IndianBulgarianBurmeseCajunCambodianCanadianCelticCentral AmericanCentral American IndianCherokeeChileanChoctawColombianCosta RicanCroatianCubanCzechCzechoslovakianDanishDominicanDutchEastern EuropeanEcuadorianEgyptianEnglishEstonianEthiopianEuropeanFilipinoFinnishFrenchFrench American IndianFrench CanadianGermanGhanaianGreekGuamanian / ChamorroGuatemalanGuyaneseHaitianHonduranHungarianIcelanderIndian (Asian)InupiatIranianIraqiIrishIroquoisIsraeliItalianJamaicanJapaneseJordanianKoreanLatvianLebaneseLithuanianLumbeeMalaysianMexicanMoroccanNative HawaiianNavajoNew ZealanderNicaraguanNigerianNorthern EuropeanNorwegianPakistaniPalestinianPanamanianParaguayanPennsylvania GermanPeruvianPolishPortuguesePuerto RicanRomanianRussianSalvadoranSamoanScandinavianScotch-IrishScottishSerbianSierra LeoneanSiouxSlavicSlovakSloveneSomaliSouth AfricanSouth AmericanSouth American IndianSpaniardSpanishSri LankanSubsaharan AfricanSudaneseSwedishSwissSyrianThaiTrinidadian and TobagonianTurkishUgandanUkrainianUruguayanVenezuelanWelshWest IndianYaquiYugoslavian
Ancestry (Percentage)
AfghanAfricanAlaskan AthabascanAmericanArabArgentineanArmenianAustralianAustrianBarbadianBelgianBelizeanBhutaneseBlackfeetBolivianBrazilianBritishBritish West IndianBulgarianBurmeseCajunCambodianCanadianCelticCentral AmericanCentral American IndianCherokeeChileanChoctawColombianCosta RicanCroatianCubanCzechCzechoslovakianDanishDominicanDutchEastern EuropeanEcuadorianEgyptianEnglishEstonianEthiopianEuropeanFilipinoFinnishFrenchFrench American IndianFrench CanadianGermanGhanaianGreekGuamanian / ChamorroGuatemalanGuyaneseHaitianHonduranHungarianIcelanderIndian (Asian)InupiatIranianIraqiIrishIroquoisIsraeliItalianJamaicanJapaneseJordanianKoreanLatvianLebaneseLithuanianLumbeeMalaysianMexicanMoroccanNative HawaiianNavajoNew ZealanderNicaraguanNigerianNorthern EuropeanNorwegianPakistaniPalestinianPanamanianParaguayanPennsylvania GermanPeruvianPolishPortuguesePuerto RicanRomanianRussianSalvadoranSamoanScandinavianScotch-IrishScottishSerbianSierra LeoneanSiouxSlavicSlovakSloveneSomaliSouth AfricanSouth AmericanSouth American IndianSpaniardSpanishSri LankanSubsaharan AfricanSudaneseSwedishSwissSyrianThaiTrinidadian and TobagonianTurkishUgandanUkrainianUruguayanVenezuelanWelshWest IndianYaquiYugoslavian
Immigrant Origin (Total)
AfghanistanAfricaArgentinaArmeniaAsiaAustraliaAustriaBangladeshBarbadosBelgiumBoliviaBosnia and HerzegovinaBrazilBurma / MyanmarCambodiaCameroonCanadaCaribbeanCentral AmericaChileChinaColombiaCongoCosta RicaCubaDominicaDominican RepublicEastern AfricaEastern AsiaEastern EuropeEcuadorEgyptEl SalvadorEnglandEritreaEthiopiaEuropeFranceGermanyGhanaGreeceGuatemalaGuyanaHaitiHondurasHong KongHungaryIndiaIranIraqIrelandIsraelItalyJamaicaJapanJordanKenyaKoreaKuwaitLaosLatin AmericaLebanonLiberiaLithuaniaMalaysiaMexicoMiddle AfricaMoldovaNepalNetherlandsNicaraguaNigeriaNorthern AfricaNorthern EuropeOceaniaPakistanPanamaPeruPhilippinesPolandRomaniaRussiaSaudi ArabiaSierra LeoneSingaporeSouth AfricaSouth AmericaSouth Central AsiaSouth Eastern AsiaSouthern EuropeSpainSt. Vincent and the GrenadinesSudanSwedenTaiwanThailandTrinidad and TobagoTurkeyUkraineVenezuelaVietnamWest IndiesWestern AfricaWestern AsiaWestern EuropeYemenZaireZimbabwe
Immigrant Origin (Percentage)
AfghanistanAfricaArgentinaArmeniaAsiaAustraliaAustriaBangladeshBarbadosBelgiumBoliviaBosnia and HerzegovinaBrazilBurma / MyanmarCambodiaCameroonCanadaCaribbeanCentral AmericaChileChinaColombiaCongoCosta RicaCubaDominicaDominican RepublicEastern AfricaEastern AsiaEastern EuropeEcuadorEgyptEl SalvadorEnglandEritreaEthiopiaEuropeFranceGermanyGhanaGreeceGuatemalaGuyanaHaitiHondurasHong KongHungaryIndiaIranIraqIrelandIsraelItalyJamaicaJapanJordanKenyaKoreaKuwaitLaosLatin AmericaLebanonLiberiaLithuaniaMalaysiaMexicoMiddle AfricaMoldovaNepalNetherlandsNicaraguaNigeriaNorthern AfricaNorthern EuropeOceaniaPakistanPanamaPeruPhilippinesPolandRomaniaRussiaSaudi ArabiaSierra LeoneSingaporeSouth AfricaSouth AmericaSouth Central AsiaSouth Eastern AsiaSouthern EuropeSpainSt. Vincent and the GrenadinesSudanSwedenTaiwanThailandTrinidad and TobagoTurkeyUkraineVenezuelaVietnamWest IndiesWestern AfricaWestern AsiaWestern EuropeYemenZaireZimbabwe
Income
Income (Families)
Income (Households)
Poverty
Poverty (Families)
Unemployment
Employment Occupations
Employment Industries
Employer Class
Commute Time
Commute Means
School Enrollment
Education by Degree Field
Occupancy
Finances
Physical Characteristics
Richmond
Compare Zip Codes
Comparison Subject

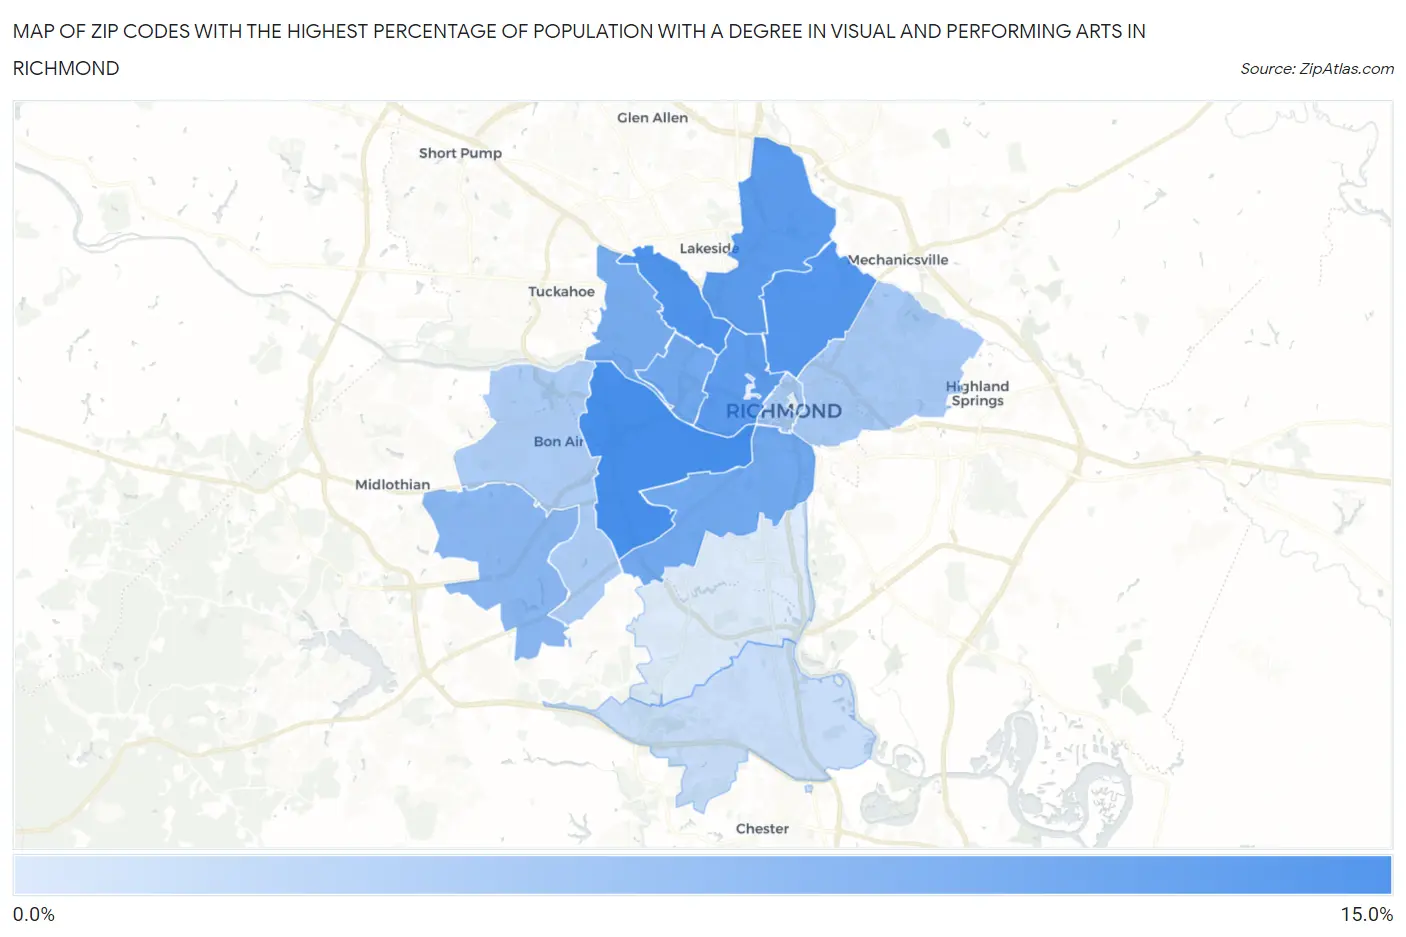
Map of Zip Codes with the Highest Percentage of Population with a Degree in Visual and Performing Arts in Richmond

0.0%
15.0%
Zip Codes with the Highest Percentage of Population with a Degree in Visual and Performing Arts in Richmond Map

Zip Codes with the Highest Percentage of Population with a Degree in Visual and Performing Arts in Richmond, VA

Zip Code % Graduates vs State vs National
1.2322510.1%3.7%(+6.39)#584.3%(+5.85)#1,788
2.232309.8%3.7%(+6.08)#614.3%(+5.54)#1,911
3.232229.3%3.7%(+5.61)#644.3%(+5.07)#2,094
4.232279.1%3.7%(+5.39)#694.3%(+4.85)#2,205
5.232208.9%3.7%(+5.20)#724.3%(+4.66)#2,299
6.232247.8%3.7%(+4.12)#834.3%(+3.58)#2,962
7.232217.8%3.7%(+4.10)#854.3%(+3.56)#2,978
8.232267.6%3.7%(+3.90)#904.3%(+3.36)#3,132
9.232366.7%3.7%(+2.95)#1104.3%(+2.41)#4,047
10.232235.3%3.7%(+1.58)#1574.3%(+1.04)#6,059
11.232195.3%3.7%(+1.56)#1584.3%(+1.03)#6,092
12.232355.0%3.7%(+1.27)#1714.3%(+0.733)#6,685
13.232373.6%3.7%(-0.152)#2804.3%(-0.687)#10,634
14.232342.6%3.7%(-1.15)#4014.3%(-1.68)#14,368

Common Questions

What are the Top 10 Zip Codes with the Highest Percentage of Population with a Degree in Visual and Performing Arts in Richmond, VA?
Top 10 Zip Codes with the Highest Percentage of Population with a Degree in Visual and Performing Arts in Richmond, VA are:
#1
10.1%
#2
9.8%
#3
9.3%
#4
9.1%
#5
8.9%
#6
7.8%
#7
7.8%
#8
7.6%
#9
6.7%
#10
5.3%
What zip code has the Highest Percentage of Population with a Degree in Visual and Performing Arts in Richmond, VA?
23225 has the Highest Percentage of Population with a Degree in Visual and Performing Arts in Richmond, VA with 10.1%.
What is the Percentage of Population with a Degree in Visual and Performing Arts in Richmond, VA?
Percentage of Population with a Degree in Visual and Performing Arts in Richmond is 8.4%.
What is the Percentage of Population with a Degree in Visual and Performing Arts in Virginia?
Percentage of Population with a Degree in Visual and Performing Arts in Virginia is 3.7%.
What is the Percentage of Population with a Degree in Visual and Performing Arts in the United States?
Percentage of Population with a Degree in Visual and Performing Arts in the United States is 4.3%.