Lovingston, VA Map & Demographics
Lovingston Map
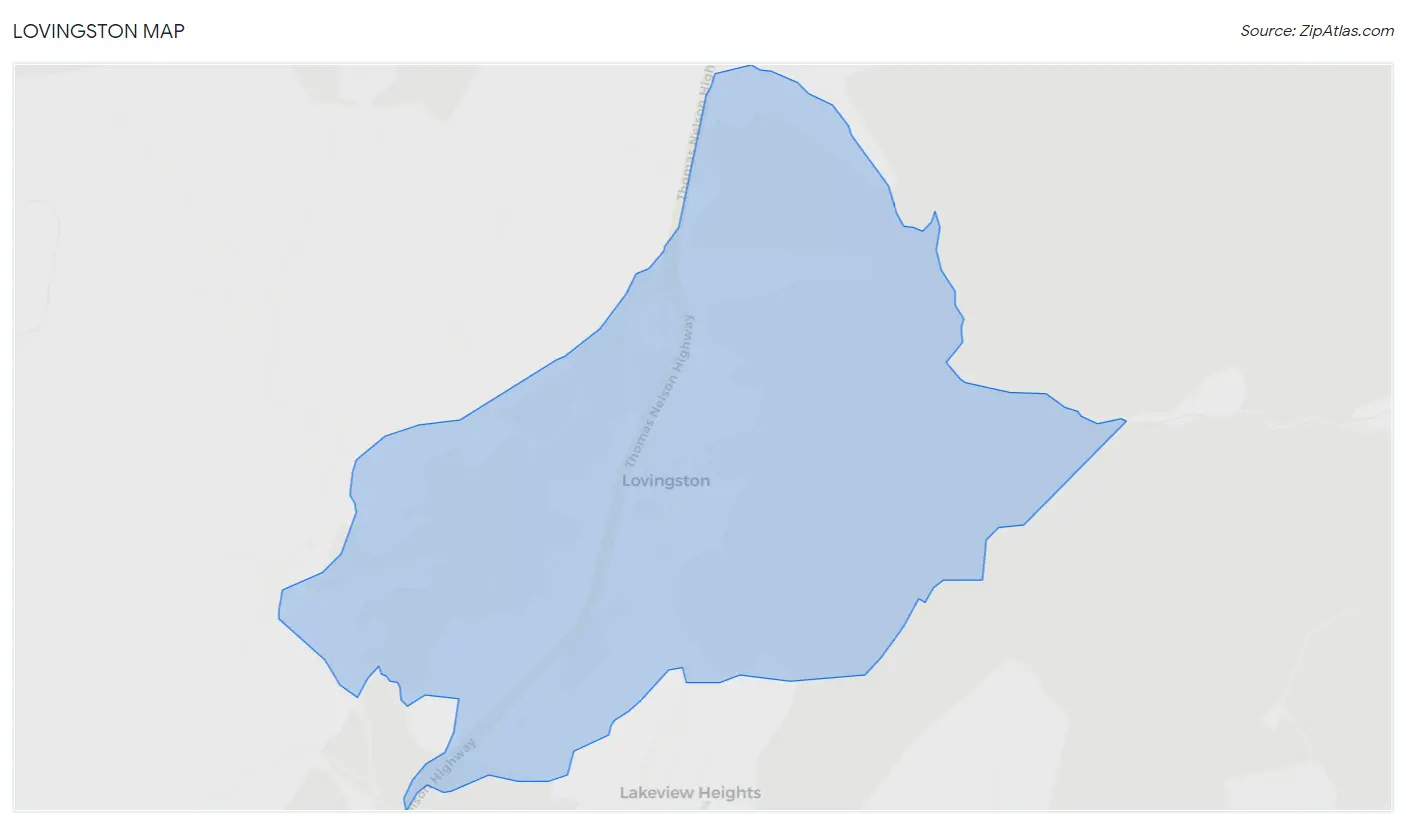
Lovingston Overview
$32,424
PER CAPITA INCOME
0.56
INEQUALITY / GINI INDEX
382
TOTAL POPULATION
144
MALE POPULATION
238
FEMALE POPULATION
60.50
MALES / 100 FEMALES
165.28
FEMALES / 100 MALES
58.2
MEDIAN AGE
1.8
AVG FAMILY SIZE
1.3
AVG HOUSEHOLD SIZE
153
LABOR FORCE [ PEOPLE ]
40.1%
PERCENT IN LABOR FORCE
Lovingston Zip Codes
Lovingston Area Codes
Income in Lovingston
Income Overview in Lovingston
| Characteristic | Number | Measure |
| Per Capita Income | 382 | $32,424 |
| Median Family Income | 76 | $0 |
| Mean Family Income | 76 | $0 |
| Median Household Income | 261 | $0 |
| Mean Household Income | 261 | $48,933 |
| Income Deficit | 76 | $0 |
| Wage / Income Gap (%) | 382 | 0.00% |
| Wage / Income Gap ($) | 382 | 100.00¢ per $1 |
| Gini / Inequality Index | 382 | 0.56 |
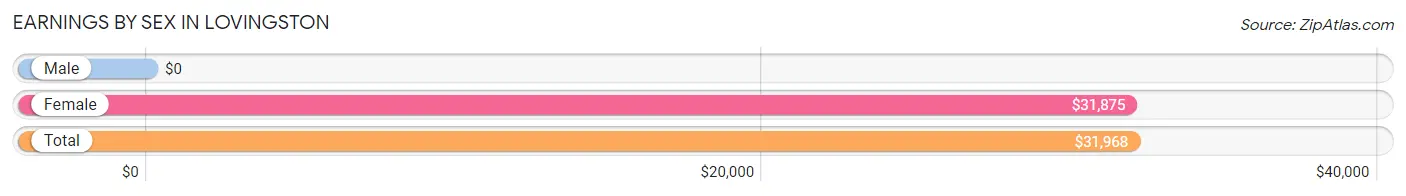
Earnings by Sex in Lovingston
| Sex | Number | Average Earnings |
| Male | 38 (24.8%) | $0 |
| Female | 115 (75.2%) | $31,875 |
| Total | 153 (100.0%) | $31,968 |
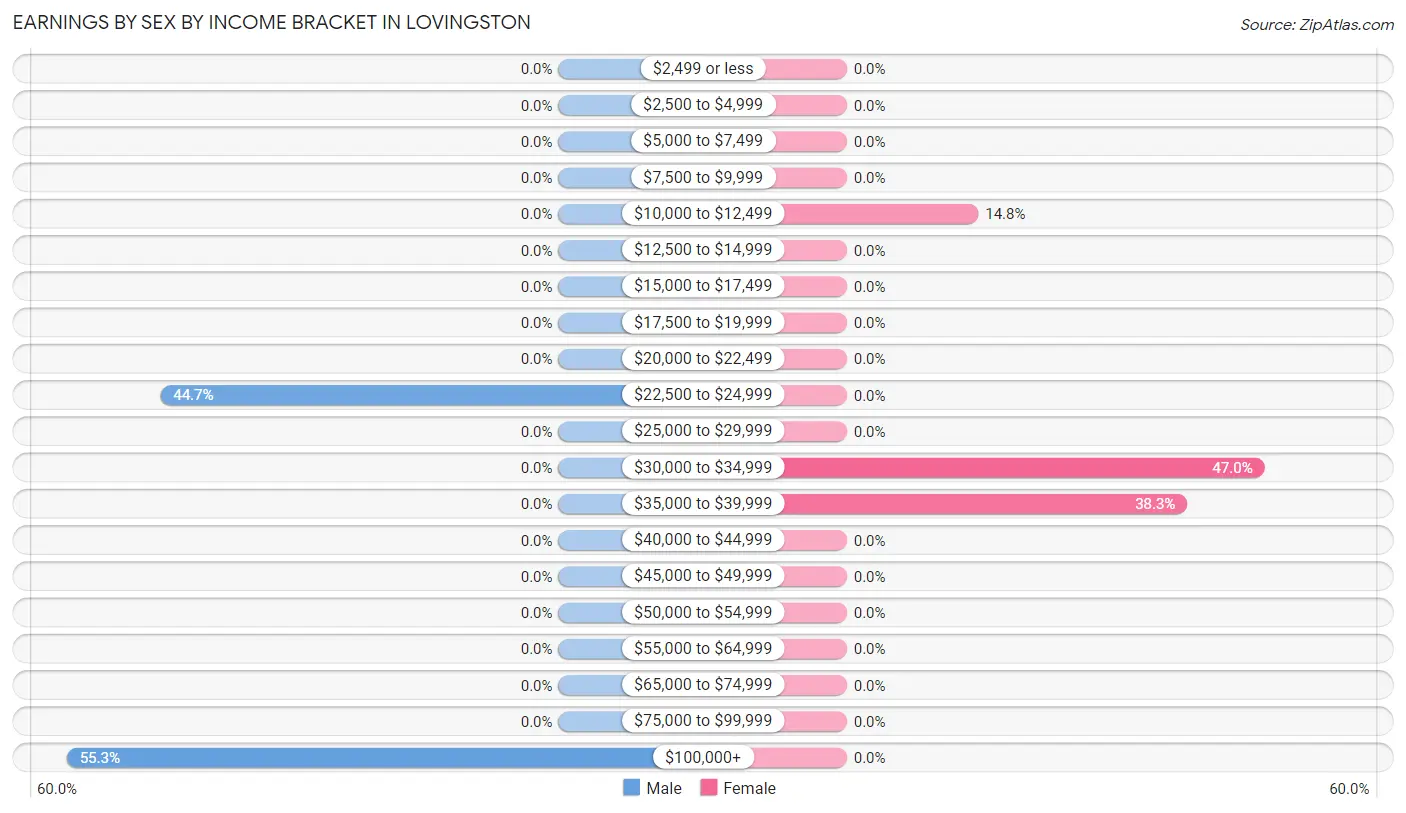
Earnings by Sex by Income Bracket in Lovingston
The most common earnings brackets in Lovingston are $100,000+ for men (21 | 55.3%) and $30,000 to $34,999 for women (54 | 47.0%).
| Income | Male | Female |
| $2,499 or less | 0 (0.0%) | 0 (0.0%) |
| $2,500 to $4,999 | 0 (0.0%) | 0 (0.0%) |
| $5,000 to $7,499 | 0 (0.0%) | 0 (0.0%) |
| $7,500 to $9,999 | 0 (0.0%) | 0 (0.0%) |
| $10,000 to $12,499 | 0 (0.0%) | 17 (14.8%) |
| $12,500 to $14,999 | 0 (0.0%) | 0 (0.0%) |
| $15,000 to $17,499 | 0 (0.0%) | 0 (0.0%) |
| $17,500 to $19,999 | 0 (0.0%) | 0 (0.0%) |
| $20,000 to $22,499 | 0 (0.0%) | 0 (0.0%) |
| $22,500 to $24,999 | 17 (44.7%) | 0 (0.0%) |
| $25,000 to $29,999 | 0 (0.0%) | 0 (0.0%) |
| $30,000 to $34,999 | 0 (0.0%) | 54 (47.0%) |
| $35,000 to $39,999 | 0 (0.0%) | 44 (38.3%) |
| $40,000 to $44,999 | 0 (0.0%) | 0 (0.0%) |
| $45,000 to $49,999 | 0 (0.0%) | 0 (0.0%) |
| $50,000 to $54,999 | 0 (0.0%) | 0 (0.0%) |
| $55,000 to $64,999 | 0 (0.0%) | 0 (0.0%) |
| $65,000 to $74,999 | 0 (0.0%) | 0 (0.0%) |
| $75,000 to $99,999 | 0 (0.0%) | 0 (0.0%) |
| $100,000+ | 21 (55.3%) | 0 (0.0%) |
| Total | 38 (100.0%) | 115 (100.0%) |
Earnings by Sex by Educational Attainment in Lovingston
| Educational Attainment | Male Income | Female Income |
| Less than High School | - | - |
| High School Diploma | - | - |
| College or Associate's Degree | - | - |
| Bachelor's Degree | - | - |
| Graduate Degree | - | - |
| Total | - | - |
Family Income in Lovingston
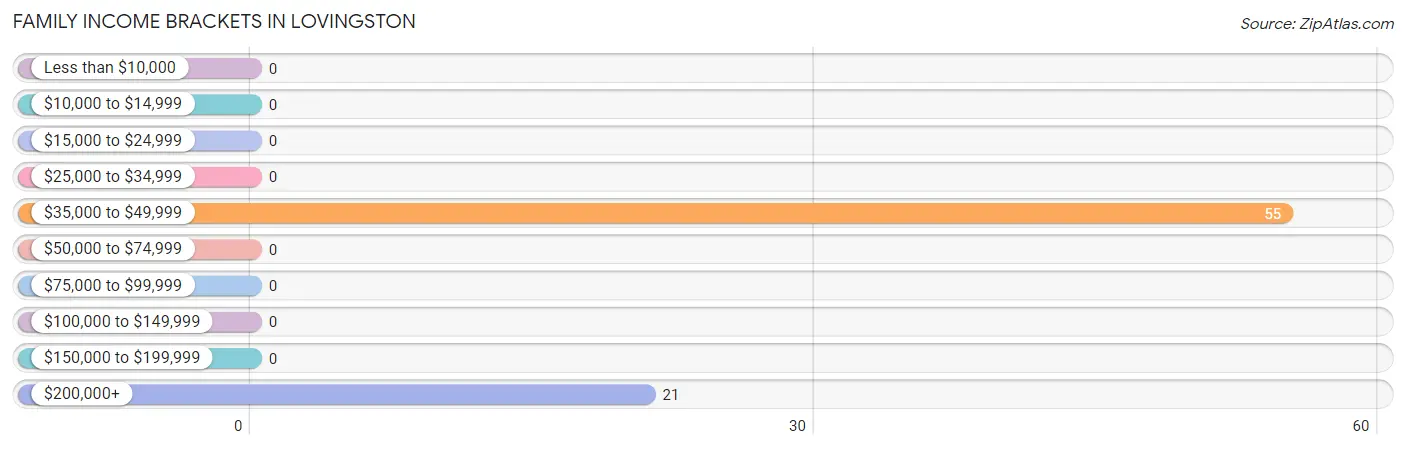
Family Income Brackets in Lovingston
According to the Lovingston family income data, there are 55 families falling into the $35,000 to $49,999 income range, which is the most common income bracket and makes up 72.4% of all families.
| Income Bracket | # Families | % Families |
| Less than $10,000 | 0 | 0.0% |
| $10,000 to $14,999 | 0 | 0.0% |
| $15,000 to $24,999 | 0 | 0.0% |
| $25,000 to $34,999 | 0 | 0.0% |
| $35,000 to $49,999 | 55 | 72.4% |
| $50,000 to $74,999 | 0 | 0.0% |
| $75,000 to $99,999 | 0 | 0.0% |
| $100,000 to $149,999 | 0 | 0.0% |
| $150,000 to $199,999 | 0 | 0.0% |
| $200,000+ | 21 | 27.6% |
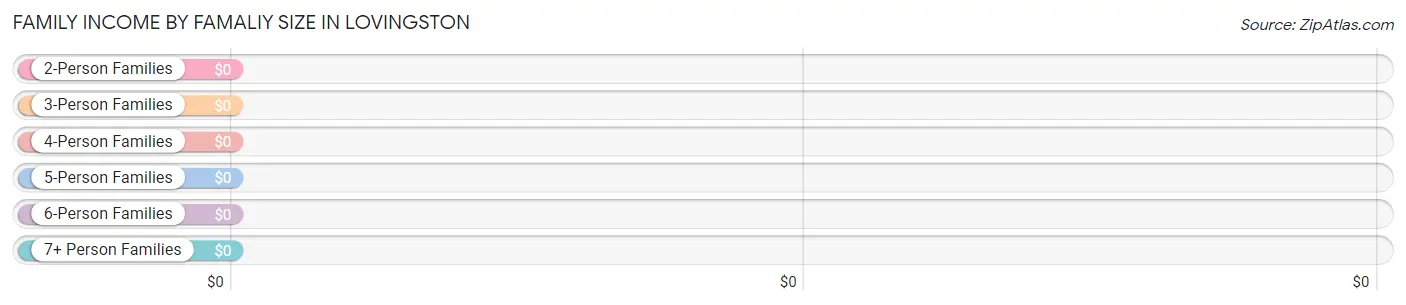
Family Income by Famaliy Size in Lovingston
| Income Bracket | # Families | Median Income |
| 2-Person Families | 76 (100.0%) | $0 |
| 3-Person Families | 0 (0.0%) | $0 |
| 4-Person Families | 0 (0.0%) | $0 |
| 5-Person Families | 0 (0.0%) | $0 |
| 6-Person Families | 0 (0.0%) | $0 |
| 7+ Person Families | 0 (0.0%) | $0 |
| Total | 76 (100.0%) | $0 |
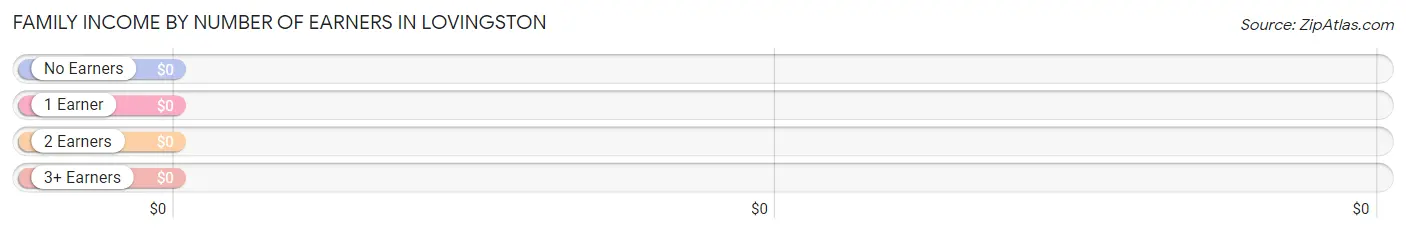
Family Income by Number of Earners in Lovingston
| Number of Earners | # Families | Median Income |
| No Earners | 0 (0.0%) | $0 |
| 1 Earner | 55 (72.4%) | $0 |
| 2 Earners | 21 (27.6%) | $0 |
| 3+ Earners | 0 (0.0%) | $0 |
| Total | 76 (100.0%) | $0 |
Household Income in Lovingston
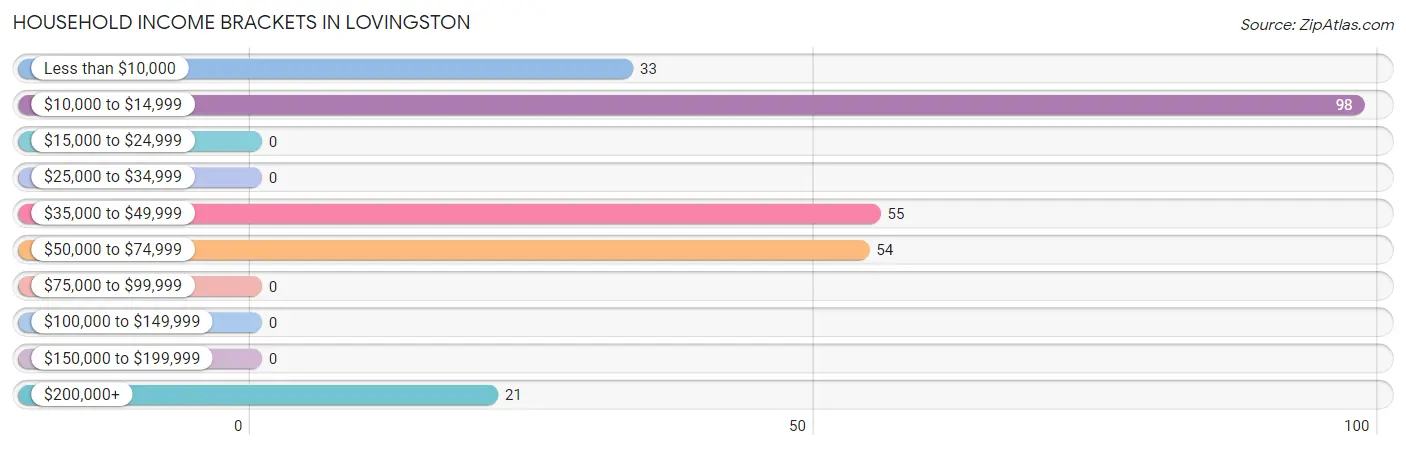
Household Income Brackets in Lovingston
With 98 households falling in the category, the $10,000 to $14,999 income range is the most frequent in Lovingston, accounting for 37.6% of all households.
| Income Bracket | # Households | % Households |
| Less than $10,000 | 33 | 12.6% |
| $10,000 to $14,999 | 98 | 37.5% |
| $15,000 to $24,999 | 0 | 0.0% |
| $25,000 to $34,999 | 0 | 0.0% |
| $35,000 to $49,999 | 55 | 21.1% |
| $50,000 to $74,999 | 54 | 20.7% |
| $75,000 to $99,999 | 0 | 0.0% |
| $100,000 to $149,999 | 0 | 0.0% |
| $150,000 to $199,999 | 0 | 0.0% |
| $200,000+ | 21 | 8.0% |
Household Income by Householder Age in Lovingston
| Income Bracket | # Households | Median Income |
| 15 to 24 Years | 0 (0.0%) | $0 |
| 25 to 44 Years | 54 (20.7%) | $0 |
| 45 to 64 Years | 207 (79.3%) | $0 |
| 65+ Years | 0 (0.0%) | $0 |
| Total | 261 (100.0%) | $0 |
Poverty in Lovingston
Income Below Poverty by Sex and Age in Lovingston
With 27.3% poverty level for males and 46.0% for females among the residents of Lovingston, 45 to 54 year old males and 55 to 64 year old females are the most vulnerable to poverty, with 35 males (100.0%) and 98 females (61.6%) in their respective age groups living below the poverty level.
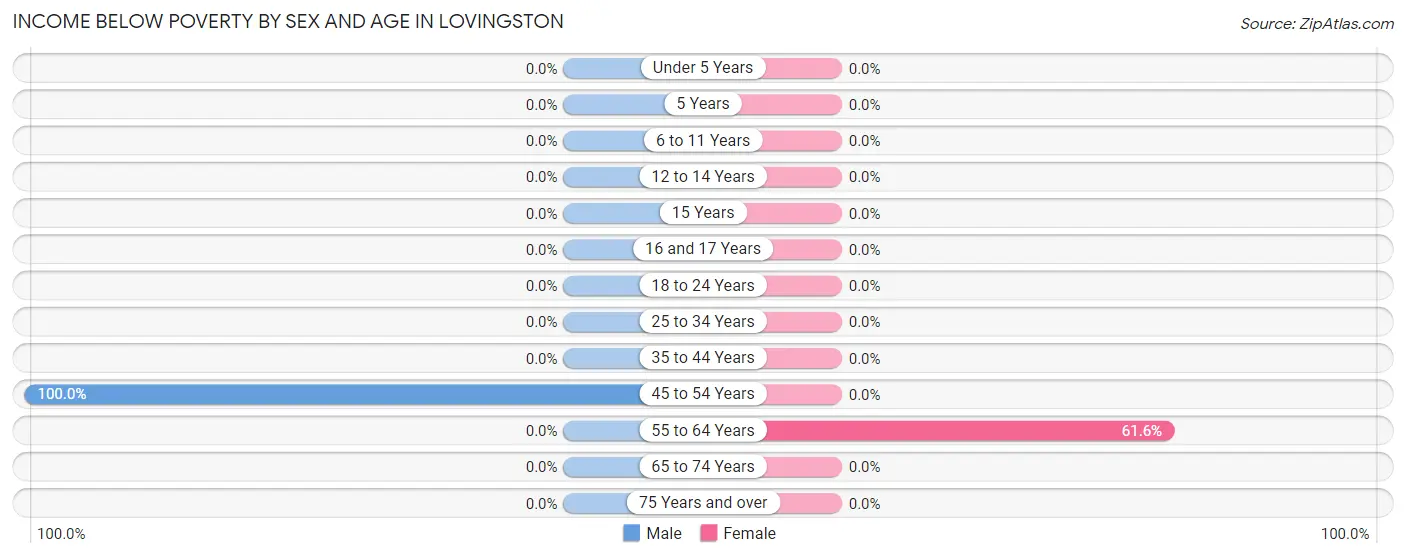
| Age Bracket | Male | Female |
| Under 5 Years | 0 (0.0%) | 0 (0.0%) |
| 5 Years | 0 (0.0%) | 0 (0.0%) |
| 6 to 11 Years | 0 (0.0%) | 0 (0.0%) |
| 12 to 14 Years | 0 (0.0%) | 0 (0.0%) |
| 15 Years | 0 (0.0%) | 0 (0.0%) |
| 16 and 17 Years | 0 (0.0%) | 0 (0.0%) |
| 18 to 24 Years | 0 (0.0%) | 0 (0.0%) |
| 25 to 34 Years | 0 (0.0%) | 0 (0.0%) |
| 35 to 44 Years | 0 (0.0%) | 0 (0.0%) |
| 45 to 54 Years | 35 (100.0%) | 0 (0.0%) |
| 55 to 64 Years | 0 (0.0%) | 98 (61.6%) |
| 65 to 74 Years | 0 (0.0%) | 0 (0.0%) |
| 75 Years and over | 0 (0.0%) | 0 (0.0%) |
| Total | 35 (27.3%) | 98 (46.0%) |
Income Above Poverty by Sex and Age in Lovingston
According to the poverty statistics in Lovingston, males aged 25 to 34 years and females aged 25 to 34 years are the age groups that are most secure financially, with 100.0% of males and 100.0% of females in these age groups living above the poverty line.
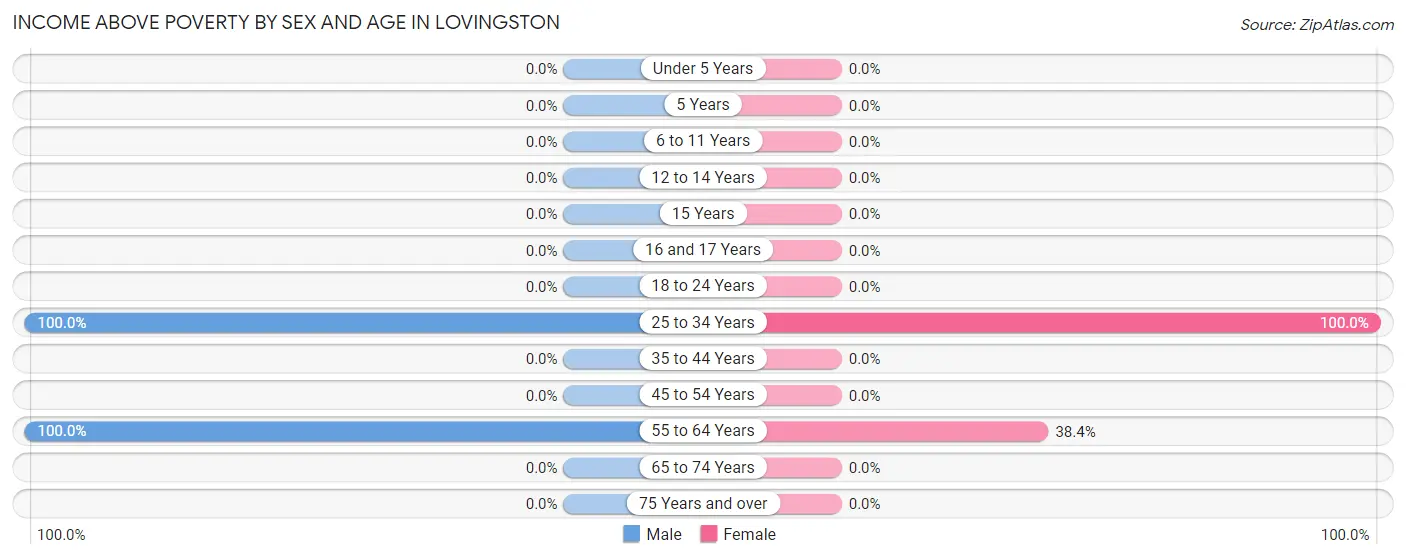
| Age Bracket | Male | Female |
| Under 5 Years | 0 (0.0%) | 0 (0.0%) |
| 5 Years | 0 (0.0%) | 0 (0.0%) |
| 6 to 11 Years | 0 (0.0%) | 0 (0.0%) |
| 12 to 14 Years | 0 (0.0%) | 0 (0.0%) |
| 15 Years | 0 (0.0%) | 0 (0.0%) |
| 16 and 17 Years | 0 (0.0%) | 0 (0.0%) |
| 18 to 24 Years | 0 (0.0%) | 0 (0.0%) |
| 25 to 34 Years | 17 (100.0%) | 54 (100.0%) |
| 35 to 44 Years | 0 (0.0%) | 0 (0.0%) |
| 45 to 54 Years | 0 (0.0%) | 0 (0.0%) |
| 55 to 64 Years | 76 (100.0%) | 61 (38.4%) |
| 65 to 74 Years | 0 (0.0%) | 0 (0.0%) |
| 75 Years and over | 0 (0.0%) | 0 (0.0%) |
| Total | 93 (72.7%) | 115 (54.0%) |
Income Below Poverty Among Married-Couple Families in Lovingston
| Children | Above Poverty | Below Poverty |
| No Children | 76 (100.0%) | 0 (0.0%) |
| 1 or 2 Children | 0 (0.0%) | 0 (0.0%) |
| 3 or 4 Children | 0 (0.0%) | 0 (0.0%) |
| 5 or more Children | 0 (0.0%) | 0 (0.0%) |
| Total | 76 (100.0%) | 0 (0.0%) |
Income Below Poverty Among Single-Parent Households in Lovingston
| Children | Single Father | Single Mother |
| No Children | 0 (0.0%) | 0 (0.0%) |
| 1 or 2 Children | 0 (0.0%) | 0 (0.0%) |
| 3 or 4 Children | 0 (0.0%) | 0 (0.0%) |
| 5 or more Children | 0 (0.0%) | 0 (0.0%) |
| Total | 0 (0.0%) | 0 (0.0%) |
Income Below Poverty Among Married-Couple vs Single-Parent Households in Lovingston
| Children | Married-Couple Families | Single-Parent Households |
| No Children | 0 (0.0%) | 0 (0.0%) |
| 1 or 2 Children | 0 (0.0%) | 0 (0.0%) |
| 3 or 4 Children | 0 (0.0%) | 0 (0.0%) |
| 5 or more Children | 0 (0.0%) | 0 (0.0%) |
| Total | 0 (0.0%) | 0 (0.0%) |
Race in Lovingston
The most populous races in Lovingston are White / Caucasian (309 | 80.9%), and Black / African American (73 | 19.1%).
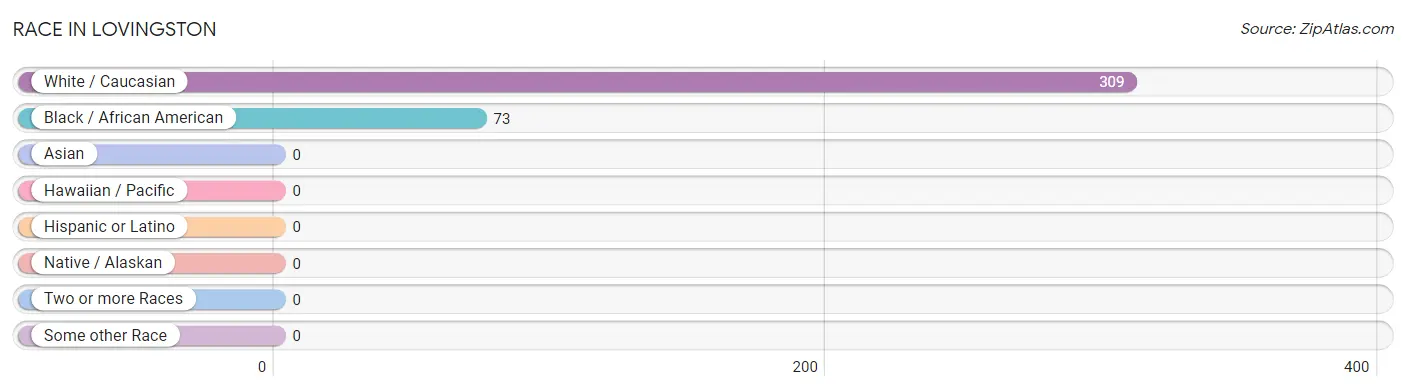
| Race | # Population | % Population |
| Asian | 0 | 0.0% |
| Black / African American | 73 | 19.1% |
| Hawaiian / Pacific | 0 | 0.0% |
| Hispanic or Latino | 0 | 0.0% |
| Native / Alaskan | 0 | 0.0% |
| White / Caucasian | 309 | 80.9% |
| Two or more Races | 0 | 0.0% |
| Some other Race | 0 | 0.0% |
| Total | 382 | 100.0% |
Ancestry in Lovingston
The most populous ancestries reported in Lovingston are American (79 | 20.7%), and Scotch-Irish (33 | 8.6%), together accounting for 29.3% of all Lovingston residents.
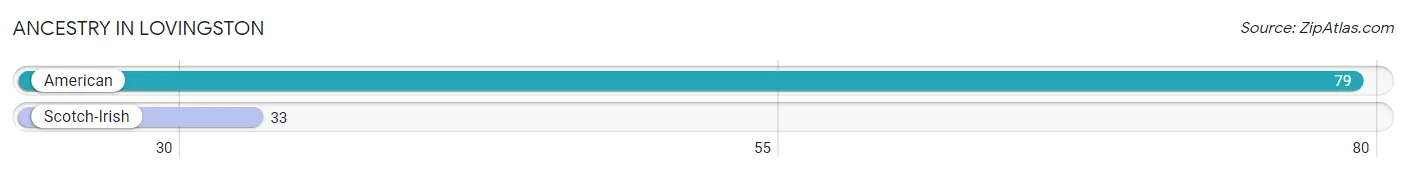
| Ancestry | # Population | % Population |
| American | 79 | 20.7% |
| Scotch-Irish | 33 | 8.6% | View All 2 Rows |
Immigrants in Lovingston

| Immigration Origin | # Population | % Population | View All 0 Rows |
Sex and Age in Lovingston
Sex and Age in Lovingston
The most populous age groups in Lovingston are 55 to 59 Years (84 | 58.3%) for men and 55 to 59 Years (159 | 66.8%) for women.
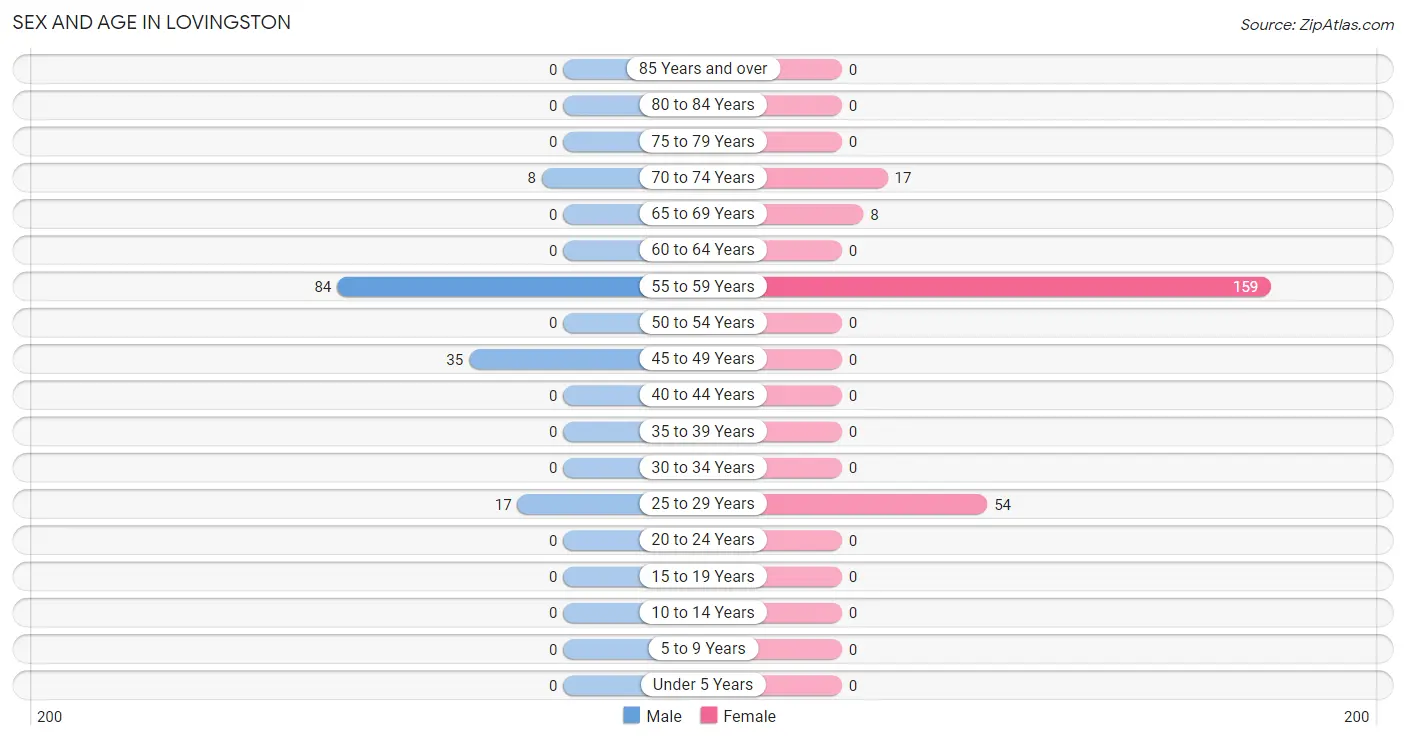
| Age Bracket | Male | Female |
| Under 5 Years | 0 (0.0%) | 0 (0.0%) |
| 5 to 9 Years | 0 (0.0%) | 0 (0.0%) |
| 10 to 14 Years | 0 (0.0%) | 0 (0.0%) |
| 15 to 19 Years | 0 (0.0%) | 0 (0.0%) |
| 20 to 24 Years | 0 (0.0%) | 0 (0.0%) |
| 25 to 29 Years | 17 (11.8%) | 54 (22.7%) |
| 30 to 34 Years | 0 (0.0%) | 0 (0.0%) |
| 35 to 39 Years | 0 (0.0%) | 0 (0.0%) |
| 40 to 44 Years | 0 (0.0%) | 0 (0.0%) |
| 45 to 49 Years | 35 (24.3%) | 0 (0.0%) |
| 50 to 54 Years | 0 (0.0%) | 0 (0.0%) |
| 55 to 59 Years | 84 (58.3%) | 159 (66.8%) |
| 60 to 64 Years | 0 (0.0%) | 0 (0.0%) |
| 65 to 69 Years | 0 (0.0%) | 8 (3.4%) |
| 70 to 74 Years | 8 (5.6%) | 17 (7.1%) |
| 75 to 79 Years | 0 (0.0%) | 0 (0.0%) |
| 80 to 84 Years | 0 (0.0%) | 0 (0.0%) |
| 85 Years and over | 0 (0.0%) | 0 (0.0%) |
| Total | 144 (100.0%) | 238 (100.0%) |
Families and Households in Lovingston
Median Family Size in Lovingston
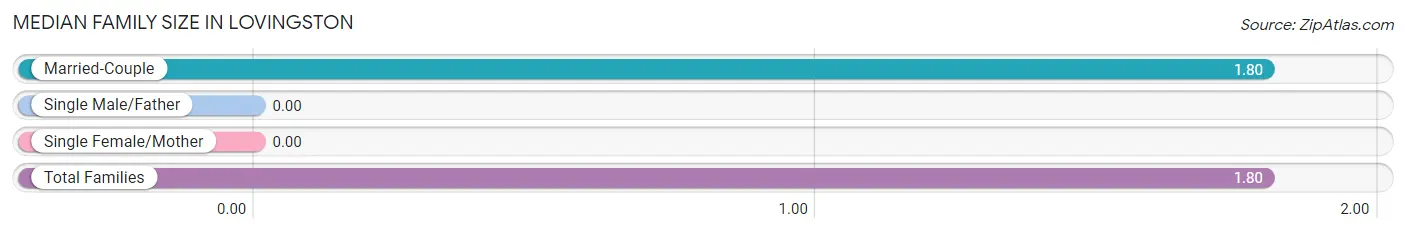
| Family Type | # Families | Family Size |
| Married-Couple | 76 (100.0%) | 1.80 |
| Single Male/Father | 0 (0.0%) | - |
| Single Female/Mother | 0 (0.0%) | - |
| Total Families | 76 (100.0%) | 1.80 |
Median Household Size in Lovingston
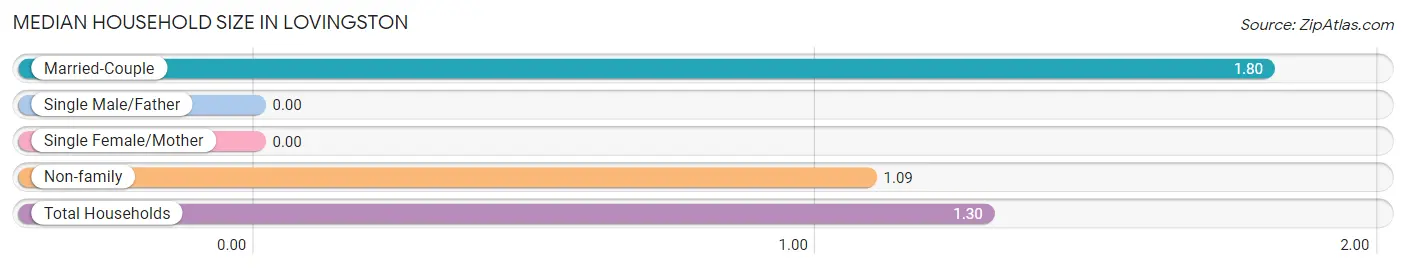
| Household Type | # Households | Household Size |
| Married-Couple | 76 (29.1%) | 1.80 |
| Single Male/Father | 0 (0.0%) | - |
| Single Female/Mother | 0 (0.0%) | - |
| Non-family | 185 (70.9%) | 1.09 |
| Total Households | 261 (100.0%) | 1.30 |
Household Size by Marriage Status in Lovingston
Out of a total of 261 households in Lovingston, 76 (29.1%) are family households, while 185 (70.9%) are nonfamily households. The most numerous type of family households are 2-person households, comprising 76, and the most common type of nonfamily households are 1-person households, comprising 131.
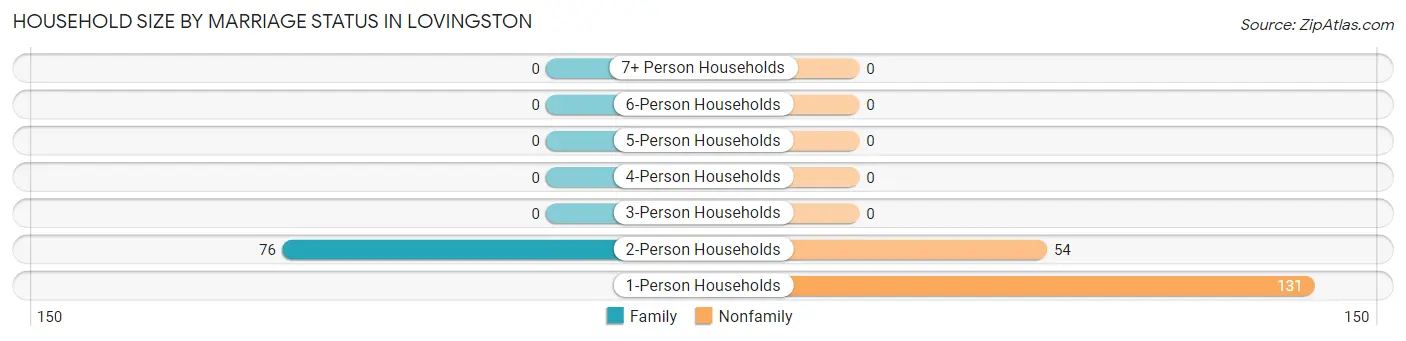
| Household Size | Family Households | Nonfamily Households |
| 1-Person Households | - | 131 (50.2%) |
| 2-Person Households | 76 (29.1%) | 54 (20.7%) |
| 3-Person Households | 0 (0.0%) | 0 (0.0%) |
| 4-Person Households | 0 (0.0%) | 0 (0.0%) |
| 5-Person Households | 0 (0.0%) | 0 (0.0%) |
| 6-Person Households | 0 (0.0%) | 0 (0.0%) |
| 7+ Person Households | 0 (0.0%) | 0 (0.0%) |
| Total | 76 (29.1%) | 185 (70.9%) |
Female Fertility in Lovingston
Fertility by Age in Lovingston
| Age Bracket | Women with Births | Births / 1,000 Women |
| 15 to 19 years | 0 (0.0%) | 0.0 |
| 20 to 34 years | 0 (0.0%) | 0.0 |
| 35 to 50 years | 0 (0.0%) | 0.0 |
| Total | 0 (0.0%) | 0.0 |
Fertility by Age by Marriage Status in Lovingston
| Age Bracket | Married | Unmarried |
| 15 to 19 years | 0 (0.0%) | 0 (0.0%) |
| 20 to 34 years | 0 (0.0%) | 0 (0.0%) |
| 35 to 50 years | 0 (0.0%) | 0 (0.0%) |
| Total | 0 (0.0%) | 0 (0.0%) |
Fertility by Education in Lovingston
| Educational Attainment | Women with Births | Births / 1,000 Women |
| Less than High School | 0 (0.0%) | 0.0 |
| High School Diploma | 0 (0.0%) | 0.0 |
| College or Associate's Degree | 0 (0.0%) | 0.0 |
| Bachelor's Degree | 0 (0.0%) | 0.0 |
| Graduate Degree | 0 (0.0%) | 0.0 |
| Total | 0 (0.0%) | 0.0 |
Fertility by Education by Marriage Status in Lovingston
| Educational Attainment | Married | Unmarried |
| Less than High School | 0 (0.0%) | 0 (0.0%) |
| High School Diploma | 0 (0.0%) | 0 (0.0%) |
| College or Associate's Degree | 0 (0.0%) | 0 (0.0%) |
| Bachelor's Degree | 0 (0.0%) | 0 (0.0%) |
| Graduate Degree | 0 (0.0%) | 0 (0.0%) |
| Total | 0 (0.0%) | 0 (0.0%) |
Employment Characteristics in Lovingston
Employment by Class of Employer in Lovingston
Among the 153 employed individuals in Lovingston, private company employees (55 | 35.9%), state government employees (54 | 35.3%), and self-employed (not incorporated) (44 | 28.8%) make up the most common classes of employment.
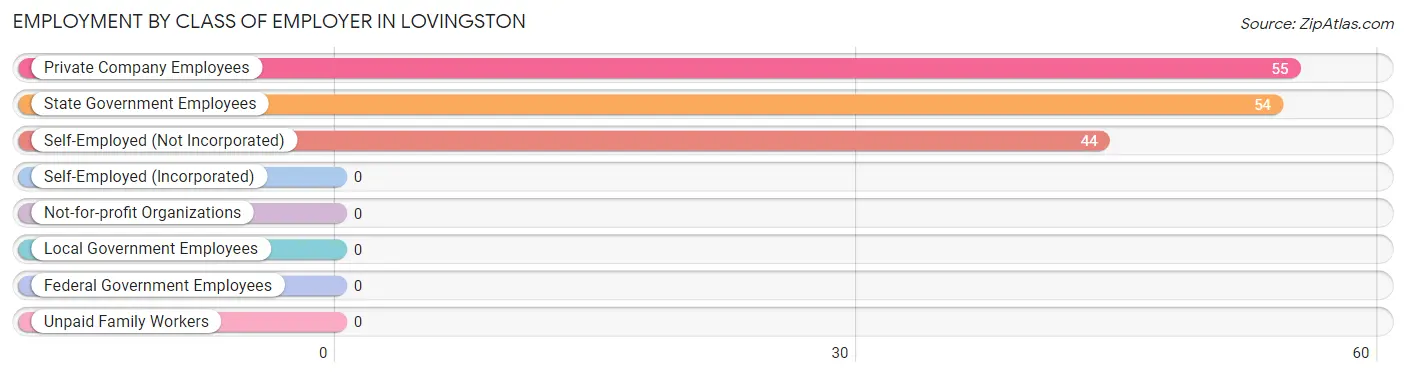
| Employer Class | # Employees | % Employees |
| Private Company Employees | 55 | 35.9% |
| Self-Employed (Incorporated) | 0 | 0.0% |
| Self-Employed (Not Incorporated) | 44 | 28.8% |
| Not-for-profit Organizations | 0 | 0.0% |
| Local Government Employees | 0 | 0.0% |
| State Government Employees | 54 | 35.3% |
| Federal Government Employees | 0 | 0.0% |
| Unpaid Family Workers | 0 | 0.0% |
| Total | 153 | 100.0% |
Employment Status by Age in Lovingston
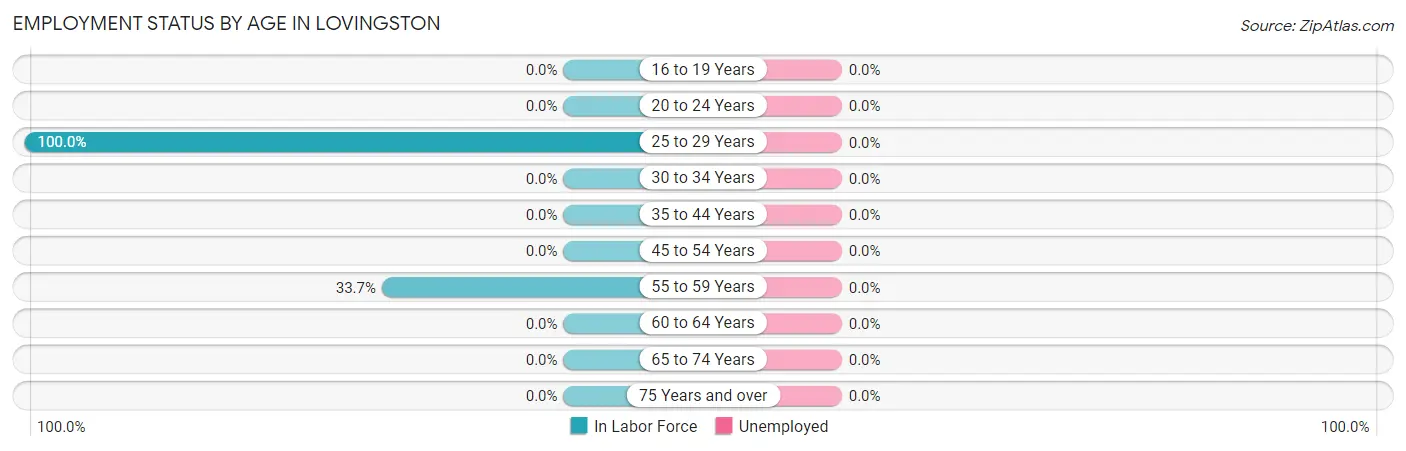
| Age Bracket | In Labor Force | Unemployed |
| 16 to 19 Years | 0 (0.0%) | 0 (0.0%) |
| 20 to 24 Years | 0 (0.0%) | 0 (0.0%) |
| 25 to 29 Years | 71 (100.0%) | 0 (0.0%) |
| 30 to 34 Years | 0 (0.0%) | 0 (0.0%) |
| 35 to 44 Years | 0 (0.0%) | 0 (0.0%) |
| 45 to 54 Years | 0 (0.0%) | 0 (0.0%) |
| 55 to 59 Years | 82 (33.7%) | 0 (0.0%) |
| 60 to 64 Years | 0 (0.0%) | 0 (0.0%) |
| 65 to 74 Years | 0 (0.0%) | 0 (0.0%) |
| 75 Years and over | 0 (0.0%) | 0 (0.0%) |
| Total | 153 (40.1%) | 0 (0.0%) |
Employment Status by Educational Attainment in Lovingston
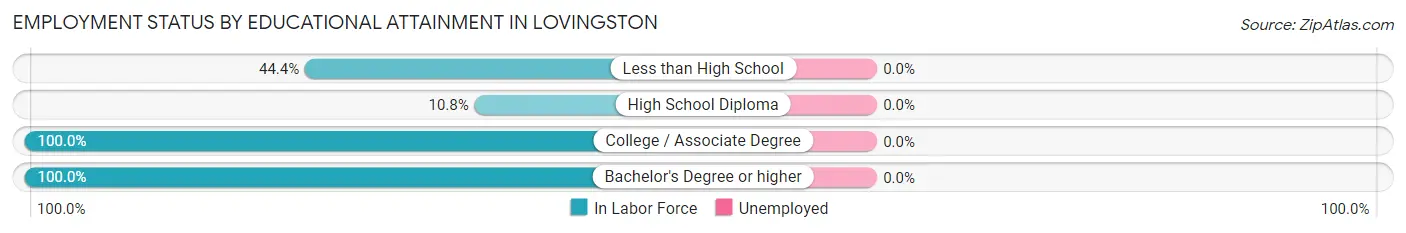
| Educational Attainment | In Labor Force | Unemployed |
| Less than High School | 44 (44.4%) | 0 (0.0%) |
| High School Diploma | 17 (10.8%) | 0 (0.0%) |
| College / Associate Degree | 54 (100.0%) | 0 (0.0%) |
| Bachelor's Degree or higher | 38 (100.0%) | 0 (0.0%) |
| Total | 153 (43.8%) | 0 (0.0%) |
Employment Occupations by Sex in Lovingston
Management, Business, Science and Arts Occupations
The most common Management, Business, Science and Arts occupations in Lovingston are , and Management (17 | 11.1%).
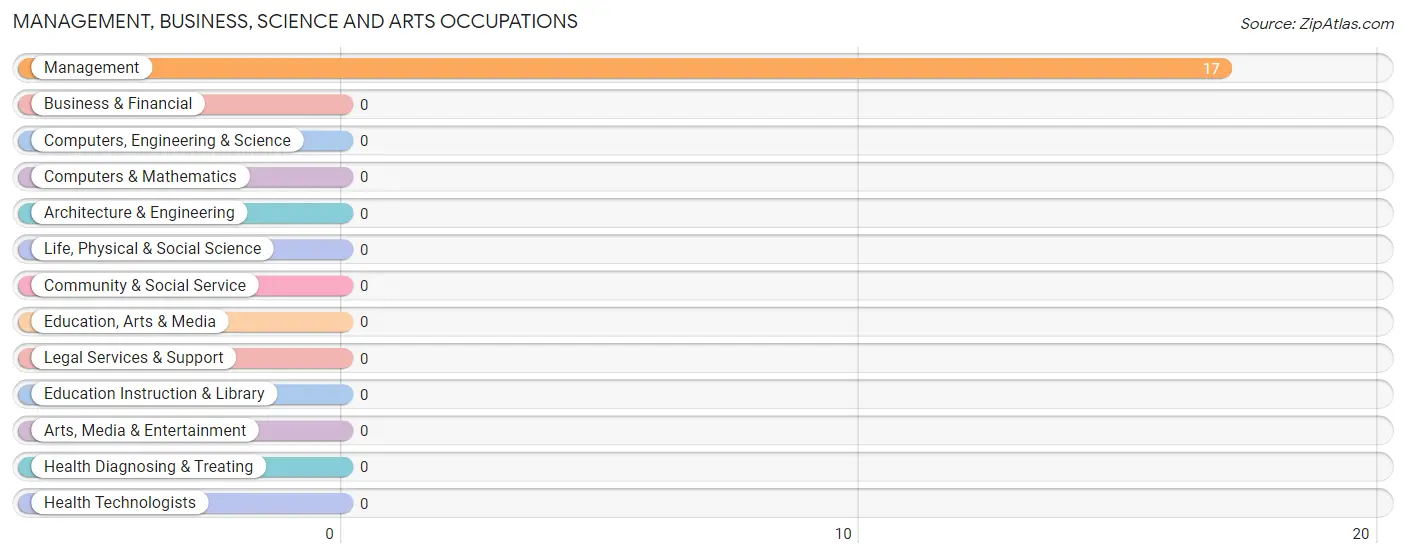
Management, Business, Science and Arts Occupations by Sex

| Occupation | Male | Female |
| Management | 0 (0.0%) | 17 (100.0%) |
| Business & Financial | 0 (0.0%) | 0 (0.0%) |
| Computers, Engineering & Science | 0 (0.0%) | 0 (0.0%) |
| Computers & Mathematics | 0 (0.0%) | 0 (0.0%) |
| Architecture & Engineering | 0 (0.0%) | 0 (0.0%) |
| Life, Physical & Social Science | 0 (0.0%) | 0 (0.0%) |
| Community & Social Service | 0 (0.0%) | 0 (0.0%) |
| Education, Arts & Media | 0 (0.0%) | 0 (0.0%) |
| Legal Services & Support | 0 (0.0%) | 0 (0.0%) |
| Education Instruction & Library | 0 (0.0%) | 0 (0.0%) |
| Arts, Media & Entertainment | 0 (0.0%) | 0 (0.0%) |
| Health Diagnosing & Treating | 0 (0.0%) | 0 (0.0%) |
| Health Technologists | 0 (0.0%) | 0 (0.0%) |
| Total (Category) | 0 (0.0%) | 17 (100.0%) |
| Total (Overall) | 38 (24.8%) | 115 (75.2%) |
Services Occupations
The most common Services occupations in Lovingston are , and Personal Care & Service (44 | 28.8%).
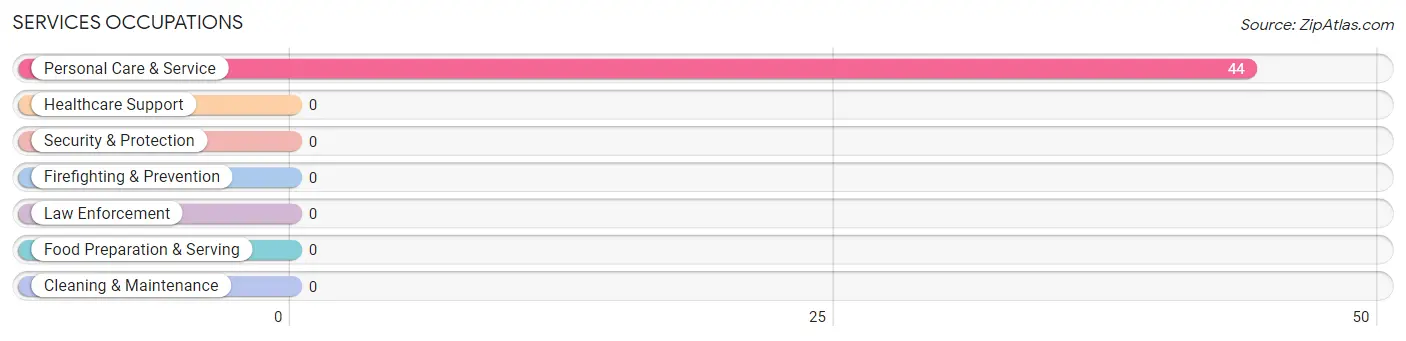
Services Occupations by Sex
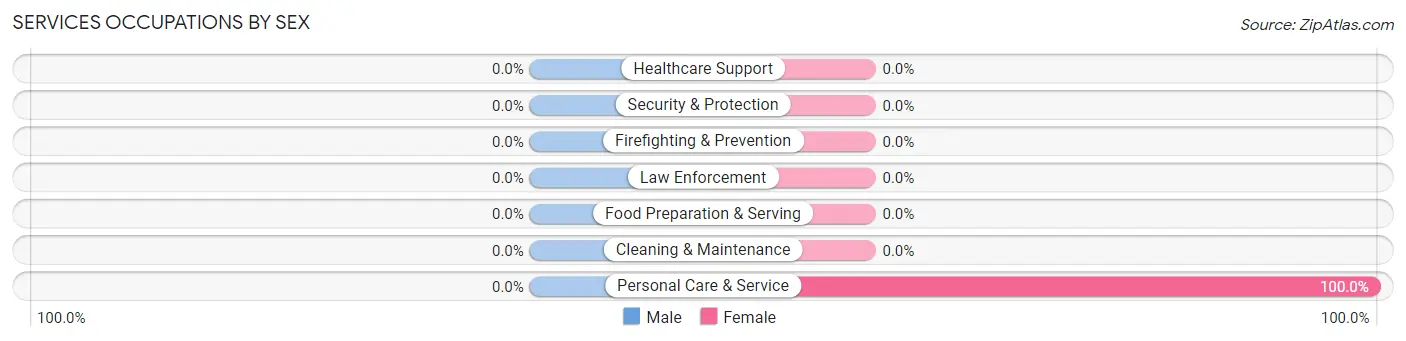
| Occupation | Male | Female |
| Healthcare Support | 0 (0.0%) | 0 (0.0%) |
| Security & Protection | 0 (0.0%) | 0 (0.0%) |
| Firefighting & Prevention | 0 (0.0%) | 0 (0.0%) |
| Law Enforcement | 0 (0.0%) | 0 (0.0%) |
| Food Preparation & Serving | 0 (0.0%) | 0 (0.0%) |
| Cleaning & Maintenance | 0 (0.0%) | 0 (0.0%) |
| Personal Care & Service | 0 (0.0%) | 44 (100.0%) |
| Total (Category) | 0 (0.0%) | 44 (100.0%) |
| Total (Overall) | 38 (24.8%) | 115 (75.2%) |
Sales and Office Occupations
The most common Sales and Office occupations in Lovingston are , and Office & Administration (54 | 35.3%).
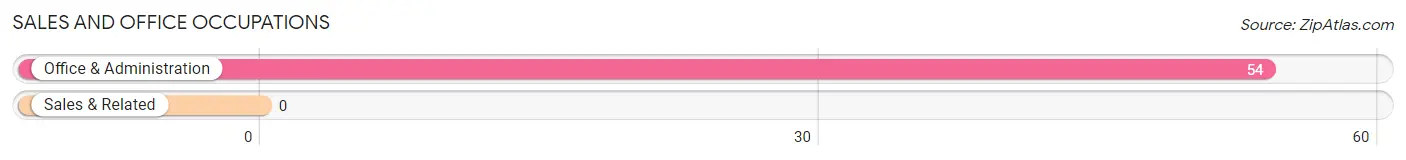
Sales and Office Occupations by Sex
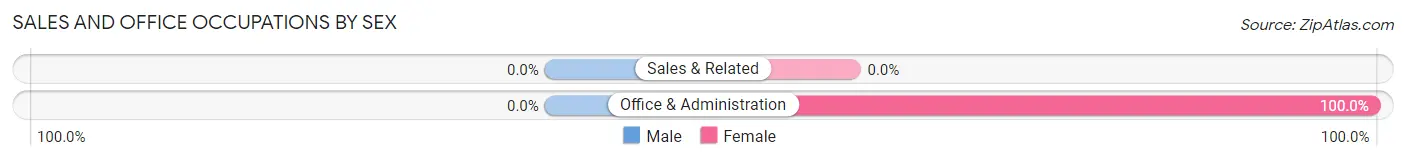
| Occupation | Male | Female |
| Sales & Related | 0 (0.0%) | 0 (0.0%) |
| Office & Administration | 0 (0.0%) | 54 (100.0%) |
| Total (Category) | 0 (0.0%) | 54 (100.0%) |
| Total (Overall) | 38 (24.8%) | 115 (75.2%) |
Natural Resources, Construction and Maintenance Occupations
Natural Resources, Construction and Maintenance Occupations by Sex
| Occupation | Male | Female |
| Farming, Fishing & Forestry | 0 (0.0%) | 0 (0.0%) |
| Construction & Extraction | 0 (0.0%) | 0 (0.0%) |
| Installation, Maintenance & Repair | 0 (0.0%) | 0 (0.0%) |
| Total (Category) | 0 (0.0%) | 0 (0.0%) |
| Total (Overall) | 38 (24.8%) | 115 (75.2%) |
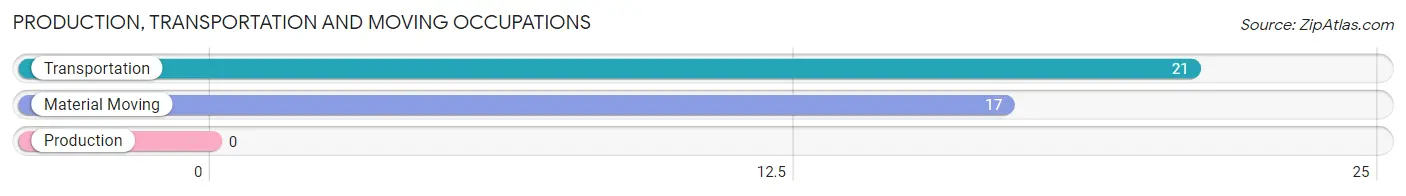
Production, Transportation and Moving Occupations
The most common Production, Transportation and Moving occupations in Lovingston are Transportation (21 | 13.7%), and Material Moving (17 | 11.1%).
Production, Transportation and Moving Occupations by Sex
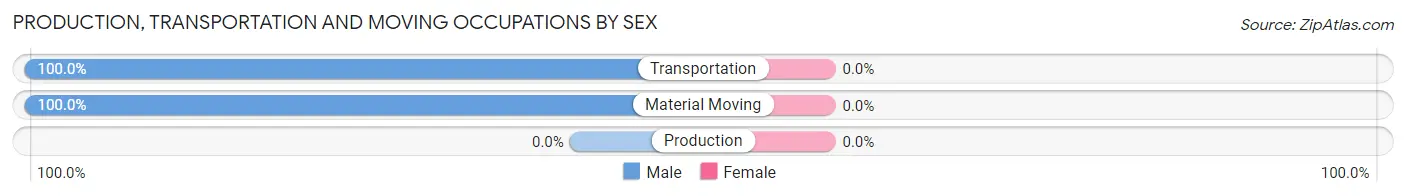
| Occupation | Male | Female |
| Production | 0 (0.0%) | 0 (0.0%) |
| Transportation | 21 (100.0%) | 0 (0.0%) |
| Material Moving | 17 (100.0%) | 0 (0.0%) |
| Total (Category) | 38 (100.0%) | 0 (0.0%) |
| Total (Overall) | 38 (24.8%) | 115 (75.2%) |
Employment Industries by Sex in Lovingston
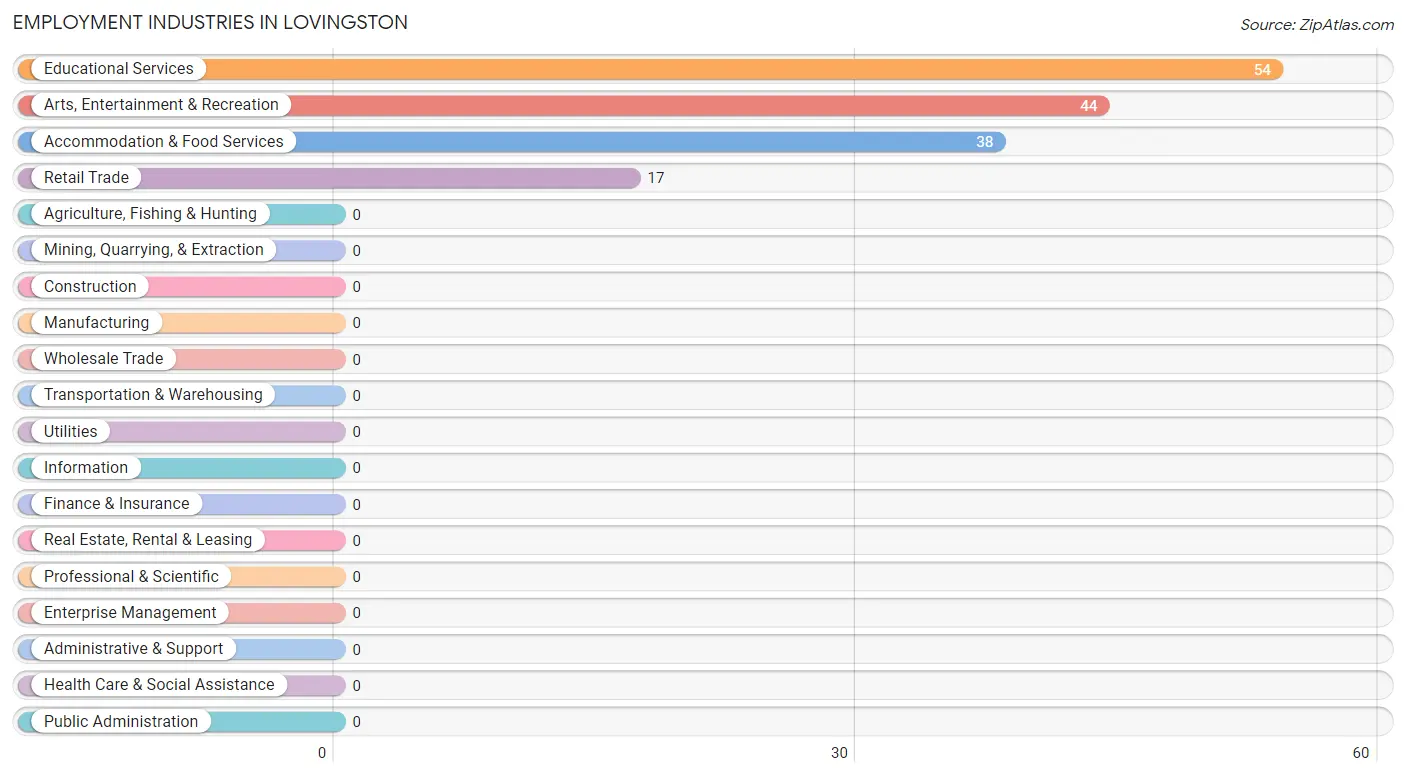
Employment Industries in Lovingston
The major employment industries in Lovingston include Educational Services (54 | 35.3%), Arts, Entertainment & Recreation (44 | 28.8%), Accommodation & Food Services (38 | 24.8%), and Retail Trade (17 | 11.1%).
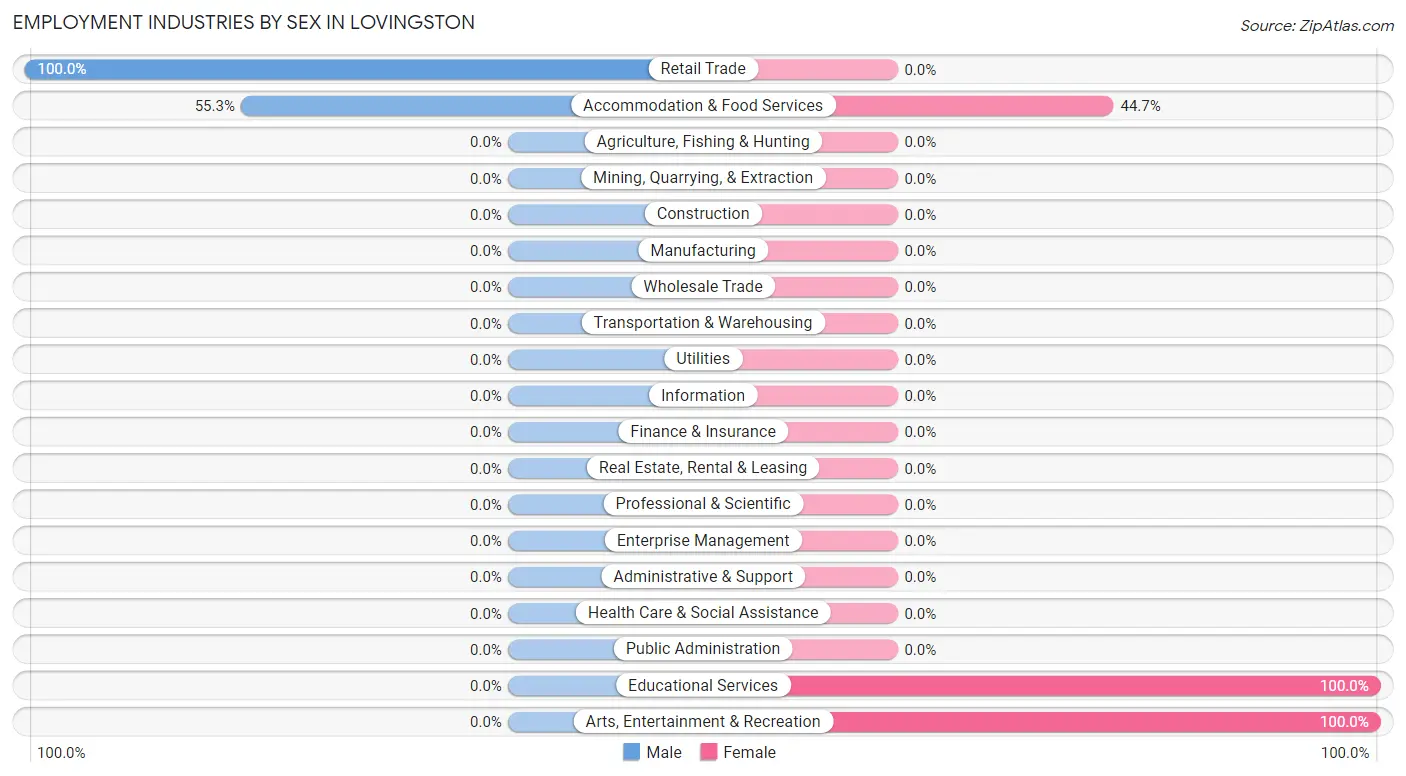
Employment Industries by Sex in Lovingston
The Lovingston industries that see more men than women are Retail Trade (100.0%), and Accommodation & Food Services (55.3%), whereas the industries that tend to have a higher number of women are Educational Services (100.0%), Arts, Entertainment & Recreation (100.0%), and Accommodation & Food Services (44.7%).
| Industry | Male | Female |
| Agriculture, Fishing & Hunting | 0 (0.0%) | 0 (0.0%) |
| Mining, Quarrying, & Extraction | 0 (0.0%) | 0 (0.0%) |
| Construction | 0 (0.0%) | 0 (0.0%) |
| Manufacturing | 0 (0.0%) | 0 (0.0%) |
| Wholesale Trade | 0 (0.0%) | 0 (0.0%) |
| Retail Trade | 17 (100.0%) | 0 (0.0%) |
| Transportation & Warehousing | 0 (0.0%) | 0 (0.0%) |
| Utilities | 0 (0.0%) | 0 (0.0%) |
| Information | 0 (0.0%) | 0 (0.0%) |
| Finance & Insurance | 0 (0.0%) | 0 (0.0%) |
| Real Estate, Rental & Leasing | 0 (0.0%) | 0 (0.0%) |
| Professional & Scientific | 0 (0.0%) | 0 (0.0%) |
| Enterprise Management | 0 (0.0%) | 0 (0.0%) |
| Administrative & Support | 0 (0.0%) | 0 (0.0%) |
| Educational Services | 0 (0.0%) | 54 (100.0%) |
| Health Care & Social Assistance | 0 (0.0%) | 0 (0.0%) |
| Arts, Entertainment & Recreation | 0 (0.0%) | 44 (100.0%) |
| Accommodation & Food Services | 21 (55.3%) | 17 (44.7%) |
| Public Administration | 0 (0.0%) | 0 (0.0%) |
| Total | 38 (24.8%) | 115 (75.2%) |
Education in Lovingston
School Enrollment in Lovingston
| School Level | # Students | % Students |
| Nursery / Preschool | 0 | 0.0% |
| Kindergarten | 0 | 0.0% |
| Elementary School | 0 | 0.0% |
| Middle School | 0 | 0.0% |
| High School | 0 | 0.0% |
| College / Undergraduate | 0 | 0.0% |
| Graduate / Professional | 0 | 0.0% |
| Total | 0 | 0.0% |
School Enrollment by Age by Funding Source in Lovingston
| Age Bracket | Public School | Private School |
| 3 to 4 Year Olds | 0 (0.0%) | 0 (0.0%) |
| 5 to 9 Year Old | 0 (0.0%) | 0 (0.0%) |
| 10 to 14 Year Olds | 0 (0.0%) | 0 (0.0%) |
| 15 to 17 Year Olds | 0 (0.0%) | 0 (0.0%) |
| 18 to 19 Year Olds | 0 (0.0%) | 0 (0.0%) |
| 20 to 24 Year Olds | 0 (0.0%) | 0 (0.0%) |
| 25 to 34 Year Olds | 0 (0.0%) | 0 (0.0%) |
| 35 Years and over | 0 (0.0%) | 0 (0.0%) |
| Total | 0 (0.0%) | 0 (0.0%) |
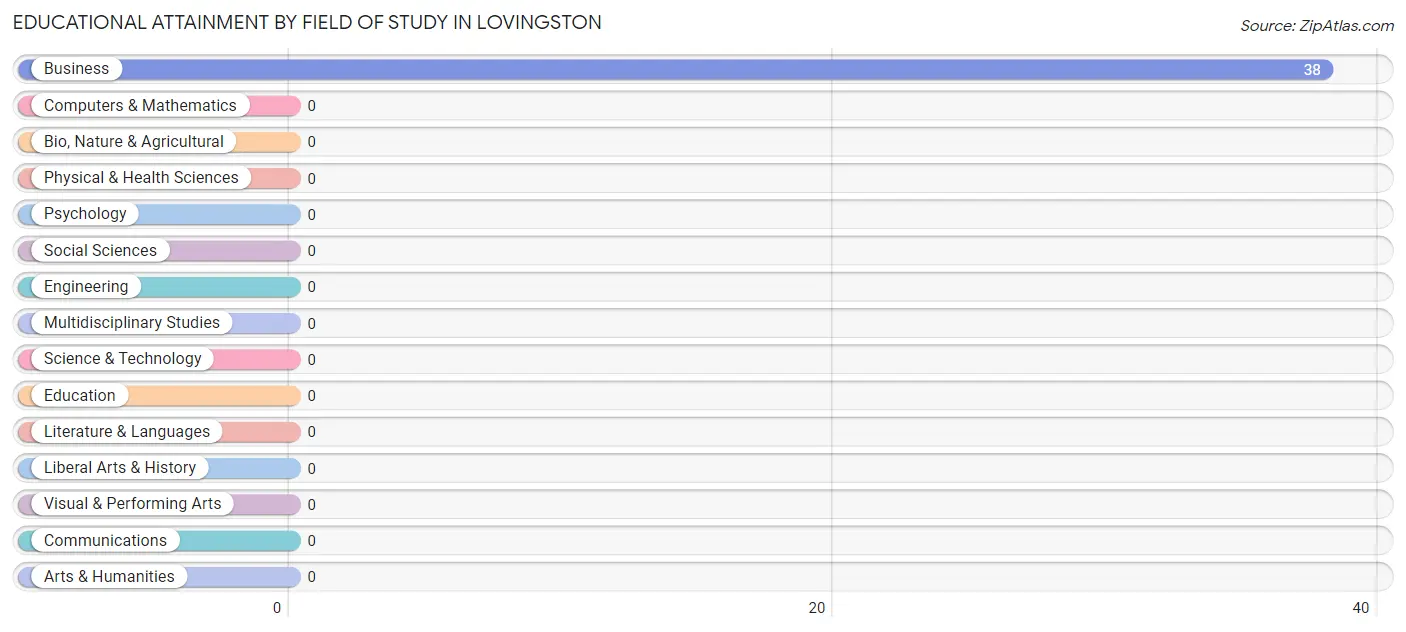
Educational Attainment by Field of Study in Lovingston
, and business (38 | 100.0%) are the most common fields of study among 38 individuals in Lovingston who have obtained a bachelor's degree or higher.
| Field of Study | # Graduates | % Graduates |
| Computers & Mathematics | 0 | 0.0% |
| Bio, Nature & Agricultural | 0 | 0.0% |
| Physical & Health Sciences | 0 | 0.0% |
| Psychology | 0 | 0.0% |
| Social Sciences | 0 | 0.0% |
| Engineering | 0 | 0.0% |
| Multidisciplinary Studies | 0 | 0.0% |
| Science & Technology | 0 | 0.0% |
| Business | 38 | 100.0% |
| Education | 0 | 0.0% |
| Literature & Languages | 0 | 0.0% |
| Liberal Arts & History | 0 | 0.0% |
| Visual & Performing Arts | 0 | 0.0% |
| Communications | 0 | 0.0% |
| Arts & Humanities | 0 | 0.0% |
| Total | 38 | 100.0% |
Transportation & Commute in Lovingston
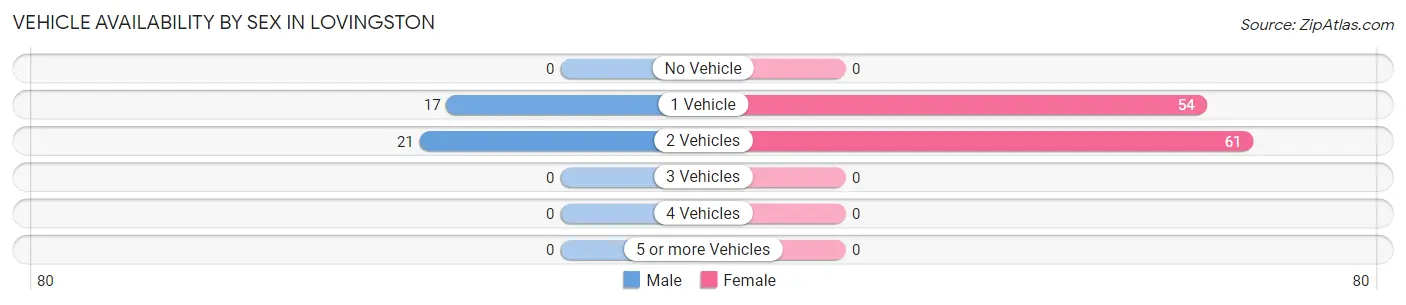
Vehicle Availability by Sex in Lovingston
The most prevalent vehicle ownership categories in Lovingston are males with 2 vehicles (21, accounting for 55.3%) and females with 2 vehicles (61, making up 18.3%).
| Vehicles Available | Male | Female |
| No Vehicle | 0 (0.0%) | 0 (0.0%) |
| 1 Vehicle | 17 (44.7%) | 54 (47.0%) |
| 2 Vehicles | 21 (55.3%) | 61 (53.0%) |
| 3 Vehicles | 0 (0.0%) | 0 (0.0%) |
| 4 Vehicles | 0 (0.0%) | 0 (0.0%) |
| 5 or more Vehicles | 0 (0.0%) | 0 (0.0%) |
| Total | 38 (100.0%) | 115 (100.0%) |
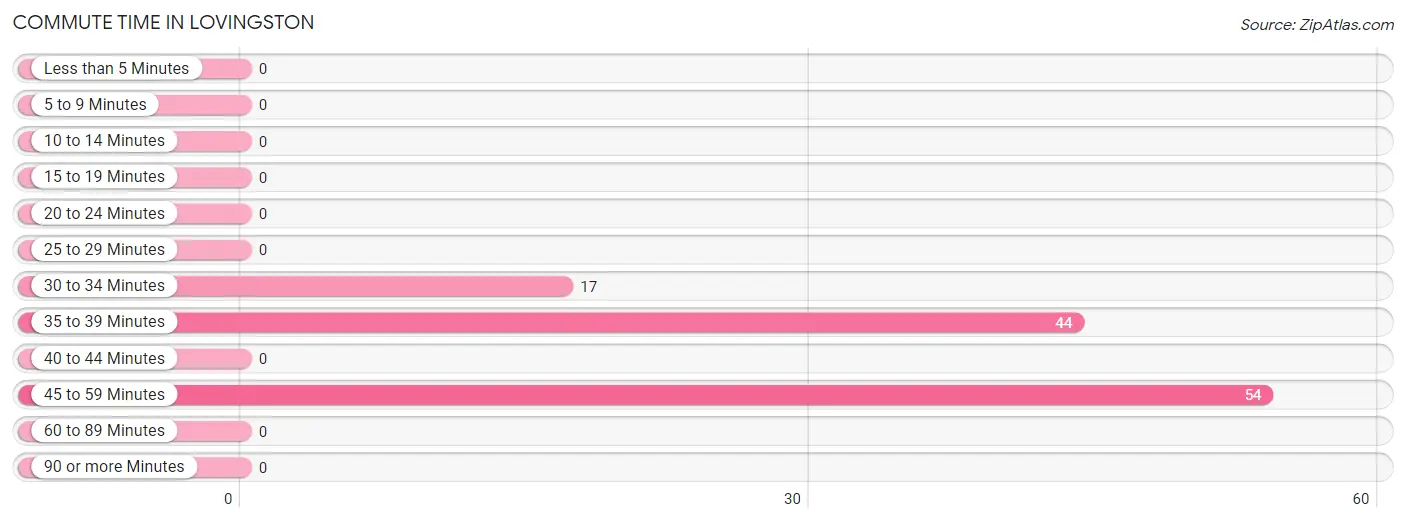
Commute Time in Lovingston
The most frequently occuring commute durations in Lovingston are 45 to 59 minutes (54 commuters, 47.0%), 35 to 39 minutes (44 commuters, 38.3%), and 30 to 34 minutes (17 commuters, 14.8%).
| Commute Time | # Commuters | % Commuters |
| Less than 5 Minutes | 0 | 0.0% |
| 5 to 9 Minutes | 0 | 0.0% |
| 10 to 14 Minutes | 0 | 0.0% |
| 15 to 19 Minutes | 0 | 0.0% |
| 20 to 24 Minutes | 0 | 0.0% |
| 25 to 29 Minutes | 0 | 0.0% |
| 30 to 34 Minutes | 17 | 14.8% |
| 35 to 39 Minutes | 44 | 38.3% |
| 40 to 44 Minutes | 0 | 0.0% |
| 45 to 59 Minutes | 54 | 47.0% |
| 60 to 89 Minutes | 0 | 0.0% |
| 90 or more Minutes | 0 | 0.0% |
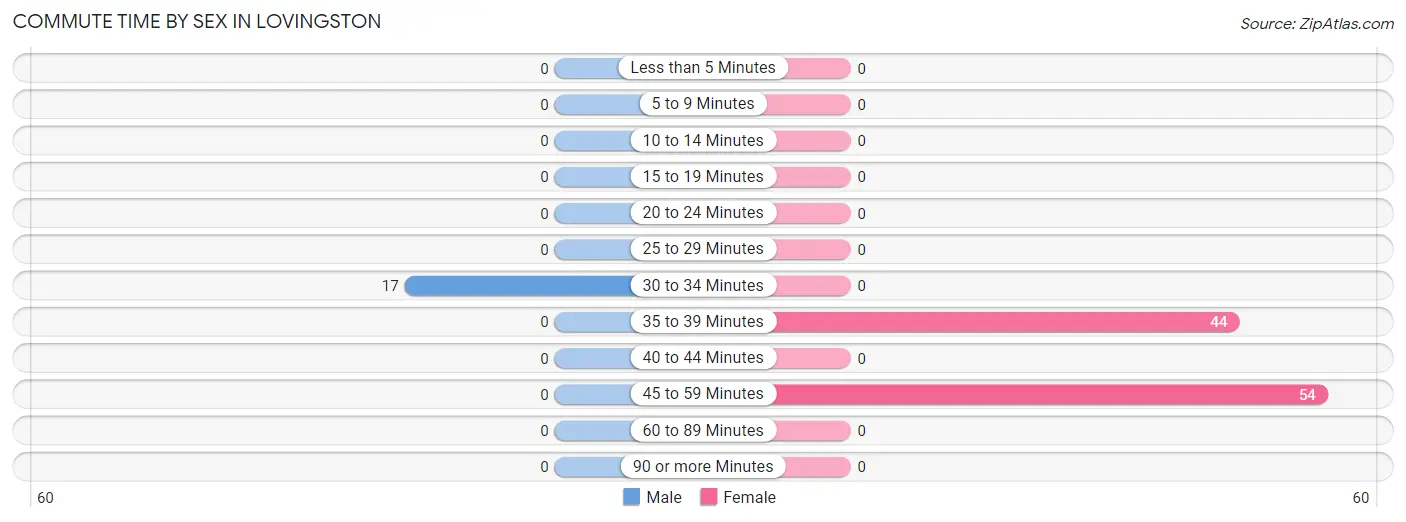
Commute Time by Sex in Lovingston
The most common commute times in Lovingston are 30 to 34 minutes (17 commuters, 100.0%) for males and 45 to 59 minutes (54 commuters, 55.1%) for females.
| Commute Time | Male | Female |
| Less than 5 Minutes | 0 (0.0%) | 0 (0.0%) |
| 5 to 9 Minutes | 0 (0.0%) | 0 (0.0%) |
| 10 to 14 Minutes | 0 (0.0%) | 0 (0.0%) |
| 15 to 19 Minutes | 0 (0.0%) | 0 (0.0%) |
| 20 to 24 Minutes | 0 (0.0%) | 0 (0.0%) |
| 25 to 29 Minutes | 0 (0.0%) | 0 (0.0%) |
| 30 to 34 Minutes | 17 (100.0%) | 0 (0.0%) |
| 35 to 39 Minutes | 0 (0.0%) | 44 (44.9%) |
| 40 to 44 Minutes | 0 (0.0%) | 0 (0.0%) |
| 45 to 59 Minutes | 0 (0.0%) | 54 (55.1%) |
| 60 to 89 Minutes | 0 (0.0%) | 0 (0.0%) |
| 90 or more Minutes | 0 (0.0%) | 0 (0.0%) |
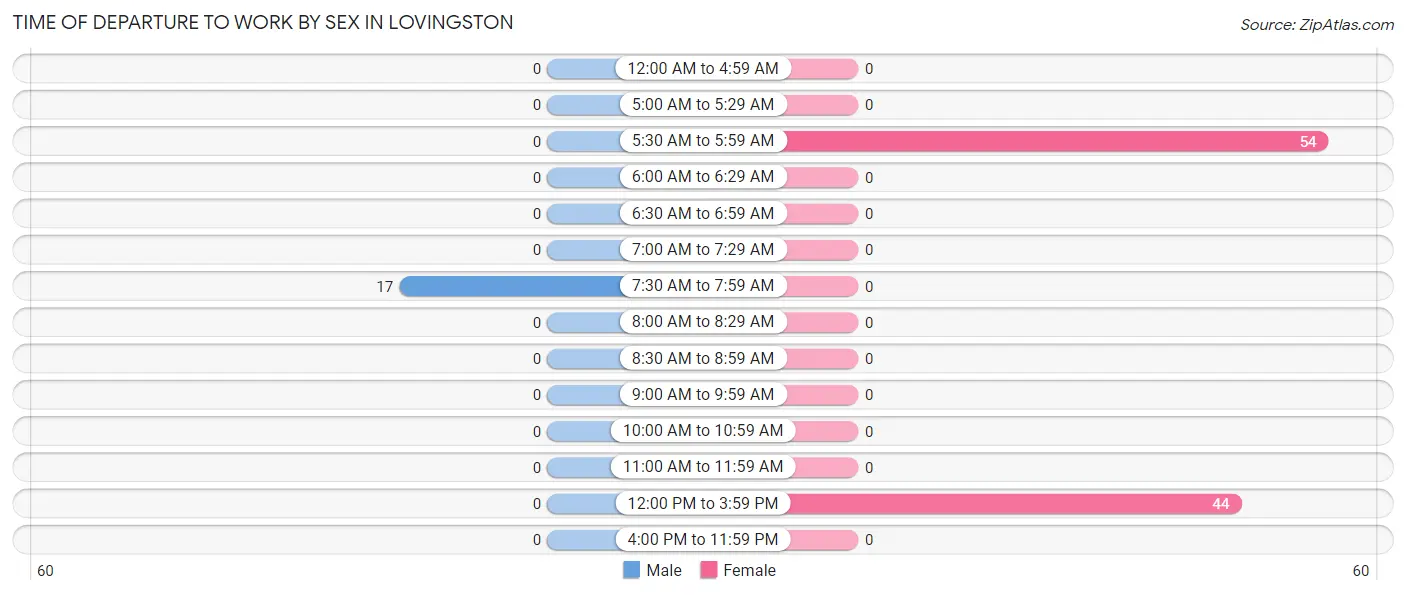
Time of Departure to Work by Sex in Lovingston
The most frequent times of departure to work in Lovingston are 7:30 AM to 7:59 AM (17, 100.0%) for males and 5:30 AM to 5:59 AM (54, 55.1%) for females.
| Time of Departure | Male | Female |
| 12:00 AM to 4:59 AM | 0 (0.0%) | 0 (0.0%) |
| 5:00 AM to 5:29 AM | 0 (0.0%) | 0 (0.0%) |
| 5:30 AM to 5:59 AM | 0 (0.0%) | 54 (55.1%) |
| 6:00 AM to 6:29 AM | 0 (0.0%) | 0 (0.0%) |
| 6:30 AM to 6:59 AM | 0 (0.0%) | 0 (0.0%) |
| 7:00 AM to 7:29 AM | 0 (0.0%) | 0 (0.0%) |
| 7:30 AM to 7:59 AM | 17 (100.0%) | 0 (0.0%) |
| 8:00 AM to 8:29 AM | 0 (0.0%) | 0 (0.0%) |
| 8:30 AM to 8:59 AM | 0 (0.0%) | 0 (0.0%) |
| 9:00 AM to 9:59 AM | 0 (0.0%) | 0 (0.0%) |
| 10:00 AM to 10:59 AM | 0 (0.0%) | 0 (0.0%) |
| 11:00 AM to 11:59 AM | 0 (0.0%) | 0 (0.0%) |
| 12:00 PM to 3:59 PM | 0 (0.0%) | 44 (44.9%) |
| 4:00 PM to 11:59 PM | 0 (0.0%) | 0 (0.0%) |
| Total | 17 (100.0%) | 98 (100.0%) |
Housing Occupancy in Lovingston
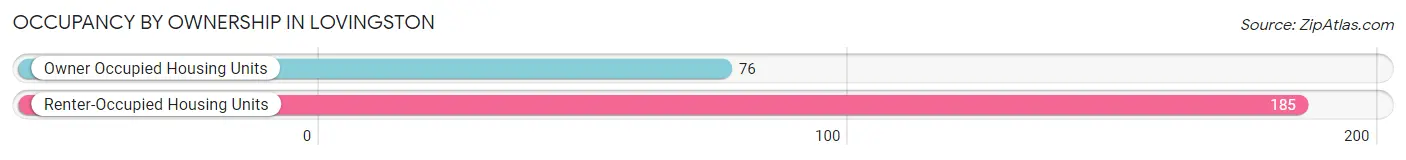
Occupancy by Ownership in Lovingston
Of the total 261 dwellings in Lovingston, owner-occupied units account for 76 (29.1%), while renter-occupied units make up 185 (70.9%).
| Occupancy | # Housing Units | % Housing Units |
| Owner Occupied Housing Units | 76 | 29.1% |
| Renter-Occupied Housing Units | 185 | 70.9% |
| Total Occupied Housing Units | 261 | 100.0% |
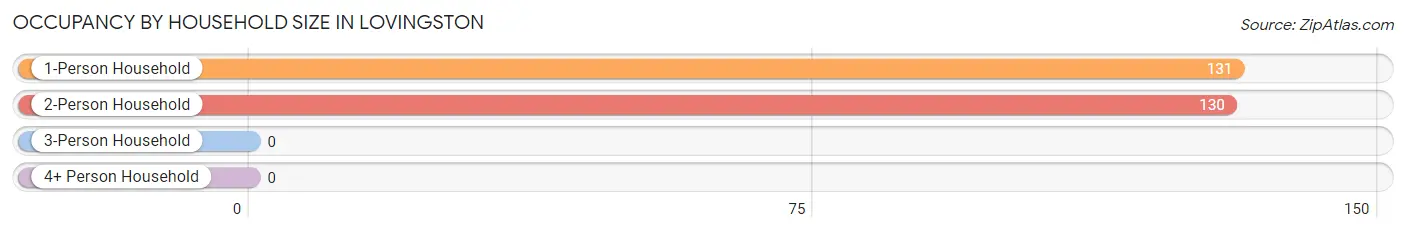
Occupancy by Household Size in Lovingston
| Household Size | # Housing Units | % Housing Units |
| 1-Person Household | 131 | 50.2% |
| 2-Person Household | 130 | 49.8% |
| 3-Person Household | 0 | 0.0% |
| 4+ Person Household | 0 | 0.0% |
| Total Housing Units | 261 | 100.0% |
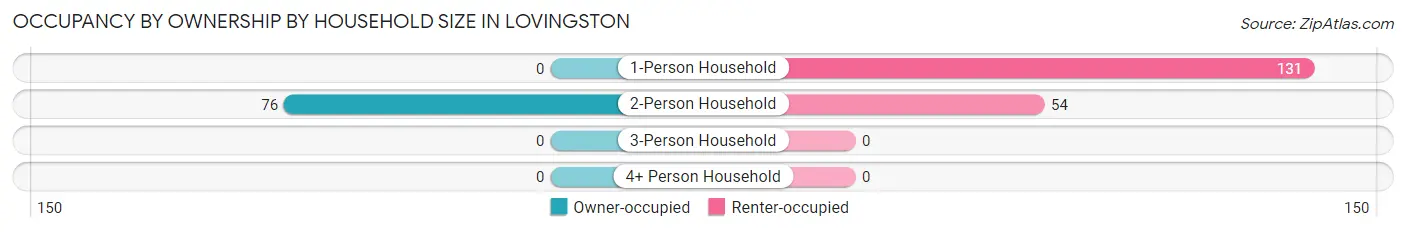
Occupancy by Ownership by Household Size in Lovingston
| Household Size | Owner-occupied | Renter-occupied |
| 1-Person Household | 0 (0.0%) | 131 (100.0%) |
| 2-Person Household | 76 (58.5%) | 54 (41.5%) |
| 3-Person Household | 0 (0.0%) | 0 (0.0%) |
| 4+ Person Household | 0 (0.0%) | 0 (0.0%) |
| Total Housing Units | 76 (29.1%) | 185 (70.9%) |
Occupancy by Educational Attainment in Lovingston
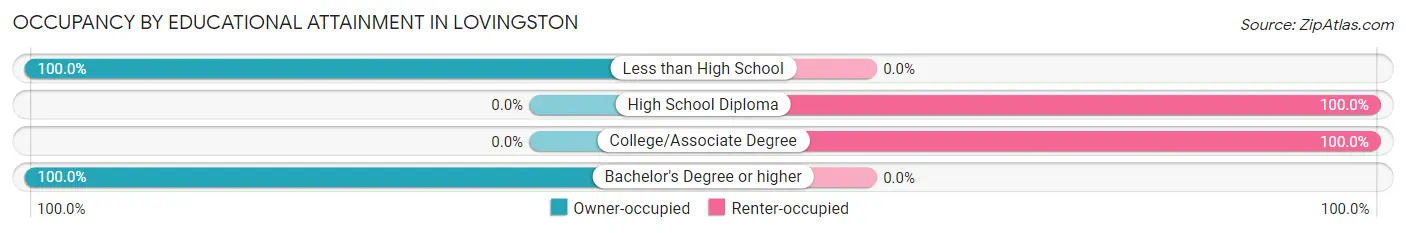
| Household Size | Owner-occupied | Renter-occupied |
| Less than High School | 55 (100.0%) | 0 (0.0%) |
| High School Diploma | 0 (0.0%) | 131 (100.0%) |
| College/Associate Degree | 0 (0.0%) | 54 (100.0%) |
| Bachelor's Degree or higher | 21 (100.0%) | 0 (0.0%) |
Occupancy by Age of Householder in Lovingston
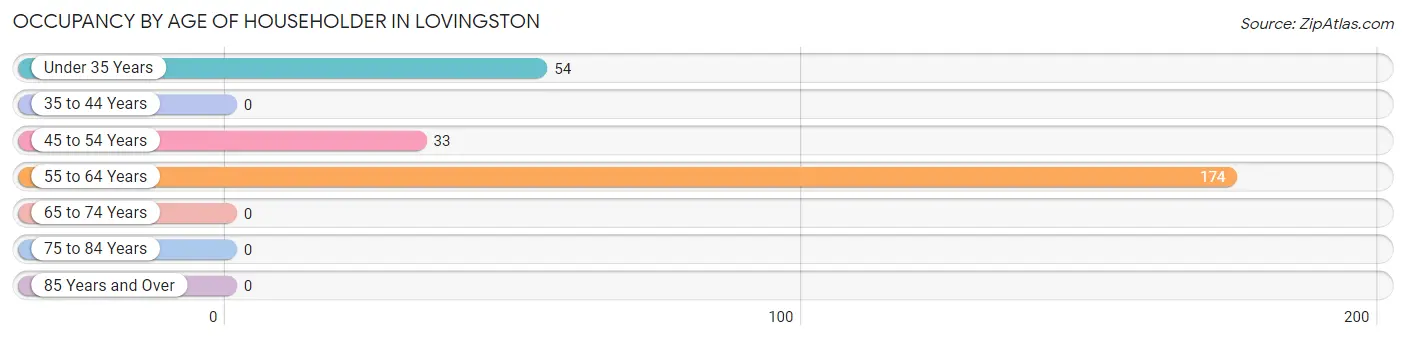
| Age Bracket | # Households | % Households |
| Under 35 Years | 54 | 20.7% |
| 35 to 44 Years | 0 | 0.0% |
| 45 to 54 Years | 33 | 12.6% |
| 55 to 64 Years | 174 | 66.7% |
| 65 to 74 Years | 0 | 0.0% |
| 75 to 84 Years | 0 | 0.0% |
| 85 Years and Over | 0 | 0.0% |
| Total | 261 | 100.0% |
Housing Finances in Lovingston
Median Income by Occupancy in Lovingston
| Occupancy Type | # Households | Median Income |
| Owner-Occupied | 76 (29.1%) | $0 |
| Renter-Occupied | 185 (70.9%) | $0 |
| Average | 261 (100.0%) | $0 |
Occupancy by Householder Income Bracket in Lovingston
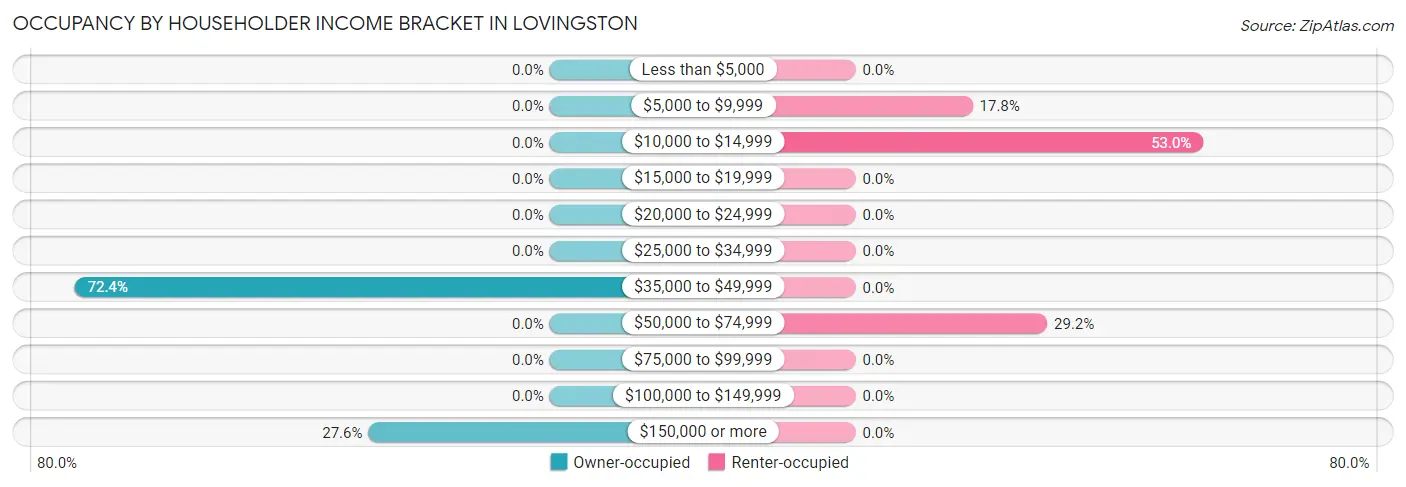
| Income Bracket | Owner-occupied | Renter-occupied |
| Less than $5,000 | 0 (0.0%) | 0 (0.0%) |
| $5,000 to $9,999 | 0 (0.0%) | 33 (17.8%) |
| $10,000 to $14,999 | 0 (0.0%) | 98 (53.0%) |
| $15,000 to $19,999 | 0 (0.0%) | 0 (0.0%) |
| $20,000 to $24,999 | 0 (0.0%) | 0 (0.0%) |
| $25,000 to $34,999 | 0 (0.0%) | 0 (0.0%) |
| $35,000 to $49,999 | 55 (72.4%) | 0 (0.0%) |
| $50,000 to $74,999 | 0 (0.0%) | 54 (29.2%) |
| $75,000 to $99,999 | 0 (0.0%) | 0 (0.0%) |
| $100,000 to $149,999 | 0 (0.0%) | 0 (0.0%) |
| $150,000 or more | 21 (27.6%) | 0 (0.0%) |
| Total | 76 (100.0%) | 185 (100.0%) |
Monthly Housing Cost Tiers in Lovingston
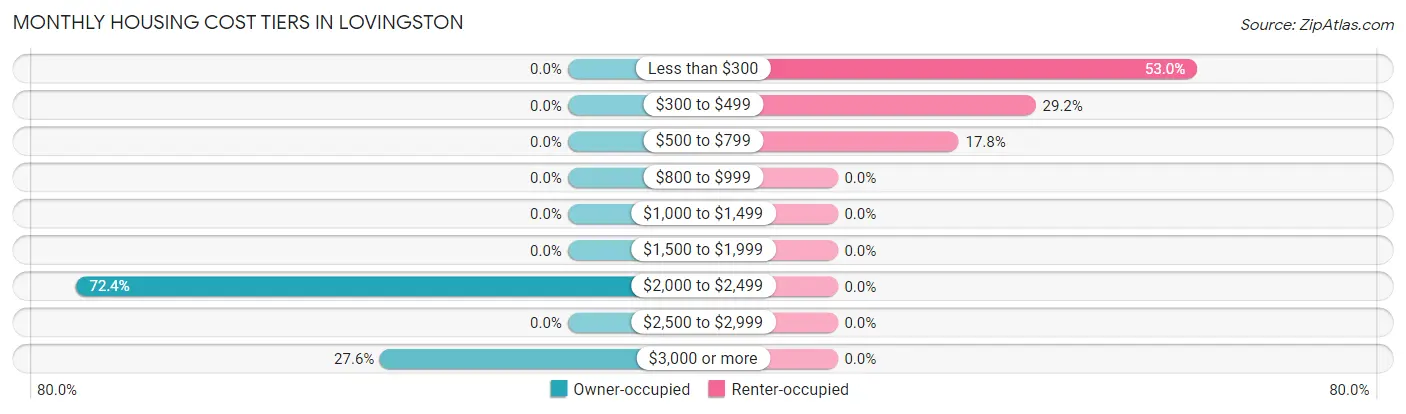
| Monthly Cost | Owner-occupied | Renter-occupied |
| Less than $300 | 0 (0.0%) | 98 (53.0%) |
| $300 to $499 | 0 (0.0%) | 54 (29.2%) |
| $500 to $799 | 0 (0.0%) | 33 (17.8%) |
| $800 to $999 | 0 (0.0%) | 0 (0.0%) |
| $1,000 to $1,499 | 0 (0.0%) | 0 (0.0%) |
| $1,500 to $1,999 | 0 (0.0%) | 0 (0.0%) |
| $2,000 to $2,499 | 55 (72.4%) | 0 (0.0%) |
| $2,500 to $2,999 | 0 (0.0%) | 0 (0.0%) |
| $3,000 or more | 21 (27.6%) | 0 (0.0%) |
| Total | 76 (100.0%) | 185 (100.0%) |
Physical Housing Characteristics in Lovingston
Housing Structures in Lovingston
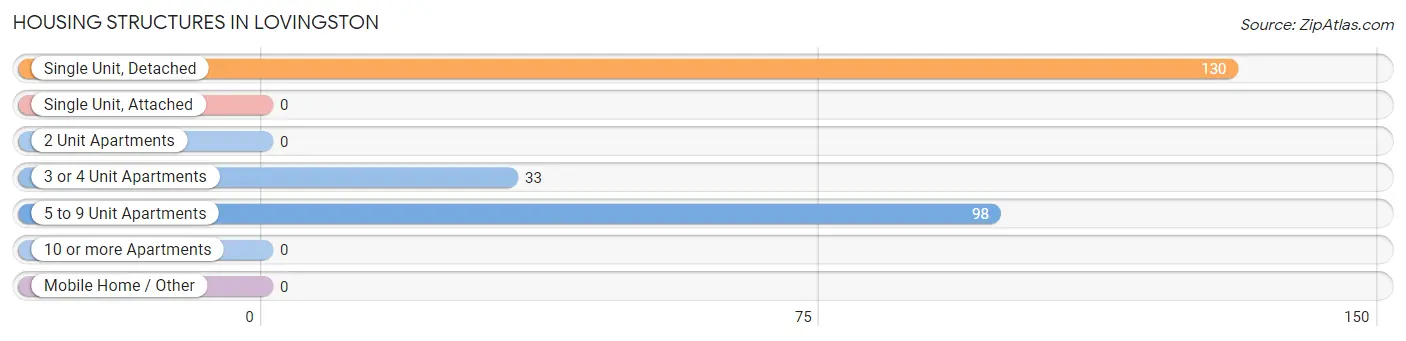
| Structure Type | # Housing Units | % Housing Units |
| Single Unit, Detached | 130 | 49.8% |
| Single Unit, Attached | 0 | 0.0% |
| 2 Unit Apartments | 0 | 0.0% |
| 3 or 4 Unit Apartments | 33 | 12.6% |
| 5 to 9 Unit Apartments | 98 | 37.6% |
| 10 or more Apartments | 0 | 0.0% |
| Mobile Home / Other | 0 | 0.0% |
| Total | 261 | 100.0% |
Housing Structures by Occupancy in Lovingston
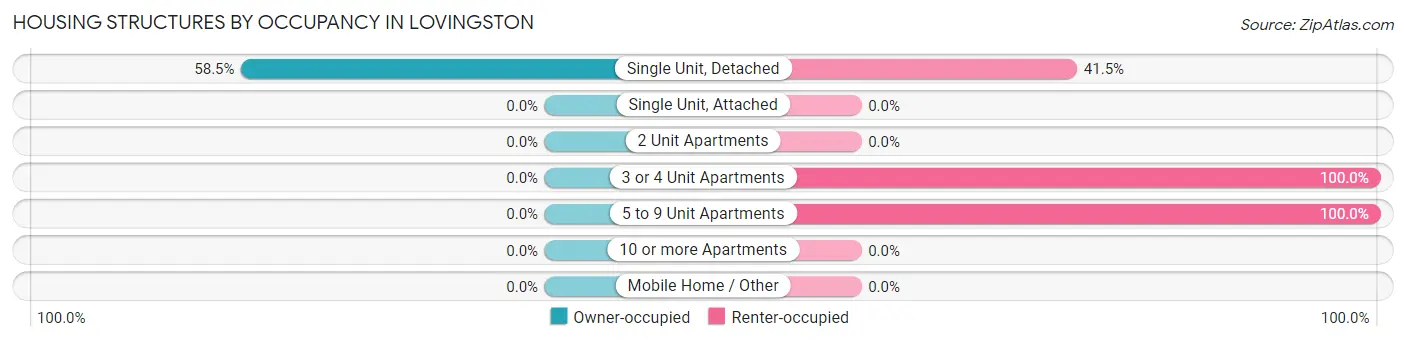
| Structure Type | Owner-occupied | Renter-occupied |
| Single Unit, Detached | 76 (58.5%) | 54 (41.5%) |
| Single Unit, Attached | 0 (0.0%) | 0 (0.0%) |
| 2 Unit Apartments | 0 (0.0%) | 0 (0.0%) |
| 3 or 4 Unit Apartments | 0 (0.0%) | 33 (100.0%) |
| 5 to 9 Unit Apartments | 0 (0.0%) | 98 (100.0%) |
| 10 or more Apartments | 0 (0.0%) | 0 (0.0%) |
| Mobile Home / Other | 0 (0.0%) | 0 (0.0%) |
| Total | 76 (29.1%) | 185 (70.9%) |
Housing Structures by Number of Rooms in Lovingston
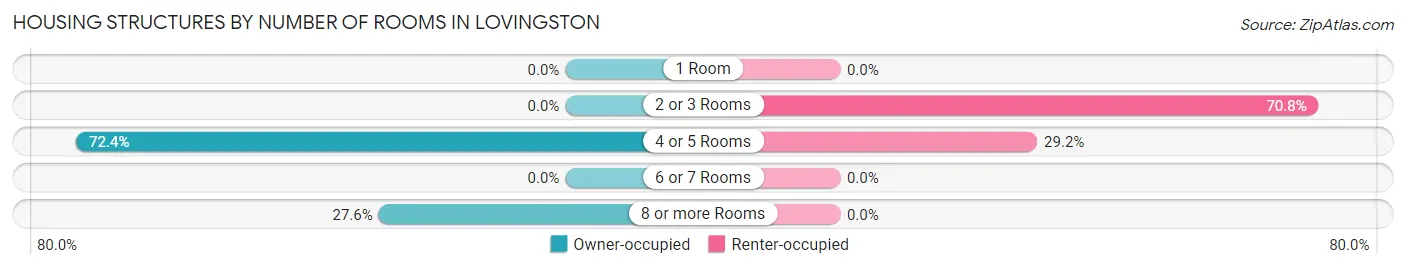
| Number of Rooms | Owner-occupied | Renter-occupied |
| 1 Room | 0 (0.0%) | 0 (0.0%) |
| 2 or 3 Rooms | 0 (0.0%) | 131 (70.8%) |
| 4 or 5 Rooms | 55 (72.4%) | 54 (29.2%) |
| 6 or 7 Rooms | 0 (0.0%) | 0 (0.0%) |
| 8 or more Rooms | 21 (27.6%) | 0 (0.0%) |
| Total | 76 (100.0%) | 185 (100.0%) |
Housing Structure by Heating Type in Lovingston
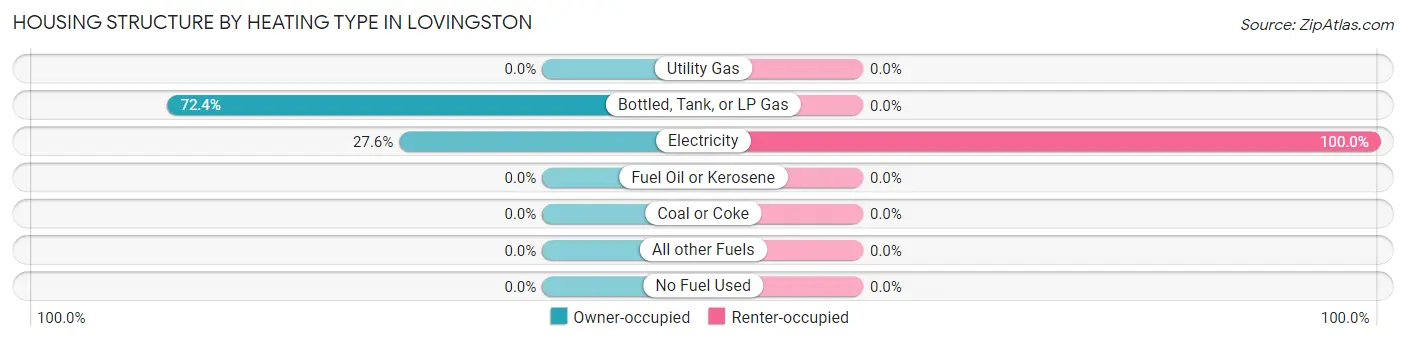
| Heating Type | Owner-occupied | Renter-occupied |
| Utility Gas | 0 (0.0%) | 0 (0.0%) |
| Bottled, Tank, or LP Gas | 55 (72.4%) | 0 (0.0%) |
| Electricity | 21 (27.6%) | 185 (100.0%) |
| Fuel Oil or Kerosene | 0 (0.0%) | 0 (0.0%) |
| Coal or Coke | 0 (0.0%) | 0 (0.0%) |
| All other Fuels | 0 (0.0%) | 0 (0.0%) |
| No Fuel Used | 0 (0.0%) | 0 (0.0%) |
| Total | 76 (100.0%) | 185 (100.0%) |
Household Vehicle Usage in Lovingston
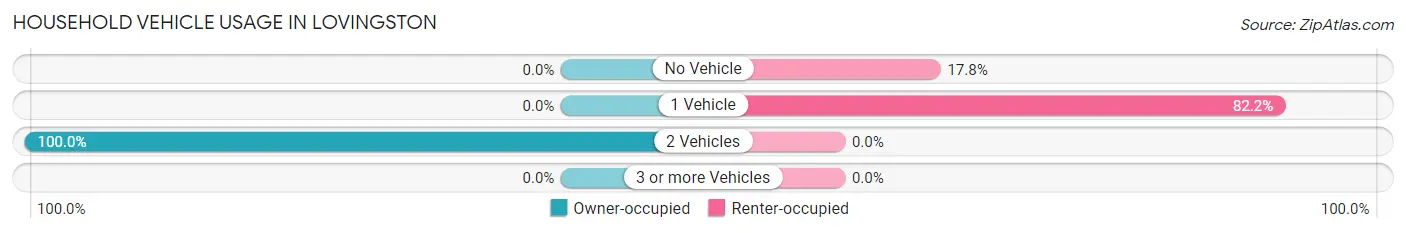
| Vehicles per Household | Owner-occupied | Renter-occupied |
| No Vehicle | 0 (0.0%) | 33 (17.8%) |
| 1 Vehicle | 0 (0.0%) | 152 (82.2%) |
| 2 Vehicles | 76 (100.0%) | 0 (0.0%) |
| 3 or more Vehicles | 0 (0.0%) | 0 (0.0%) |
| Total | 76 (100.0%) | 185 (100.0%) |
Real Estate & Mortgages in Lovingston
Real Estate and Mortgage Overview in Lovingston
| Characteristic | Without Mortgage | With Mortgage |
| Housing Units | 0 | 76 |
| Median Property Value | - | - |
| Median Household Income | - | - |
| Monthly Housing Costs | - | - |
| Real Estate Taxes | - | - |
Property Value by Mortgage Status in Lovingston
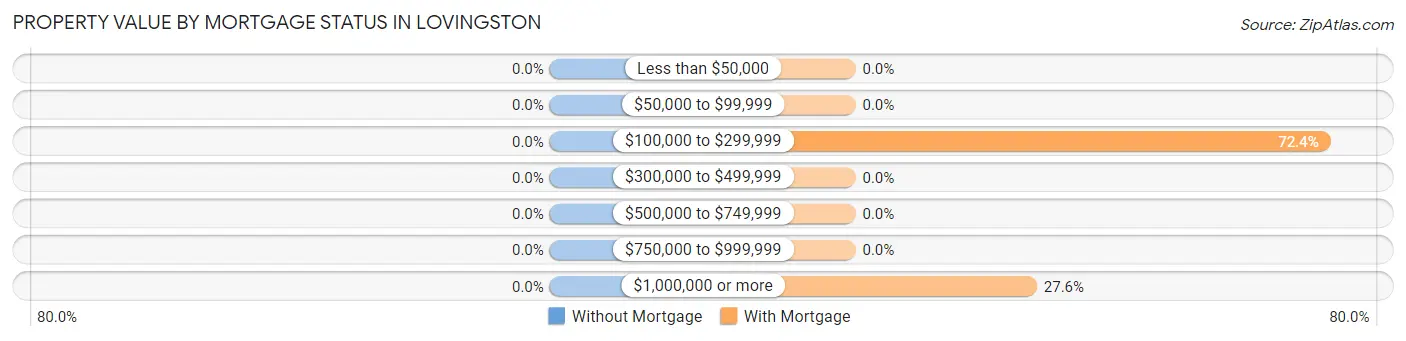
| Property Value | Without Mortgage | With Mortgage |
| Less than $50,000 | 0 (0.0%) | 0 (0.0%) |
| $50,000 to $99,999 | 0 (0.0%) | 0 (0.0%) |
| $100,000 to $299,999 | 0 (0.0%) | 55 (72.4%) |
| $300,000 to $499,999 | 0 (0.0%) | 0 (0.0%) |
| $500,000 to $749,999 | 0 (0.0%) | 0 (0.0%) |
| $750,000 to $999,999 | 0 (0.0%) | 0 (0.0%) |
| $1,000,000 or more | 0 (0.0%) | 21 (27.6%) |
| Total | 0 (0.0%) | 76 (100.0%) |
Household Income by Mortgage Status in Lovingston
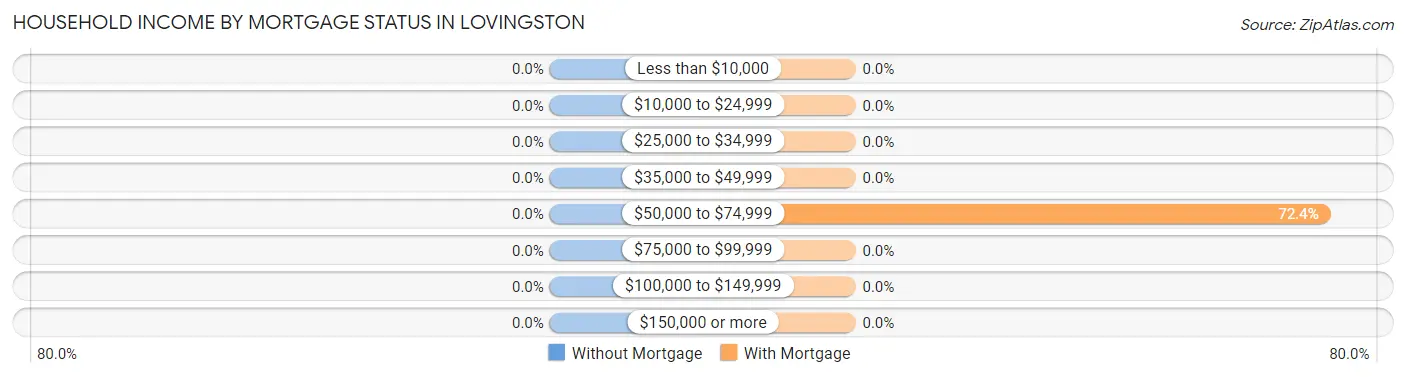
| Household Income | Without Mortgage | With Mortgage |
| Less than $10,000 | 0 (0.0%) | 0 (0.0%) |
| $10,000 to $24,999 | 0 (0.0%) | 0 (0.0%) |
| $25,000 to $34,999 | 0 (0.0%) | 0 (0.0%) |
| $35,000 to $49,999 | 0 (0.0%) | 0 (0.0%) |
| $50,000 to $74,999 | 0 (0.0%) | 55 (72.4%) |
| $75,000 to $99,999 | 0 (0.0%) | 0 (0.0%) |
| $100,000 to $149,999 | 0 (0.0%) | 0 (0.0%) |
| $150,000 or more | 0 (0.0%) | 0 (0.0%) |
| Total | 0 (0.0%) | 76 (100.0%) |
Property Value to Household Income Ratio in Lovingston
| Value-to-Income Ratio | Without Mortgage | With Mortgage |
| Less than 2.0x | 0 (0.0%) | 0 (0.0%) |
| 2.0x to 2.9x | 0 (0.0%) | 0 (0.0%) |
| 3.0x to 3.9x | 0 (0.0%) | 0 (0.0%) |
| 4.0x or more | 0 (0.0%) | 0 (0.0%) |
| Total | 0 (0.0%) | 76 (100.0%) |
Real Estate Taxes by Mortgage Status in Lovingston
| Property Taxes | Without Mortgage | With Mortgage |
| Less than $800 | 0 (0.0%) | 0 (0.0%) |
| $800 to $1,499 | 0 (0.0%) | 0 (0.0%) |
| $800 to $1,499 | 0 (0.0%) | 0 (0.0%) |
| Total | 0 (0.0%) | 76 (100.0%) |
Health & Disability in Lovingston
Health Insurance Coverage by Age in Lovingston
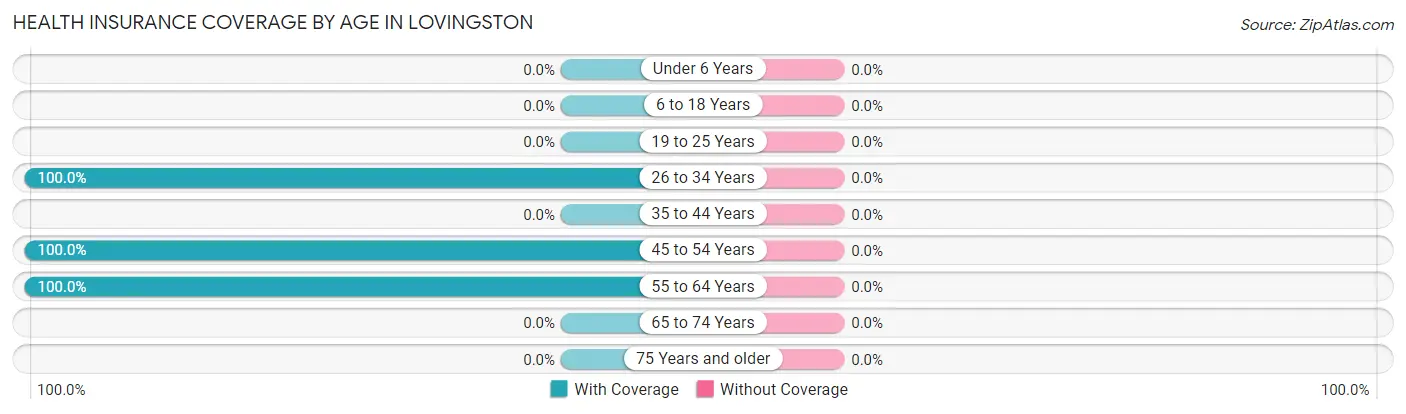
| Age Bracket | With Coverage | Without Coverage |
| Under 6 Years | 0 (0.0%) | 0 (0.0%) |
| 6 to 18 Years | 0 (0.0%) | 0 (0.0%) |
| 19 to 25 Years | 0 (0.0%) | 0 (0.0%) |
| 26 to 34 Years | 71 (100.0%) | 0 (0.0%) |
| 35 to 44 Years | 0 (0.0%) | 0 (0.0%) |
| 45 to 54 Years | 35 (100.0%) | 0 (0.0%) |
| 55 to 64 Years | 235 (100.0%) | 0 (0.0%) |
| 65 to 74 Years | 0 (0.0%) | 0 (0.0%) |
| 75 Years and older | 0 (0.0%) | 0 (0.0%) |
| Total | 341 (100.0%) | 0 (0.0%) |
Health Insurance Coverage by Citizenship Status in Lovingston
| Citizenship Status | With Coverage | Without Coverage |
| Native Born | 0 (0.0%) | 0 (0.0%) |
| Foreign Born, Citizen | 0 (0.0%) | 0 (0.0%) |
| Foreign Born, not a Citizen | 0 (0.0%) | 0 (0.0%) |
Health Insurance Coverage by Household Income in Lovingston
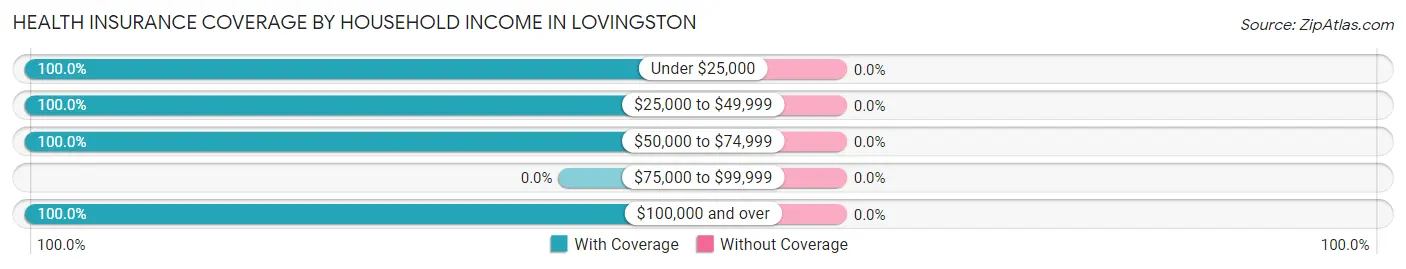
| Household Income | With Coverage | Without Coverage |
| Under $25,000 | 131 (100.0%) | 0 (0.0%) |
| $25,000 to $49,999 | 99 (100.0%) | 0 (0.0%) |
| $50,000 to $74,999 | 71 (100.0%) | 0 (0.0%) |
| $75,000 to $99,999 | 0 (0.0%) | 0 (0.0%) |
| $100,000 and over | 38 (100.0%) | 0 (0.0%) |
Public vs Private Health Insurance Coverage by Age in Lovingston
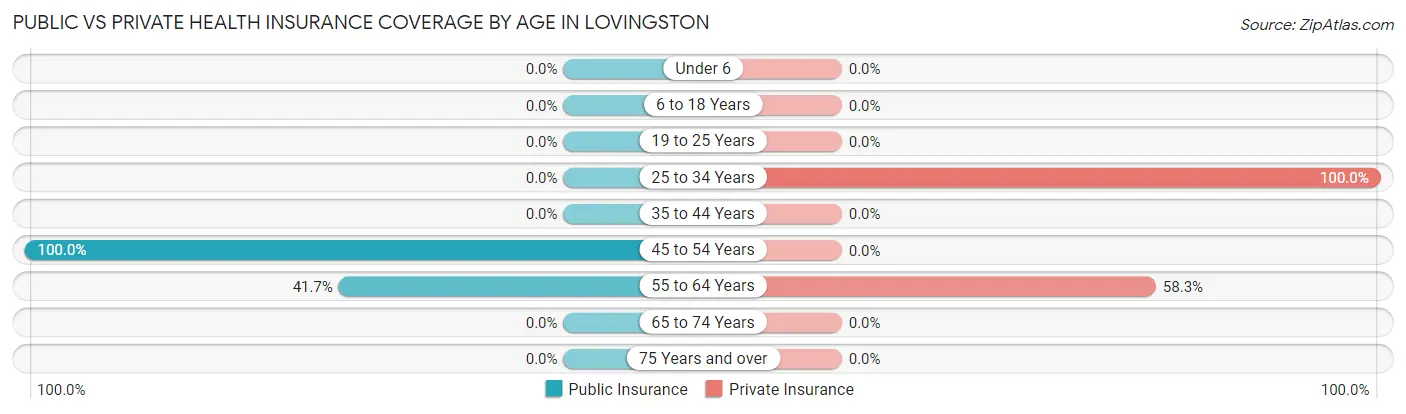
| Age Bracket | Public Insurance | Private Insurance |
| Under 6 | 0 (0.0%) | 0 (0.0%) |
| 6 to 18 Years | 0 (0.0%) | 0 (0.0%) |
| 19 to 25 Years | 0 (0.0%) | 0 (0.0%) |
| 25 to 34 Years | 0 (0.0%) | 71 (100.0%) |
| 35 to 44 Years | 0 (0.0%) | 0 (0.0%) |
| 45 to 54 Years | 35 (100.0%) | 0 (0.0%) |
| 55 to 64 Years | 98 (41.7%) | 137 (58.3%) |
| 65 to 74 Years | 0 (0.0%) | 0 (0.0%) |
| 75 Years and over | 0 (0.0%) | 0 (0.0%) |
| Total | 133 (39.0%) | 208 (61.0%) |
Disability Status by Sex by Age in Lovingston
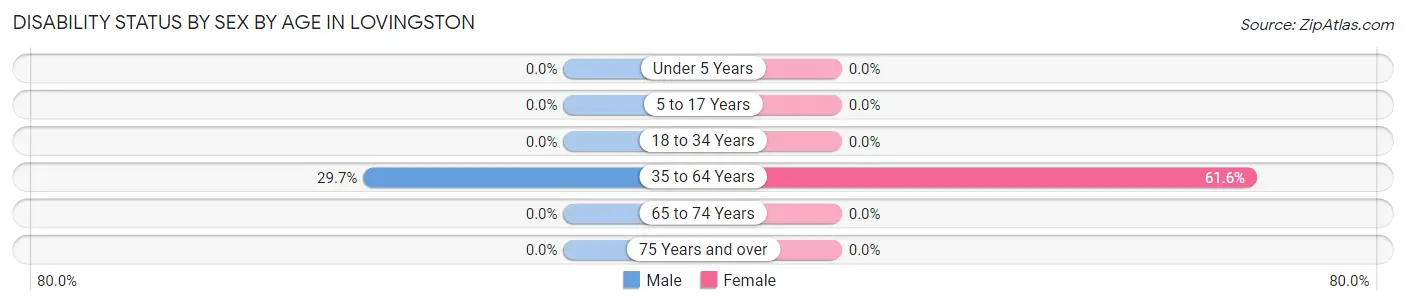
| Age Bracket | Male | Female |
| Under 5 Years | 0 (0.0%) | 0 (0.0%) |
| 5 to 17 Years | 0 (0.0%) | 0 (0.0%) |
| 18 to 34 Years | 0 (0.0%) | 0 (0.0%) |
| 35 to 64 Years | 33 (29.7%) | 98 (61.6%) |
| 65 to 74 Years | 0 (0.0%) | 0 (0.0%) |
| 75 Years and over | 0 (0.0%) | 0 (0.0%) |
Disability Class by Sex by Age in Lovingston
Disability Class: Hearing Difficulty
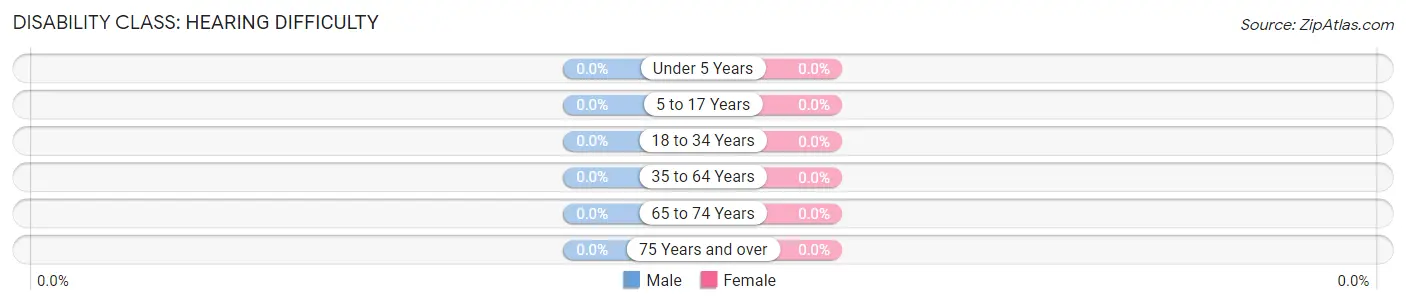
| Age Bracket | Male | Female |
| Under 5 Years | 0 (0.0%) | 0 (0.0%) |
| 5 to 17 Years | 0 (0.0%) | 0 (0.0%) |
| 18 to 34 Years | 0 (0.0%) | 0 (0.0%) |
| 35 to 64 Years | 0 (0.0%) | 0 (0.0%) |
| 65 to 74 Years | 0 (0.0%) | 0 (0.0%) |
| 75 Years and over | 0 (0.0%) | 0 (0.0%) |
Disability Class: Vision Difficulty
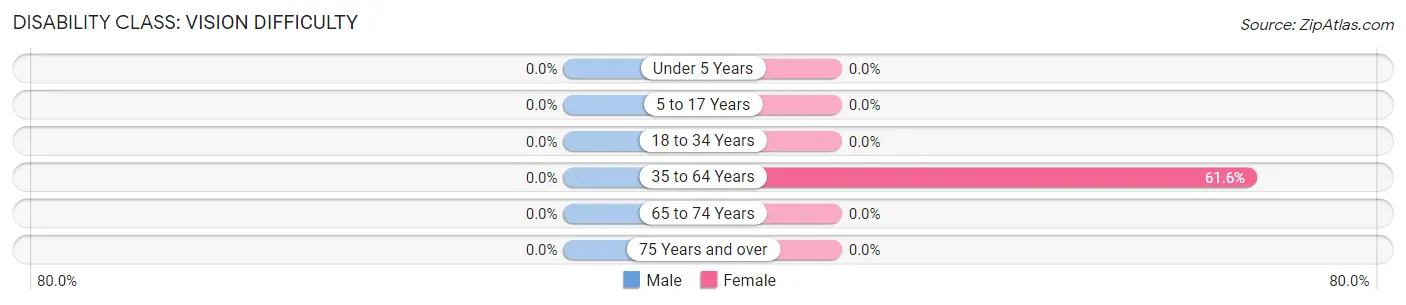
| Age Bracket | Male | Female |
| Under 5 Years | 0 (0.0%) | 0 (0.0%) |
| 5 to 17 Years | 0 (0.0%) | 0 (0.0%) |
| 18 to 34 Years | 0 (0.0%) | 0 (0.0%) |
| 35 to 64 Years | 0 (0.0%) | 98 (61.6%) |
| 65 to 74 Years | 0 (0.0%) | 0 (0.0%) |
| 75 Years and over | 0 (0.0%) | 0 (0.0%) |
Disability Class: Cognitive Difficulty
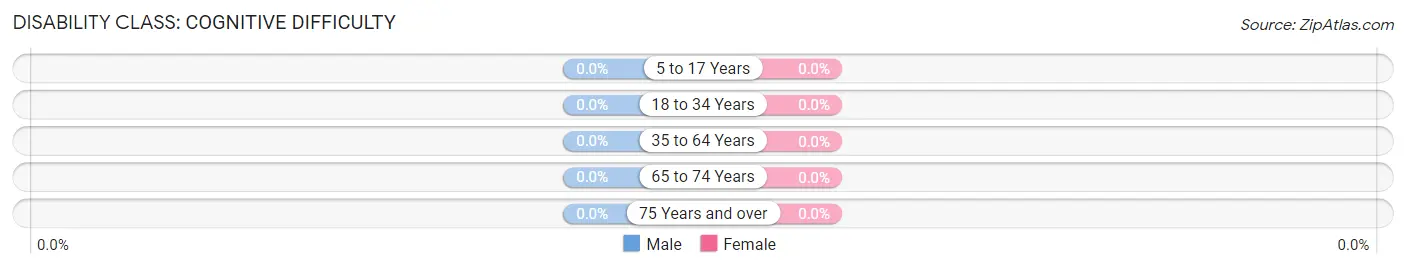
| Age Bracket | Male | Female |
| 5 to 17 Years | 0 (0.0%) | 0 (0.0%) |
| 18 to 34 Years | 0 (0.0%) | 0 (0.0%) |
| 35 to 64 Years | 0 (0.0%) | 0 (0.0%) |
| 65 to 74 Years | 0 (0.0%) | 0 (0.0%) |
| 75 Years and over | 0 (0.0%) | 0 (0.0%) |
Disability Class: Ambulatory Difficulty
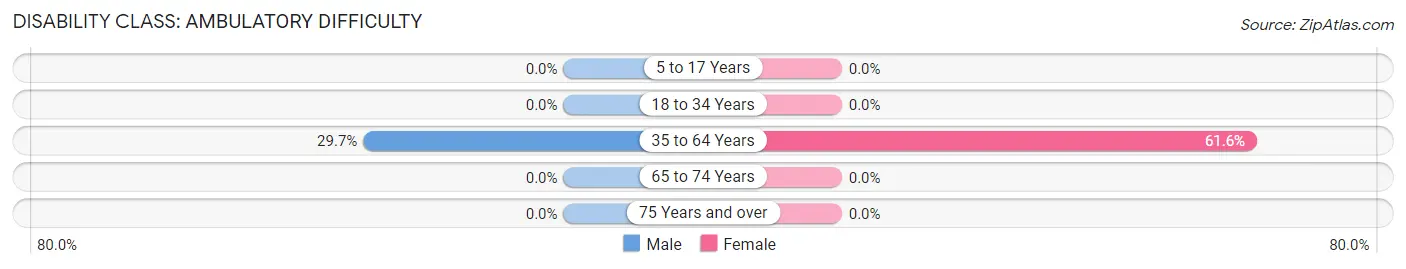
| Age Bracket | Male | Female |
| 5 to 17 Years | 0 (0.0%) | 0 (0.0%) |
| 18 to 34 Years | 0 (0.0%) | 0 (0.0%) |
| 35 to 64 Years | 33 (29.7%) | 98 (61.6%) |
| 65 to 74 Years | 0 (0.0%) | 0 (0.0%) |
| 75 Years and over | 0 (0.0%) | 0 (0.0%) |
Disability Class: Self-Care Difficulty
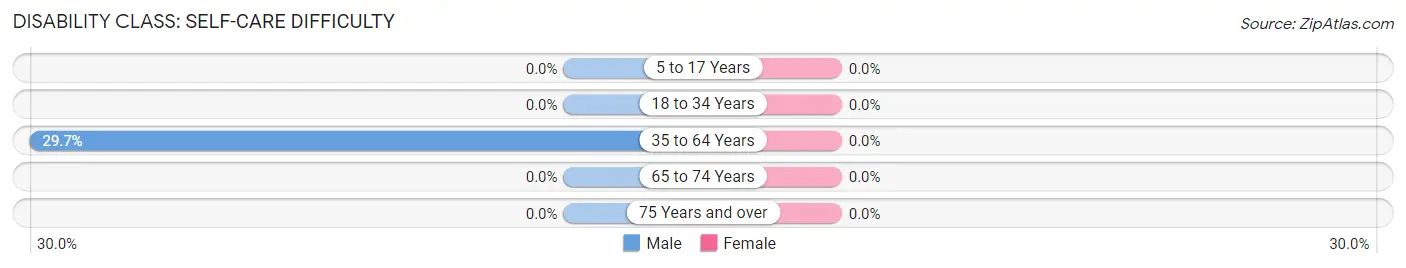
| Age Bracket | Male | Female |
| 5 to 17 Years | 0 (0.0%) | 0 (0.0%) |
| 18 to 34 Years | 0 (0.0%) | 0 (0.0%) |
| 35 to 64 Years | 33 (29.7%) | 0 (0.0%) |
| 65 to 74 Years | 0 (0.0%) | 0 (0.0%) |
| 75 Years and over | 0 (0.0%) | 0 (0.0%) |
Technology Access in Lovingston
Computing Device Access in Lovingston
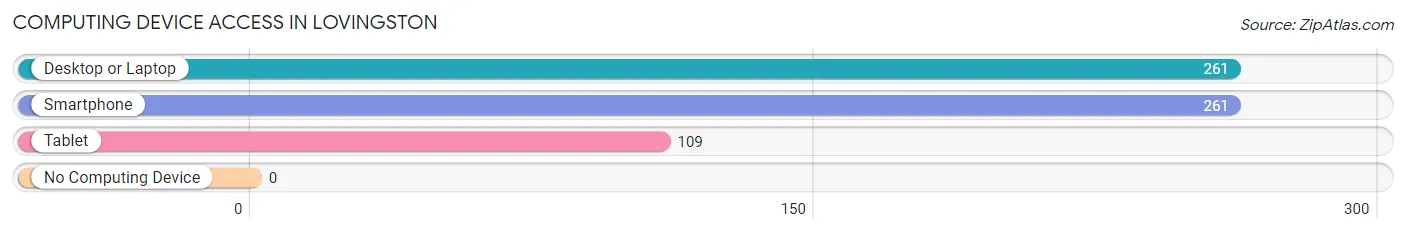
| Device Type | # Households | % Households |
| Desktop or Laptop | 261 | 100.0% |
| Smartphone | 261 | 100.0% |
| Tablet | 109 | 41.8% |
| No Computing Device | 0 | 0.0% |
| Total | 261 | 100.0% |
Internet Access in Lovingston
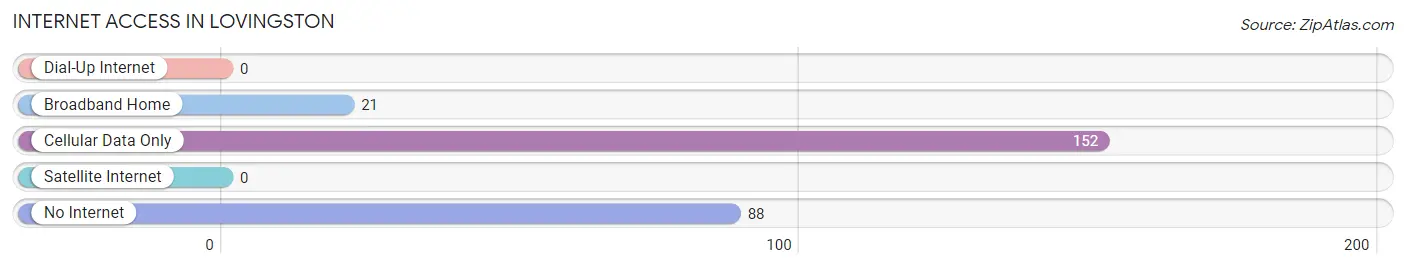
| Internet Type | # Households | % Households |
| Dial-Up Internet | 0 | 0.0% |
| Broadband Home | 21 | 8.1% |
| Cellular Data Only | 152 | 58.2% |
| Satellite Internet | 0 | 0.0% |
| No Internet | 88 | 33.7% |
| Total | 261 | 100.0% |
Lovingston Summary
Lovingston is a small town located in Nelson County, Virginia, United States. It is situated in the foothills of the Blue Ridge Mountains, about 20 miles east of Charlottesville. The population was 1,368 at the 2010 census.
History
Lovingston was founded in 1793 by William Loving, a Revolutionary War veteran. He named the town after himself and it was incorporated in 1810. The town was a major stop on the Virginia Central Railroad, which connected Richmond to the Shenandoah Valley. The railroad was a major factor in the town's growth and development.
In the late 19th century, Lovingston was a major center for the production of apples. The town was home to several large apple orchards and was known as the "Apple Capital of Virginia." The town was also home to several other industries, including a sawmill, a gristmill, and a tannery.
Geography
Lovingston is located in the foothills of the Blue Ridge Mountains in central Virginia. It is situated in Nelson County, about 20 miles east of Charlottesville. The town is located along U.S. Route 29, which connects it to Charlottesville and Lynchburg.
The town is situated on the banks of the Tye River, which flows through the town and is a major tributary of the James River. The town is surrounded by rolling hills and forests, and is located in a rural area.
Economy
Lovingston's economy is largely based on agriculture and tourism. The town is home to several large apple orchards, and is known as the "Apple Capital of Virginia." The town is also home to several wineries, which attract tourists from all over the state.
The town is also home to several small businesses, including restaurants, shops, and other services. The town is also home to a large industrial park, which is home to several manufacturing and distribution companies.
Demographics
As of the 2010 census, Lovingston had a population of 1,368. The racial makeup of the town was 92.3% White, 4.2% African American, 0.3% Native American, 0.7% Asian, 0.1% Pacific Islander, 0.7% from other races, and 1.7% from two or more races. Hispanic or Latino of any race were 2.2% of the population.
The median income for a household in the town was $37,500, and the median income for a family was $45,000. The per capita income for the town was $20,845. About 11.2% of families and 14.2% of the population were below the poverty line, including 18.2% of those under age 18 and 8.3% of those age 65 or over.
Common Questions
What is Per Capita Income in Lovingston?
Per Capita income in Lovingston is $32,424.
What is Inequality or Gini Index in Lovingston?
Inequality or Gini Index in Lovingston is 0.56.
What is the Total Population of Lovingston?
Total Population of Lovingston is 382.
What is the Total Male Population of Lovingston?
Total Male Population of Lovingston is 144.
What is the Total Female Population of Lovingston?
Total Female Population of Lovingston is 238.
What is the Ratio of Males per 100 Females in Lovingston?
There are 60.50 Males per 100 Females in Lovingston.
What is the Ratio of Females per 100 Males in Lovingston?
There are 165.28 Females per 100 Males in Lovingston.
What is the Median Population Age in Lovingston?
Median Population Age in Lovingston is 58.2 Years.
What is the Average Family Size in Lovingston
Average Family Size in Lovingston is 1.8 People.
What is the Average Household Size in Lovingston
Average Household Size in Lovingston is 1.3 People.
How Large is the Labor Force in Lovingston?
There are 153 People in the Labor Forcein in Lovingston.
What is the Percentage of People in the Labor Force in Lovingston?
40.1% of People are in the Labor Force in Lovingston.