Yogaville, VA Map & Demographics
Yogaville Map
Yogaville Overview
$30,203
PER CAPITA INCOME
$93,068
AVG FAMILY INCOME
$39,028
AVG HOUSEHOLD INCOME
21.6%
WAGE / INCOME GAP [ % ]
78.4¢/ $1
WAGE / INCOME GAP [ $ ]
0.40
INEQUALITY / GINI INDEX
144
TOTAL POPULATION
65
MALE POPULATION
79
FEMALE POPULATION
82.28
MALES / 100 FEMALES
121.54
FEMALES / 100 MALES
67.2
MEDIAN AGE
2.1
AVG FAMILY SIZE
1.6
AVG HOUSEHOLD SIZE
65
LABOR FORCE [ PEOPLE ]
45.8%
PERCENT IN LABOR FORCE
Income in Yogaville
Income Overview in Yogaville
Per Capita Income in Yogaville is $30,203, while median incomes of families and households are $93,068 and $39,028 respectively.
| Characteristic | Number | Measure |
| Per Capita Income | 144 | $30,203 |
| Median Family Income | 40 | $93,068 |
| Mean Family Income | 40 | $76,403 |
| Median Household Income | 81 | $39,028 |
| Mean Household Income | 81 | $48,189 |
| Income Deficit | 40 | $0 |
| Wage / Income Gap (%) | 144 | 21.61% |
| Wage / Income Gap ($) | 144 | 78.39¢ per $1 |
| Gini / Inequality Index | 144 | 0.40 |
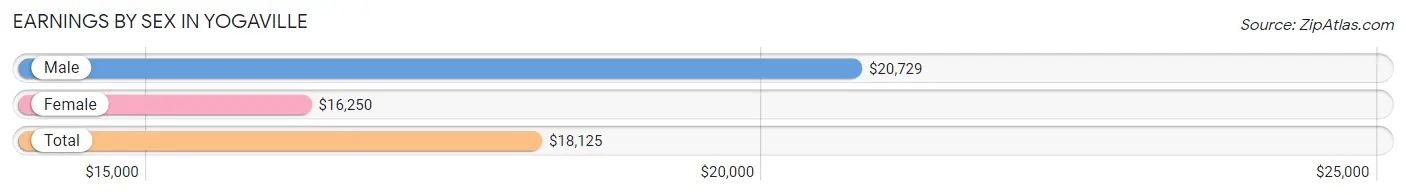
Earnings by Sex in Yogaville
Average Earnings in Yogaville are $18,125, $20,729 for men and $16,250 for women, a difference of 21.6%.
| Sex | Number | Average Earnings |
| Male | 35 (47.9%) | $20,729 |
| Female | 38 (52.0%) | $16,250 |
| Total | 73 (100.0%) | $18,125 |
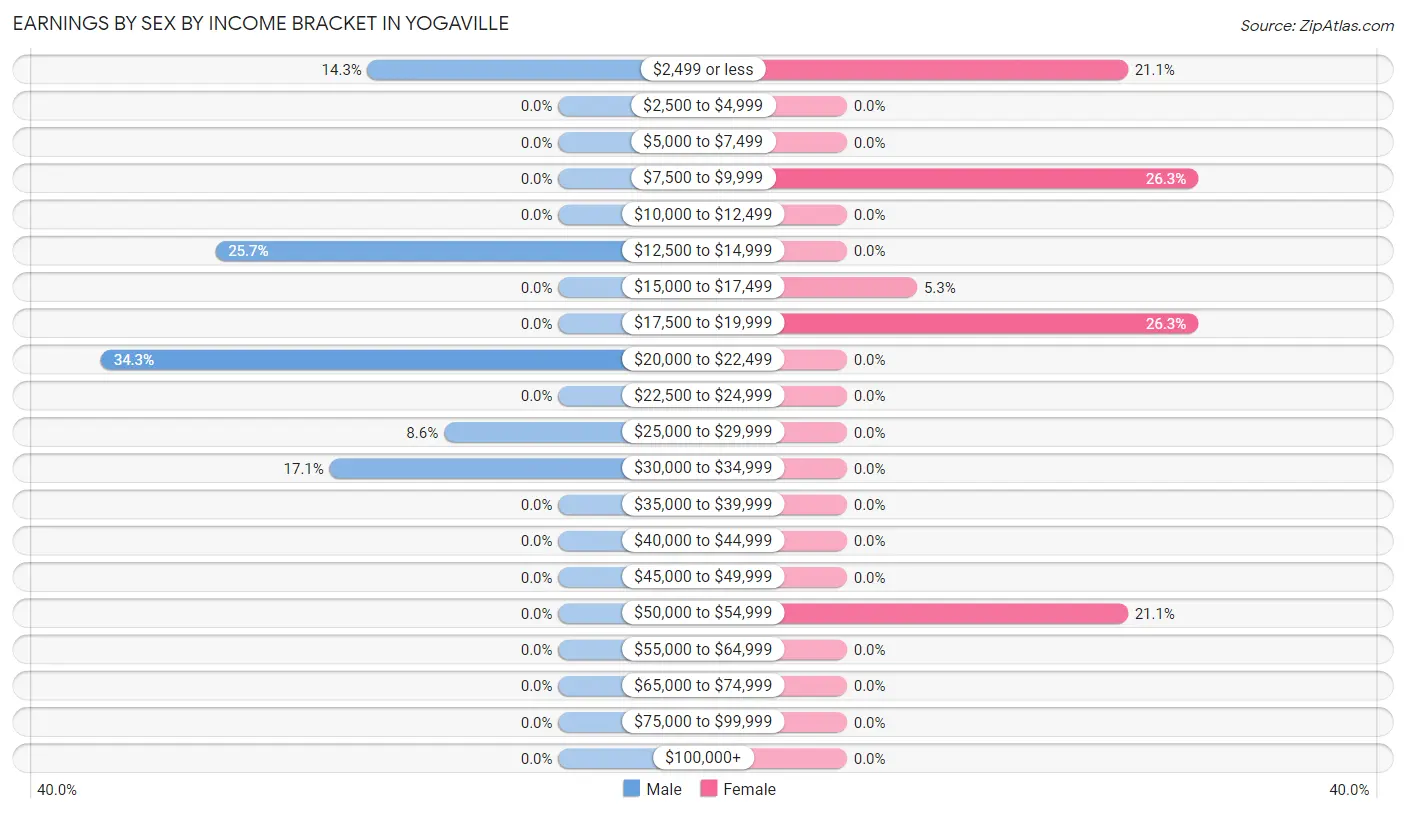
Earnings by Sex by Income Bracket in Yogaville
The most common earnings brackets in Yogaville are $20,000 to $22,499 for men (12 | 34.3%) and $7,500 to $9,999 for women (10 | 26.3%).
| Income | Male | Female |
| $2,499 or less | 5 (14.3%) | 8 (21.0%) |
| $2,500 to $4,999 | 0 (0.0%) | 0 (0.0%) |
| $5,000 to $7,499 | 0 (0.0%) | 0 (0.0%) |
| $7,500 to $9,999 | 0 (0.0%) | 10 (26.3%) |
| $10,000 to $12,499 | 0 (0.0%) | 0 (0.0%) |
| $12,500 to $14,999 | 9 (25.7%) | 0 (0.0%) |
| $15,000 to $17,499 | 0 (0.0%) | 2 (5.3%) |
| $17,500 to $19,999 | 0 (0.0%) | 10 (26.3%) |
| $20,000 to $22,499 | 12 (34.3%) | 0 (0.0%) |
| $22,500 to $24,999 | 0 (0.0%) | 0 (0.0%) |
| $25,000 to $29,999 | 3 (8.6%) | 0 (0.0%) |
| $30,000 to $34,999 | 6 (17.1%) | 0 (0.0%) |
| $35,000 to $39,999 | 0 (0.0%) | 0 (0.0%) |
| $40,000 to $44,999 | 0 (0.0%) | 0 (0.0%) |
| $45,000 to $49,999 | 0 (0.0%) | 0 (0.0%) |
| $50,000 to $54,999 | 0 (0.0%) | 8 (21.0%) |
| $55,000 to $64,999 | 0 (0.0%) | 0 (0.0%) |
| $65,000 to $74,999 | 0 (0.0%) | 0 (0.0%) |
| $75,000 to $99,999 | 0 (0.0%) | 0 (0.0%) |
| $100,000+ | 0 (0.0%) | 0 (0.0%) |
| Total | 35 (100.0%) | 38 (100.0%) |
Earnings by Sex by Educational Attainment in Yogaville
| Educational Attainment | Male Income | Female Income |
| Less than High School | - | - |
| High School Diploma | - | - |
| College or Associate's Degree | - | - |
| Bachelor's Degree | - | - |
| Graduate Degree | - | - |
| Total | $20,417 | $0 |
Family Income in Yogaville
Family Income Brackets in Yogaville
According to the Yogaville family income data, there are 22 families falling into the $75,000 to $99,999 income range, which is the most common income bracket and makes up 55.0% of all families.
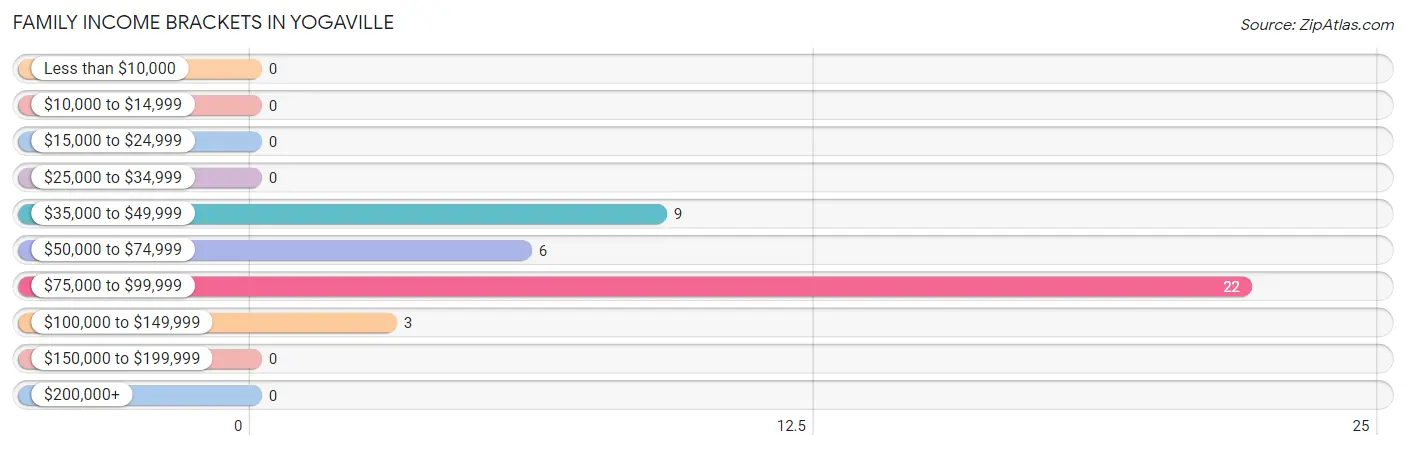
| Income Bracket | # Families | % Families |
| Less than $10,000 | 0 | 0.0% |
| $10,000 to $14,999 | 0 | 0.0% |
| $15,000 to $24,999 | 0 | 0.0% |
| $25,000 to $34,999 | 0 | 0.0% |
| $35,000 to $49,999 | 9 | 22.5% |
| $50,000 to $74,999 | 6 | 15.0% |
| $75,000 to $99,999 | 22 | 55.0% |
| $100,000 to $149,999 | 3 | 7.5% |
| $150,000 to $199,999 | 0 | 0.0% |
| $200,000+ | 0 | 0.0% |
Family Income by Famaliy Size in Yogaville
2-person families (40 | 100.0%) account for the highest median family income in Yogaville with $93,068 per family, while 2-person families (40 | 100.0%) have the highest median income of $46,534 per family member.
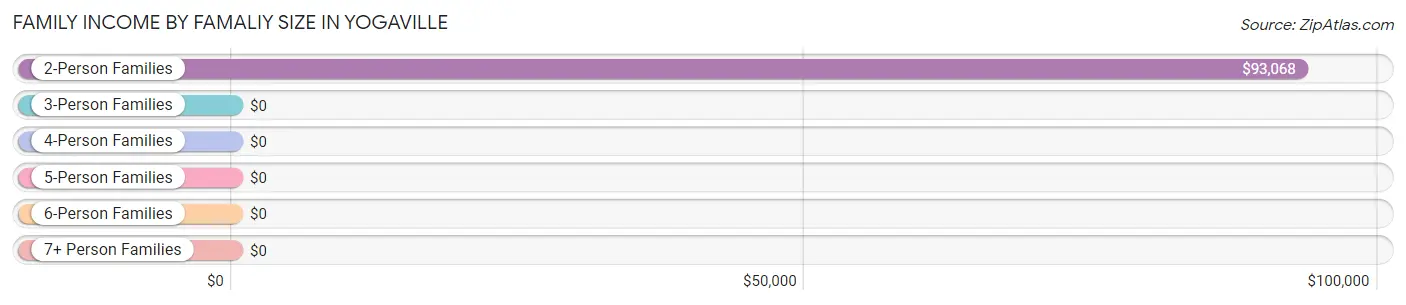
| Income Bracket | # Families | Median Income |
| 2-Person Families | 40 (100.0%) | $93,068 |
| 3-Person Families | 0 (0.0%) | $0 |
| 4-Person Families | 0 (0.0%) | $0 |
| 5-Person Families | 0 (0.0%) | $0 |
| 6-Person Families | 0 (0.0%) | $0 |
| 7+ Person Families | 0 (0.0%) | $0 |
| Total | 40 (100.0%) | $93,068 |
Family Income by Number of Earners in Yogaville
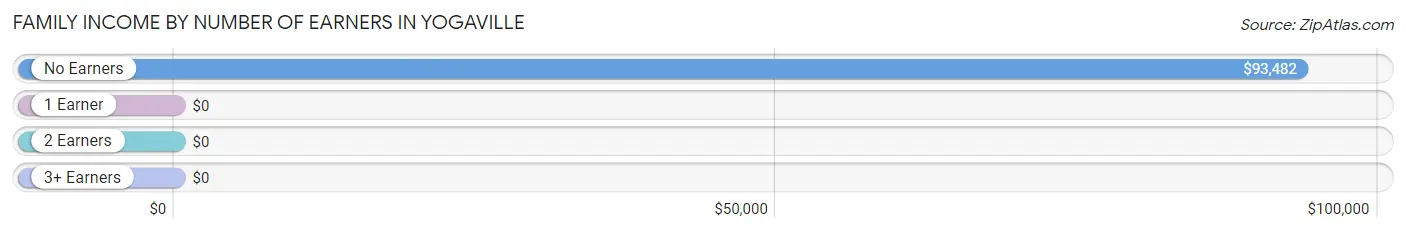
| Number of Earners | # Families | Median Income |
| No Earners | 23 (57.5%) | $93,482 |
| 1 Earner | 9 (22.5%) | $0 |
| 2 Earners | 8 (20.0%) | $0 |
| 3+ Earners | 0 (0.0%) | $0 |
| Total | 40 (100.0%) | $93,068 |
Household Income in Yogaville
Household Income Brackets in Yogaville
With 22 households falling in the category, the $75,000 to $99,999 income range is the most frequent in Yogaville, accounting for 27.2% of all households.
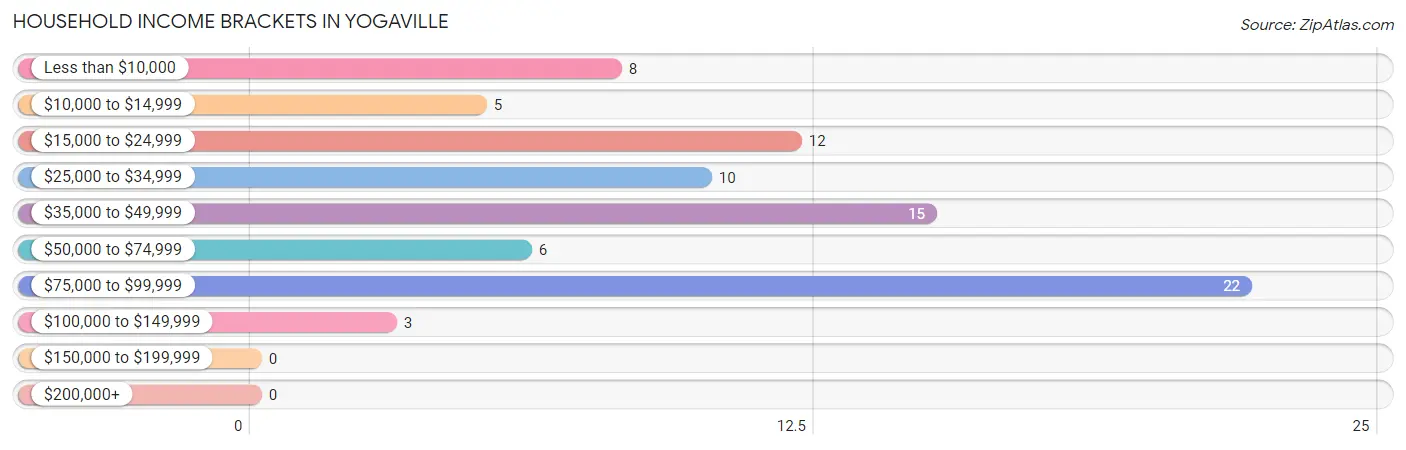
| Income Bracket | # Households | % Households |
| Less than $10,000 | 8 | 9.9% |
| $10,000 to $14,999 | 5 | 6.2% |
| $15,000 to $24,999 | 12 | 14.8% |
| $25,000 to $34,999 | 10 | 12.3% |
| $35,000 to $49,999 | 15 | 18.5% |
| $50,000 to $74,999 | 6 | 7.4% |
| $75,000 to $99,999 | 22 | 27.2% |
| $100,000 to $149,999 | 3 | 3.7% |
| $150,000 to $199,999 | 0 | 0.0% |
| $200,000+ | 0 | 0.0% |
Household Income by Householder Age in Yogaville
The median household income in Yogaville is $39,028, with the highest median household income of $38,889 found in the 45 to 64 years age bracket for the primary householder. A total of 36 households (44.4%) fall into this category.
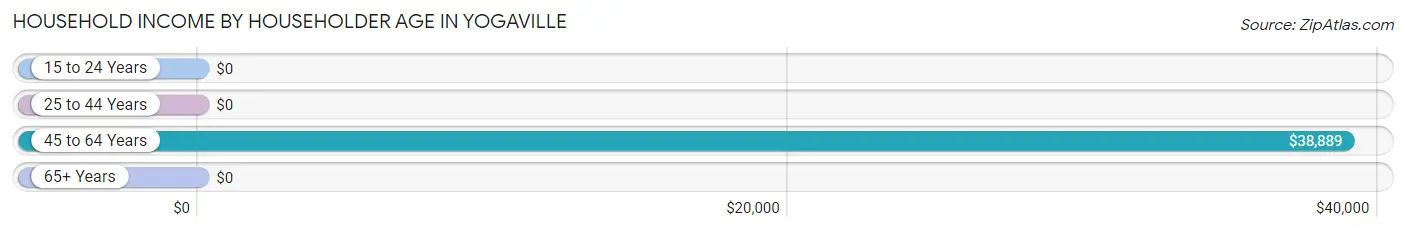
| Income Bracket | # Households | Median Income |
| 15 to 24 Years | 0 (0.0%) | $0 |
| 25 to 44 Years | 12 (14.8%) | $0 |
| 45 to 64 Years | 36 (44.4%) | $38,889 |
| 65+ Years | 33 (40.7%) | $0 |
| Total | 81 (100.0%) | $39,028 |
Poverty in Yogaville
Income Below Poverty by Sex and Age in Yogaville
With 7.9% poverty level for males and 22.8% for females among the residents of Yogaville, 55 to 64 year old males and 18 to 24 year old females are the most vulnerable to poverty, with 5 males (20.0%) and 10 females (100.0%) in their respective age groups living below the poverty level.
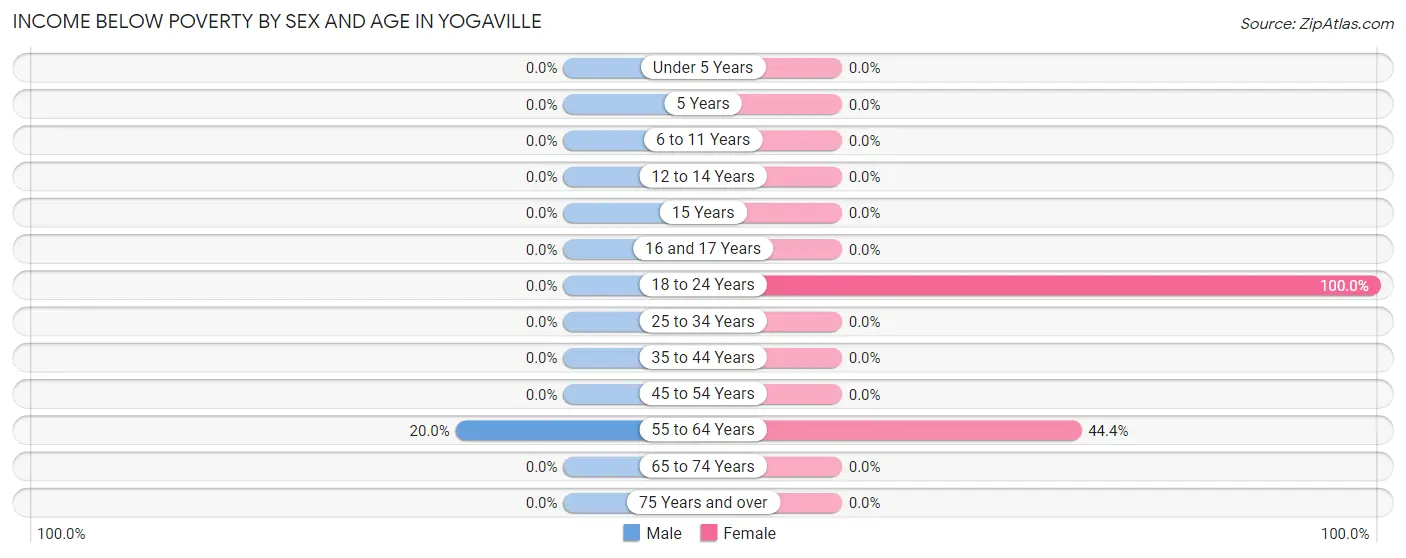
| Age Bracket | Male | Female |
| Under 5 Years | 0 (0.0%) | 0 (0.0%) |
| 5 Years | 0 (0.0%) | 0 (0.0%) |
| 6 to 11 Years | 0 (0.0%) | 0 (0.0%) |
| 12 to 14 Years | 0 (0.0%) | 0 (0.0%) |
| 15 Years | 0 (0.0%) | 0 (0.0%) |
| 16 and 17 Years | 0 (0.0%) | 0 (0.0%) |
| 18 to 24 Years | 0 (0.0%) | 10 (100.0%) |
| 25 to 34 Years | 0 (0.0%) | 0 (0.0%) |
| 35 to 44 Years | 0 (0.0%) | 0 (0.0%) |
| 45 to 54 Years | 0 (0.0%) | 0 (0.0%) |
| 55 to 64 Years | 5 (20.0%) | 8 (44.4%) |
| 65 to 74 Years | 0 (0.0%) | 0 (0.0%) |
| 75 Years and over | 0 (0.0%) | 0 (0.0%) |
| Total | 5 (7.9%) | 18 (22.8%) |
Income Above Poverty by Sex and Age in Yogaville
According to the poverty statistics in Yogaville, males aged 18 to 24 years and females aged 65 to 74 years are the age groups that are most secure financially, with 100.0% of males and 100.0% of females in these age groups living above the poverty line.
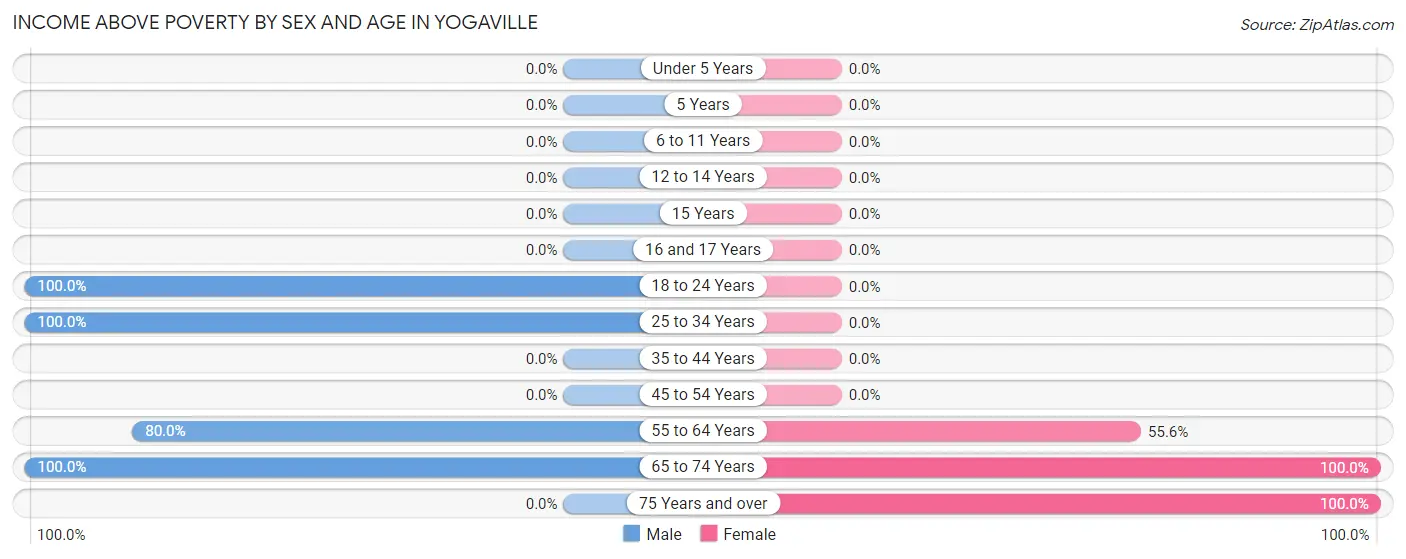
| Age Bracket | Male | Female |
| Under 5 Years | 0 (0.0%) | 0 (0.0%) |
| 5 Years | 0 (0.0%) | 0 (0.0%) |
| 6 to 11 Years | 0 (0.0%) | 0 (0.0%) |
| 12 to 14 Years | 0 (0.0%) | 0 (0.0%) |
| 15 Years | 0 (0.0%) | 0 (0.0%) |
| 16 and 17 Years | 0 (0.0%) | 0 (0.0%) |
| 18 to 24 Years | 3 (100.0%) | 0 (0.0%) |
| 25 to 34 Years | 12 (100.0%) | 0 (0.0%) |
| 35 to 44 Years | 0 (0.0%) | 0 (0.0%) |
| 45 to 54 Years | 0 (0.0%) | 0 (0.0%) |
| 55 to 64 Years | 20 (80.0%) | 10 (55.6%) |
| 65 to 74 Years | 23 (100.0%) | 37 (100.0%) |
| 75 Years and over | 0 (0.0%) | 14 (100.0%) |
| Total | 58 (92.1%) | 61 (77.2%) |
Income Below Poverty Among Married-Couple Families in Yogaville
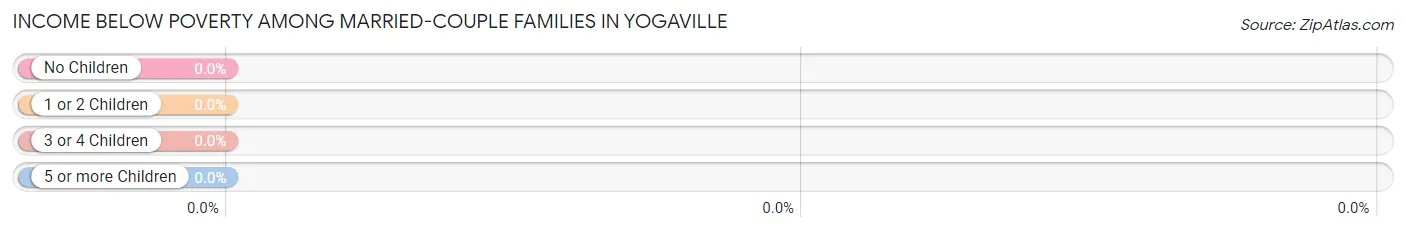
| Children | Above Poverty | Below Poverty |
| No Children | 31 (100.0%) | 0 (0.0%) |
| 1 or 2 Children | 0 (0.0%) | 0 (0.0%) |
| 3 or 4 Children | 0 (0.0%) | 0 (0.0%) |
| 5 or more Children | 0 (0.0%) | 0 (0.0%) |
| Total | 31 (100.0%) | 0 (0.0%) |
Income Below Poverty Among Single-Parent Households in Yogaville
| Children | Single Father | Single Mother |
| No Children | 0 (0.0%) | 0 (0.0%) |
| 1 or 2 Children | 0 (0.0%) | 0 (0.0%) |
| 3 or 4 Children | 0 (0.0%) | 0 (0.0%) |
| 5 or more Children | 0 (0.0%) | 0 (0.0%) |
| Total | 0 (0.0%) | 0 (0.0%) |
Income Below Poverty Among Married-Couple vs Single-Parent Households in Yogaville
| Children | Married-Couple Families | Single-Parent Households |
| No Children | 0 (0.0%) | 0 (0.0%) |
| 1 or 2 Children | 0 (0.0%) | 0 (0.0%) |
| 3 or 4 Children | 0 (0.0%) | 0 (0.0%) |
| 5 or more Children | 0 (0.0%) | 0 (0.0%) |
| Total | 0 (0.0%) | 0 (0.0%) |
Race in Yogaville
The most populous races in Yogaville are White / Caucasian (139 | 96.5%), Hispanic or Latino (7 | 4.9%), and Native / Alaskan (5 | 3.5%).
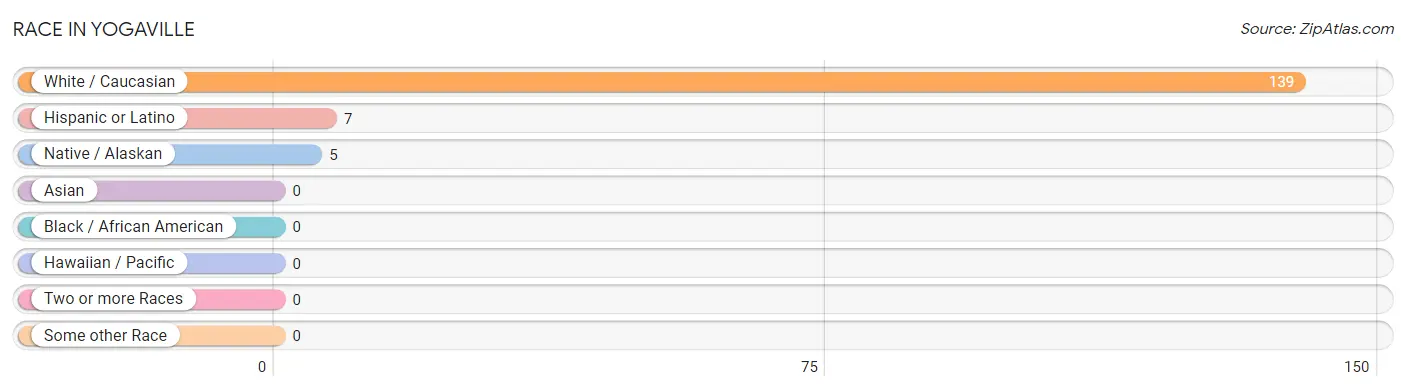
| Race | # Population | % Population |
| Asian | 0 | 0.0% |
| Black / African American | 0 | 0.0% |
| Hawaiian / Pacific | 0 | 0.0% |
| Hispanic or Latino | 7 | 4.9% |
| Native / Alaskan | 5 | 3.5% |
| White / Caucasian | 139 | 96.5% |
| Two or more Races | 0 | 0.0% |
| Some other Race | 0 | 0.0% |
| Total | 144 | 100.0% |
Ancestry in Yogaville
The most populous ancestries reported in Yogaville are Italian (54 | 37.5%), American (21 | 14.6%), German (20 | 13.9%), Irish (14 | 9.7%), and Austrian (10 | 6.9%), together accounting for 82.6% of all Yogaville residents.
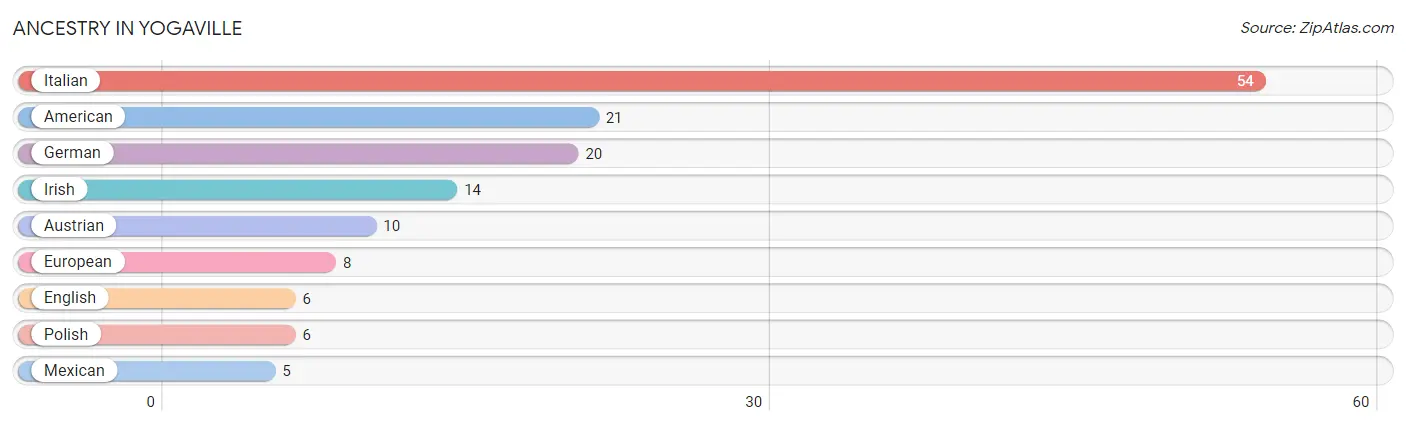
| Ancestry | # Population | % Population |
| American | 21 | 14.6% |
| Austrian | 10 | 6.9% |
| English | 6 | 4.2% |
| European | 8 | 5.6% |
| German | 20 | 13.9% |
| Irish | 14 | 9.7% |
| Italian | 54 | 37.5% |
| Mexican | 5 | 3.5% |
| Polish | 6 | 4.2% | View All 9 Rows |
Immigrants in Yogaville

| Immigration Origin | # Population | % Population | View All 0 Rows |
Sex and Age in Yogaville
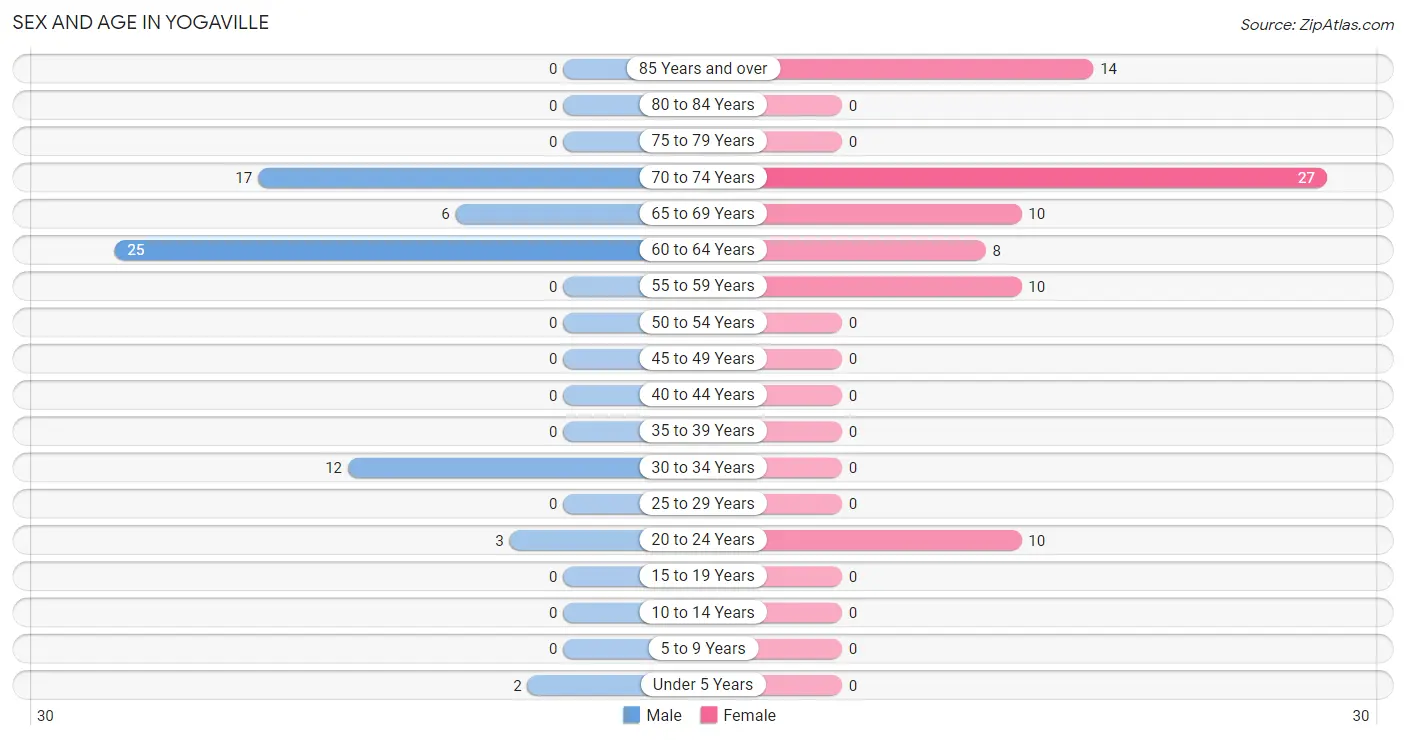
Sex and Age in Yogaville
The most populous age groups in Yogaville are 60 to 64 Years (25 | 38.5%) for men and 70 to 74 Years (27 | 34.2%) for women.
| Age Bracket | Male | Female |
| Under 5 Years | 2 (3.1%) | 0 (0.0%) |
| 5 to 9 Years | 0 (0.0%) | 0 (0.0%) |
| 10 to 14 Years | 0 (0.0%) | 0 (0.0%) |
| 15 to 19 Years | 0 (0.0%) | 0 (0.0%) |
| 20 to 24 Years | 3 (4.6%) | 10 (12.7%) |
| 25 to 29 Years | 0 (0.0%) | 0 (0.0%) |
| 30 to 34 Years | 12 (18.5%) | 0 (0.0%) |
| 35 to 39 Years | 0 (0.0%) | 0 (0.0%) |
| 40 to 44 Years | 0 (0.0%) | 0 (0.0%) |
| 45 to 49 Years | 0 (0.0%) | 0 (0.0%) |
| 50 to 54 Years | 0 (0.0%) | 0 (0.0%) |
| 55 to 59 Years | 0 (0.0%) | 10 (12.7%) |
| 60 to 64 Years | 25 (38.5%) | 8 (10.1%) |
| 65 to 69 Years | 6 (9.2%) | 10 (12.7%) |
| 70 to 74 Years | 17 (26.2%) | 27 (34.2%) |
| 75 to 79 Years | 0 (0.0%) | 0 (0.0%) |
| 80 to 84 Years | 0 (0.0%) | 0 (0.0%) |
| 85 Years and over | 0 (0.0%) | 14 (17.7%) |
| Total | 65 (100.0%) | 79 (100.0%) |
Families and Households in Yogaville
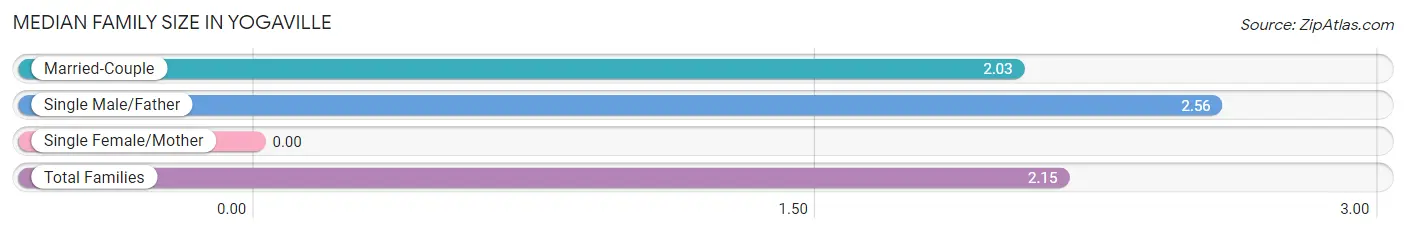
Median Family Size in Yogaville
| Family Type | # Families | Family Size |
| Married-Couple | 31 (77.5%) | 2.03 |
| Single Male/Father | 9 (22.5%) | 2.56 |
| Single Female/Mother | 0 (0.0%) | - |
| Total Families | 40 (100.0%) | 2.15 |
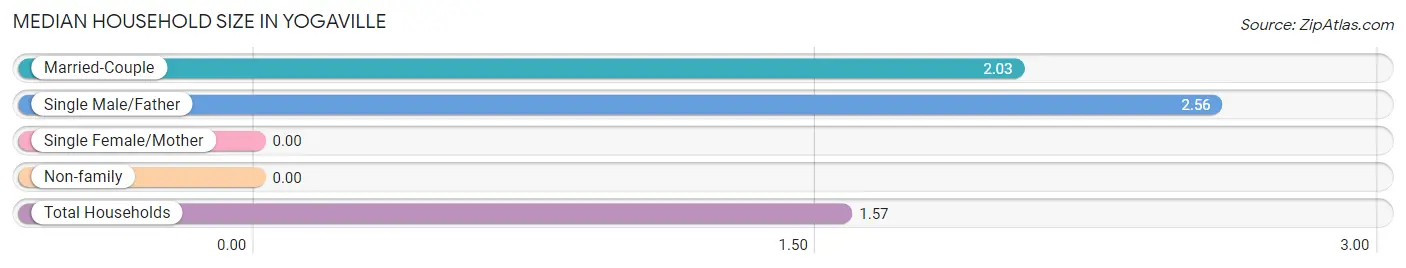
Median Household Size in Yogaville
| Household Type | # Households | Household Size |
| Married-Couple | 31 (38.3%) | 2.03 |
| Single Male/Father | 9 (11.1%) | 2.56 |
| Single Female/Mother | 0 (0.0%) | - |
| Non-family | 41 (50.6%) | - |
| Total Households | 81 (100.0%) | 1.57 |
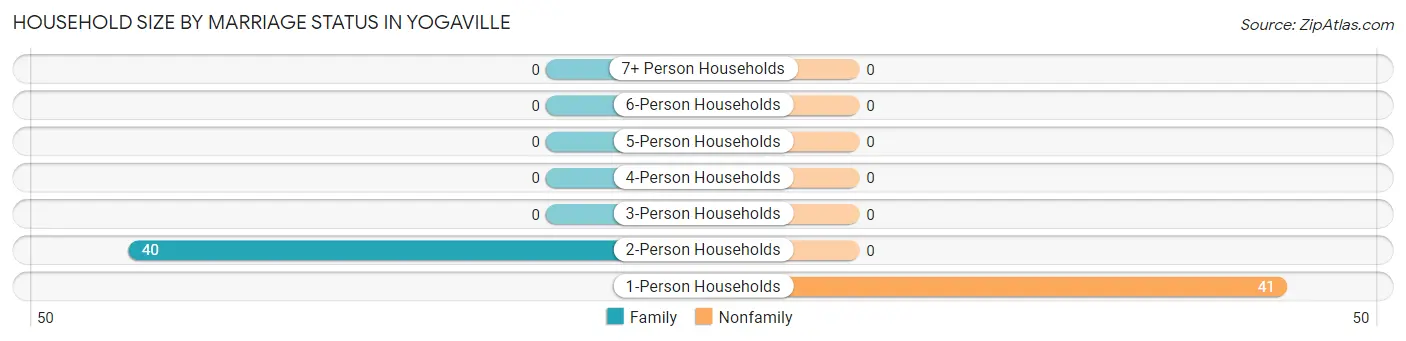
Household Size by Marriage Status in Yogaville
Out of a total of 81 households in Yogaville, 40 (49.4%) are family households, while 41 (50.6%) are nonfamily households. The most numerous type of family households are 2-person households, comprising 40, and the most common type of nonfamily households are 1-person households, comprising 41.
| Household Size | Family Households | Nonfamily Households |
| 1-Person Households | - | 41 (50.6%) |
| 2-Person Households | 40 (49.4%) | 0 (0.0%) |
| 3-Person Households | 0 (0.0%) | 0 (0.0%) |
| 4-Person Households | 0 (0.0%) | 0 (0.0%) |
| 5-Person Households | 0 (0.0%) | 0 (0.0%) |
| 6-Person Households | 0 (0.0%) | 0 (0.0%) |
| 7+ Person Households | 0 (0.0%) | 0 (0.0%) |
| Total | 40 (49.4%) | 41 (50.6%) |
Female Fertility in Yogaville
Fertility by Age in Yogaville
Average fertility rate in Yogaville is 1,000.0 births per 1,000 women. Women in the age bracket of 20 to 34 years have the highest fertility rate with 1,000.0 births per 1,000 women. Women in the age bracket of 20 to 34 years acount for 100.0% of all women with births.
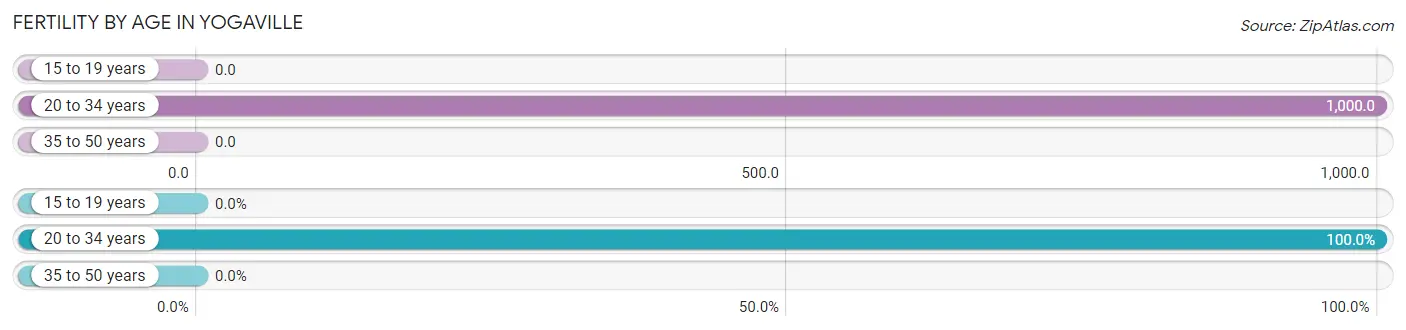
| Age Bracket | Women with Births | Births / 1,000 Women |
| 15 to 19 years | 0 (0.0%) | 0.0 |
| 20 to 34 years | 10 (100.0%) | 1,000.0 |
| 35 to 50 years | 0 (0.0%) | 0.0 |
| Total | 10 (100.0%) | 1,000.0 |
Fertility by Age by Marriage Status in Yogaville
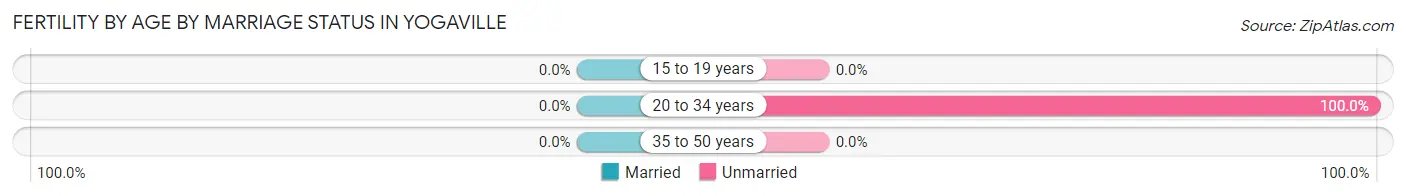
| Age Bracket | Married | Unmarried |
| 15 to 19 years | 0 (0.0%) | 0 (0.0%) |
| 20 to 34 years | 0 (0.0%) | 10 (100.0%) |
| 35 to 50 years | 0 (0.0%) | 0 (0.0%) |
| Total | 0 (0.0%) | 10 (100.0%) |
Fertility by Education in Yogaville
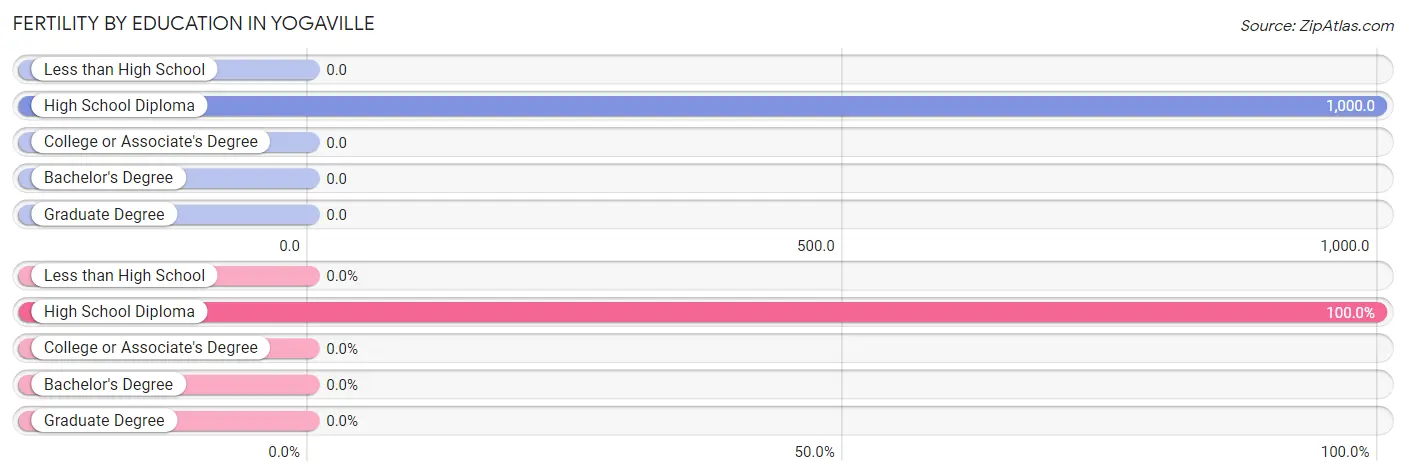
| Educational Attainment | Women with Births | Births / 1,000 Women |
| Less than High School | 0 (0.0%) | 0.0 |
| High School Diploma | 10 (100.0%) | 1,000.0 |
| College or Associate's Degree | 0 (0.0%) | 0.0 |
| Bachelor's Degree | 0 (0.0%) | 0.0 |
| Graduate Degree | 0 (0.0%) | 0.0 |
| Total | 10 (100.0%) | 1,000.0 |
Fertility by Education by Marriage Status in Yogaville
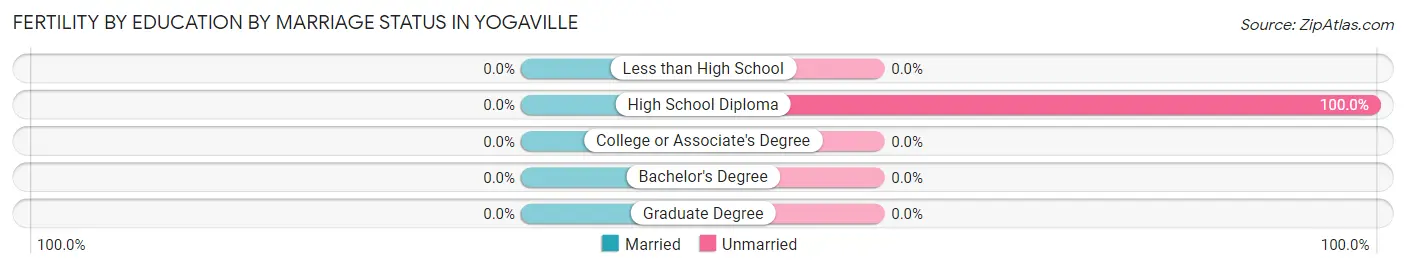
| Educational Attainment | Married | Unmarried |
| Less than High School | 0 (0.0%) | 0 (0.0%) |
| High School Diploma | 0 (0.0%) | 10 (100.0%) |
| College or Associate's Degree | 0 (0.0%) | 0 (0.0%) |
| Bachelor's Degree | 0 (0.0%) | 0 (0.0%) |
| Graduate Degree | 0 (0.0%) | 0 (0.0%) |
| Total | 0 (0.0%) | 10 (100.0%) |
Employment Characteristics in Yogaville
Employment by Class of Employer in Yogaville
Among the 65 employed individuals in Yogaville, not-for-profit organizations (30 | 46.2%), self-employed (not incorporated) (13 | 20.0%), and private company employees (12 | 18.5%) make up the most common classes of employment.
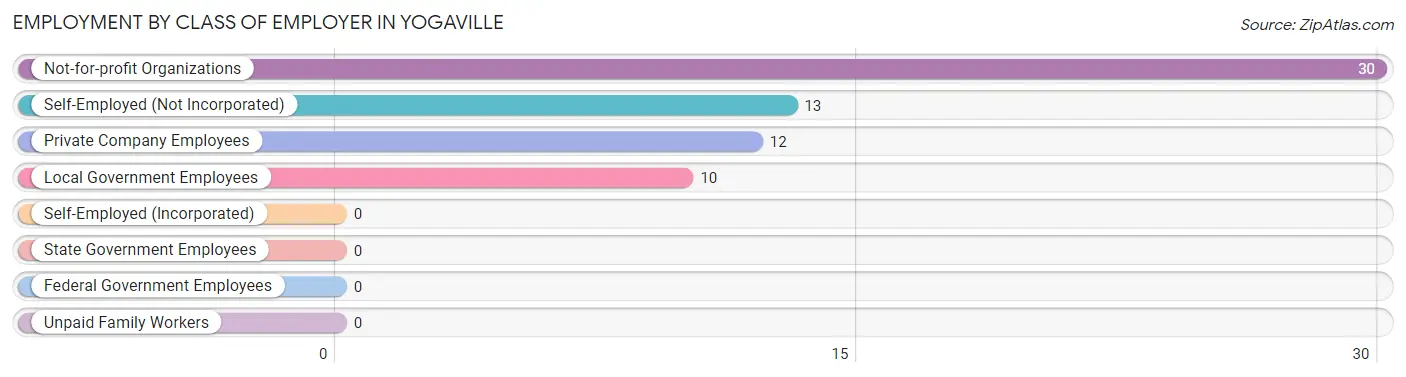
| Employer Class | # Employees | % Employees |
| Private Company Employees | 12 | 18.5% |
| Self-Employed (Incorporated) | 0 | 0.0% |
| Self-Employed (Not Incorporated) | 13 | 20.0% |
| Not-for-profit Organizations | 30 | 46.2% |
| Local Government Employees | 10 | 15.4% |
| State Government Employees | 0 | 0.0% |
| Federal Government Employees | 0 | 0.0% |
| Unpaid Family Workers | 0 | 0.0% |
| Total | 65 | 100.0% |
Employment Status by Age in Yogaville
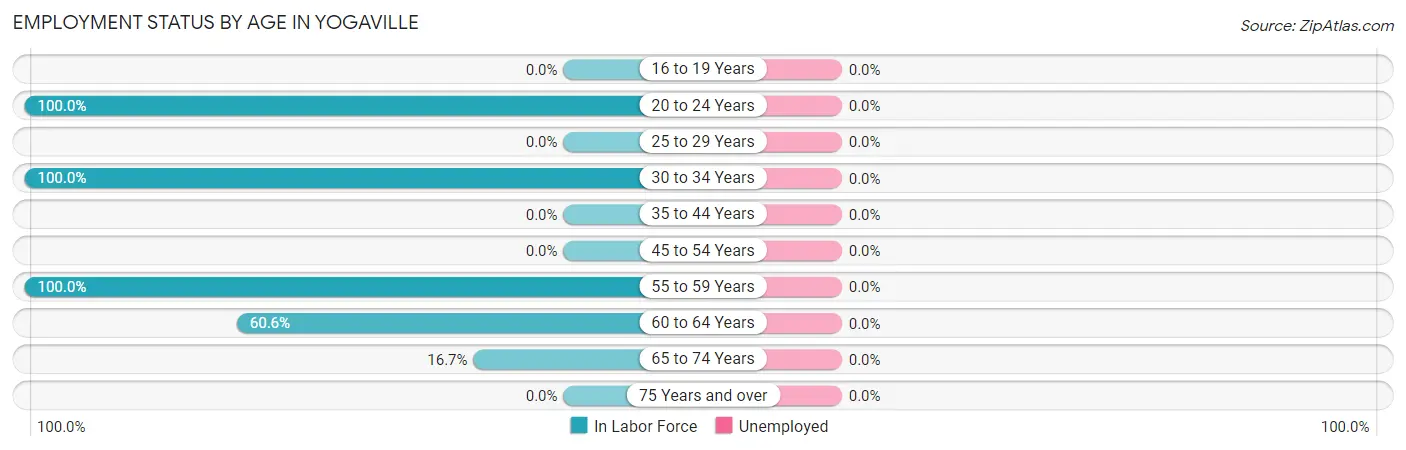
| Age Bracket | In Labor Force | Unemployed |
| 16 to 19 Years | 0 (0.0%) | 0 (0.0%) |
| 20 to 24 Years | 13 (100.0%) | 0 (0.0%) |
| 25 to 29 Years | 0 (0.0%) | 0 (0.0%) |
| 30 to 34 Years | 12 (100.0%) | 0 (0.0%) |
| 35 to 44 Years | 0 (0.0%) | 0 (0.0%) |
| 45 to 54 Years | 0 (0.0%) | 0 (0.0%) |
| 55 to 59 Years | 10 (100.0%) | 0 (0.0%) |
| 60 to 64 Years | 20 (60.6%) | 0 (0.0%) |
| 65 to 74 Years | 10 (16.7%) | 0 (0.0%) |
| 75 Years and over | 0 (0.0%) | 0 (0.0%) |
| Total | 65 (45.8%) | 0 (0.0%) |
Employment Status by Educational Attainment in Yogaville
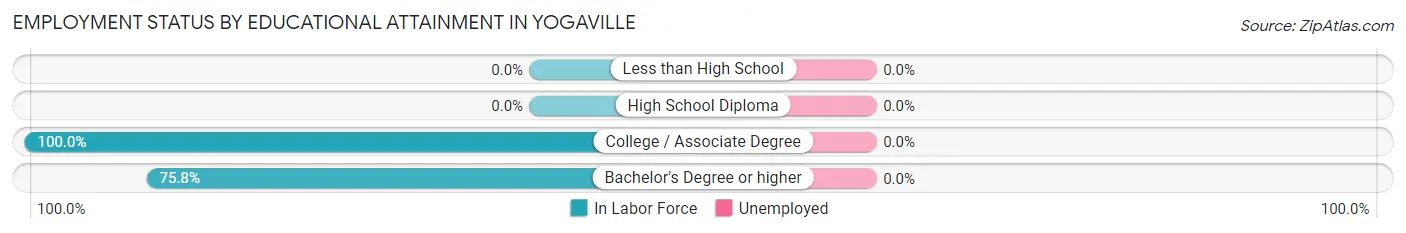
| Educational Attainment | In Labor Force | Unemployed |
| Less than High School | 0 (0.0%) | 0 (0.0%) |
| High School Diploma | 0 (0.0%) | 0 (0.0%) |
| College / Associate Degree | 17 (100.0%) | 0 (0.0%) |
| Bachelor's Degree or higher | 25 (75.8%) | 0 (0.0%) |
| Total | 42 (76.4%) | 0 (0.0%) |
Employment Occupations by Sex in Yogaville
Management, Business, Science and Arts Occupations
The most common Management, Business, Science and Arts occupations in Yogaville are , and Management (7 | 10.8%).
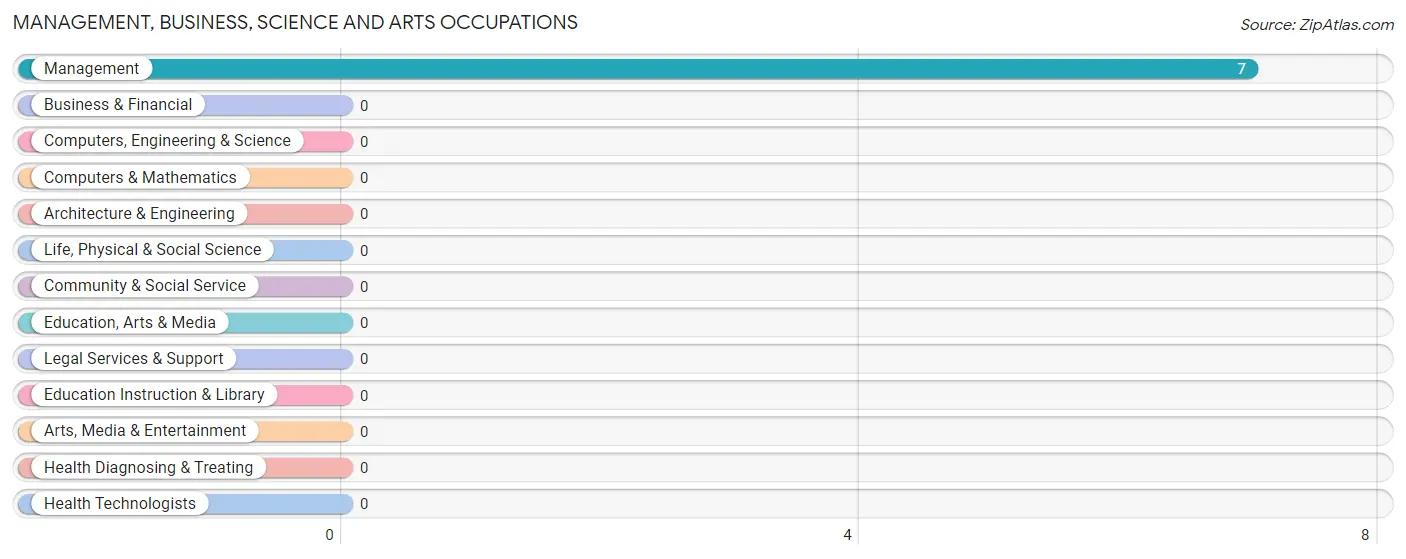
Management, Business, Science and Arts Occupations by Sex
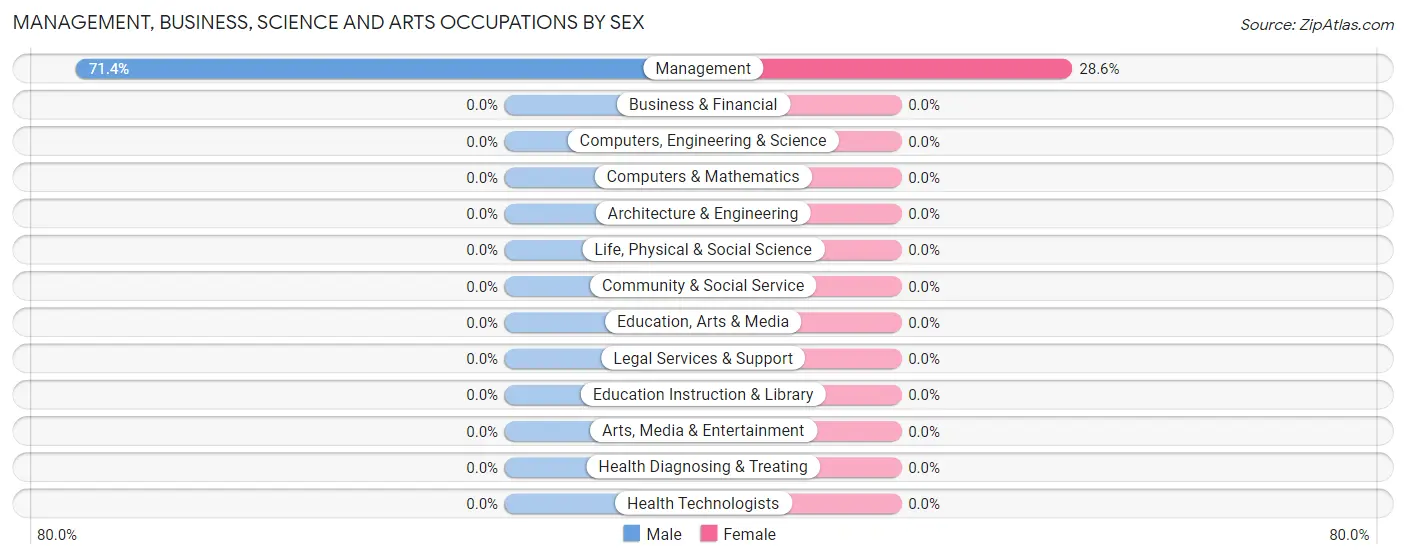
| Occupation | Male | Female |
| Management | 5 (71.4%) | 2 (28.6%) |
| Business & Financial | 0 (0.0%) | 0 (0.0%) |
| Computers, Engineering & Science | 0 (0.0%) | 0 (0.0%) |
| Computers & Mathematics | 0 (0.0%) | 0 (0.0%) |
| Architecture & Engineering | 0 (0.0%) | 0 (0.0%) |
| Life, Physical & Social Science | 0 (0.0%) | 0 (0.0%) |
| Community & Social Service | 0 (0.0%) | 0 (0.0%) |
| Education, Arts & Media | 0 (0.0%) | 0 (0.0%) |
| Legal Services & Support | 0 (0.0%) | 0 (0.0%) |
| Education Instruction & Library | 0 (0.0%) | 0 (0.0%) |
| Arts, Media & Entertainment | 0 (0.0%) | 0 (0.0%) |
| Health Diagnosing & Treating | 0 (0.0%) | 0 (0.0%) |
| Health Technologists | 0 (0.0%) | 0 (0.0%) |
| Total (Category) | 5 (71.4%) | 2 (28.6%) |
| Total (Overall) | 35 (53.8%) | 30 (46.2%) |
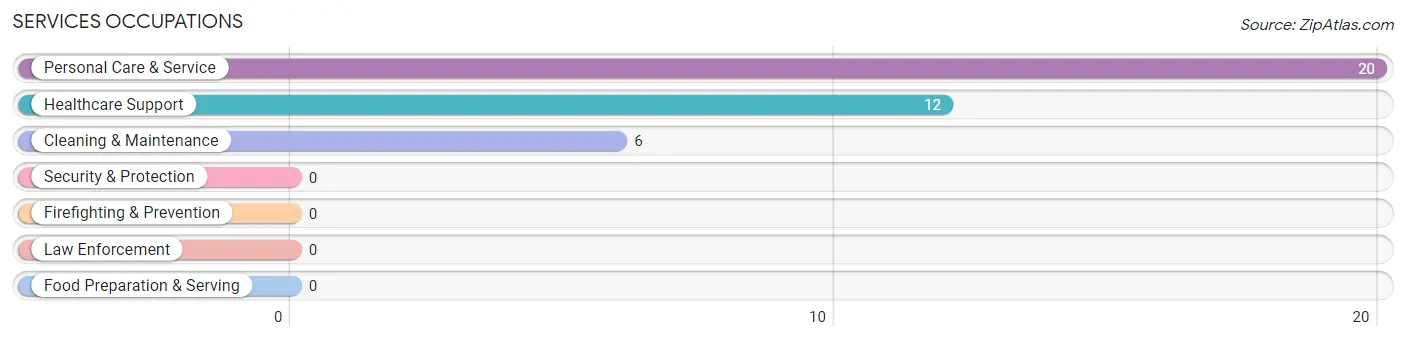
Services Occupations
The most common Services occupations in Yogaville are Personal Care & Service (20 | 30.8%), Healthcare Support (12 | 18.5%), and Cleaning & Maintenance (6 | 9.2%).
Services Occupations by Sex
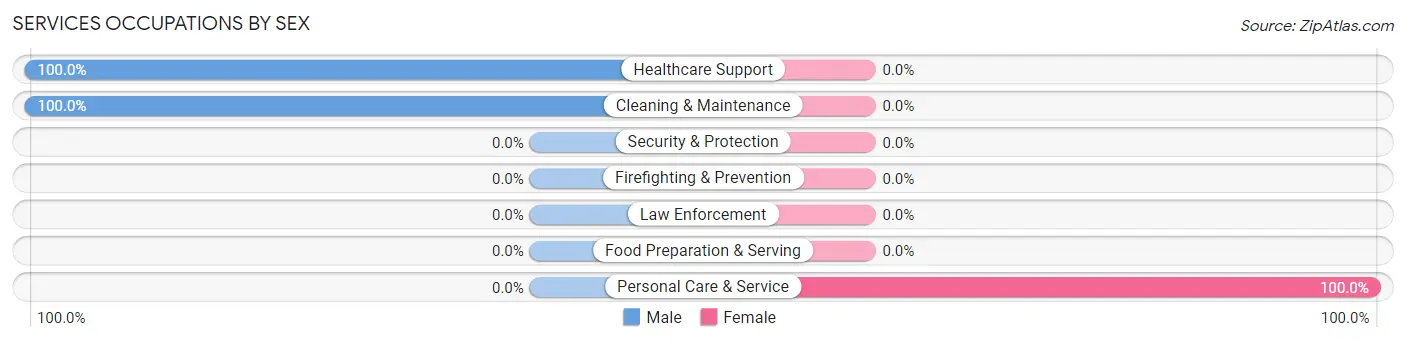
| Occupation | Male | Female |
| Healthcare Support | 12 (100.0%) | 0 (0.0%) |
| Security & Protection | 0 (0.0%) | 0 (0.0%) |
| Firefighting & Prevention | 0 (0.0%) | 0 (0.0%) |
| Law Enforcement | 0 (0.0%) | 0 (0.0%) |
| Food Preparation & Serving | 0 (0.0%) | 0 (0.0%) |
| Cleaning & Maintenance | 6 (100.0%) | 0 (0.0%) |
| Personal Care & Service | 0 (0.0%) | 20 (100.0%) |
| Total (Category) | 18 (47.4%) | 20 (52.6%) |
| Total (Overall) | 35 (53.8%) | 30 (46.2%) |
Sales and Office Occupations
The most common Sales and Office occupations in Yogaville are , and Office & Administration (12 | 18.5%).
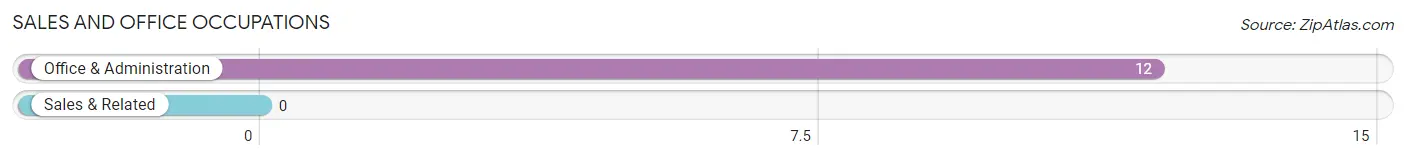
Sales and Office Occupations by Sex
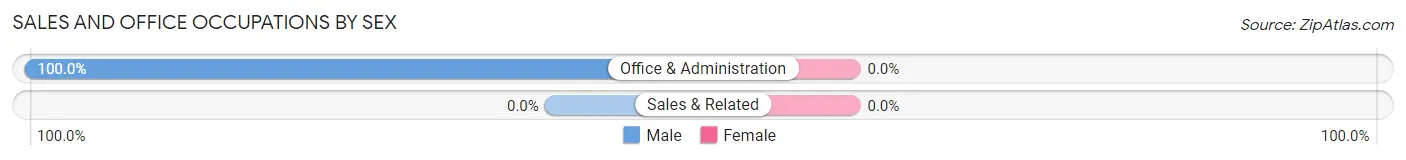
| Occupation | Male | Female |
| Sales & Related | 0 (0.0%) | 0 (0.0%) |
| Office & Administration | 12 (100.0%) | 0 (0.0%) |
| Total (Category) | 12 (100.0%) | 0 (0.0%) |
| Total (Overall) | 35 (53.8%) | 30 (46.2%) |
Natural Resources, Construction and Maintenance Occupations
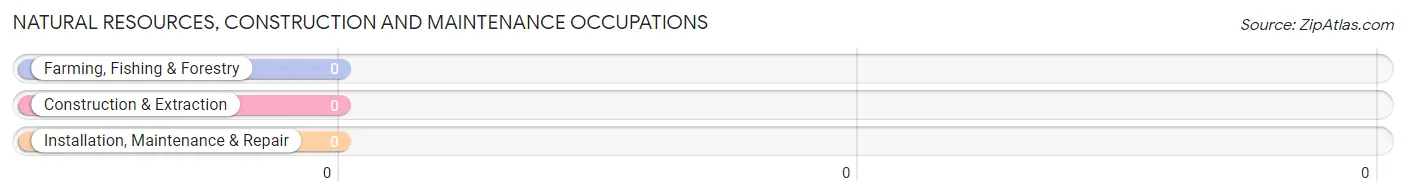
Natural Resources, Construction and Maintenance Occupations by Sex
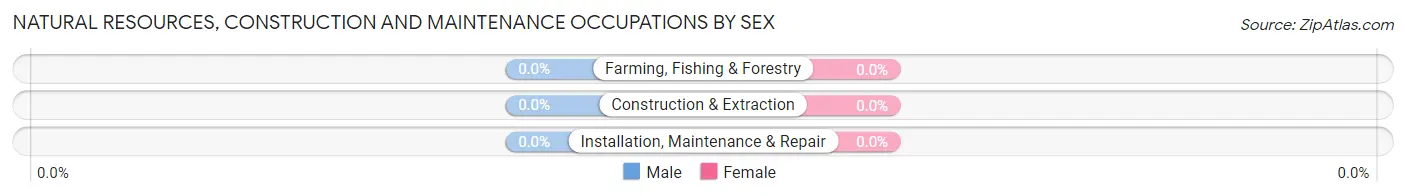
| Occupation | Male | Female |
| Farming, Fishing & Forestry | 0 (0.0%) | 0 (0.0%) |
| Construction & Extraction | 0 (0.0%) | 0 (0.0%) |
| Installation, Maintenance & Repair | 0 (0.0%) | 0 (0.0%) |
| Total (Category) | 0 (0.0%) | 0 (0.0%) |
| Total (Overall) | 35 (53.8%) | 30 (46.2%) |
Production, Transportation and Moving Occupations
The most common Production, Transportation and Moving occupations in Yogaville are , and Material Moving (8 | 12.3%).
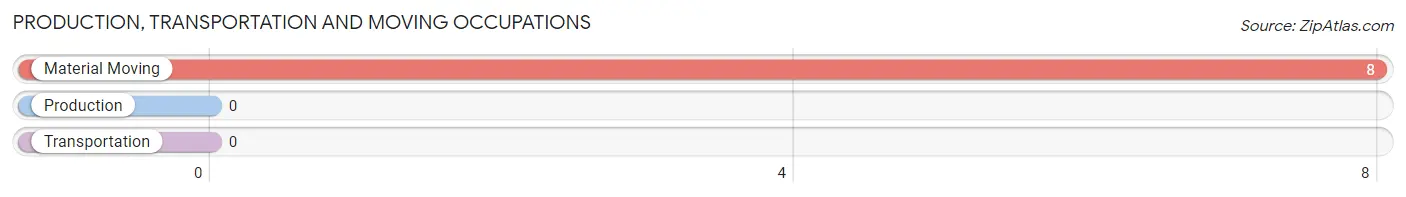
Production, Transportation and Moving Occupations by Sex
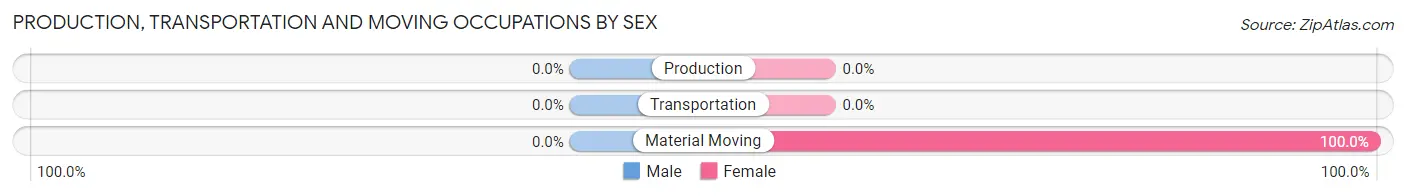
| Occupation | Male | Female |
| Production | 0 (0.0%) | 0 (0.0%) |
| Transportation | 0 (0.0%) | 0 (0.0%) |
| Material Moving | 0 (0.0%) | 8 (100.0%) |
| Total (Category) | 0 (0.0%) | 8 (100.0%) |
| Total (Overall) | 35 (53.8%) | 30 (46.2%) |
Employment Industries by Sex in Yogaville
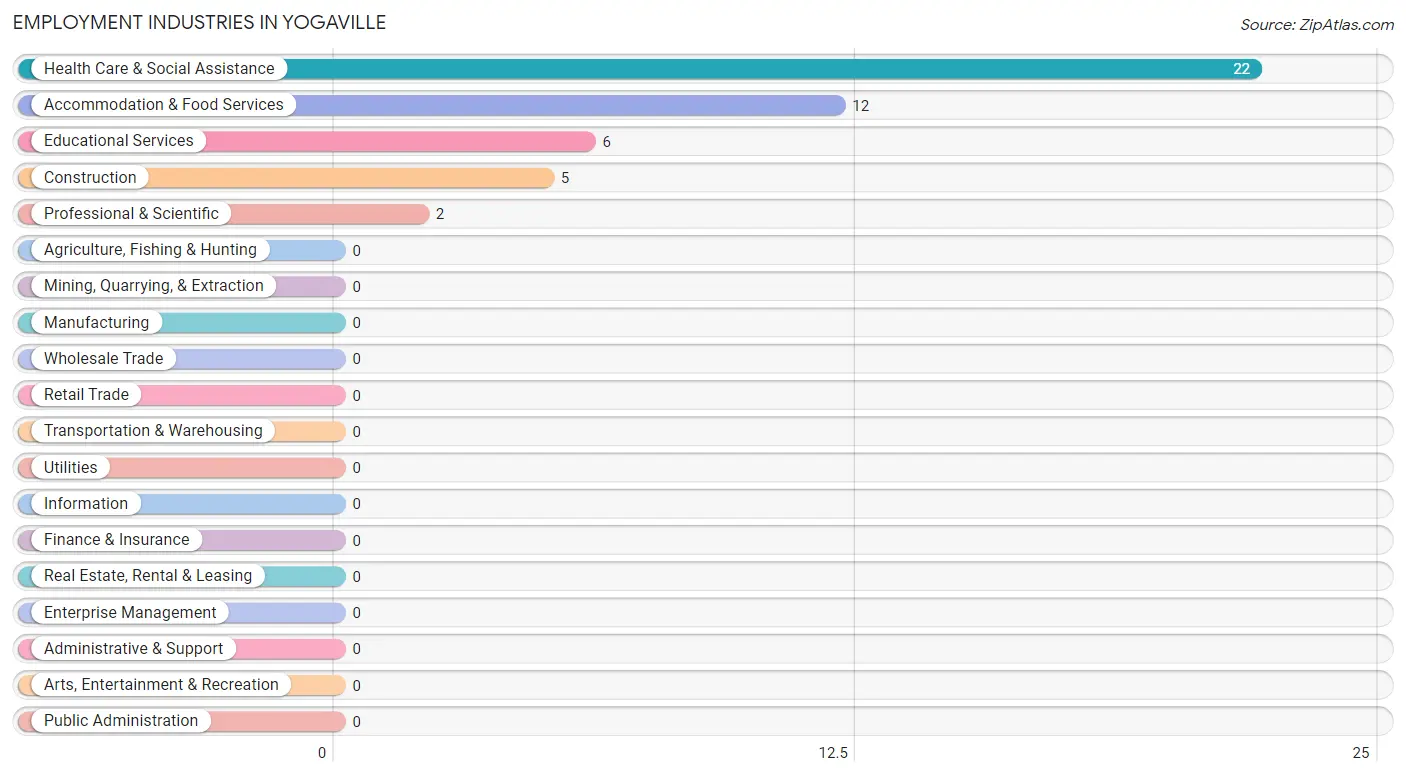
Employment Industries in Yogaville
The major employment industries in Yogaville include Health Care & Social Assistance (22 | 33.9%), Accommodation & Food Services (12 | 18.5%), Educational Services (6 | 9.2%), Construction (5 | 7.7%), and Professional & Scientific (2 | 3.1%).
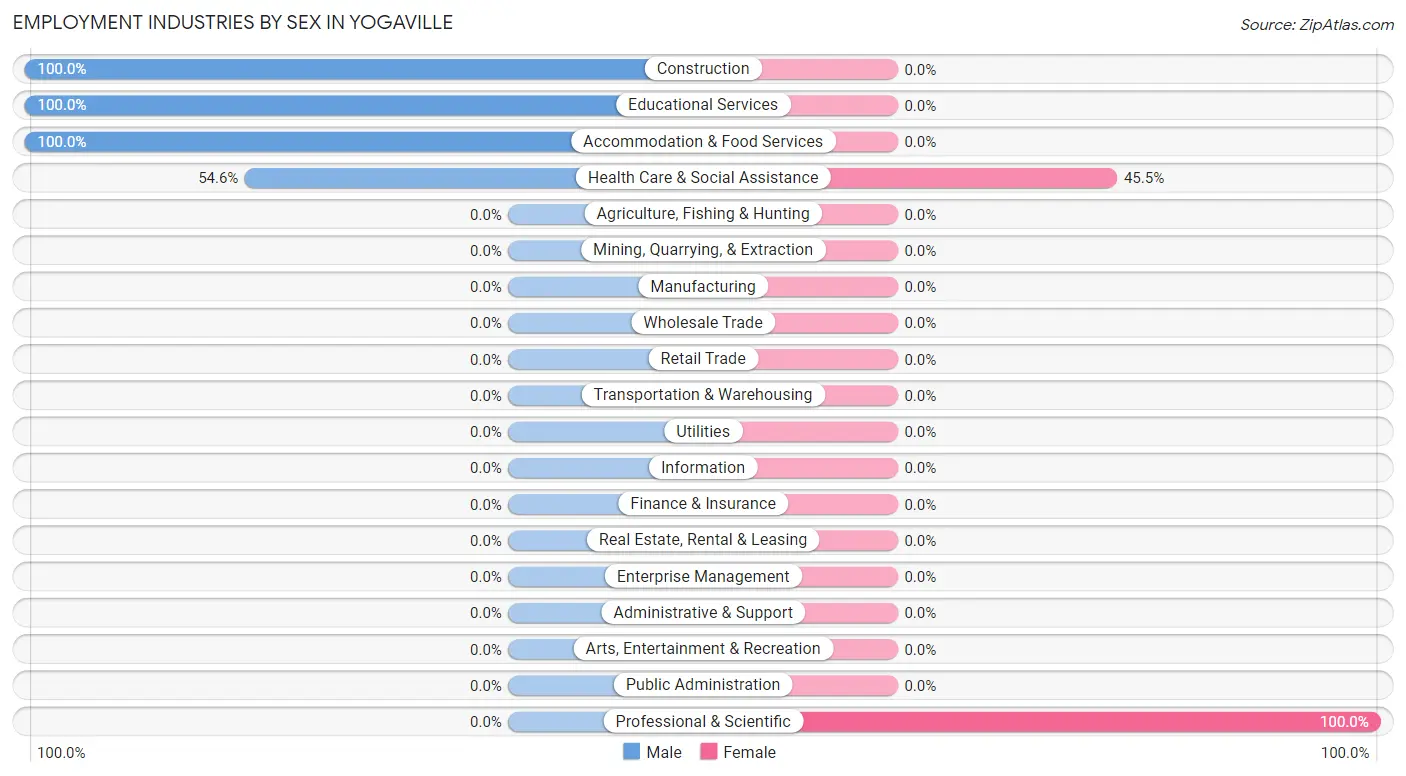
Employment Industries by Sex in Yogaville
The Yogaville industries that see more men than women are Construction (100.0%), Educational Services (100.0%), and Accommodation & Food Services (100.0%), whereas the industries that tend to have a higher number of women are Professional & Scientific (100.0%), and Health Care & Social Assistance (45.5%).
| Industry | Male | Female |
| Agriculture, Fishing & Hunting | 0 (0.0%) | 0 (0.0%) |
| Mining, Quarrying, & Extraction | 0 (0.0%) | 0 (0.0%) |
| Construction | 5 (100.0%) | 0 (0.0%) |
| Manufacturing | 0 (0.0%) | 0 (0.0%) |
| Wholesale Trade | 0 (0.0%) | 0 (0.0%) |
| Retail Trade | 0 (0.0%) | 0 (0.0%) |
| Transportation & Warehousing | 0 (0.0%) | 0 (0.0%) |
| Utilities | 0 (0.0%) | 0 (0.0%) |
| Information | 0 (0.0%) | 0 (0.0%) |
| Finance & Insurance | 0 (0.0%) | 0 (0.0%) |
| Real Estate, Rental & Leasing | 0 (0.0%) | 0 (0.0%) |
| Professional & Scientific | 0 (0.0%) | 2 (100.0%) |
| Enterprise Management | 0 (0.0%) | 0 (0.0%) |
| Administrative & Support | 0 (0.0%) | 0 (0.0%) |
| Educational Services | 6 (100.0%) | 0 (0.0%) |
| Health Care & Social Assistance | 12 (54.5%) | 10 (45.5%) |
| Arts, Entertainment & Recreation | 0 (0.0%) | 0 (0.0%) |
| Accommodation & Food Services | 12 (100.0%) | 0 (0.0%) |
| Public Administration | 0 (0.0%) | 0 (0.0%) |
| Total | 35 (53.8%) | 30 (46.2%) |
Education in Yogaville
School Enrollment in Yogaville
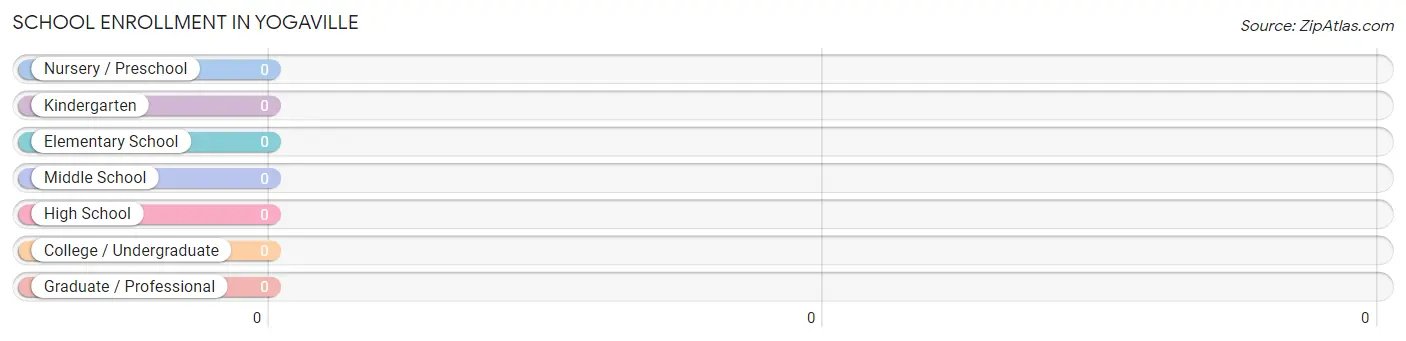
| School Level | # Students | % Students |
| Nursery / Preschool | 0 | 0.0% |
| Kindergarten | 0 | 0.0% |
| Elementary School | 0 | 0.0% |
| Middle School | 0 | 0.0% |
| High School | 0 | 0.0% |
| College / Undergraduate | 0 | 0.0% |
| Graduate / Professional | 0 | 0.0% |
| Total | 0 | 0.0% |
School Enrollment by Age by Funding Source in Yogaville
| Age Bracket | Public School | Private School |
| 3 to 4 Year Olds | 0 (0.0%) | 0 (0.0%) |
| 5 to 9 Year Old | 0 (0.0%) | 0 (0.0%) |
| 10 to 14 Year Olds | 0 (0.0%) | 0 (0.0%) |
| 15 to 17 Year Olds | 0 (0.0%) | 0 (0.0%) |
| 18 to 19 Year Olds | 0 (0.0%) | 0 (0.0%) |
| 20 to 24 Year Olds | 0 (0.0%) | 0 (0.0%) |
| 25 to 34 Year Olds | 0 (0.0%) | 0 (0.0%) |
| 35 Years and over | 0 (0.0%) | 0 (0.0%) |
| Total | 0 (0.0%) | 0 (0.0%) |
Educational Attainment by Field of Study in Yogaville
Science & technology (20 | 26.7%), arts & humanities (16 | 21.3%), psychology (14 | 18.7%), literature & languages (14 | 18.7%), and education (6 | 8.0%) are the most common fields of study among 75 individuals in Yogaville who have obtained a bachelor's degree or higher.
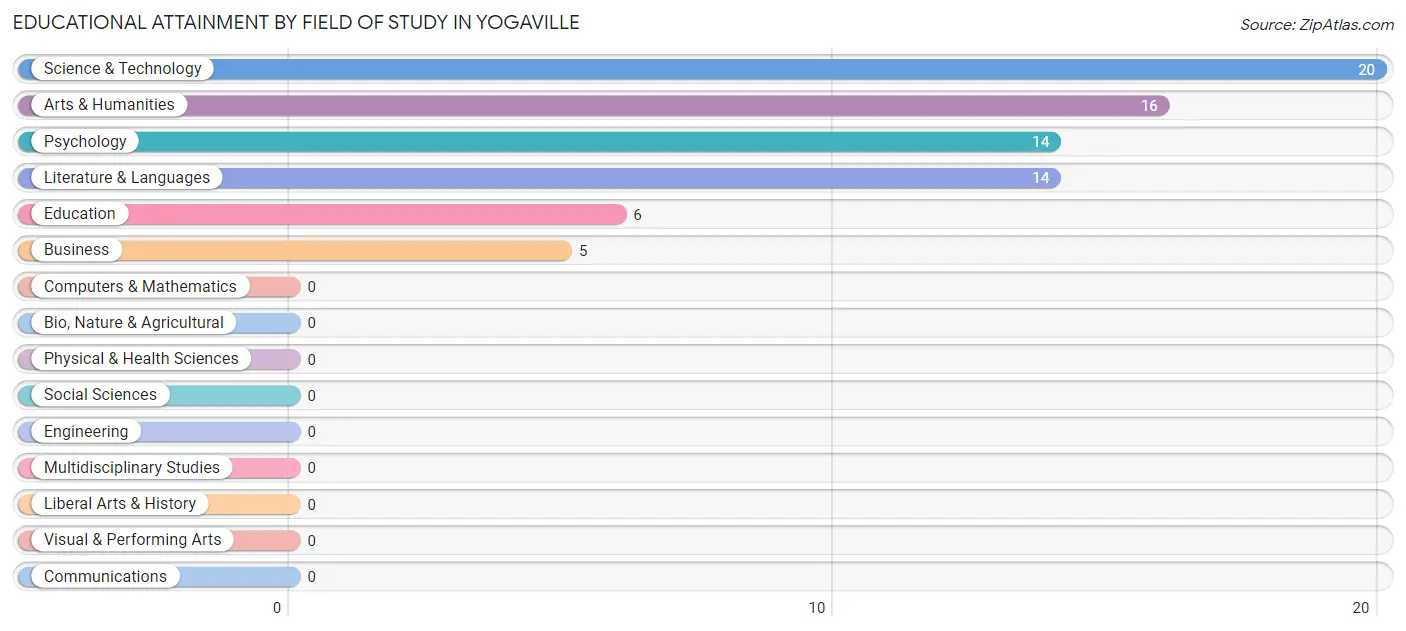
| Field of Study | # Graduates | % Graduates |
| Computers & Mathematics | 0 | 0.0% |
| Bio, Nature & Agricultural | 0 | 0.0% |
| Physical & Health Sciences | 0 | 0.0% |
| Psychology | 14 | 18.7% |
| Social Sciences | 0 | 0.0% |
| Engineering | 0 | 0.0% |
| Multidisciplinary Studies | 0 | 0.0% |
| Science & Technology | 20 | 26.7% |
| Business | 5 | 6.7% |
| Education | 6 | 8.0% |
| Literature & Languages | 14 | 18.7% |
| Liberal Arts & History | 0 | 0.0% |
| Visual & Performing Arts | 0 | 0.0% |
| Communications | 0 | 0.0% |
| Arts & Humanities | 16 | 21.3% |
| Total | 75 | 100.0% |
Transportation & Commute in Yogaville
Vehicle Availability by Sex in Yogaville
The most prevalent vehicle ownership categories in Yogaville are males with 1 vehicle (32, accounting for 100.0%) and females with 1 vehicle (18, making up 177.8%).
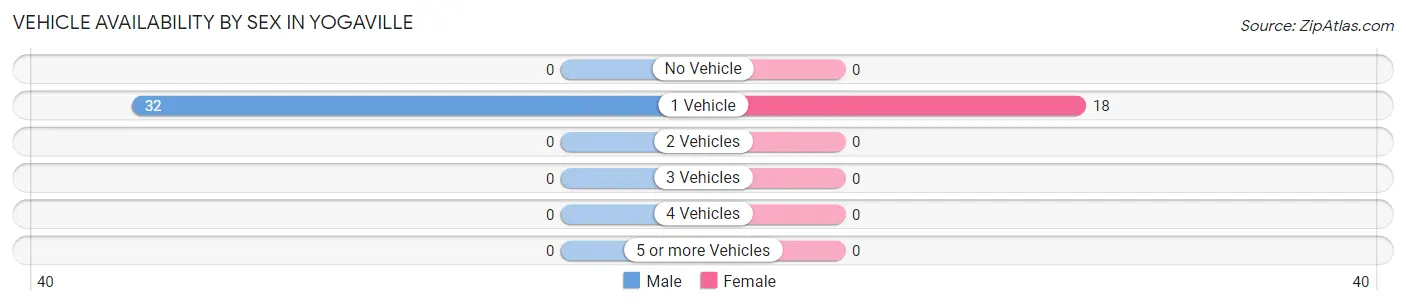
| Vehicles Available | Male | Female |
| No Vehicle | 0 (0.0%) | 0 (0.0%) |
| 1 Vehicle | 32 (100.0%) | 18 (100.0%) |
| 2 Vehicles | 0 (0.0%) | 0 (0.0%) |
| 3 Vehicles | 0 (0.0%) | 0 (0.0%) |
| 4 Vehicles | 0 (0.0%) | 0 (0.0%) |
| 5 or more Vehicles | 0 (0.0%) | 0 (0.0%) |
| Total | 32 (100.0%) | 18 (100.0%) |
Commute Time in Yogaville
The most frequently occuring commute durations in Yogaville are 10 to 14 minutes (15 commuters, 26.3%), 60 to 89 minutes (15 commuters, 26.3%), and less than 5 minutes (14 commuters, 24.6%).
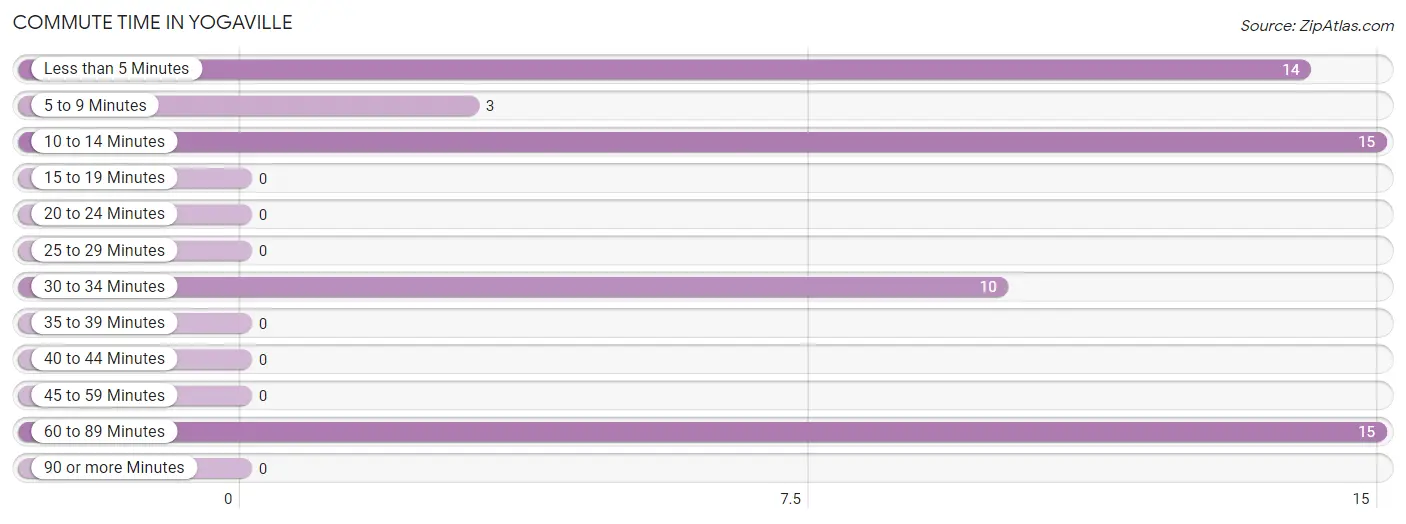
| Commute Time | # Commuters | % Commuters |
| Less than 5 Minutes | 14 | 24.6% |
| 5 to 9 Minutes | 3 | 5.3% |
| 10 to 14 Minutes | 15 | 26.3% |
| 15 to 19 Minutes | 0 | 0.0% |
| 20 to 24 Minutes | 0 | 0.0% |
| 25 to 29 Minutes | 0 | 0.0% |
| 30 to 34 Minutes | 10 | 17.5% |
| 35 to 39 Minutes | 0 | 0.0% |
| 40 to 44 Minutes | 0 | 0.0% |
| 45 to 59 Minutes | 0 | 0.0% |
| 60 to 89 Minutes | 15 | 26.3% |
| 90 or more Minutes | 0 | 0.0% |
Commute Time by Sex in Yogaville
The most common commute times in Yogaville are 60 to 89 minutes (15 commuters, 42.9%) for males and 10 to 14 minutes (10 commuters, 45.5%) for females.
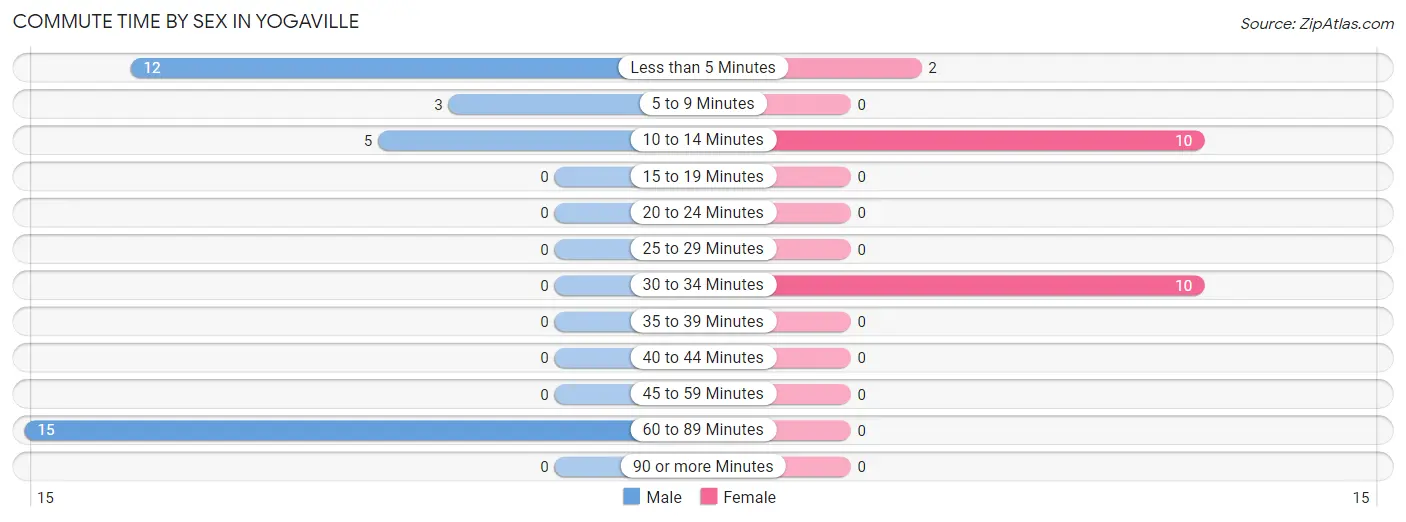
| Commute Time | Male | Female |
| Less than 5 Minutes | 12 (34.3%) | 2 (9.1%) |
| 5 to 9 Minutes | 3 (8.6%) | 0 (0.0%) |
| 10 to 14 Minutes | 5 (14.3%) | 10 (45.5%) |
| 15 to 19 Minutes | 0 (0.0%) | 0 (0.0%) |
| 20 to 24 Minutes | 0 (0.0%) | 0 (0.0%) |
| 25 to 29 Minutes | 0 (0.0%) | 0 (0.0%) |
| 30 to 34 Minutes | 0 (0.0%) | 10 (45.5%) |
| 35 to 39 Minutes | 0 (0.0%) | 0 (0.0%) |
| 40 to 44 Minutes | 0 (0.0%) | 0 (0.0%) |
| 45 to 59 Minutes | 0 (0.0%) | 0 (0.0%) |
| 60 to 89 Minutes | 15 (42.9%) | 0 (0.0%) |
| 90 or more Minutes | 0 (0.0%) | 0 (0.0%) |
Time of Departure to Work by Sex in Yogaville
The most frequent times of departure to work in Yogaville are 9:00 AM to 9:59 AM (17, 48.6%) for males and 6:30 AM to 6:59 AM (10, 45.5%) for females.
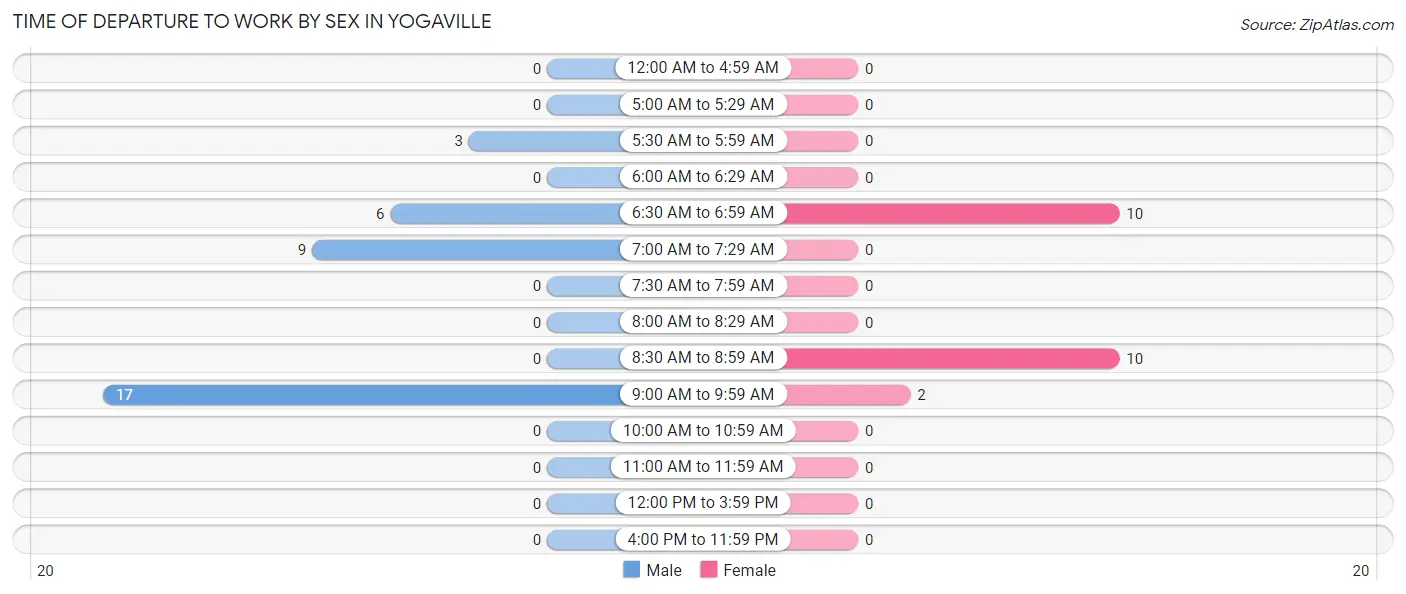
| Time of Departure | Male | Female |
| 12:00 AM to 4:59 AM | 0 (0.0%) | 0 (0.0%) |
| 5:00 AM to 5:29 AM | 0 (0.0%) | 0 (0.0%) |
| 5:30 AM to 5:59 AM | 3 (8.6%) | 0 (0.0%) |
| 6:00 AM to 6:29 AM | 0 (0.0%) | 0 (0.0%) |
| 6:30 AM to 6:59 AM | 6 (17.1%) | 10 (45.5%) |
| 7:00 AM to 7:29 AM | 9 (25.7%) | 0 (0.0%) |
| 7:30 AM to 7:59 AM | 0 (0.0%) | 0 (0.0%) |
| 8:00 AM to 8:29 AM | 0 (0.0%) | 0 (0.0%) |
| 8:30 AM to 8:59 AM | 0 (0.0%) | 10 (45.5%) |
| 9:00 AM to 9:59 AM | 17 (48.6%) | 2 (9.1%) |
| 10:00 AM to 10:59 AM | 0 (0.0%) | 0 (0.0%) |
| 11:00 AM to 11:59 AM | 0 (0.0%) | 0 (0.0%) |
| 12:00 PM to 3:59 PM | 0 (0.0%) | 0 (0.0%) |
| 4:00 PM to 11:59 PM | 0 (0.0%) | 0 (0.0%) |
| Total | 35 (100.0%) | 22 (100.0%) |
Housing Occupancy in Yogaville
Occupancy by Ownership in Yogaville
Of the total 81 dwellings in Yogaville, owner-occupied units account for 43 (53.1%), while renter-occupied units make up 38 (46.9%).
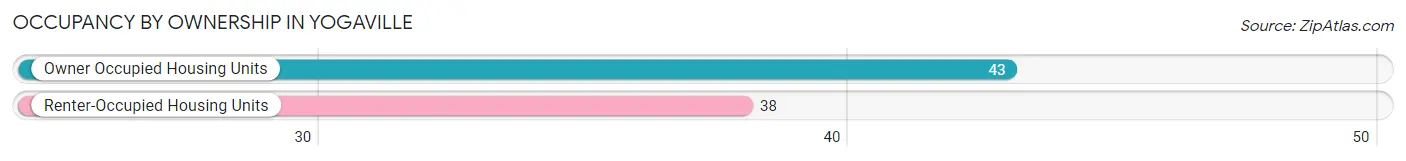
| Occupancy | # Housing Units | % Housing Units |
| Owner Occupied Housing Units | 43 | 53.1% |
| Renter-Occupied Housing Units | 38 | 46.9% |
| Total Occupied Housing Units | 81 | 100.0% |
Occupancy by Household Size in Yogaville
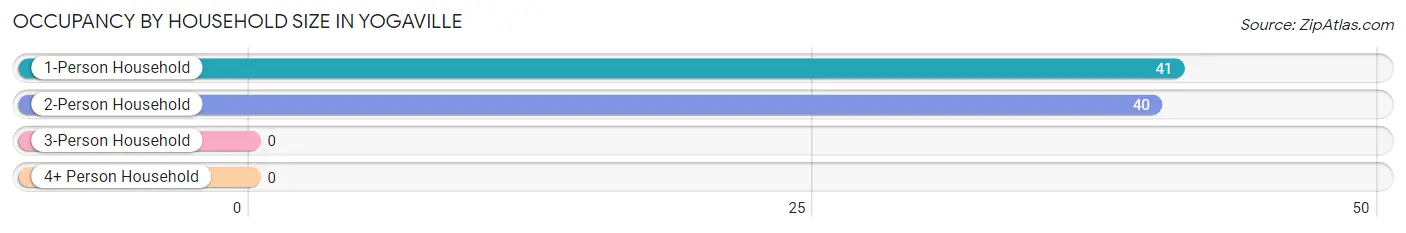
| Household Size | # Housing Units | % Housing Units |
| 1-Person Household | 41 | 50.6% |
| 2-Person Household | 40 | 49.4% |
| 3-Person Household | 0 | 0.0% |
| 4+ Person Household | 0 | 0.0% |
| Total Housing Units | 81 | 100.0% |
Occupancy by Ownership by Household Size in Yogaville
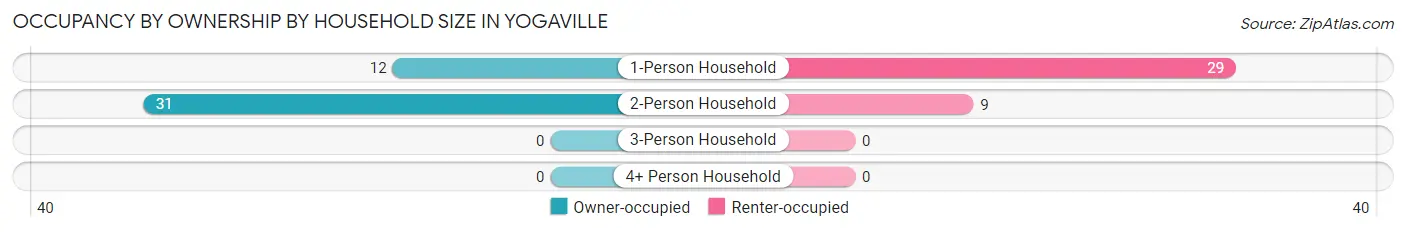
| Household Size | Owner-occupied | Renter-occupied |
| 1-Person Household | 12 (29.3%) | 29 (70.7%) |
| 2-Person Household | 31 (77.5%) | 9 (22.5%) |
| 3-Person Household | 0 (0.0%) | 0 (0.0%) |
| 4+ Person Household | 0 (0.0%) | 0 (0.0%) |
| Total Housing Units | 43 (53.1%) | 38 (46.9%) |
Occupancy by Educational Attainment in Yogaville
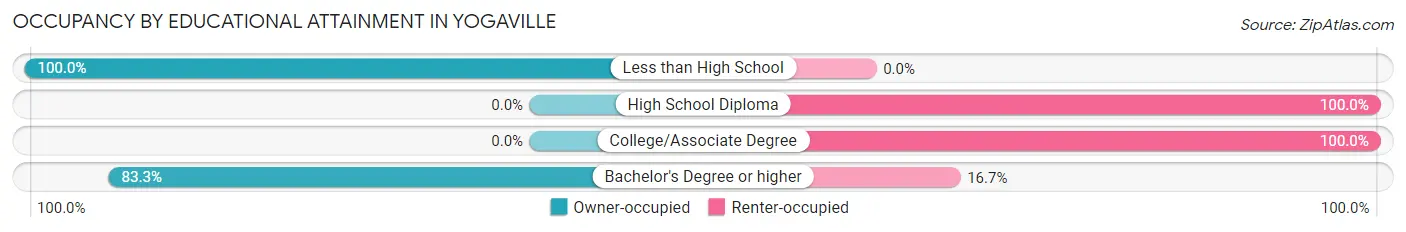
| Household Size | Owner-occupied | Renter-occupied |
| Less than High School | 3 (100.0%) | 0 (0.0%) |
| High School Diploma | 0 (0.0%) | 15 (100.0%) |
| College/Associate Degree | 0 (0.0%) | 15 (100.0%) |
| Bachelor's Degree or higher | 40 (83.3%) | 8 (16.7%) |
Occupancy by Age of Householder in Yogaville
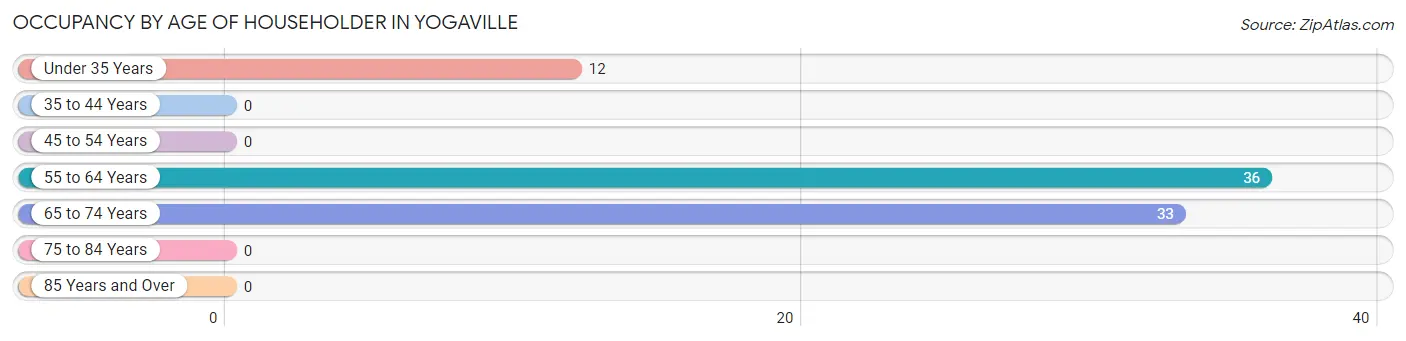
| Age Bracket | # Households | % Households |
| Under 35 Years | 12 | 14.8% |
| 35 to 44 Years | 0 | 0.0% |
| 45 to 54 Years | 0 | 0.0% |
| 55 to 64 Years | 36 | 44.4% |
| 65 to 74 Years | 33 | 40.7% |
| 75 to 84 Years | 0 | 0.0% |
| 85 Years and Over | 0 | 0.0% |
| Total | 81 | 100.0% |
Housing Finances in Yogaville
Median Income by Occupancy in Yogaville
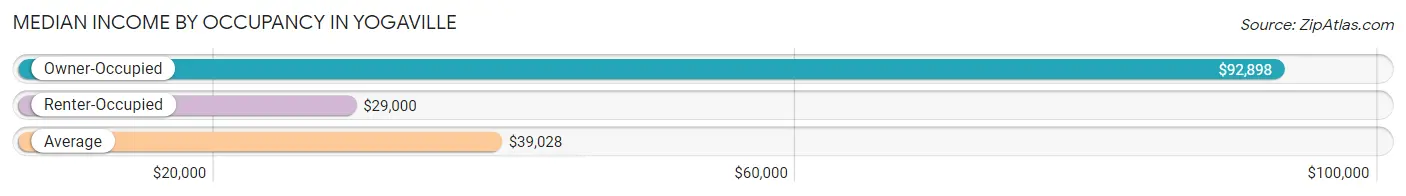
| Occupancy Type | # Households | Median Income |
| Owner-Occupied | 43 (53.1%) | $92,898 |
| Renter-Occupied | 38 (46.9%) | $29,000 |
| Average | 81 (100.0%) | $39,028 |
Occupancy by Householder Income Bracket in Yogaville
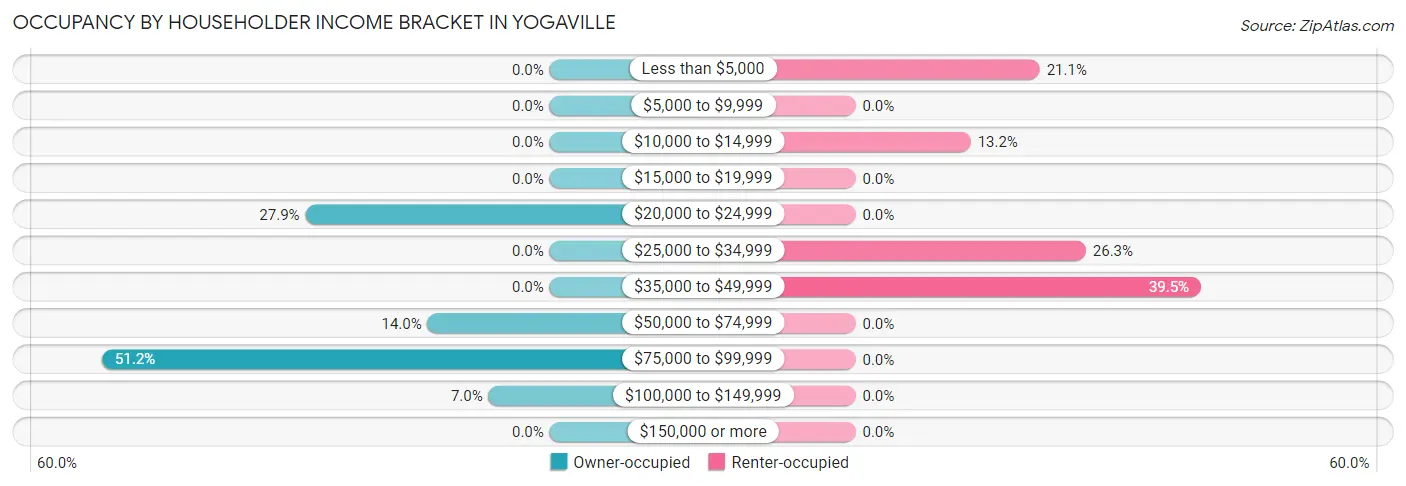
| Income Bracket | Owner-occupied | Renter-occupied |
| Less than $5,000 | 0 (0.0%) | 8 (21.0%) |
| $5,000 to $9,999 | 0 (0.0%) | 0 (0.0%) |
| $10,000 to $14,999 | 0 (0.0%) | 5 (13.2%) |
| $15,000 to $19,999 | 0 (0.0%) | 0 (0.0%) |
| $20,000 to $24,999 | 12 (27.9%) | 0 (0.0%) |
| $25,000 to $34,999 | 0 (0.0%) | 10 (26.3%) |
| $35,000 to $49,999 | 0 (0.0%) | 15 (39.5%) |
| $50,000 to $74,999 | 6 (14.0%) | 0 (0.0%) |
| $75,000 to $99,999 | 22 (51.2%) | 0 (0.0%) |
| $100,000 to $149,999 | 3 (7.0%) | 0 (0.0%) |
| $150,000 or more | 0 (0.0%) | 0 (0.0%) |
| Total | 43 (100.0%) | 38 (100.0%) |
Monthly Housing Cost Tiers in Yogaville
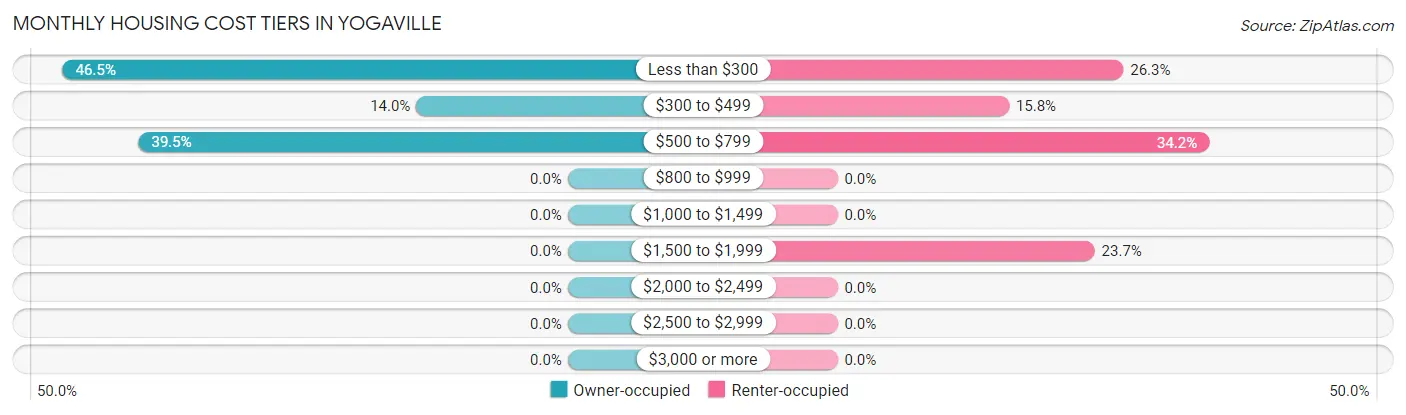
| Monthly Cost | Owner-occupied | Renter-occupied |
| Less than $300 | 20 (46.5%) | 10 (26.3%) |
| $300 to $499 | 6 (14.0%) | 6 (15.8%) |
| $500 to $799 | 17 (39.5%) | 13 (34.2%) |
| $800 to $999 | 0 (0.0%) | 0 (0.0%) |
| $1,000 to $1,499 | 0 (0.0%) | 0 (0.0%) |
| $1,500 to $1,999 | 0 (0.0%) | 9 (23.7%) |
| $2,000 to $2,499 | 0 (0.0%) | 0 (0.0%) |
| $2,500 to $2,999 | 0 (0.0%) | 0 (0.0%) |
| $3,000 or more | 0 (0.0%) | 0 (0.0%) |
| Total | 43 (100.0%) | 38 (100.0%) |
Physical Housing Characteristics in Yogaville
Housing Structures in Yogaville
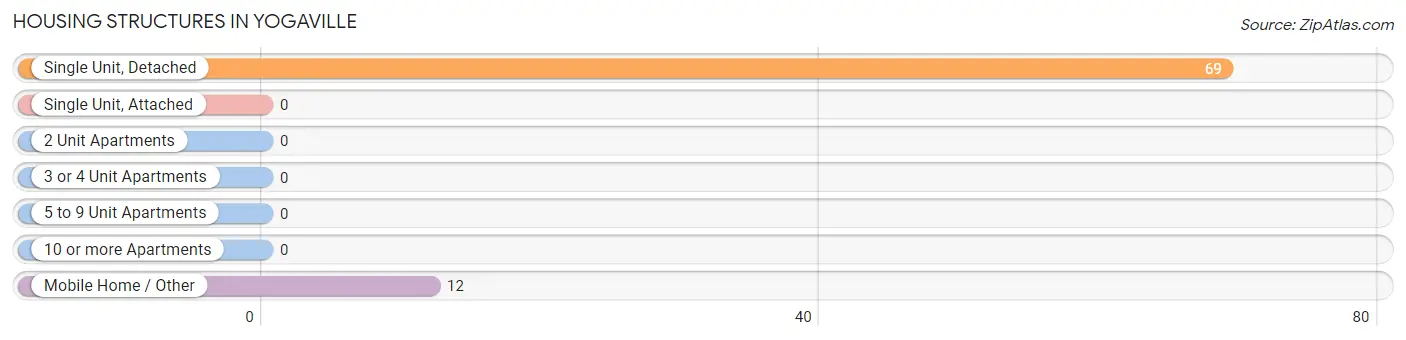
| Structure Type | # Housing Units | % Housing Units |
| Single Unit, Detached | 69 | 85.2% |
| Single Unit, Attached | 0 | 0.0% |
| 2 Unit Apartments | 0 | 0.0% |
| 3 or 4 Unit Apartments | 0 | 0.0% |
| 5 to 9 Unit Apartments | 0 | 0.0% |
| 10 or more Apartments | 0 | 0.0% |
| Mobile Home / Other | 12 | 14.8% |
| Total | 81 | 100.0% |
Housing Structures by Occupancy in Yogaville
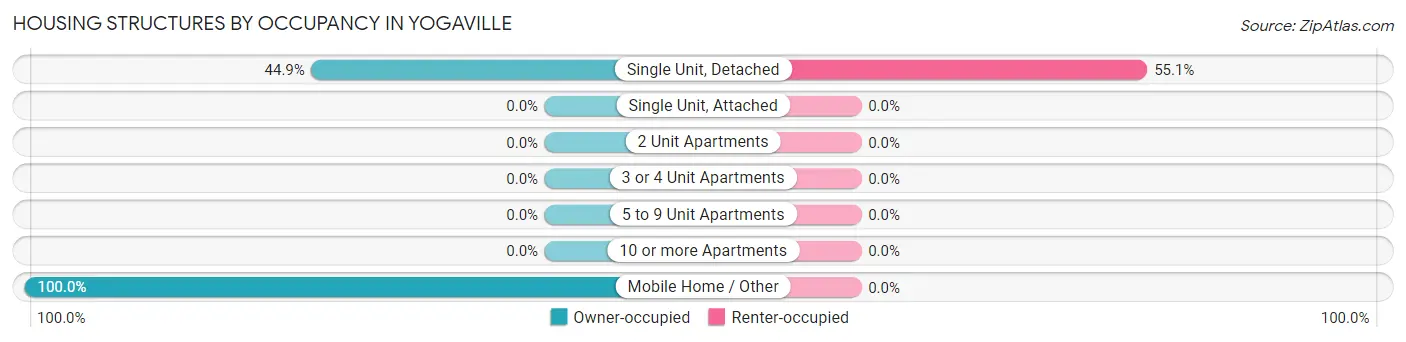
| Structure Type | Owner-occupied | Renter-occupied |
| Single Unit, Detached | 31 (44.9%) | 38 (55.1%) |
| Single Unit, Attached | 0 (0.0%) | 0 (0.0%) |
| 2 Unit Apartments | 0 (0.0%) | 0 (0.0%) |
| 3 or 4 Unit Apartments | 0 (0.0%) | 0 (0.0%) |
| 5 to 9 Unit Apartments | 0 (0.0%) | 0 (0.0%) |
| 10 or more Apartments | 0 (0.0%) | 0 (0.0%) |
| Mobile Home / Other | 12 (100.0%) | 0 (0.0%) |
| Total | 43 (53.1%) | 38 (46.9%) |
Housing Structures by Number of Rooms in Yogaville
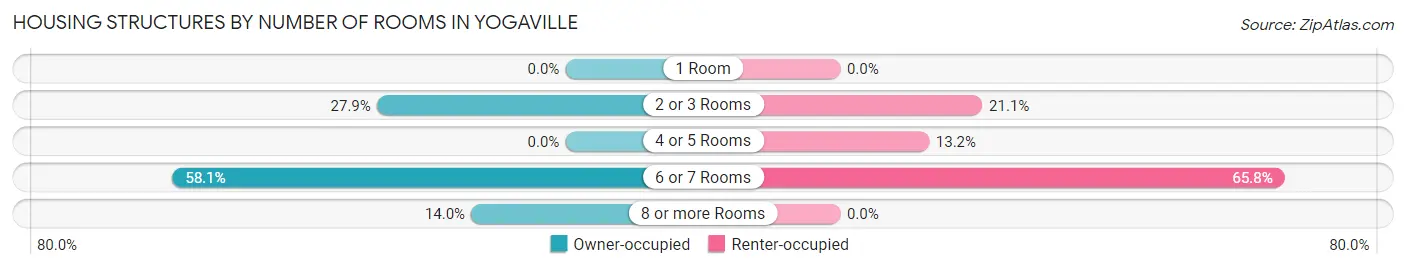
| Number of Rooms | Owner-occupied | Renter-occupied |
| 1 Room | 0 (0.0%) | 0 (0.0%) |
| 2 or 3 Rooms | 12 (27.9%) | 8 (21.0%) |
| 4 or 5 Rooms | 0 (0.0%) | 5 (13.2%) |
| 6 or 7 Rooms | 25 (58.1%) | 25 (65.8%) |
| 8 or more Rooms | 6 (14.0%) | 0 (0.0%) |
| Total | 43 (100.0%) | 38 (100.0%) |
Housing Structure by Heating Type in Yogaville
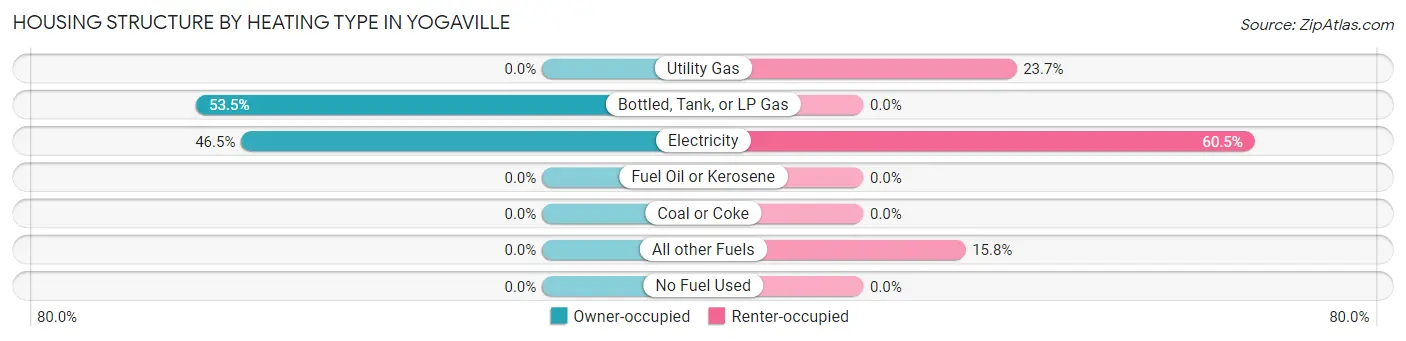
| Heating Type | Owner-occupied | Renter-occupied |
| Utility Gas | 0 (0.0%) | 9 (23.7%) |
| Bottled, Tank, or LP Gas | 23 (53.5%) | 0 (0.0%) |
| Electricity | 20 (46.5%) | 23 (60.5%) |
| Fuel Oil or Kerosene | 0 (0.0%) | 0 (0.0%) |
| Coal or Coke | 0 (0.0%) | 0 (0.0%) |
| All other Fuels | 0 (0.0%) | 6 (15.8%) |
| No Fuel Used | 0 (0.0%) | 0 (0.0%) |
| Total | 43 (100.0%) | 38 (100.0%) |
Household Vehicle Usage in Yogaville
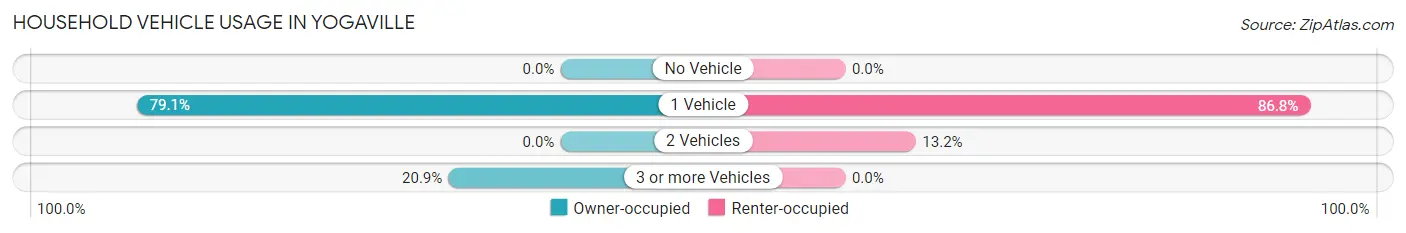
| Vehicles per Household | Owner-occupied | Renter-occupied |
| No Vehicle | 0 (0.0%) | 0 (0.0%) |
| 1 Vehicle | 34 (79.1%) | 33 (86.8%) |
| 2 Vehicles | 0 (0.0%) | 5 (13.2%) |
| 3 or more Vehicles | 9 (20.9%) | 0 (0.0%) |
| Total | 43 (100.0%) | 38 (100.0%) |
Real Estate & Mortgages in Yogaville
Real Estate and Mortgage Overview in Yogaville
| Characteristic | Without Mortgage | With Mortgage |
| Housing Units | 43 | 0 |
| Median Property Value | - | - |
| Median Household Income | $92,898 | $0 |
| Monthly Housing Costs | - | - |
| Real Estate Taxes | - | - |
Property Value by Mortgage Status in Yogaville
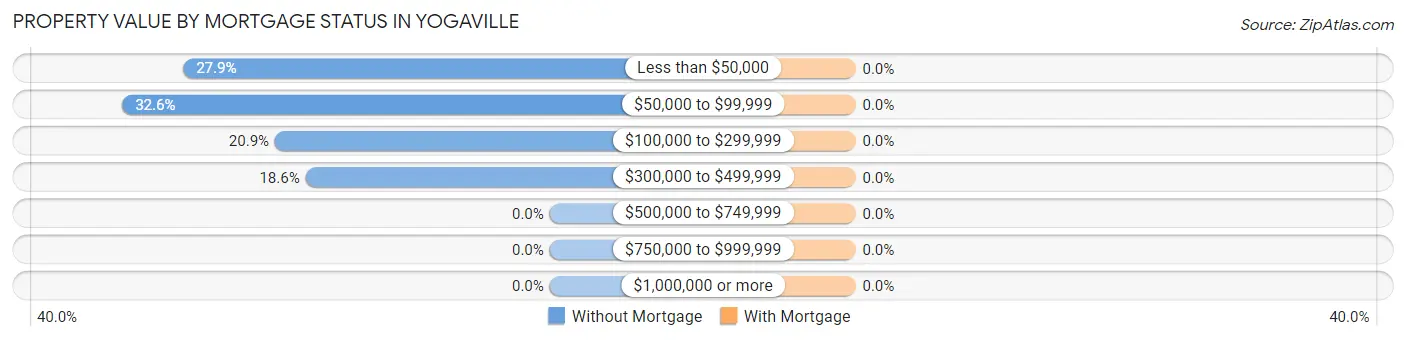
| Property Value | Without Mortgage | With Mortgage |
| Less than $50,000 | 12 (27.9%) | 0 (0.0%) |
| $50,000 to $99,999 | 14 (32.6%) | 0 (0.0%) |
| $100,000 to $299,999 | 9 (20.9%) | 0 (0.0%) |
| $300,000 to $499,999 | 8 (18.6%) | 0 (0.0%) |
| $500,000 to $749,999 | 0 (0.0%) | 0 (0.0%) |
| $750,000 to $999,999 | 0 (0.0%) | 0 (0.0%) |
| $1,000,000 or more | 0 (0.0%) | 0 (0.0%) |
| Total | 43 (100.0%) | 0 (0.0%) |
Household Income by Mortgage Status in Yogaville
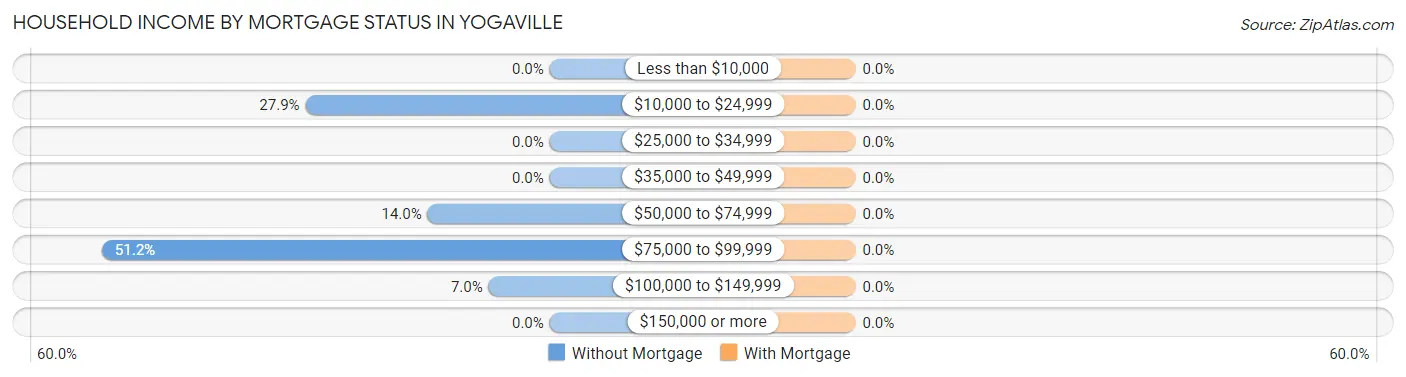
| Household Income | Without Mortgage | With Mortgage |
| Less than $10,000 | 0 (0.0%) | 0 (0.0%) |
| $10,000 to $24,999 | 12 (27.9%) | 0 (0.0%) |
| $25,000 to $34,999 | 0 (0.0%) | 0 (0.0%) |
| $35,000 to $49,999 | 0 (0.0%) | 0 (0.0%) |
| $50,000 to $74,999 | 6 (14.0%) | 0 (0.0%) |
| $75,000 to $99,999 | 22 (51.2%) | 0 (0.0%) |
| $100,000 to $149,999 | 3 (7.0%) | 0 (0.0%) |
| $150,000 or more | 0 (0.0%) | 0 (0.0%) |
| Total | 43 (100.0%) | 0 (0.0%) |
Property Value to Household Income Ratio in Yogaville
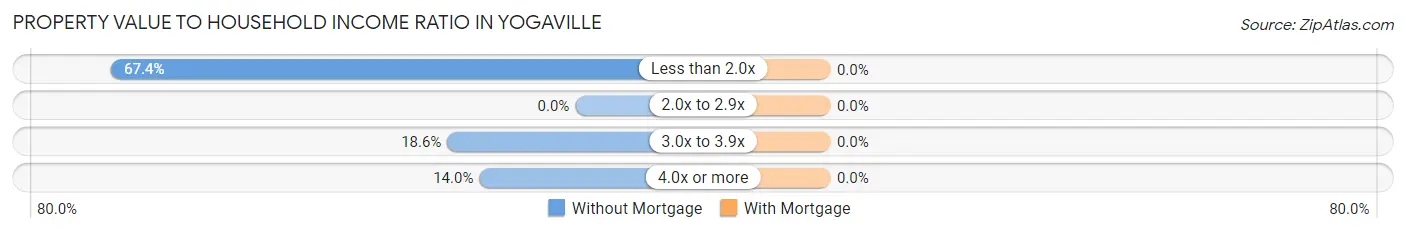
| Value-to-Income Ratio | Without Mortgage | With Mortgage |
| Less than 2.0x | 29 (67.4%) | 0 (0.0%) |
| 2.0x to 2.9x | 0 (0.0%) | 0 (0.0%) |
| 3.0x to 3.9x | 8 (18.6%) | 0 (0.0%) |
| 4.0x or more | 6 (14.0%) | 0 (0.0%) |
| Total | 43 (100.0%) | 0 (0.0%) |
Real Estate Taxes by Mortgage Status in Yogaville
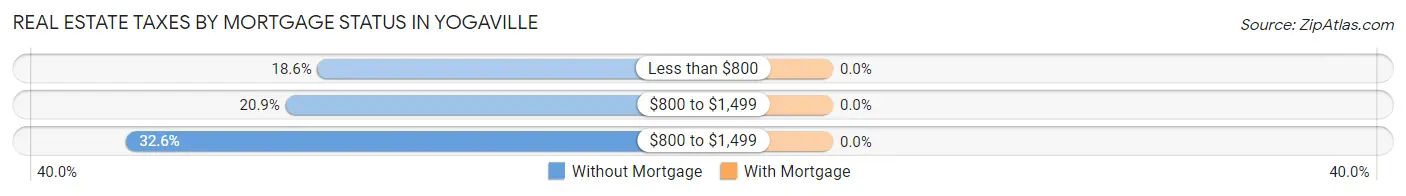
| Property Taxes | Without Mortgage | With Mortgage |
| Less than $800 | 8 (18.6%) | 0 (0.0%) |
| $800 to $1,499 | 9 (20.9%) | 0 (0.0%) |
| $800 to $1,499 | 14 (32.6%) | 0 (0.0%) |
| Total | 43 (100.0%) | 0 (0.0%) |
Health & Disability in Yogaville
Health Insurance Coverage by Age in Yogaville
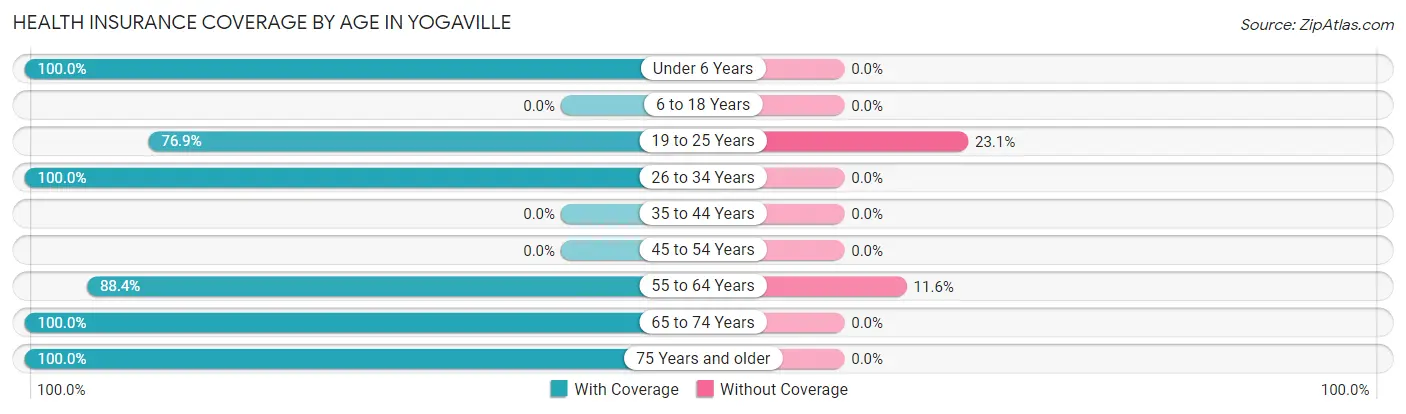
| Age Bracket | With Coverage | Without Coverage |
| Under 6 Years | 2 (100.0%) | 0 (0.0%) |
| 6 to 18 Years | 0 (0.0%) | 0 (0.0%) |
| 19 to 25 Years | 10 (76.9%) | 3 (23.1%) |
| 26 to 34 Years | 12 (100.0%) | 0 (0.0%) |
| 35 to 44 Years | 0 (0.0%) | 0 (0.0%) |
| 45 to 54 Years | 0 (0.0%) | 0 (0.0%) |
| 55 to 64 Years | 38 (88.4%) | 5 (11.6%) |
| 65 to 74 Years | 60 (100.0%) | 0 (0.0%) |
| 75 Years and older | 14 (100.0%) | 0 (0.0%) |
| Total | 136 (94.4%) | 8 (5.6%) |
Health Insurance Coverage by Citizenship Status in Yogaville
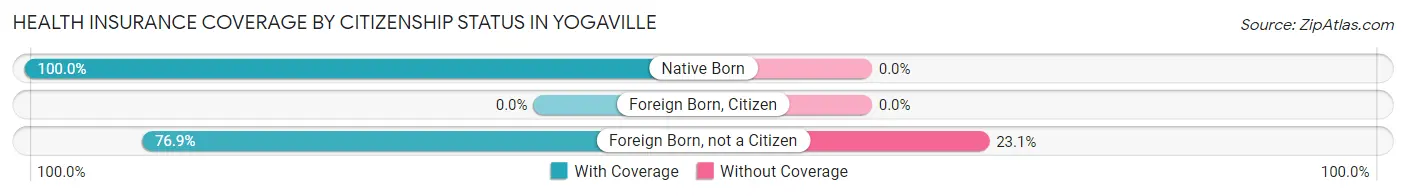
| Citizenship Status | With Coverage | Without Coverage |
| Native Born | 2 (100.0%) | 0 (0.0%) |
| Foreign Born, Citizen | 0 (0.0%) | 0 (0.0%) |
| Foreign Born, not a Citizen | 10 (76.9%) | 3 (23.1%) |
Health Insurance Coverage by Household Income in Yogaville
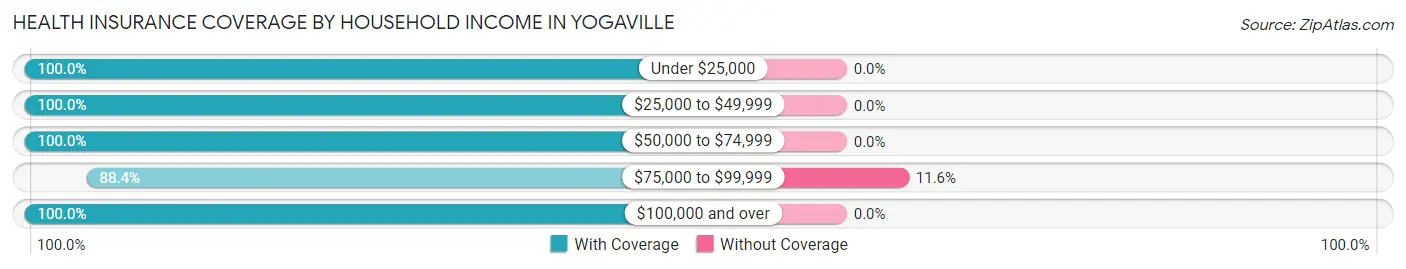
| Household Income | With Coverage | Without Coverage |
| Under $25,000 | 25 (100.0%) | 0 (0.0%) |
| $25,000 to $49,999 | 39 (100.0%) | 0 (0.0%) |
| $50,000 to $74,999 | 12 (100.0%) | 0 (0.0%) |
| $75,000 to $99,999 | 38 (88.4%) | 5 (11.6%) |
| $100,000 and over | 8 (100.0%) | 0 (0.0%) |
Public vs Private Health Insurance Coverage by Age in Yogaville
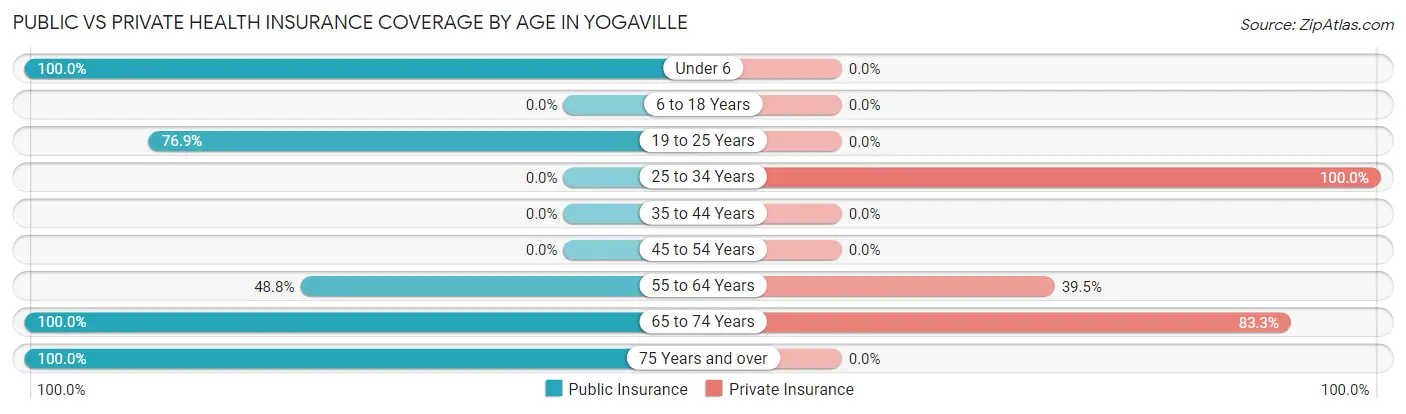
| Age Bracket | Public Insurance | Private Insurance |
| Under 6 | 2 (100.0%) | 0 (0.0%) |
| 6 to 18 Years | 0 (0.0%) | 0 (0.0%) |
| 19 to 25 Years | 10 (76.9%) | 0 (0.0%) |
| 25 to 34 Years | 0 (0.0%) | 12 (100.0%) |
| 35 to 44 Years | 0 (0.0%) | 0 (0.0%) |
| 45 to 54 Years | 0 (0.0%) | 0 (0.0%) |
| 55 to 64 Years | 21 (48.8%) | 17 (39.5%) |
| 65 to 74 Years | 60 (100.0%) | 50 (83.3%) |
| 75 Years and over | 14 (100.0%) | 0 (0.0%) |
| Total | 107 (74.3%) | 79 (54.9%) |
Disability Status by Sex by Age in Yogaville
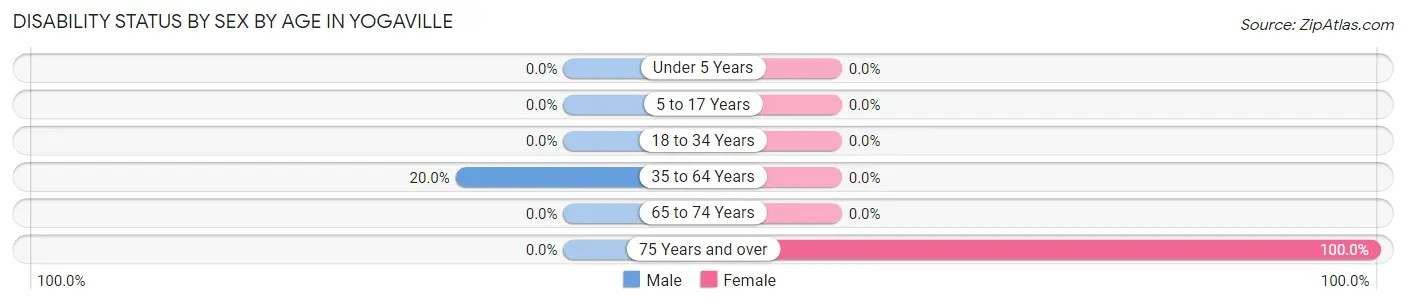
| Age Bracket | Male | Female |
| Under 5 Years | 0 (0.0%) | 0 (0.0%) |
| 5 to 17 Years | 0 (0.0%) | 0 (0.0%) |
| 18 to 34 Years | 0 (0.0%) | 0 (0.0%) |
| 35 to 64 Years | 5 (20.0%) | 0 (0.0%) |
| 65 to 74 Years | 0 (0.0%) | 0 (0.0%) |
| 75 Years and over | 0 (0.0%) | 14 (100.0%) |
Disability Class by Sex by Age in Yogaville
Disability Class: Hearing Difficulty
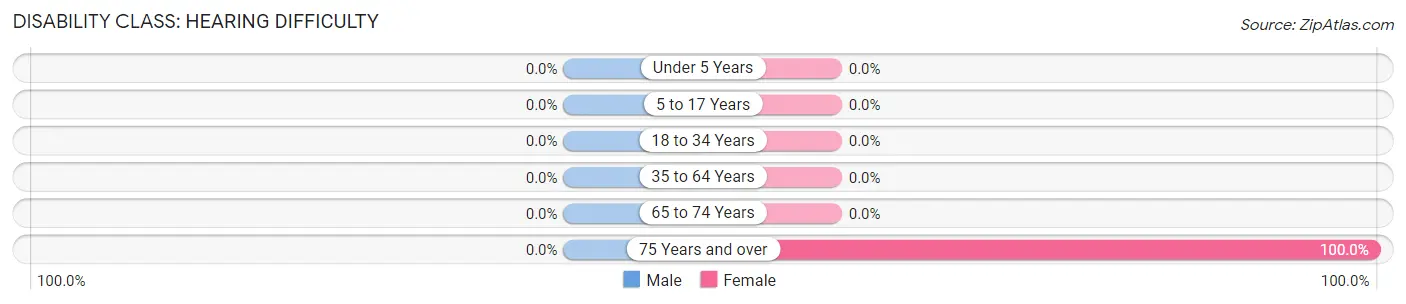
| Age Bracket | Male | Female |
| Under 5 Years | 0 (0.0%) | 0 (0.0%) |
| 5 to 17 Years | 0 (0.0%) | 0 (0.0%) |
| 18 to 34 Years | 0 (0.0%) | 0 (0.0%) |
| 35 to 64 Years | 0 (0.0%) | 0 (0.0%) |
| 65 to 74 Years | 0 (0.0%) | 0 (0.0%) |
| 75 Years and over | 0 (0.0%) | 14 (100.0%) |
Disability Class: Vision Difficulty
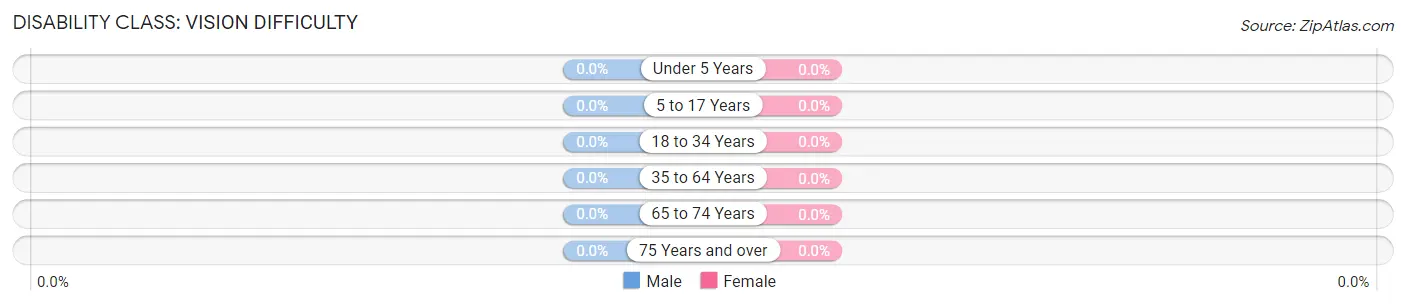
| Age Bracket | Male | Female |
| Under 5 Years | 0 (0.0%) | 0 (0.0%) |
| 5 to 17 Years | 0 (0.0%) | 0 (0.0%) |
| 18 to 34 Years | 0 (0.0%) | 0 (0.0%) |
| 35 to 64 Years | 0 (0.0%) | 0 (0.0%) |
| 65 to 74 Years | 0 (0.0%) | 0 (0.0%) |
| 75 Years and over | 0 (0.0%) | 0 (0.0%) |
Disability Class: Cognitive Difficulty
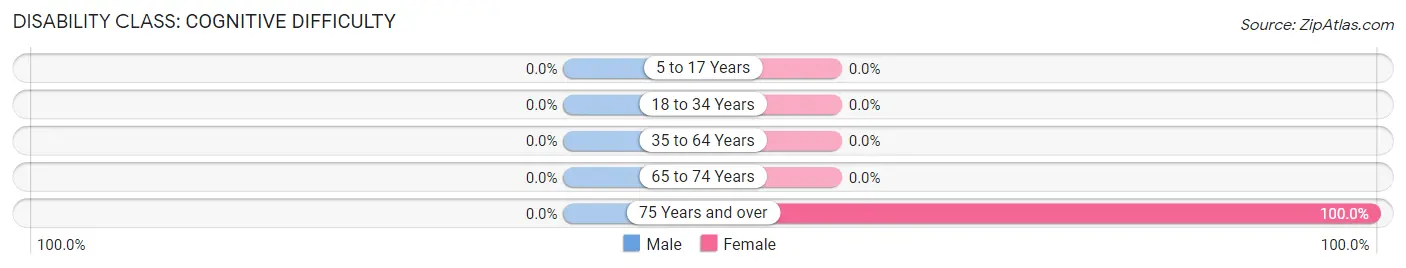
| Age Bracket | Male | Female |
| 5 to 17 Years | 0 (0.0%) | 0 (0.0%) |
| 18 to 34 Years | 0 (0.0%) | 0 (0.0%) |
| 35 to 64 Years | 0 (0.0%) | 0 (0.0%) |
| 65 to 74 Years | 0 (0.0%) | 0 (0.0%) |
| 75 Years and over | 0 (0.0%) | 14 (100.0%) |
Disability Class: Ambulatory Difficulty
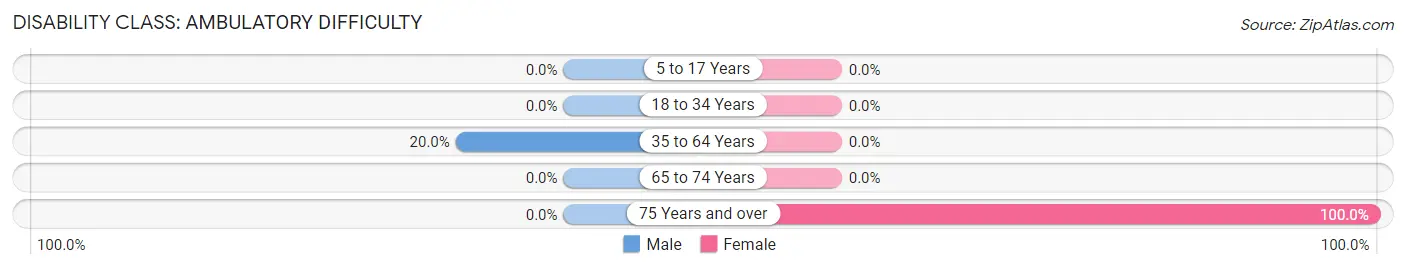
| Age Bracket | Male | Female |
| 5 to 17 Years | 0 (0.0%) | 0 (0.0%) |
| 18 to 34 Years | 0 (0.0%) | 0 (0.0%) |
| 35 to 64 Years | 5 (20.0%) | 0 (0.0%) |
| 65 to 74 Years | 0 (0.0%) | 0 (0.0%) |
| 75 Years and over | 0 (0.0%) | 14 (100.0%) |
Disability Class: Self-Care Difficulty
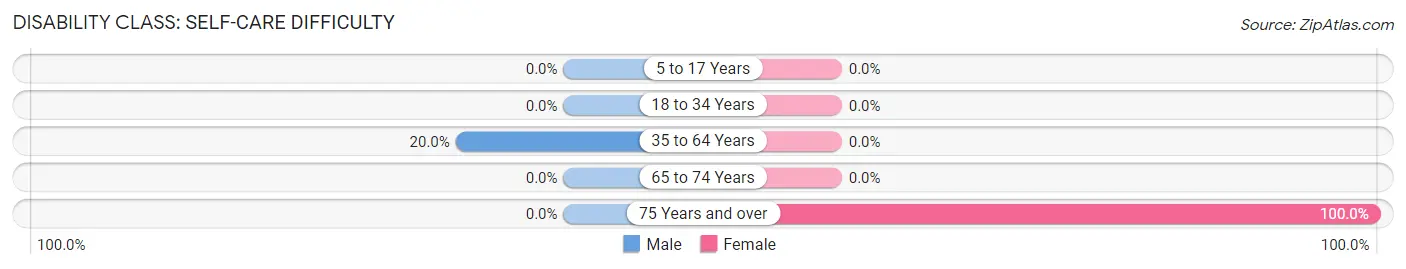
| Age Bracket | Male | Female |
| 5 to 17 Years | 0 (0.0%) | 0 (0.0%) |
| 18 to 34 Years | 0 (0.0%) | 0 (0.0%) |
| 35 to 64 Years | 5 (20.0%) | 0 (0.0%) |
| 65 to 74 Years | 0 (0.0%) | 0 (0.0%) |
| 75 Years and over | 0 (0.0%) | 14 (100.0%) |
Technology Access in Yogaville
Computing Device Access in Yogaville
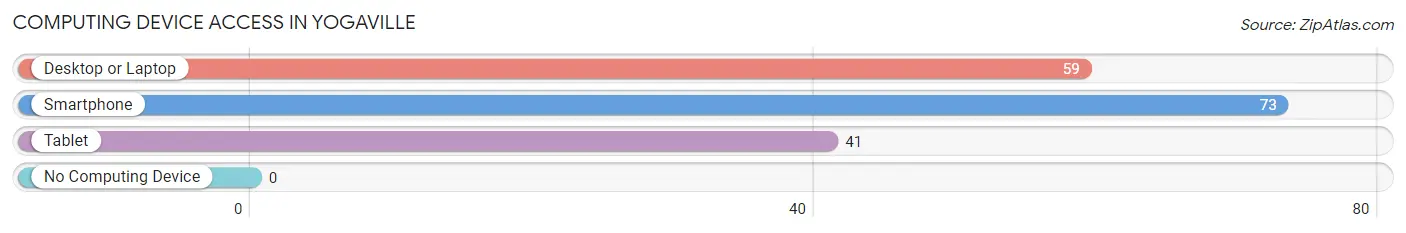
| Device Type | # Households | % Households |
| Desktop or Laptop | 59 | 72.8% |
| Smartphone | 73 | 90.1% |
| Tablet | 41 | 50.6% |
| No Computing Device | 0 | 0.0% |
| Total | 81 | 100.0% |
Internet Access in Yogaville
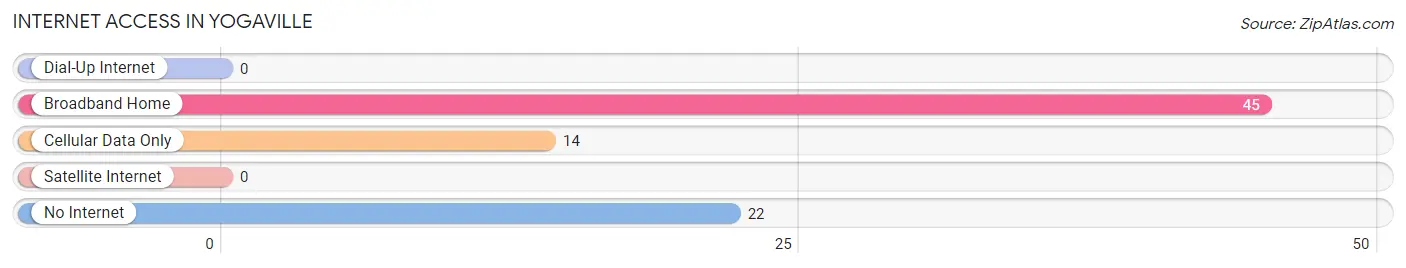
| Internet Type | # Households | % Households |
| Dial-Up Internet | 0 | 0.0% |
| Broadband Home | 45 | 55.6% |
| Cellular Data Only | 14 | 17.3% |
| Satellite Internet | 0 | 0.0% |
| No Internet | 22 | 27.2% |
| Total | 81 | 100.0% |
Yogaville Summary
Yogaville, Virginia is a small unincorporated community located in Buckingham County, Virginia. It is situated on the banks of the James River, approximately 25 miles east of Lynchburg. The community is home to the Satchidananda Ashram, a spiritual retreat center founded by Sri Swami Satchidananda in 1979. The ashram is the center of the community and is home to a variety of spiritual activities, including yoga, meditation, and chanting.
History
Yogaville was founded in 1979 by Sri Swami Satchidananda, a spiritual leader and teacher of yoga and meditation. He purchased the land in Buckingham County, Virginia, and established the Satchidananda Ashram, which is the center of the community. The ashram is home to a variety of spiritual activities, including yoga, meditation, and chanting.
The ashram has grown over the years and now includes a variety of facilities, including a meditation hall, a library, a retreat center, and a temple. The ashram also offers a variety of classes and workshops on yoga, meditation, and other spiritual topics.
Geography
Yogaville is located in Buckingham County, Virginia, approximately 25 miles east of Lynchburg. The community is situated on the banks of the James River, and is surrounded by rolling hills and forests. The climate in the area is temperate, with hot summers and mild winters.
Economy
The economy of Yogaville is largely based on the Satchidananda Ashram, which is the center of the community. The ashram offers a variety of spiritual activities, including yoga, meditation, and chanting. The ashram also offers a variety of classes and workshops on yoga, meditation, and other spiritual topics.
The ashram also provides employment opportunities for the local community. In addition to the ashram, there are a few small businesses in the area, including a general store, a restaurant, and a few bed and breakfasts.
Demographics
As of the 2010 census, the population of Yogaville was 1,092. The racial makeup of the community was 95.3% White, 1.2% African American, 0.7% Native American, 0.3% Asian, 0.1% Pacific Islander, and 2.4% from other races. The median household income was $37,500, and the median age was 44.
Conclusion
Yogaville, Virginia is a small unincorporated community located in Buckingham County, Virginia. It is situated on the banks of the James River, approximately 25 miles east of Lynchburg. The community is home to the Satchidananda Ashram, a spiritual retreat center founded by Sri Swami Satchidananda in 1979. The ashram is the center of the community and is home to a variety of spiritual activities, including yoga, meditation, and chanting. The economy of Yogaville is largely based on the Satchidananda Ashram, which provides employment opportunities for the local community. As of the 2010 census, the population of Yogaville was 1,092. The racial makeup of the community was 95.3% White, 1.2% African American, 0.7% Native American, 0.3% Asian, 0.1% Pacific Islander, and 2.4% from other races. The median household income was $37,500, and the median age was 44.
Common Questions
What is Per Capita Income in Yogaville?
Per Capita income in Yogaville is $30,203.
What is the Median Family Income in Yogaville?
Median Family Income in Yogaville is $93,068.
What is the Median Household income in Yogaville?
Median Household Income in Yogaville is $39,028.
What is Income or Wage Gap in Yogaville?
Income or Wage Gap in Yogaville is 21.6%.
Women in Yogaville earn 78.4 cents for every dollar earned by a man.
What is Inequality or Gini Index in Yogaville?
Inequality or Gini Index in Yogaville is 0.40.
What is the Total Population of Yogaville?
Total Population of Yogaville is 144.
What is the Total Male Population of Yogaville?
Total Male Population of Yogaville is 65.
What is the Total Female Population of Yogaville?
Total Female Population of Yogaville is 79.
What is the Ratio of Males per 100 Females in Yogaville?
There are 82.28 Males per 100 Females in Yogaville.
What is the Ratio of Females per 100 Males in Yogaville?
There are 121.54 Females per 100 Males in Yogaville.
What is the Median Population Age in Yogaville?
Median Population Age in Yogaville is 67.2 Years.
What is the Average Family Size in Yogaville
Average Family Size in Yogaville is 2.1 People.
What is the Average Household Size in Yogaville
Average Household Size in Yogaville is 1.6 People.
How Large is the Labor Force in Yogaville?
There are 65 People in the Labor Forcein in Yogaville.
What is the Percentage of People in the Labor Force in Yogaville?
45.8% of People are in the Labor Force in Yogaville.