Harriston, VA Map & Demographics
Harriston Map
Harriston Overview
$31,327
PER CAPITA INCOME
$91,917
AVG FAMILY INCOME
$86,544
AVG HOUSEHOLD INCOME
20.6%
WAGE / INCOME GAP [ % ]
79.4¢/ $1
WAGE / INCOME GAP [ $ ]
0.30
INEQUALITY / GINI INDEX
1,033
TOTAL POPULATION
531
MALE POPULATION
502
FEMALE POPULATION
105.78
MALES / 100 FEMALES
94.54
FEMALES / 100 MALES
40.7
MEDIAN AGE
3.4
AVG FAMILY SIZE
2.4
AVG HOUSEHOLD SIZE
491
LABOR FORCE [ PEOPLE ]
59.7%
PERCENT IN LABOR FORCE
Income in Harriston
Income Overview in Harriston
Per Capita Income in Harriston is $31,327, while median incomes of families and households are $91,917 and $86,544 respectively.
| Characteristic | Number | Measure |
| Per Capita Income | 1,033 | $31,327 |
| Median Family Income | 240 | $91,917 |
| Mean Family Income | 240 | $91,654 |
| Median Household Income | 433 | $86,544 |
| Mean Household Income | 433 | $71,556 |
| Income Deficit | 240 | $0 |
| Wage / Income Gap (%) | 1,033 | 20.57% |
| Wage / Income Gap ($) | 1,033 | 79.43¢ per $1 |
| Gini / Inequality Index | 1,033 | 0.30 |
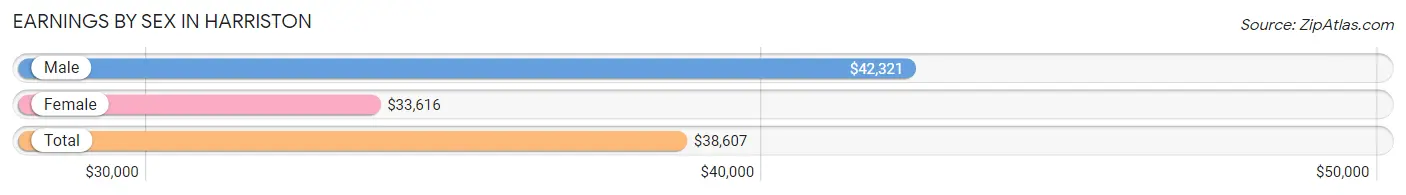
Earnings by Sex in Harriston
Average Earnings in Harriston are $38,607, $42,321 for men and $33,616 for women, a difference of 20.6%.
| Sex | Number | Average Earnings |
| Male | 315 (60.6%) | $42,321 |
| Female | 205 (39.4%) | $33,616 |
| Total | 520 (100.0%) | $38,607 |
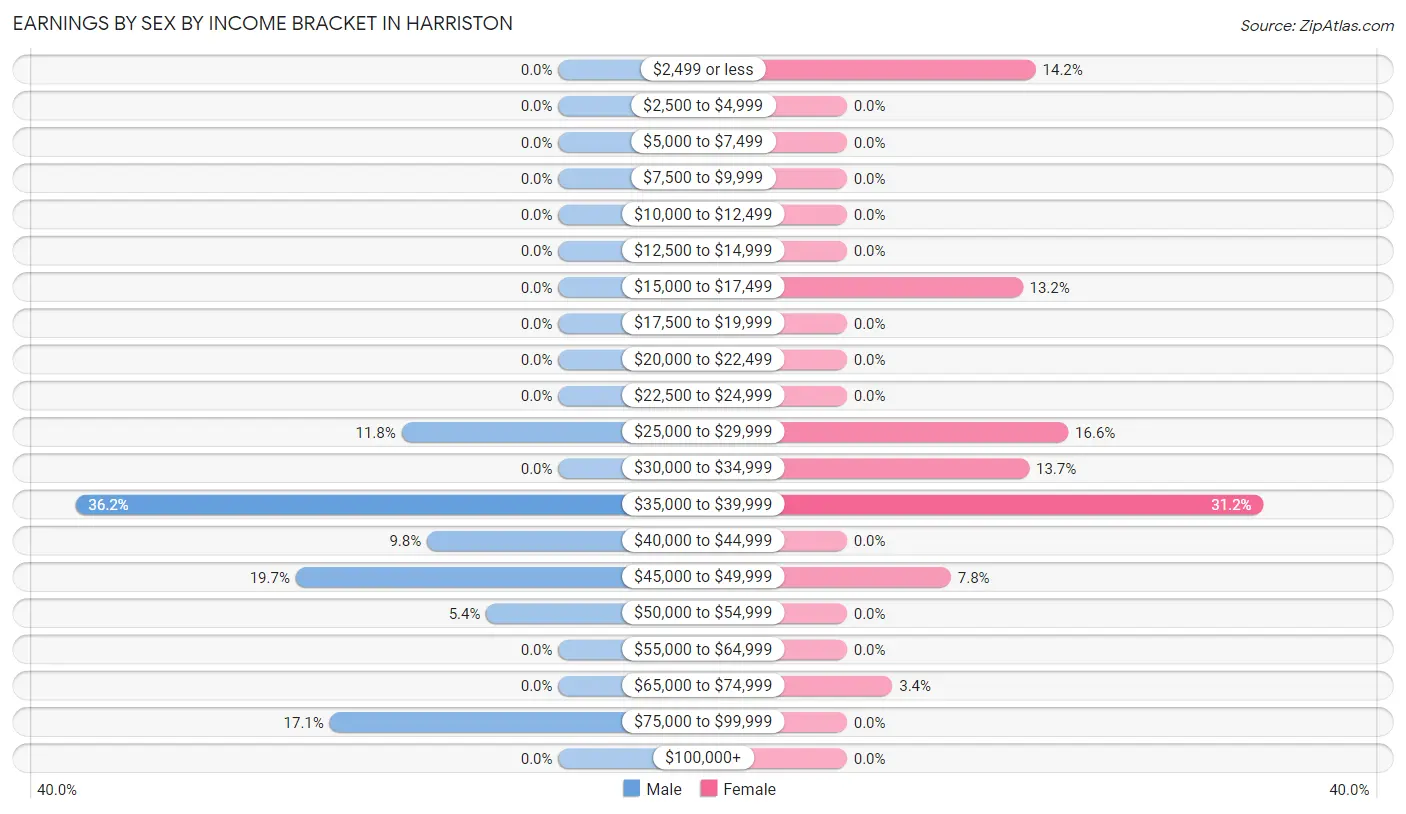
Earnings by Sex by Income Bracket in Harriston
The most common earnings brackets in Harriston are $35,000 to $39,999 for men (114 | 36.2%) and $35,000 to $39,999 for women (64 | 31.2%).
| Income | Male | Female |
| $2,499 or less | 0 (0.0%) | 29 (14.1%) |
| $2,500 to $4,999 | 0 (0.0%) | 0 (0.0%) |
| $5,000 to $7,499 | 0 (0.0%) | 0 (0.0%) |
| $7,500 to $9,999 | 0 (0.0%) | 0 (0.0%) |
| $10,000 to $12,499 | 0 (0.0%) | 0 (0.0%) |
| $12,500 to $14,999 | 0 (0.0%) | 0 (0.0%) |
| $15,000 to $17,499 | 0 (0.0%) | 27 (13.2%) |
| $17,500 to $19,999 | 0 (0.0%) | 0 (0.0%) |
| $20,000 to $22,499 | 0 (0.0%) | 0 (0.0%) |
| $22,500 to $24,999 | 0 (0.0%) | 0 (0.0%) |
| $25,000 to $29,999 | 37 (11.7%) | 34 (16.6%) |
| $30,000 to $34,999 | 0 (0.0%) | 28 (13.7%) |
| $35,000 to $39,999 | 114 (36.2%) | 64 (31.2%) |
| $40,000 to $44,999 | 31 (9.8%) | 0 (0.0%) |
| $45,000 to $49,999 | 62 (19.7%) | 16 (7.8%) |
| $50,000 to $54,999 | 17 (5.4%) | 0 (0.0%) |
| $55,000 to $64,999 | 0 (0.0%) | 0 (0.0%) |
| $65,000 to $74,999 | 0 (0.0%) | 7 (3.4%) |
| $75,000 to $99,999 | 54 (17.1%) | 0 (0.0%) |
| $100,000+ | 0 (0.0%) | 0 (0.0%) |
| Total | 315 (100.0%) | 205 (100.0%) |
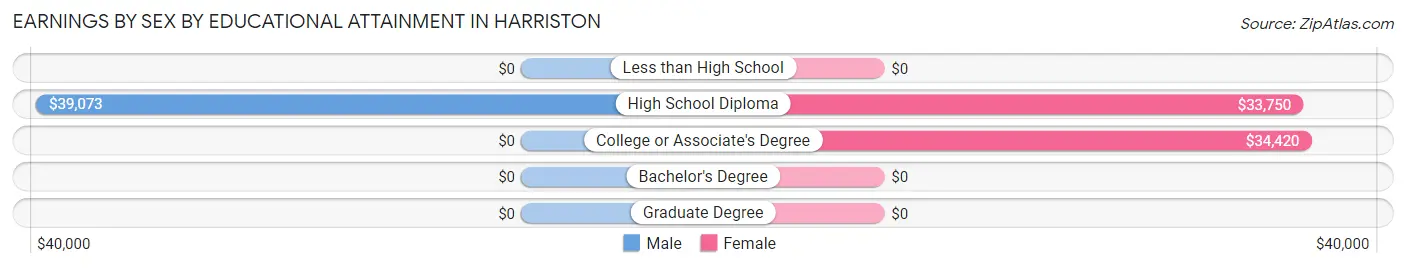
Earnings by Sex by Educational Attainment in Harriston
Average earnings in Harriston are $43,281 for men and $36,058 for women, a difference of 16.7%. Men with an educational attainment of high school diploma enjoy the highest average annual earnings of $39,073, while those with high school diploma education earn the least with $39,073. Women with an educational attainment of college or associate's degree earn the most with the average annual earnings of $34,420, while those with high school diploma education have the smallest earnings of $33,750.
| Educational Attainment | Male Income | Female Income |
| Less than High School | - | - |
| High School Diploma | $39,073 | $33,750 |
| College or Associate's Degree | - | - |
| Bachelor's Degree | - | - |
| Graduate Degree | - | - |
| Total | $43,281 | $36,058 |
Family Income in Harriston
Family Income Brackets in Harriston
According to the Harriston family income data, there are 113 families falling into the $100,000 to $149,999 income range, which is the most common income bracket and makes up 47.1% of all families.
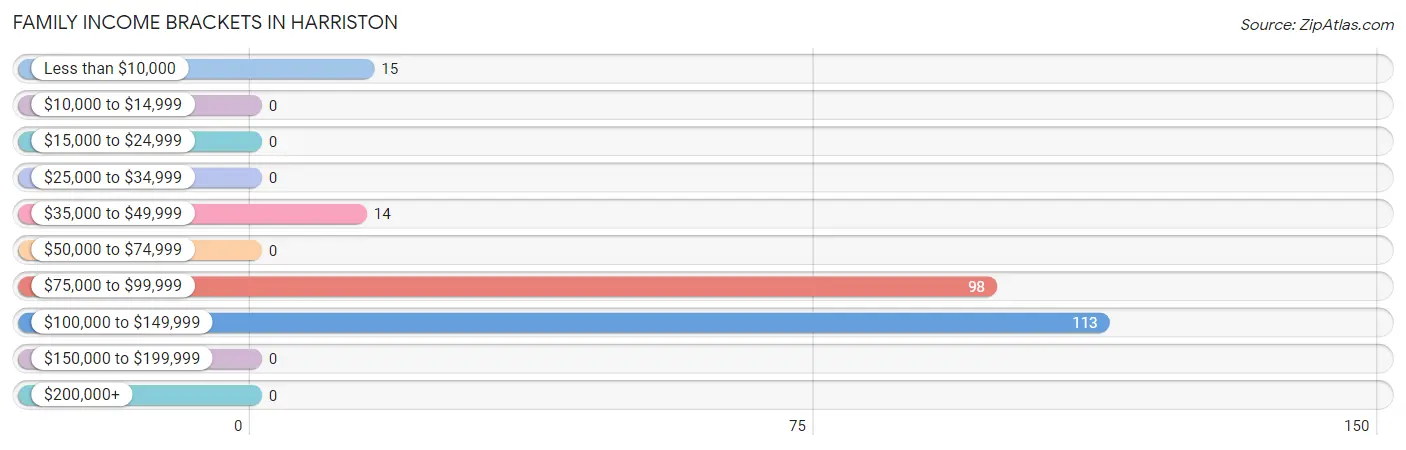
| Income Bracket | # Families | % Families |
| Less than $10,000 | 15 | 6.3% |
| $10,000 to $14,999 | 0 | 0.0% |
| $15,000 to $24,999 | 0 | 0.0% |
| $25,000 to $34,999 | 0 | 0.0% |
| $35,000 to $49,999 | 14 | 5.8% |
| $50,000 to $74,999 | 0 | 0.0% |
| $75,000 to $99,999 | 98 | 40.8% |
| $100,000 to $149,999 | 113 | 47.1% |
| $150,000 to $199,999 | 0 | 0.0% |
| $200,000+ | 0 | 0.0% |
Family Income by Famaliy Size in Harriston
2-person families (59 | 24.6%) account for the highest median family income in Harriston with $101,192 per family, while 2-person families (59 | 24.6%) have the highest median income of $50,596 per family member.
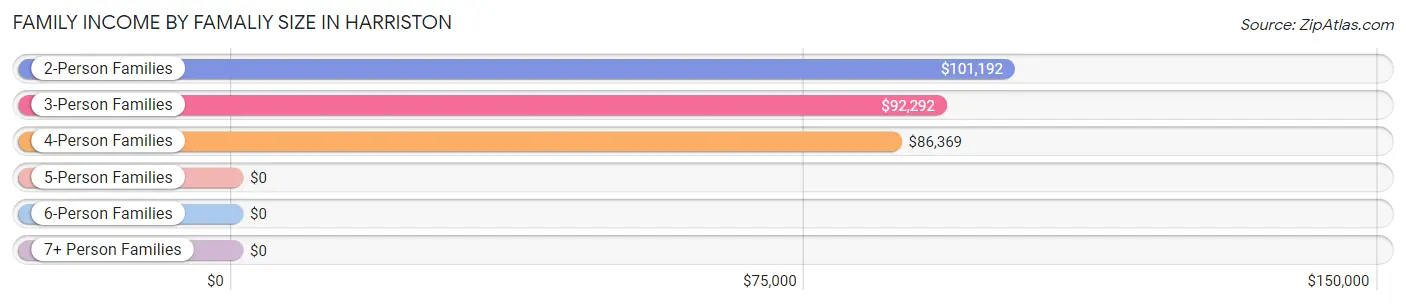
| Income Bracket | # Families | Median Income |
| 2-Person Families | 59 (24.6%) | $101,192 |
| 3-Person Families | 97 (40.4%) | $92,292 |
| 4-Person Families | 53 (22.1%) | $86,369 |
| 5-Person Families | 31 (12.9%) | $0 |
| 6-Person Families | 0 (0.0%) | $0 |
| 7+ Person Families | 0 (0.0%) | $0 |
| Total | 240 (100.0%) | $91,917 |
Family Income by Number of Earners in Harriston
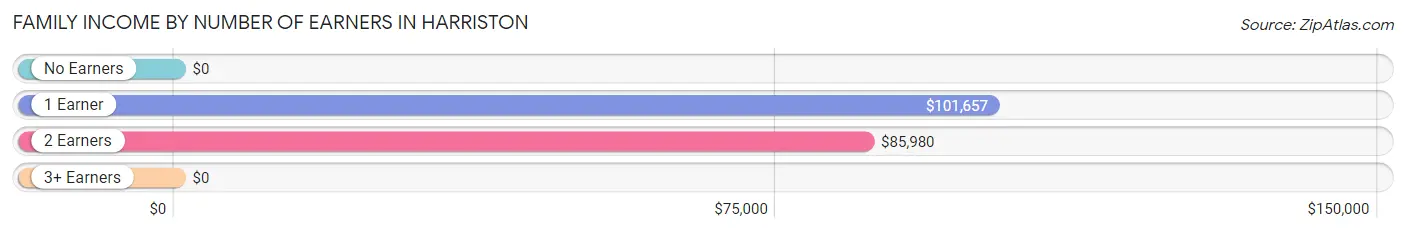
| Number of Earners | # Families | Median Income |
| No Earners | 0 (0.0%) | $0 |
| 1 Earner | 121 (50.4%) | $101,657 |
| 2 Earners | 102 (42.5%) | $85,980 |
| 3+ Earners | 17 (7.1%) | $0 |
| Total | 240 (100.0%) | $91,917 |
Household Income in Harriston
Household Income Brackets in Harriston
With 158 households falling in the category, the $75,000 to $99,999 income range is the most frequent in Harriston, accounting for 36.5% of all households.
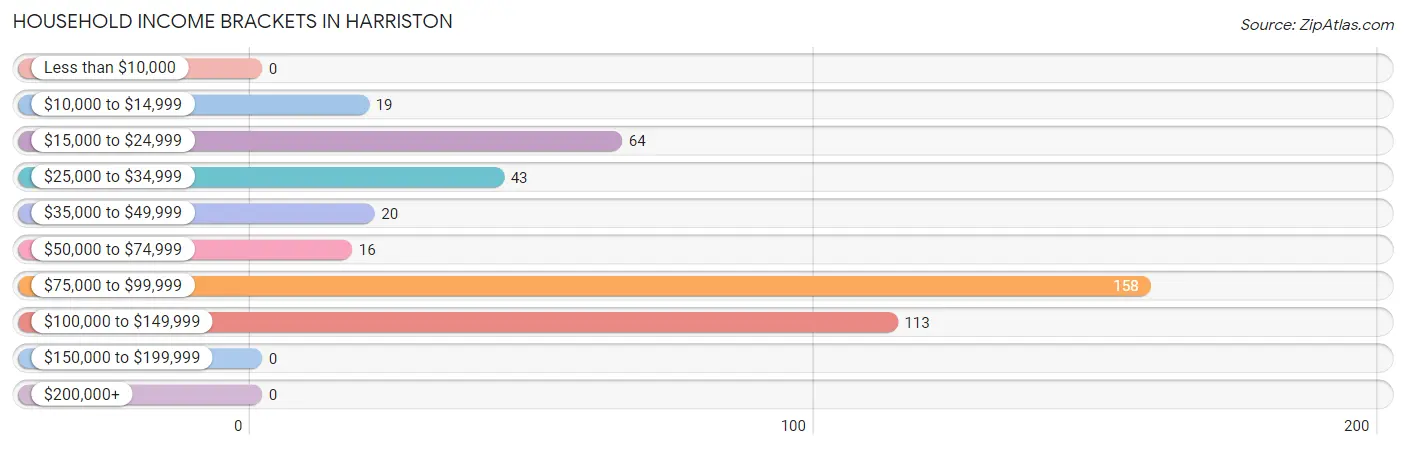
| Income Bracket | # Households | % Households |
| Less than $10,000 | 0 | 0.0% |
| $10,000 to $14,999 | 19 | 4.4% |
| $15,000 to $24,999 | 64 | 14.8% |
| $25,000 to $34,999 | 43 | 9.9% |
| $35,000 to $49,999 | 20 | 4.6% |
| $50,000 to $74,999 | 16 | 3.7% |
| $75,000 to $99,999 | 158 | 36.5% |
| $100,000 to $149,999 | 113 | 26.1% |
| $150,000 to $199,999 | 0 | 0.0% |
| $200,000+ | 0 | 0.0% |
Household Income by Householder Age in Harriston
The median household income in Harriston is $86,544, with the highest median household income of $101,279 found in the 45 to 64 years age bracket for the primary householder. A total of 168 households (38.8%) fall into this category. Meanwhile, the 15 to 24 years age bracket for the primary householder has the lowest median household income of $0, with 15 households (3.5%) in this group.
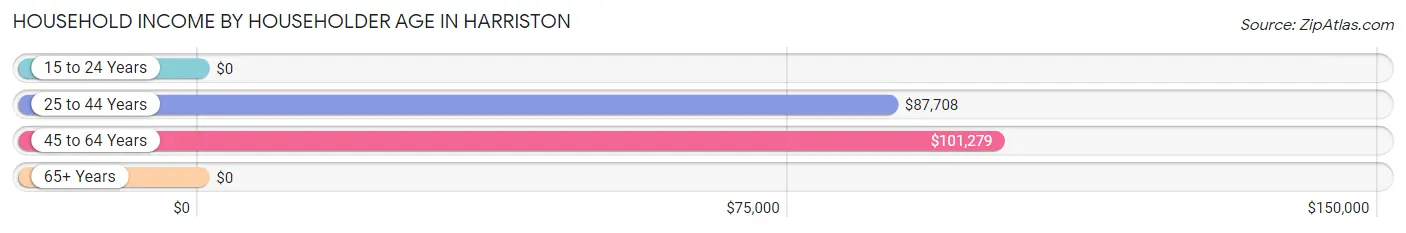
| Income Bracket | # Households | Median Income |
| 15 to 24 Years | 15 (3.5%) | $0 |
| 25 to 44 Years | 113 (26.1%) | $87,708 |
| 45 to 64 Years | 168 (38.8%) | $101,279 |
| 65+ Years | 137 (31.6%) | $0 |
| Total | 433 (100.0%) | $86,544 |
Poverty in Harriston
Income Below Poverty by Sex and Age in Harriston
With 6.2% poverty level for males and 7.8% for females among the residents of Harriston, under 5 year old males and under 5 year old females are the most vulnerable to poverty, with 33 males (41.8%) and 24 females (100.0%) in their respective age groups living below the poverty level.
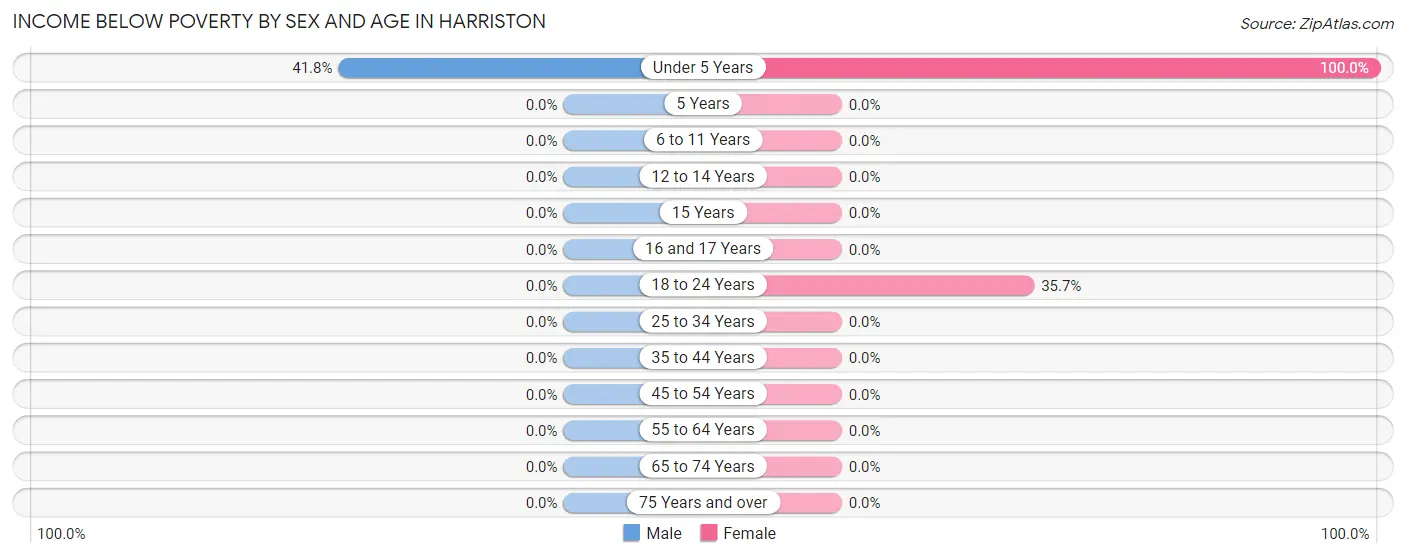
| Age Bracket | Male | Female |
| Under 5 Years | 33 (41.8%) | 24 (100.0%) |
| 5 Years | 0 (0.0%) | 0 (0.0%) |
| 6 to 11 Years | 0 (0.0%) | 0 (0.0%) |
| 12 to 14 Years | 0 (0.0%) | 0 (0.0%) |
| 15 Years | 0 (0.0%) | 0 (0.0%) |
| 16 and 17 Years | 0 (0.0%) | 0 (0.0%) |
| 18 to 24 Years | 0 (0.0%) | 15 (35.7%) |
| 25 to 34 Years | 0 (0.0%) | 0 (0.0%) |
| 35 to 44 Years | 0 (0.0%) | 0 (0.0%) |
| 45 to 54 Years | 0 (0.0%) | 0 (0.0%) |
| 55 to 64 Years | 0 (0.0%) | 0 (0.0%) |
| 65 to 74 Years | 0 (0.0%) | 0 (0.0%) |
| 75 Years and over | 0 (0.0%) | 0 (0.0%) |
| Total | 33 (6.2%) | 39 (7.8%) |
Income Above Poverty by Sex and Age in Harriston
According to the poverty statistics in Harriston, males aged 5 years and females aged 6 to 11 years are the age groups that are most secure financially, with 100.0% of males and 100.0% of females in these age groups living above the poverty line.
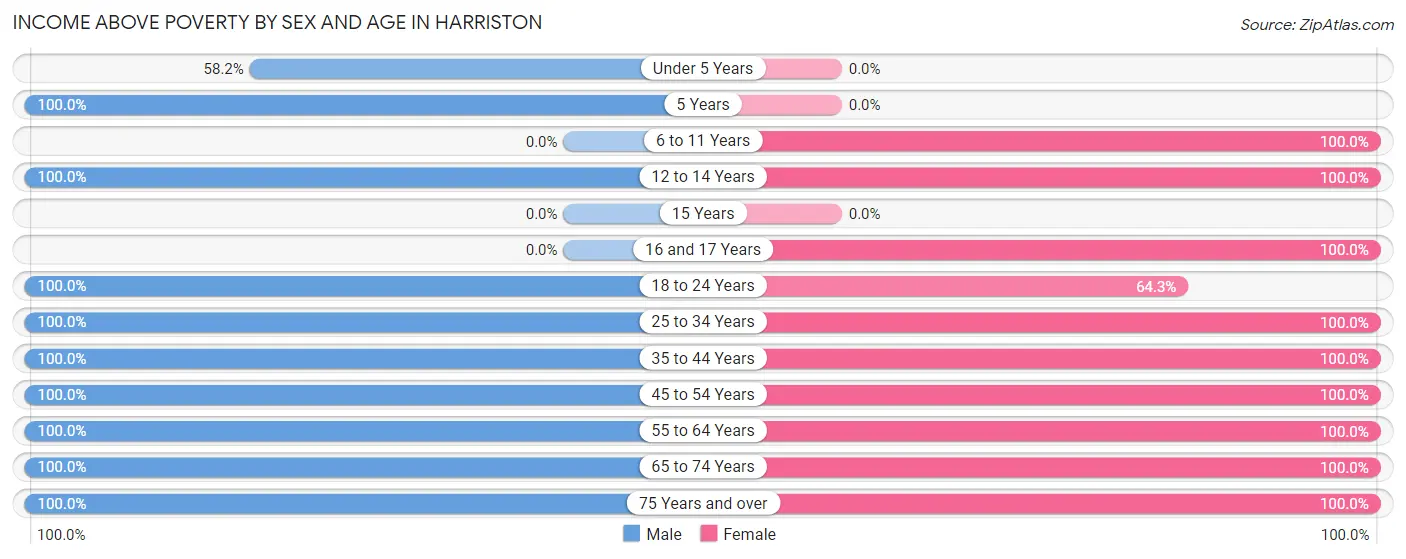
| Age Bracket | Male | Female |
| Under 5 Years | 46 (58.2%) | 0 (0.0%) |
| 5 Years | 17 (100.0%) | 0 (0.0%) |
| 6 to 11 Years | 0 (0.0%) | 50 (100.0%) |
| 12 to 14 Years | 21 (100.0%) | 20 (100.0%) |
| 15 Years | 0 (0.0%) | 0 (0.0%) |
| 16 and 17 Years | 0 (0.0%) | 30 (100.0%) |
| 18 to 24 Years | 16 (100.0%) | 27 (64.3%) |
| 25 to 34 Years | 77 (100.0%) | 84 (100.0%) |
| 35 to 44 Years | 89 (100.0%) | 7 (100.0%) |
| 45 to 54 Years | 41 (100.0%) | 30 (100.0%) |
| 55 to 64 Years | 61 (100.0%) | 121 (100.0%) |
| 65 to 74 Years | 98 (100.0%) | 27 (100.0%) |
| 75 Years and over | 32 (100.0%) | 67 (100.0%) |
| Total | 498 (93.8%) | 463 (92.2%) |
Income Below Poverty Among Married-Couple Families in Harriston
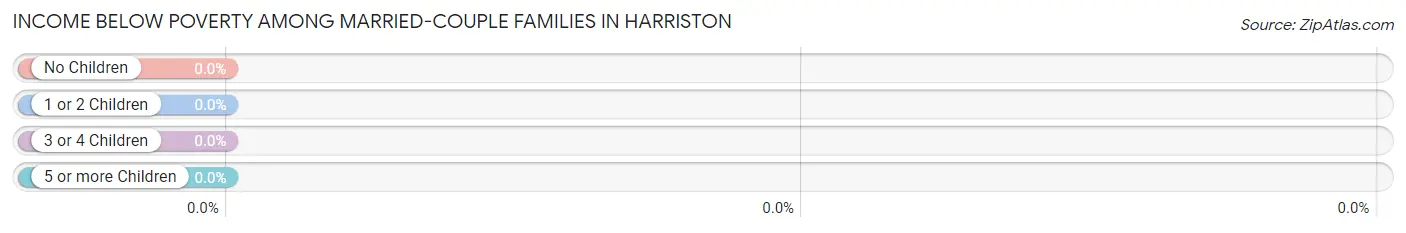
| Children | Above Poverty | Below Poverty |
| No Children | 143 (100.0%) | 0 (0.0%) |
| 1 or 2 Children | 51 (100.0%) | 0 (0.0%) |
| 3 or 4 Children | 31 (100.0%) | 0 (0.0%) |
| 5 or more Children | 0 (0.0%) | 0 (0.0%) |
| Total | 225 (100.0%) | 0 (0.0%) |
Income Below Poverty Among Single-Parent Households in Harriston
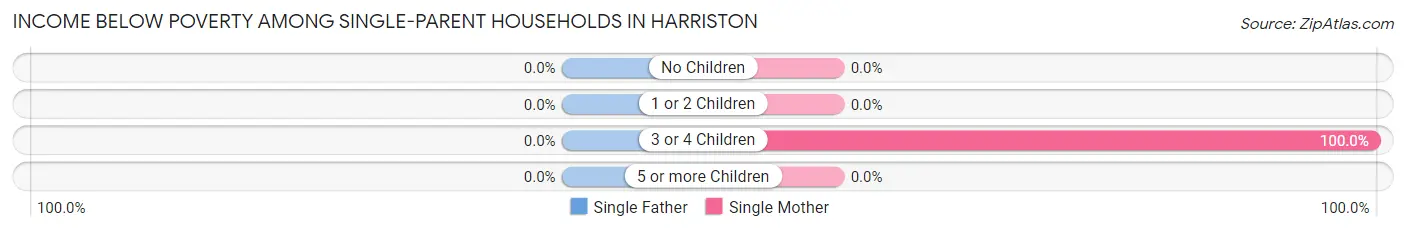
| Children | Single Father | Single Mother |
| No Children | 0 (0.0%) | 0 (0.0%) |
| 1 or 2 Children | 0 (0.0%) | 0 (0.0%) |
| 3 or 4 Children | 0 (0.0%) | 15 (100.0%) |
| 5 or more Children | 0 (0.0%) | 0 (0.0%) |
| Total | 0 (0.0%) | 15 (100.0%) |
Income Below Poverty Among Married-Couple vs Single-Parent Households in Harriston
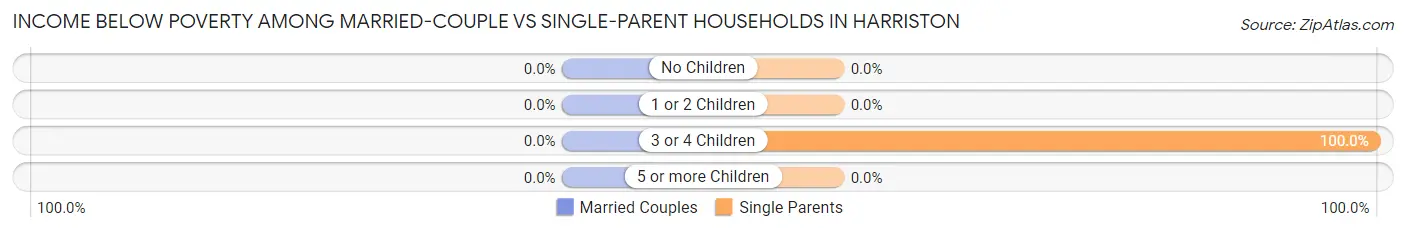
| Children | Married-Couple Families | Single-Parent Households |
| No Children | 0 (0.0%) | 0 (0.0%) |
| 1 or 2 Children | 0 (0.0%) | 0 (0.0%) |
| 3 or 4 Children | 0 (0.0%) | 15 (100.0%) |
| 5 or more Children | 0 (0.0%) | 0 (0.0%) |
| Total | 0 (0.0%) | 15 (100.0%) |
Race in Harriston
The most populous races in Harriston are White / Caucasian (738 | 71.4%), Two or more Races (140 | 13.6%), and Black / African American (116 | 11.2%).
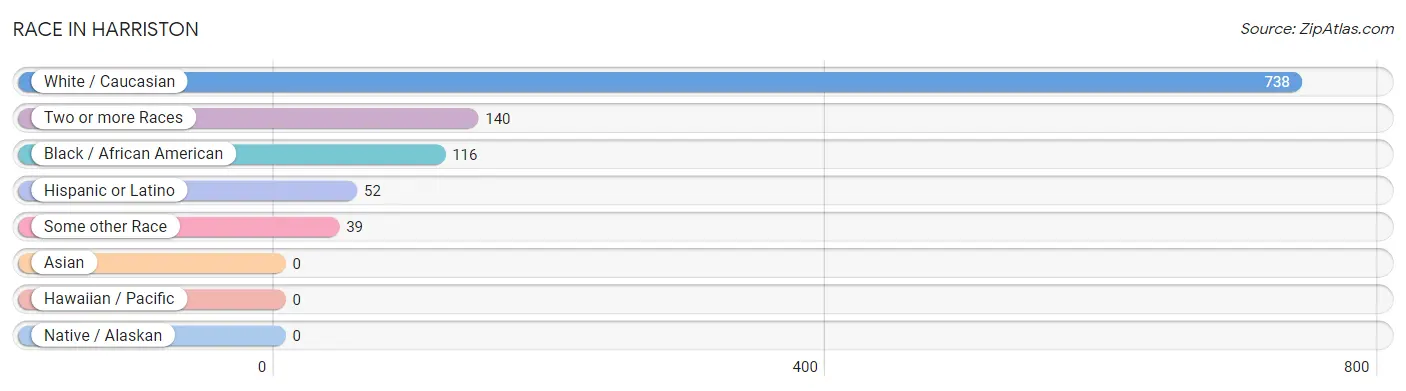
| Race | # Population | % Population |
| Asian | 0 | 0.0% |
| Black / African American | 116 | 11.2% |
| Hawaiian / Pacific | 0 | 0.0% |
| Hispanic or Latino | 52 | 5.0% |
| Native / Alaskan | 0 | 0.0% |
| White / Caucasian | 738 | 71.4% |
| Two or more Races | 140 | 13.6% |
| Some other Race | 39 | 3.8% |
| Total | 1,033 | 100.0% |
Ancestry in Harriston
The most populous ancestries reported in Harriston are English (223 | 21.6%), Irish (206 | 19.9%), American (186 | 18.0%), Cherokee (88 | 8.5%), and German (84 | 8.1%), together accounting for 76.2% of all Harriston residents.
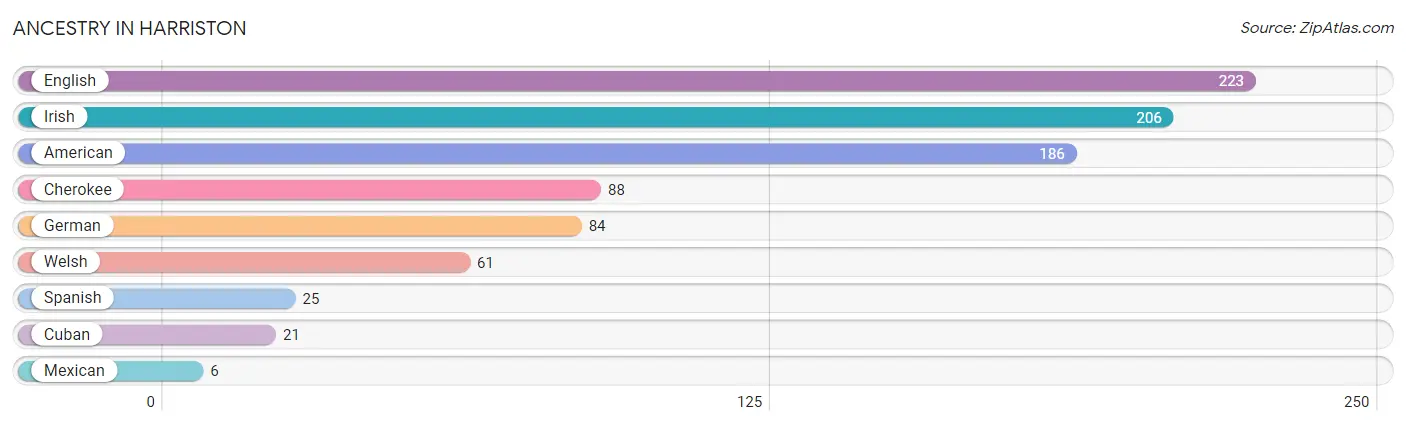
| Ancestry | # Population | % Population |
| American | 186 | 18.0% |
| Cherokee | 88 | 8.5% |
| Cuban | 21 | 2.0% |
| English | 223 | 21.6% |
| German | 84 | 8.1% |
| Irish | 206 | 19.9% |
| Mexican | 6 | 0.6% |
| Spanish | 25 | 2.4% |
| Welsh | 61 | 5.9% | View All 9 Rows |
Immigrants in Harriston

| Immigration Origin | # Population | % Population | View All 0 Rows |
Sex and Age in Harriston
Sex and Age in Harriston
The most populous age groups in Harriston are 65 to 69 Years (94 | 17.7%) for men and 30 to 34 Years (84 | 16.7%) for women.
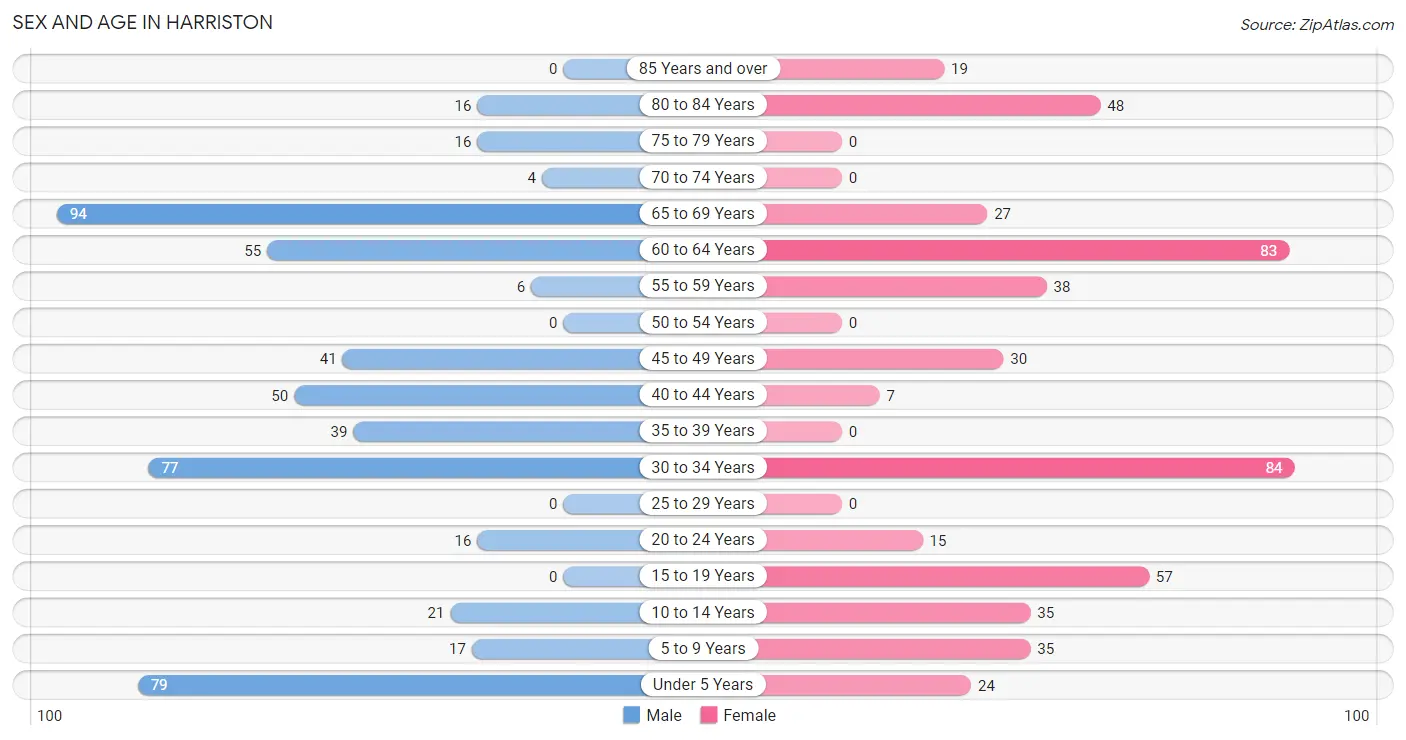
| Age Bracket | Male | Female |
| Under 5 Years | 79 (14.9%) | 24 (4.8%) |
| 5 to 9 Years | 17 (3.2%) | 35 (7.0%) |
| 10 to 14 Years | 21 (4.0%) | 35 (7.0%) |
| 15 to 19 Years | 0 (0.0%) | 57 (11.4%) |
| 20 to 24 Years | 16 (3.0%) | 15 (3.0%) |
| 25 to 29 Years | 0 (0.0%) | 0 (0.0%) |
| 30 to 34 Years | 77 (14.5%) | 84 (16.7%) |
| 35 to 39 Years | 39 (7.3%) | 0 (0.0%) |
| 40 to 44 Years | 50 (9.4%) | 7 (1.4%) |
| 45 to 49 Years | 41 (7.7%) | 30 (6.0%) |
| 50 to 54 Years | 0 (0.0%) | 0 (0.0%) |
| 55 to 59 Years | 6 (1.1%) | 38 (7.6%) |
| 60 to 64 Years | 55 (10.4%) | 83 (16.5%) |
| 65 to 69 Years | 94 (17.7%) | 27 (5.4%) |
| 70 to 74 Years | 4 (0.7%) | 0 (0.0%) |
| 75 to 79 Years | 16 (3.0%) | 0 (0.0%) |
| 80 to 84 Years | 16 (3.0%) | 48 (9.6%) |
| 85 Years and over | 0 (0.0%) | 19 (3.8%) |
| Total | 531 (100.0%) | 502 (100.0%) |
Families and Households in Harriston
Median Family Size in Harriston
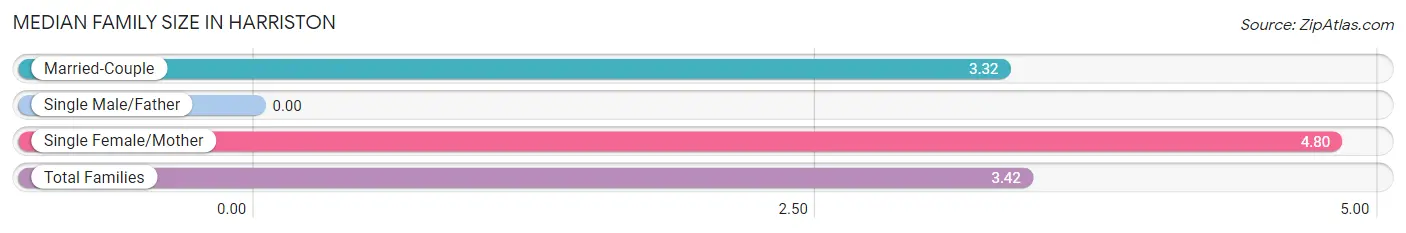
| Family Type | # Families | Family Size |
| Married-Couple | 225 (93.8%) | 3.32 |
| Single Male/Father | 0 (0.0%) | - |
| Single Female/Mother | 15 (6.2%) | 4.80 |
| Total Families | 240 (100.0%) | 3.42 |
Median Household Size in Harriston
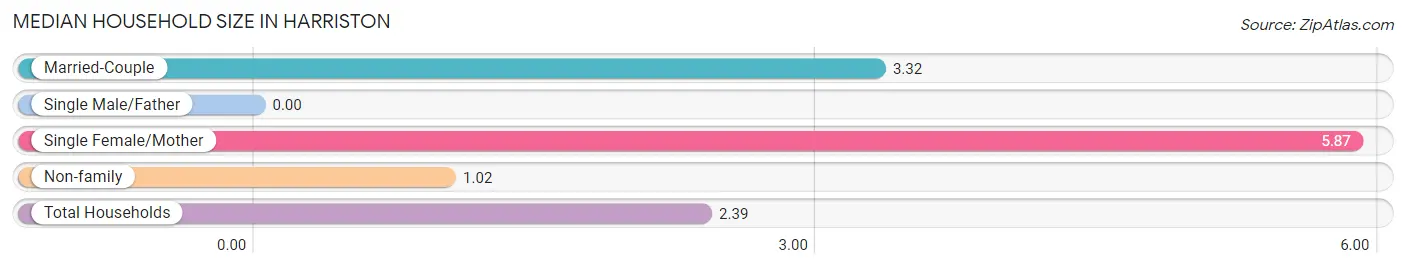
| Household Type | # Households | Household Size |
| Married-Couple | 225 (52.0%) | 3.32 |
| Single Male/Father | 0 (0.0%) | - |
| Single Female/Mother | 15 (3.5%) | 5.87 |
| Non-family | 193 (44.6%) | 1.02 |
| Total Households | 433 (100.0%) | 2.39 |
Household Size by Marriage Status in Harriston
Out of a total of 433 households in Harriston, 240 (55.4%) are family households, while 193 (44.6%) are nonfamily households. The most numerous type of family households are 3-person households, comprising 97, and the most common type of nonfamily households are 1-person households, comprising 187.
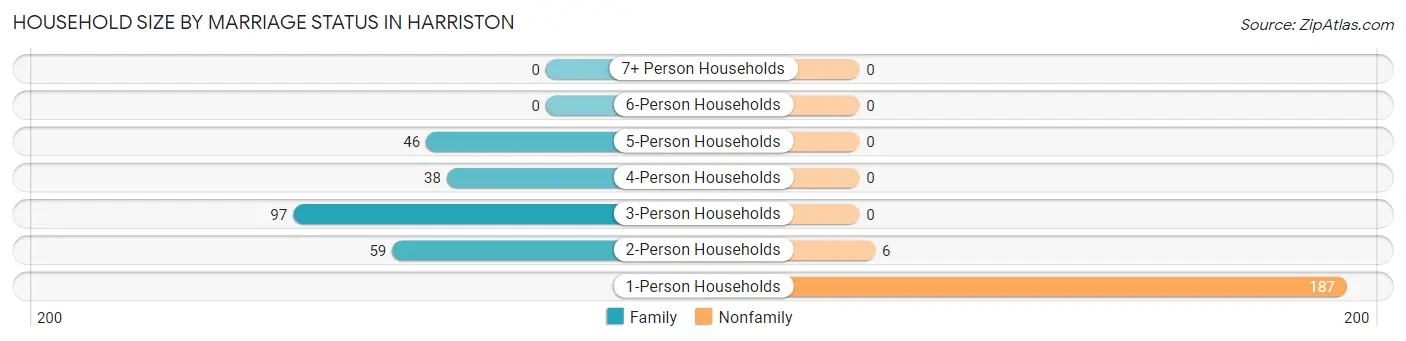
| Household Size | Family Households | Nonfamily Households |
| 1-Person Households | - | 187 (43.2%) |
| 2-Person Households | 59 (13.6%) | 6 (1.4%) |
| 3-Person Households | 97 (22.4%) | 0 (0.0%) |
| 4-Person Households | 38 (8.8%) | 0 (0.0%) |
| 5-Person Households | 46 (10.6%) | 0 (0.0%) |
| 6-Person Households | 0 (0.0%) | 0 (0.0%) |
| 7+ Person Households | 0 (0.0%) | 0 (0.0%) |
| Total | 240 (55.4%) | 193 (44.6%) |
Female Fertility in Harriston
Fertility by Age in Harriston
Average fertility rate in Harriston is 228.0 births per 1,000 women. Women in the age bracket of 15 to 19 years have the highest fertility rate with 474.0 births per 1,000 women. Women in the age bracket of 15 to 19 years acount for 61.4% of all women with births.
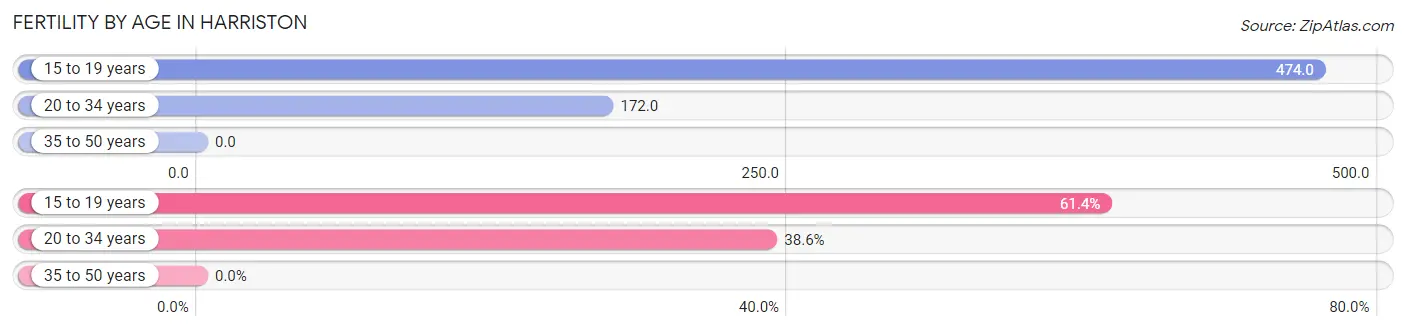
| Age Bracket | Women with Births | Births / 1,000 Women |
| 15 to 19 years | 27 (61.4%) | 474.0 |
| 20 to 34 years | 17 (38.6%) | 172.0 |
| 35 to 50 years | 0 (0.0%) | 0.0 |
| Total | 44 (100.0%) | 228.0 |
Fertility by Age by Marriage Status in Harriston
38.6% of women with births (44) in Harriston are married. The highest percentage of unmarried women with births falls into 15 to 19 years age bracket with 100.0% of them unmarried at the time of birth, while the lowest percentage of unmarried women with births belong to 20 to 34 years age bracket with 0.0% of them unmarried.
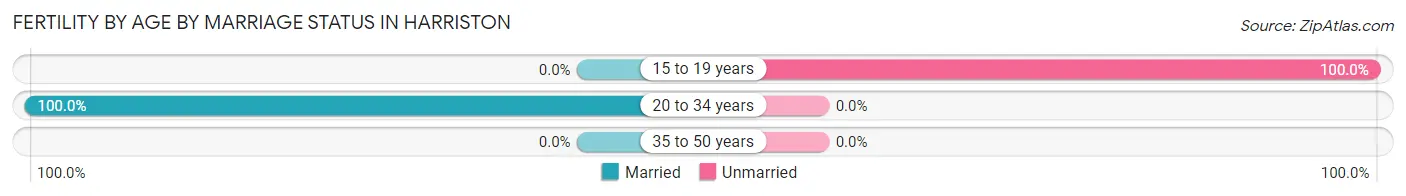
| Age Bracket | Married | Unmarried |
| 15 to 19 years | 0 (0.0%) | 27 (100.0%) |
| 20 to 34 years | 17 (100.0%) | 0 (0.0%) |
| 35 to 50 years | 0 (0.0%) | 0 (0.0%) |
| Total | 17 (38.6%) | 27 (61.4%) |
Fertility by Education in Harriston
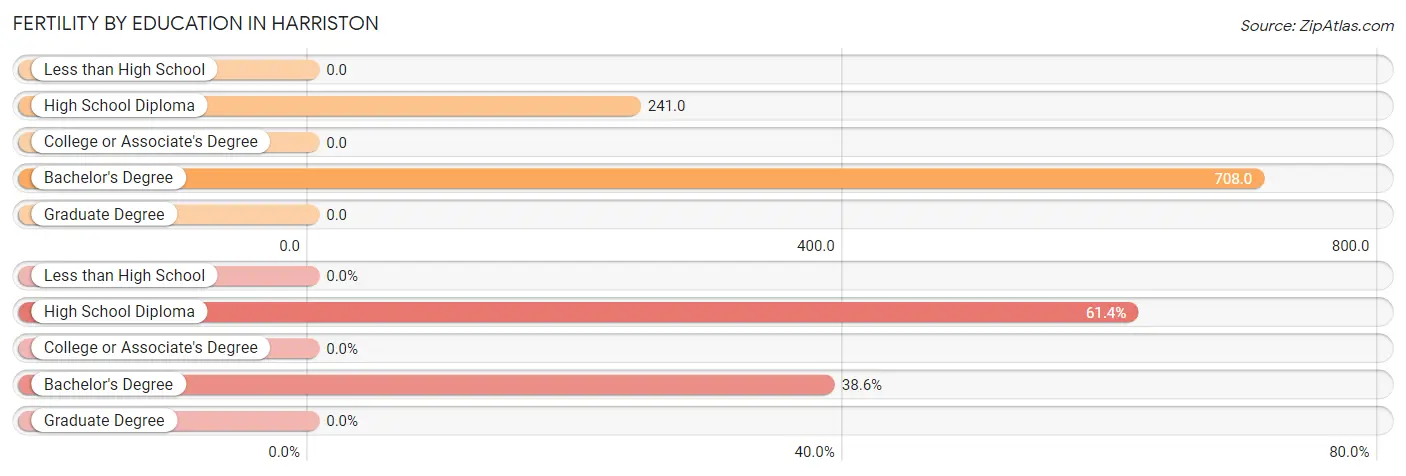
| Educational Attainment | Women with Births | Births / 1,000 Women |
| Less than High School | 0 (0.0%) | 0.0 |
| High School Diploma | 27 (61.4%) | 241.0 |
| College or Associate's Degree | 0 (0.0%) | 0.0 |
| Bachelor's Degree | 17 (38.6%) | 708.0 |
| Graduate Degree | 0 (0.0%) | 0.0 |
| Total | 44 (100.0%) | 228.0 |
Fertility by Education by Marriage Status in Harriston
61.4% of women with births in Harriston are unmarried. Women with the educational attainment of bachelor's degree are most likely to be married with 100.0% of them married at childbirth, while women with the educational attainment of high school diploma are least likely to be married with 100.0% of them unmarried at childbirth.
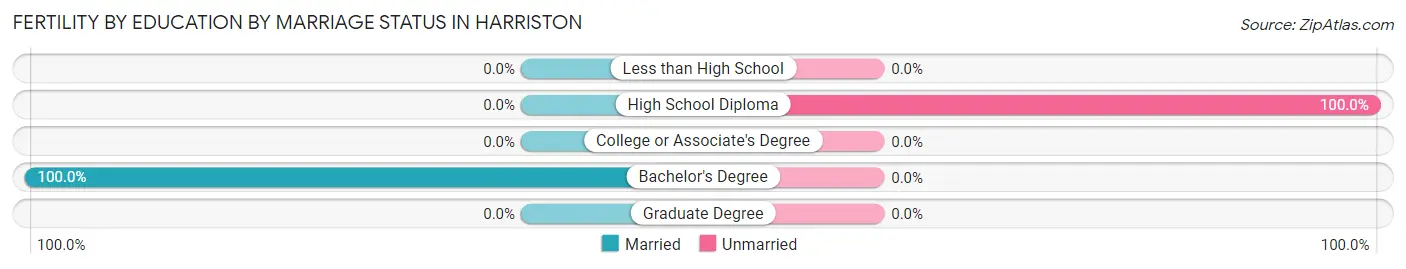
| Educational Attainment | Married | Unmarried |
| Less than High School | 0 (0.0%) | 0 (0.0%) |
| High School Diploma | 0 (0.0%) | 27 (100.0%) |
| College or Associate's Degree | 0 (0.0%) | 0 (0.0%) |
| Bachelor's Degree | 17 (100.0%) | 0 (0.0%) |
| Graduate Degree | 0 (0.0%) | 0 (0.0%) |
| Total | 17 (38.6%) | 27 (61.4%) |
Employment Characteristics in Harriston
Employment by Class of Employer in Harriston
Among the 491 employed individuals in Harriston, private company employees (286 | 58.3%), not-for-profit organizations (92 | 18.7%), and state government employees (74 | 15.1%) make up the most common classes of employment.
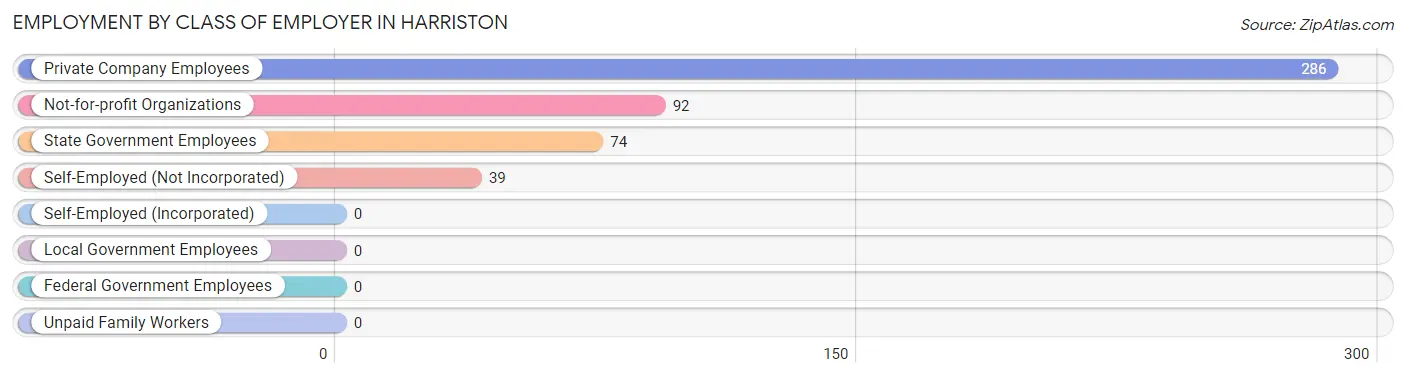
| Employer Class | # Employees | % Employees |
| Private Company Employees | 286 | 58.3% |
| Self-Employed (Incorporated) | 0 | 0.0% |
| Self-Employed (Not Incorporated) | 39 | 7.9% |
| Not-for-profit Organizations | 92 | 18.7% |
| Local Government Employees | 0 | 0.0% |
| State Government Employees | 74 | 15.1% |
| Federal Government Employees | 0 | 0.0% |
| Unpaid Family Workers | 0 | 0.0% |
| Total | 491 | 100.0% |
Employment Status by Age in Harriston
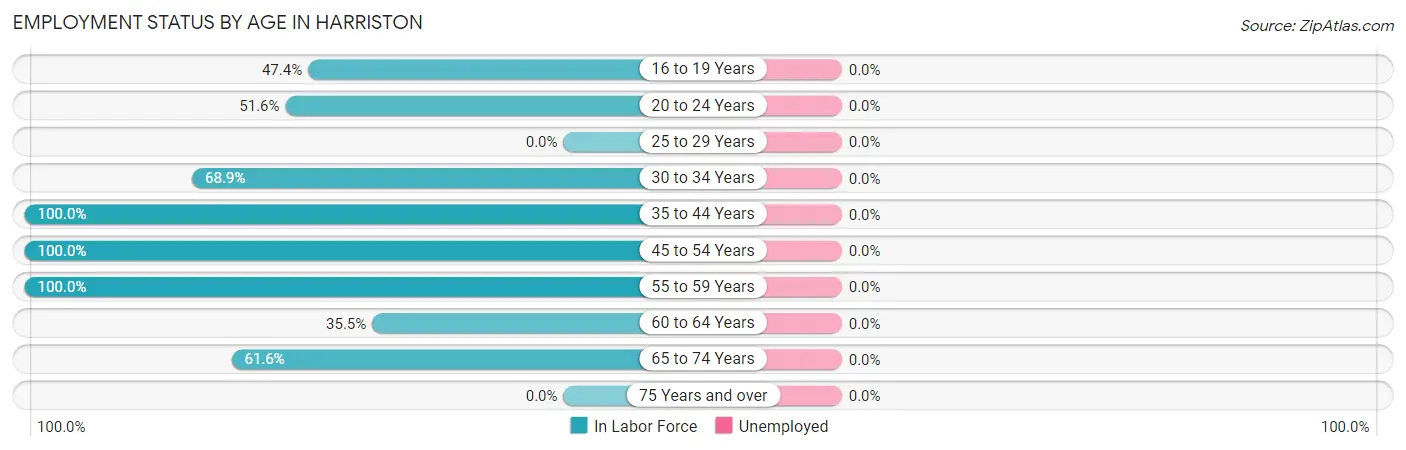
| Age Bracket | In Labor Force | Unemployed |
| 16 to 19 Years | 27 (47.4%) | 0 (0.0%) |
| 20 to 24 Years | 16 (51.6%) | 0 (0.0%) |
| 25 to 29 Years | 0 (0.0%) | 0 (0.0%) |
| 30 to 34 Years | 111 (68.9%) | 0 (0.0%) |
| 35 to 44 Years | 96 (100.0%) | 0 (0.0%) |
| 45 to 54 Years | 71 (100.0%) | 0 (0.0%) |
| 55 to 59 Years | 44 (100.0%) | 0 (0.0%) |
| 60 to 64 Years | 49 (35.5%) | 0 (0.0%) |
| 65 to 74 Years | 77 (61.6%) | 0 (0.0%) |
| 75 Years and over | 0 (0.0%) | 0 (0.0%) |
| Total | 491 (59.7%) | 0 (0.0%) |
Employment Status by Educational Attainment in Harriston
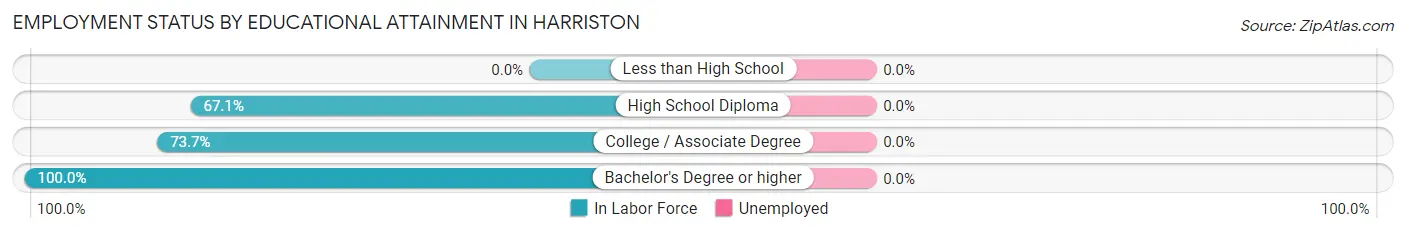
| Educational Attainment | In Labor Force | Unemployed |
| Less than High School | 0 (0.0%) | 0 (0.0%) |
| High School Diploma | 161 (67.1%) | 0 (0.0%) |
| College / Associate Degree | 168 (73.7%) | 0 (0.0%) |
| Bachelor's Degree or higher | 42 (100.0%) | 0 (0.0%) |
| Total | 371 (72.7%) | 0 (0.0%) |
Employment Occupations by Sex in Harriston
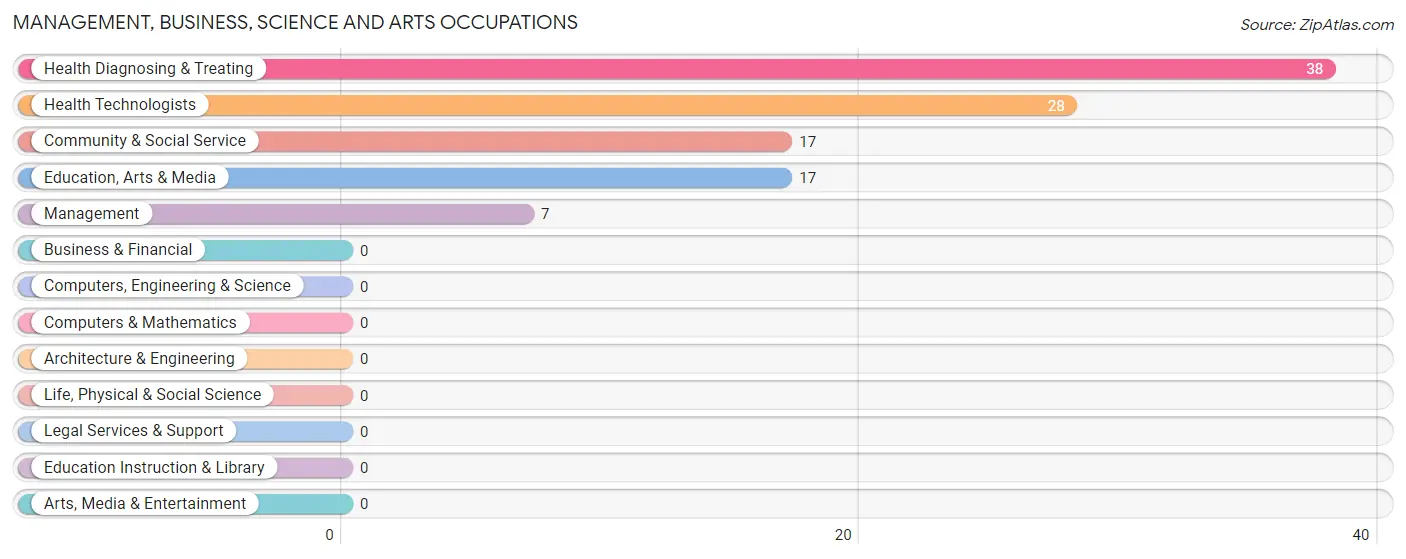
Management, Business, Science and Arts Occupations
The most common Management, Business, Science and Arts occupations in Harriston are Health Diagnosing & Treating (38 | 7.7%), Health Technologists (28 | 5.7%), Community & Social Service (17 | 3.5%), Education, Arts & Media (17 | 3.5%), and Management (7 | 1.4%).
Management, Business, Science and Arts Occupations by Sex
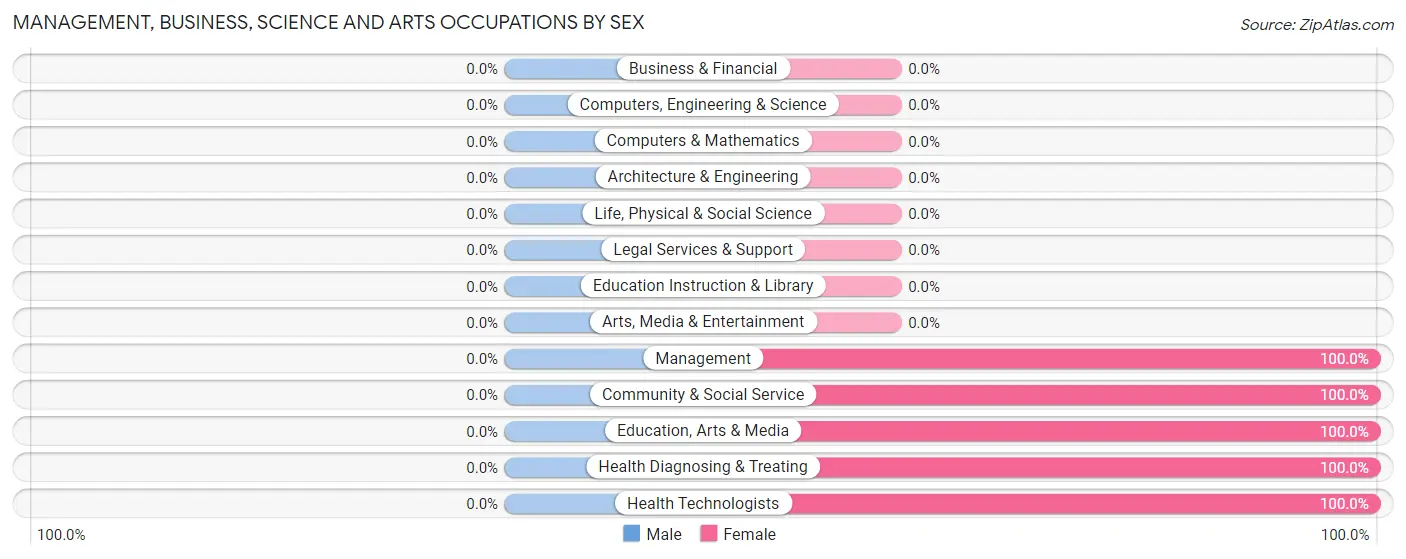
| Occupation | Male | Female |
| Management | 0 (0.0%) | 7 (100.0%) |
| Business & Financial | 0 (0.0%) | 0 (0.0%) |
| Computers, Engineering & Science | 0 (0.0%) | 0 (0.0%) |
| Computers & Mathematics | 0 (0.0%) | 0 (0.0%) |
| Architecture & Engineering | 0 (0.0%) | 0 (0.0%) |
| Life, Physical & Social Science | 0 (0.0%) | 0 (0.0%) |
| Community & Social Service | 0 (0.0%) | 17 (100.0%) |
| Education, Arts & Media | 0 (0.0%) | 17 (100.0%) |
| Legal Services & Support | 0 (0.0%) | 0 (0.0%) |
| Education Instruction & Library | 0 (0.0%) | 0 (0.0%) |
| Arts, Media & Entertainment | 0 (0.0%) | 0 (0.0%) |
| Health Diagnosing & Treating | 0 (0.0%) | 38 (100.0%) |
| Health Technologists | 0 (0.0%) | 28 (100.0%) |
| Total (Category) | 0 (0.0%) | 62 (100.0%) |
| Total (Overall) | 315 (64.1%) | 176 (35.8%) |
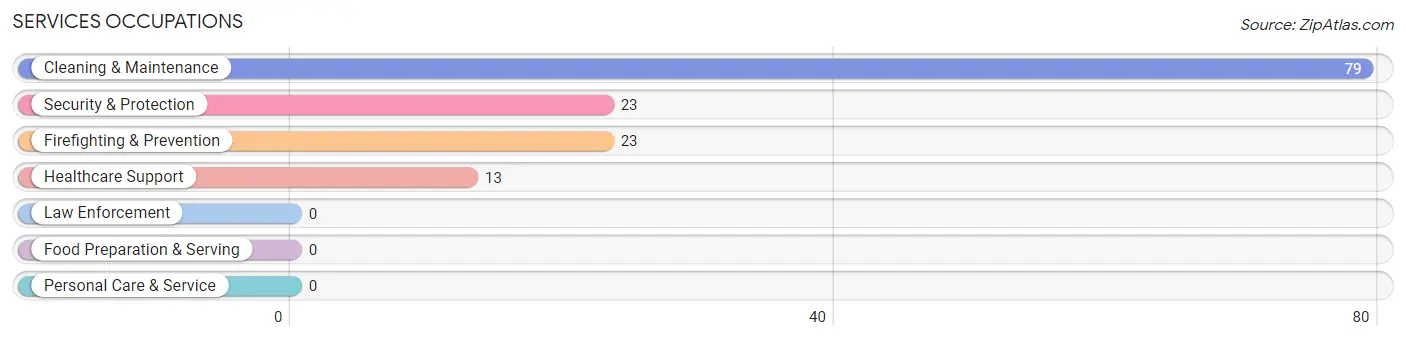
Services Occupations
The most common Services occupations in Harriston are Cleaning & Maintenance (79 | 16.1%), Security & Protection (23 | 4.7%), Firefighting & Prevention (23 | 4.7%), and Healthcare Support (13 | 2.6%).
Services Occupations by Sex
Within the Services occupations in Harriston, the most male-oriented occupations are Security & Protection (100.0%), Firefighting & Prevention (100.0%), and Cleaning & Maintenance (22.8%), while the most female-oriented occupations are Healthcare Support (100.0%), and Cleaning & Maintenance (77.2%).
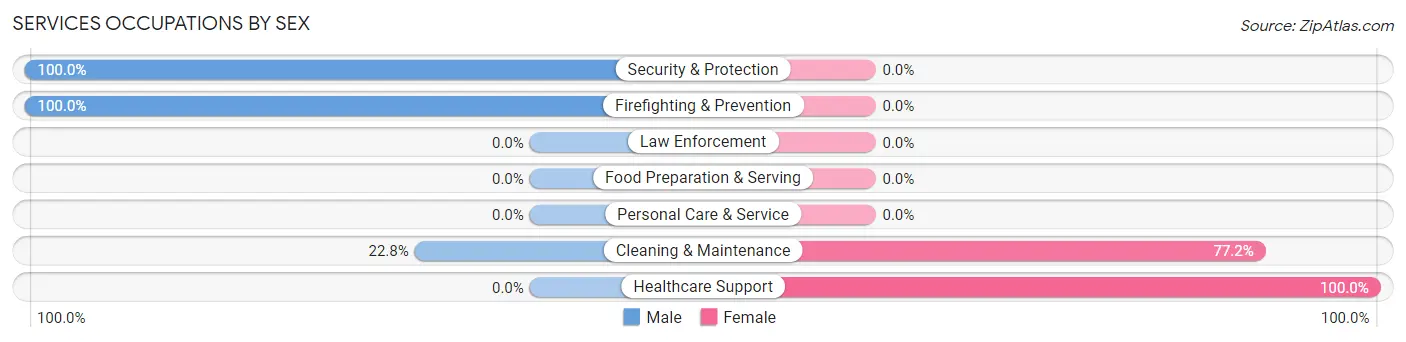
| Occupation | Male | Female |
| Healthcare Support | 0 (0.0%) | 13 (100.0%) |
| Security & Protection | 23 (100.0%) | 0 (0.0%) |
| Firefighting & Prevention | 23 (100.0%) | 0 (0.0%) |
| Law Enforcement | 0 (0.0%) | 0 (0.0%) |
| Food Preparation & Serving | 0 (0.0%) | 0 (0.0%) |
| Cleaning & Maintenance | 18 (22.8%) | 61 (77.2%) |
| Personal Care & Service | 0 (0.0%) | 0 (0.0%) |
| Total (Category) | 41 (35.6%) | 74 (64.3%) |
| Total (Overall) | 315 (64.1%) | 176 (35.8%) |
Sales and Office Occupations
The most common Sales and Office occupations in Harriston are , and Office & Administration (40 | 8.2%).
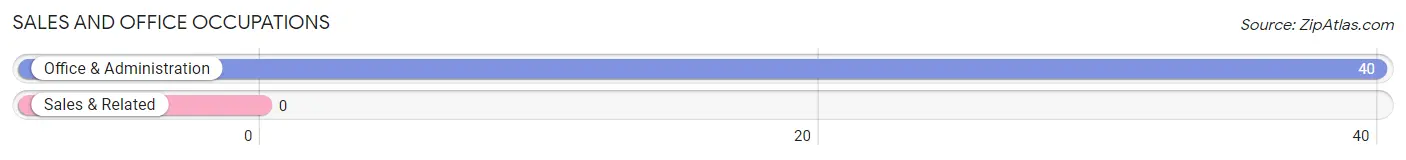
Sales and Office Occupations by Sex
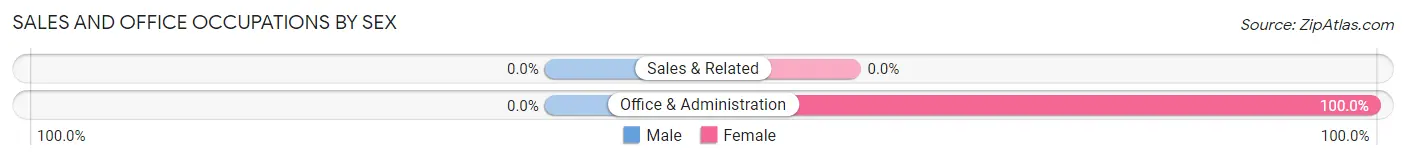
| Occupation | Male | Female |
| Sales & Related | 0 (0.0%) | 0 (0.0%) |
| Office & Administration | 0 (0.0%) | 40 (100.0%) |
| Total (Category) | 0 (0.0%) | 40 (100.0%) |
| Total (Overall) | 315 (64.1%) | 176 (35.8%) |
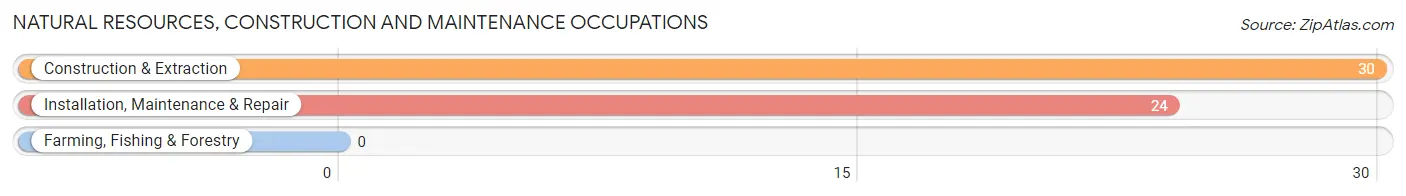
Natural Resources, Construction and Maintenance Occupations
The most common Natural Resources, Construction and Maintenance occupations in Harriston are Construction & Extraction (30 | 6.1%), and Installation, Maintenance & Repair (24 | 4.9%).
Natural Resources, Construction and Maintenance Occupations by Sex
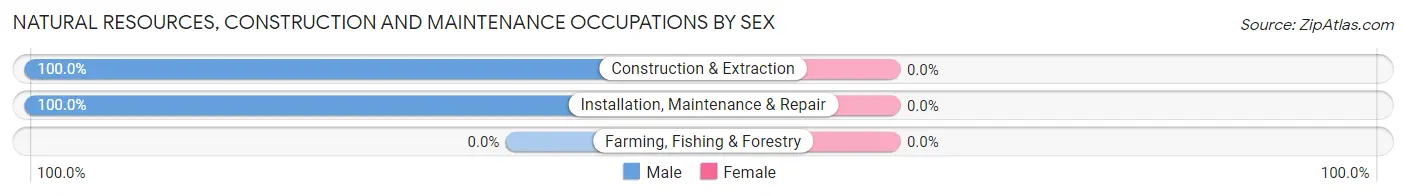
| Occupation | Male | Female |
| Farming, Fishing & Forestry | 0 (0.0%) | 0 (0.0%) |
| Construction & Extraction | 30 (100.0%) | 0 (0.0%) |
| Installation, Maintenance & Repair | 24 (100.0%) | 0 (0.0%) |
| Total (Category) | 54 (100.0%) | 0 (0.0%) |
| Total (Overall) | 315 (64.1%) | 176 (35.8%) |
Production, Transportation and Moving Occupations
The most common Production, Transportation and Moving occupations in Harriston are Transportation (113 | 23.0%), Material Moving (63 | 12.8%), and Production (44 | 9.0%).
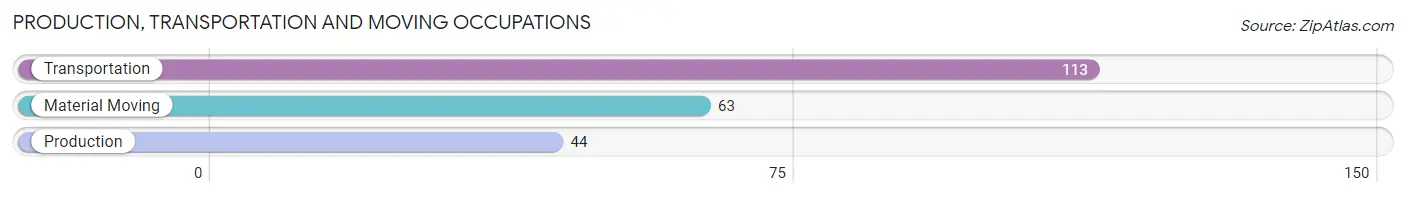
Production, Transportation and Moving Occupations by Sex
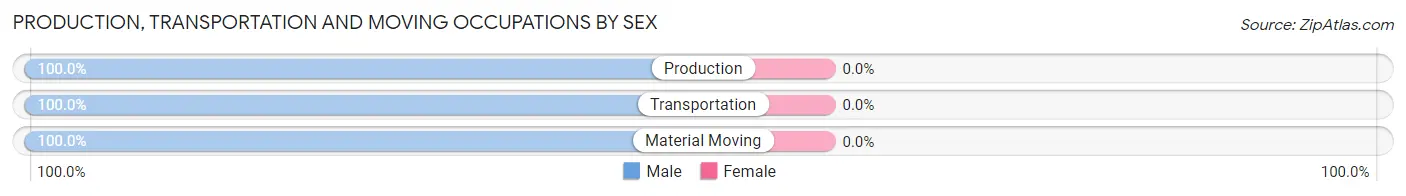
| Occupation | Male | Female |
| Production | 44 (100.0%) | 0 (0.0%) |
| Transportation | 113 (100.0%) | 0 (0.0%) |
| Material Moving | 63 (100.0%) | 0 (0.0%) |
| Total (Category) | 220 (100.0%) | 0 (0.0%) |
| Total (Overall) | 315 (64.1%) | 176 (35.8%) |
Employment Industries by Sex in Harriston
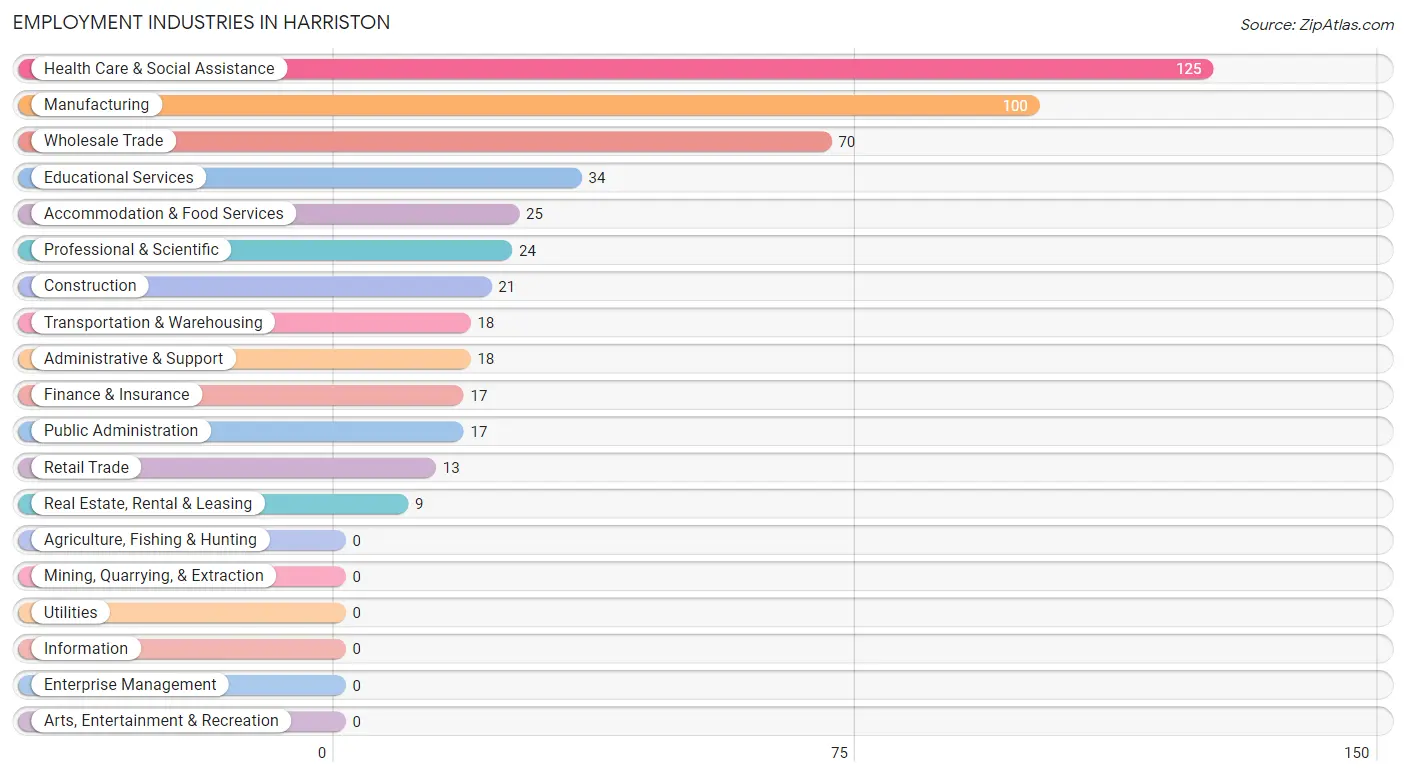
Employment Industries in Harriston
The major employment industries in Harriston include Health Care & Social Assistance (125 | 25.5%), Manufacturing (100 | 20.4%), Wholesale Trade (70 | 14.3%), Educational Services (34 | 6.9%), and Accommodation & Food Services (25 | 5.1%).
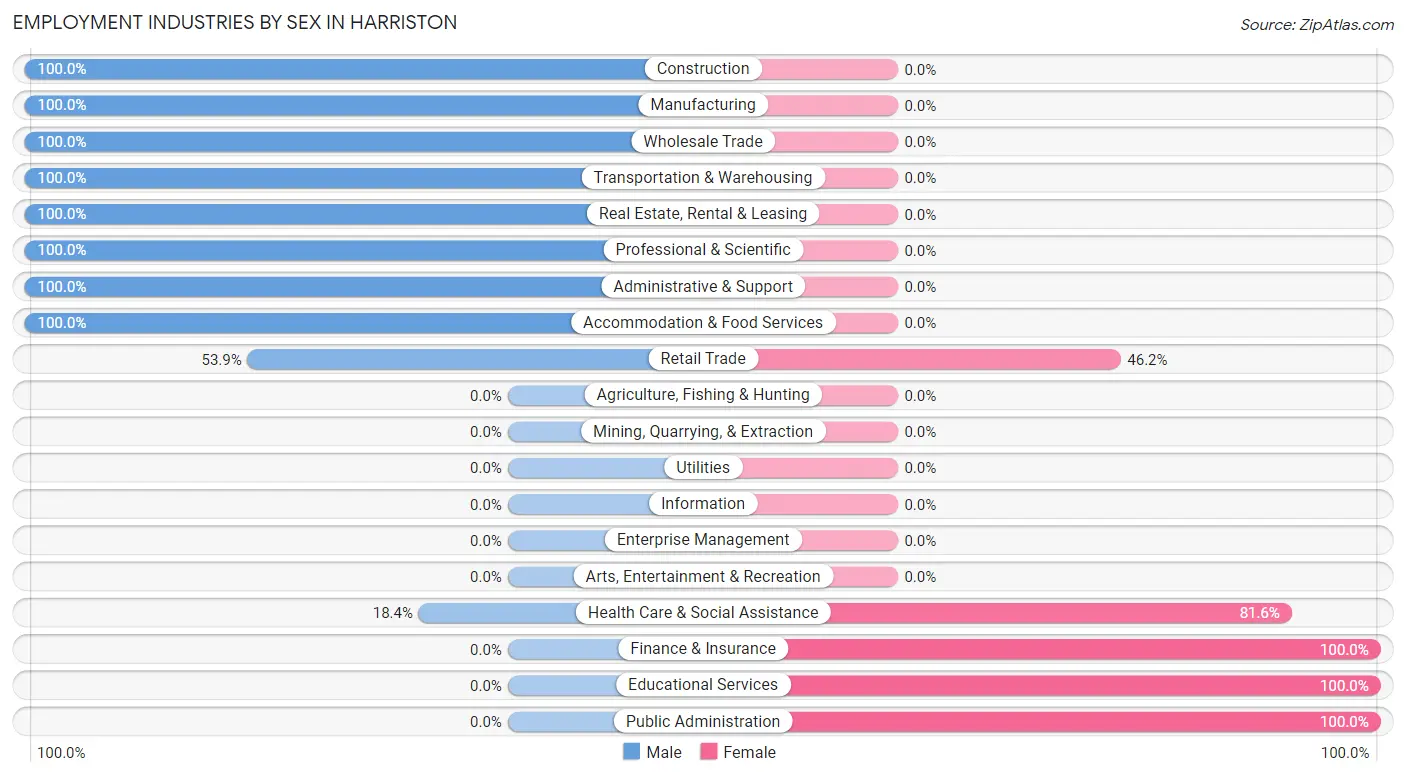
Employment Industries by Sex in Harriston
The Harriston industries that see more men than women are Construction (100.0%), Manufacturing (100.0%), and Wholesale Trade (100.0%), whereas the industries that tend to have a higher number of women are Finance & Insurance (100.0%), Educational Services (100.0%), and Public Administration (100.0%).
| Industry | Male | Female |
| Agriculture, Fishing & Hunting | 0 (0.0%) | 0 (0.0%) |
| Mining, Quarrying, & Extraction | 0 (0.0%) | 0 (0.0%) |
| Construction | 21 (100.0%) | 0 (0.0%) |
| Manufacturing | 100 (100.0%) | 0 (0.0%) |
| Wholesale Trade | 70 (100.0%) | 0 (0.0%) |
| Retail Trade | 7 (53.8%) | 6 (46.2%) |
| Transportation & Warehousing | 18 (100.0%) | 0 (0.0%) |
| Utilities | 0 (0.0%) | 0 (0.0%) |
| Information | 0 (0.0%) | 0 (0.0%) |
| Finance & Insurance | 0 (0.0%) | 17 (100.0%) |
| Real Estate, Rental & Leasing | 9 (100.0%) | 0 (0.0%) |
| Professional & Scientific | 24 (100.0%) | 0 (0.0%) |
| Enterprise Management | 0 (0.0%) | 0 (0.0%) |
| Administrative & Support | 18 (100.0%) | 0 (0.0%) |
| Educational Services | 0 (0.0%) | 34 (100.0%) |
| Health Care & Social Assistance | 23 (18.4%) | 102 (81.6%) |
| Arts, Entertainment & Recreation | 0 (0.0%) | 0 (0.0%) |
| Accommodation & Food Services | 25 (100.0%) | 0 (0.0%) |
| Public Administration | 0 (0.0%) | 17 (100.0%) |
| Total | 315 (64.1%) | 176 (35.8%) |
Education in Harriston
School Enrollment in Harriston
The most common levels of schooling among the 172 students in Harriston are middle school (56 | 32.6%), elementary school (35 | 20.3%), and nursery / preschool (34 | 19.8%).
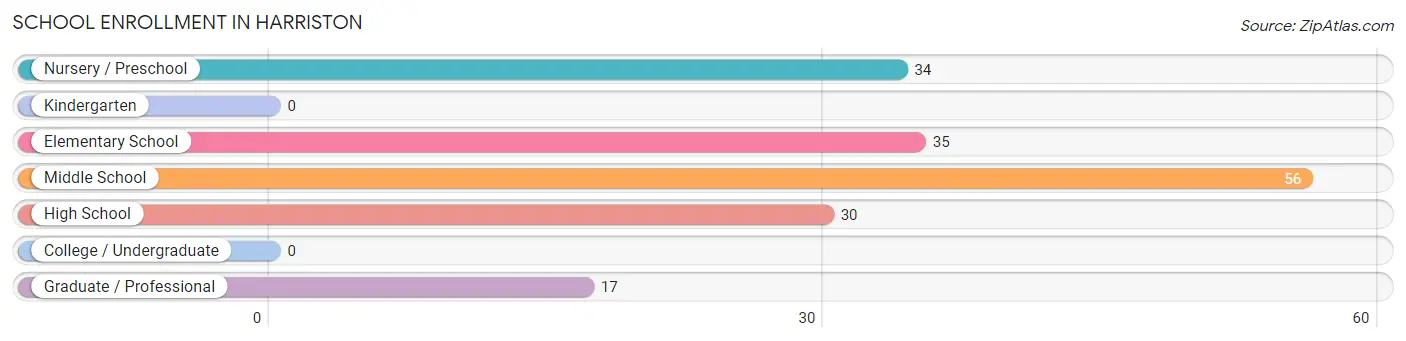
| School Level | # Students | % Students |
| Nursery / Preschool | 34 | 19.8% |
| Kindergarten | 0 | 0.0% |
| Elementary School | 35 | 20.3% |
| Middle School | 56 | 32.6% |
| High School | 30 | 17.4% |
| College / Undergraduate | 0 | 0.0% |
| Graduate / Professional | 17 | 9.9% |
| Total | 172 | 100.0% |
School Enrollment by Age by Funding Source in Harriston
Out of a total of 172 students who are enrolled in schools in Harriston, 34 (19.8%) attend a private institution, while the remaining 138 (80.2%) are enrolled in public schools. The age group of 3 to 4 year olds has the highest likelihood of being enrolled in private schools, with 17 (100.0% in the age bracket) enrolled. Conversely, the age group of 10 to 14 year olds has the lowest likelihood of being enrolled in a private school, with 56 (100.0% in the age bracket) attending a public institution.
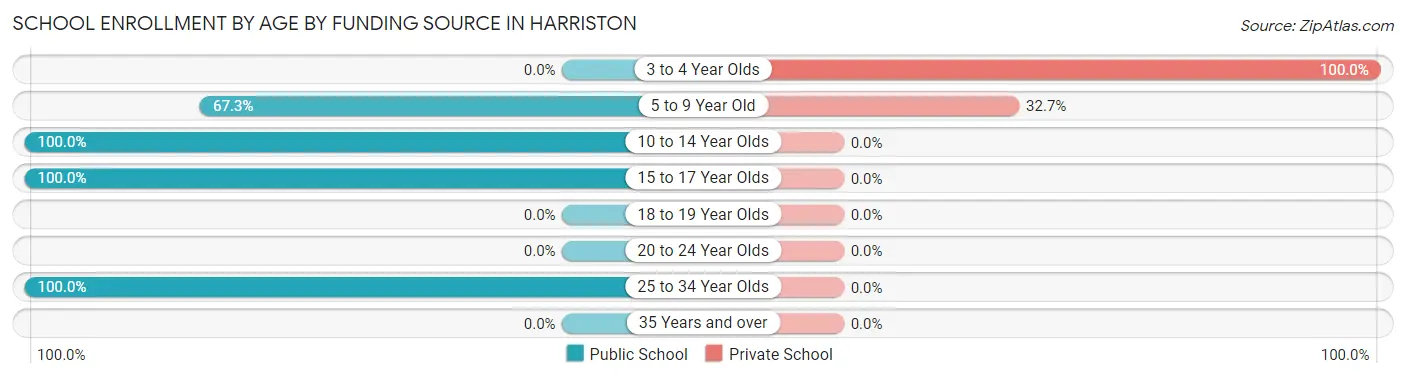
| Age Bracket | Public School | Private School |
| 3 to 4 Year Olds | 0 (0.0%) | 17 (100.0%) |
| 5 to 9 Year Old | 35 (67.3%) | 17 (32.7%) |
| 10 to 14 Year Olds | 56 (100.0%) | 0 (0.0%) |
| 15 to 17 Year Olds | 30 (100.0%) | 0 (0.0%) |
| 18 to 19 Year Olds | 0 (0.0%) | 0 (0.0%) |
| 20 to 24 Year Olds | 0 (0.0%) | 0 (0.0%) |
| 25 to 34 Year Olds | 17 (100.0%) | 0 (0.0%) |
| 35 Years and over | 0 (0.0%) | 0 (0.0%) |
| Total | 138 (80.2%) | 34 (19.8%) |
Educational Attainment by Field of Study in Harriston
Arts & humanities (35 | 83.3%), and psychology (7 | 16.7%) are the most common fields of study among 42 individuals in Harriston who have obtained a bachelor's degree or higher.
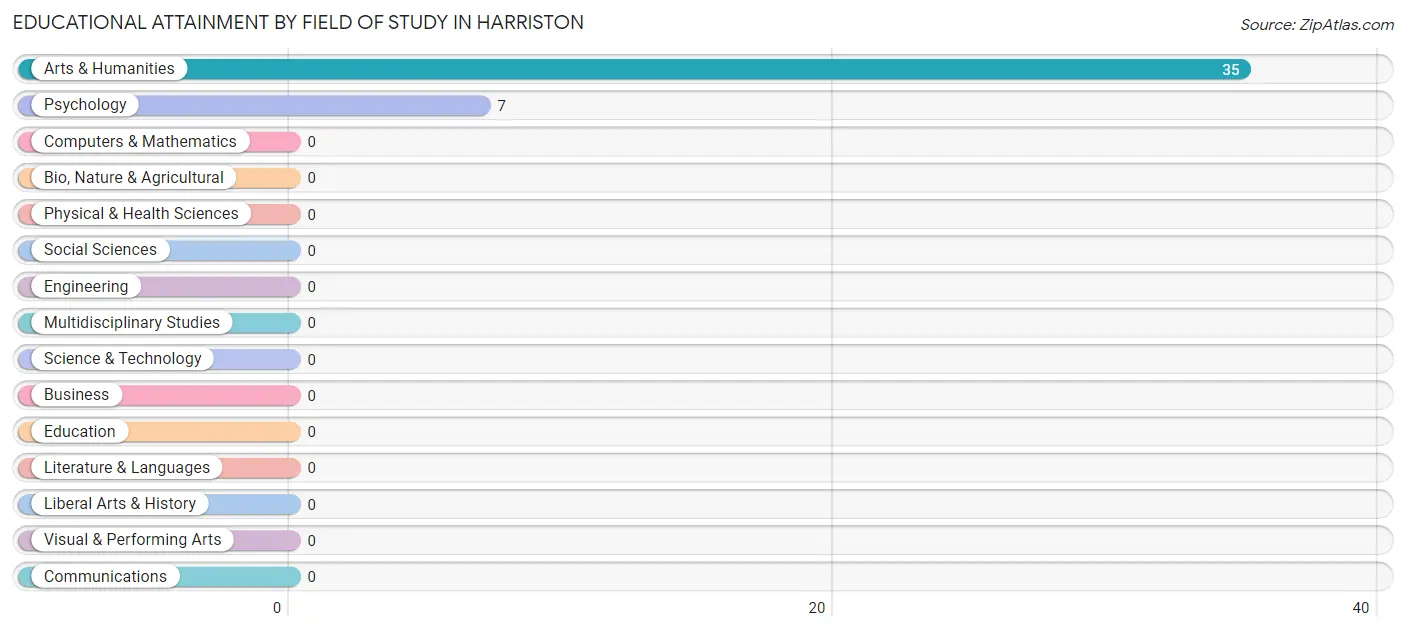
| Field of Study | # Graduates | % Graduates |
| Computers & Mathematics | 0 | 0.0% |
| Bio, Nature & Agricultural | 0 | 0.0% |
| Physical & Health Sciences | 0 | 0.0% |
| Psychology | 7 | 16.7% |
| Social Sciences | 0 | 0.0% |
| Engineering | 0 | 0.0% |
| Multidisciplinary Studies | 0 | 0.0% |
| Science & Technology | 0 | 0.0% |
| Business | 0 | 0.0% |
| Education | 0 | 0.0% |
| Literature & Languages | 0 | 0.0% |
| Liberal Arts & History | 0 | 0.0% |
| Visual & Performing Arts | 0 | 0.0% |
| Communications | 0 | 0.0% |
| Arts & Humanities | 35 | 83.3% |
| Total | 42 | 100.0% |
Transportation & Commute in Harriston
Vehicle Availability by Sex in Harriston
The most prevalent vehicle ownership categories in Harriston are males with 2 vehicles (149, accounting for 47.3%) and females with 2 vehicles (17, making up 84.7%).
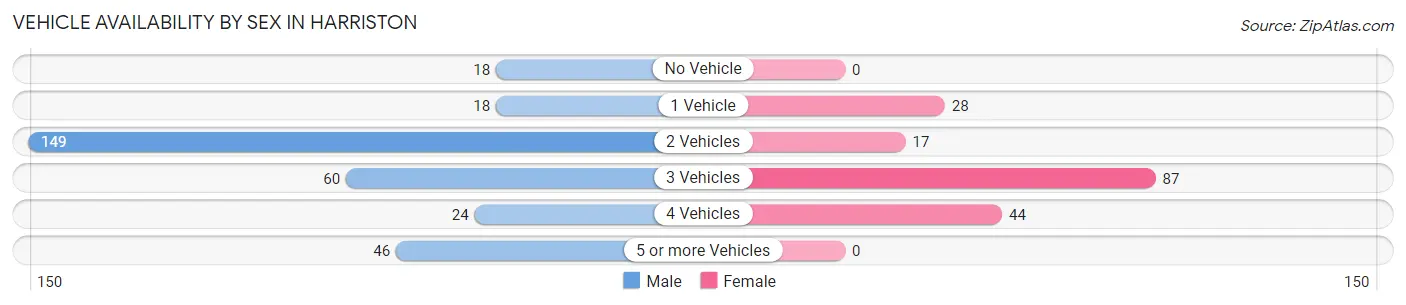
| Vehicles Available | Male | Female |
| No Vehicle | 18 (5.7%) | 0 (0.0%) |
| 1 Vehicle | 18 (5.7%) | 28 (15.9%) |
| 2 Vehicles | 149 (47.3%) | 17 (9.7%) |
| 3 Vehicles | 60 (19.1%) | 87 (49.4%) |
| 4 Vehicles | 24 (7.6%) | 44 (25.0%) |
| 5 or more Vehicles | 46 (14.6%) | 0 (0.0%) |
| Total | 315 (100.0%) | 176 (100.0%) |
Commute Time in Harriston
The most frequently occuring commute durations in Harriston are 20 to 24 minutes (104 commuters, 21.9%), 25 to 29 minutes (84 commuters, 17.7%), and 15 to 19 minutes (83 commuters, 17.5%).
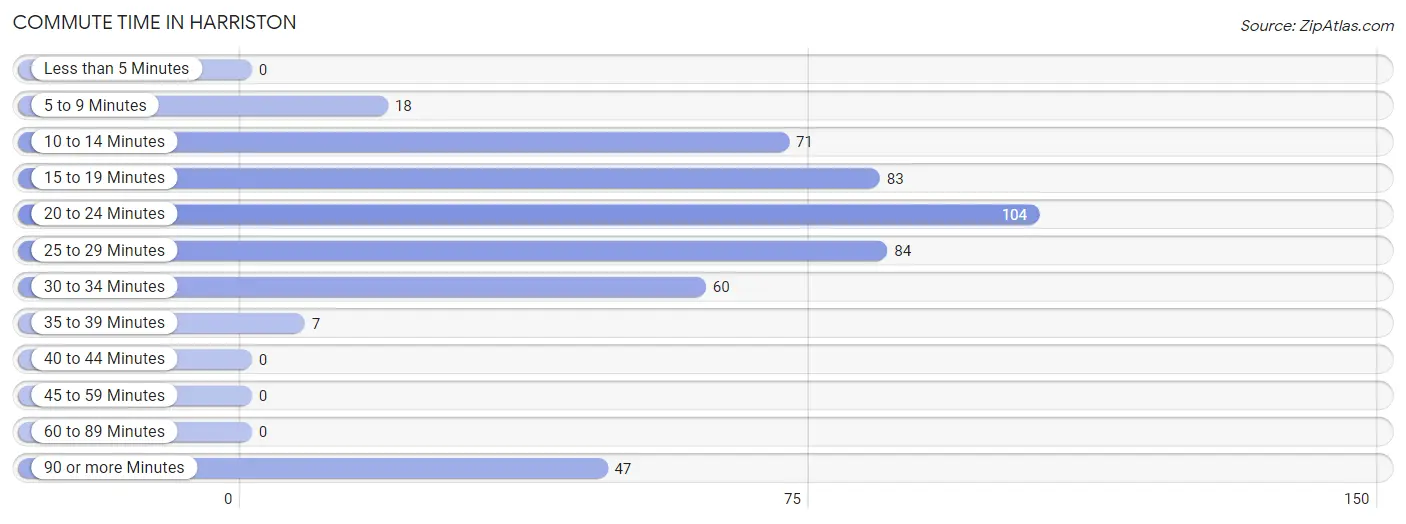
| Commute Time | # Commuters | % Commuters |
| Less than 5 Minutes | 0 | 0.0% |
| 5 to 9 Minutes | 18 | 3.8% |
| 10 to 14 Minutes | 71 | 15.0% |
| 15 to 19 Minutes | 83 | 17.5% |
| 20 to 24 Minutes | 104 | 21.9% |
| 25 to 29 Minutes | 84 | 17.7% |
| 30 to 34 Minutes | 60 | 12.7% |
| 35 to 39 Minutes | 7 | 1.5% |
| 40 to 44 Minutes | 0 | 0.0% |
| 45 to 59 Minutes | 0 | 0.0% |
| 60 to 89 Minutes | 0 | 0.0% |
| 90 or more Minutes | 47 | 9.9% |
Commute Time by Sex in Harriston
The most common commute times in Harriston are 20 to 24 minutes (76 commuters, 24.1%) for males and 90 or more minutes (47 commuters, 29.6%) for females.
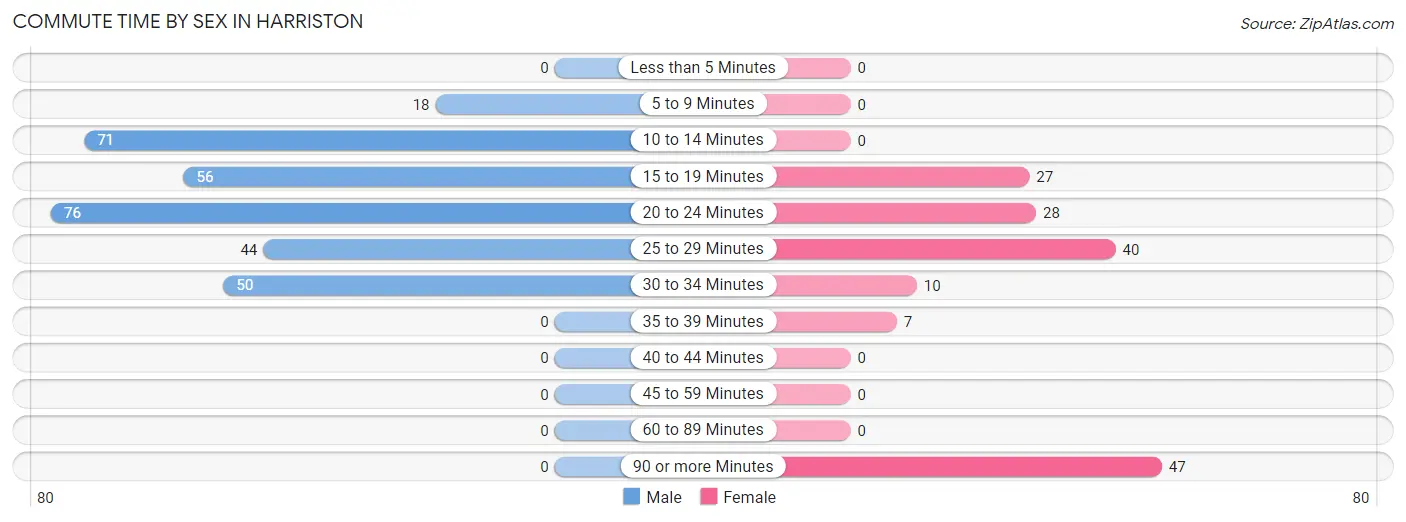
| Commute Time | Male | Female |
| Less than 5 Minutes | 0 (0.0%) | 0 (0.0%) |
| 5 to 9 Minutes | 18 (5.7%) | 0 (0.0%) |
| 10 to 14 Minutes | 71 (22.5%) | 0 (0.0%) |
| 15 to 19 Minutes | 56 (17.8%) | 27 (17.0%) |
| 20 to 24 Minutes | 76 (24.1%) | 28 (17.6%) |
| 25 to 29 Minutes | 44 (14.0%) | 40 (25.2%) |
| 30 to 34 Minutes | 50 (15.9%) | 10 (6.3%) |
| 35 to 39 Minutes | 0 (0.0%) | 7 (4.4%) |
| 40 to 44 Minutes | 0 (0.0%) | 0 (0.0%) |
| 45 to 59 Minutes | 0 (0.0%) | 0 (0.0%) |
| 60 to 89 Minutes | 0 (0.0%) | 0 (0.0%) |
| 90 or more Minutes | 0 (0.0%) | 47 (29.6%) |
Time of Departure to Work by Sex in Harriston
The most frequent times of departure to work in Harriston are 6:30 AM to 6:59 AM (97, 30.8%) for males and 7:30 AM to 7:59 AM (64, 40.3%) for females.
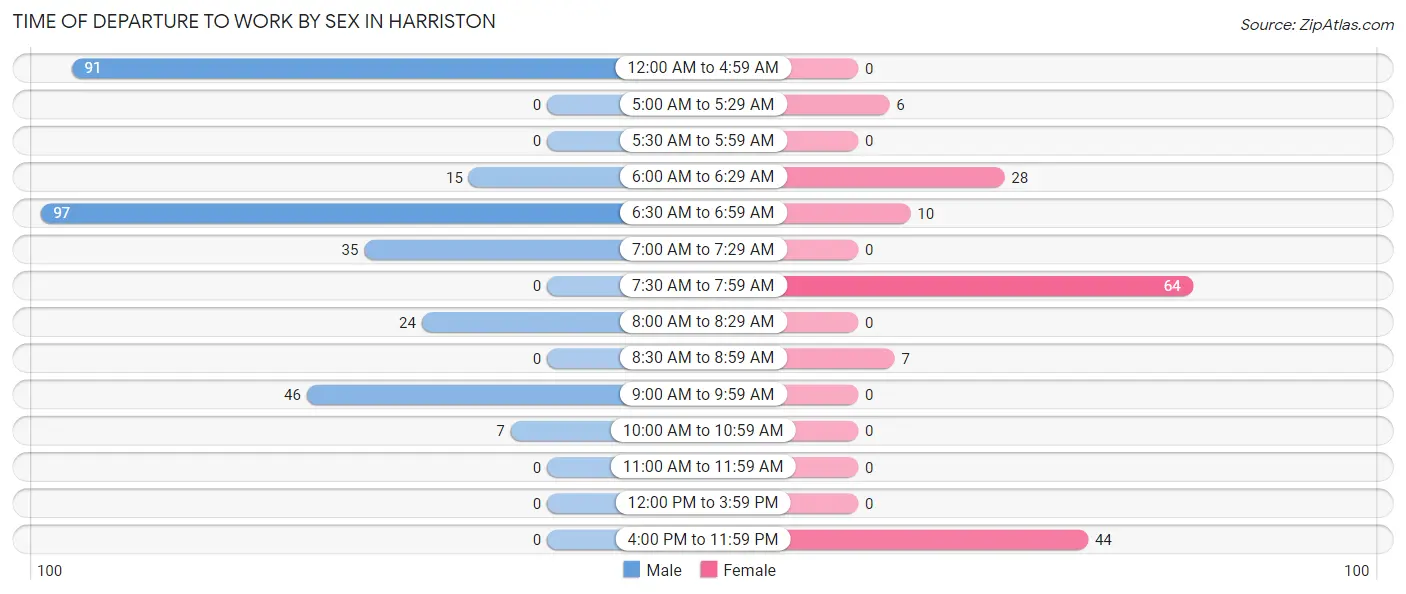
| Time of Departure | Male | Female |
| 12:00 AM to 4:59 AM | 91 (28.9%) | 0 (0.0%) |
| 5:00 AM to 5:29 AM | 0 (0.0%) | 6 (3.8%) |
| 5:30 AM to 5:59 AM | 0 (0.0%) | 0 (0.0%) |
| 6:00 AM to 6:29 AM | 15 (4.8%) | 28 (17.6%) |
| 6:30 AM to 6:59 AM | 97 (30.8%) | 10 (6.3%) |
| 7:00 AM to 7:29 AM | 35 (11.1%) | 0 (0.0%) |
| 7:30 AM to 7:59 AM | 0 (0.0%) | 64 (40.3%) |
| 8:00 AM to 8:29 AM | 24 (7.6%) | 0 (0.0%) |
| 8:30 AM to 8:59 AM | 0 (0.0%) | 7 (4.4%) |
| 9:00 AM to 9:59 AM | 46 (14.6%) | 0 (0.0%) |
| 10:00 AM to 10:59 AM | 7 (2.2%) | 0 (0.0%) |
| 11:00 AM to 11:59 AM | 0 (0.0%) | 0 (0.0%) |
| 12:00 PM to 3:59 PM | 0 (0.0%) | 0 (0.0%) |
| 4:00 PM to 11:59 PM | 0 (0.0%) | 44 (27.7%) |
| Total | 315 (100.0%) | 159 (100.0%) |
Housing Occupancy in Harriston
Occupancy by Ownership in Harriston
Of the total 433 dwellings in Harriston, owner-occupied units account for 348 (80.4%), while renter-occupied units make up 85 (19.6%).
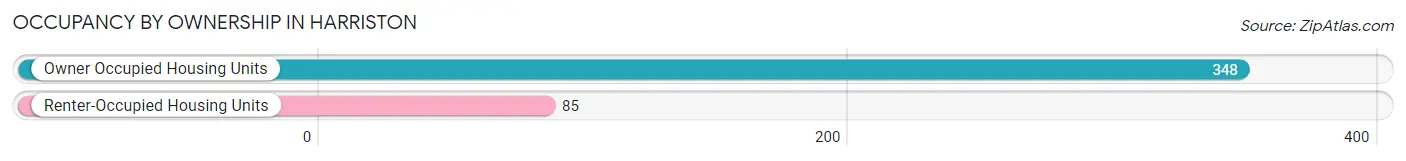
| Occupancy | # Housing Units | % Housing Units |
| Owner Occupied Housing Units | 348 | 80.4% |
| Renter-Occupied Housing Units | 85 | 19.6% |
| Total Occupied Housing Units | 433 | 100.0% |
Occupancy by Household Size in Harriston
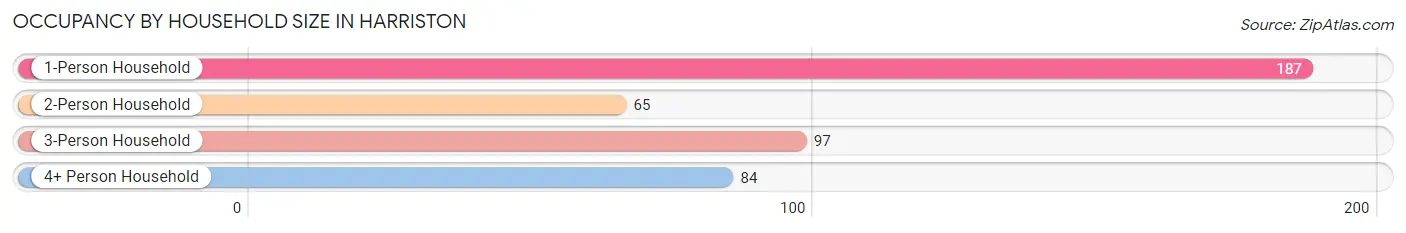
| Household Size | # Housing Units | % Housing Units |
| 1-Person Household | 187 | 43.2% |
| 2-Person Household | 65 | 15.0% |
| 3-Person Household | 97 | 22.4% |
| 4+ Person Household | 84 | 19.4% |
| Total Housing Units | 433 | 100.0% |
Occupancy by Ownership by Household Size in Harriston
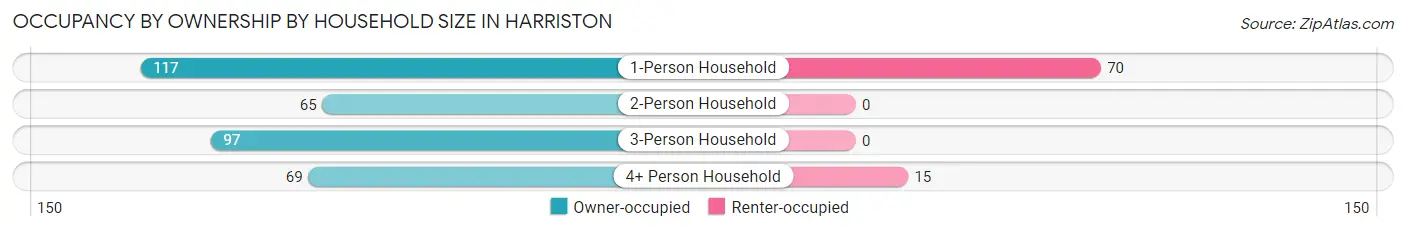
| Household Size | Owner-occupied | Renter-occupied |
| 1-Person Household | 117 (62.6%) | 70 (37.4%) |
| 2-Person Household | 65 (100.0%) | 0 (0.0%) |
| 3-Person Household | 97 (100.0%) | 0 (0.0%) |
| 4+ Person Household | 69 (82.1%) | 15 (17.9%) |
| Total Housing Units | 348 (80.4%) | 85 (19.6%) |
Occupancy by Educational Attainment in Harriston
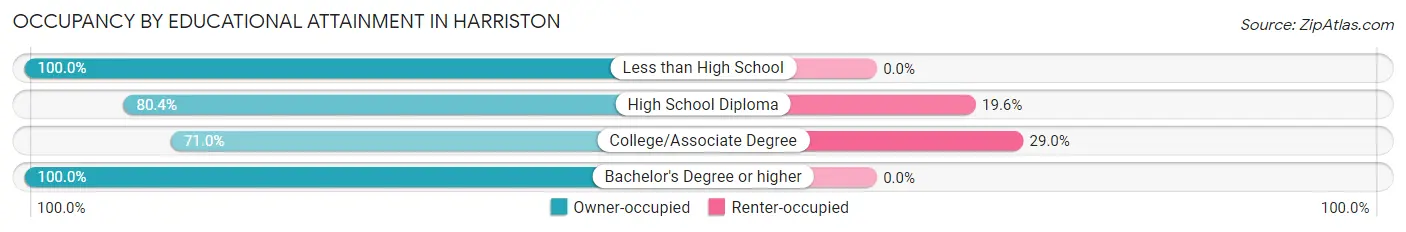
| Household Size | Owner-occupied | Renter-occupied |
| Less than High School | 65 (100.0%) | 0 (0.0%) |
| High School Diploma | 127 (80.4%) | 31 (19.6%) |
| College/Associate Degree | 132 (71.0%) | 54 (29.0%) |
| Bachelor's Degree or higher | 24 (100.0%) | 0 (0.0%) |
Occupancy by Age of Householder in Harriston
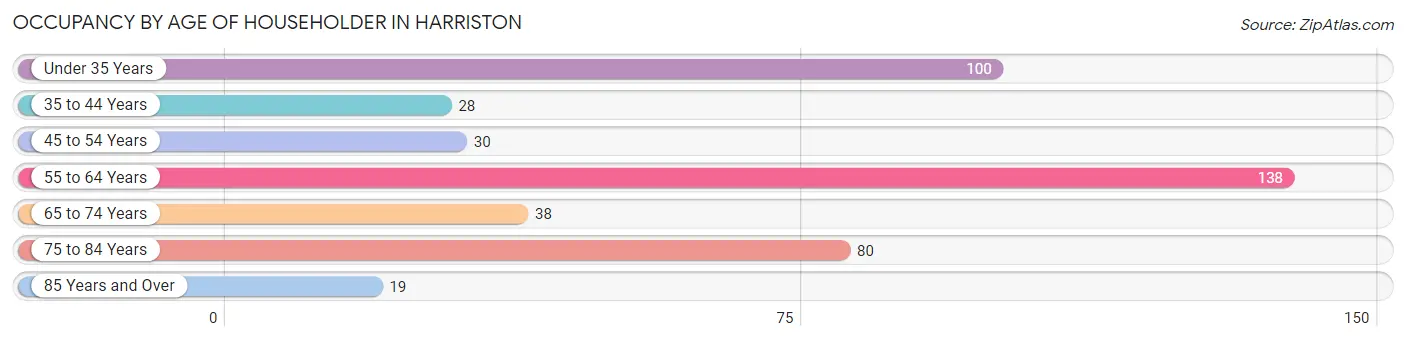
| Age Bracket | # Households | % Households |
| Under 35 Years | 100 | 23.1% |
| 35 to 44 Years | 28 | 6.5% |
| 45 to 54 Years | 30 | 6.9% |
| 55 to 64 Years | 138 | 31.9% |
| 65 to 74 Years | 38 | 8.8% |
| 75 to 84 Years | 80 | 18.5% |
| 85 Years and Over | 19 | 4.4% |
| Total | 433 | 100.0% |
Housing Finances in Harriston
Median Income by Occupancy in Harriston
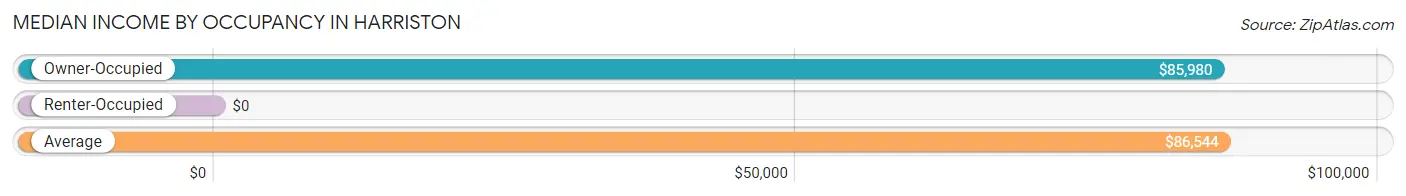
| Occupancy Type | # Households | Median Income |
| Owner-Occupied | 348 (80.4%) | $85,980 |
| Renter-Occupied | 85 (19.6%) | $0 |
| Average | 433 (100.0%) | $86,544 |
Occupancy by Householder Income Bracket in Harriston
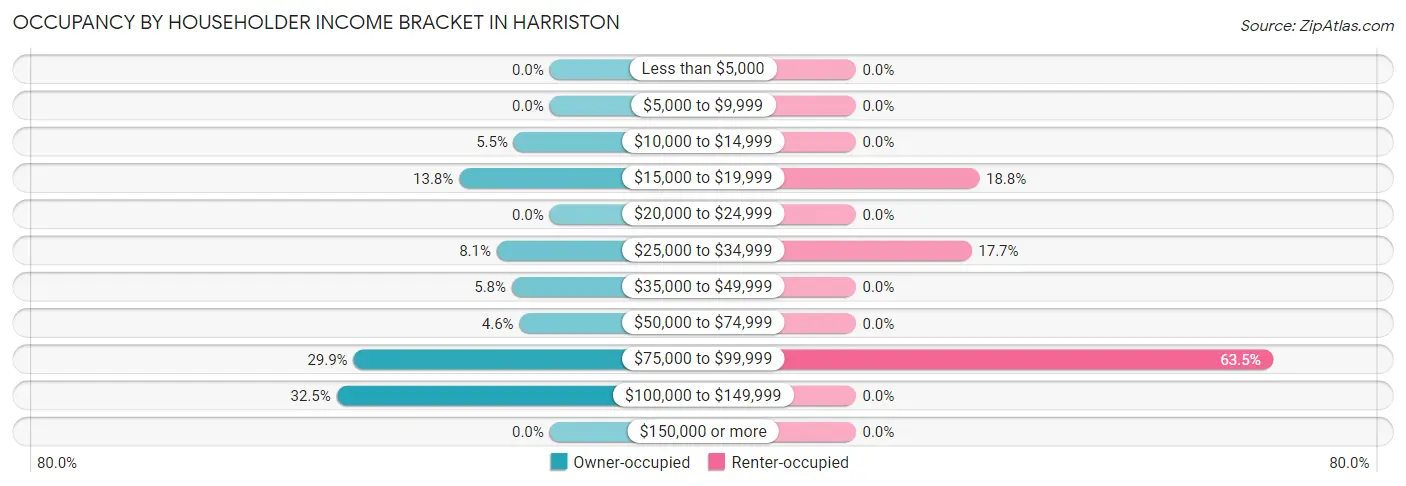
| Income Bracket | Owner-occupied | Renter-occupied |
| Less than $5,000 | 0 (0.0%) | 0 (0.0%) |
| $5,000 to $9,999 | 0 (0.0%) | 0 (0.0%) |
| $10,000 to $14,999 | 19 (5.5%) | 0 (0.0%) |
| $15,000 to $19,999 | 48 (13.8%) | 16 (18.8%) |
| $20,000 to $24,999 | 0 (0.0%) | 0 (0.0%) |
| $25,000 to $34,999 | 28 (8.1%) | 15 (17.6%) |
| $35,000 to $49,999 | 20 (5.8%) | 0 (0.0%) |
| $50,000 to $74,999 | 16 (4.6%) | 0 (0.0%) |
| $75,000 to $99,999 | 104 (29.9%) | 54 (63.5%) |
| $100,000 to $149,999 | 113 (32.5%) | 0 (0.0%) |
| $150,000 or more | 0 (0.0%) | 0 (0.0%) |
| Total | 348 (100.0%) | 85 (100.0%) |
Monthly Housing Cost Tiers in Harriston
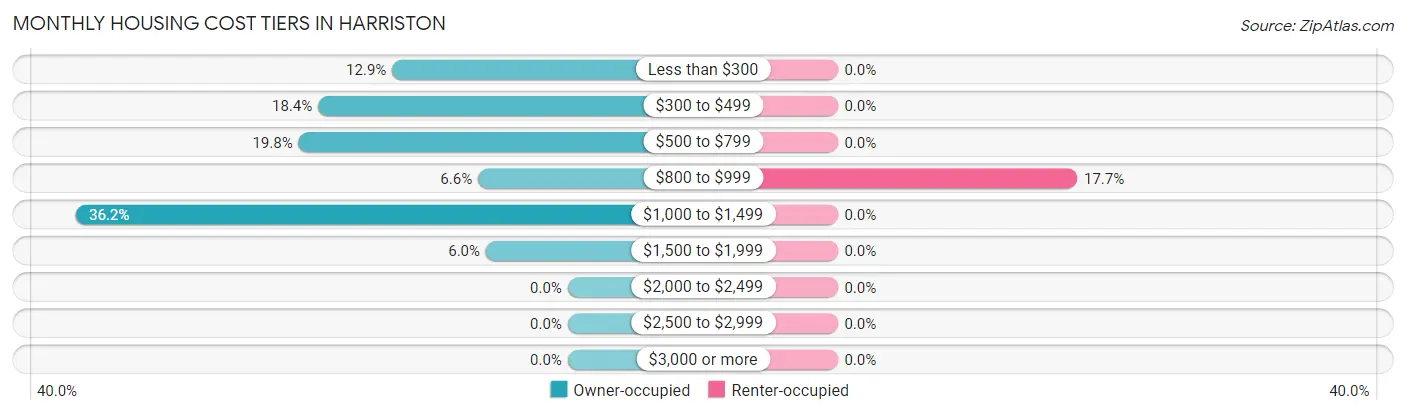
| Monthly Cost | Owner-occupied | Renter-occupied |
| Less than $300 | 45 (12.9%) | 0 (0.0%) |
| $300 to $499 | 64 (18.4%) | 0 (0.0%) |
| $500 to $799 | 69 (19.8%) | 0 (0.0%) |
| $800 to $999 | 23 (6.6%) | 15 (17.6%) |
| $1,000 to $1,499 | 126 (36.2%) | 0 (0.0%) |
| $1,500 to $1,999 | 21 (6.0%) | 0 (0.0%) |
| $2,000 to $2,499 | 0 (0.0%) | 0 (0.0%) |
| $2,500 to $2,999 | 0 (0.0%) | 0 (0.0%) |
| $3,000 or more | 0 (0.0%) | 0 (0.0%) |
| Total | 348 (100.0%) | 85 (100.0%) |
Physical Housing Characteristics in Harriston
Housing Structures in Harriston
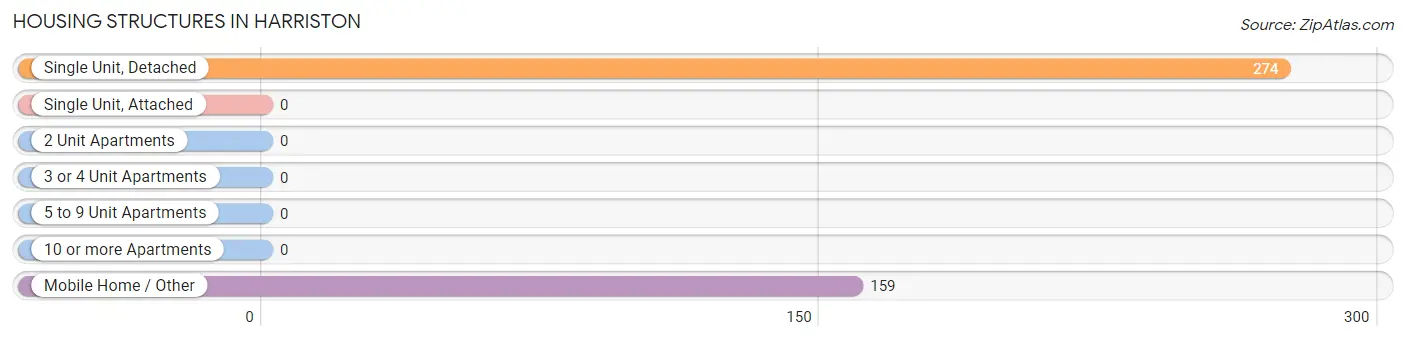
| Structure Type | # Housing Units | % Housing Units |
| Single Unit, Detached | 274 | 63.3% |
| Single Unit, Attached | 0 | 0.0% |
| 2 Unit Apartments | 0 | 0.0% |
| 3 or 4 Unit Apartments | 0 | 0.0% |
| 5 to 9 Unit Apartments | 0 | 0.0% |
| 10 or more Apartments | 0 | 0.0% |
| Mobile Home / Other | 159 | 36.7% |
| Total | 433 | 100.0% |
Housing Structures by Occupancy in Harriston
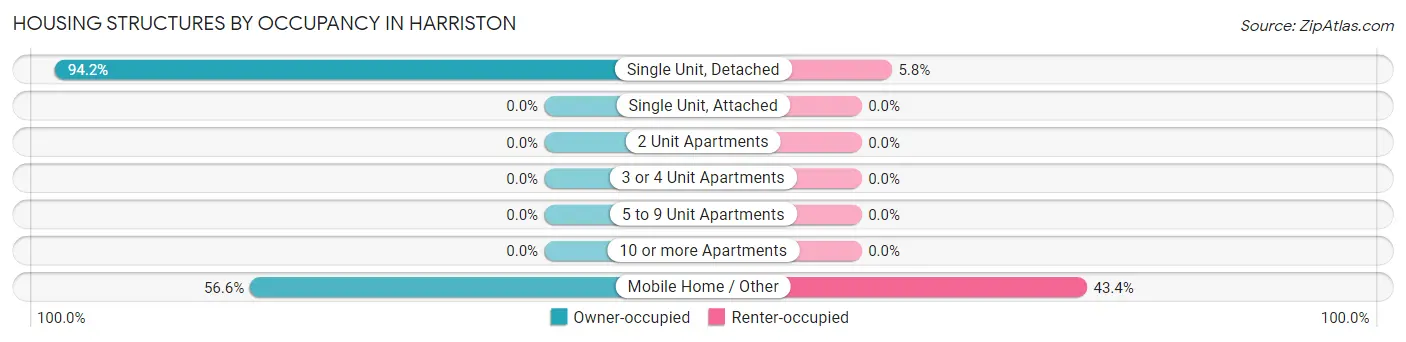
| Structure Type | Owner-occupied | Renter-occupied |
| Single Unit, Detached | 258 (94.2%) | 16 (5.8%) |
| Single Unit, Attached | 0 (0.0%) | 0 (0.0%) |
| 2 Unit Apartments | 0 (0.0%) | 0 (0.0%) |
| 3 or 4 Unit Apartments | 0 (0.0%) | 0 (0.0%) |
| 5 to 9 Unit Apartments | 0 (0.0%) | 0 (0.0%) |
| 10 or more Apartments | 0 (0.0%) | 0 (0.0%) |
| Mobile Home / Other | 90 (56.6%) | 69 (43.4%) |
| Total | 348 (80.4%) | 85 (19.6%) |
Housing Structures by Number of Rooms in Harriston
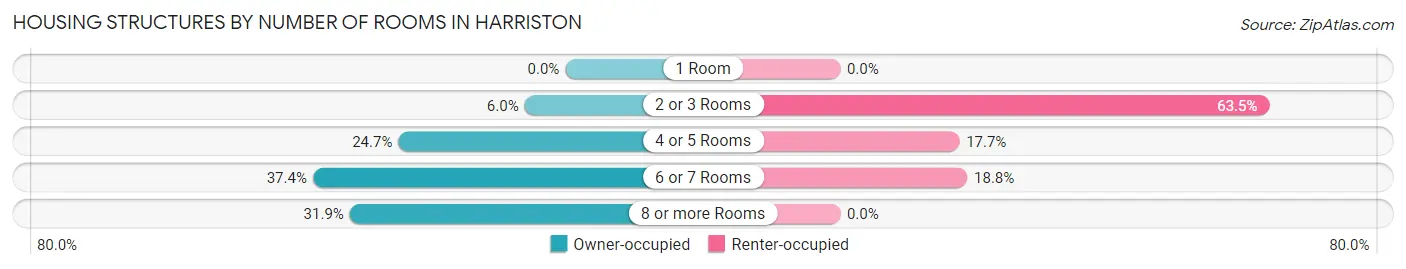
| Number of Rooms | Owner-occupied | Renter-occupied |
| 1 Room | 0 (0.0%) | 0 (0.0%) |
| 2 or 3 Rooms | 21 (6.0%) | 54 (63.5%) |
| 4 or 5 Rooms | 86 (24.7%) | 15 (17.6%) |
| 6 or 7 Rooms | 130 (37.4%) | 16 (18.8%) |
| 8 or more Rooms | 111 (31.9%) | 0 (0.0%) |
| Total | 348 (100.0%) | 85 (100.0%) |
Housing Structure by Heating Type in Harriston
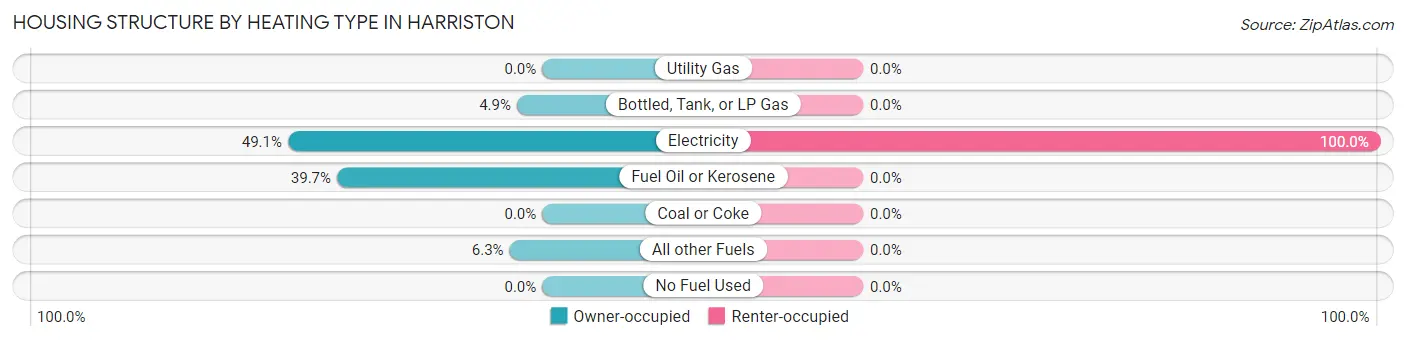
| Heating Type | Owner-occupied | Renter-occupied |
| Utility Gas | 0 (0.0%) | 0 (0.0%) |
| Bottled, Tank, or LP Gas | 17 (4.9%) | 0 (0.0%) |
| Electricity | 171 (49.1%) | 85 (100.0%) |
| Fuel Oil or Kerosene | 138 (39.7%) | 0 (0.0%) |
| Coal or Coke | 0 (0.0%) | 0 (0.0%) |
| All other Fuels | 22 (6.3%) | 0 (0.0%) |
| No Fuel Used | 0 (0.0%) | 0 (0.0%) |
| Total | 348 (100.0%) | 85 (100.0%) |
Household Vehicle Usage in Harriston
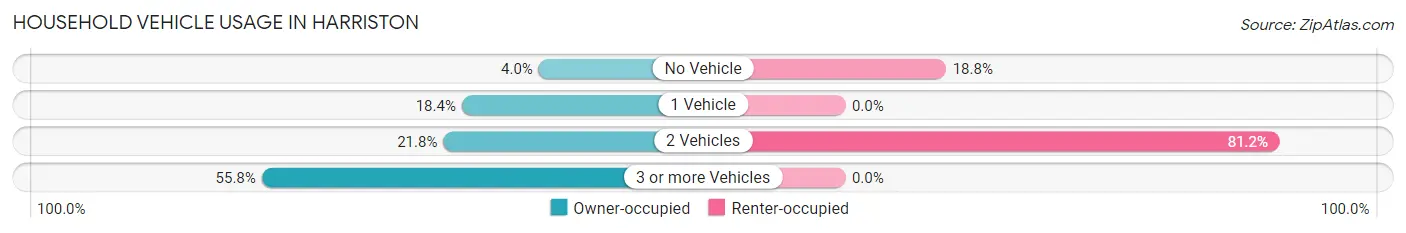
| Vehicles per Household | Owner-occupied | Renter-occupied |
| No Vehicle | 14 (4.0%) | 16 (18.8%) |
| 1 Vehicle | 64 (18.4%) | 0 (0.0%) |
| 2 Vehicles | 76 (21.8%) | 69 (81.2%) |
| 3 or more Vehicles | 194 (55.7%) | 0 (0.0%) |
| Total | 348 (100.0%) | 85 (100.0%) |
Real Estate & Mortgages in Harriston
Real Estate and Mortgage Overview in Harriston
| Characteristic | Without Mortgage | With Mortgage |
| Housing Units | 155 | 193 |
| Median Property Value | - | - |
| Median Household Income | - | - |
| Monthly Housing Costs | $434 | $0 |
| Real Estate Taxes | - | - |
Property Value by Mortgage Status in Harriston
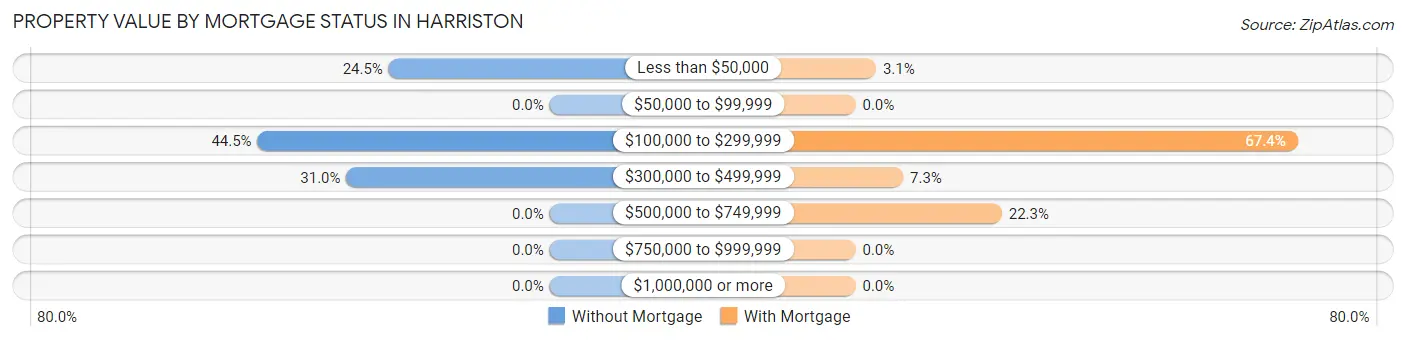
| Property Value | Without Mortgage | With Mortgage |
| Less than $50,000 | 38 (24.5%) | 6 (3.1%) |
| $50,000 to $99,999 | 0 (0.0%) | 0 (0.0%) |
| $100,000 to $299,999 | 69 (44.5%) | 130 (67.4%) |
| $300,000 to $499,999 | 48 (31.0%) | 14 (7.2%) |
| $500,000 to $749,999 | 0 (0.0%) | 43 (22.3%) |
| $750,000 to $999,999 | 0 (0.0%) | 0 (0.0%) |
| $1,000,000 or more | 0 (0.0%) | 0 (0.0%) |
| Total | 155 (100.0%) | 193 (100.0%) |
Household Income by Mortgage Status in Harriston
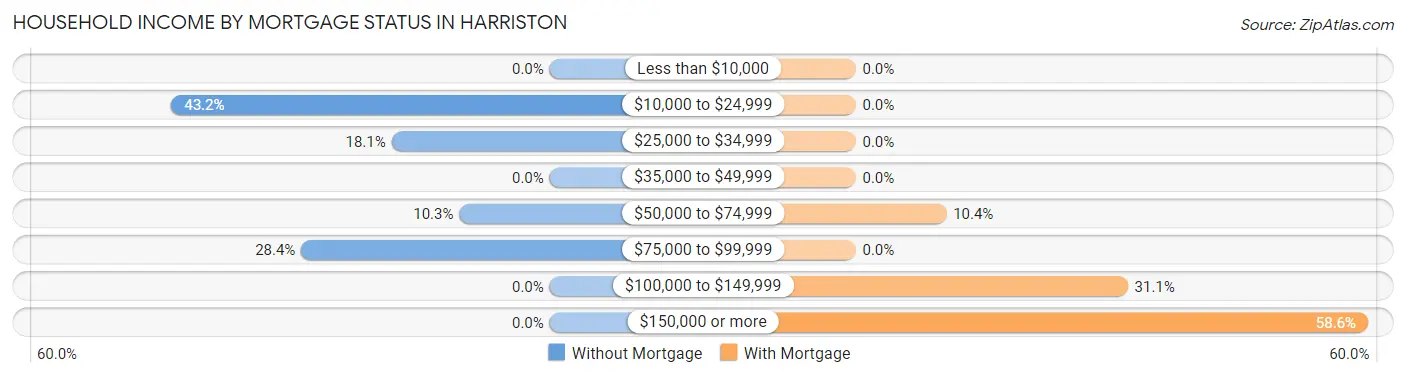
| Household Income | Without Mortgage | With Mortgage |
| Less than $10,000 | 0 (0.0%) | 0 (0.0%) |
| $10,000 to $24,999 | 67 (43.2%) | 0 (0.0%) |
| $25,000 to $34,999 | 28 (18.1%) | 0 (0.0%) |
| $35,000 to $49,999 | 0 (0.0%) | 0 (0.0%) |
| $50,000 to $74,999 | 16 (10.3%) | 20 (10.4%) |
| $75,000 to $99,999 | 44 (28.4%) | 0 (0.0%) |
| $100,000 to $149,999 | 0 (0.0%) | 60 (31.1%) |
| $150,000 or more | 0 (0.0%) | 113 (58.6%) |
| Total | 155 (100.0%) | 193 (100.0%) |
Property Value to Household Income Ratio in Harriston
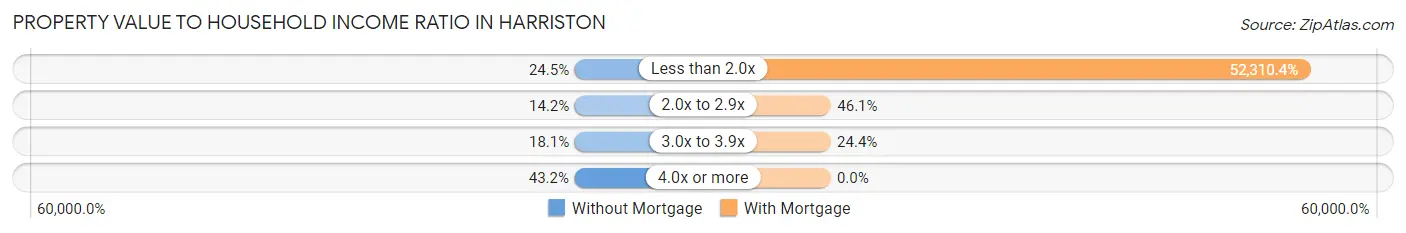
| Value-to-Income Ratio | Without Mortgage | With Mortgage |
| Less than 2.0x | 38 (24.5%) | 100,959 (52,310.4%) |
| 2.0x to 2.9x | 22 (14.2%) | 89 (46.1%) |
| 3.0x to 3.9x | 28 (18.1%) | 47 (24.3%) |
| 4.0x or more | 67 (43.2%) | 0 (0.0%) |
| Total | 155 (100.0%) | 193 (100.0%) |
Real Estate Taxes by Mortgage Status in Harriston
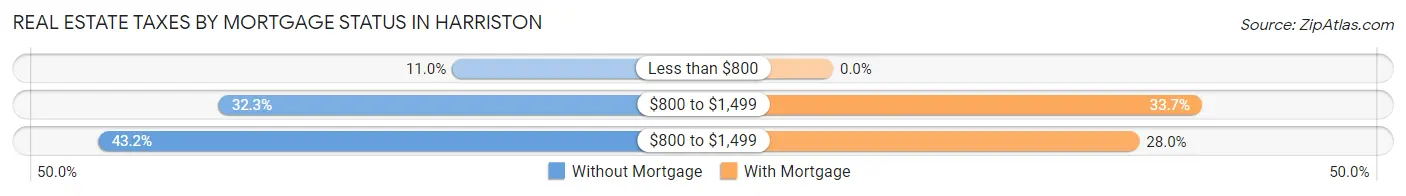
| Property Taxes | Without Mortgage | With Mortgage |
| Less than $800 | 17 (11.0%) | 0 (0.0%) |
| $800 to $1,499 | 50 (32.3%) | 65 (33.7%) |
| $800 to $1,499 | 67 (43.2%) | 54 (28.0%) |
| Total | 155 (100.0%) | 193 (100.0%) |
Health & Disability in Harriston
Health Insurance Coverage by Age in Harriston
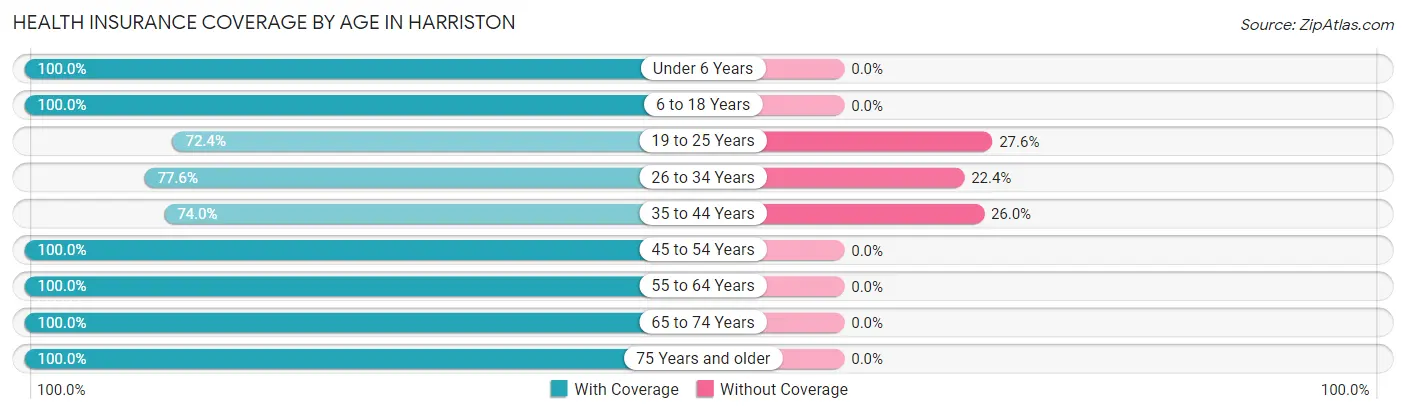
| Age Bracket | With Coverage | Without Coverage |
| Under 6 Years | 120 (100.0%) | 0 (0.0%) |
| 6 to 18 Years | 121 (100.0%) | 0 (0.0%) |
| 19 to 25 Years | 42 (72.4%) | 16 (27.6%) |
| 26 to 34 Years | 125 (77.6%) | 36 (22.4%) |
| 35 to 44 Years | 71 (74.0%) | 25 (26.0%) |
| 45 to 54 Years | 71 (100.0%) | 0 (0.0%) |
| 55 to 64 Years | 182 (100.0%) | 0 (0.0%) |
| 65 to 74 Years | 125 (100.0%) | 0 (0.0%) |
| 75 Years and older | 99 (100.0%) | 0 (0.0%) |
| Total | 956 (92.5%) | 77 (7.4%) |
Health Insurance Coverage by Citizenship Status in Harriston
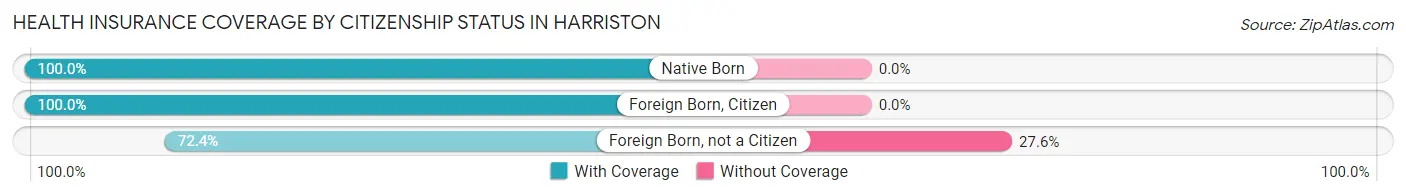
| Citizenship Status | With Coverage | Without Coverage |
| Native Born | 120 (100.0%) | 0 (0.0%) |
| Foreign Born, Citizen | 121 (100.0%) | 0 (0.0%) |
| Foreign Born, not a Citizen | 42 (72.4%) | 16 (27.6%) |
Health Insurance Coverage by Household Income in Harriston
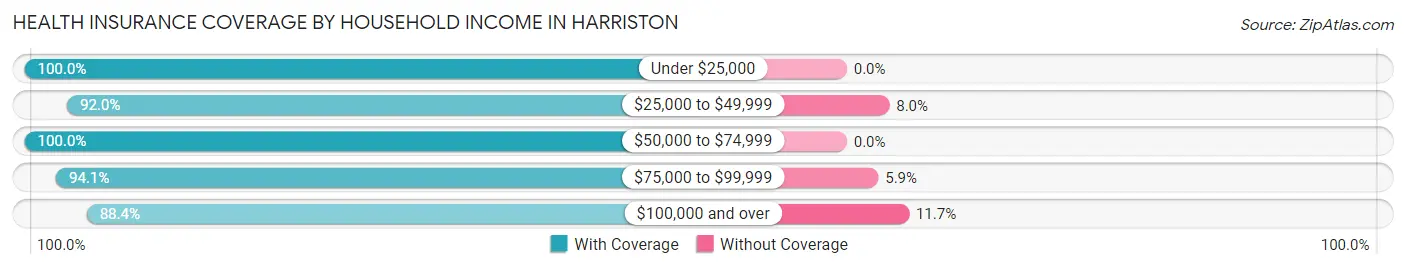
| Household Income | With Coverage | Without Coverage |
| Under $25,000 | 83 (100.0%) | 0 (0.0%) |
| $25,000 to $49,999 | 185 (92.0%) | 16 (8.0%) |
| $50,000 to $74,999 | 16 (100.0%) | 0 (0.0%) |
| $75,000 to $99,999 | 399 (94.1%) | 25 (5.9%) |
| $100,000 and over | 273 (88.3%) | 36 (11.7%) |
Public vs Private Health Insurance Coverage by Age in Harriston
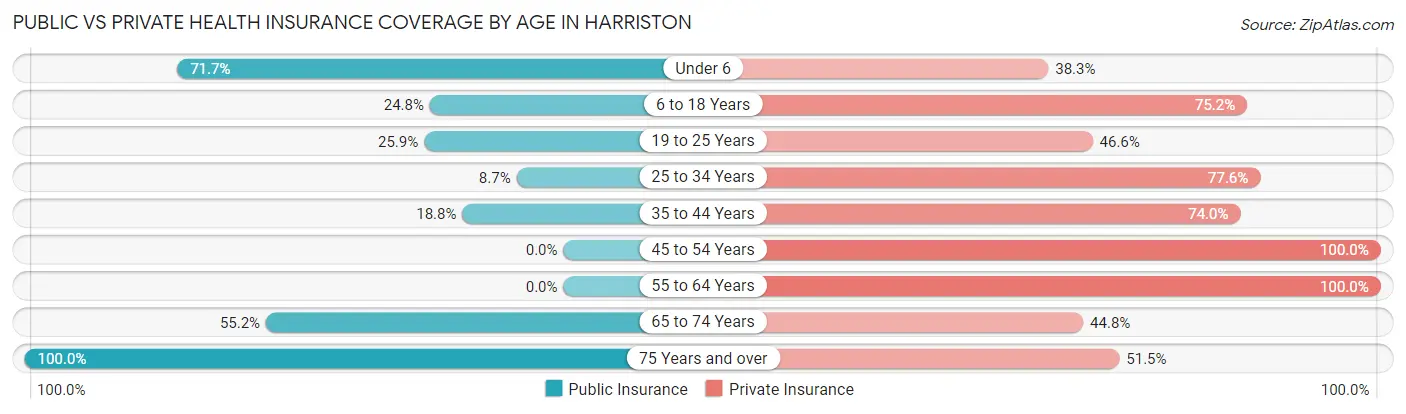
| Age Bracket | Public Insurance | Private Insurance |
| Under 6 | 86 (71.7%) | 46 (38.3%) |
| 6 to 18 Years | 30 (24.8%) | 91 (75.2%) |
| 19 to 25 Years | 15 (25.9%) | 27 (46.6%) |
| 25 to 34 Years | 14 (8.7%) | 125 (77.6%) |
| 35 to 44 Years | 18 (18.8%) | 71 (74.0%) |
| 45 to 54 Years | 0 (0.0%) | 71 (100.0%) |
| 55 to 64 Years | 0 (0.0%) | 182 (100.0%) |
| 65 to 74 Years | 69 (55.2%) | 56 (44.8%) |
| 75 Years and over | 99 (100.0%) | 51 (51.5%) |
| Total | 331 (32.0%) | 720 (69.7%) |
Disability Status by Sex by Age in Harriston
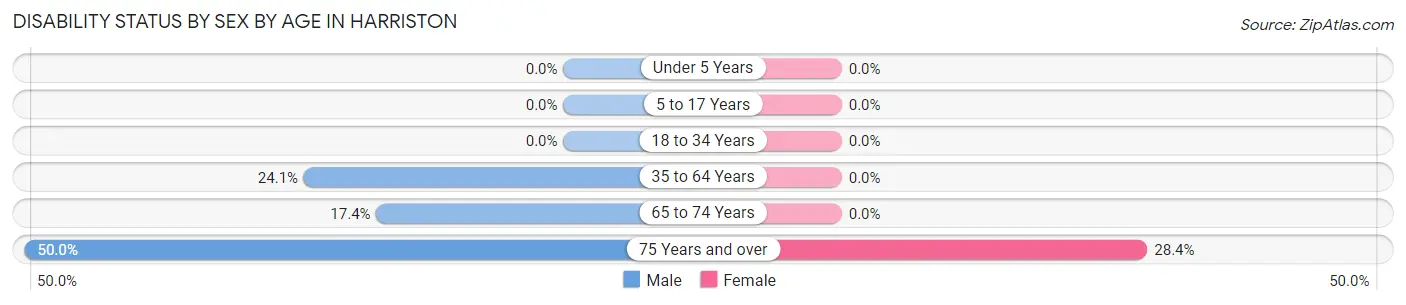
| Age Bracket | Male | Female |
| Under 5 Years | 0 (0.0%) | 0 (0.0%) |
| 5 to 17 Years | 0 (0.0%) | 0 (0.0%) |
| 18 to 34 Years | 0 (0.0%) | 0 (0.0%) |
| 35 to 64 Years | 46 (24.1%) | 0 (0.0%) |
| 65 to 74 Years | 17 (17.3%) | 0 (0.0%) |
| 75 Years and over | 16 (50.0%) | 19 (28.4%) |
Disability Class by Sex by Age in Harriston
Disability Class: Hearing Difficulty
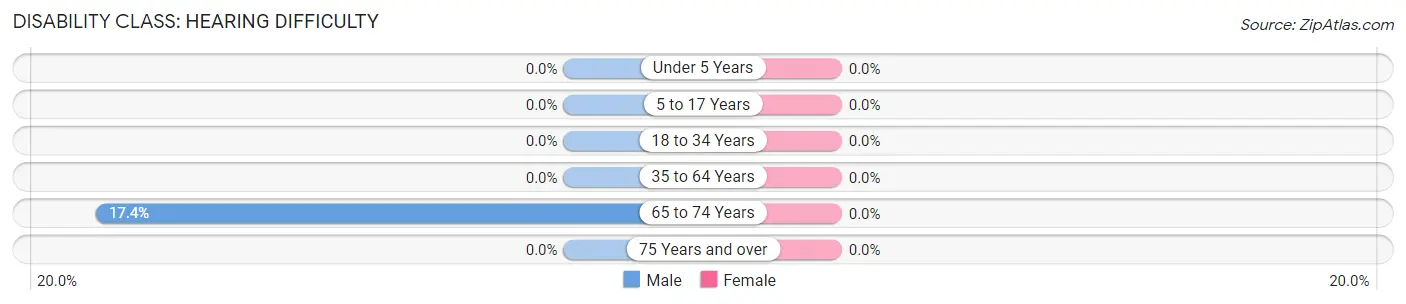
| Age Bracket | Male | Female |
| Under 5 Years | 0 (0.0%) | 0 (0.0%) |
| 5 to 17 Years | 0 (0.0%) | 0 (0.0%) |
| 18 to 34 Years | 0 (0.0%) | 0 (0.0%) |
| 35 to 64 Years | 0 (0.0%) | 0 (0.0%) |
| 65 to 74 Years | 17 (17.3%) | 0 (0.0%) |
| 75 Years and over | 0 (0.0%) | 0 (0.0%) |
Disability Class: Vision Difficulty
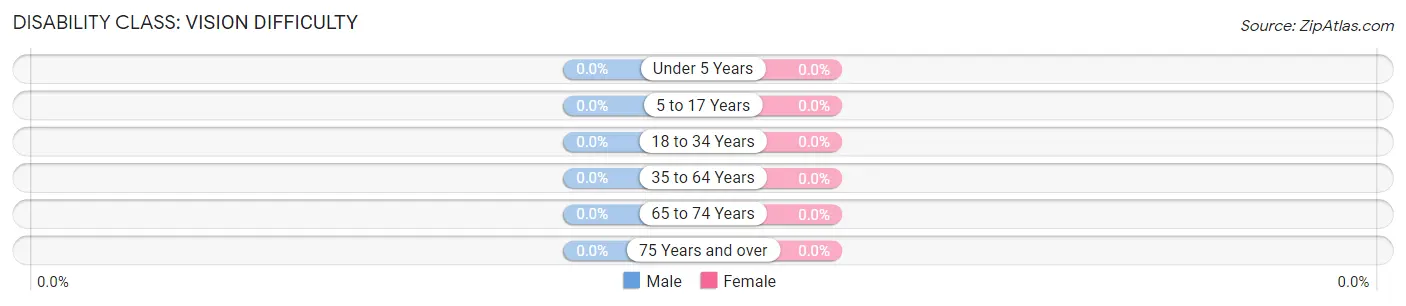
| Age Bracket | Male | Female |
| Under 5 Years | 0 (0.0%) | 0 (0.0%) |
| 5 to 17 Years | 0 (0.0%) | 0 (0.0%) |
| 18 to 34 Years | 0 (0.0%) | 0 (0.0%) |
| 35 to 64 Years | 0 (0.0%) | 0 (0.0%) |
| 65 to 74 Years | 0 (0.0%) | 0 (0.0%) |
| 75 Years and over | 0 (0.0%) | 0 (0.0%) |
Disability Class: Cognitive Difficulty
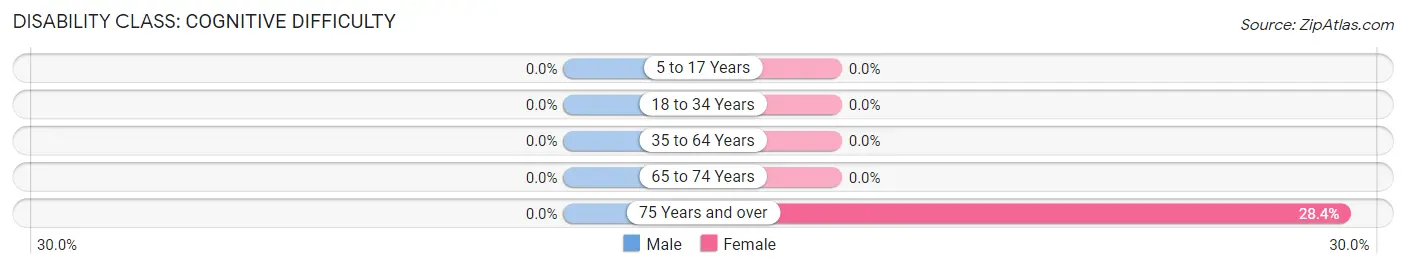
| Age Bracket | Male | Female |
| 5 to 17 Years | 0 (0.0%) | 0 (0.0%) |
| 18 to 34 Years | 0 (0.0%) | 0 (0.0%) |
| 35 to 64 Years | 0 (0.0%) | 0 (0.0%) |
| 65 to 74 Years | 0 (0.0%) | 0 (0.0%) |
| 75 Years and over | 0 (0.0%) | 19 (28.4%) |
Disability Class: Ambulatory Difficulty
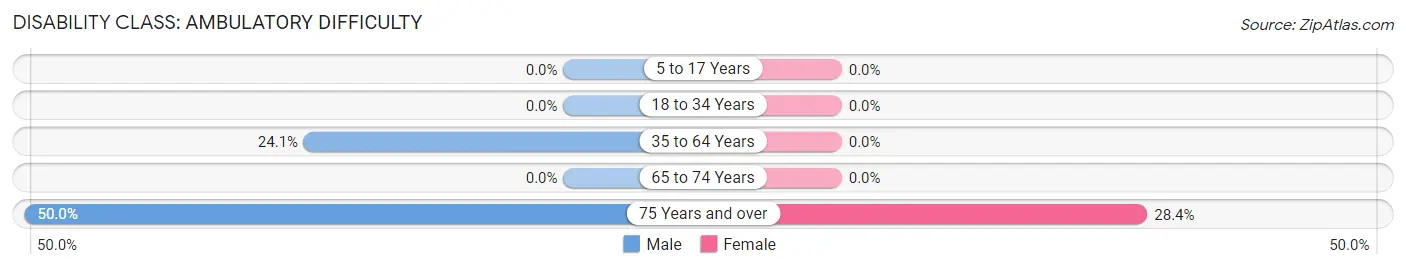
| Age Bracket | Male | Female |
| 5 to 17 Years | 0 (0.0%) | 0 (0.0%) |
| 18 to 34 Years | 0 (0.0%) | 0 (0.0%) |
| 35 to 64 Years | 46 (24.1%) | 0 (0.0%) |
| 65 to 74 Years | 0 (0.0%) | 0 (0.0%) |
| 75 Years and over | 16 (50.0%) | 19 (28.4%) |
Disability Class: Self-Care Difficulty
| Age Bracket | Male | Female |
| 5 to 17 Years | 0 (0.0%) | 0 (0.0%) |
| 18 to 34 Years | 0 (0.0%) | 0 (0.0%) |
| 35 to 64 Years | 0 (0.0%) | 0 (0.0%) |
| 65 to 74 Years | 0 (0.0%) | 0 (0.0%) |
| 75 Years and over | 0 (0.0%) | 0 (0.0%) |
Technology Access in Harriston
Computing Device Access in Harriston
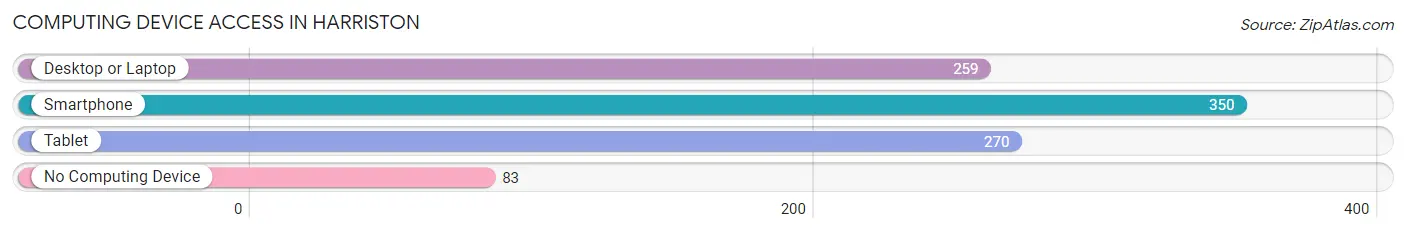
| Device Type | # Households | % Households |
| Desktop or Laptop | 259 | 59.8% |
| Smartphone | 350 | 80.8% |
| Tablet | 270 | 62.4% |
| No Computing Device | 83 | 19.2% |
| Total | 433 | 100.0% |
Internet Access in Harriston
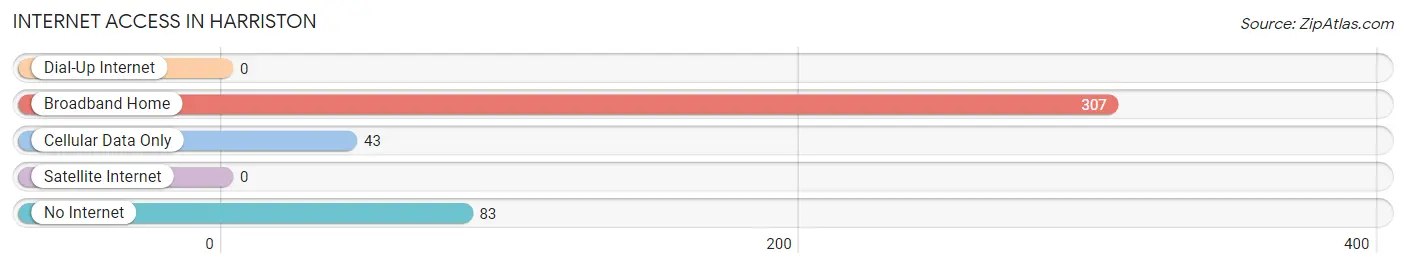
| Internet Type | # Households | % Households |
| Dial-Up Internet | 0 | 0.0% |
| Broadband Home | 307 | 70.9% |
| Cellular Data Only | 43 | 9.9% |
| Satellite Internet | 0 | 0.0% |
| No Internet | 83 | 19.2% |
| Total | 433 | 100.0% |
Harriston Summary
Harriston, Virginia is a small town located in the Shenandoah Valley of Virginia. It is situated in the foothills of the Blue Ridge Mountains and is part of the Winchester, Virginia metropolitan area. The town has a population of approximately 1,500 people and is located about 25 miles west of Winchester.
History
Harriston was founded in 1790 by William Harriston, a Revolutionary War veteran. The town was originally known as Harristonville, but the name was changed to Harriston in 1820. The town was an important stop on the Valley Turnpike, which connected Winchester to Staunton, Virginia. The turnpike was a major transportation route for goods and people in the 19th century.
Harriston was also an important stop on the Winchester and Potomac Railroad, which connected Winchester to Washington, D.C. The railroad was completed in 1836 and was a major factor in the growth of the town. The railroad brought new businesses and industries to the area, including a flour mill, a sawmill, and a tannery.
Geography
Harriston is located in the Shenandoah Valley of Virginia. The town is situated in the foothills of the Blue Ridge Mountains and is part of the Winchester, Virginia metropolitan area. The town is located about 25 miles west of Winchester and is bordered by the towns of Stephens City, Middletown, and Strasburg.
The town is situated on the banks of the Shenandoah River and is surrounded by rolling hills and farmland. The town is located at the intersection of Interstate 81 and U.S. Route 11.
Economy
The economy of Harriston is largely based on agriculture and tourism. The town is home to several farms, including a dairy farm, a beef farm, and a poultry farm. The town is also home to several wineries and vineyards, which attract tourists from all over the region.
The town is also home to several small businesses, including a hardware store, a grocery store, and a restaurant. The town is also home to a small manufacturing plant, which produces plastic products.
Demographics
As of the 2010 census, the population of Harriston was 1,500. The town is predominantly white, with a small African American population. The median household income is $45,000 and the median home value is $150,000. The town has a low unemployment rate and a high rate of homeownership.
The town is served by the Winchester Public Schools system. The town is home to one elementary school, one middle school, and one high school. The town is also home to a branch of the Shenandoah County Library.
Conclusion
Harriston, Virginia is a small town located in the Shenandoah Valley of Virginia. The town has a population of approximately 1,500 people and is located about 25 miles west of Winchester. The town was founded in 1790 and was an important stop on the Valley Turnpike and the Winchester and Potomac Railroad. The economy of Harriston is largely based on agriculture and tourism. The town is predominantly white, with a small African American population. The town is served by the Winchester Public Schools system and is home to a branch of the Shenandoah County Library.
Common Questions
What is Per Capita Income in Harriston?
Per Capita income in Harriston is $31,327.
What is the Median Family Income in Harriston?
Median Family Income in Harriston is $91,917.
What is the Median Household income in Harriston?
Median Household Income in Harriston is $86,544.
What is Income or Wage Gap in Harriston?
Income or Wage Gap in Harriston is 20.6%.
Women in Harriston earn 79.4 cents for every dollar earned by a man.
What is Inequality or Gini Index in Harriston?
Inequality or Gini Index in Harriston is 0.30.
What is the Total Population of Harriston?
Total Population of Harriston is 1,033.
What is the Total Male Population of Harriston?
Total Male Population of Harriston is 531.
What is the Total Female Population of Harriston?
Total Female Population of Harriston is 502.
What is the Ratio of Males per 100 Females in Harriston?
There are 105.78 Males per 100 Females in Harriston.
What is the Ratio of Females per 100 Males in Harriston?
There are 94.54 Females per 100 Males in Harriston.
What is the Median Population Age in Harriston?
Median Population Age in Harriston is 40.7 Years.
What is the Average Family Size in Harriston
Average Family Size in Harriston is 3.4 People.
What is the Average Household Size in Harriston
Average Household Size in Harriston is 2.4 People.
How Large is the Labor Force in Harriston?
There are 491 People in the Labor Forcein in Harriston.
What is the Percentage of People in the Labor Force in Harriston?
59.7% of People are in the Labor Force in Harriston.