Jolivue, VA Map & Demographics
Jolivue Map
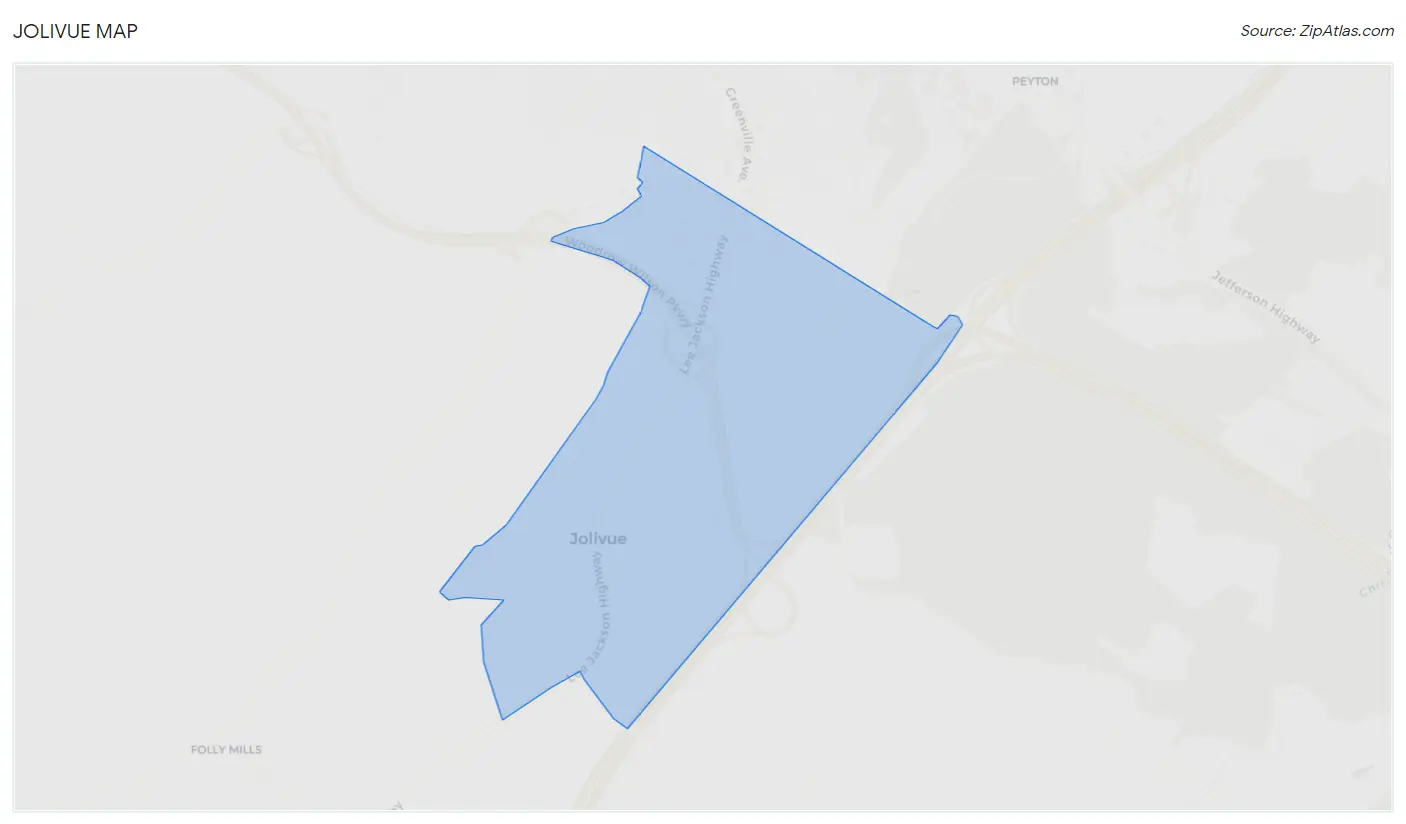
Jolivue Overview
$25,422
PER CAPITA INCOME
$35,662
AVG HOUSEHOLD INCOME
26.6%
WAGE / INCOME GAP [ % ]
73.4¢/ $1
WAGE / INCOME GAP [ $ ]
0.46
INEQUALITY / GINI INDEX
1,083
TOTAL POPULATION
432
MALE POPULATION
651
FEMALE POPULATION
66.36
MALES / 100 FEMALES
150.69
FEMALES / 100 MALES
40.8
MEDIAN AGE
3.2
AVG FAMILY SIZE
2.1
AVG HOUSEHOLD SIZE
589
LABOR FORCE [ PEOPLE ]
61.9%
PERCENT IN LABOR FORCE
4.2%
UNEMPLOYMENT RATE
Income in Jolivue
Income Overview in Jolivue
| Characteristic | Number | Measure |
| Per Capita Income | 1,083 | $25,422 |
| Median Family Income | 210 | $0 |
| Mean Family Income | 210 | $84,235 |
| Median Household Income | 506 | $35,662 |
| Mean Household Income | 506 | $54,049 |
| Income Deficit | 210 | $0 |
| Wage / Income Gap (%) | 1,083 | 26.60% |
| Wage / Income Gap ($) | 1,083 | 73.40¢ per $1 |
| Gini / Inequality Index | 1,083 | 0.46 |
Earnings by Sex in Jolivue
Average Earnings in Jolivue are $34,451, $26,732 for men and $36,420 for women, a difference of 26.6%.
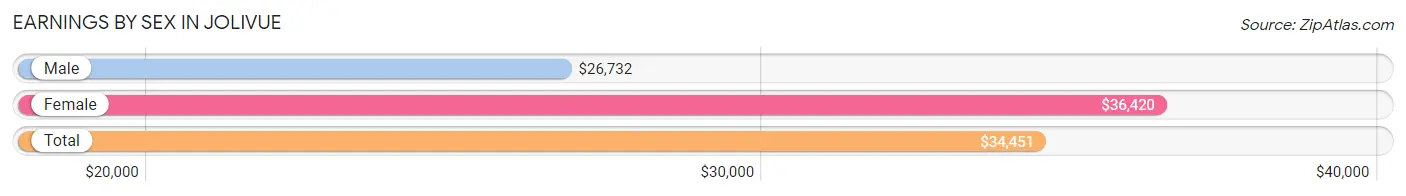
| Sex | Number | Average Earnings |
| Male | 201 (35.6%) | $26,732 |
| Female | 363 (64.4%) | $36,420 |
| Total | 564 (100.0%) | $34,451 |
Earnings by Sex by Income Bracket in Jolivue
The most common earnings brackets in Jolivue are $25,000 to $29,999 for men (95 | 47.3%) and $35,000 to $39,999 for women (74 | 20.4%).
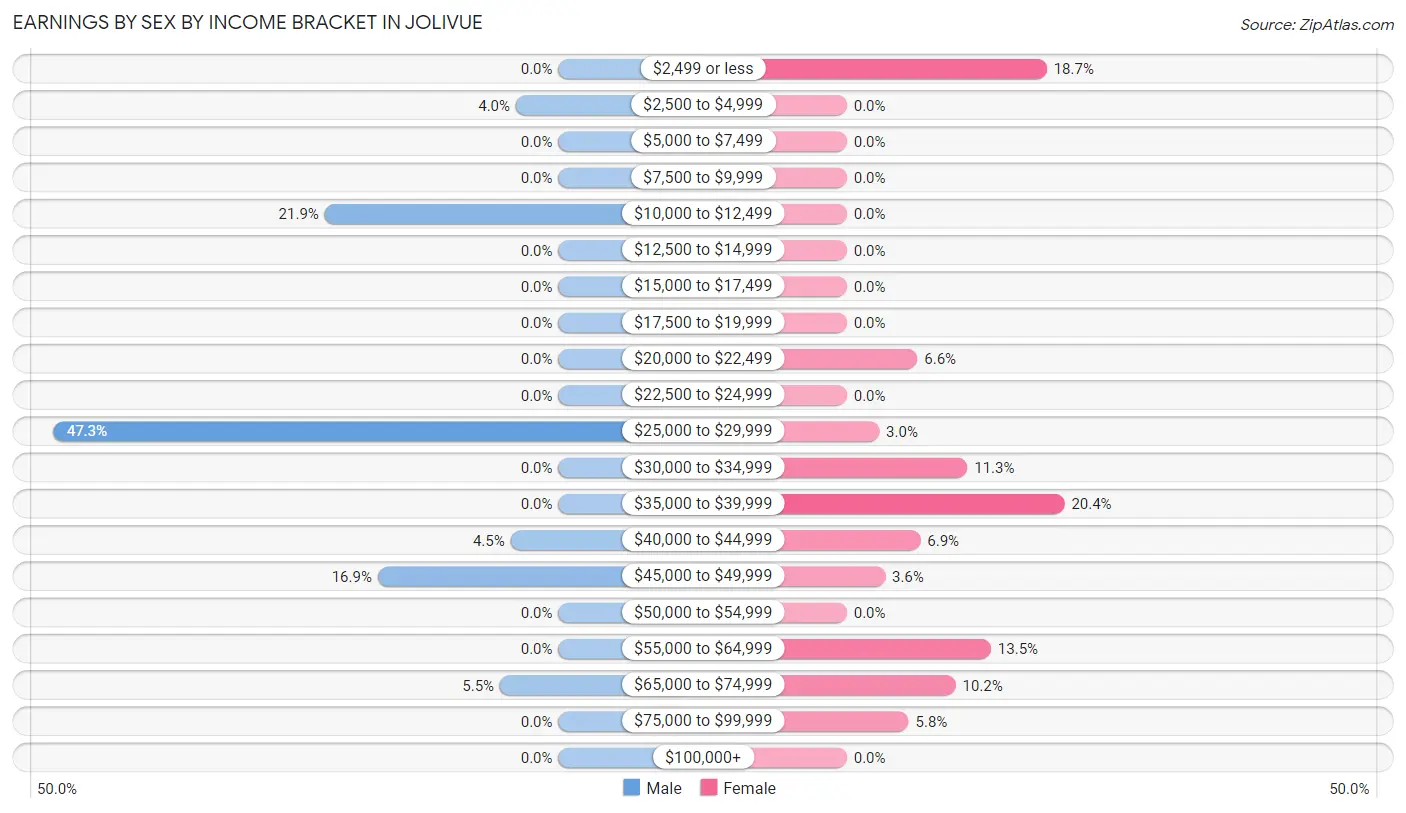
| Income | Male | Female |
| $2,499 or less | 0 (0.0%) | 68 (18.7%) |
| $2,500 to $4,999 | 8 (4.0%) | 0 (0.0%) |
| $5,000 to $7,499 | 0 (0.0%) | 0 (0.0%) |
| $7,500 to $9,999 | 0 (0.0%) | 0 (0.0%) |
| $10,000 to $12,499 | 44 (21.9%) | 0 (0.0%) |
| $12,500 to $14,999 | 0 (0.0%) | 0 (0.0%) |
| $15,000 to $17,499 | 0 (0.0%) | 0 (0.0%) |
| $17,500 to $19,999 | 0 (0.0%) | 0 (0.0%) |
| $20,000 to $22,499 | 0 (0.0%) | 24 (6.6%) |
| $22,500 to $24,999 | 0 (0.0%) | 0 (0.0%) |
| $25,000 to $29,999 | 95 (47.3%) | 11 (3.0%) |
| $30,000 to $34,999 | 0 (0.0%) | 41 (11.3%) |
| $35,000 to $39,999 | 0 (0.0%) | 74 (20.4%) |
| $40,000 to $44,999 | 9 (4.5%) | 25 (6.9%) |
| $45,000 to $49,999 | 34 (16.9%) | 13 (3.6%) |
| $50,000 to $54,999 | 0 (0.0%) | 0 (0.0%) |
| $55,000 to $64,999 | 0 (0.0%) | 49 (13.5%) |
| $65,000 to $74,999 | 11 (5.5%) | 37 (10.2%) |
| $75,000 to $99,999 | 0 (0.0%) | 21 (5.8%) |
| $100,000+ | 0 (0.0%) | 0 (0.0%) |
| Total | 201 (100.0%) | 363 (100.0%) |
Earnings by Sex by Educational Attainment in Jolivue
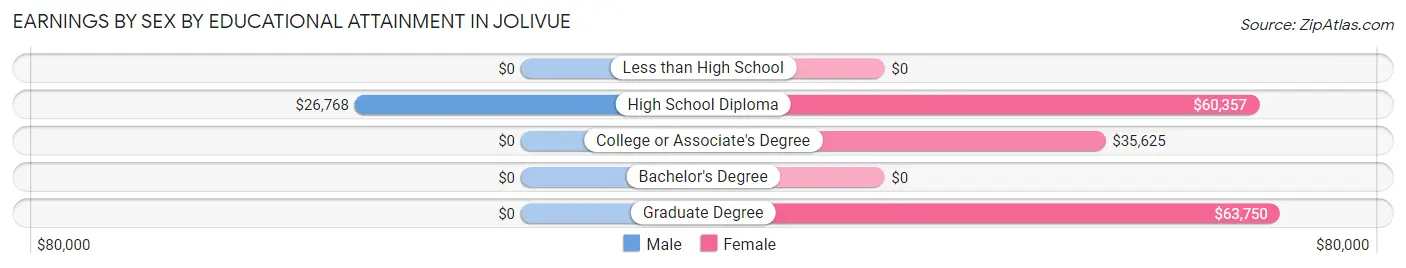
| Educational Attainment | Male Income | Female Income |
| Less than High School | - | - |
| High School Diploma | $26,768 | $60,357 |
| College or Associate's Degree | - | - |
| Bachelor's Degree | - | - |
| Graduate Degree | - | - |
| Total | - | - |
Family Income in Jolivue
Family Income Brackets in Jolivue
According to the Jolivue family income data, there are 78 families falling into the $100,000 to $149,999 income range, which is the most common income bracket and makes up 37.1% of all families.
| Income Bracket | # Families | % Families |
| Less than $10,000 | 0 | 0.0% |
| $10,000 to $14,999 | 0 | 0.0% |
| $15,000 to $24,999 | 0 | 0.0% |
| $25,000 to $34,999 | 41 | 19.5% |
| $35,000 to $49,999 | 22 | 10.5% |
| $50,000 to $74,999 | 61 | 29.0% |
| $75,000 to $99,999 | 0 | 0.0% |
| $100,000 to $149,999 | 78 | 37.1% |
| $150,000 to $199,999 | 8 | 3.8% |
| $200,000+ | 0 | 0.0% |
Family Income by Famaliy Size in Jolivue
2-person families (50 | 23.8%) account for the highest median family income in Jolivue with $138,229 per family, while 2-person families (50 | 23.8%) have the highest median income of $69,114 per family member.
| Income Bracket | # Families | Median Income |
| 2-Person Families | 50 (23.8%) | $138,229 |
| 3-Person Families | 110 (52.4%) | $63,214 |
| 4-Person Families | 50 (23.8%) | $0 |
| 5-Person Families | 0 (0.0%) | $0 |
| 6-Person Families | 0 (0.0%) | $0 |
| 7+ Person Families | 0 (0.0%) | $0 |
| Total | 210 (100.0%) | $0 |
Family Income by Number of Earners in Jolivue
| Number of Earners | # Families | Median Income |
| No Earners | 57 (27.1%) | $0 |
| 1 Earner | 32 (15.2%) | $0 |
| 2 Earners | 73 (34.8%) | $0 |
| 3+ Earners | 48 (22.9%) | $126,339 |
| Total | 210 (100.0%) | $0 |
Household Income in Jolivue
Household Income Brackets in Jolivue
With 113 households falling in the category, the $25,000 to $34,999 income range is the most frequent in Jolivue, accounting for 22.3% of all households.
| Income Bracket | # Households | % Households |
| Less than $10,000 | 41 | 8.1% |
| $10,000 to $14,999 | 72 | 14.2% |
| $15,000 to $24,999 | 0 | 0.0% |
| $25,000 to $34,999 | 113 | 22.3% |
| $35,000 to $49,999 | 108 | 21.3% |
| $50,000 to $74,999 | 37 | 7.3% |
| $75,000 to $99,999 | 49 | 9.7% |
| $100,000 to $149,999 | 72 | 14.2% |
| $150,000 to $199,999 | 14 | 2.8% |
| $200,000+ | 0 | 0.0% |
Household Income by Householder Age in Jolivue
The median household income in Jolivue is $35,662, with the highest median household income of $28,415 found in the 65+ years age bracket for the primary householder. A total of 92 households (18.2%) fall into this category. Meanwhile, the 15 to 24 years age bracket for the primary householder has the lowest median household income of $0, with 45 households (8.9%) in this group.
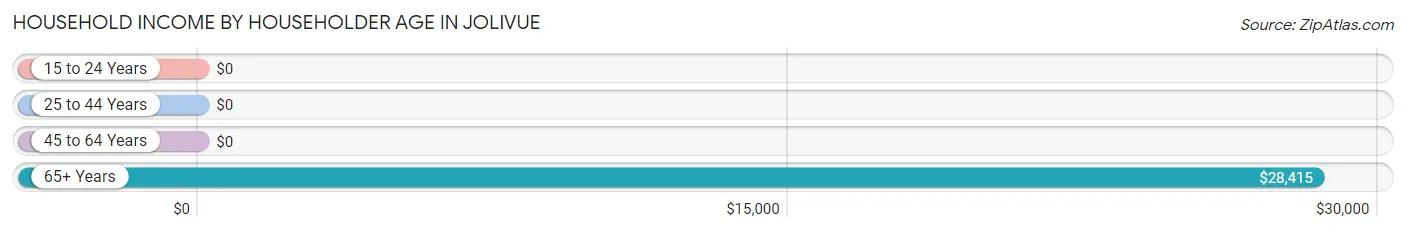
| Income Bracket | # Households | Median Income |
| 15 to 24 Years | 45 (8.9%) | $0 |
| 25 to 44 Years | 134 (26.5%) | $0 |
| 45 to 64 Years | 235 (46.4%) | $0 |
| 65+ Years | 92 (18.2%) | $28,415 |
| Total | 506 (100.0%) | $35,662 |
Poverty in Jolivue
Income Below Poverty by Sex and Age in Jolivue
With 4.6% poverty level for males and 17.4% for females among the residents of Jolivue, 18 to 24 year old males and 55 to 64 year old females are the most vulnerable to poverty, with 20 males (29.0%) and 52 females (39.7%) in their respective age groups living below the poverty level.
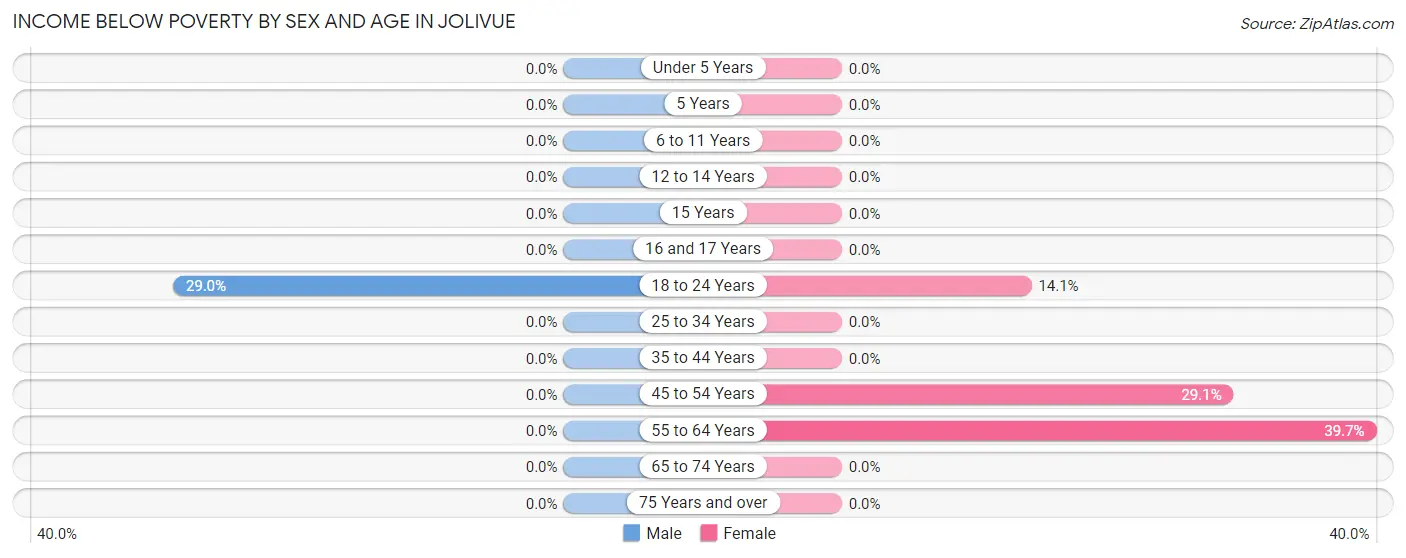
| Age Bracket | Male | Female |
| Under 5 Years | 0 (0.0%) | 0 (0.0%) |
| 5 Years | 0 (0.0%) | 0 (0.0%) |
| 6 to 11 Years | 0 (0.0%) | 0 (0.0%) |
| 12 to 14 Years | 0 (0.0%) | 0 (0.0%) |
| 15 Years | 0 (0.0%) | 0 (0.0%) |
| 16 and 17 Years | 0 (0.0%) | 0 (0.0%) |
| 18 to 24 Years | 20 (29.0%) | 20 (14.1%) |
| 25 to 34 Years | 0 (0.0%) | 0 (0.0%) |
| 35 to 44 Years | 0 (0.0%) | 0 (0.0%) |
| 45 to 54 Years | 0 (0.0%) | 41 (29.1%) |
| 55 to 64 Years | 0 (0.0%) | 52 (39.7%) |
| 65 to 74 Years | 0 (0.0%) | 0 (0.0%) |
| 75 Years and over | 0 (0.0%) | 0 (0.0%) |
| Total | 20 (4.6%) | 113 (17.4%) |
Income Above Poverty by Sex and Age in Jolivue
According to the poverty statistics in Jolivue, males aged 6 to 11 years and females aged 12 to 14 years are the age groups that are most secure financially, with 100.0% of males and 100.0% of females in these age groups living above the poverty line.
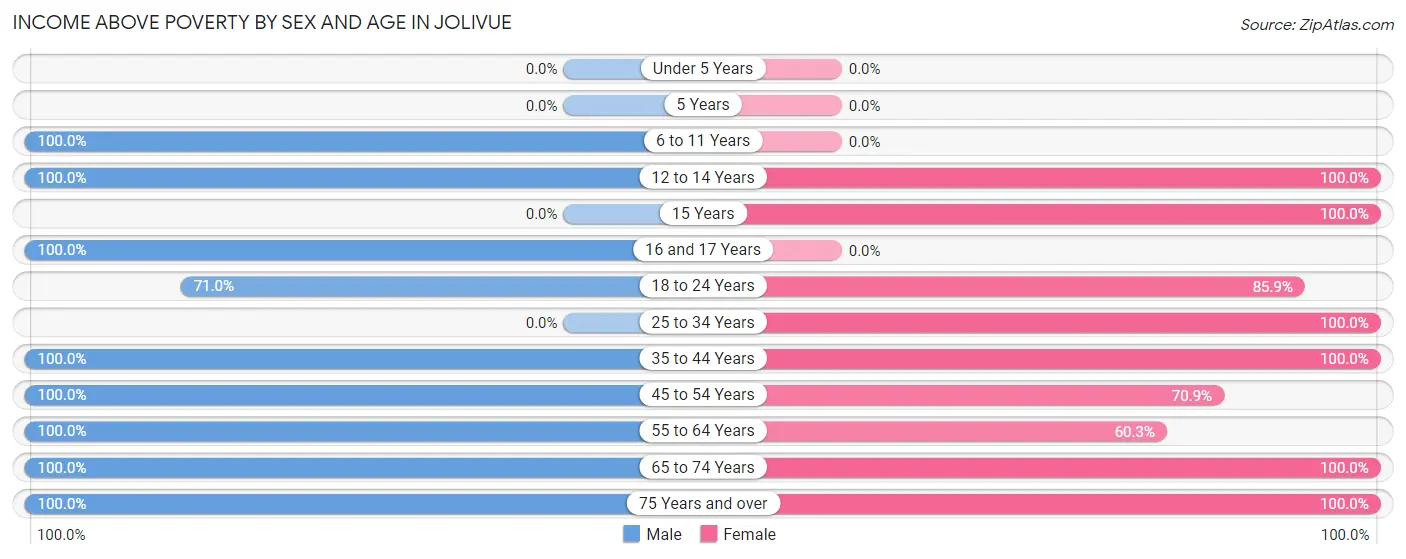
| Age Bracket | Male | Female |
| Under 5 Years | 0 (0.0%) | 0 (0.0%) |
| 5 Years | 0 (0.0%) | 0 (0.0%) |
| 6 to 11 Years | 46 (100.0%) | 0 (0.0%) |
| 12 to 14 Years | 75 (100.0%) | 5 (100.0%) |
| 15 Years | 0 (0.0%) | 6 (100.0%) |
| 16 and 17 Years | 8 (100.0%) | 0 (0.0%) |
| 18 to 24 Years | 49 (71.0%) | 122 (85.9%) |
| 25 to 34 Years | 0 (0.0%) | 120 (100.0%) |
| 35 to 44 Years | 53 (100.0%) | 28 (100.0%) |
| 45 to 54 Years | 64 (100.0%) | 100 (70.9%) |
| 55 to 64 Years | 69 (100.0%) | 79 (60.3%) |
| 65 to 74 Years | 17 (100.0%) | 50 (100.0%) |
| 75 Years and over | 31 (100.0%) | 28 (100.0%) |
| Total | 412 (95.4%) | 538 (82.6%) |
Income Below Poverty Among Married-Couple Families in Jolivue
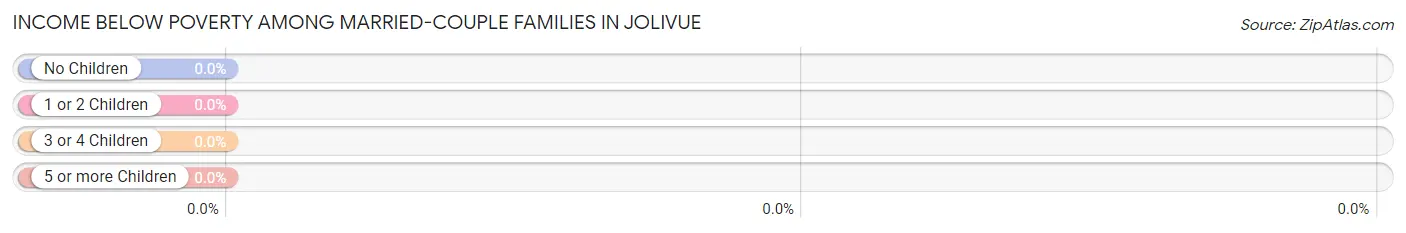
| Children | Above Poverty | Below Poverty |
| No Children | 55 (100.0%) | 0 (0.0%) |
| 1 or 2 Children | 43 (100.0%) | 0 (0.0%) |
| 3 or 4 Children | 0 (0.0%) | 0 (0.0%) |
| 5 or more Children | 0 (0.0%) | 0 (0.0%) |
| Total | 98 (100.0%) | 0 (0.0%) |
Income Below Poverty Among Single-Parent Households in Jolivue
| Children | Single Father | Single Mother |
| No Children | 0 (0.0%) | 0 (0.0%) |
| 1 or 2 Children | 0 (0.0%) | 0 (0.0%) |
| 3 or 4 Children | 0 (0.0%) | 0 (0.0%) |
| 5 or more Children | 0 (0.0%) | 0 (0.0%) |
| Total | 0 (0.0%) | 0 (0.0%) |
Income Below Poverty Among Married-Couple vs Single-Parent Households in Jolivue
| Children | Married-Couple Families | Single-Parent Households |
| No Children | 0 (0.0%) | 0 (0.0%) |
| 1 or 2 Children | 0 (0.0%) | 0 (0.0%) |
| 3 or 4 Children | 0 (0.0%) | 0 (0.0%) |
| 5 or more Children | 0 (0.0%) | 0 (0.0%) |
| Total | 0 (0.0%) | 0 (0.0%) |
Race in Jolivue
The most populous races in Jolivue are White / Caucasian (1,021 | 94.3%), Hawaiian / Pacific (41 | 3.8%), and Black / African American (21 | 1.9%).
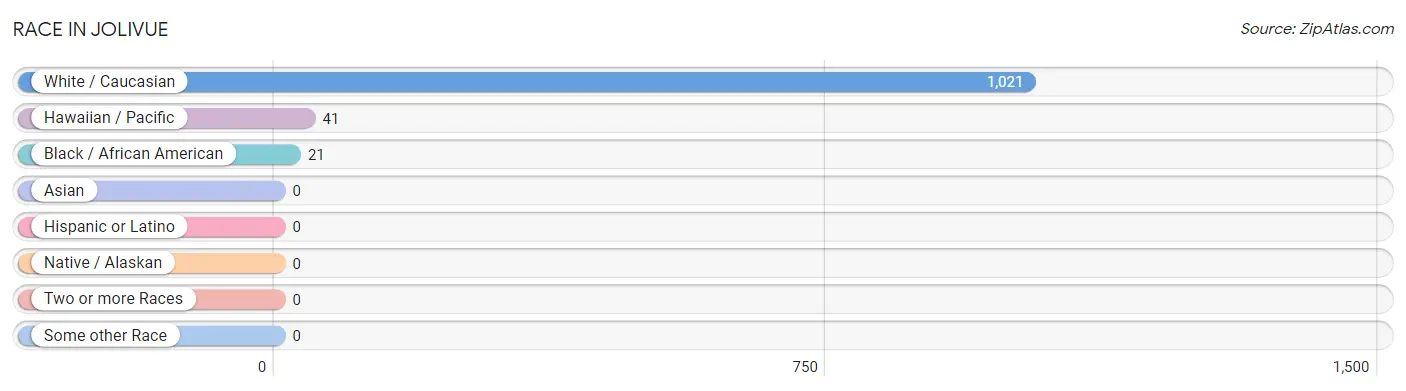
| Race | # Population | % Population |
| Asian | 0 | 0.0% |
| Black / African American | 21 | 1.9% |
| Hawaiian / Pacific | 41 | 3.8% |
| Hispanic or Latino | 0 | 0.0% |
| Native / Alaskan | 0 | 0.0% |
| White / Caucasian | 1,021 | 94.3% |
| Two or more Races | 0 | 0.0% |
| Some other Race | 0 | 0.0% |
| Total | 1,083 | 100.0% |
Ancestry in Jolivue
The most populous ancestries reported in Jolivue are American (293 | 27.1%), Italian (130 | 12.0%), English (94 | 8.7%), German (62 | 5.7%), and Native Hawaiian (41 | 3.8%), together accounting for 57.2% of all Jolivue residents.
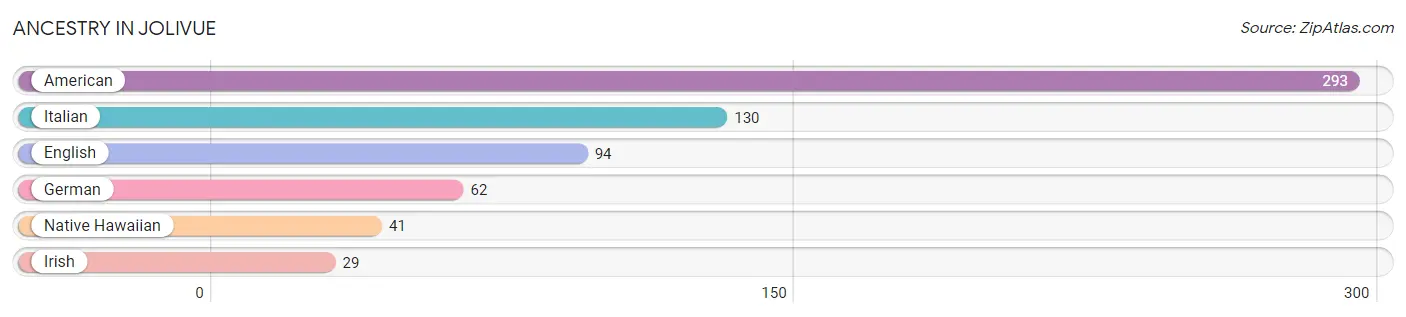
| Ancestry | # Population | % Population |
| American | 293 | 27.1% |
| English | 94 | 8.7% |
| German | 62 | 5.7% |
| Irish | 29 | 2.7% |
| Italian | 130 | 12.0% |
| Native Hawaiian | 41 | 3.8% | View All 6 Rows |
Immigrants in Jolivue

| Immigration Origin | # Population | % Population | View All 0 Rows |
Sex and Age in Jolivue
Sex and Age in Jolivue
The most populous age groups in Jolivue are 10 to 14 Years (75 | 17.4%) for men and 20 to 24 Years (122 | 18.7%) for women.
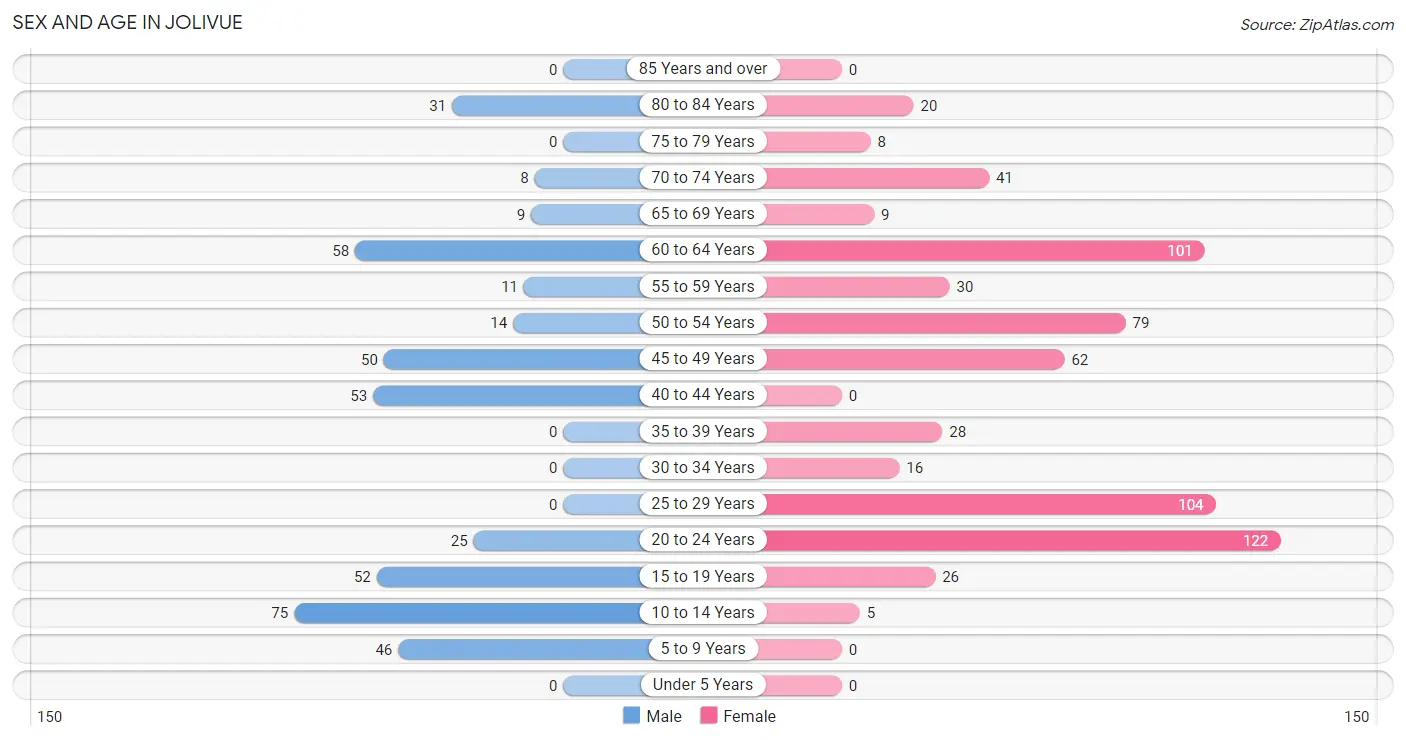
| Age Bracket | Male | Female |
| Under 5 Years | 0 (0.0%) | 0 (0.0%) |
| 5 to 9 Years | 46 (10.6%) | 0 (0.0%) |
| 10 to 14 Years | 75 (17.4%) | 5 (0.8%) |
| 15 to 19 Years | 52 (12.0%) | 26 (4.0%) |
| 20 to 24 Years | 25 (5.8%) | 122 (18.7%) |
| 25 to 29 Years | 0 (0.0%) | 104 (16.0%) |
| 30 to 34 Years | 0 (0.0%) | 16 (2.5%) |
| 35 to 39 Years | 0 (0.0%) | 28 (4.3%) |
| 40 to 44 Years | 53 (12.3%) | 0 (0.0%) |
| 45 to 49 Years | 50 (11.6%) | 62 (9.5%) |
| 50 to 54 Years | 14 (3.2%) | 79 (12.1%) |
| 55 to 59 Years | 11 (2.5%) | 30 (4.6%) |
| 60 to 64 Years | 58 (13.4%) | 101 (15.5%) |
| 65 to 69 Years | 9 (2.1%) | 9 (1.4%) |
| 70 to 74 Years | 8 (1.8%) | 41 (6.3%) |
| 75 to 79 Years | 0 (0.0%) | 8 (1.2%) |
| 80 to 84 Years | 31 (7.2%) | 20 (3.1%) |
| 85 Years and over | 0 (0.0%) | 0 (0.0%) |
| Total | 432 (100.0%) | 651 (100.0%) |
Families and Households in Jolivue
Median Family Size in Jolivue
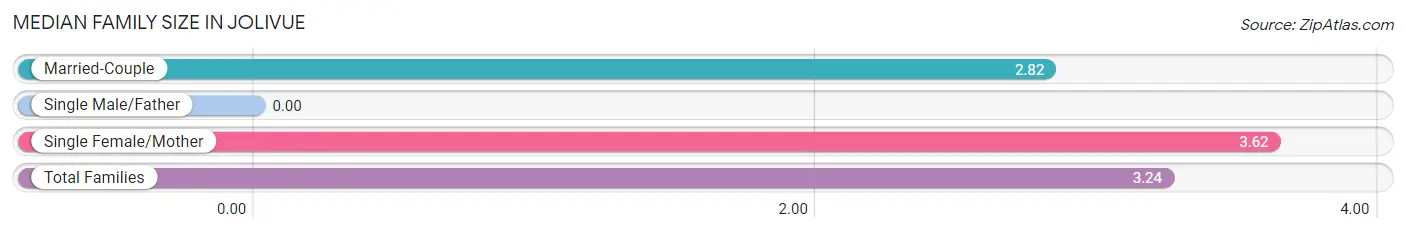
| Family Type | # Families | Family Size |
| Married-Couple | 98 (46.7%) | 2.82 |
| Single Male/Father | 0 (0.0%) | - |
| Single Female/Mother | 112 (53.3%) | 3.62 |
| Total Families | 210 (100.0%) | 3.24 |
Median Household Size in Jolivue
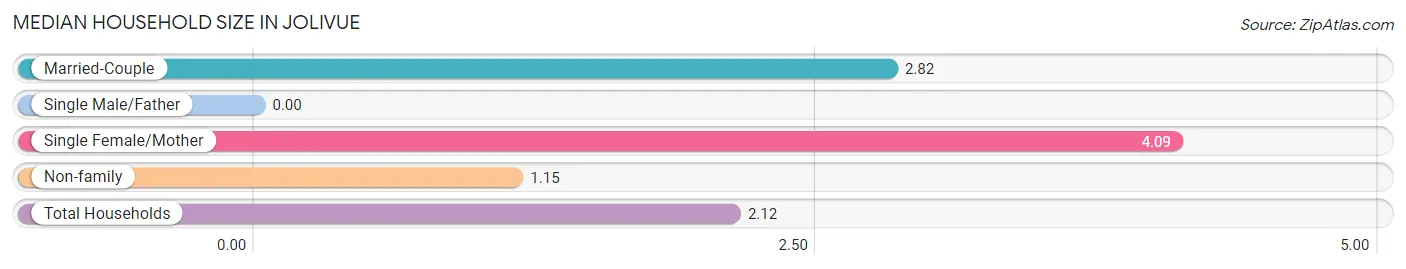
| Household Type | # Households | Household Size |
| Married-Couple | 98 (19.4%) | 2.82 |
| Single Male/Father | 0 (0.0%) | - |
| Single Female/Mother | 112 (22.1%) | 4.09 |
| Non-family | 296 (58.5%) | 1.15 |
| Total Households | 506 (100.0%) | 2.12 |
Household Size by Marriage Status in Jolivue
Out of a total of 506 households in Jolivue, 210 (41.5%) are family households, while 296 (58.5%) are nonfamily households. The most numerous type of family households are 4-person households, comprising 99, and the most common type of nonfamily households are 1-person households, comprising 251.
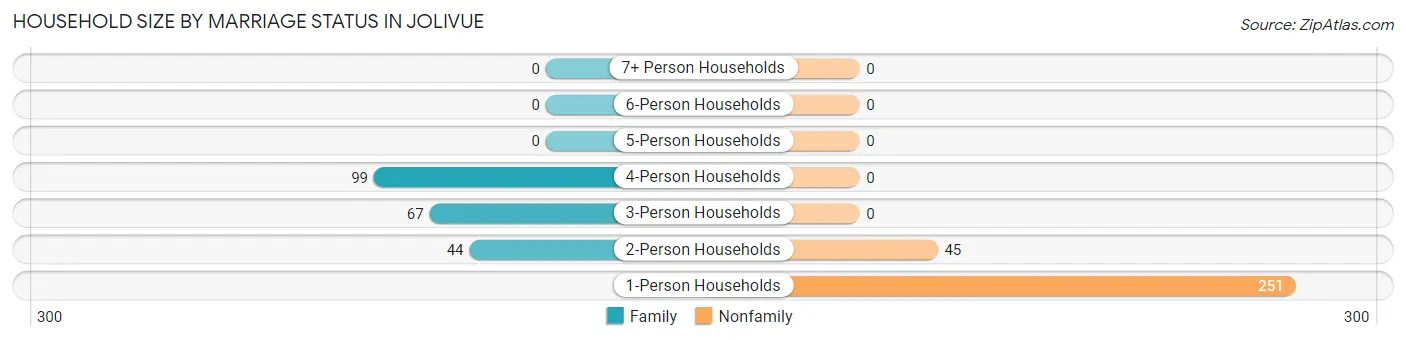
| Household Size | Family Households | Nonfamily Households |
| 1-Person Households | - | 251 (49.6%) |
| 2-Person Households | 44 (8.7%) | 45 (8.9%) |
| 3-Person Households | 67 (13.2%) | 0 (0.0%) |
| 4-Person Households | 99 (19.6%) | 0 (0.0%) |
| 5-Person Households | 0 (0.0%) | 0 (0.0%) |
| 6-Person Households | 0 (0.0%) | 0 (0.0%) |
| 7+ Person Households | 0 (0.0%) | 0 (0.0%) |
| Total | 210 (41.5%) | 296 (58.5%) |
Female Fertility in Jolivue
Fertility by Age in Jolivue
| Age Bracket | Women with Births | Births / 1,000 Women |
| 15 to 19 years | 0 (0.0%) | 0.0 |
| 20 to 34 years | 0 (0.0%) | 0.0 |
| 35 to 50 years | 0 (0.0%) | 0.0 |
| Total | 0 (0.0%) | 0.0 |
Fertility by Age by Marriage Status in Jolivue
| Age Bracket | Married | Unmarried |
| 15 to 19 years | 0 (0.0%) | 0 (0.0%) |
| 20 to 34 years | 0 (0.0%) | 0 (0.0%) |
| 35 to 50 years | 0 (0.0%) | 0 (0.0%) |
| Total | 0 (0.0%) | 0 (0.0%) |
Fertility by Education in Jolivue
| Educational Attainment | Women with Births | Births / 1,000 Women |
| Less than High School | 0 (0.0%) | 0.0 |
| High School Diploma | 0 (0.0%) | 0.0 |
| College or Associate's Degree | 0 (0.0%) | 0.0 |
| Bachelor's Degree | 0 (0.0%) | 0.0 |
| Graduate Degree | 0 (0.0%) | 0.0 |
| Total | 0 (0.0%) | 0.0 |
Fertility by Education by Marriage Status in Jolivue
| Educational Attainment | Married | Unmarried |
| Less than High School | 0 (0.0%) | 0 (0.0%) |
| High School Diploma | 0 (0.0%) | 0 (0.0%) |
| College or Associate's Degree | 0 (0.0%) | 0 (0.0%) |
| Bachelor's Degree | 0 (0.0%) | 0 (0.0%) |
| Graduate Degree | 0 (0.0%) | 0 (0.0%) |
| Total | 0 (0.0%) | 0 (0.0%) |
Employment Characteristics in Jolivue
Employment by Class of Employer in Jolivue
Among the 553 employed individuals in Jolivue, private company employees (359 | 64.9%), state government employees (52 | 9.4%), and not-for-profit organizations (49 | 8.9%) make up the most common classes of employment.
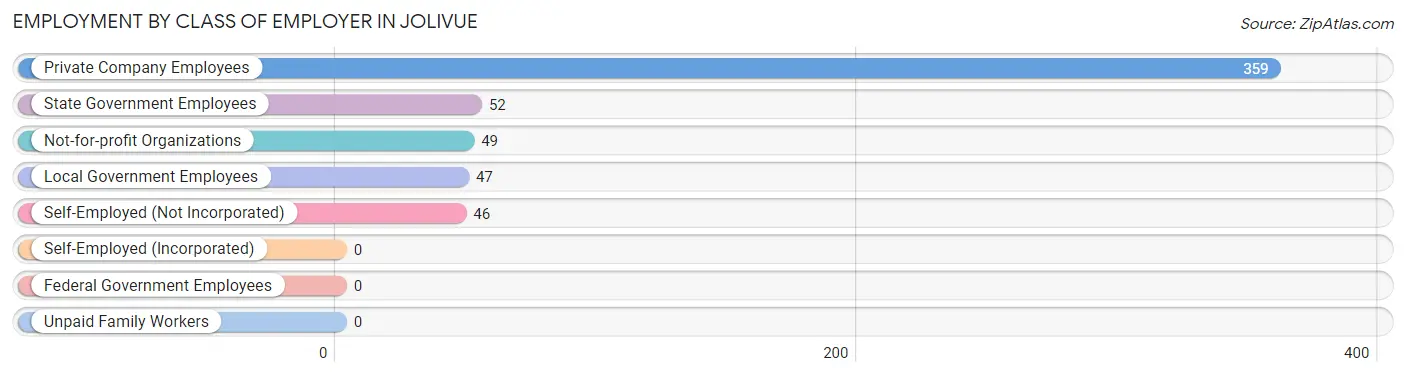
| Employer Class | # Employees | % Employees |
| Private Company Employees | 359 | 64.9% |
| Self-Employed (Incorporated) | 0 | 0.0% |
| Self-Employed (Not Incorporated) | 46 | 8.3% |
| Not-for-profit Organizations | 49 | 8.9% |
| Local Government Employees | 47 | 8.5% |
| State Government Employees | 52 | 9.4% |
| Federal Government Employees | 0 | 0.0% |
| Unpaid Family Workers | 0 | 0.0% |
| Total | 553 | 100.0% |
Employment Status by Age in Jolivue
According to the labor force statistics for Jolivue, out of the total population over 16 years of age (951), 61.9% or 589 individuals are in the labor force, with 4.2% or 25 of them unemployed. The age group with the highest labor force participation rate is 25 to 29 years, with 100.0% or 104 individuals in the labor force. Within the labor force, the 25 to 29 years age range has the highest percentage of unemployed individuals, with 24.0% or 25 of them being unemployed.
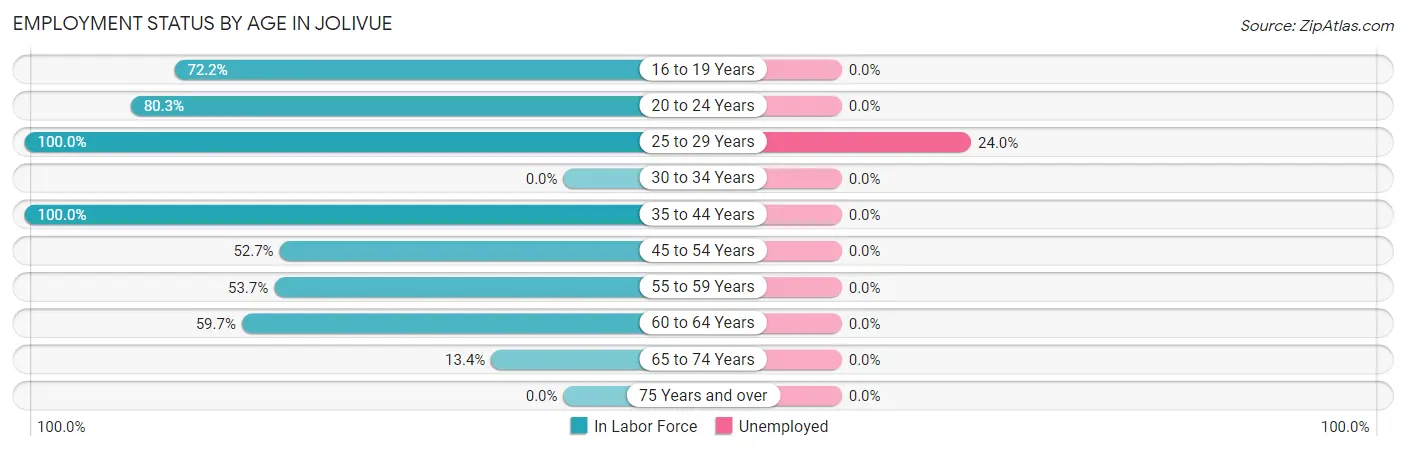
| Age Bracket | In Labor Force | Unemployed |
| 16 to 19 Years | 52 (72.2%) | 0 (0.0%) |
| 20 to 24 Years | 118 (80.3%) | 0 (0.0%) |
| 25 to 29 Years | 104 (100.0%) | 25 (24.0%) |
| 30 to 34 Years | 0 (0.0%) | 0 (0.0%) |
| 35 to 44 Years | 81 (100.0%) | 0 (0.0%) |
| 45 to 54 Years | 108 (52.7%) | 0 (0.0%) |
| 55 to 59 Years | 22 (53.7%) | 0 (0.0%) |
| 60 to 64 Years | 95 (59.7%) | 0 (0.0%) |
| 65 to 74 Years | 9 (13.4%) | 0 (0.0%) |
| 75 Years and over | 0 (0.0%) | 0 (0.0%) |
| Total | 589 (61.9%) | 25 (4.2%) |
Employment Status by Educational Attainment in Jolivue
According to labor force statistics for Jolivue, 67.7% of individuals (410) out of the total population between 25 and 64 years of age (606) are in the labor force, with 6.1% or 25 of them being unemployed. The group with the highest labor force participation rate are those with the educational attainment of bachelor's degree or higher, with 100.0% or 73 individuals in the labor force. Within the labor force, individuals with high school diploma education have the highest percentage of unemployment, with 12.0% or 25 of them being unemployed.
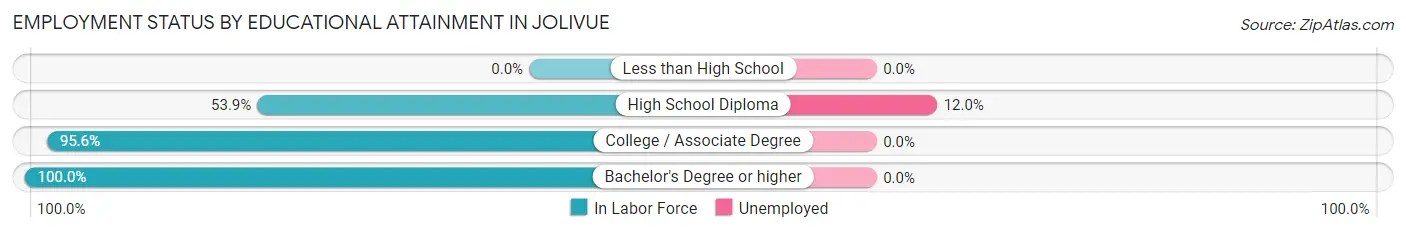
| Educational Attainment | In Labor Force | Unemployed |
| Less than High School | 0 (0.0%) | 0 (0.0%) |
| High School Diploma | 208 (53.9%) | 46 (12.0%) |
| College / Associate Degree | 129 (95.6%) | 0 (0.0%) |
| Bachelor's Degree or higher | 73 (100.0%) | 0 (0.0%) |
| Total | 410 (67.7%) | 37 (6.1%) |
Employment Occupations by Sex in Jolivue
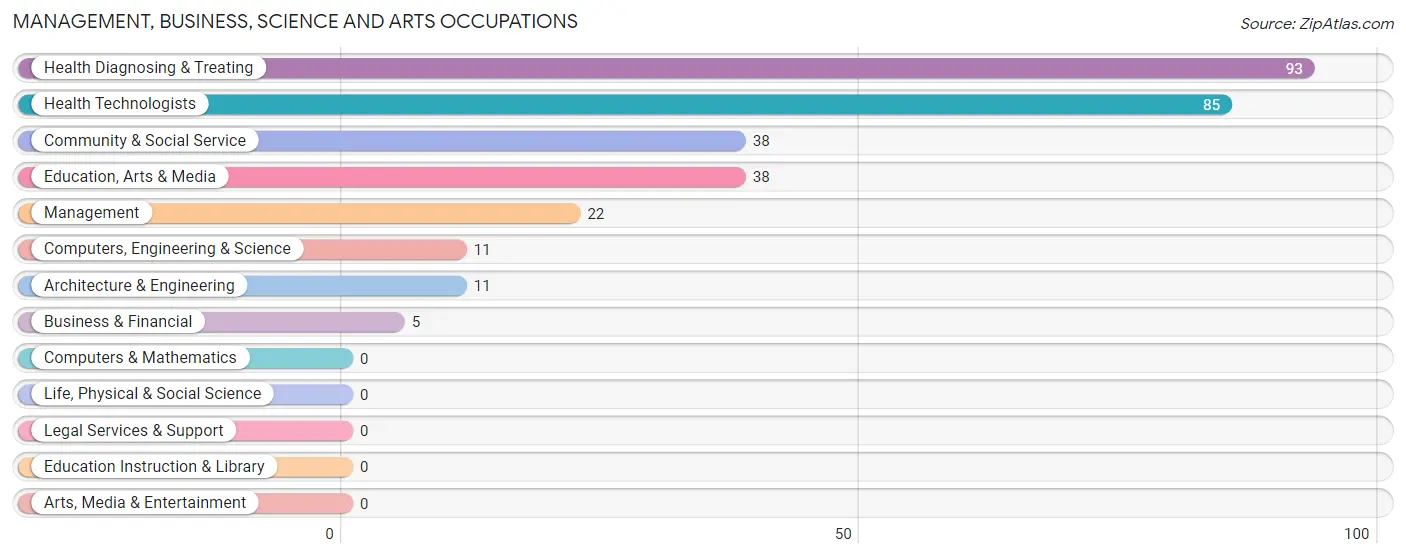
Management, Business, Science and Arts Occupations
The most common Management, Business, Science and Arts occupations in Jolivue are Health Diagnosing & Treating (93 | 16.5%), Health Technologists (85 | 15.1%), Community & Social Service (38 | 6.7%), Education, Arts & Media (38 | 6.7%), and Management (22 | 3.9%).
Management, Business, Science and Arts Occupations by Sex
Within the Management, Business, Science and Arts occupations in Jolivue, the most male-oriented occupations are Business & Financial (100.0%), Computers, Engineering & Science (100.0%), and Architecture & Engineering (100.0%), while the most female-oriented occupations are Management (100.0%), Community & Social Service (100.0%), and Education, Arts & Media (100.0%).
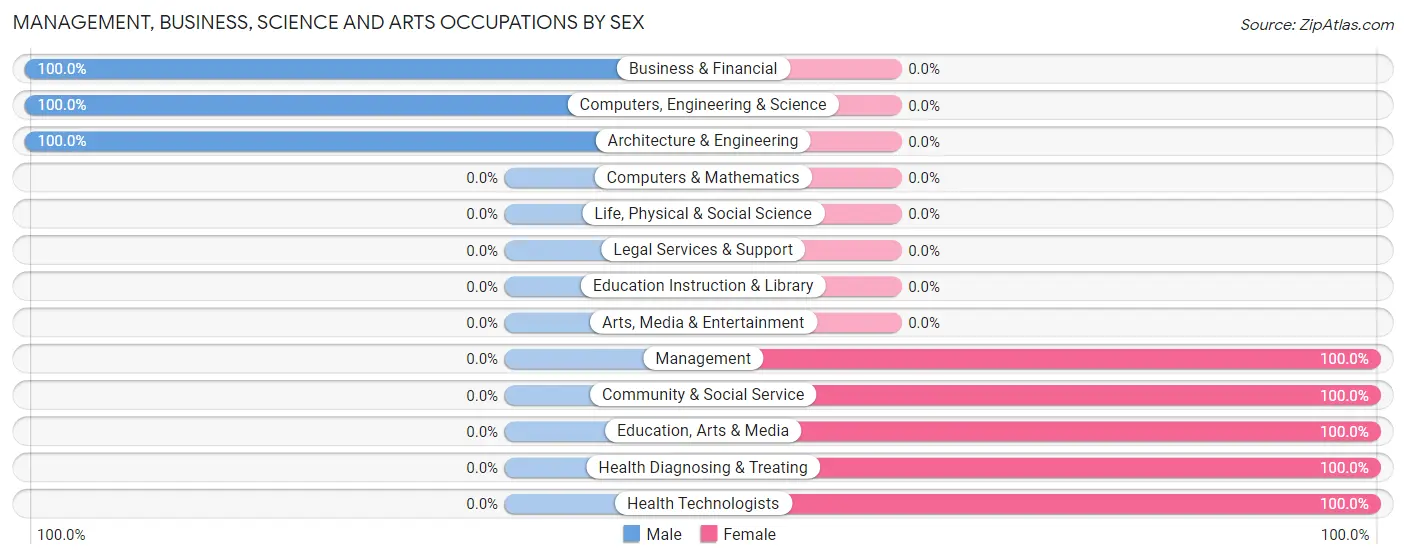
| Occupation | Male | Female |
| Management | 0 (0.0%) | 22 (100.0%) |
| Business & Financial | 5 (100.0%) | 0 (0.0%) |
| Computers, Engineering & Science | 11 (100.0%) | 0 (0.0%) |
| Computers & Mathematics | 0 (0.0%) | 0 (0.0%) |
| Architecture & Engineering | 11 (100.0%) | 0 (0.0%) |
| Life, Physical & Social Science | 0 (0.0%) | 0 (0.0%) |
| Community & Social Service | 0 (0.0%) | 38 (100.0%) |
| Education, Arts & Media | 0 (0.0%) | 38 (100.0%) |
| Legal Services & Support | 0 (0.0%) | 0 (0.0%) |
| Education Instruction & Library | 0 (0.0%) | 0 (0.0%) |
| Arts, Media & Entertainment | 0 (0.0%) | 0 (0.0%) |
| Health Diagnosing & Treating | 0 (0.0%) | 93 (100.0%) |
| Health Technologists | 0 (0.0%) | 85 (100.0%) |
| Total (Category) | 16 (9.5%) | 153 (90.5%) |
| Total (Overall) | 201 (35.6%) | 363 (64.4%) |
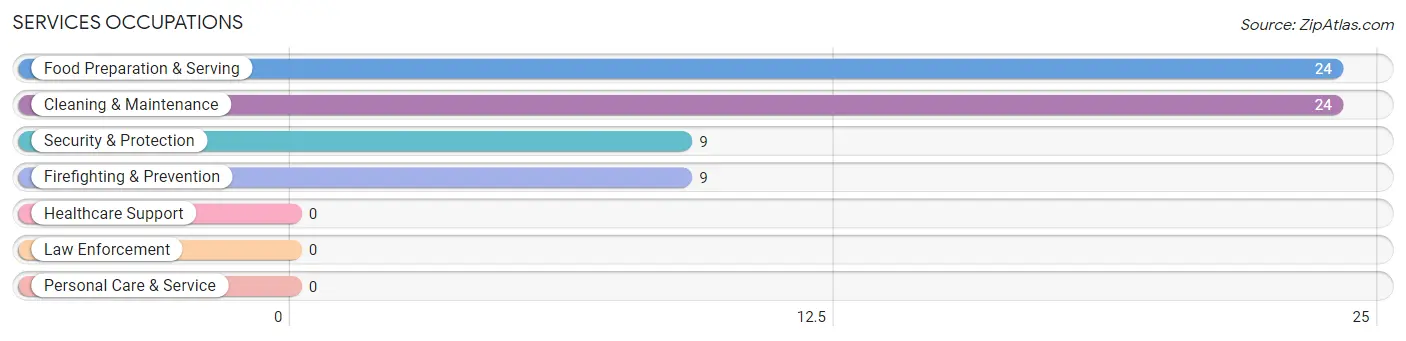
Services Occupations
The most common Services occupations in Jolivue are Food Preparation & Serving (24 | 4.3%), Cleaning & Maintenance (24 | 4.3%), Security & Protection (9 | 1.6%), and Firefighting & Prevention (9 | 1.6%).
Services Occupations by Sex
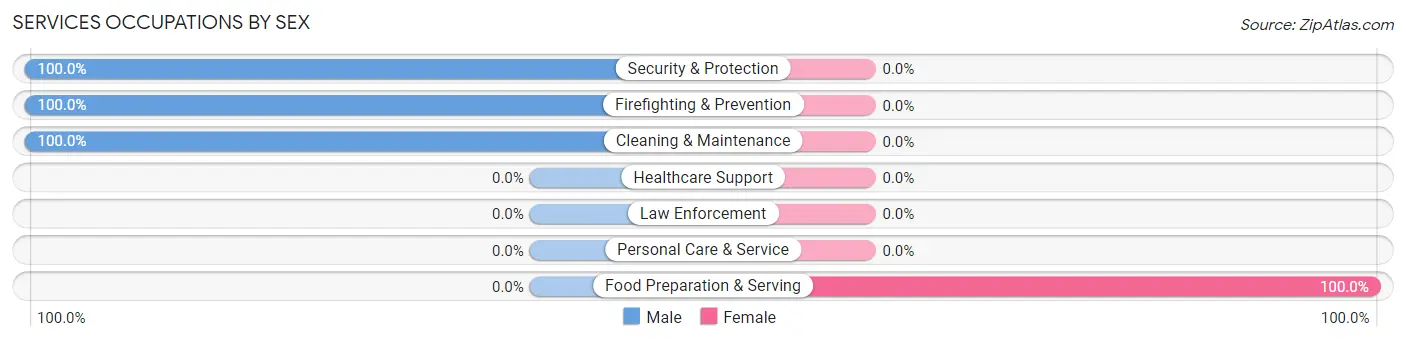
| Occupation | Male | Female |
| Healthcare Support | 0 (0.0%) | 0 (0.0%) |
| Security & Protection | 9 (100.0%) | 0 (0.0%) |
| Firefighting & Prevention | 9 (100.0%) | 0 (0.0%) |
| Law Enforcement | 0 (0.0%) | 0 (0.0%) |
| Food Preparation & Serving | 0 (0.0%) | 24 (100.0%) |
| Cleaning & Maintenance | 24 (100.0%) | 0 (0.0%) |
| Personal Care & Service | 0 (0.0%) | 0 (0.0%) |
| Total (Category) | 33 (57.9%) | 24 (42.1%) |
| Total (Overall) | 201 (35.6%) | 363 (64.4%) |
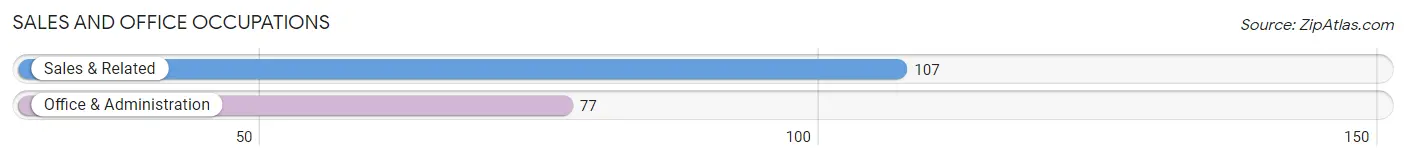
Sales and Office Occupations
The most common Sales and Office occupations in Jolivue are Sales & Related (107 | 19.0%), and Office & Administration (77 | 13.7%).
Sales and Office Occupations by Sex
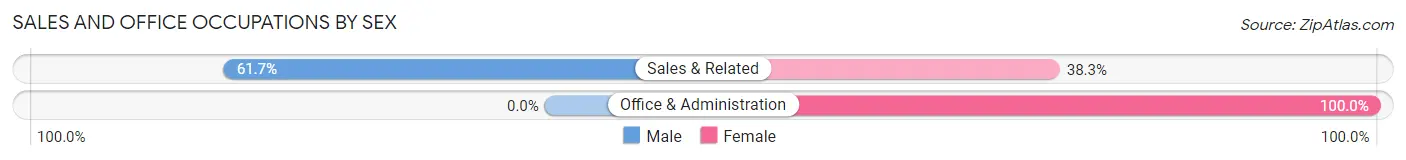
| Occupation | Male | Female |
| Sales & Related | 66 (61.7%) | 41 (38.3%) |
| Office & Administration | 0 (0.0%) | 77 (100.0%) |
| Total (Category) | 66 (35.9%) | 118 (64.1%) |
| Total (Overall) | 201 (35.6%) | 363 (64.4%) |
Natural Resources, Construction and Maintenance Occupations
Natural Resources, Construction and Maintenance Occupations by Sex
| Occupation | Male | Female |
| Farming, Fishing & Forestry | 0 (0.0%) | 0 (0.0%) |
| Construction & Extraction | 0 (0.0%) | 0 (0.0%) |
| Installation, Maintenance & Repair | 0 (0.0%) | 0 (0.0%) |
| Total (Category) | 0 (0.0%) | 0 (0.0%) |
| Total (Overall) | 201 (35.6%) | 363 (64.4%) |
Production, Transportation and Moving Occupations
The most common Production, Transportation and Moving occupations in Jolivue are Production (97 | 17.2%), and Material Moving (57 | 10.1%).
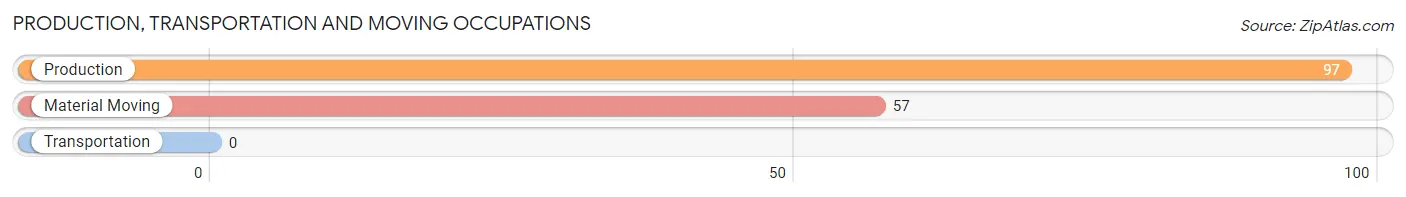
Production, Transportation and Moving Occupations by Sex
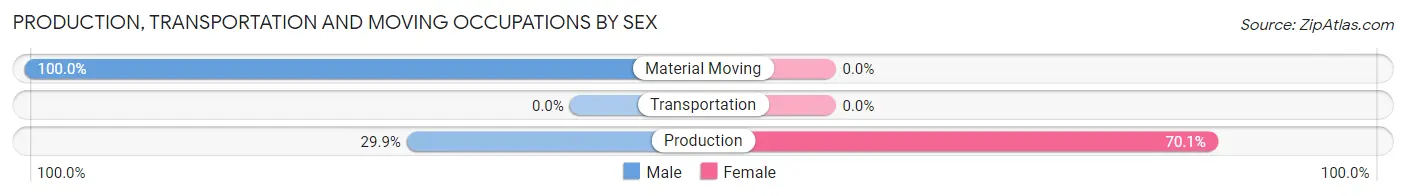
| Occupation | Male | Female |
| Production | 29 (29.9%) | 68 (70.1%) |
| Transportation | 0 (0.0%) | 0 (0.0%) |
| Material Moving | 57 (100.0%) | 0 (0.0%) |
| Total (Category) | 86 (55.8%) | 68 (44.2%) |
| Total (Overall) | 201 (35.6%) | 363 (64.4%) |
Employment Industries by Sex in Jolivue
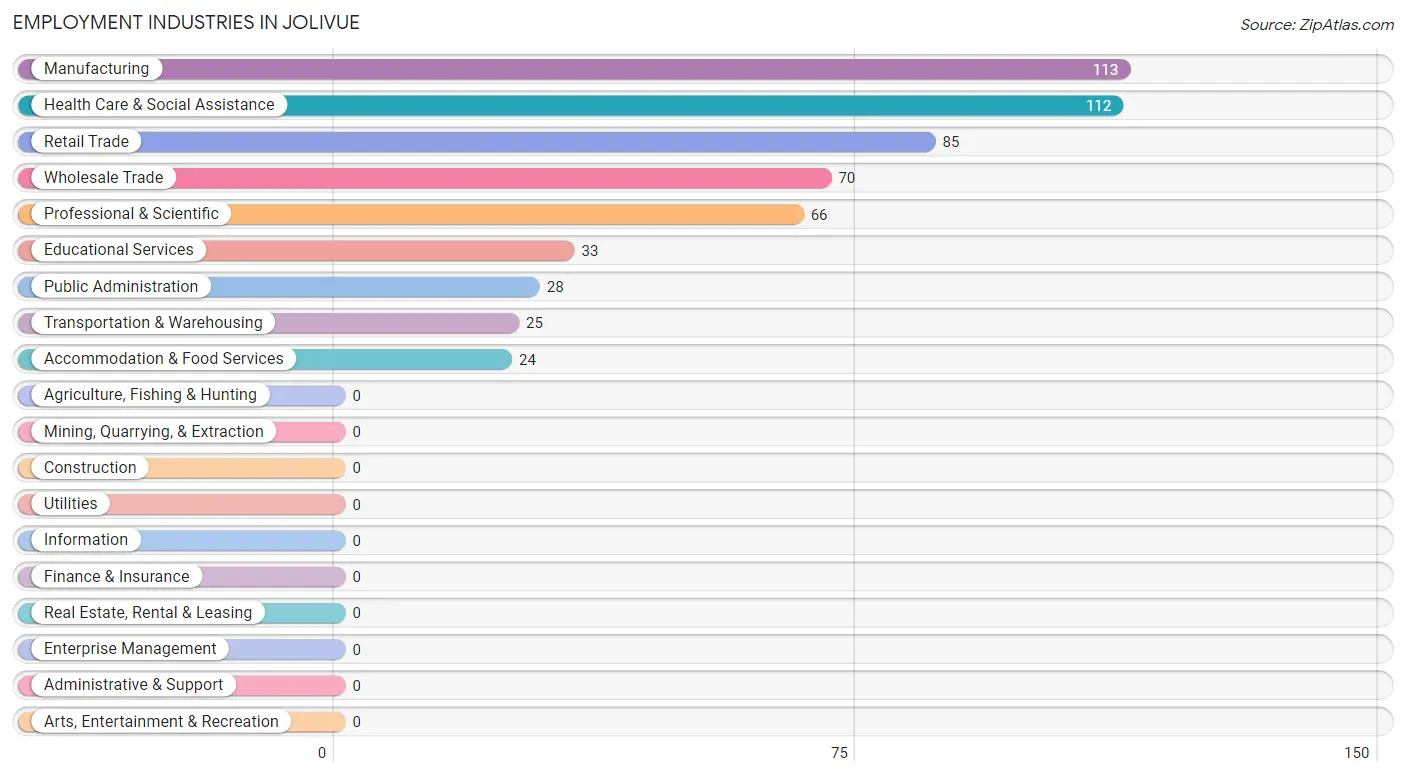
Employment Industries in Jolivue
The major employment industries in Jolivue include Manufacturing (113 | 20.0%), Health Care & Social Assistance (112 | 19.9%), Retail Trade (85 | 15.1%), Wholesale Trade (70 | 12.4%), and Professional & Scientific (66 | 11.7%).
Employment Industries by Sex in Jolivue
The Jolivue industries that see more men than women are Wholesale Trade (100.0%), Transportation & Warehousing (100.0%), and Retail Trade (51.8%), whereas the industries that tend to have a higher number of women are Professional & Scientific (100.0%), Educational Services (100.0%), and Accommodation & Food Services (100.0%).
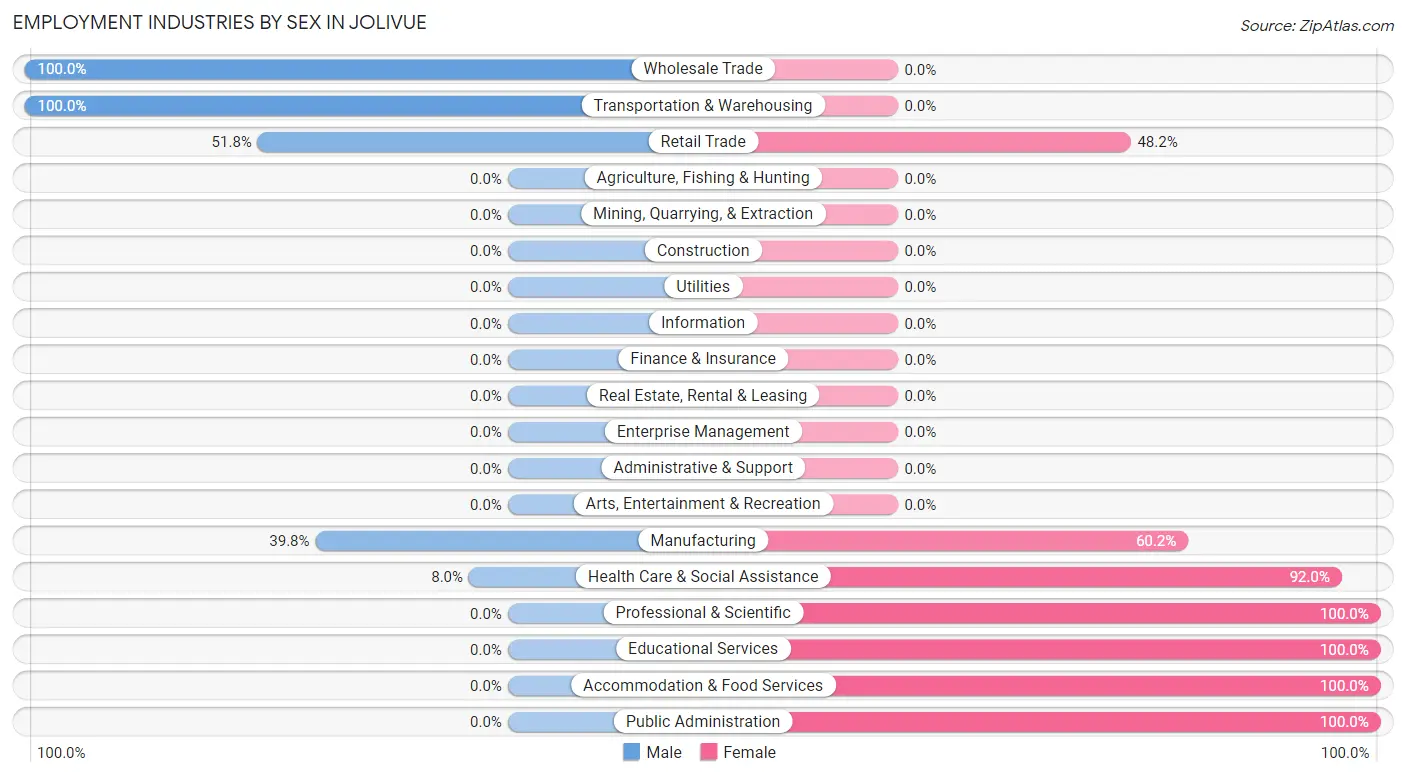
| Industry | Male | Female |
| Agriculture, Fishing & Hunting | 0 (0.0%) | 0 (0.0%) |
| Mining, Quarrying, & Extraction | 0 (0.0%) | 0 (0.0%) |
| Construction | 0 (0.0%) | 0 (0.0%) |
| Manufacturing | 45 (39.8%) | 68 (60.2%) |
| Wholesale Trade | 70 (100.0%) | 0 (0.0%) |
| Retail Trade | 44 (51.8%) | 41 (48.2%) |
| Transportation & Warehousing | 25 (100.0%) | 0 (0.0%) |
| Utilities | 0 (0.0%) | 0 (0.0%) |
| Information | 0 (0.0%) | 0 (0.0%) |
| Finance & Insurance | 0 (0.0%) | 0 (0.0%) |
| Real Estate, Rental & Leasing | 0 (0.0%) | 0 (0.0%) |
| Professional & Scientific | 0 (0.0%) | 66 (100.0%) |
| Enterprise Management | 0 (0.0%) | 0 (0.0%) |
| Administrative & Support | 0 (0.0%) | 0 (0.0%) |
| Educational Services | 0 (0.0%) | 33 (100.0%) |
| Health Care & Social Assistance | 9 (8.0%) | 103 (92.0%) |
| Arts, Entertainment & Recreation | 0 (0.0%) | 0 (0.0%) |
| Accommodation & Food Services | 0 (0.0%) | 24 (100.0%) |
| Public Administration | 0 (0.0%) | 28 (100.0%) |
| Total | 201 (35.6%) | 363 (64.4%) |
Education in Jolivue
School Enrollment in Jolivue
The most common levels of schooling among the 157 students in Jolivue are middle school (53 | 33.8%), elementary school (46 | 29.3%), and college / undergraduate (44 | 28.0%).
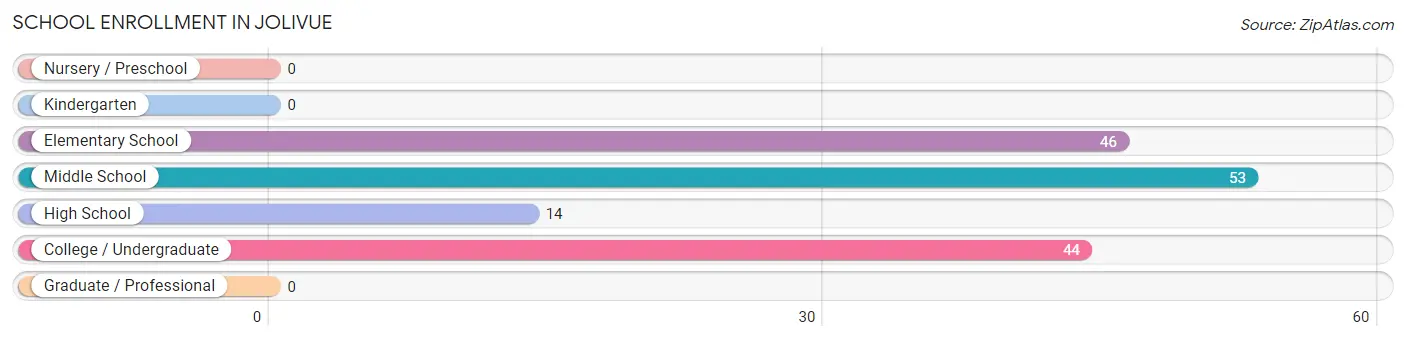
| School Level | # Students | % Students |
| Nursery / Preschool | 0 | 0.0% |
| Kindergarten | 0 | 0.0% |
| Elementary School | 46 | 29.3% |
| Middle School | 53 | 33.8% |
| High School | 14 | 8.9% |
| College / Undergraduate | 44 | 28.0% |
| Graduate / Professional | 0 | 0.0% |
| Total | 157 | 100.0% |
School Enrollment by Age by Funding Source in Jolivue
Out of a total of 157 students who are enrolled in schools in Jolivue, 5 (3.2%) attend a private institution, while the remaining 152 (96.8%) are enrolled in public schools. The age group of 10 to 14 year olds has the highest likelihood of being enrolled in private schools, with 5 (9.4% in the age bracket) enrolled. Conversely, the age group of 5 to 9 year old has the lowest likelihood of being enrolled in a private school, with 46 (100.0% in the age bracket) attending a public institution.
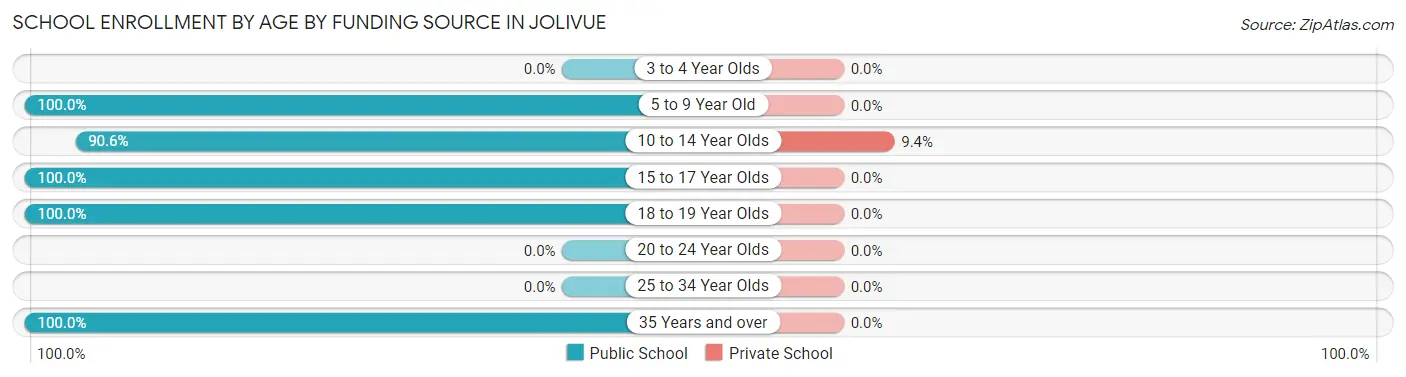
| Age Bracket | Public School | Private School |
| 3 to 4 Year Olds | 0 (0.0%) | 0 (0.0%) |
| 5 to 9 Year Old | 46 (100.0%) | 0 (0.0%) |
| 10 to 14 Year Olds | 48 (90.6%) | 5 (9.4%) |
| 15 to 17 Year Olds | 14 (100.0%) | 0 (0.0%) |
| 18 to 19 Year Olds | 20 (100.0%) | 0 (0.0%) |
| 20 to 24 Year Olds | 0 (0.0%) | 0 (0.0%) |
| 25 to 34 Year Olds | 0 (0.0%) | 0 (0.0%) |
| 35 Years and over | 24 (100.0%) | 0 (0.0%) |
| Total | 152 (96.8%) | 5 (3.2%) |
Educational Attainment by Field of Study in Jolivue
Science & technology (49 | 60.5%), engineering (11 | 13.6%), liberal arts & history (8 | 9.9%), education (7 | 8.6%), and computers & mathematics (6 | 7.4%) are the most common fields of study among 81 individuals in Jolivue who have obtained a bachelor's degree or higher.
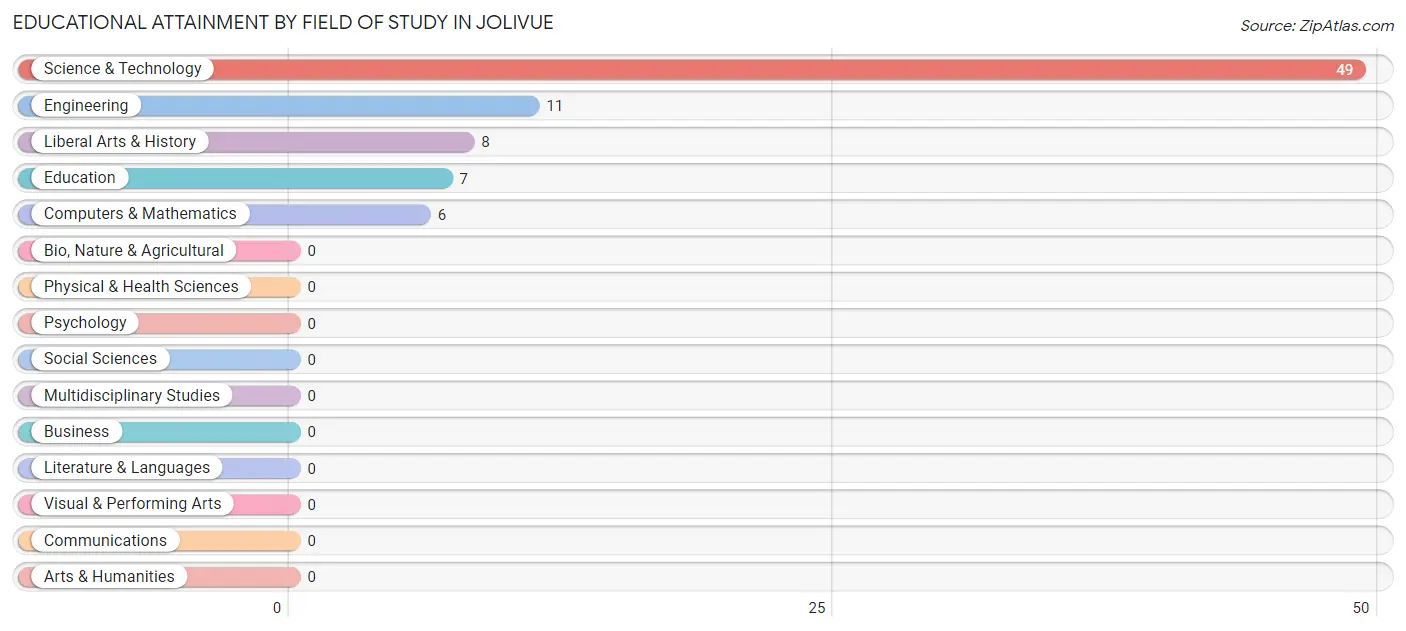
| Field of Study | # Graduates | % Graduates |
| Computers & Mathematics | 6 | 7.4% |
| Bio, Nature & Agricultural | 0 | 0.0% |
| Physical & Health Sciences | 0 | 0.0% |
| Psychology | 0 | 0.0% |
| Social Sciences | 0 | 0.0% |
| Engineering | 11 | 13.6% |
| Multidisciplinary Studies | 0 | 0.0% |
| Science & Technology | 49 | 60.5% |
| Business | 0 | 0.0% |
| Education | 7 | 8.6% |
| Literature & Languages | 0 | 0.0% |
| Liberal Arts & History | 8 | 9.9% |
| Visual & Performing Arts | 0 | 0.0% |
| Communications | 0 | 0.0% |
| Arts & Humanities | 0 | 0.0% |
| Total | 81 | 100.0% |
Transportation & Commute in Jolivue
Vehicle Availability by Sex in Jolivue
The most prevalent vehicle ownership categories in Jolivue are males with 2 vehicles (78, accounting for 38.8%) and females with 2 vehicles (59, making up 22.2%).
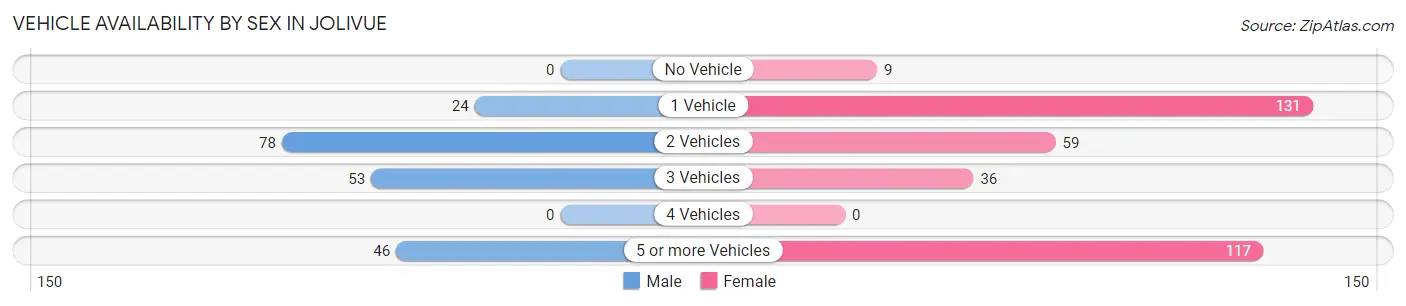
| Vehicles Available | Male | Female |
| No Vehicle | 0 (0.0%) | 9 (2.6%) |
| 1 Vehicle | 24 (11.9%) | 131 (37.2%) |
| 2 Vehicles | 78 (38.8%) | 59 (16.8%) |
| 3 Vehicles | 53 (26.4%) | 36 (10.2%) |
| 4 Vehicles | 0 (0.0%) | 0 (0.0%) |
| 5 or more Vehicles | 46 (22.9%) | 117 (33.2%) |
| Total | 201 (100.0%) | 352 (100.0%) |
Commute Time in Jolivue
The most frequently occuring commute durations in Jolivue are 20 to 24 minutes (126 commuters, 22.8%), 5 to 9 minutes (117 commuters, 21.2%), and 30 to 34 minutes (76 commuters, 13.7%).
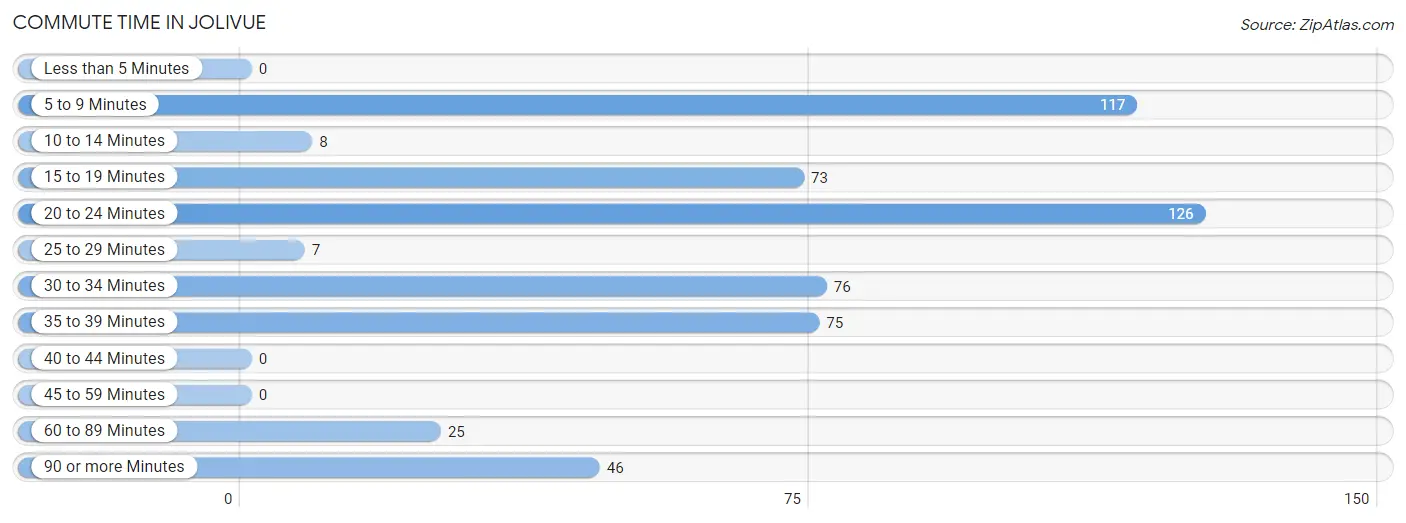
| Commute Time | # Commuters | % Commuters |
| Less than 5 Minutes | 0 | 0.0% |
| 5 to 9 Minutes | 117 | 21.2% |
| 10 to 14 Minutes | 8 | 1.5% |
| 15 to 19 Minutes | 73 | 13.2% |
| 20 to 24 Minutes | 126 | 22.8% |
| 25 to 29 Minutes | 7 | 1.3% |
| 30 to 34 Minutes | 76 | 13.7% |
| 35 to 39 Minutes | 75 | 13.6% |
| 40 to 44 Minutes | 0 | 0.0% |
| 45 to 59 Minutes | 0 | 0.0% |
| 60 to 89 Minutes | 25 | 4.5% |
| 90 or more Minutes | 46 | 8.3% |
Commute Time by Sex in Jolivue
The most common commute times in Jolivue are 15 to 19 minutes (54 commuters, 26.9%) for males and 20 to 24 minutes (115 commuters, 32.7%) for females.
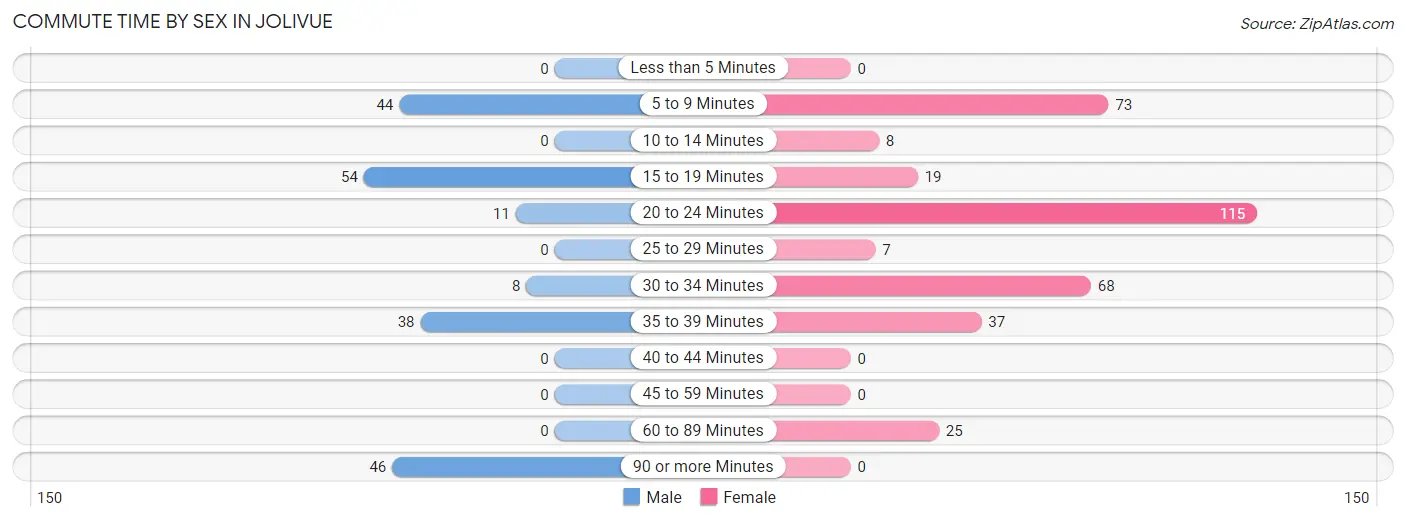
| Commute Time | Male | Female |
| Less than 5 Minutes | 0 (0.0%) | 0 (0.0%) |
| 5 to 9 Minutes | 44 (21.9%) | 73 (20.7%) |
| 10 to 14 Minutes | 0 (0.0%) | 8 (2.3%) |
| 15 to 19 Minutes | 54 (26.9%) | 19 (5.4%) |
| 20 to 24 Minutes | 11 (5.5%) | 115 (32.7%) |
| 25 to 29 Minutes | 0 (0.0%) | 7 (2.0%) |
| 30 to 34 Minutes | 8 (4.0%) | 68 (19.3%) |
| 35 to 39 Minutes | 38 (18.9%) | 37 (10.5%) |
| 40 to 44 Minutes | 0 (0.0%) | 0 (0.0%) |
| 45 to 59 Minutes | 0 (0.0%) | 0 (0.0%) |
| 60 to 89 Minutes | 0 (0.0%) | 25 (7.1%) |
| 90 or more Minutes | 46 (22.9%) | 0 (0.0%) |
Time of Departure to Work by Sex in Jolivue
The most frequent times of departure to work in Jolivue are 4:00 PM to 11:59 PM (48, 23.9%) for males and 7:00 AM to 7:29 AM (93, 26.4%) for females.
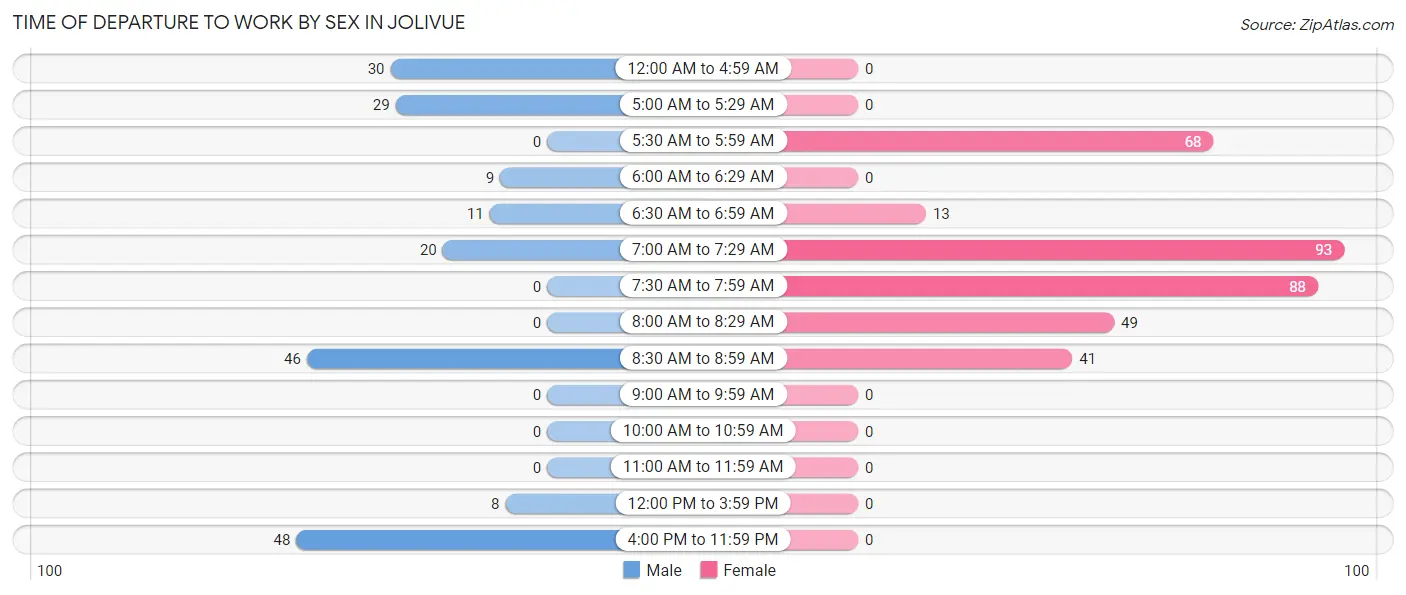
| Time of Departure | Male | Female |
| 12:00 AM to 4:59 AM | 30 (14.9%) | 0 (0.0%) |
| 5:00 AM to 5:29 AM | 29 (14.4%) | 0 (0.0%) |
| 5:30 AM to 5:59 AM | 0 (0.0%) | 68 (19.3%) |
| 6:00 AM to 6:29 AM | 9 (4.5%) | 0 (0.0%) |
| 6:30 AM to 6:59 AM | 11 (5.5%) | 13 (3.7%) |
| 7:00 AM to 7:29 AM | 20 (10.0%) | 93 (26.4%) |
| 7:30 AM to 7:59 AM | 0 (0.0%) | 88 (25.0%) |
| 8:00 AM to 8:29 AM | 0 (0.0%) | 49 (13.9%) |
| 8:30 AM to 8:59 AM | 46 (22.9%) | 41 (11.7%) |
| 9:00 AM to 9:59 AM | 0 (0.0%) | 0 (0.0%) |
| 10:00 AM to 10:59 AM | 0 (0.0%) | 0 (0.0%) |
| 11:00 AM to 11:59 AM | 0 (0.0%) | 0 (0.0%) |
| 12:00 PM to 3:59 PM | 8 (4.0%) | 0 (0.0%) |
| 4:00 PM to 11:59 PM | 48 (23.9%) | 0 (0.0%) |
| Total | 201 (100.0%) | 352 (100.0%) |
Housing Occupancy in Jolivue
Occupancy by Ownership in Jolivue
Of the total 506 dwellings in Jolivue, owner-occupied units account for 219 (43.3%), while renter-occupied units make up 287 (56.7%).
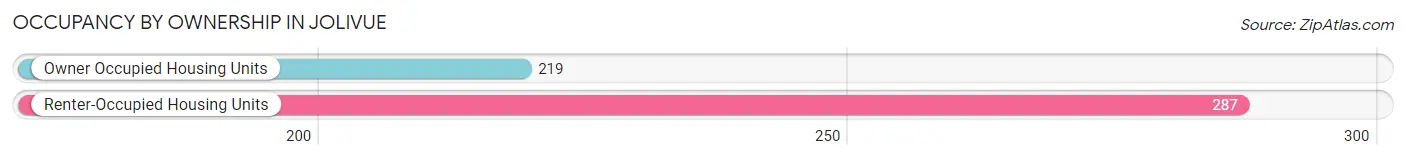
| Occupancy | # Housing Units | % Housing Units |
| Owner Occupied Housing Units | 219 | 43.3% |
| Renter-Occupied Housing Units | 287 | 56.7% |
| Total Occupied Housing Units | 506 | 100.0% |
Occupancy by Household Size in Jolivue
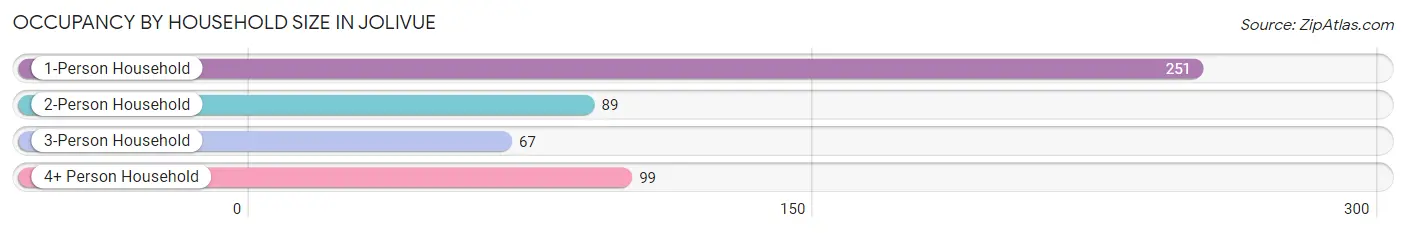
| Household Size | # Housing Units | % Housing Units |
| 1-Person Household | 251 | 49.6% |
| 2-Person Household | 89 | 17.6% |
| 3-Person Household | 67 | 13.2% |
| 4+ Person Household | 99 | 19.6% |
| Total Housing Units | 506 | 100.0% |
Occupancy by Ownership by Household Size in Jolivue
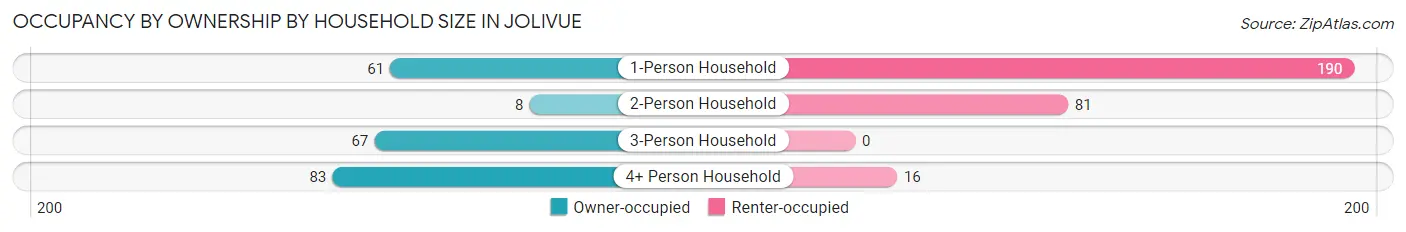
| Household Size | Owner-occupied | Renter-occupied |
| 1-Person Household | 61 (24.3%) | 190 (75.7%) |
| 2-Person Household | 8 (9.0%) | 81 (91.0%) |
| 3-Person Household | 67 (100.0%) | 0 (0.0%) |
| 4+ Person Household | 83 (83.8%) | 16 (16.2%) |
| Total Housing Units | 219 (43.3%) | 287 (56.7%) |
Occupancy by Educational Attainment in Jolivue

| Household Size | Owner-occupied | Renter-occupied |
| Less than High School | 0 (0.0%) | 12 (100.0%) |
| High School Diploma | 110 (41.8%) | 153 (58.2%) |
| College/Associate Degree | 64 (39.8%) | 97 (60.3%) |
| Bachelor's Degree or higher | 45 (64.3%) | 25 (35.7%) |
Occupancy by Age of Householder in Jolivue
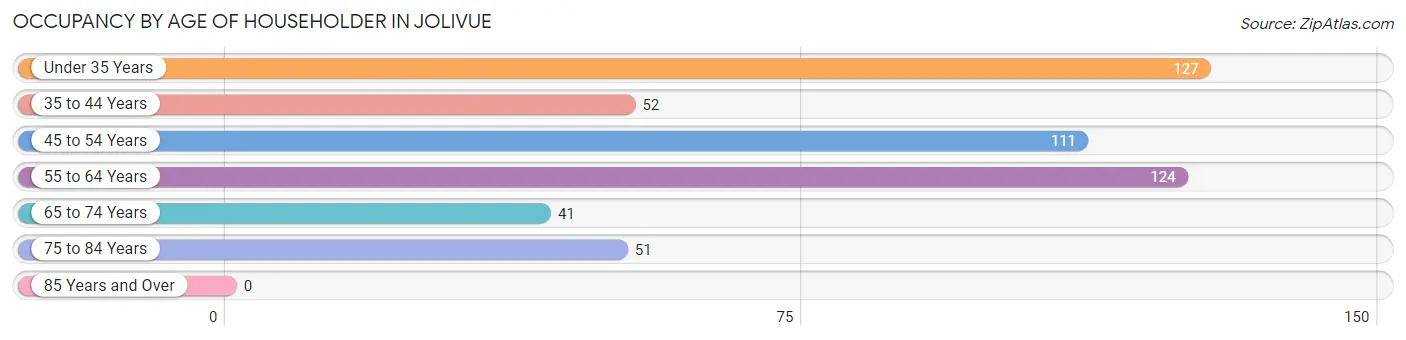
| Age Bracket | # Households | % Households |
| Under 35 Years | 127 | 25.1% |
| 35 to 44 Years | 52 | 10.3% |
| 45 to 54 Years | 111 | 21.9% |
| 55 to 64 Years | 124 | 24.5% |
| 65 to 74 Years | 41 | 8.1% |
| 75 to 84 Years | 51 | 10.1% |
| 85 Years and Over | 0 | 0.0% |
| Total | 506 | 100.0% |
Housing Finances in Jolivue
Median Income by Occupancy in Jolivue
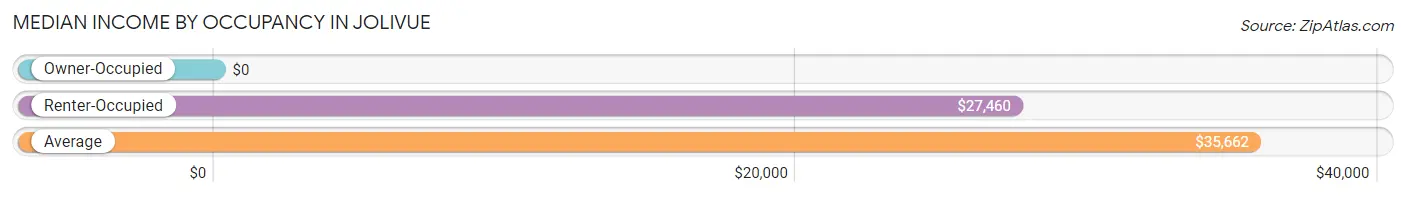
| Occupancy Type | # Households | Median Income |
| Owner-Occupied | 219 (43.3%) | $0 |
| Renter-Occupied | 287 (56.7%) | $27,460 |
| Average | 506 (100.0%) | $35,662 |
Occupancy by Householder Income Bracket in Jolivue
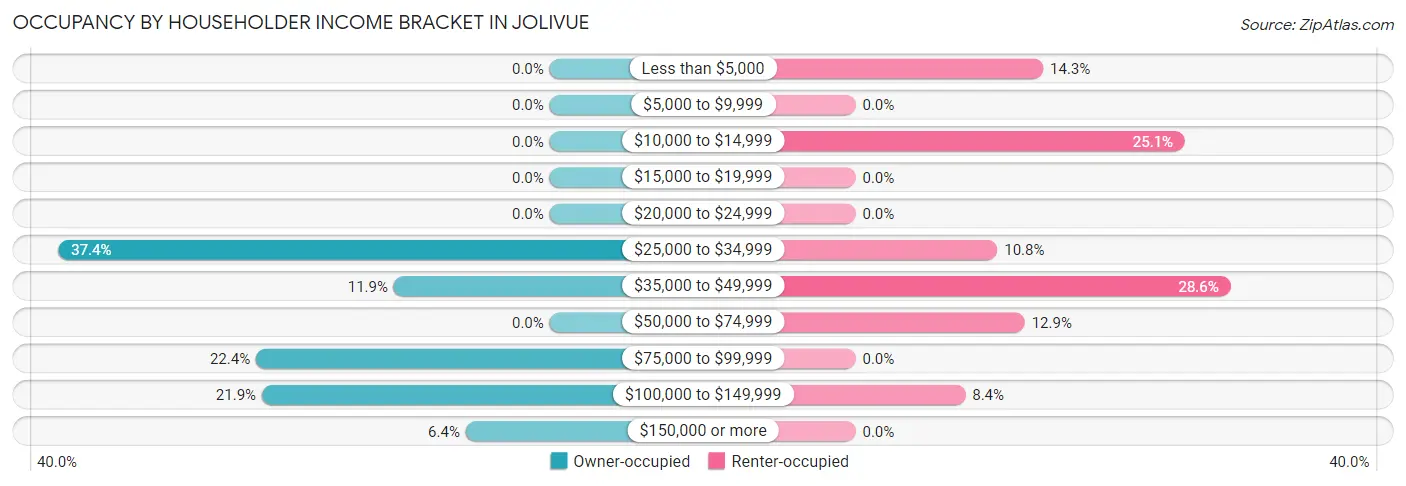
| Income Bracket | Owner-occupied | Renter-occupied |
| Less than $5,000 | 0 (0.0%) | 41 (14.3%) |
| $5,000 to $9,999 | 0 (0.0%) | 0 (0.0%) |
| $10,000 to $14,999 | 0 (0.0%) | 72 (25.1%) |
| $15,000 to $19,999 | 0 (0.0%) | 0 (0.0%) |
| $20,000 to $24,999 | 0 (0.0%) | 0 (0.0%) |
| $25,000 to $34,999 | 82 (37.4%) | 31 (10.8%) |
| $35,000 to $49,999 | 26 (11.9%) | 82 (28.6%) |
| $50,000 to $74,999 | 0 (0.0%) | 37 (12.9%) |
| $75,000 to $99,999 | 49 (22.4%) | 0 (0.0%) |
| $100,000 to $149,999 | 48 (21.9%) | 24 (8.4%) |
| $150,000 or more | 14 (6.4%) | 0 (0.0%) |
| Total | 219 (100.0%) | 287 (100.0%) |
Monthly Housing Cost Tiers in Jolivue
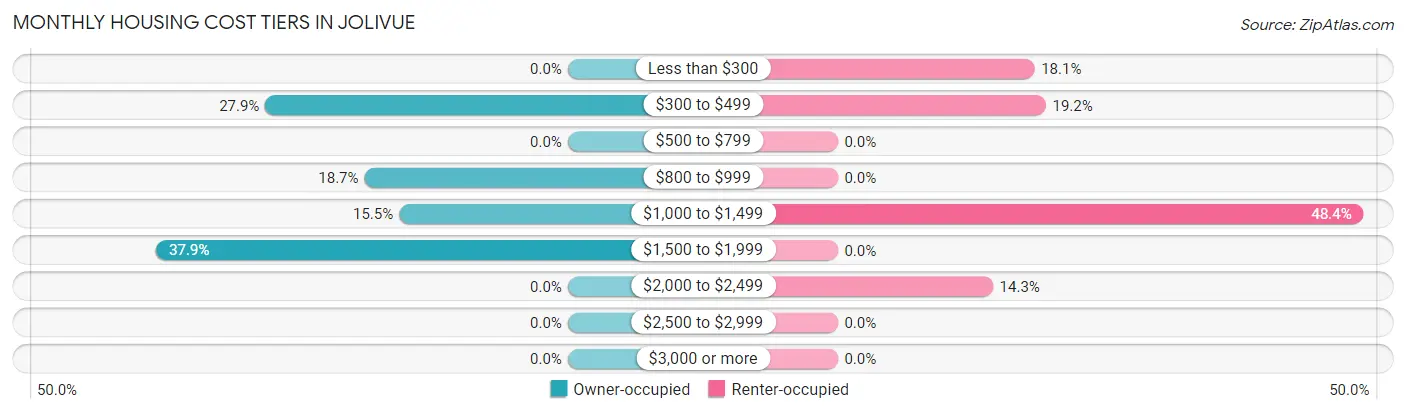
| Monthly Cost | Owner-occupied | Renter-occupied |
| Less than $300 | 0 (0.0%) | 52 (18.1%) |
| $300 to $499 | 61 (27.9%) | 55 (19.2%) |
| $500 to $799 | 0 (0.0%) | 0 (0.0%) |
| $800 to $999 | 41 (18.7%) | 0 (0.0%) |
| $1,000 to $1,499 | 34 (15.5%) | 139 (48.4%) |
| $1,500 to $1,999 | 83 (37.9%) | 0 (0.0%) |
| $2,000 to $2,499 | 0 (0.0%) | 41 (14.3%) |
| $2,500 to $2,999 | 0 (0.0%) | 0 (0.0%) |
| $3,000 or more | 0 (0.0%) | 0 (0.0%) |
| Total | 219 (100.0%) | 287 (100.0%) |
Physical Housing Characteristics in Jolivue
Housing Structures in Jolivue
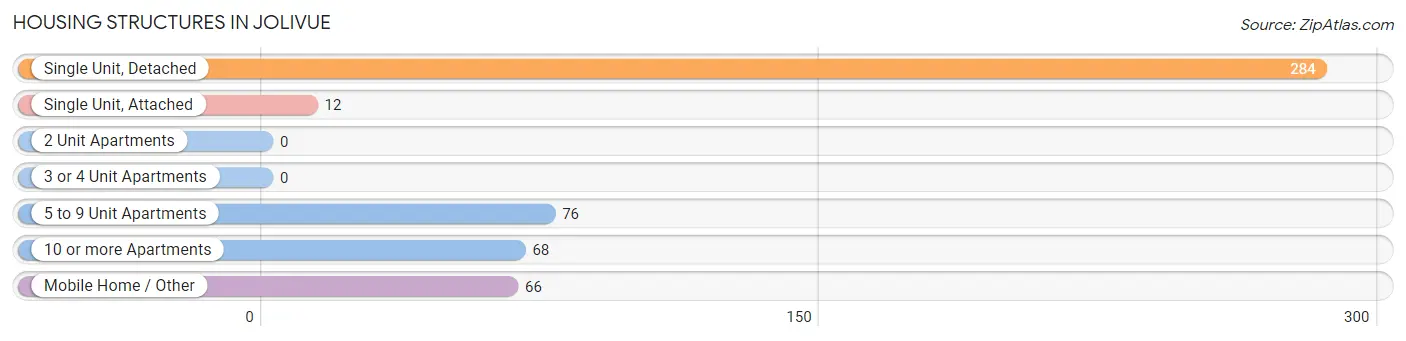
| Structure Type | # Housing Units | % Housing Units |
| Single Unit, Detached | 284 | 56.1% |
| Single Unit, Attached | 12 | 2.4% |
| 2 Unit Apartments | 0 | 0.0% |
| 3 or 4 Unit Apartments | 0 | 0.0% |
| 5 to 9 Unit Apartments | 76 | 15.0% |
| 10 or more Apartments | 68 | 13.4% |
| Mobile Home / Other | 66 | 13.0% |
| Total | 506 | 100.0% |
Housing Structures by Occupancy in Jolivue
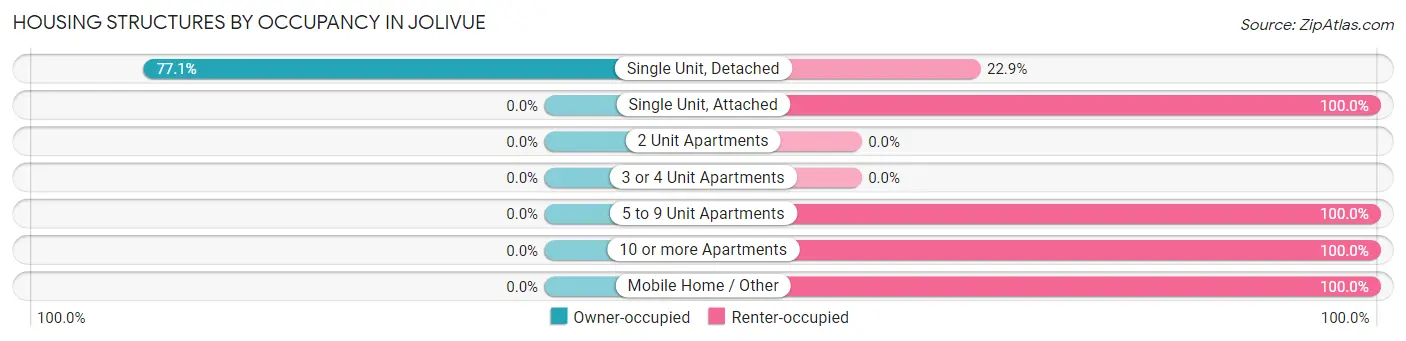
| Structure Type | Owner-occupied | Renter-occupied |
| Single Unit, Detached | 219 (77.1%) | 65 (22.9%) |
| Single Unit, Attached | 0 (0.0%) | 12 (100.0%) |
| 2 Unit Apartments | 0 (0.0%) | 0 (0.0%) |
| 3 or 4 Unit Apartments | 0 (0.0%) | 0 (0.0%) |
| 5 to 9 Unit Apartments | 0 (0.0%) | 76 (100.0%) |
| 10 or more Apartments | 0 (0.0%) | 68 (100.0%) |
| Mobile Home / Other | 0 (0.0%) | 66 (100.0%) |
| Total | 219 (43.3%) | 287 (56.7%) |
Housing Structures by Number of Rooms in Jolivue
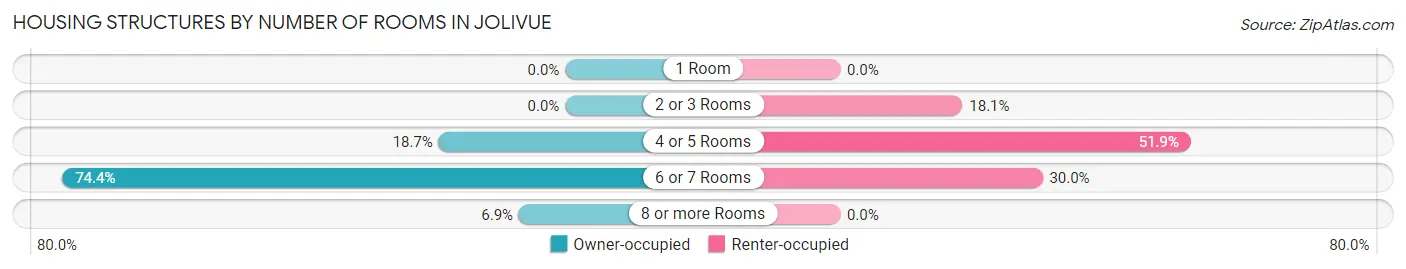
| Number of Rooms | Owner-occupied | Renter-occupied |
| 1 Room | 0 (0.0%) | 0 (0.0%) |
| 2 or 3 Rooms | 0 (0.0%) | 52 (18.1%) |
| 4 or 5 Rooms | 41 (18.7%) | 149 (51.9%) |
| 6 or 7 Rooms | 163 (74.4%) | 86 (30.0%) |
| 8 or more Rooms | 15 (6.9%) | 0 (0.0%) |
| Total | 219 (100.0%) | 287 (100.0%) |
Housing Structure by Heating Type in Jolivue
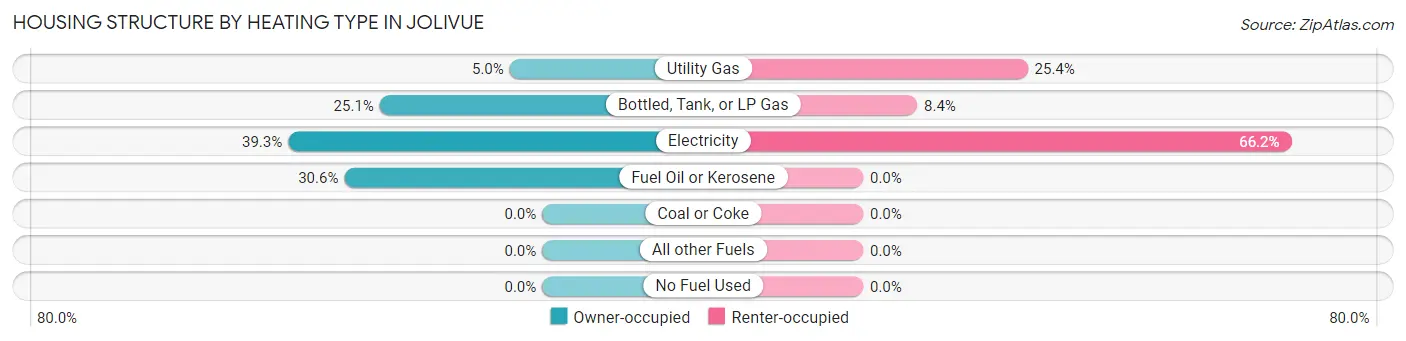
| Heating Type | Owner-occupied | Renter-occupied |
| Utility Gas | 11 (5.0%) | 73 (25.4%) |
| Bottled, Tank, or LP Gas | 55 (25.1%) | 24 (8.4%) |
| Electricity | 86 (39.3%) | 190 (66.2%) |
| Fuel Oil or Kerosene | 67 (30.6%) | 0 (0.0%) |
| Coal or Coke | 0 (0.0%) | 0 (0.0%) |
| All other Fuels | 0 (0.0%) | 0 (0.0%) |
| No Fuel Used | 0 (0.0%) | 0 (0.0%) |
| Total | 219 (100.0%) | 287 (100.0%) |
Household Vehicle Usage in Jolivue
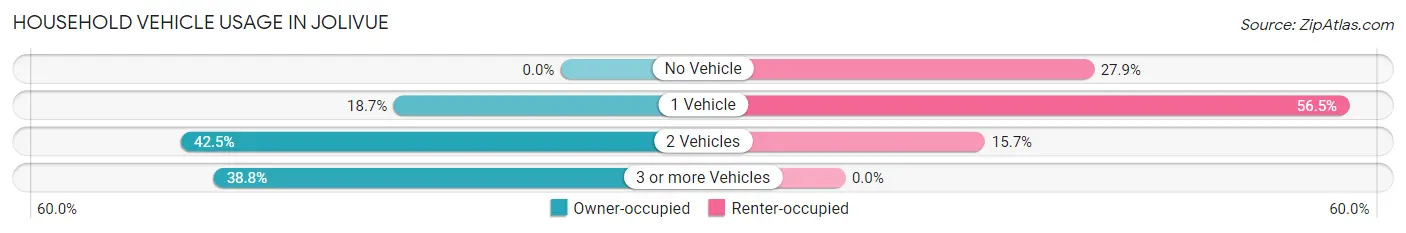
| Vehicles per Household | Owner-occupied | Renter-occupied |
| No Vehicle | 0 (0.0%) | 80 (27.9%) |
| 1 Vehicle | 41 (18.7%) | 162 (56.5%) |
| 2 Vehicles | 93 (42.5%) | 45 (15.7%) |
| 3 or more Vehicles | 85 (38.8%) | 0 (0.0%) |
| Total | 219 (100.0%) | 287 (100.0%) |
Real Estate & Mortgages in Jolivue
Real Estate and Mortgage Overview in Jolivue
| Characteristic | Without Mortgage | With Mortgage |
| Housing Units | 61 | 158 |
| Median Property Value | - | - |
| Median Household Income | - | - |
| Monthly Housing Costs | - | - |
| Real Estate Taxes | - | - |
Property Value by Mortgage Status in Jolivue
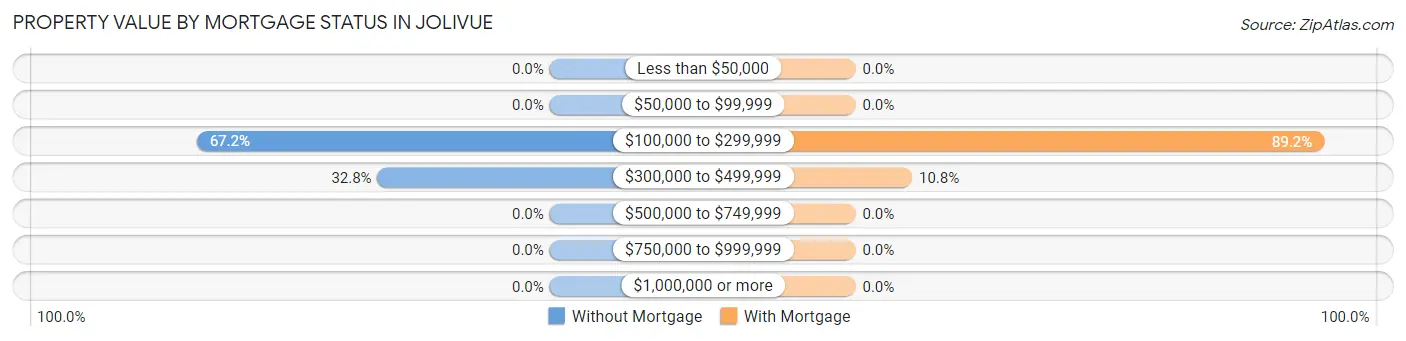
| Property Value | Without Mortgage | With Mortgage |
| Less than $50,000 | 0 (0.0%) | 0 (0.0%) |
| $50,000 to $99,999 | 0 (0.0%) | 0 (0.0%) |
| $100,000 to $299,999 | 41 (67.2%) | 141 (89.2%) |
| $300,000 to $499,999 | 20 (32.8%) | 17 (10.8%) |
| $500,000 to $749,999 | 0 (0.0%) | 0 (0.0%) |
| $750,000 to $999,999 | 0 (0.0%) | 0 (0.0%) |
| $1,000,000 or more | 0 (0.0%) | 0 (0.0%) |
| Total | 61 (100.0%) | 158 (100.0%) |
Household Income by Mortgage Status in Jolivue
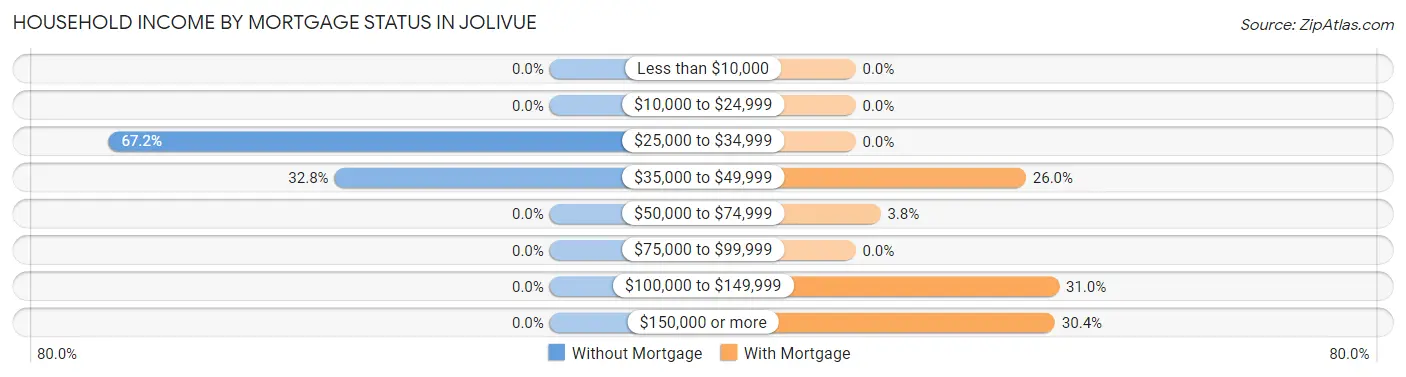
| Household Income | Without Mortgage | With Mortgage |
| Less than $10,000 | 0 (0.0%) | 0 (0.0%) |
| $10,000 to $24,999 | 0 (0.0%) | 0 (0.0%) |
| $25,000 to $34,999 | 41 (67.2%) | 0 (0.0%) |
| $35,000 to $49,999 | 20 (32.8%) | 41 (26.0%) |
| $50,000 to $74,999 | 0 (0.0%) | 6 (3.8%) |
| $75,000 to $99,999 | 0 (0.0%) | 0 (0.0%) |
| $100,000 to $149,999 | 0 (0.0%) | 49 (31.0%) |
| $150,000 or more | 0 (0.0%) | 48 (30.4%) |
| Total | 61 (100.0%) | 158 (100.0%) |
Property Value to Household Income Ratio in Jolivue
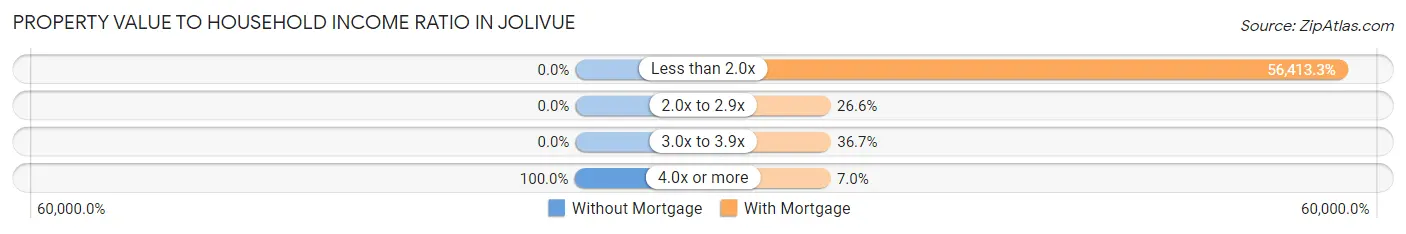
| Value-to-Income Ratio | Without Mortgage | With Mortgage |
| Less than 2.0x | 0 (0.0%) | 89,133 (56,413.3%) |
| 2.0x to 2.9x | 0 (0.0%) | 42 (26.6%) |
| 3.0x to 3.9x | 0 (0.0%) | 58 (36.7%) |
| 4.0x or more | 61 (100.0%) | 11 (7.0%) |
| Total | 61 (100.0%) | 158 (100.0%) |
Real Estate Taxes by Mortgage Status in Jolivue
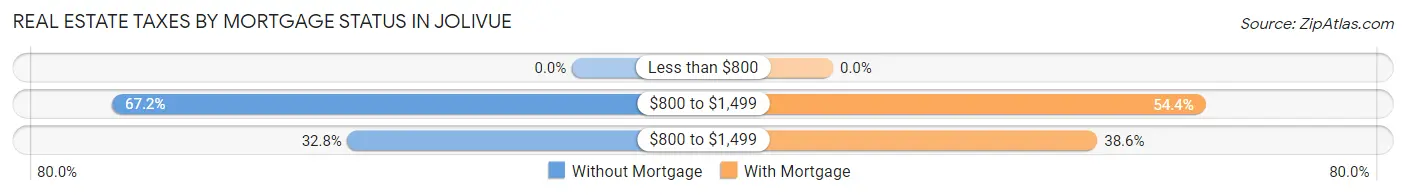
| Property Taxes | Without Mortgage | With Mortgage |
| Less than $800 | 0 (0.0%) | 0 (0.0%) |
| $800 to $1,499 | 41 (67.2%) | 86 (54.4%) |
| $800 to $1,499 | 20 (32.8%) | 61 (38.6%) |
| Total | 61 (100.0%) | 158 (100.0%) |
Health & Disability in Jolivue
Health Insurance Coverage by Age in Jolivue
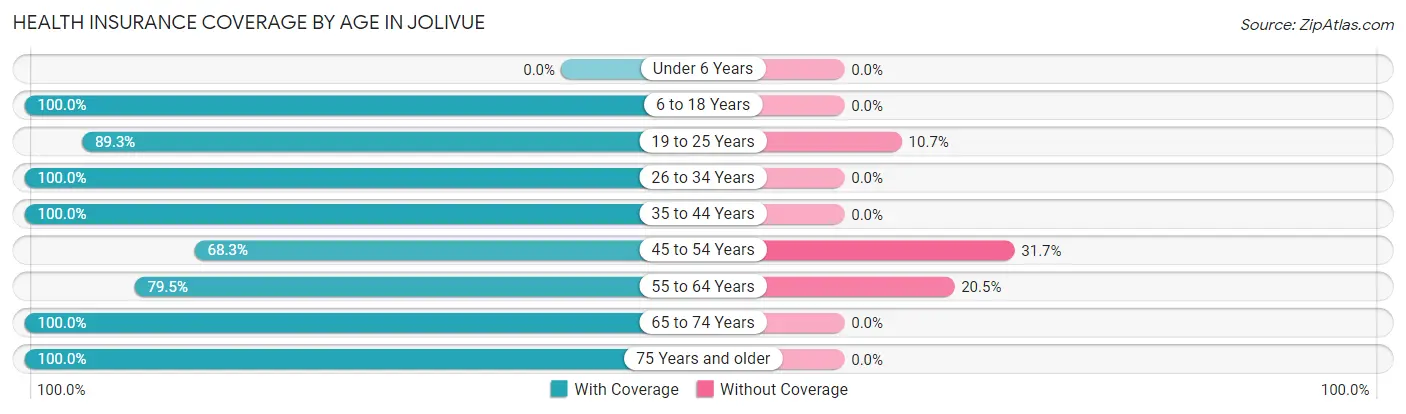
| Age Bracket | With Coverage | Without Coverage |
| Under 6 Years | 0 (0.0%) | 0 (0.0%) |
| 6 to 18 Years | 164 (100.0%) | 0 (0.0%) |
| 19 to 25 Years | 167 (89.3%) | 20 (10.7%) |
| 26 to 34 Years | 120 (100.0%) | 0 (0.0%) |
| 35 to 44 Years | 81 (100.0%) | 0 (0.0%) |
| 45 to 54 Years | 140 (68.3%) | 65 (31.7%) |
| 55 to 64 Years | 159 (79.5%) | 41 (20.5%) |
| 65 to 74 Years | 67 (100.0%) | 0 (0.0%) |
| 75 Years and older | 59 (100.0%) | 0 (0.0%) |
| Total | 957 (88.4%) | 126 (11.6%) |
Health Insurance Coverage by Citizenship Status in Jolivue
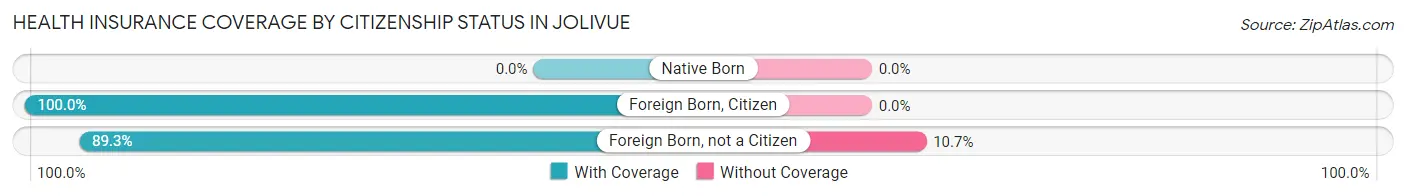
| Citizenship Status | With Coverage | Without Coverage |
| Native Born | 0 (0.0%) | 0 (0.0%) |
| Foreign Born, Citizen | 164 (100.0%) | 0 (0.0%) |
| Foreign Born, not a Citizen | 167 (89.3%) | 20 (10.7%) |
Health Insurance Coverage by Household Income in Jolivue
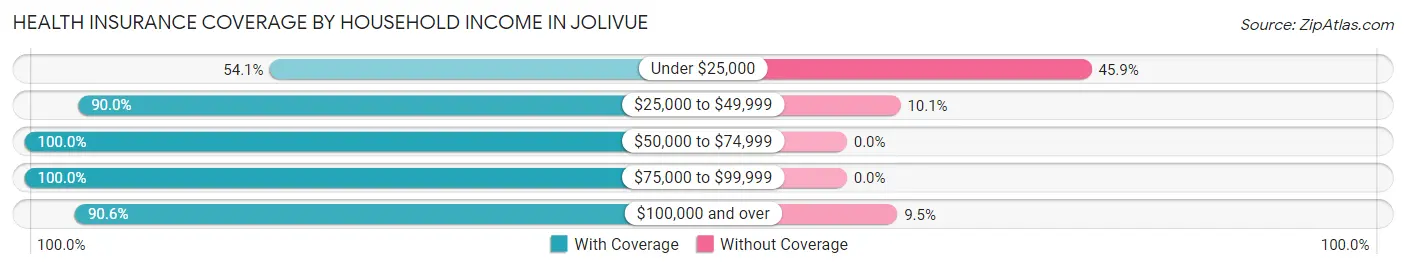
| Household Income | With Coverage | Without Coverage |
| Under $25,000 | 72 (54.1%) | 61 (45.9%) |
| $25,000 to $49,999 | 367 (89.9%) | 41 (10.1%) |
| $50,000 to $74,999 | 71 (100.0%) | 0 (0.0%) |
| $75,000 to $99,999 | 209 (100.0%) | 0 (0.0%) |
| $100,000 and over | 230 (90.5%) | 24 (9.5%) |
Public vs Private Health Insurance Coverage by Age in Jolivue
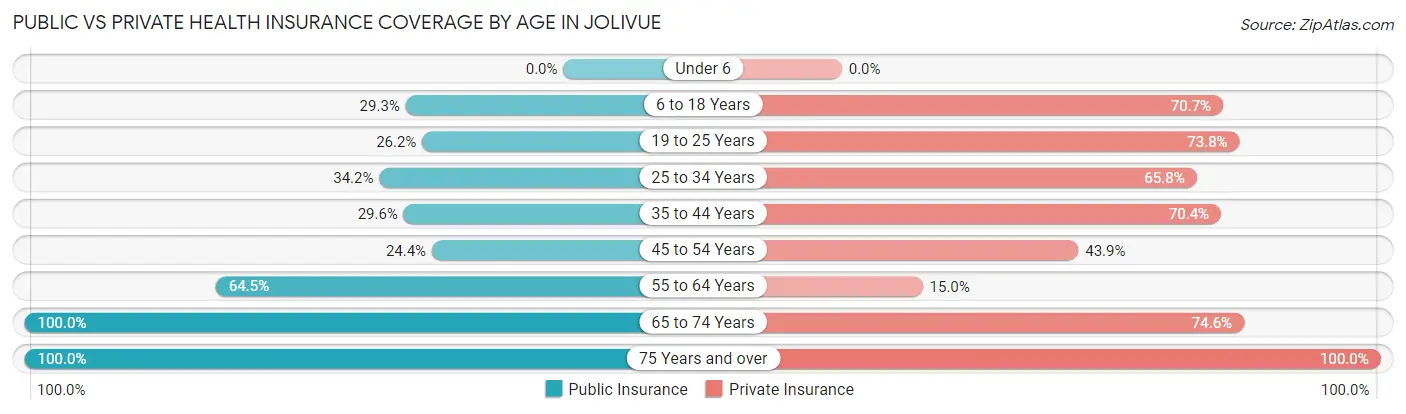
| Age Bracket | Public Insurance | Private Insurance |
| Under 6 | 0 (0.0%) | 0 (0.0%) |
| 6 to 18 Years | 48 (29.3%) | 116 (70.7%) |
| 19 to 25 Years | 49 (26.2%) | 138 (73.8%) |
| 25 to 34 Years | 41 (34.2%) | 79 (65.8%) |
| 35 to 44 Years | 24 (29.6%) | 57 (70.4%) |
| 45 to 54 Years | 50 (24.4%) | 90 (43.9%) |
| 55 to 64 Years | 129 (64.5%) | 30 (15.0%) |
| 65 to 74 Years | 67 (100.0%) | 50 (74.6%) |
| 75 Years and over | 59 (100.0%) | 59 (100.0%) |
| Total | 467 (43.1%) | 619 (57.2%) |
Disability Status by Sex by Age in Jolivue
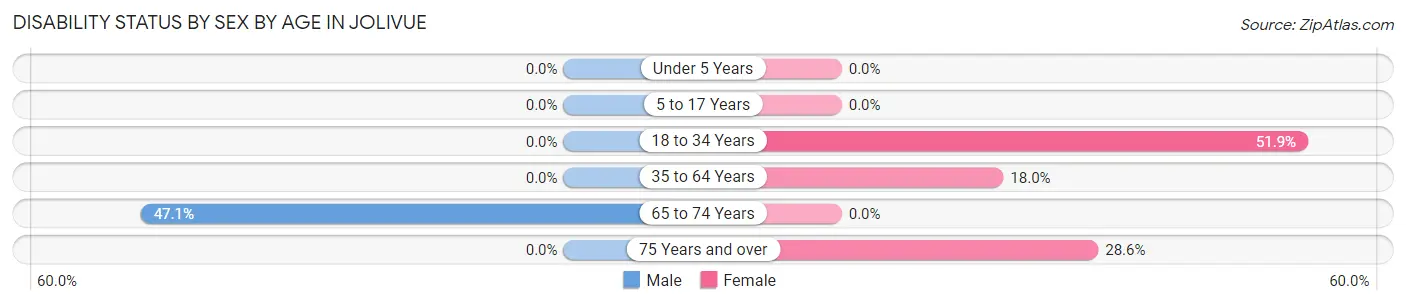
| Age Bracket | Male | Female |
| Under 5 Years | 0 (0.0%) | 0 (0.0%) |
| 5 to 17 Years | 0 (0.0%) | 0 (0.0%) |
| 18 to 34 Years | 0 (0.0%) | 136 (51.9%) |
| 35 to 64 Years | 0 (0.0%) | 54 (18.0%) |
| 65 to 74 Years | 8 (47.1%) | 0 (0.0%) |
| 75 Years and over | 0 (0.0%) | 8 (28.6%) |
Disability Class by Sex by Age in Jolivue
Disability Class: Hearing Difficulty
| Age Bracket | Male | Female |
| Under 5 Years | 0 (0.0%) | 0 (0.0%) |
| 5 to 17 Years | 0 (0.0%) | 0 (0.0%) |
| 18 to 34 Years | 0 (0.0%) | 0 (0.0%) |
| 35 to 64 Years | 0 (0.0%) | 0 (0.0%) |
| 65 to 74 Years | 0 (0.0%) | 0 (0.0%) |
| 75 Years and over | 0 (0.0%) | 0 (0.0%) |
Disability Class: Vision Difficulty
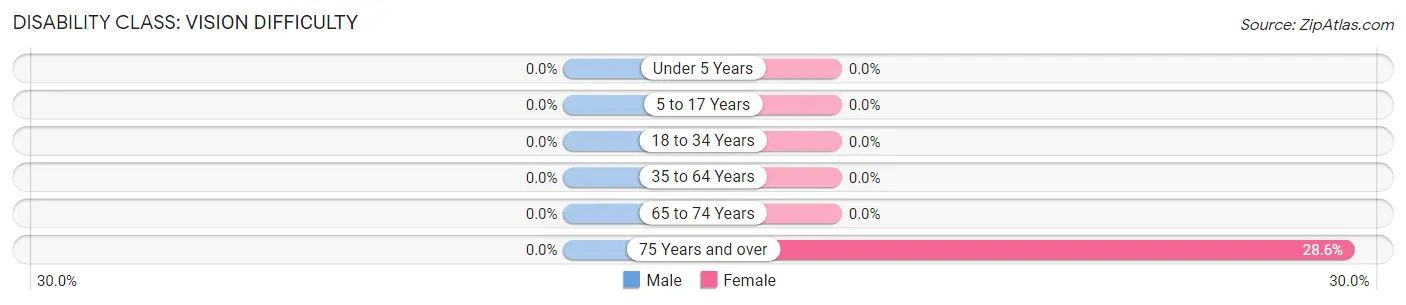
| Age Bracket | Male | Female |
| Under 5 Years | 0 (0.0%) | 0 (0.0%) |
| 5 to 17 Years | 0 (0.0%) | 0 (0.0%) |
| 18 to 34 Years | 0 (0.0%) | 0 (0.0%) |
| 35 to 64 Years | 0 (0.0%) | 0 (0.0%) |
| 65 to 74 Years | 0 (0.0%) | 0 (0.0%) |
| 75 Years and over | 0 (0.0%) | 8 (28.6%) |
Disability Class: Cognitive Difficulty
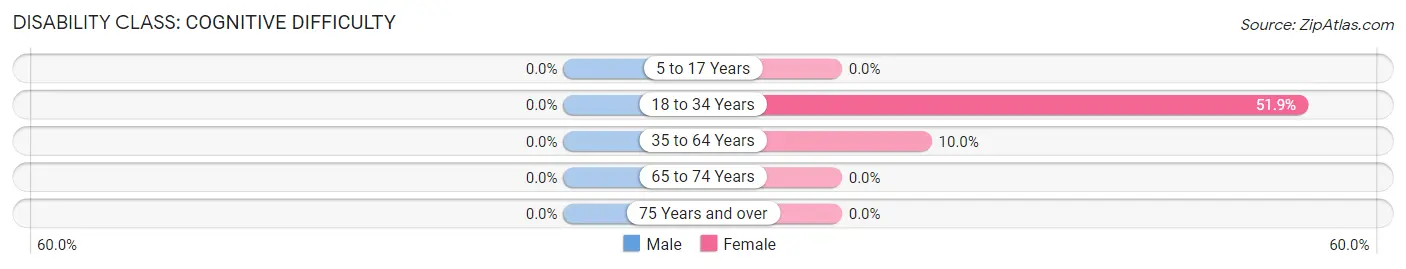
| Age Bracket | Male | Female |
| 5 to 17 Years | 0 (0.0%) | 0 (0.0%) |
| 18 to 34 Years | 0 (0.0%) | 136 (51.9%) |
| 35 to 64 Years | 0 (0.0%) | 30 (10.0%) |
| 65 to 74 Years | 0 (0.0%) | 0 (0.0%) |
| 75 Years and over | 0 (0.0%) | 0 (0.0%) |
Disability Class: Ambulatory Difficulty
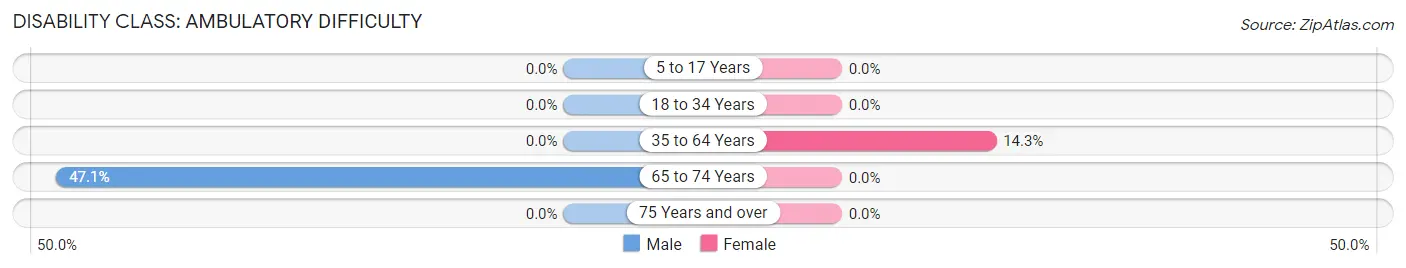
| Age Bracket | Male | Female |
| 5 to 17 Years | 0 (0.0%) | 0 (0.0%) |
| 18 to 34 Years | 0 (0.0%) | 0 (0.0%) |
| 35 to 64 Years | 0 (0.0%) | 43 (14.3%) |
| 65 to 74 Years | 8 (47.1%) | 0 (0.0%) |
| 75 Years and over | 0 (0.0%) | 0 (0.0%) |
Disability Class: Self-Care Difficulty
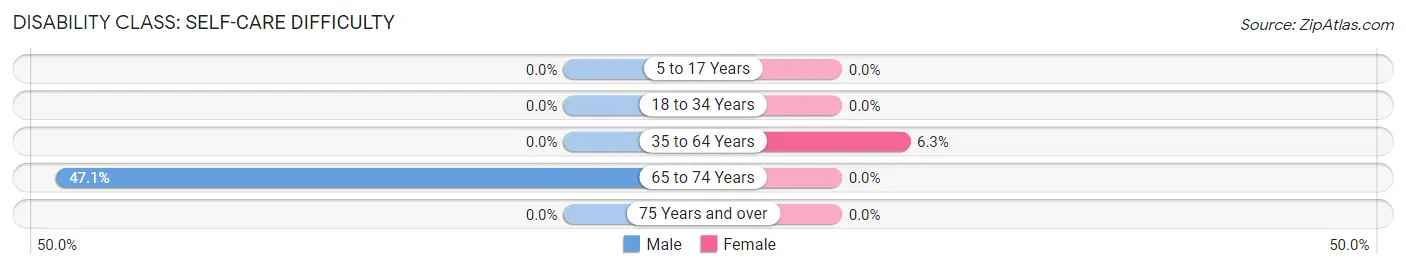
| Age Bracket | Male | Female |
| 5 to 17 Years | 0 (0.0%) | 0 (0.0%) |
| 18 to 34 Years | 0 (0.0%) | 0 (0.0%) |
| 35 to 64 Years | 0 (0.0%) | 19 (6.3%) |
| 65 to 74 Years | 8 (47.1%) | 0 (0.0%) |
| 75 Years and over | 0 (0.0%) | 0 (0.0%) |
Technology Access in Jolivue
Computing Device Access in Jolivue
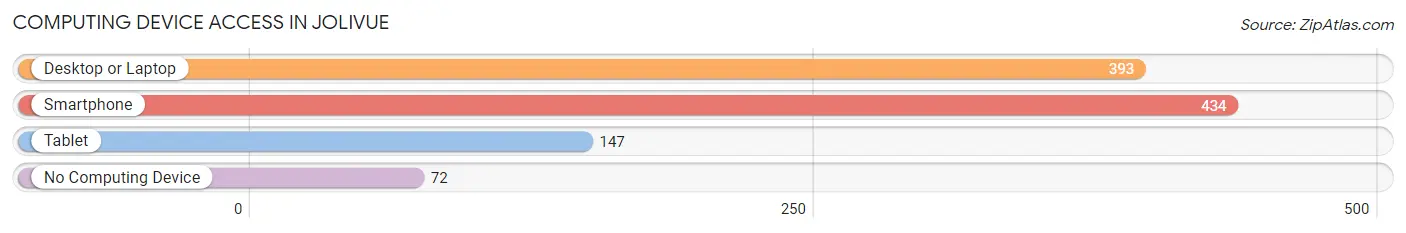
| Device Type | # Households | % Households |
| Desktop or Laptop | 393 | 77.7% |
| Smartphone | 434 | 85.8% |
| Tablet | 147 | 29.0% |
| No Computing Device | 72 | 14.2% |
| Total | 506 | 100.0% |
Internet Access in Jolivue
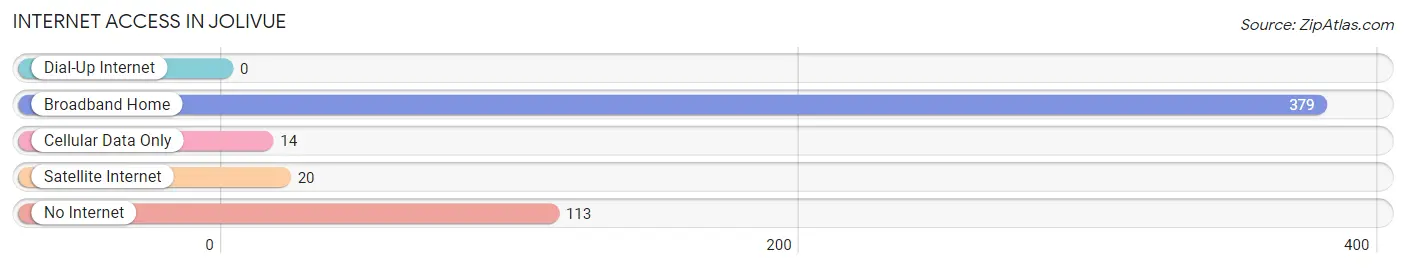
| Internet Type | # Households | % Households |
| Dial-Up Internet | 0 | 0.0% |
| Broadband Home | 379 | 74.9% |
| Cellular Data Only | 14 | 2.8% |
| Satellite Internet | 20 | 4.0% |
| No Internet | 113 | 22.3% |
| Total | 506 | 100.0% |
Jolivue Summary
Jolivue is an unincorporated community located in Rockbridge County, Virginia. It is situated in the Shenandoah Valley, approximately 8 miles south of Lexington and 8 miles north of Buena Vista. The community is located along the Maury River, which is a tributary of the James River.
History
Jolivue was first settled in the late 1700s by German immigrants. The community was originally known as “Jolly’s View”, named after the first settler, John Jolly. The name was later changed to Jolivue. The community was a small farming village until the late 1800s when the railroad was built through the area. This allowed for the development of a small industrial center, which included a sawmill, gristmill, and a tannery.
In the early 1900s, the community began to grow and develop. A post office was established in 1906 and a school was built in 1910. The school was later consolidated with the nearby Buena Vista school system in the 1950s.
Geography
Jolivue is located in the Shenandoah Valley, approximately 8 miles south of Lexington and 8 miles north of Buena Vista. The community is situated along the Maury River, which is a tributary of the James River. The terrain is mostly rolling hills and valleys, with some flat areas. The climate is temperate, with hot summers and cold winters.
Economy
The economy of Jolivue is largely based on agriculture and tourism. The area is home to several farms, which produce a variety of crops, including corn, soybeans, wheat, and hay. The community also has several small businesses, including a general store, a gas station, and a restaurant.
Tourism is an important part of the local economy. The area is home to several attractions, including the Natural Bridge, the Maury River, and the Blue Ridge Parkway. The community also hosts several festivals and events throughout the year, including the Maury River Music Festival and the Rockbridge County Fair.
Demographics
As of the 2010 census, the population of Jolivue was 1,093. The racial makeup of the community was 95.3% White, 2.2% African American, 0.3% Native American, 0.2% Asian, 0.1% Pacific Islander, 0.7% from other races, and 1.3% from two or more races. The median household income was $37,917, and the median family income was $45,000.
Jolivue is a small, rural community with a strong sense of community and a rich history. The area is home to several farms and businesses, and is a popular destination for tourists. The community is a great place to live, work, and raise a family.
Common Questions
What is Per Capita Income in Jolivue?
Per Capita income in Jolivue is $25,422.
What is the Median Household income in Jolivue?
Median Household Income in Jolivue is $35,662.
What is Income or Wage Gap in Jolivue?
Income or Wage Gap in Jolivue is 26.6%.
Women in Jolivue earn 73.4 cents for every dollar earned by a man.
What is Inequality or Gini Index in Jolivue?
Inequality or Gini Index in Jolivue is 0.46.
What is the Total Population of Jolivue?
Total Population of Jolivue is 1,083.
What is the Total Male Population of Jolivue?
Total Male Population of Jolivue is 432.
What is the Total Female Population of Jolivue?
Total Female Population of Jolivue is 651.
What is the Ratio of Males per 100 Females in Jolivue?
There are 66.36 Males per 100 Females in Jolivue.
What is the Ratio of Females per 100 Males in Jolivue?
There are 150.69 Females per 100 Males in Jolivue.
What is the Median Population Age in Jolivue?
Median Population Age in Jolivue is 40.8 Years.
What is the Average Family Size in Jolivue
Average Family Size in Jolivue is 3.2 People.
What is the Average Household Size in Jolivue
Average Household Size in Jolivue is 2.1 People.
How Large is the Labor Force in Jolivue?
There are 589 People in the Labor Forcein in Jolivue.
What is the Percentage of People in the Labor Force in Jolivue?
61.9% of People are in the Labor Force in Jolivue.
What is the Unemployment Rate in Jolivue?
Unemployment Rate in Jolivue is 4.2%.