Sandy Level, VA Map & Demographics
Sandy Level Map
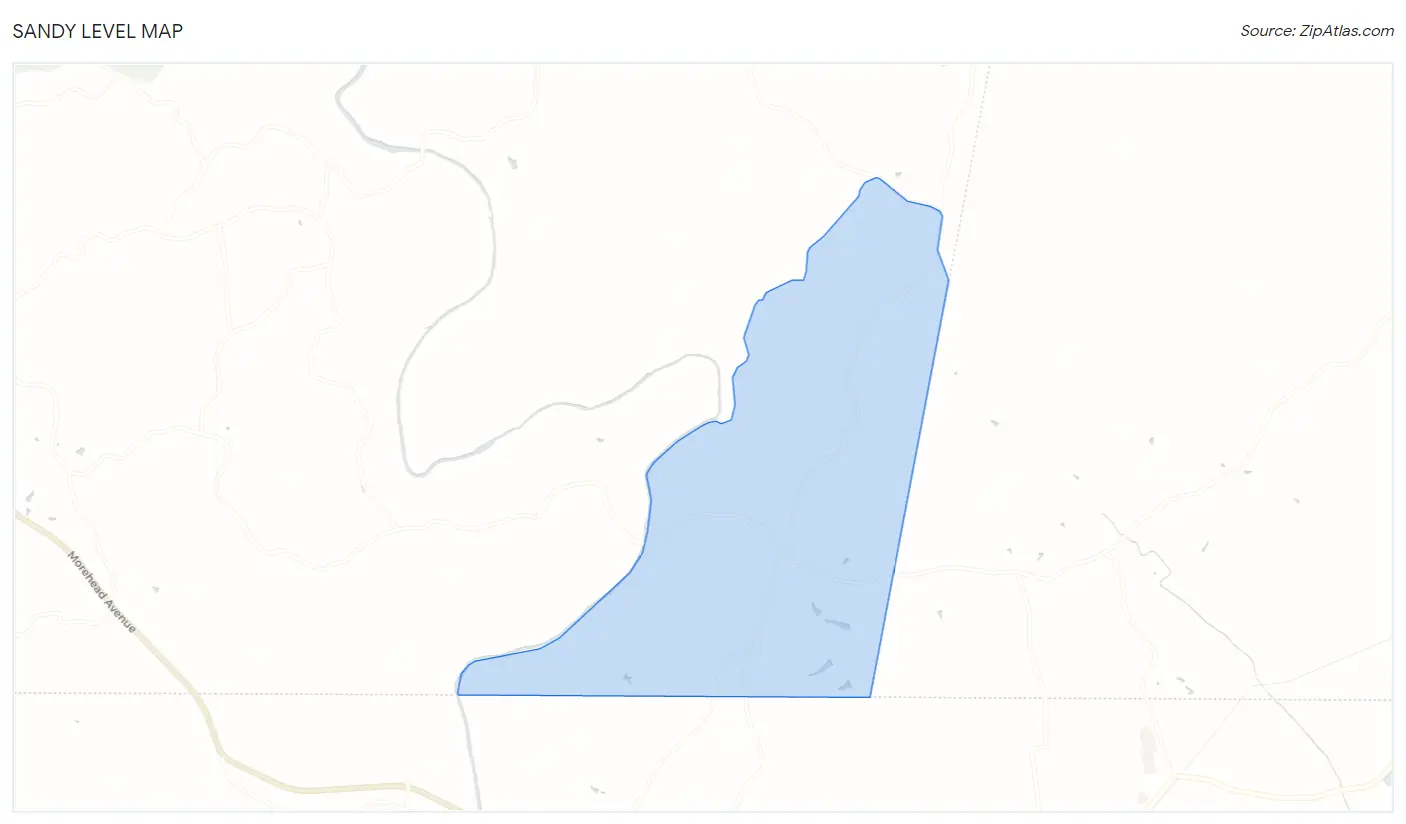
Sandy Level Overview
$13,481
PER CAPITA INCOME
$38,380
AVG FAMILY INCOME
$37,905
AVG HOUSEHOLD INCOME
0.20
INEQUALITY / GINI INDEX
621
TOTAL POPULATION
403
MALE POPULATION
218
FEMALE POPULATION
184.86
MALES / 100 FEMALES
54.09
FEMALES / 100 MALES
36.9
MEDIAN AGE
3.7
AVG FAMILY SIZE
3.3
AVG HOUSEHOLD SIZE
208
LABOR FORCE [ PEOPLE ]
41.7%
PERCENT IN LABOR FORCE
Sandy Level Zip Codes
Sandy Level Area Codes
Income in Sandy Level
Income Overview in Sandy Level
Per Capita Income in Sandy Level is $13,481, while median incomes of families and households are $38,380 and $37,905 respectively.
| Characteristic | Number | Measure |
| Per Capita Income | 621 | $13,481 |
| Median Family Income | 162 | $38,380 |
| Mean Family Income | 162 | $43,065 |
| Median Household Income | 189 | $37,905 |
| Mean Household Income | 189 | $40,973 |
| Income Deficit | 162 | $0 |
| Wage / Income Gap (%) | 621 | 0.00% |
| Wage / Income Gap ($) | 621 | 100.00¢ per $1 |
| Gini / Inequality Index | 621 | 0.20 |
Earnings by Sex in Sandy Level
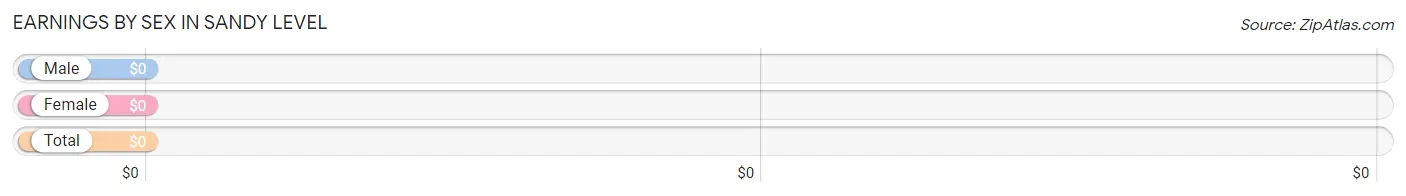
| Sex | Number | Average Earnings |
| Male | 191 (91.8%) | $0 |
| Female | 17 (8.2%) | $0 |
| Total | 208 (100.0%) | $0 |
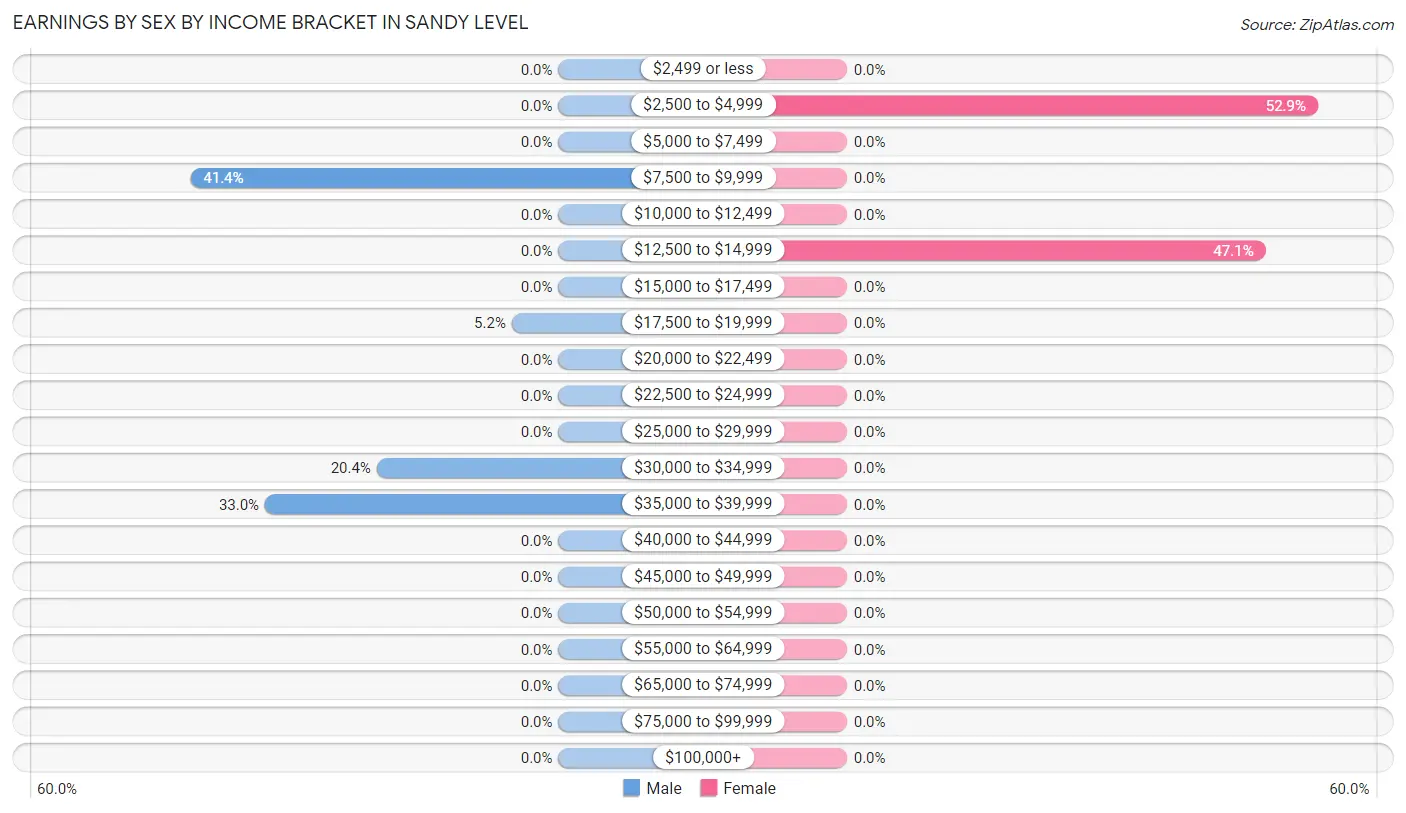
Earnings by Sex by Income Bracket in Sandy Level
The most common earnings brackets in Sandy Level are $7,500 to $9,999 for men (79 | 41.4%) and $2,500 to $4,999 for women (9 | 52.9%).
| Income | Male | Female |
| $2,499 or less | 0 (0.0%) | 0 (0.0%) |
| $2,500 to $4,999 | 0 (0.0%) | 9 (52.9%) |
| $5,000 to $7,499 | 0 (0.0%) | 0 (0.0%) |
| $7,500 to $9,999 | 79 (41.4%) | 0 (0.0%) |
| $10,000 to $12,499 | 0 (0.0%) | 0 (0.0%) |
| $12,500 to $14,999 | 0 (0.0%) | 8 (47.1%) |
| $15,000 to $17,499 | 0 (0.0%) | 0 (0.0%) |
| $17,500 to $19,999 | 10 (5.2%) | 0 (0.0%) |
| $20,000 to $22,499 | 0 (0.0%) | 0 (0.0%) |
| $22,500 to $24,999 | 0 (0.0%) | 0 (0.0%) |
| $25,000 to $29,999 | 0 (0.0%) | 0 (0.0%) |
| $30,000 to $34,999 | 39 (20.4%) | 0 (0.0%) |
| $35,000 to $39,999 | 63 (33.0%) | 0 (0.0%) |
| $40,000 to $44,999 | 0 (0.0%) | 0 (0.0%) |
| $45,000 to $49,999 | 0 (0.0%) | 0 (0.0%) |
| $50,000 to $54,999 | 0 (0.0%) | 0 (0.0%) |
| $55,000 to $64,999 | 0 (0.0%) | 0 (0.0%) |
| $65,000 to $74,999 | 0 (0.0%) | 0 (0.0%) |
| $75,000 to $99,999 | 0 (0.0%) | 0 (0.0%) |
| $100,000+ | 0 (0.0%) | 0 (0.0%) |
| Total | 191 (100.0%) | 17 (100.0%) |
Earnings by Sex by Educational Attainment in Sandy Level
| Educational Attainment | Male Income | Female Income |
| Less than High School | - | - |
| High School Diploma | - | - |
| College or Associate's Degree | - | - |
| Bachelor's Degree | - | - |
| Graduate Degree | - | - |
| Total | - | - |
Family Income in Sandy Level
Family Income Brackets in Sandy Level
According to the Sandy Level family income data, there are 71 families falling into the $35,000 to $49,999 income range, which is the most common income bracket and makes up 43.8% of all families.
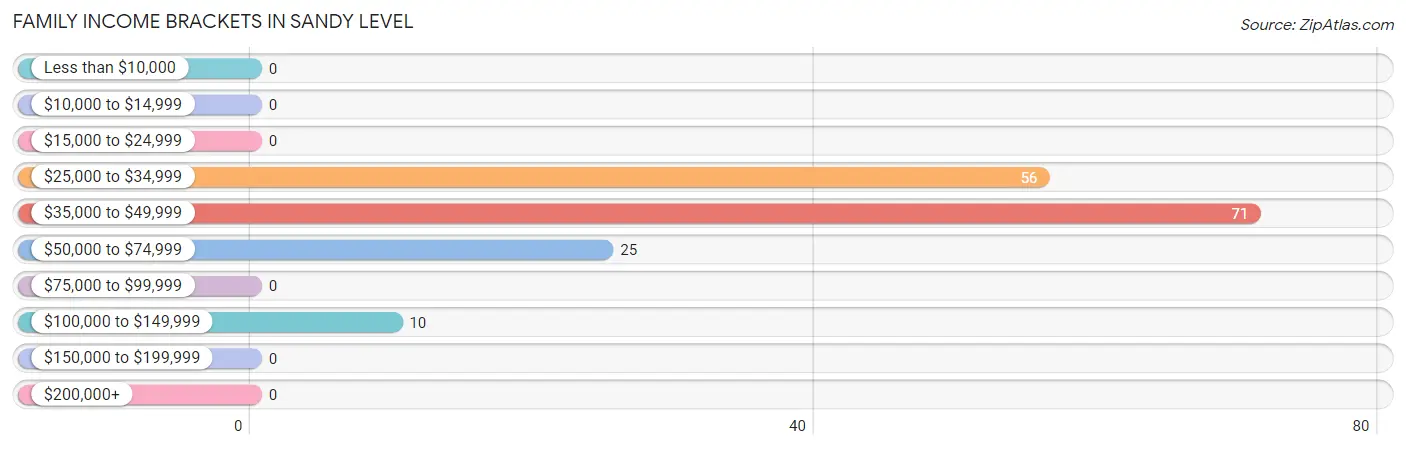
| Income Bracket | # Families | % Families |
| Less than $10,000 | 0 | 0.0% |
| $10,000 to $14,999 | 0 | 0.0% |
| $15,000 to $24,999 | 0 | 0.0% |
| $25,000 to $34,999 | 56 | 34.6% |
| $35,000 to $49,999 | 71 | 43.8% |
| $50,000 to $74,999 | 25 | 15.4% |
| $75,000 to $99,999 | 0 | 0.0% |
| $100,000 to $149,999 | 10 | 6.2% |
| $150,000 to $199,999 | 0 | 0.0% |
| $200,000+ | 0 | 0.0% |
Family Income by Famaliy Size in Sandy Level
3-person families (101 | 62.4%) account for the highest median family income in Sandy Level with $38,222 per family, while 3-person families (101 | 62.4%) have the highest median income of $12,741 per family member.
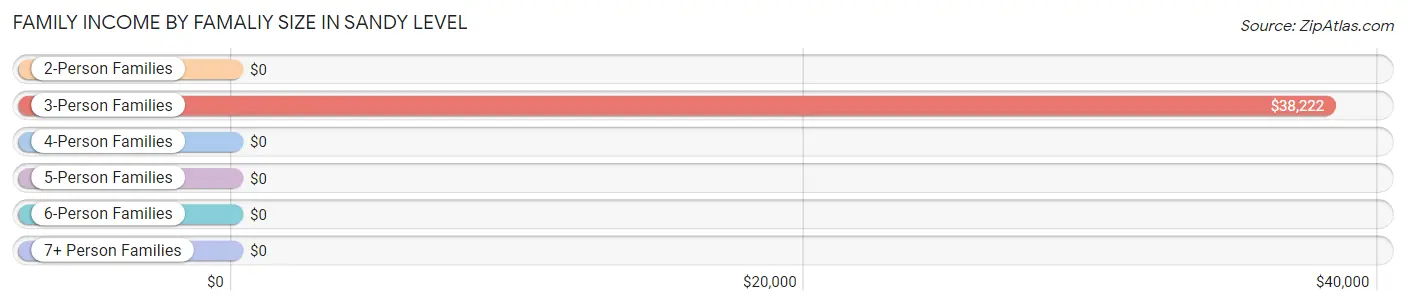
| Income Bracket | # Families | Median Income |
| 2-Person Families | 46 (28.4%) | $0 |
| 3-Person Families | 101 (62.4%) | $38,222 |
| 4-Person Families | 15 (9.3%) | $0 |
| 5-Person Families | 0 (0.0%) | $0 |
| 6-Person Families | 0 (0.0%) | $0 |
| 7+ Person Families | 0 (0.0%) | $0 |
| Total | 162 (100.0%) | $38,380 |
Family Income by Number of Earners in Sandy Level
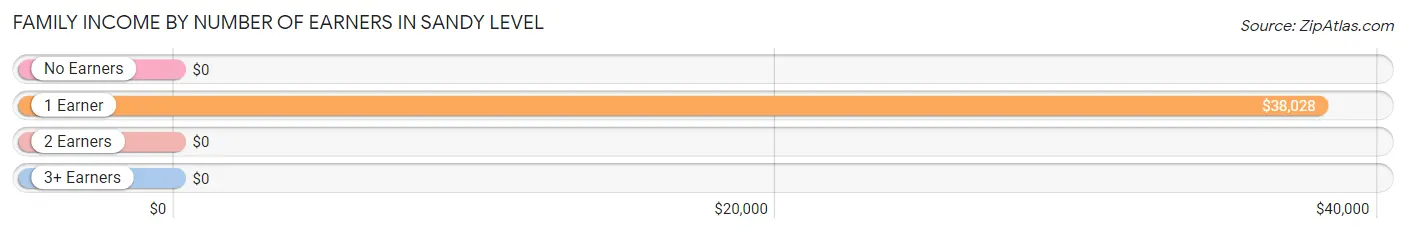
| Number of Earners | # Families | Median Income |
| No Earners | 20 (12.3%) | $0 |
| 1 Earner | 142 (87.6%) | $38,028 |
| 2 Earners | 0 (0.0%) | $0 |
| 3+ Earners | 0 (0.0%) | $0 |
| Total | 162 (100.0%) | $38,380 |
Household Income in Sandy Level
Household Income Brackets in Sandy Level
With 80 households falling in the category, the $35,000 to $49,999 income range is the most frequent in Sandy Level, accounting for 42.3% of all households.
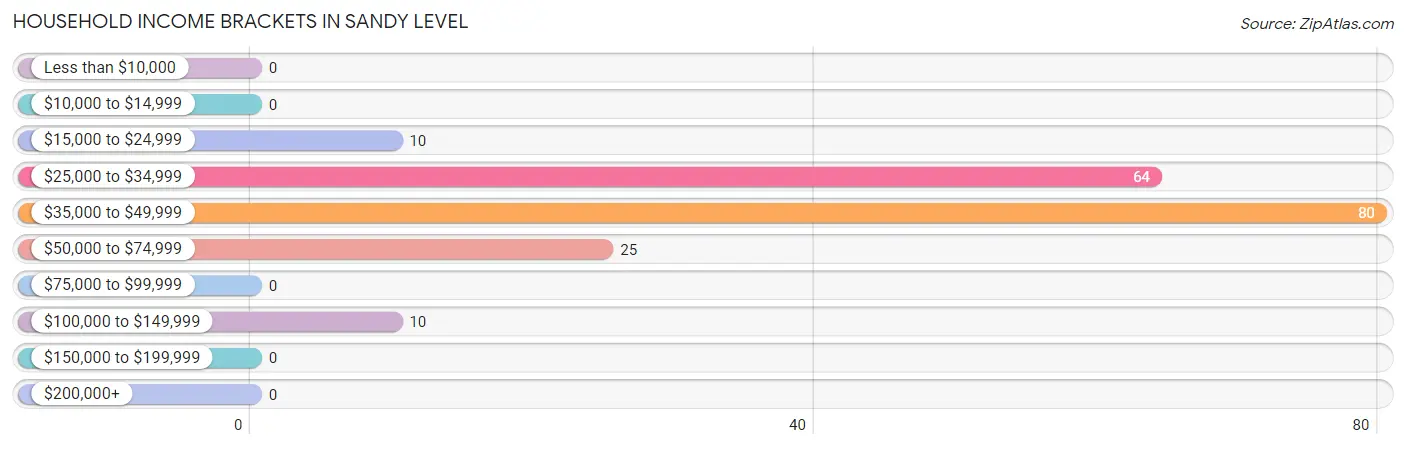
| Income Bracket | # Households | % Households |
| Less than $10,000 | 0 | 0.0% |
| $10,000 to $14,999 | 0 | 0.0% |
| $15,000 to $24,999 | 10 | 5.3% |
| $25,000 to $34,999 | 64 | 33.9% |
| $35,000 to $49,999 | 80 | 42.3% |
| $50,000 to $74,999 | 25 | 13.2% |
| $75,000 to $99,999 | 0 | 0.0% |
| $100,000 to $149,999 | 10 | 5.3% |
| $150,000 to $199,999 | 0 | 0.0% |
| $200,000+ | 0 | 0.0% |
Household Income by Householder Age in Sandy Level
The median household income in Sandy Level is $37,905, with the highest median household income of $34,500 found in the 65+ years age bracket for the primary householder. A total of 116 households (61.4%) fall into this category. Meanwhile, the 15 to 24 years age bracket for the primary householder has the lowest median household income of $0, with 10 households (5.3%) in this group.
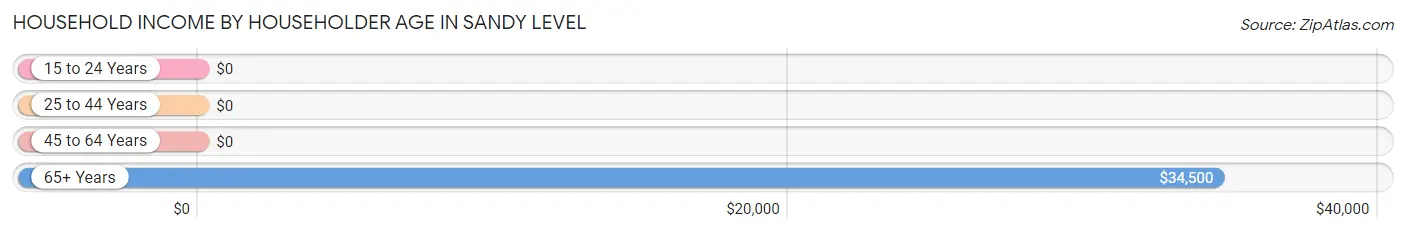
| Income Bracket | # Households | Median Income |
| 15 to 24 Years | 10 (5.3%) | $0 |
| 25 to 44 Years | 63 (33.3%) | $0 |
| 45 to 64 Years | 0 (0.0%) | $0 |
| 65+ Years | 116 (61.4%) | $34,500 |
| Total | 189 (100.0%) | $37,905 |
Poverty in Sandy Level
Income Below Poverty by Sex and Age in Sandy Level
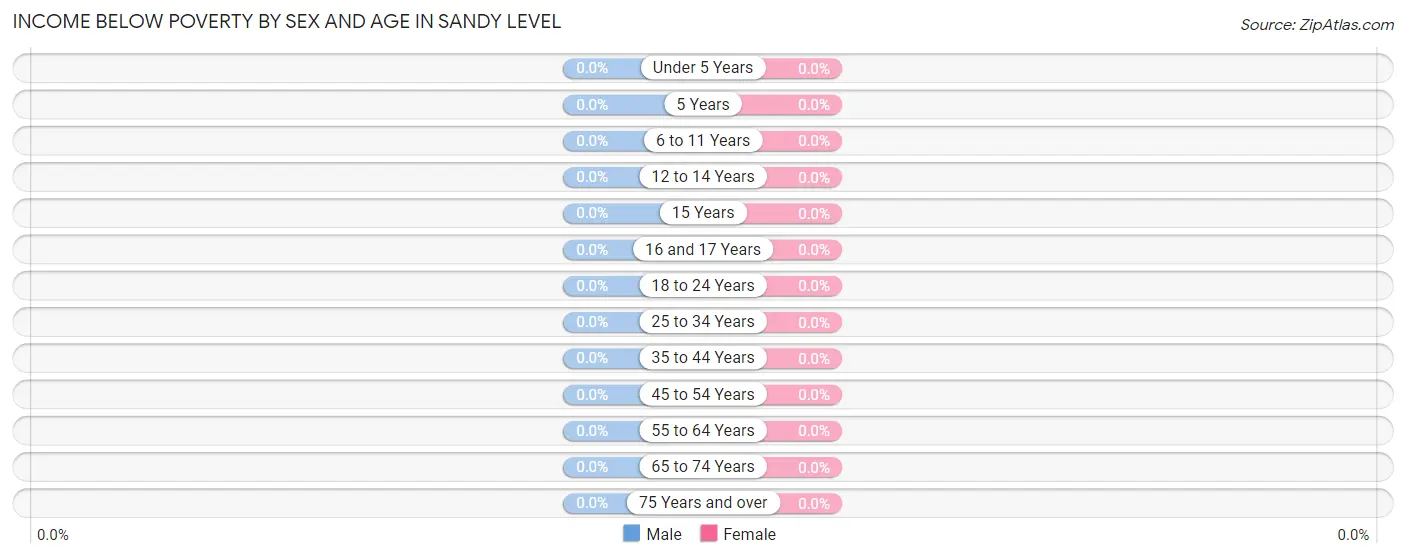
| Age Bracket | Male | Female |
| Under 5 Years | 0 (0.0%) | 0 (0.0%) |
| 5 Years | 0 (0.0%) | 0 (0.0%) |
| 6 to 11 Years | 0 (0.0%) | 0 (0.0%) |
| 12 to 14 Years | 0 (0.0%) | 0 (0.0%) |
| 15 Years | 0 (0.0%) | 0 (0.0%) |
| 16 and 17 Years | 0 (0.0%) | 0 (0.0%) |
| 18 to 24 Years | 0 (0.0%) | 0 (0.0%) |
| 25 to 34 Years | 0 (0.0%) | 0 (0.0%) |
| 35 to 44 Years | 0 (0.0%) | 0 (0.0%) |
| 45 to 54 Years | 0 (0.0%) | 0 (0.0%) |
| 55 to 64 Years | 0 (0.0%) | 0 (0.0%) |
| 65 to 74 Years | 0 (0.0%) | 0 (0.0%) |
| 75 Years and over | 0 (0.0%) | 0 (0.0%) |
| Total | 0 (0.0%) | 0 (0.0%) |
Income Above Poverty by Sex and Age in Sandy Level
According to the poverty statistics in Sandy Level, males aged 6 to 11 years and females aged 25 to 34 years are the age groups that are most secure financially, with 100.0% of males and 100.0% of females in these age groups living above the poverty line.
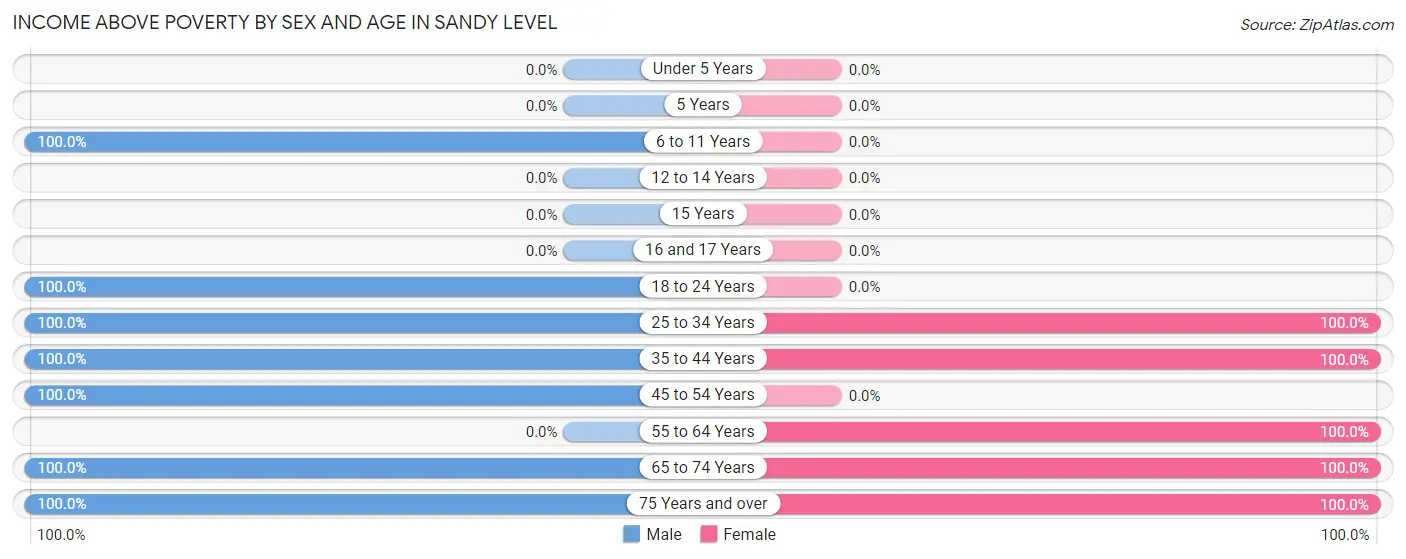
| Age Bracket | Male | Female |
| Under 5 Years | 0 (0.0%) | 0 (0.0%) |
| 5 Years | 0 (0.0%) | 0 (0.0%) |
| 6 to 11 Years | 122 (100.0%) | 0 (0.0%) |
| 12 to 14 Years | 0 (0.0%) | 0 (0.0%) |
| 15 Years | 0 (0.0%) | 0 (0.0%) |
| 16 and 17 Years | 0 (0.0%) | 0 (0.0%) |
| 18 to 24 Years | 10 (100.0%) | 0 (0.0%) |
| 25 to 34 Years | 51 (100.0%) | 46 (100.0%) |
| 35 to 44 Years | 80 (100.0%) | 89 (100.0%) |
| 45 to 54 Years | 50 (100.0%) | 0 (0.0%) |
| 55 to 64 Years | 0 (0.0%) | 10 (100.0%) |
| 65 to 74 Years | 34 (100.0%) | 22 (100.0%) |
| 75 Years and over | 56 (100.0%) | 51 (100.0%) |
| Total | 403 (100.0%) | 218 (100.0%) |
Income Below Poverty Among Married-Couple Families in Sandy Level
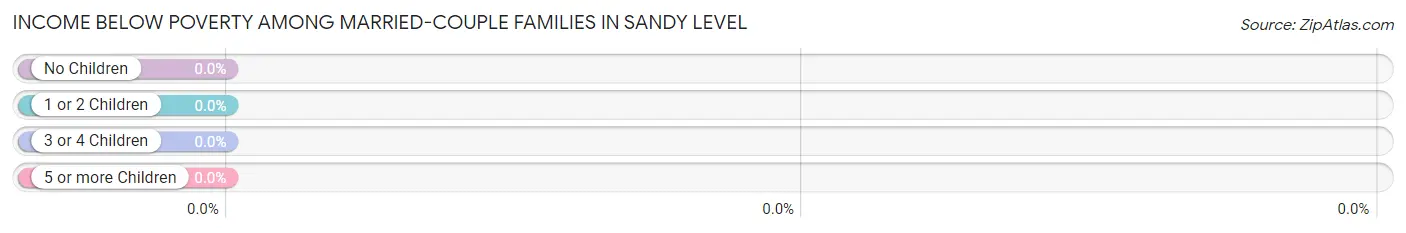
| Children | Above Poverty | Below Poverty |
| No Children | 43 (100.0%) | 0 (0.0%) |
| 1 or 2 Children | 63 (100.0%) | 0 (0.0%) |
| 3 or 4 Children | 0 (0.0%) | 0 (0.0%) |
| 5 or more Children | 0 (0.0%) | 0 (0.0%) |
| Total | 106 (100.0%) | 0 (0.0%) |
Income Below Poverty Among Single-Parent Households in Sandy Level
| Children | Single Father | Single Mother |
| No Children | 0 (0.0%) | 0 (0.0%) |
| 1 or 2 Children | 0 (0.0%) | 0 (0.0%) |
| 3 or 4 Children | 0 (0.0%) | 0 (0.0%) |
| 5 or more Children | 0 (0.0%) | 0 (0.0%) |
| Total | 0 (0.0%) | 0 (0.0%) |
Income Below Poverty Among Married-Couple vs Single-Parent Households in Sandy Level
| Children | Married-Couple Families | Single-Parent Households |
| No Children | 0 (0.0%) | 0 (0.0%) |
| 1 or 2 Children | 0 (0.0%) | 0 (0.0%) |
| 3 or 4 Children | 0 (0.0%) | 0 (0.0%) |
| 5 or more Children | 0 (0.0%) | 0 (0.0%) |
| Total | 0 (0.0%) | 0 (0.0%) |
Race in Sandy Level
The most populous races in Sandy Level are White / Caucasian (420 | 67.6%), and Black / African American (201 | 32.4%).
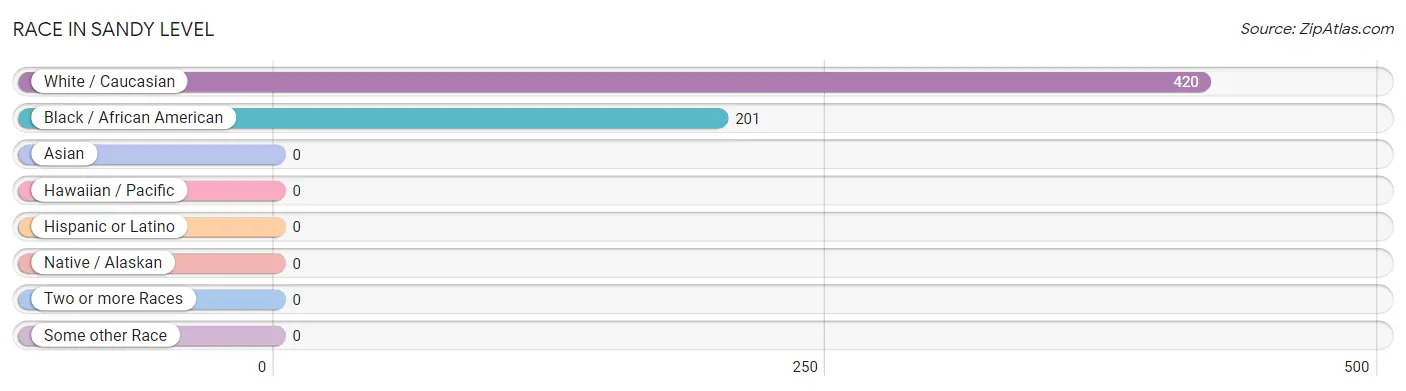
| Race | # Population | % Population |
| Asian | 0 | 0.0% |
| Black / African American | 201 | 32.4% |
| Hawaiian / Pacific | 0 | 0.0% |
| Hispanic or Latino | 0 | 0.0% |
| Native / Alaskan | 0 | 0.0% |
| White / Caucasian | 420 | 67.6% |
| Two or more Races | 0 | 0.0% |
| Some other Race | 0 | 0.0% |
| Total | 621 | 100.0% |
Ancestry in Sandy Level
The most populous ancestries reported in Sandy Level are American (320 | 51.5%), German (79 | 12.7%), and English (21 | 3.4%), together accounting for 67.6% of all Sandy Level residents.
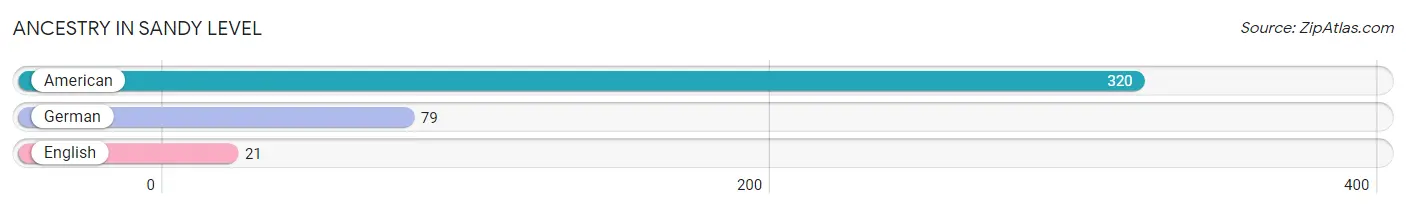
| Ancestry | # Population | % Population |
| American | 320 | 51.5% |
| English | 21 | 3.4% |
| German | 79 | 12.7% | View All 3 Rows |
Immigrants in Sandy Level

| Immigration Origin | # Population | % Population | View All 0 Rows |
Sex and Age in Sandy Level
Sex and Age in Sandy Level
The most populous age groups in Sandy Level are 5 to 9 Years (122 | 30.3%) for men and 35 to 39 Years (89 | 40.8%) for women.
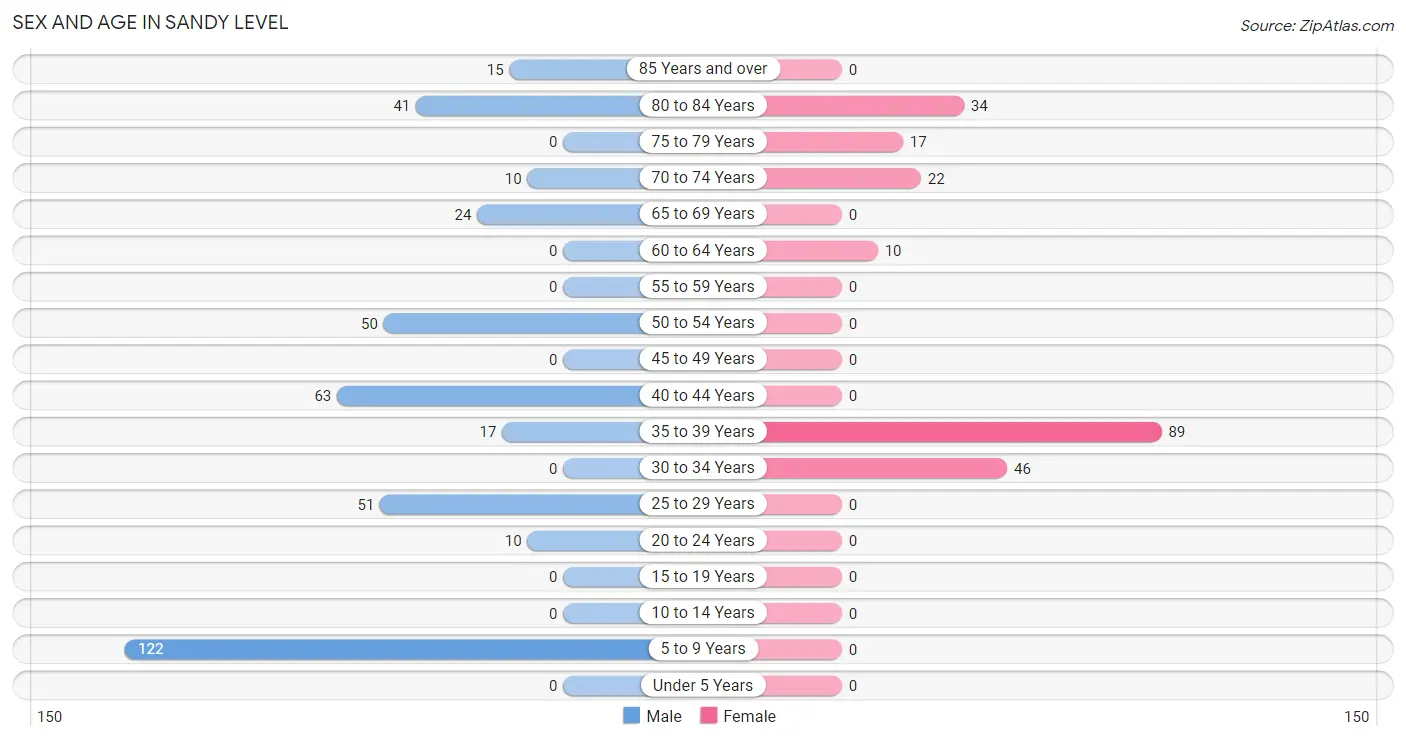
| Age Bracket | Male | Female |
| Under 5 Years | 0 (0.0%) | 0 (0.0%) |
| 5 to 9 Years | 122 (30.3%) | 0 (0.0%) |
| 10 to 14 Years | 0 (0.0%) | 0 (0.0%) |
| 15 to 19 Years | 0 (0.0%) | 0 (0.0%) |
| 20 to 24 Years | 10 (2.5%) | 0 (0.0%) |
| 25 to 29 Years | 51 (12.7%) | 0 (0.0%) |
| 30 to 34 Years | 0 (0.0%) | 46 (21.1%) |
| 35 to 39 Years | 17 (4.2%) | 89 (40.8%) |
| 40 to 44 Years | 63 (15.6%) | 0 (0.0%) |
| 45 to 49 Years | 0 (0.0%) | 0 (0.0%) |
| 50 to 54 Years | 50 (12.4%) | 0 (0.0%) |
| 55 to 59 Years | 0 (0.0%) | 0 (0.0%) |
| 60 to 64 Years | 0 (0.0%) | 10 (4.6%) |
| 65 to 69 Years | 24 (6.0%) | 0 (0.0%) |
| 70 to 74 Years | 10 (2.5%) | 22 (10.1%) |
| 75 to 79 Years | 0 (0.0%) | 17 (7.8%) |
| 80 to 84 Years | 41 (10.2%) | 34 (15.6%) |
| 85 Years and over | 15 (3.7%) | 0 (0.0%) |
| Total | 403 (100.0%) | 218 (100.0%) |
Families and Households in Sandy Level
Median Family Size in Sandy Level
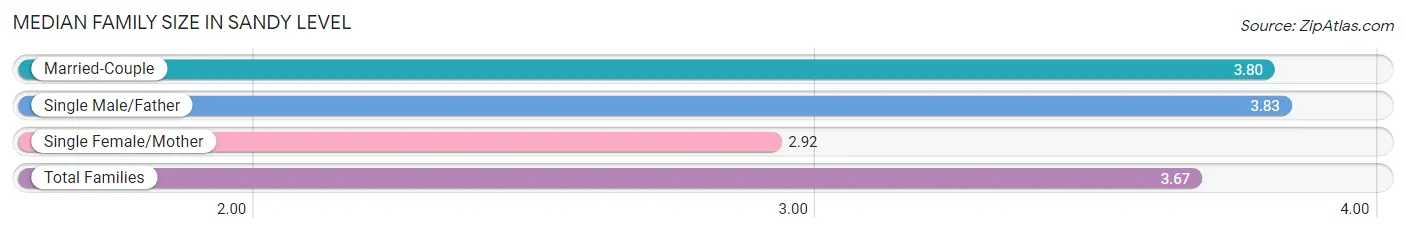
The median family size in Sandy Level is 3.67 persons per family, with single male/father families (30 | 18.5%) accounting for the largest median family size of 3.83 persons per family. On the other hand, single female/mother families (26 | 16.1%) represent the smallest median family size with 2.92 persons per family.
| Family Type | # Families | Family Size |
| Married-Couple | 106 (65.4%) | 3.80 |
| Single Male/Father | 30 (18.5%) | 3.83 |
| Single Female/Mother | 26 (16.1%) | 2.92 |
| Total Families | 162 (100.0%) | 3.67 |
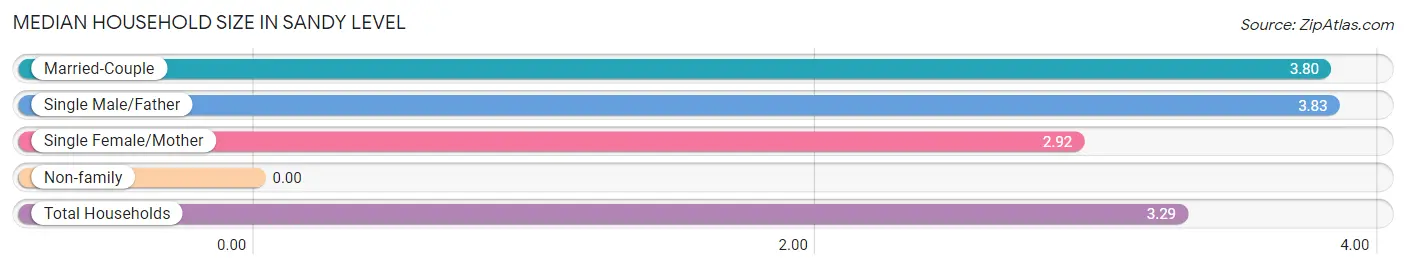
Median Household Size in Sandy Level
| Household Type | # Households | Household Size |
| Married-Couple | 106 (56.1%) | 3.80 |
| Single Male/Father | 30 (15.9%) | 3.83 |
| Single Female/Mother | 26 (13.8%) | 2.92 |
| Non-family | 27 (14.3%) | - |
| Total Households | 189 (100.0%) | 3.29 |
Household Size by Marriage Status in Sandy Level
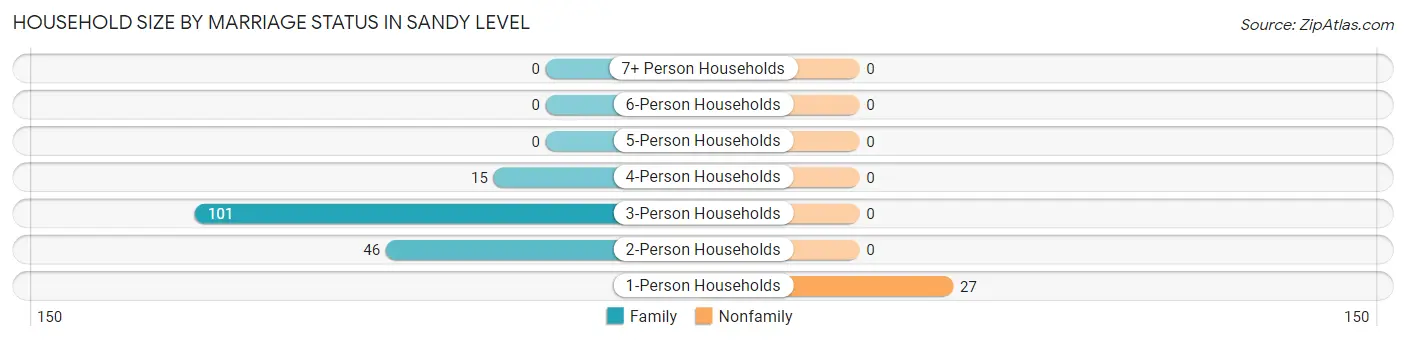
Out of a total of 189 households in Sandy Level, 162 (85.7%) are family households, while 27 (14.3%) are nonfamily households. The most numerous type of family households are 3-person households, comprising 101, and the most common type of nonfamily households are 1-person households, comprising 27.
| Household Size | Family Households | Nonfamily Households |
| 1-Person Households | - | 27 (14.3%) |
| 2-Person Households | 46 (24.3%) | 0 (0.0%) |
| 3-Person Households | 101 (53.4%) | 0 (0.0%) |
| 4-Person Households | 15 (7.9%) | 0 (0.0%) |
| 5-Person Households | 0 (0.0%) | 0 (0.0%) |
| 6-Person Households | 0 (0.0%) | 0 (0.0%) |
| 7+ Person Households | 0 (0.0%) | 0 (0.0%) |
| Total | 162 (85.7%) | 27 (14.3%) |
Female Fertility in Sandy Level
Fertility by Age in Sandy Level
| Age Bracket | Women with Births | Births / 1,000 Women |
| 15 to 19 years | 0 (0.0%) | 0.0 |
| 20 to 34 years | 0 (0.0%) | 0.0 |
| 35 to 50 years | 0 (0.0%) | 0.0 |
| Total | 0 (0.0%) | 0.0 |
Fertility by Age by Marriage Status in Sandy Level
| Age Bracket | Married | Unmarried |
| 15 to 19 years | 0 (0.0%) | 0 (0.0%) |
| 20 to 34 years | 0 (0.0%) | 0 (0.0%) |
| 35 to 50 years | 0 (0.0%) | 0 (0.0%) |
| Total | 0 (0.0%) | 0 (0.0%) |
Fertility by Education in Sandy Level
| Educational Attainment | Women with Births | Births / 1,000 Women |
| Less than High School | 0 (0.0%) | 0.0 |
| High School Diploma | 0 (0.0%) | 0.0 |
| College or Associate's Degree | 0 (0.0%) | 0.0 |
| Bachelor's Degree | 0 (0.0%) | 0.0 |
| Graduate Degree | 0 (0.0%) | 0.0 |
| Total | 0 (0.0%) | 0.0 |
Fertility by Education by Marriage Status in Sandy Level
| Educational Attainment | Married | Unmarried |
| Less than High School | 0 (0.0%) | 0 (0.0%) |
| High School Diploma | 0 (0.0%) | 0 (0.0%) |
| College or Associate's Degree | 0 (0.0%) | 0 (0.0%) |
| Bachelor's Degree | 0 (0.0%) | 0 (0.0%) |
| Graduate Degree | 0 (0.0%) | 0 (0.0%) |
| Total | 0 (0.0%) | 0 (0.0%) |
Employment Characteristics in Sandy Level
Employment by Class of Employer in Sandy Level
Among the 208 employed individuals in Sandy Level, private company employees (128 | 61.5%), and not-for-profit organizations (80 | 38.5%) make up the most common classes of employment.
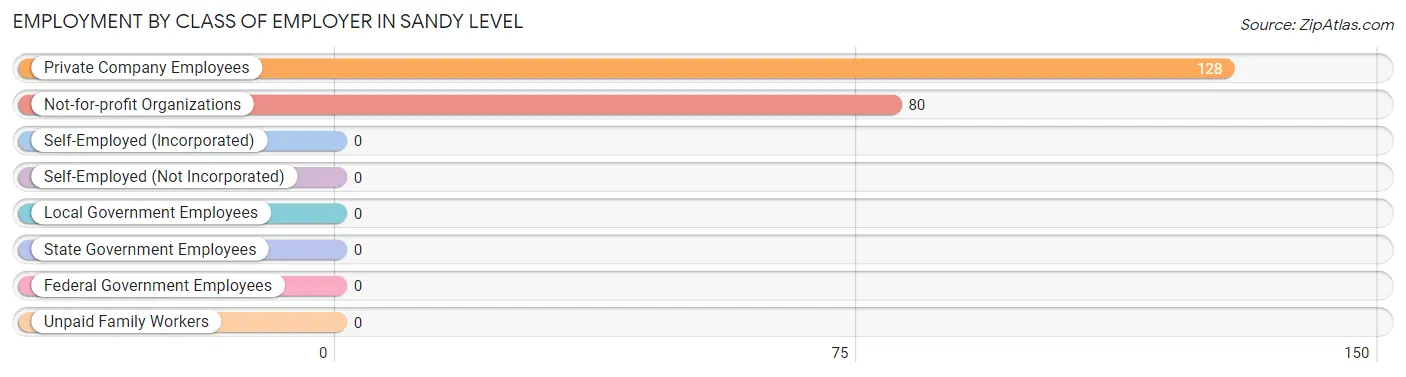
| Employer Class | # Employees | % Employees |
| Private Company Employees | 128 | 61.5% |
| Self-Employed (Incorporated) | 0 | 0.0% |
| Self-Employed (Not Incorporated) | 0 | 0.0% |
| Not-for-profit Organizations | 80 | 38.5% |
| Local Government Employees | 0 | 0.0% |
| State Government Employees | 0 | 0.0% |
| Federal Government Employees | 0 | 0.0% |
| Unpaid Family Workers | 0 | 0.0% |
| Total | 208 | 100.0% |
Employment Status by Age in Sandy Level
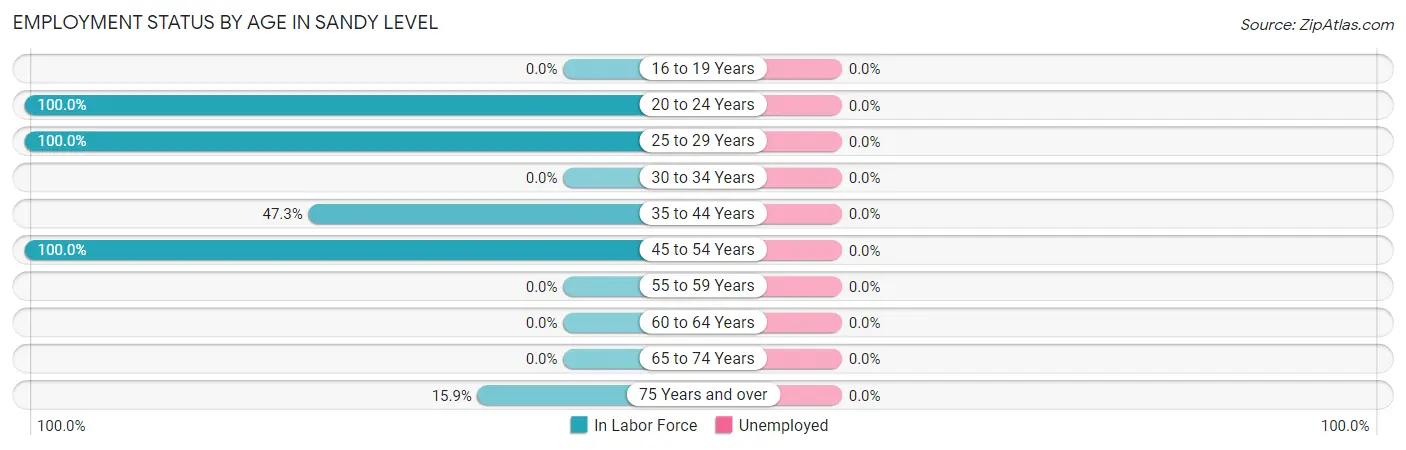
| Age Bracket | In Labor Force | Unemployed |
| 16 to 19 Years | 0 (0.0%) | 0 (0.0%) |
| 20 to 24 Years | 10 (100.0%) | 0 (0.0%) |
| 25 to 29 Years | 51 (100.0%) | 0 (0.0%) |
| 30 to 34 Years | 0 (0.0%) | 0 (0.0%) |
| 35 to 44 Years | 80 (47.3%) | 0 (0.0%) |
| 45 to 54 Years | 50 (100.0%) | 0 (0.0%) |
| 55 to 59 Years | 0 (0.0%) | 0 (0.0%) |
| 60 to 64 Years | 0 (0.0%) | 0 (0.0%) |
| 65 to 74 Years | 0 (0.0%) | 0 (0.0%) |
| 75 Years and over | 17 (15.9%) | 0 (0.0%) |
| Total | 208 (41.7%) | 0 (0.0%) |
Employment Status by Educational Attainment in Sandy Level
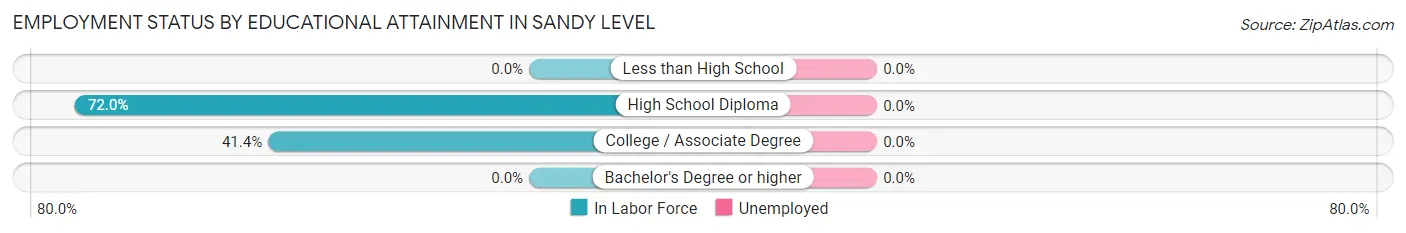
| Educational Attainment | In Labor Force | Unemployed |
| Less than High School | 0 (0.0%) | 0 (0.0%) |
| High School Diploma | 118 (72.0%) | 0 (0.0%) |
| College / Associate Degree | 63 (41.4%) | 0 (0.0%) |
| Bachelor's Degree or higher | 0 (0.0%) | 0 (0.0%) |
| Total | 181 (55.5%) | 0 (0.0%) |
Employment Occupations by Sex in Sandy Level
Management, Business, Science and Arts Occupations
The most common Management, Business, Science and Arts occupations in Sandy Level are , and Management (72 | 34.6%).
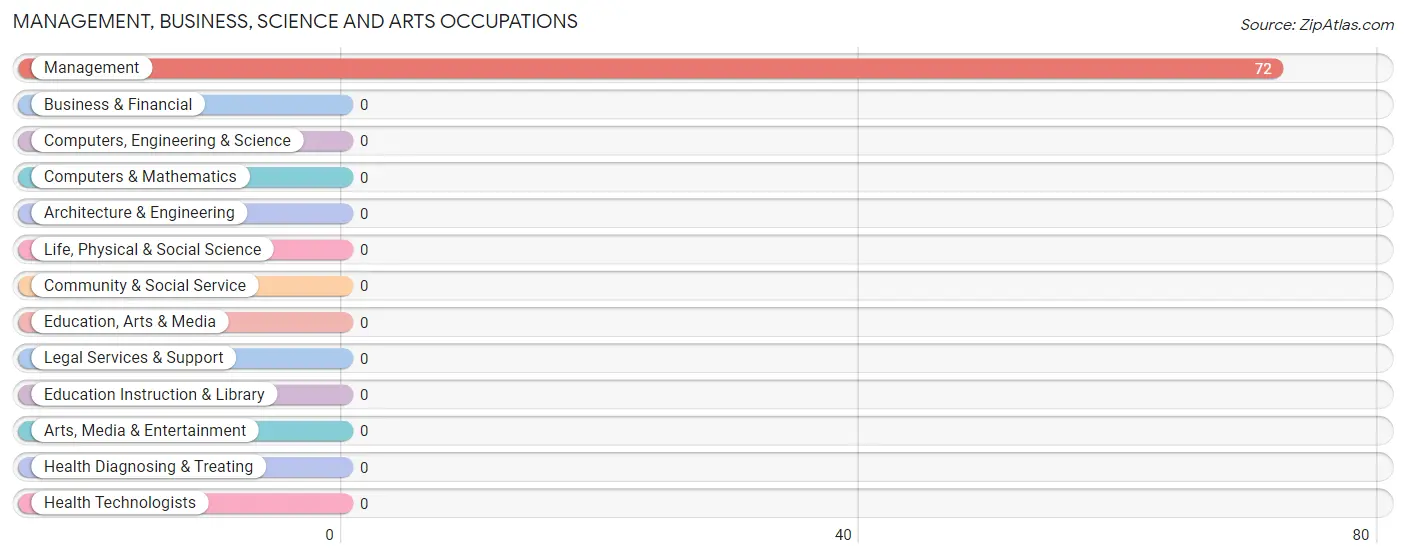
Management, Business, Science and Arts Occupations by Sex
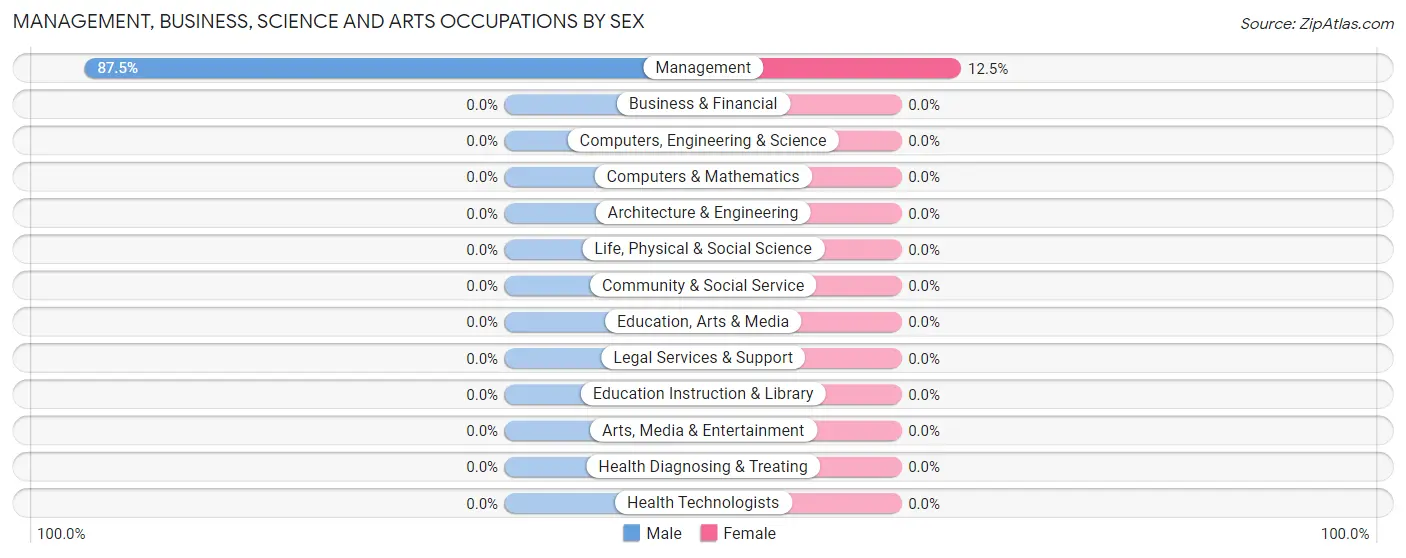
| Occupation | Male | Female |
| Management | 63 (87.5%) | 9 (12.5%) |
| Business & Financial | 0 (0.0%) | 0 (0.0%) |
| Computers, Engineering & Science | 0 (0.0%) | 0 (0.0%) |
| Computers & Mathematics | 0 (0.0%) | 0 (0.0%) |
| Architecture & Engineering | 0 (0.0%) | 0 (0.0%) |
| Life, Physical & Social Science | 0 (0.0%) | 0 (0.0%) |
| Community & Social Service | 0 (0.0%) | 0 (0.0%) |
| Education, Arts & Media | 0 (0.0%) | 0 (0.0%) |
| Legal Services & Support | 0 (0.0%) | 0 (0.0%) |
| Education Instruction & Library | 0 (0.0%) | 0 (0.0%) |
| Arts, Media & Entertainment | 0 (0.0%) | 0 (0.0%) |
| Health Diagnosing & Treating | 0 (0.0%) | 0 (0.0%) |
| Health Technologists | 0 (0.0%) | 0 (0.0%) |
| Total (Category) | 63 (87.5%) | 9 (12.5%) |
| Total (Overall) | 191 (91.8%) | 17 (8.2%) |
Services Occupations
The most common Services occupations in Sandy Level are , and Food Preparation & Serving (17 | 8.2%).
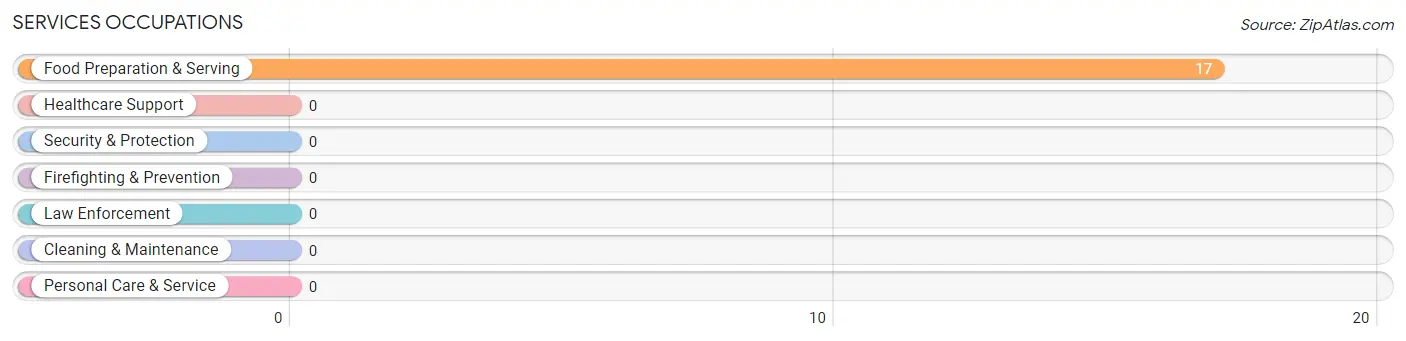
Services Occupations by Sex
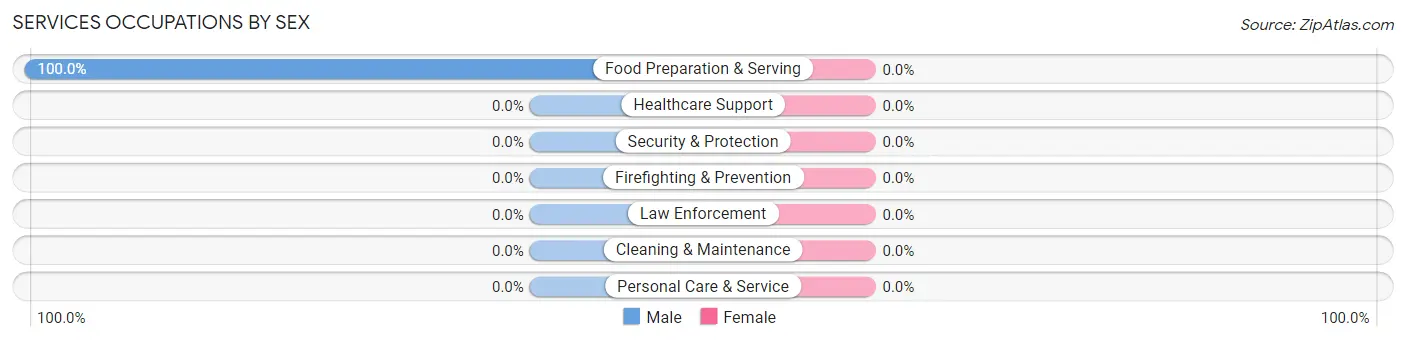
| Occupation | Male | Female |
| Healthcare Support | 0 (0.0%) | 0 (0.0%) |
| Security & Protection | 0 (0.0%) | 0 (0.0%) |
| Firefighting & Prevention | 0 (0.0%) | 0 (0.0%) |
| Law Enforcement | 0 (0.0%) | 0 (0.0%) |
| Food Preparation & Serving | 17 (100.0%) | 0 (0.0%) |
| Cleaning & Maintenance | 0 (0.0%) | 0 (0.0%) |
| Personal Care & Service | 0 (0.0%) | 0 (0.0%) |
| Total (Category) | 17 (100.0%) | 0 (0.0%) |
| Total (Overall) | 191 (91.8%) | 17 (8.2%) |
Sales and Office Occupations
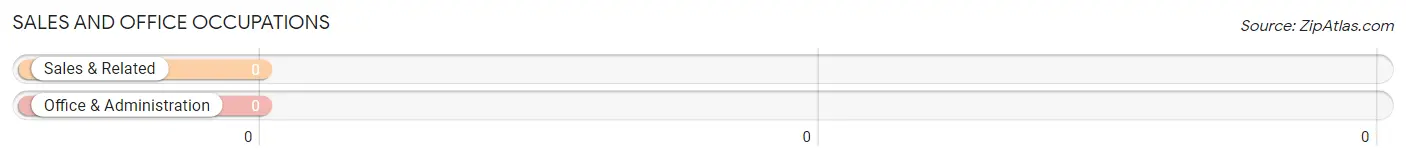
Sales and Office Occupations by Sex
| Occupation | Male | Female |
| Sales & Related | 0 (0.0%) | 0 (0.0%) |
| Office & Administration | 0 (0.0%) | 0 (0.0%) |
| Total (Category) | 0 (0.0%) | 0 (0.0%) |
| Total (Overall) | 191 (91.8%) | 17 (8.2%) |
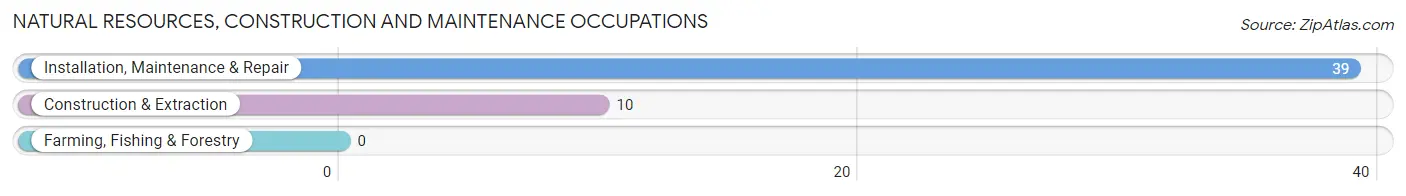
Natural Resources, Construction and Maintenance Occupations
The most common Natural Resources, Construction and Maintenance occupations in Sandy Level are Installation, Maintenance & Repair (39 | 18.8%), and Construction & Extraction (10 | 4.8%).
Natural Resources, Construction and Maintenance Occupations by Sex
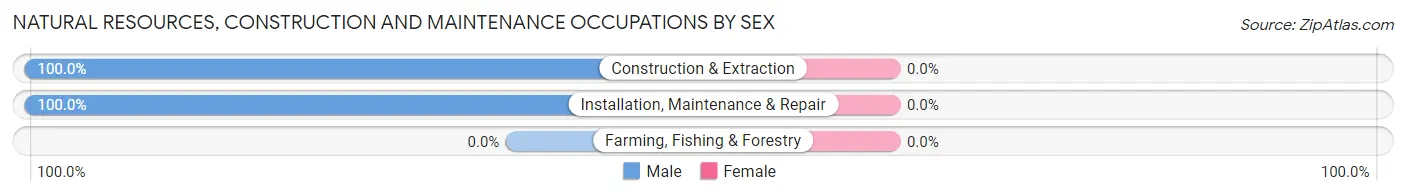
| Occupation | Male | Female |
| Farming, Fishing & Forestry | 0 (0.0%) | 0 (0.0%) |
| Construction & Extraction | 10 (100.0%) | 0 (0.0%) |
| Installation, Maintenance & Repair | 39 (100.0%) | 0 (0.0%) |
| Total (Category) | 49 (100.0%) | 0 (0.0%) |
| Total (Overall) | 191 (91.8%) | 17 (8.2%) |
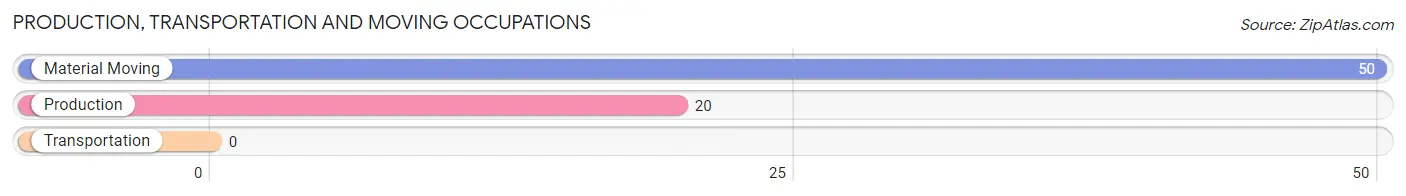
Production, Transportation and Moving Occupations
The most common Production, Transportation and Moving occupations in Sandy Level are Material Moving (50 | 24.0%), and Production (20 | 9.6%).
Production, Transportation and Moving Occupations by Sex
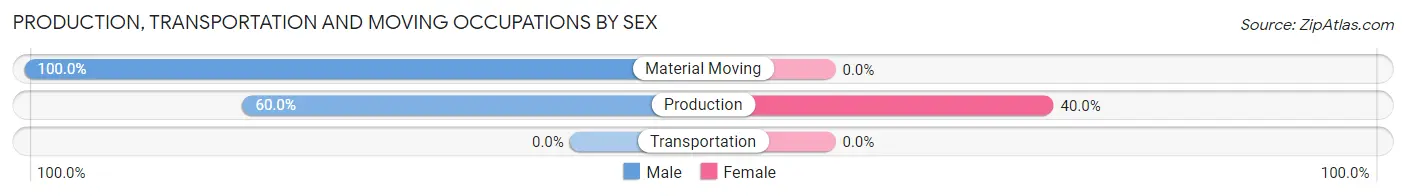
| Occupation | Male | Female |
| Production | 12 (60.0%) | 8 (40.0%) |
| Transportation | 0 (0.0%) | 0 (0.0%) |
| Material Moving | 50 (100.0%) | 0 (0.0%) |
| Total (Category) | 62 (88.6%) | 8 (11.4%) |
| Total (Overall) | 191 (91.8%) | 17 (8.2%) |
Employment Industries by Sex in Sandy Level
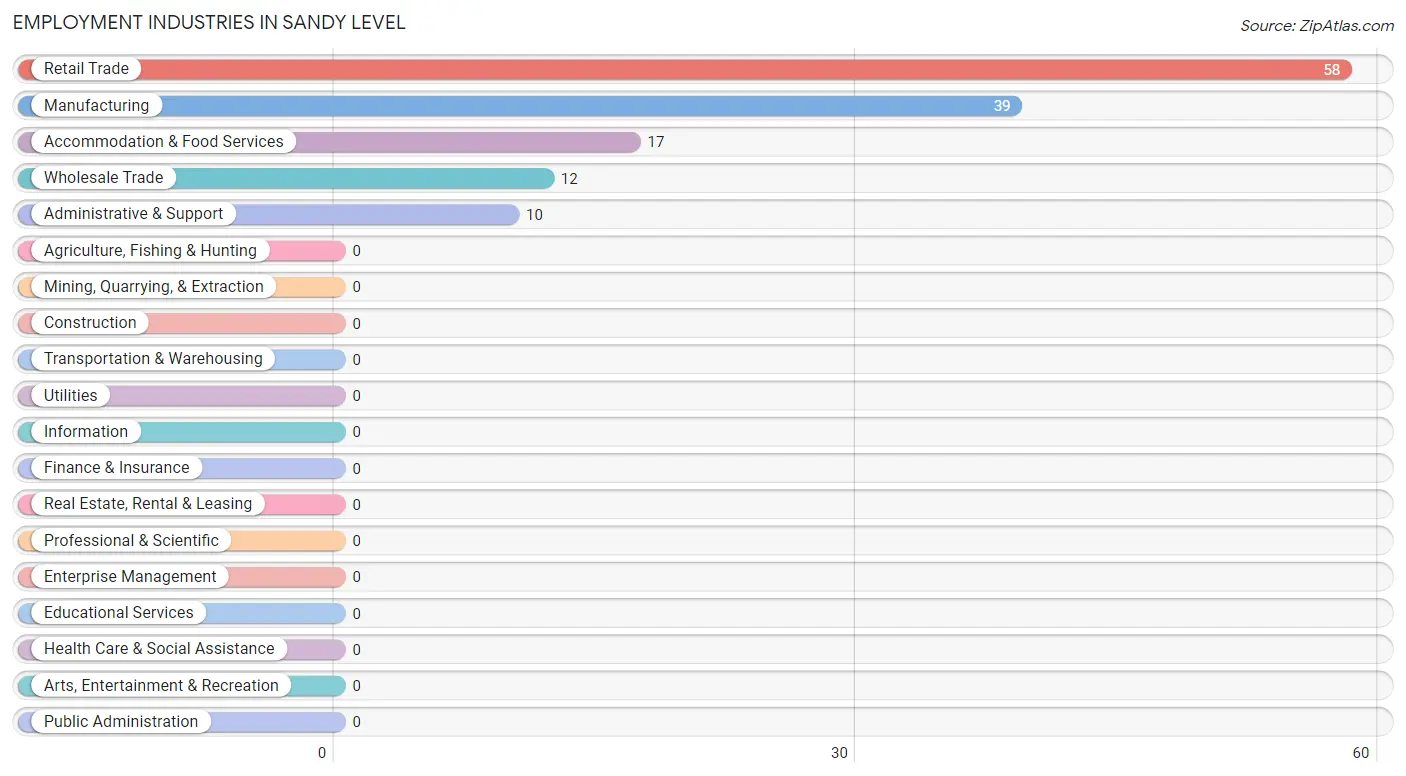
Employment Industries in Sandy Level
The major employment industries in Sandy Level include Retail Trade (58 | 27.9%), Manufacturing (39 | 18.8%), Accommodation & Food Services (17 | 8.2%), Wholesale Trade (12 | 5.8%), and Administrative & Support (10 | 4.8%).
Employment Industries by Sex in Sandy Level
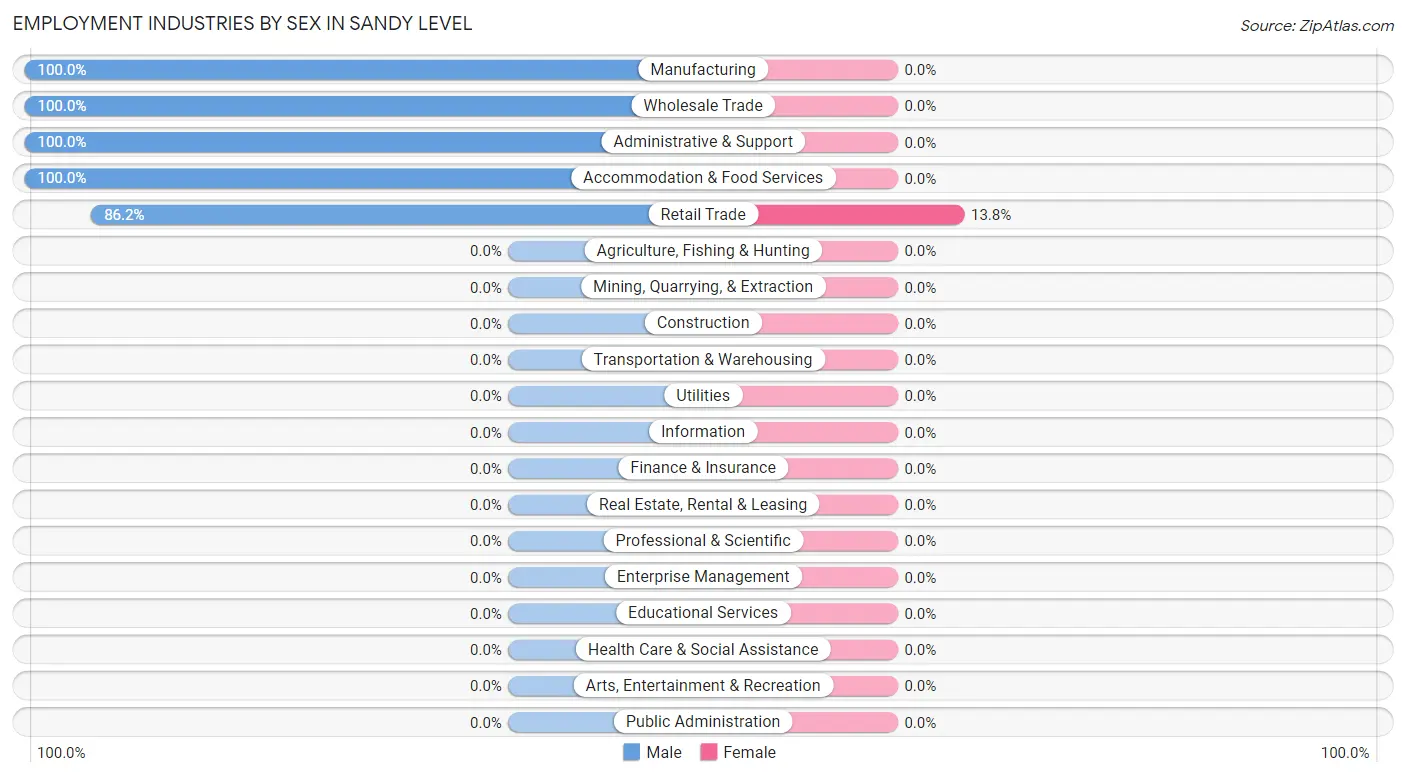
| Industry | Male | Female |
| Agriculture, Fishing & Hunting | 0 (0.0%) | 0 (0.0%) |
| Mining, Quarrying, & Extraction | 0 (0.0%) | 0 (0.0%) |
| Construction | 0 (0.0%) | 0 (0.0%) |
| Manufacturing | 39 (100.0%) | 0 (0.0%) |
| Wholesale Trade | 12 (100.0%) | 0 (0.0%) |
| Retail Trade | 50 (86.2%) | 8 (13.8%) |
| Transportation & Warehousing | 0 (0.0%) | 0 (0.0%) |
| Utilities | 0 (0.0%) | 0 (0.0%) |
| Information | 0 (0.0%) | 0 (0.0%) |
| Finance & Insurance | 0 (0.0%) | 0 (0.0%) |
| Real Estate, Rental & Leasing | 0 (0.0%) | 0 (0.0%) |
| Professional & Scientific | 0 (0.0%) | 0 (0.0%) |
| Enterprise Management | 0 (0.0%) | 0 (0.0%) |
| Administrative & Support | 10 (100.0%) | 0 (0.0%) |
| Educational Services | 0 (0.0%) | 0 (0.0%) |
| Health Care & Social Assistance | 0 (0.0%) | 0 (0.0%) |
| Arts, Entertainment & Recreation | 0 (0.0%) | 0 (0.0%) |
| Accommodation & Food Services | 17 (100.0%) | 0 (0.0%) |
| Public Administration | 0 (0.0%) | 0 (0.0%) |
| Total | 191 (91.8%) | 17 (8.2%) |
Education in Sandy Level
School Enrollment in Sandy Level
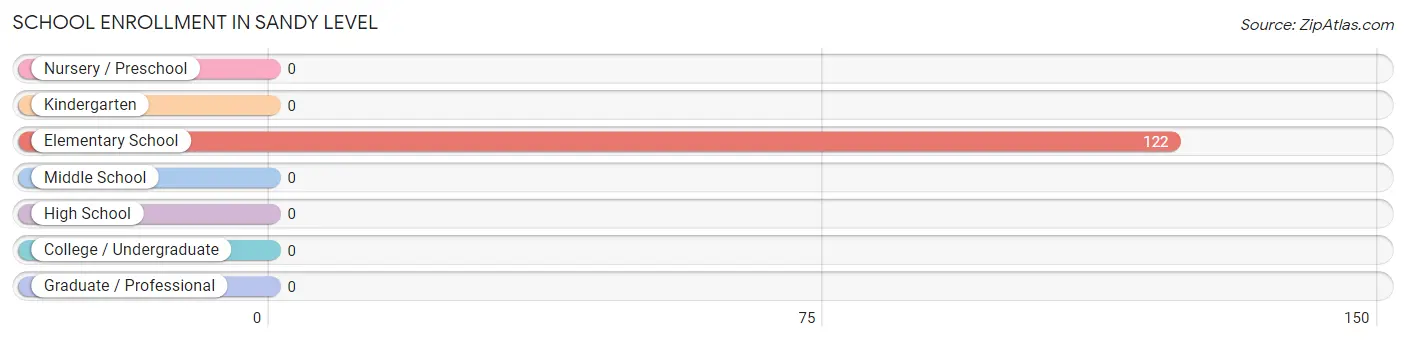
| School Level | # Students | % Students |
| Nursery / Preschool | 0 | 0.0% |
| Kindergarten | 0 | 0.0% |
| Elementary School | 122 | 100.0% |
| Middle School | 0 | 0.0% |
| High School | 0 | 0.0% |
| College / Undergraduate | 0 | 0.0% |
| Graduate / Professional | 0 | 0.0% |
| Total | 122 | 100.0% |
School Enrollment by Age by Funding Source in Sandy Level
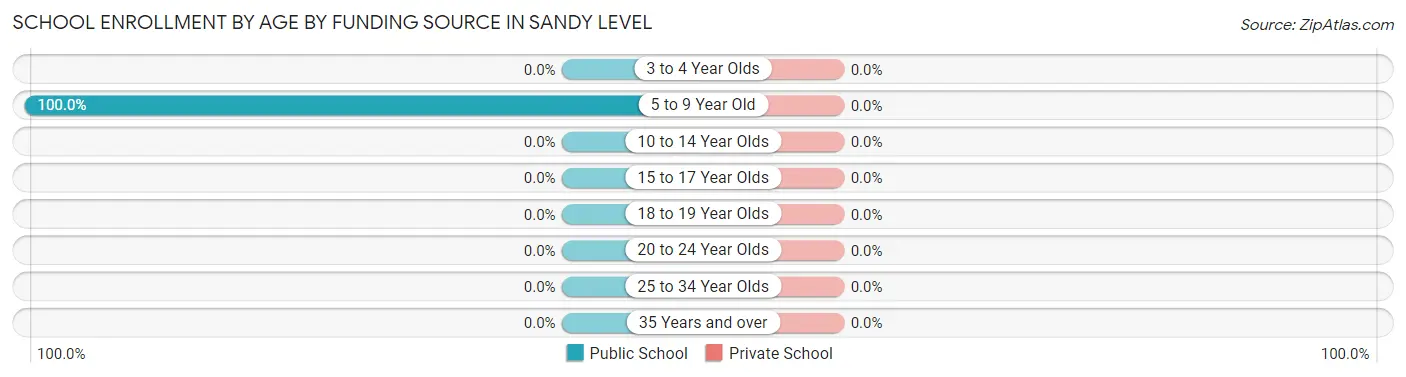
| Age Bracket | Public School | Private School |
| 3 to 4 Year Olds | 0 (0.0%) | 0 (0.0%) |
| 5 to 9 Year Old | 122 (100.0%) | 0 (0.0%) |
| 10 to 14 Year Olds | 0 (0.0%) | 0 (0.0%) |
| 15 to 17 Year Olds | 0 (0.0%) | 0 (0.0%) |
| 18 to 19 Year Olds | 0 (0.0%) | 0 (0.0%) |
| 20 to 24 Year Olds | 0 (0.0%) | 0 (0.0%) |
| 25 to 34 Year Olds | 0 (0.0%) | 0 (0.0%) |
| 35 Years and over | 0 (0.0%) | 0 (0.0%) |
| Total | 122 (100.0%) | 0 (0.0%) |
Educational Attainment by Field of Study in Sandy Level
, and education (8 | 100.0%) are the most common fields of study among 8 individuals in Sandy Level who have obtained a bachelor's degree or higher.
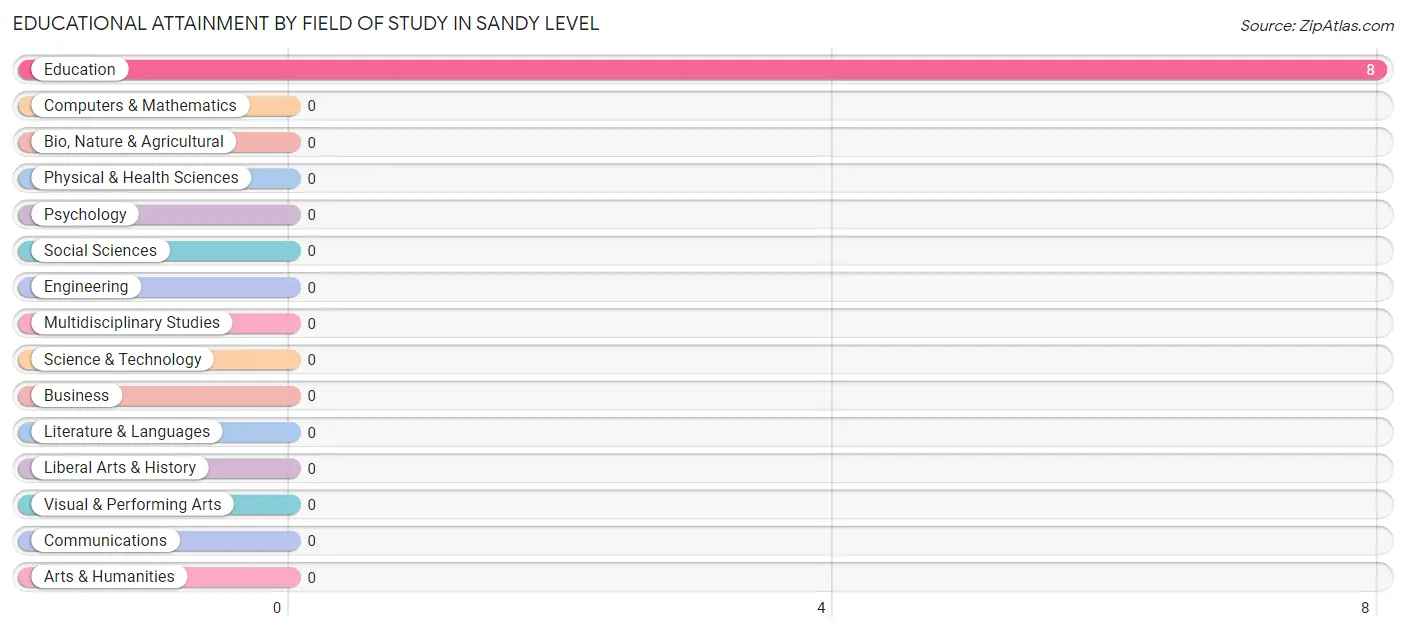
| Field of Study | # Graduates | % Graduates |
| Computers & Mathematics | 0 | 0.0% |
| Bio, Nature & Agricultural | 0 | 0.0% |
| Physical & Health Sciences | 0 | 0.0% |
| Psychology | 0 | 0.0% |
| Social Sciences | 0 | 0.0% |
| Engineering | 0 | 0.0% |
| Multidisciplinary Studies | 0 | 0.0% |
| Science & Technology | 0 | 0.0% |
| Business | 0 | 0.0% |
| Education | 8 | 100.0% |
| Literature & Languages | 0 | 0.0% |
| Liberal Arts & History | 0 | 0.0% |
| Visual & Performing Arts | 0 | 0.0% |
| Communications | 0 | 0.0% |
| Arts & Humanities | 0 | 0.0% |
| Total | 8 | 100.0% |
Transportation & Commute in Sandy Level
Vehicle Availability by Sex in Sandy Level
The most prevalent vehicle ownership categories in Sandy Level are males with 1 vehicle (89, accounting for 46.6%) and females with 1 vehicle (9, making up 523.5%).
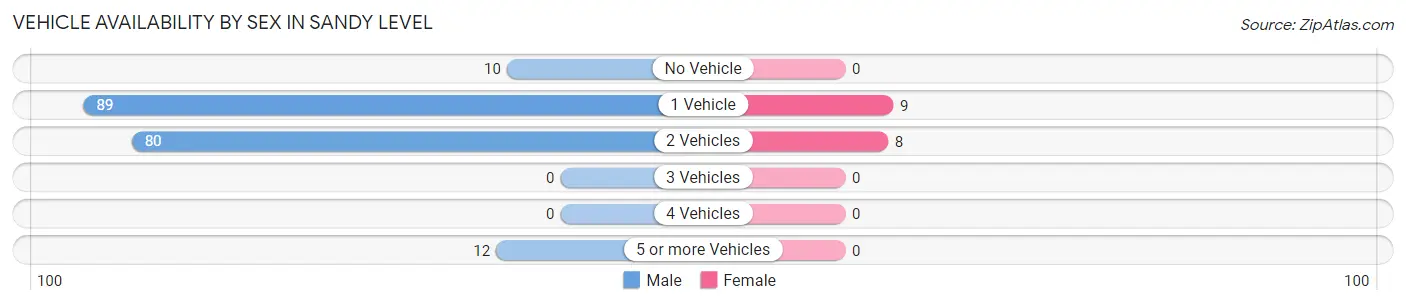
| Vehicles Available | Male | Female |
| No Vehicle | 10 (5.2%) | 0 (0.0%) |
| 1 Vehicle | 89 (46.6%) | 9 (52.9%) |
| 2 Vehicles | 80 (41.9%) | 8 (47.1%) |
| 3 Vehicles | 0 (0.0%) | 0 (0.0%) |
| 4 Vehicles | 0 (0.0%) | 0 (0.0%) |
| 5 or more Vehicles | 12 (6.3%) | 0 (0.0%) |
| Total | 191 (100.0%) | 17 (100.0%) |
Commute Time in Sandy Level
The most frequently occuring commute durations in Sandy Level are 20 to 24 minutes (84 commuters, 40.4%), 25 to 29 minutes (50 commuters, 24.0%), and 30 to 34 minutes (47 commuters, 22.6%).
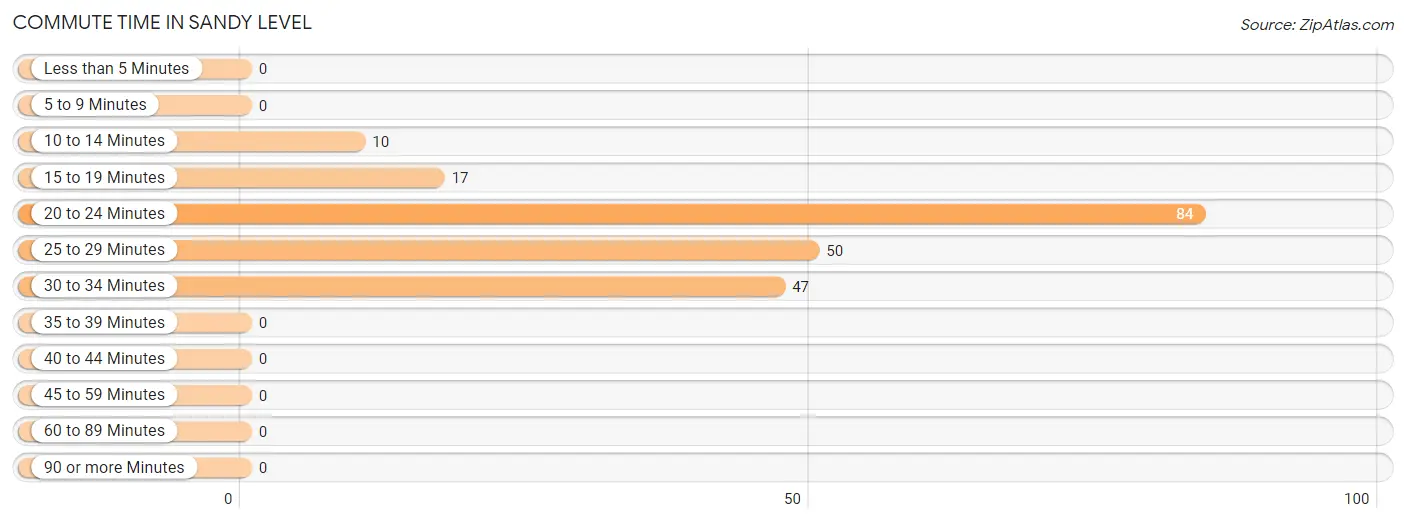
| Commute Time | # Commuters | % Commuters |
| Less than 5 Minutes | 0 | 0.0% |
| 5 to 9 Minutes | 0 | 0.0% |
| 10 to 14 Minutes | 10 | 4.8% |
| 15 to 19 Minutes | 17 | 8.2% |
| 20 to 24 Minutes | 84 | 40.4% |
| 25 to 29 Minutes | 50 | 24.0% |
| 30 to 34 Minutes | 47 | 22.6% |
| 35 to 39 Minutes | 0 | 0.0% |
| 40 to 44 Minutes | 0 | 0.0% |
| 45 to 59 Minutes | 0 | 0.0% |
| 60 to 89 Minutes | 0 | 0.0% |
| 90 or more Minutes | 0 | 0.0% |
Commute Time by Sex in Sandy Level
The most common commute times in Sandy Level are 20 to 24 minutes (75 commuters, 39.3%) for males and 20 to 24 minutes (9 commuters, 52.9%) for females.
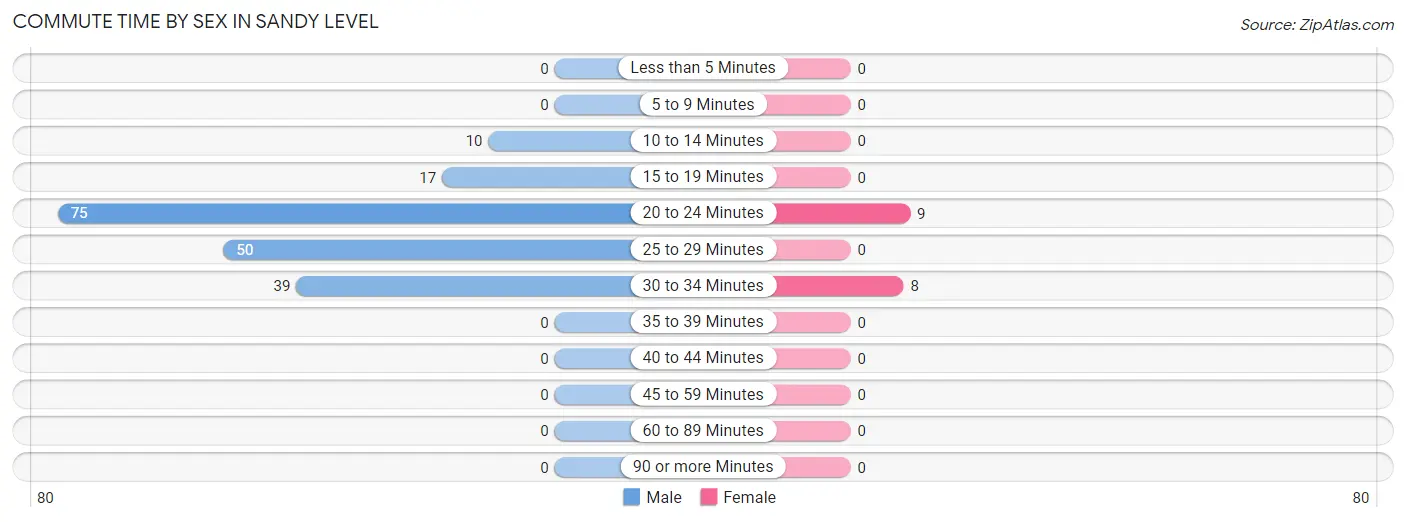
| Commute Time | Male | Female |
| Less than 5 Minutes | 0 (0.0%) | 0 (0.0%) |
| 5 to 9 Minutes | 0 (0.0%) | 0 (0.0%) |
| 10 to 14 Minutes | 10 (5.2%) | 0 (0.0%) |
| 15 to 19 Minutes | 17 (8.9%) | 0 (0.0%) |
| 20 to 24 Minutes | 75 (39.3%) | 9 (52.9%) |
| 25 to 29 Minutes | 50 (26.2%) | 0 (0.0%) |
| 30 to 34 Minutes | 39 (20.4%) | 8 (47.1%) |
| 35 to 39 Minutes | 0 (0.0%) | 0 (0.0%) |
| 40 to 44 Minutes | 0 (0.0%) | 0 (0.0%) |
| 45 to 59 Minutes | 0 (0.0%) | 0 (0.0%) |
| 60 to 89 Minutes | 0 (0.0%) | 0 (0.0%) |
| 90 or more Minutes | 0 (0.0%) | 0 (0.0%) |
Time of Departure to Work by Sex in Sandy Level
The most frequent times of departure to work in Sandy Level are 4:00 PM to 11:59 PM (102, 53.4%) for males and 6:30 AM to 6:59 AM (9, 52.9%) for females.
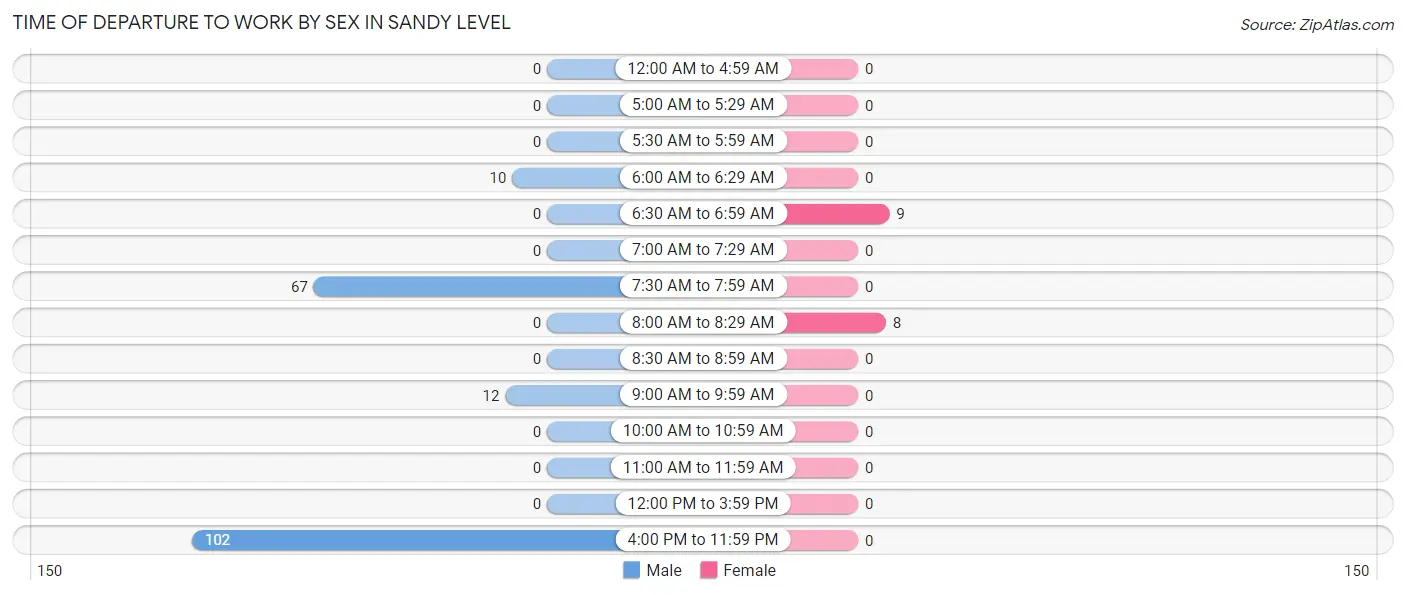
| Time of Departure | Male | Female |
| 12:00 AM to 4:59 AM | 0 (0.0%) | 0 (0.0%) |
| 5:00 AM to 5:29 AM | 0 (0.0%) | 0 (0.0%) |
| 5:30 AM to 5:59 AM | 0 (0.0%) | 0 (0.0%) |
| 6:00 AM to 6:29 AM | 10 (5.2%) | 0 (0.0%) |
| 6:30 AM to 6:59 AM | 0 (0.0%) | 9 (52.9%) |
| 7:00 AM to 7:29 AM | 0 (0.0%) | 0 (0.0%) |
| 7:30 AM to 7:59 AM | 67 (35.1%) | 0 (0.0%) |
| 8:00 AM to 8:29 AM | 0 (0.0%) | 8 (47.1%) |
| 8:30 AM to 8:59 AM | 0 (0.0%) | 0 (0.0%) |
| 9:00 AM to 9:59 AM | 12 (6.3%) | 0 (0.0%) |
| 10:00 AM to 10:59 AM | 0 (0.0%) | 0 (0.0%) |
| 11:00 AM to 11:59 AM | 0 (0.0%) | 0 (0.0%) |
| 12:00 PM to 3:59 PM | 0 (0.0%) | 0 (0.0%) |
| 4:00 PM to 11:59 PM | 102 (53.4%) | 0 (0.0%) |
| Total | 191 (100.0%) | 17 (100.0%) |
Housing Occupancy in Sandy Level
Occupancy by Ownership in Sandy Level
Of the total 189 dwellings in Sandy Level, owner-occupied units account for 116 (61.4%), while renter-occupied units make up 73 (38.6%).
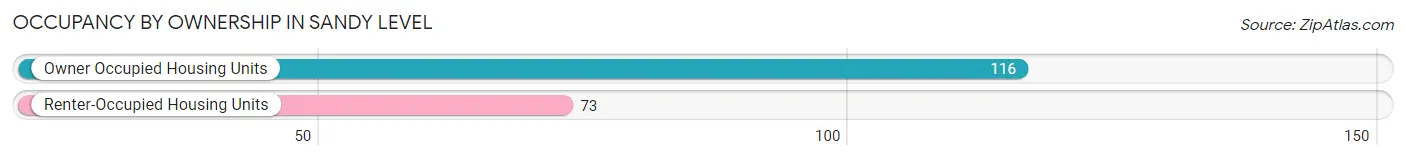
| Occupancy | # Housing Units | % Housing Units |
| Owner Occupied Housing Units | 116 | 61.4% |
| Renter-Occupied Housing Units | 73 | 38.6% |
| Total Occupied Housing Units | 189 | 100.0% |
Occupancy by Household Size in Sandy Level
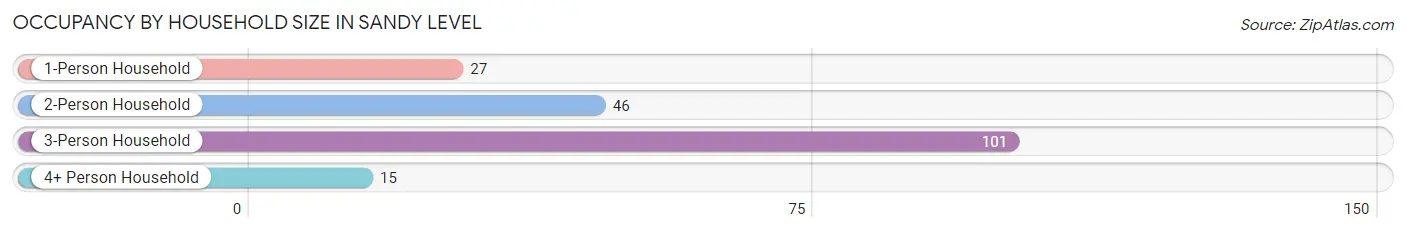
| Household Size | # Housing Units | % Housing Units |
| 1-Person Household | 27 | 14.3% |
| 2-Person Household | 46 | 24.3% |
| 3-Person Household | 101 | 53.4% |
| 4+ Person Household | 15 | 7.9% |
| Total Housing Units | 189 | 100.0% |
Occupancy by Ownership by Household Size in Sandy Level
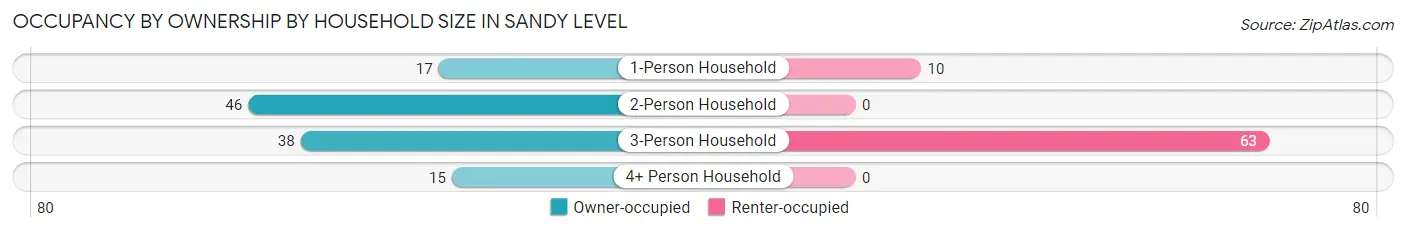
| Household Size | Owner-occupied | Renter-occupied |
| 1-Person Household | 17 (63.0%) | 10 (37.0%) |
| 2-Person Household | 46 (100.0%) | 0 (0.0%) |
| 3-Person Household | 38 (37.6%) | 63 (62.4%) |
| 4+ Person Household | 15 (100.0%) | 0 (0.0%) |
| Total Housing Units | 116 (61.4%) | 73 (38.6%) |
Occupancy by Educational Attainment in Sandy Level
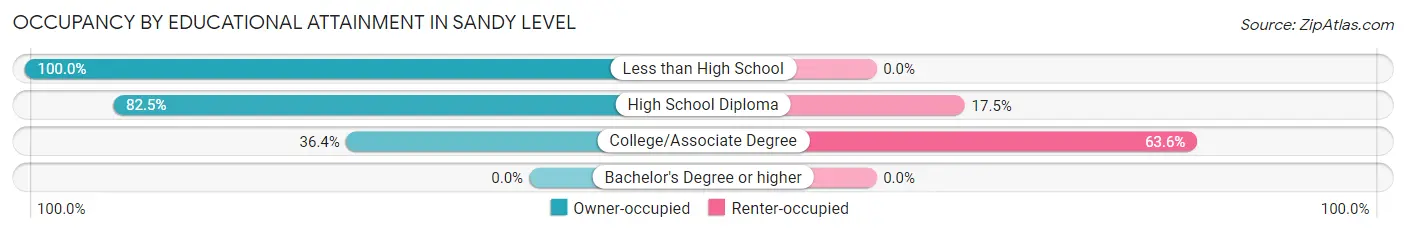
| Household Size | Owner-occupied | Renter-occupied |
| Less than High School | 33 (100.0%) | 0 (0.0%) |
| High School Diploma | 47 (82.5%) | 10 (17.5%) |
| College/Associate Degree | 36 (36.4%) | 63 (63.6%) |
| Bachelor's Degree or higher | 0 (0.0%) | 0 (0.0%) |
Occupancy by Age of Householder in Sandy Level
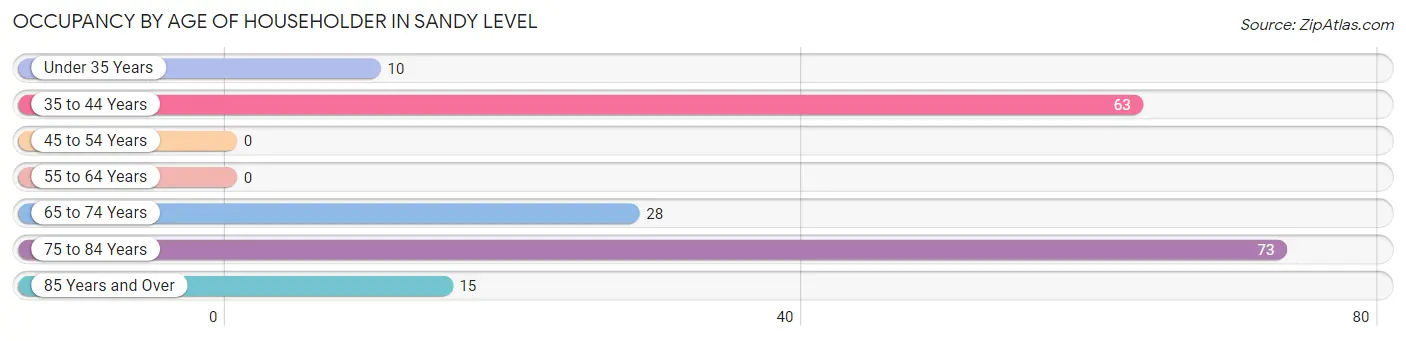
| Age Bracket | # Households | % Households |
| Under 35 Years | 10 | 5.3% |
| 35 to 44 Years | 63 | 33.3% |
| 45 to 54 Years | 0 | 0.0% |
| 55 to 64 Years | 0 | 0.0% |
| 65 to 74 Years | 28 | 14.8% |
| 75 to 84 Years | 73 | 38.6% |
| 85 Years and Over | 15 | 7.9% |
| Total | 189 | 100.0% |
Housing Finances in Sandy Level
Median Income by Occupancy in Sandy Level
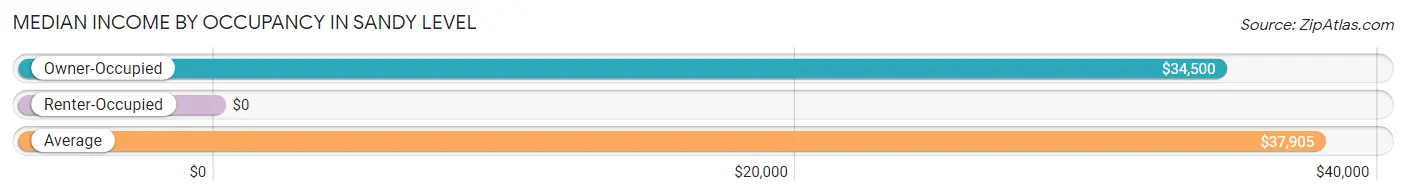
| Occupancy Type | # Households | Median Income |
| Owner-Occupied | 116 (61.4%) | $34,500 |
| Renter-Occupied | 73 (38.6%) | $0 |
| Average | 189 (100.0%) | $37,905 |
Occupancy by Householder Income Bracket in Sandy Level
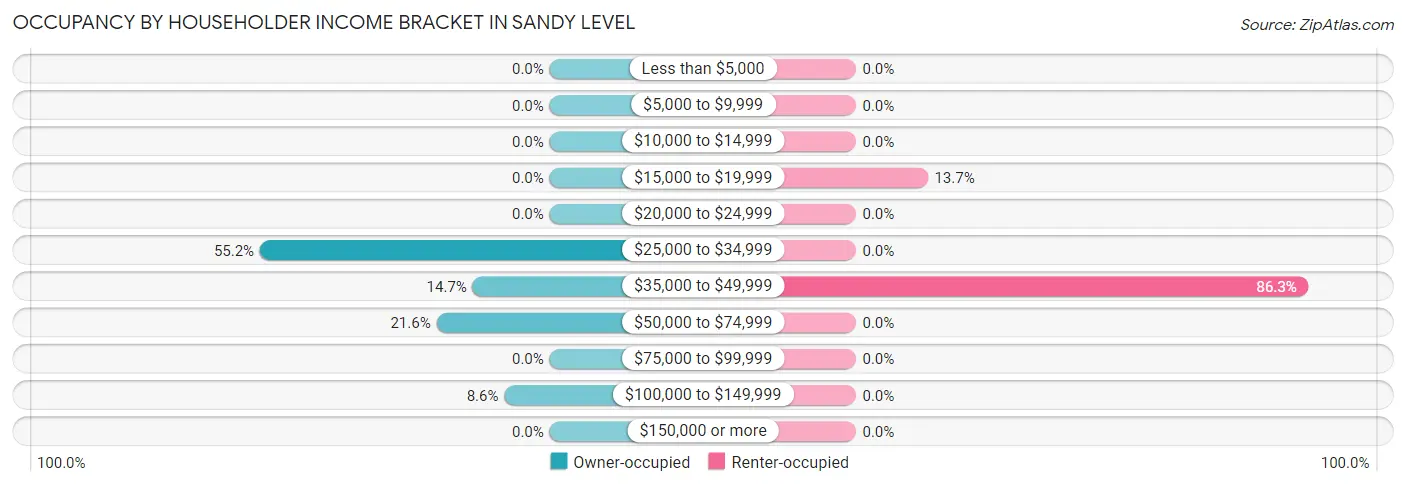
| Income Bracket | Owner-occupied | Renter-occupied |
| Less than $5,000 | 0 (0.0%) | 0 (0.0%) |
| $5,000 to $9,999 | 0 (0.0%) | 0 (0.0%) |
| $10,000 to $14,999 | 0 (0.0%) | 0 (0.0%) |
| $15,000 to $19,999 | 0 (0.0%) | 10 (13.7%) |
| $20,000 to $24,999 | 0 (0.0%) | 0 (0.0%) |
| $25,000 to $34,999 | 64 (55.2%) | 0 (0.0%) |
| $35,000 to $49,999 | 17 (14.7%) | 63 (86.3%) |
| $50,000 to $74,999 | 25 (21.5%) | 0 (0.0%) |
| $75,000 to $99,999 | 0 (0.0%) | 0 (0.0%) |
| $100,000 to $149,999 | 10 (8.6%) | 0 (0.0%) |
| $150,000 or more | 0 (0.0%) | 0 (0.0%) |
| Total | 116 (100.0%) | 73 (100.0%) |
Monthly Housing Cost Tiers in Sandy Level
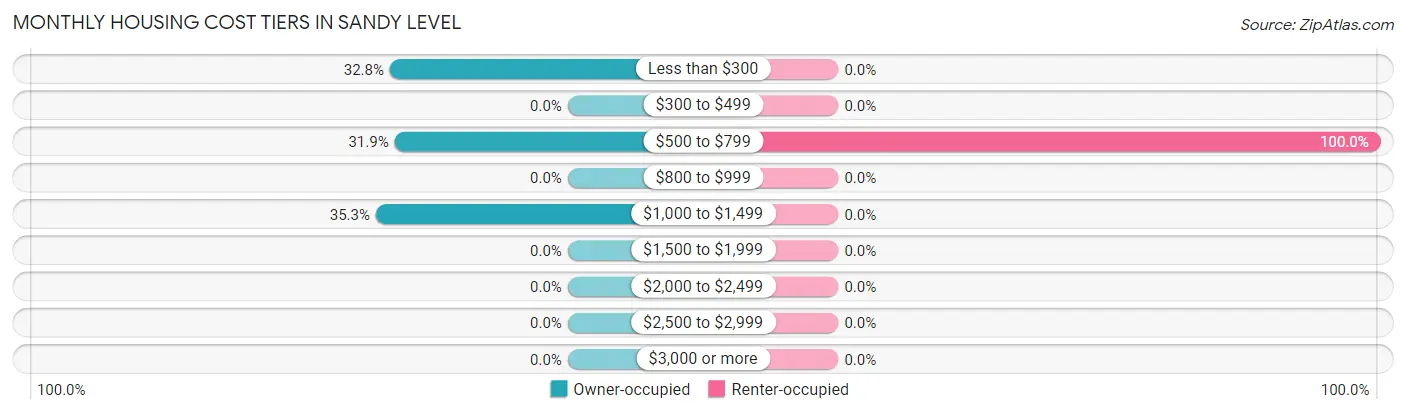
| Monthly Cost | Owner-occupied | Renter-occupied |
| Less than $300 | 38 (32.8%) | 0 (0.0%) |
| $300 to $499 | 0 (0.0%) | 0 (0.0%) |
| $500 to $799 | 37 (31.9%) | 73 (100.0%) |
| $800 to $999 | 0 (0.0%) | 0 (0.0%) |
| $1,000 to $1,499 | 41 (35.3%) | 0 (0.0%) |
| $1,500 to $1,999 | 0 (0.0%) | 0 (0.0%) |
| $2,000 to $2,499 | 0 (0.0%) | 0 (0.0%) |
| $2,500 to $2,999 | 0 (0.0%) | 0 (0.0%) |
| $3,000 or more | 0 (0.0%) | 0 (0.0%) |
| Total | 116 (100.0%) | 73 (100.0%) |
Physical Housing Characteristics in Sandy Level
Housing Structures in Sandy Level
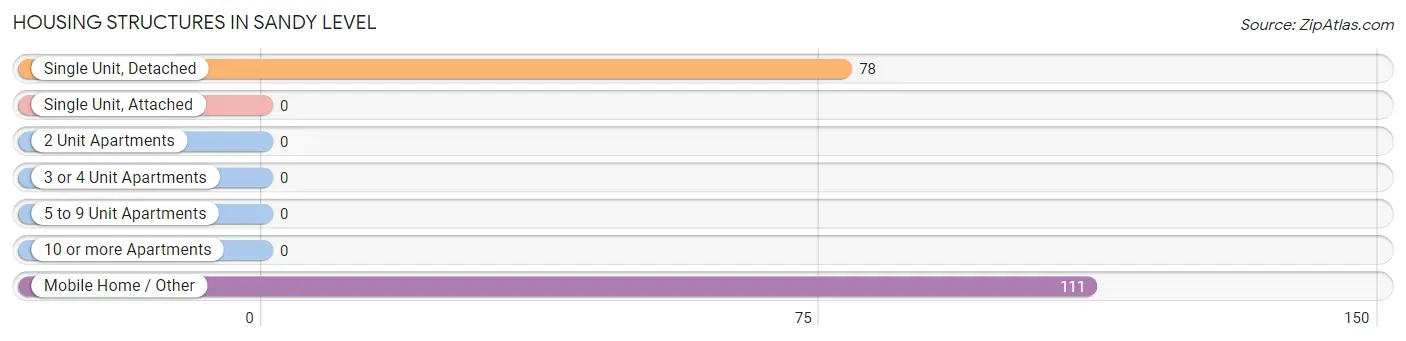
| Structure Type | # Housing Units | % Housing Units |
| Single Unit, Detached | 78 | 41.3% |
| Single Unit, Attached | 0 | 0.0% |
| 2 Unit Apartments | 0 | 0.0% |
| 3 or 4 Unit Apartments | 0 | 0.0% |
| 5 to 9 Unit Apartments | 0 | 0.0% |
| 10 or more Apartments | 0 | 0.0% |
| Mobile Home / Other | 111 | 58.7% |
| Total | 189 | 100.0% |
Housing Structures by Occupancy in Sandy Level
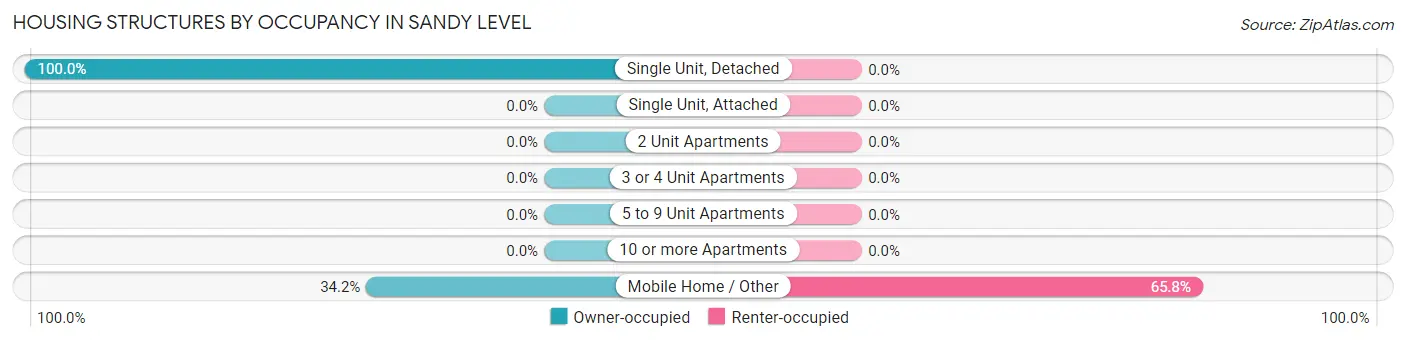
| Structure Type | Owner-occupied | Renter-occupied |
| Single Unit, Detached | 78 (100.0%) | 0 (0.0%) |
| Single Unit, Attached | 0 (0.0%) | 0 (0.0%) |
| 2 Unit Apartments | 0 (0.0%) | 0 (0.0%) |
| 3 or 4 Unit Apartments | 0 (0.0%) | 0 (0.0%) |
| 5 to 9 Unit Apartments | 0 (0.0%) | 0 (0.0%) |
| 10 or more Apartments | 0 (0.0%) | 0 (0.0%) |
| Mobile Home / Other | 38 (34.2%) | 73 (65.8%) |
| Total | 116 (61.4%) | 73 (38.6%) |
Housing Structures by Number of Rooms in Sandy Level
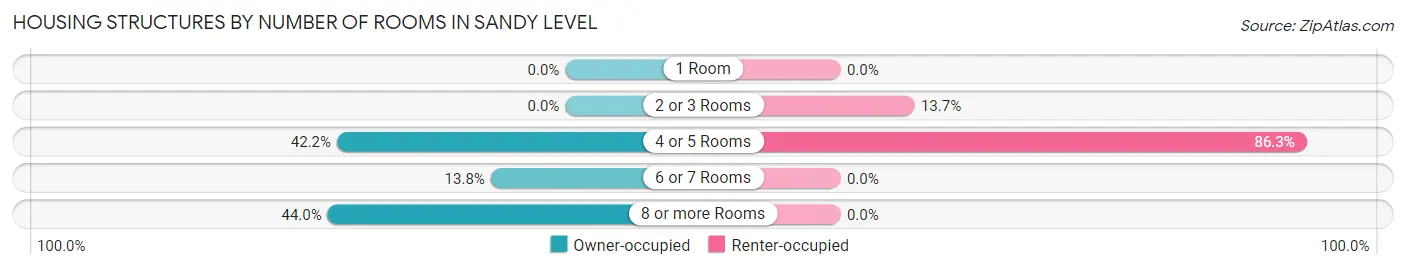
| Number of Rooms | Owner-occupied | Renter-occupied |
| 1 Room | 0 (0.0%) | 0 (0.0%) |
| 2 or 3 Rooms | 0 (0.0%) | 10 (13.7%) |
| 4 or 5 Rooms | 49 (42.2%) | 63 (86.3%) |
| 6 or 7 Rooms | 16 (13.8%) | 0 (0.0%) |
| 8 or more Rooms | 51 (44.0%) | 0 (0.0%) |
| Total | 116 (100.0%) | 73 (100.0%) |
Housing Structure by Heating Type in Sandy Level
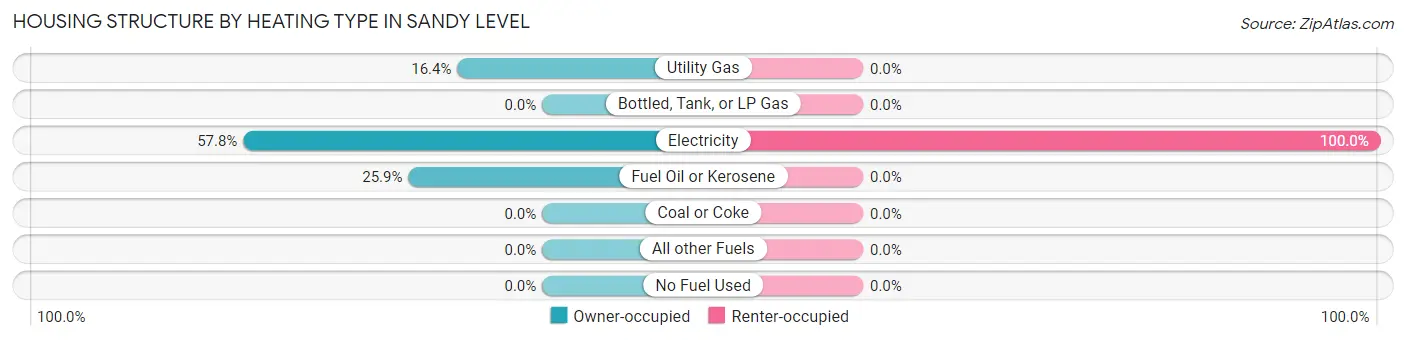
| Heating Type | Owner-occupied | Renter-occupied |
| Utility Gas | 19 (16.4%) | 0 (0.0%) |
| Bottled, Tank, or LP Gas | 0 (0.0%) | 0 (0.0%) |
| Electricity | 67 (57.8%) | 73 (100.0%) |
| Fuel Oil or Kerosene | 30 (25.9%) | 0 (0.0%) |
| Coal or Coke | 0 (0.0%) | 0 (0.0%) |
| All other Fuels | 0 (0.0%) | 0 (0.0%) |
| No Fuel Used | 0 (0.0%) | 0 (0.0%) |
| Total | 116 (100.0%) | 73 (100.0%) |
Household Vehicle Usage in Sandy Level
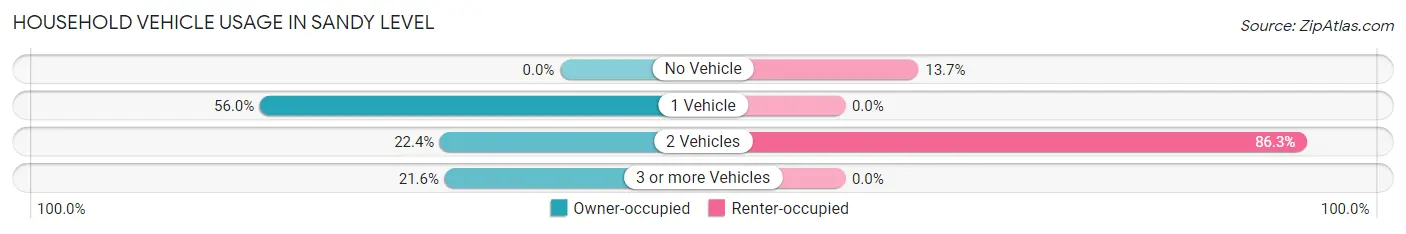
| Vehicles per Household | Owner-occupied | Renter-occupied |
| No Vehicle | 0 (0.0%) | 10 (13.7%) |
| 1 Vehicle | 65 (56.0%) | 0 (0.0%) |
| 2 Vehicles | 26 (22.4%) | 63 (86.3%) |
| 3 or more Vehicles | 25 (21.5%) | 0 (0.0%) |
| Total | 116 (100.0%) | 73 (100.0%) |
Real Estate & Mortgages in Sandy Level
Real Estate and Mortgage Overview in Sandy Level
| Characteristic | Without Mortgage | With Mortgage |
| Housing Units | 67 | 49 |
| Median Property Value | - | - |
| Median Household Income | $34,625 | $0 |
| Monthly Housing Costs | - | - |
| Real Estate Taxes | - | - |
Property Value by Mortgage Status in Sandy Level
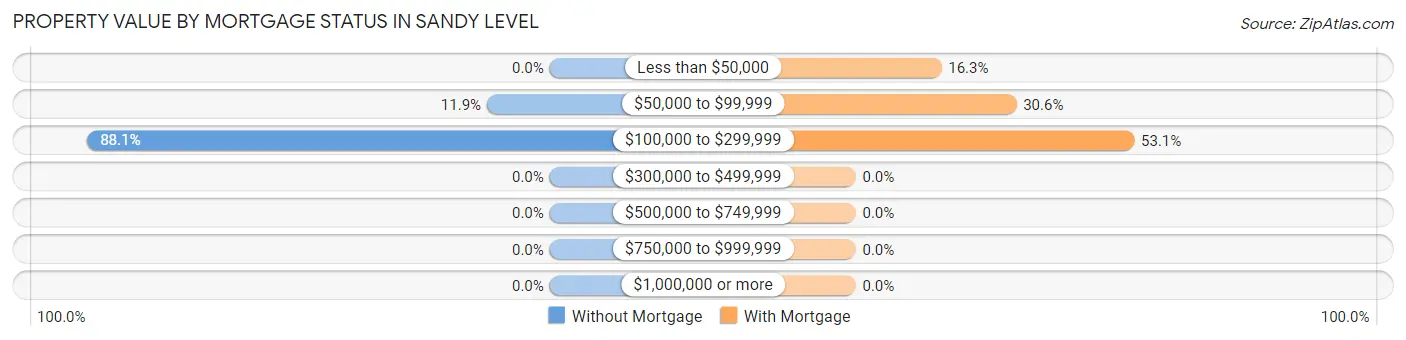
| Property Value | Without Mortgage | With Mortgage |
| Less than $50,000 | 0 (0.0%) | 8 (16.3%) |
| $50,000 to $99,999 | 8 (11.9%) | 15 (30.6%) |
| $100,000 to $299,999 | 59 (88.1%) | 26 (53.1%) |
| $300,000 to $499,999 | 0 (0.0%) | 0 (0.0%) |
| $500,000 to $749,999 | 0 (0.0%) | 0 (0.0%) |
| $750,000 to $999,999 | 0 (0.0%) | 0 (0.0%) |
| $1,000,000 or more | 0 (0.0%) | 0 (0.0%) |
| Total | 67 (100.0%) | 49 (100.0%) |
Household Income by Mortgage Status in Sandy Level
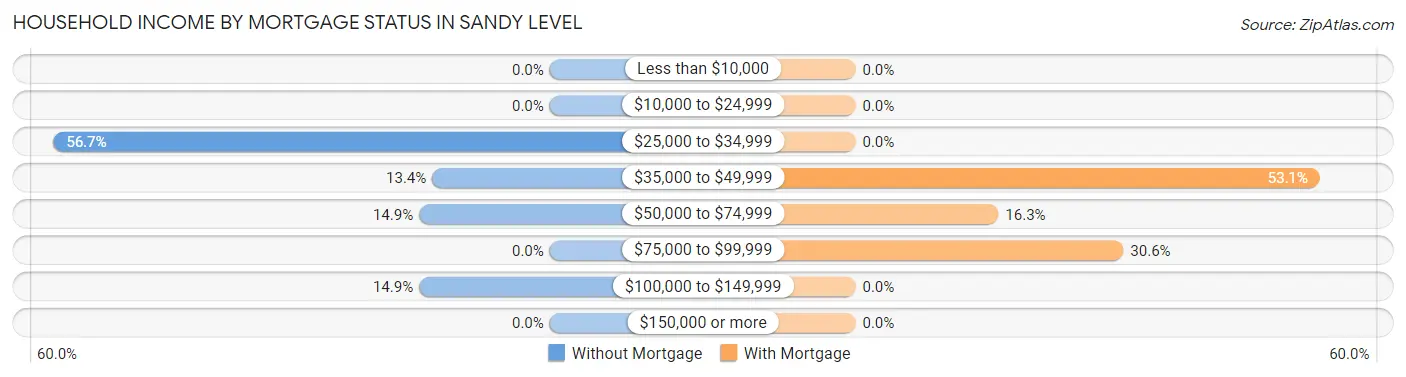
| Household Income | Without Mortgage | With Mortgage |
| Less than $10,000 | 0 (0.0%) | 0 (0.0%) |
| $10,000 to $24,999 | 0 (0.0%) | 0 (0.0%) |
| $25,000 to $34,999 | 38 (56.7%) | 0 (0.0%) |
| $35,000 to $49,999 | 9 (13.4%) | 26 (53.1%) |
| $50,000 to $74,999 | 10 (14.9%) | 8 (16.3%) |
| $75,000 to $99,999 | 0 (0.0%) | 15 (30.6%) |
| $100,000 to $149,999 | 10 (14.9%) | 0 (0.0%) |
| $150,000 or more | 0 (0.0%) | 0 (0.0%) |
| Total | 67 (100.0%) | 49 (100.0%) |
Property Value to Household Income Ratio in Sandy Level
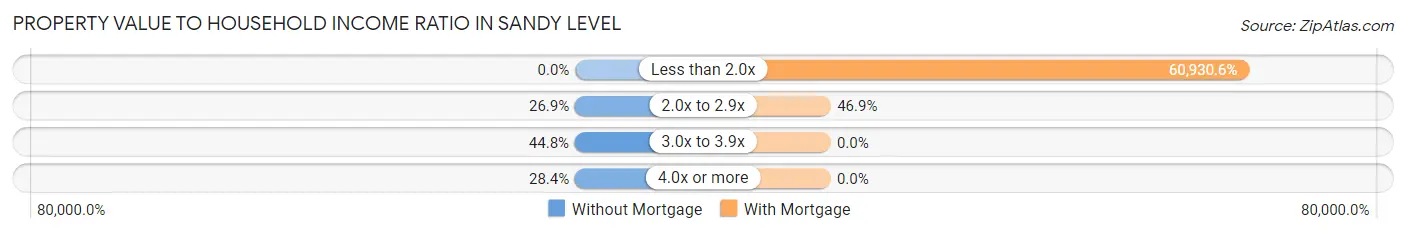
| Value-to-Income Ratio | Without Mortgage | With Mortgage |
| Less than 2.0x | 0 (0.0%) | 29,856 (60,930.6%) |
| 2.0x to 2.9x | 18 (26.9%) | 23 (46.9%) |
| 3.0x to 3.9x | 30 (44.8%) | 0 (0.0%) |
| 4.0x or more | 19 (28.4%) | 0 (0.0%) |
| Total | 67 (100.0%) | 49 (100.0%) |
Real Estate Taxes by Mortgage Status in Sandy Level
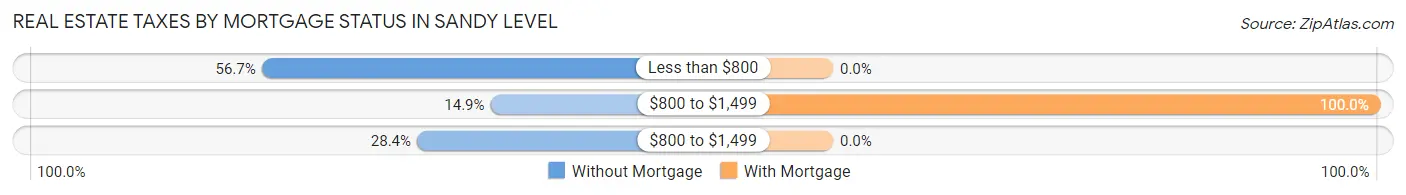
| Property Taxes | Without Mortgage | With Mortgage |
| Less than $800 | 38 (56.7%) | 0 (0.0%) |
| $800 to $1,499 | 10 (14.9%) | 49 (100.0%) |
| $800 to $1,499 | 19 (28.4%) | 0 (0.0%) |
| Total | 67 (100.0%) | 49 (100.0%) |
Health & Disability in Sandy Level
Health Insurance Coverage by Age in Sandy Level
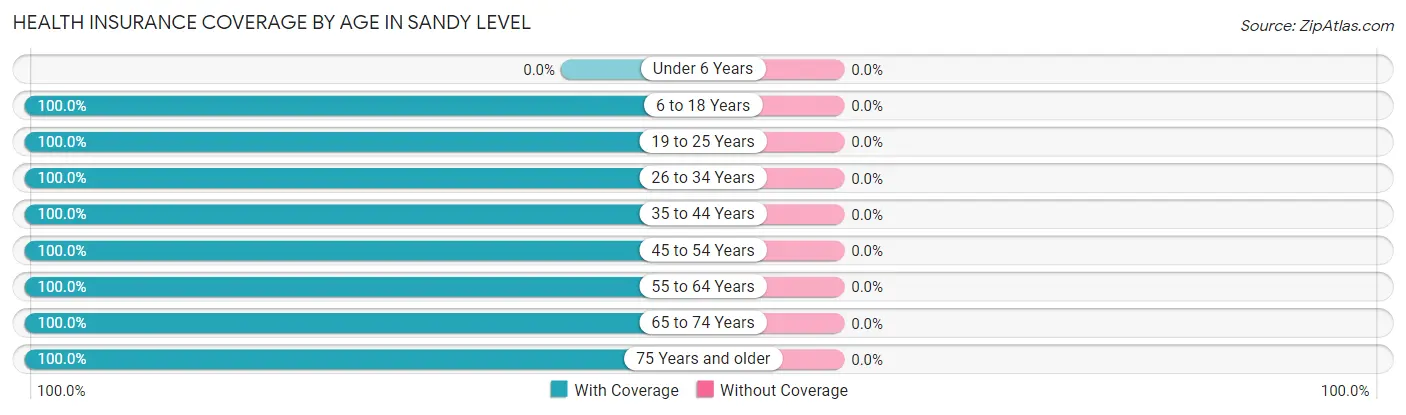
| Age Bracket | With Coverage | Without Coverage |
| Under 6 Years | 0 (0.0%) | 0 (0.0%) |
| 6 to 18 Years | 122 (100.0%) | 0 (0.0%) |
| 19 to 25 Years | 10 (100.0%) | 0 (0.0%) |
| 26 to 34 Years | 97 (100.0%) | 0 (0.0%) |
| 35 to 44 Years | 169 (100.0%) | 0 (0.0%) |
| 45 to 54 Years | 50 (100.0%) | 0 (0.0%) |
| 55 to 64 Years | 10 (100.0%) | 0 (0.0%) |
| 65 to 74 Years | 56 (100.0%) | 0 (0.0%) |
| 75 Years and older | 107 (100.0%) | 0 (0.0%) |
| Total | 621 (100.0%) | 0 (0.0%) |
Health Insurance Coverage by Citizenship Status in Sandy Level
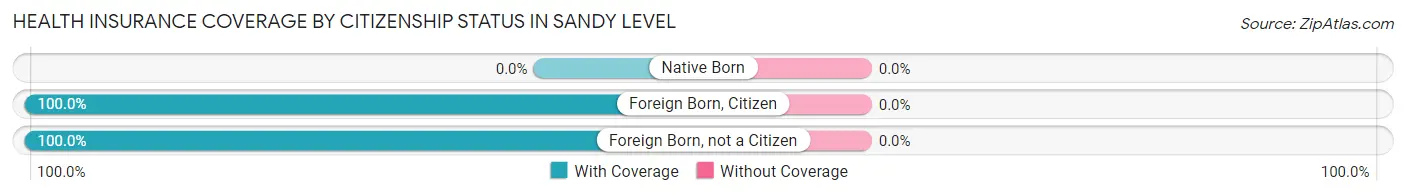
| Citizenship Status | With Coverage | Without Coverage |
| Native Born | 0 (0.0%) | 0 (0.0%) |
| Foreign Born, Citizen | 122 (100.0%) | 0 (0.0%) |
| Foreign Born, not a Citizen | 10 (100.0%) | 0 (0.0%) |
Health Insurance Coverage by Household Income in Sandy Level
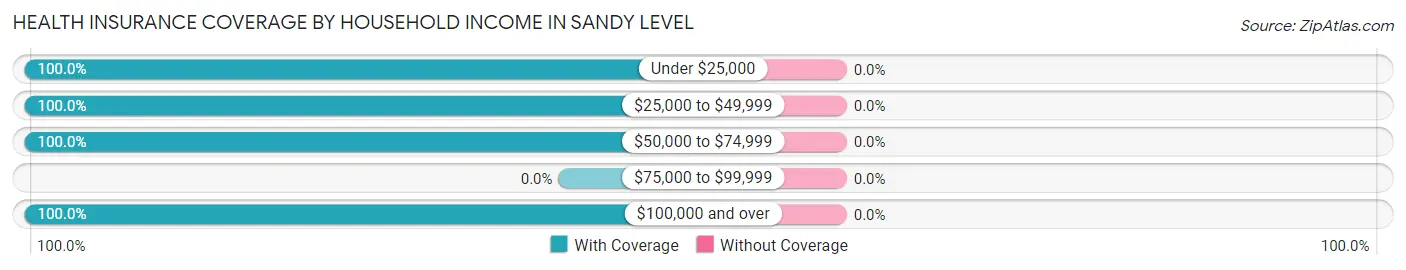
| Household Income | With Coverage | Without Coverage |
| Under $25,000 | 10 (100.0%) | 0 (0.0%) |
| $25,000 to $49,999 | 517 (100.0%) | 0 (0.0%) |
| $50,000 to $74,999 | 73 (100.0%) | 0 (0.0%) |
| $75,000 to $99,999 | 0 (0.0%) | 0 (0.0%) |
| $100,000 and over | 21 (100.0%) | 0 (0.0%) |
Public vs Private Health Insurance Coverage by Age in Sandy Level
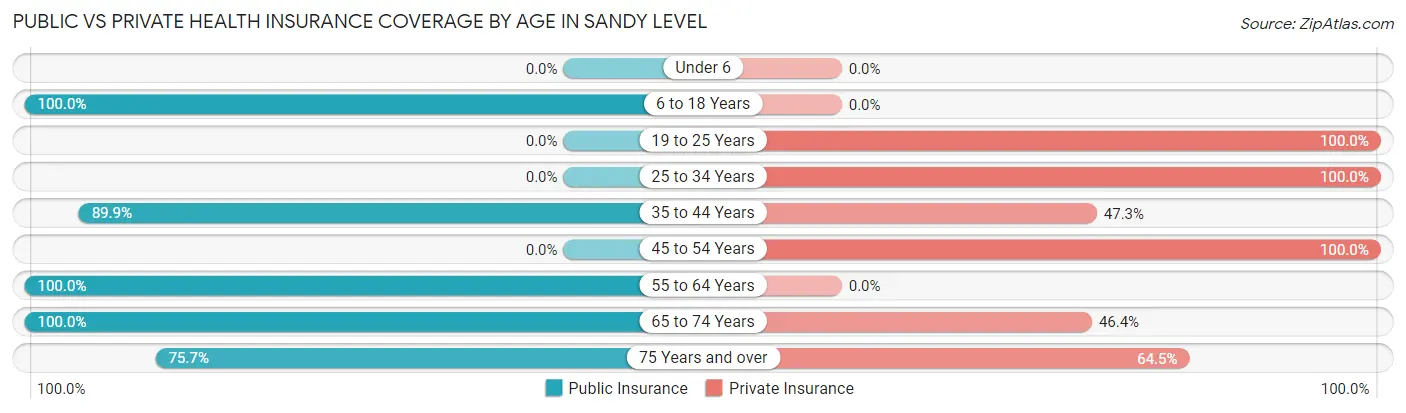
| Age Bracket | Public Insurance | Private Insurance |
| Under 6 | 0 (0.0%) | 0 (0.0%) |
| 6 to 18 Years | 122 (100.0%) | 0 (0.0%) |
| 19 to 25 Years | 0 (0.0%) | 10 (100.0%) |
| 25 to 34 Years | 0 (0.0%) | 97 (100.0%) |
| 35 to 44 Years | 152 (89.9%) | 80 (47.3%) |
| 45 to 54 Years | 0 (0.0%) | 50 (100.0%) |
| 55 to 64 Years | 10 (100.0%) | 0 (0.0%) |
| 65 to 74 Years | 56 (100.0%) | 26 (46.4%) |
| 75 Years and over | 81 (75.7%) | 69 (64.5%) |
| Total | 421 (67.8%) | 332 (53.5%) |
Disability Status by Sex by Age in Sandy Level
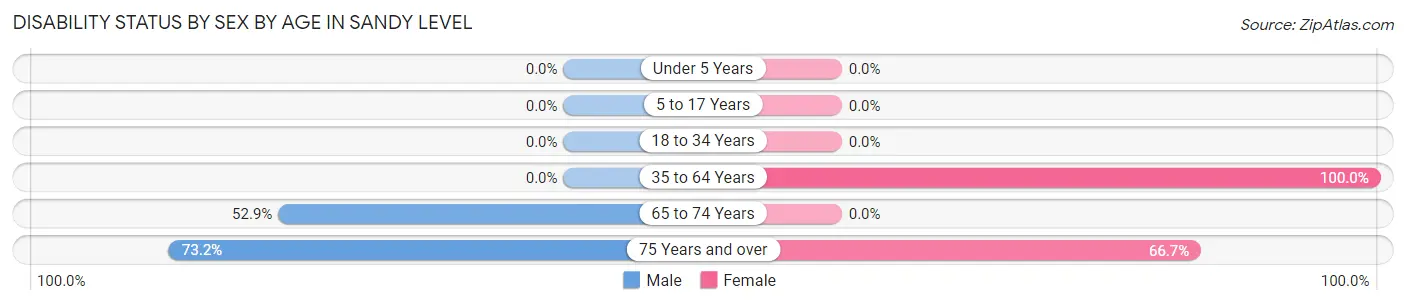
| Age Bracket | Male | Female |
| Under 5 Years | 0 (0.0%) | 0 (0.0%) |
| 5 to 17 Years | 0 (0.0%) | 0 (0.0%) |
| 18 to 34 Years | 0 (0.0%) | 0 (0.0%) |
| 35 to 64 Years | 0 (0.0%) | 99 (100.0%) |
| 65 to 74 Years | 18 (52.9%) | 0 (0.0%) |
| 75 Years and over | 41 (73.2%) | 34 (66.7%) |
Disability Class by Sex by Age in Sandy Level
Disability Class: Hearing Difficulty
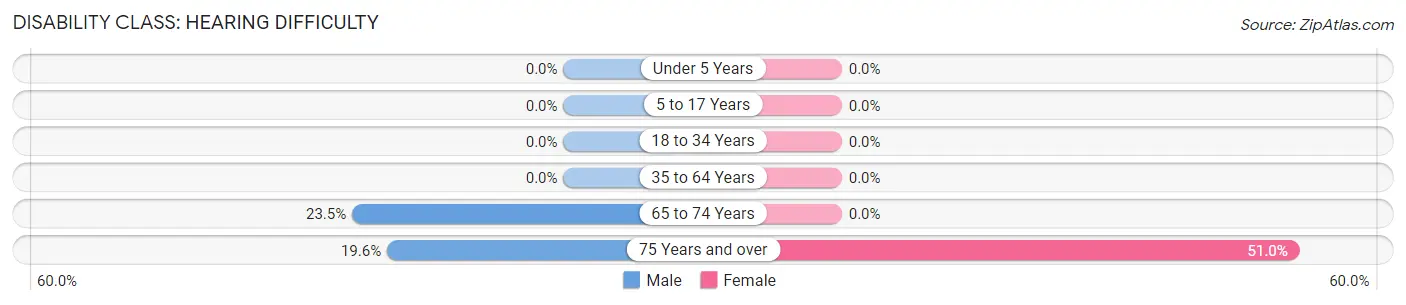
| Age Bracket | Male | Female |
| Under 5 Years | 0 (0.0%) | 0 (0.0%) |
| 5 to 17 Years | 0 (0.0%) | 0 (0.0%) |
| 18 to 34 Years | 0 (0.0%) | 0 (0.0%) |
| 35 to 64 Years | 0 (0.0%) | 0 (0.0%) |
| 65 to 74 Years | 8 (23.5%) | 0 (0.0%) |
| 75 Years and over | 11 (19.6%) | 26 (51.0%) |
Disability Class: Vision Difficulty
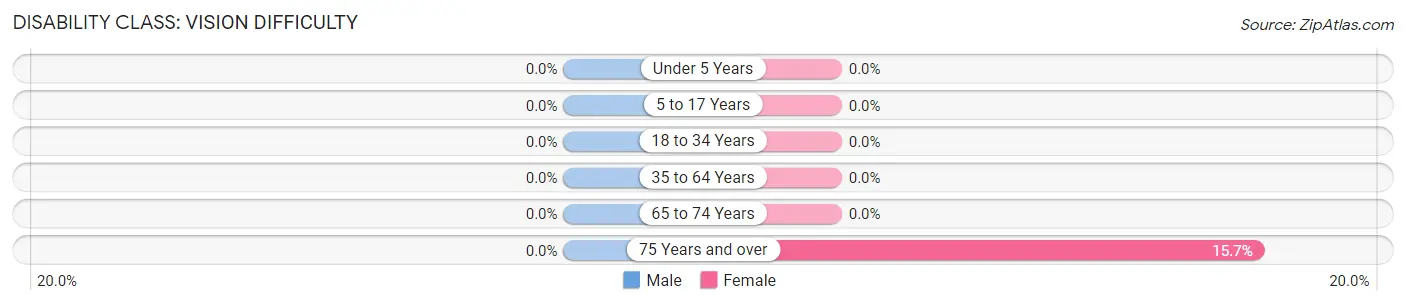
| Age Bracket | Male | Female |
| Under 5 Years | 0 (0.0%) | 0 (0.0%) |
| 5 to 17 Years | 0 (0.0%) | 0 (0.0%) |
| 18 to 34 Years | 0 (0.0%) | 0 (0.0%) |
| 35 to 64 Years | 0 (0.0%) | 0 (0.0%) |
| 65 to 74 Years | 0 (0.0%) | 0 (0.0%) |
| 75 Years and over | 0 (0.0%) | 8 (15.7%) |
Disability Class: Cognitive Difficulty
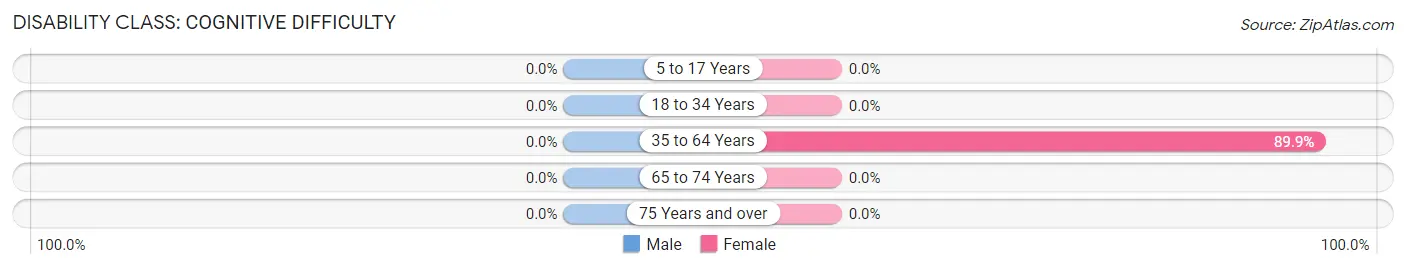
| Age Bracket | Male | Female |
| 5 to 17 Years | 0 (0.0%) | 0 (0.0%) |
| 18 to 34 Years | 0 (0.0%) | 0 (0.0%) |
| 35 to 64 Years | 0 (0.0%) | 89 (89.9%) |
| 65 to 74 Years | 0 (0.0%) | 0 (0.0%) |
| 75 Years and over | 0 (0.0%) | 0 (0.0%) |
Disability Class: Ambulatory Difficulty
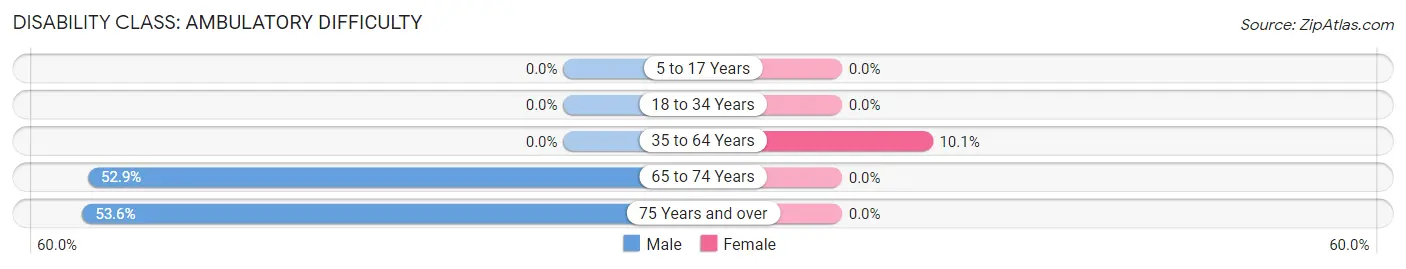
| Age Bracket | Male | Female |
| 5 to 17 Years | 0 (0.0%) | 0 (0.0%) |
| 18 to 34 Years | 0 (0.0%) | 0 (0.0%) |
| 35 to 64 Years | 0 (0.0%) | 10 (10.1%) |
| 65 to 74 Years | 18 (52.9%) | 0 (0.0%) |
| 75 Years and over | 30 (53.6%) | 0 (0.0%) |
Disability Class: Self-Care Difficulty
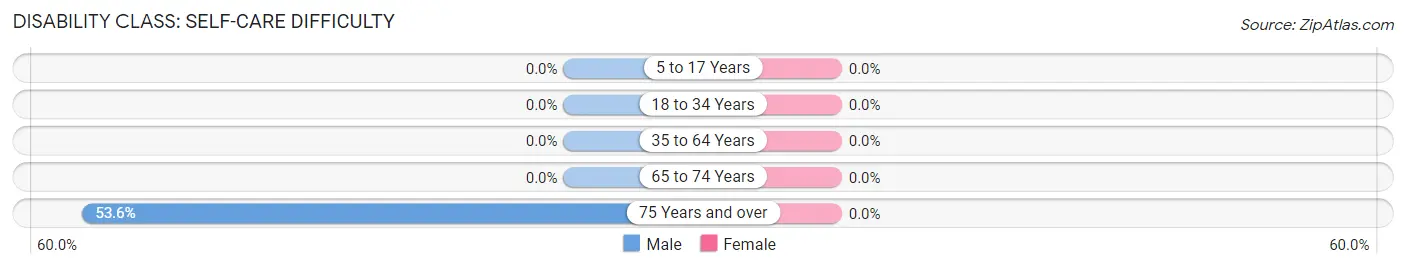
| Age Bracket | Male | Female |
| 5 to 17 Years | 0 (0.0%) | 0 (0.0%) |
| 18 to 34 Years | 0 (0.0%) | 0 (0.0%) |
| 35 to 64 Years | 0 (0.0%) | 0 (0.0%) |
| 65 to 74 Years | 0 (0.0%) | 0 (0.0%) |
| 75 Years and over | 30 (53.6%) | 0 (0.0%) |
Technology Access in Sandy Level
Computing Device Access in Sandy Level
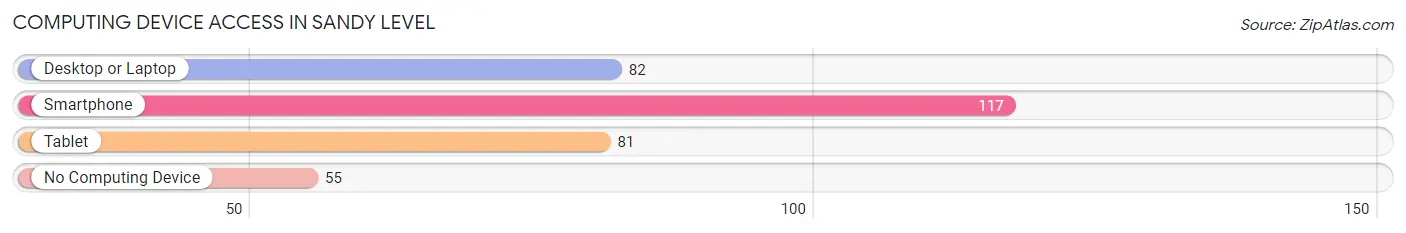
| Device Type | # Households | % Households |
| Desktop or Laptop | 82 | 43.4% |
| Smartphone | 117 | 61.9% |
| Tablet | 81 | 42.9% |
| No Computing Device | 55 | 29.1% |
| Total | 189 | 100.0% |
Internet Access in Sandy Level
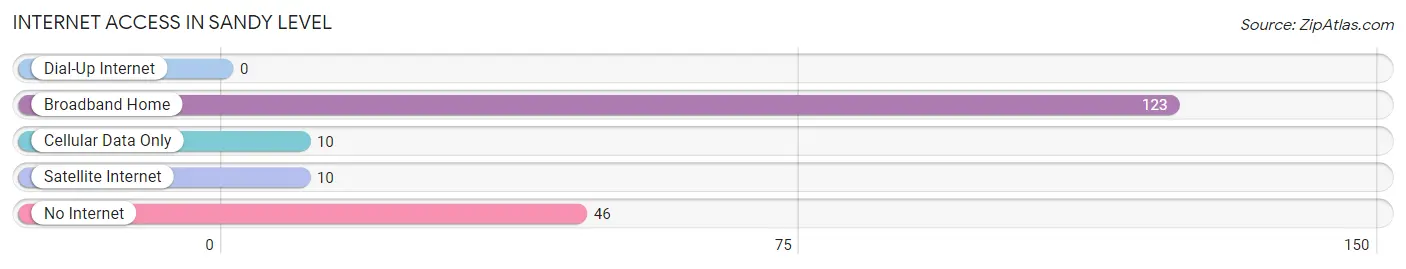
| Internet Type | # Households | % Households |
| Dial-Up Internet | 0 | 0.0% |
| Broadband Home | 123 | 65.1% |
| Cellular Data Only | 10 | 5.3% |
| Satellite Internet | 10 | 5.3% |
| No Internet | 46 | 24.3% |
| Total | 189 | 100.0% |
Sandy Level Summary
Sandy Level is an unincorporated community located in Pittsylvania County, Virginia. It is situated in the foothills of the Blue Ridge Mountains, approximately 20 miles south of the city of Lynchburg. The community is home to a population of approximately 1,000 people, and is known for its rural charm and close-knit community.
History
Sandy Level was first settled in the late 1700s by a group of settlers from Pennsylvania. The community was originally known as “Sandy Level Crossroads” due to its location at the intersection of two major roads. The community was officially established in 1820, and the first post office was established in 1821.
The community was named after the sandy soil in the area, which was ideal for farming. The area was also known for its abundance of timber, which was used to build homes and other structures.
In the late 1800s, the community began to grow and prosper. The railroad was extended to Sandy Level in 1887, and the town was incorporated in 1890. The town was home to several businesses, including a general store, a blacksmith shop, a grist mill, and a sawmill.
Geography
Sandy Level is located in the foothills of the Blue Ridge Mountains in Pittsylvania County, Virginia. The community is situated at an elevation of 1,000 feet above sea level. The area is characterized by rolling hills and valleys, and is home to a variety of wildlife, including deer, turkey, and bear.
The climate in Sandy Level is humid subtropical, with hot, humid summers and mild winters. The average annual temperature is around 60 degrees Fahrenheit, and the average annual precipitation is around 40 inches.
Economy
The economy of Sandy Level is largely based on agriculture. The area is home to several farms, which produce a variety of crops, including corn, soybeans, wheat, and hay. The area is also home to several small businesses, including a general store, a hardware store, and a restaurant.
Demographics
As of the 2010 census, the population of Sandy Level was 1,000 people. The racial makeup of the community was 97.2% White, 0.7% African American, 0.3% Native American, 0.2% Asian, and 1.6% from other races. The median household income was $37,500, and the median home value was $125,000.
Conclusion
Sandy Level is a small, rural community located in Pittsylvania County, Virginia. The community is known for its rural charm and close-knit community, and is home to a population of approximately 1,000 people. The economy of Sandy Level is largely based on agriculture, and the area is home to several small businesses. The racial makeup of the community is predominantly White, with a small percentage of African American, Native American, and Asian residents.
Common Questions
What is Per Capita Income in Sandy Level?
Per Capita income in Sandy Level is $13,481.
What is the Median Family Income in Sandy Level?
Median Family Income in Sandy Level is $38,380.
What is the Median Household income in Sandy Level?
Median Household Income in Sandy Level is $37,905.
What is Inequality or Gini Index in Sandy Level?
Inequality or Gini Index in Sandy Level is 0.20.
What is the Total Population of Sandy Level?
Total Population of Sandy Level is 621.
What is the Total Male Population of Sandy Level?
Total Male Population of Sandy Level is 403.
What is the Total Female Population of Sandy Level?
Total Female Population of Sandy Level is 218.
What is the Ratio of Males per 100 Females in Sandy Level?
There are 184.86 Males per 100 Females in Sandy Level.
What is the Ratio of Females per 100 Males in Sandy Level?
There are 54.09 Females per 100 Males in Sandy Level.
What is the Median Population Age in Sandy Level?
Median Population Age in Sandy Level is 36.9 Years.
What is the Average Family Size in Sandy Level
Average Family Size in Sandy Level is 3.7 People.
What is the Average Household Size in Sandy Level
Average Household Size in Sandy Level is 3.3 People.
How Large is the Labor Force in Sandy Level?
There are 208 People in the Labor Forcein in Sandy Level.
What is the Percentage of People in the Labor Force in Sandy Level?
41.7% of People are in the Labor Force in Sandy Level.