Callaghan, VA Map & Demographics
Callaghan Map
Callaghan Overview
$42,332
PER CAPITA INCOME
$105,536
AVG FAMILY INCOME
$101,111
AVG HOUSEHOLD INCOME
0.41
INEQUALITY / GINI INDEX
317
TOTAL POPULATION
226
MALE POPULATION
91
FEMALE POPULATION
248.35
MALES / 100 FEMALES
40.27
FEMALES / 100 MALES
48.4
MEDIAN AGE
2.5
AVG FAMILY SIZE
2.4
AVG HOUSEHOLD SIZE
210
LABOR FORCE [ PEOPLE ]
66.2%
PERCENT IN LABOR FORCE
1.4%
UNEMPLOYMENT RATE
Income in Callaghan
Income Overview in Callaghan
Per Capita Income in Callaghan is $42,332, while median incomes of families and households are $105,536 and $101,111 respectively.
| Characteristic | Number | Measure |
| Per Capita Income | 317 | $42,332 |
| Median Family Income | 85 | $105,536 |
| Mean Family Income | 85 | $139,792 |
| Median Household Income | 98 | $101,111 |
| Mean Household Income | 98 | $128,378 |
| Income Deficit | 85 | $0 |
| Wage / Income Gap (%) | 317 | 0.00% |
| Wage / Income Gap ($) | 317 | 100.00¢ per $1 |
| Gini / Inequality Index | 317 | 0.41 |
Earnings by Sex in Callaghan
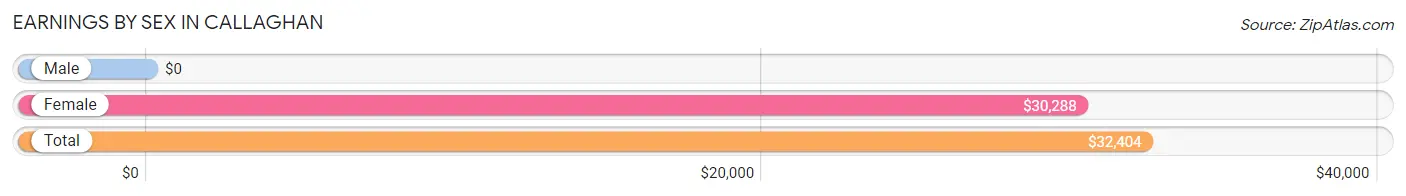
| Sex | Number | Average Earnings |
| Male | 130 (60.5%) | $0 |
| Female | 85 (39.5%) | $30,288 |
| Total | 215 (100.0%) | $32,404 |
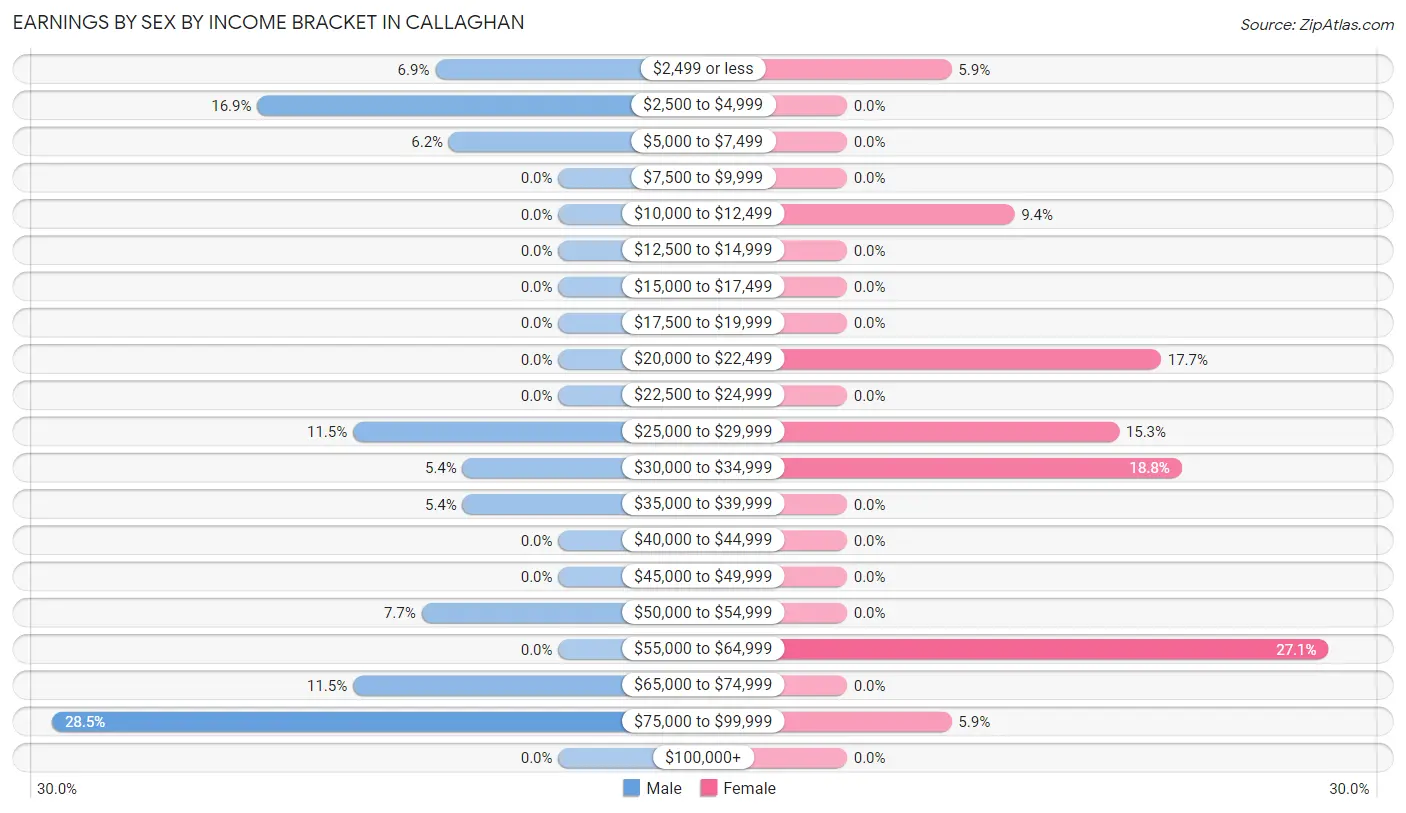
Earnings by Sex by Income Bracket in Callaghan
The most common earnings brackets in Callaghan are $75,000 to $99,999 for men (37 | 28.5%) and $55,000 to $64,999 for women (23 | 27.1%).
| Income | Male | Female |
| $2,499 or less | 9 (6.9%) | 5 (5.9%) |
| $2,500 to $4,999 | 22 (16.9%) | 0 (0.0%) |
| $5,000 to $7,499 | 8 (6.1%) | 0 (0.0%) |
| $7,500 to $9,999 | 0 (0.0%) | 0 (0.0%) |
| $10,000 to $12,499 | 0 (0.0%) | 8 (9.4%) |
| $12,500 to $14,999 | 0 (0.0%) | 0 (0.0%) |
| $15,000 to $17,499 | 0 (0.0%) | 0 (0.0%) |
| $17,500 to $19,999 | 0 (0.0%) | 0 (0.0%) |
| $20,000 to $22,499 | 0 (0.0%) | 15 (17.6%) |
| $22,500 to $24,999 | 0 (0.0%) | 0 (0.0%) |
| $25,000 to $29,999 | 15 (11.5%) | 13 (15.3%) |
| $30,000 to $34,999 | 7 (5.4%) | 16 (18.8%) |
| $35,000 to $39,999 | 7 (5.4%) | 0 (0.0%) |
| $40,000 to $44,999 | 0 (0.0%) | 0 (0.0%) |
| $45,000 to $49,999 | 0 (0.0%) | 0 (0.0%) |
| $50,000 to $54,999 | 10 (7.7%) | 0 (0.0%) |
| $55,000 to $64,999 | 0 (0.0%) | 23 (27.1%) |
| $65,000 to $74,999 | 15 (11.5%) | 0 (0.0%) |
| $75,000 to $99,999 | 37 (28.5%) | 5 (5.9%) |
| $100,000+ | 0 (0.0%) | 0 (0.0%) |
| Total | 130 (100.0%) | 85 (100.0%) |
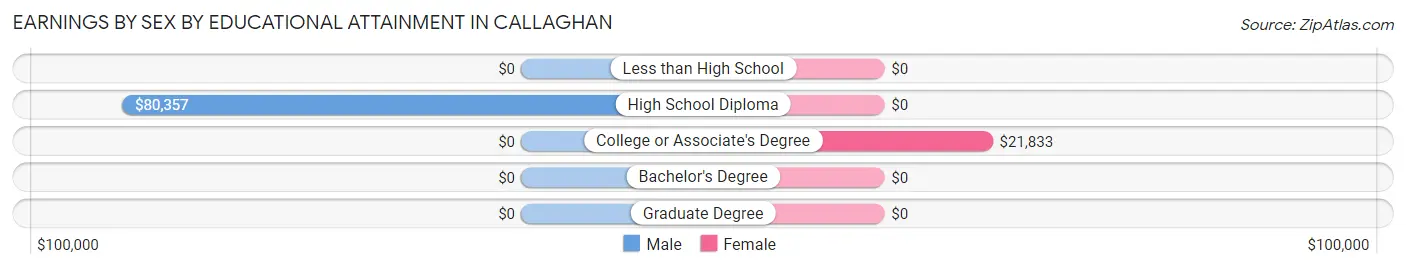
Earnings by Sex by Educational Attainment in Callaghan
Average earnings in Callaghan are $68,542 for men and $30,288 for women, a difference of 55.8%. Men with an educational attainment of high school diploma enjoy the highest average annual earnings of $80,357, while those with high school diploma education earn the least with $80,357. Women with an educational attainment of college or associate's degree earn the most with the average annual earnings of $21,833, while those with college or associate's degree education have the smallest earnings of $21,833.
| Educational Attainment | Male Income | Female Income |
| Less than High School | - | - |
| High School Diploma | $80,357 | $0 |
| College or Associate's Degree | - | - |
| Bachelor's Degree | - | - |
| Graduate Degree | - | - |
| Total | $68,542 | $30,288 |
Family Income in Callaghan
Family Income Brackets in Callaghan
According to the Callaghan family income data, there are 50 families falling into the $100,000 to $149,999 income range, which is the most common income bracket and makes up 58.8% of all families.
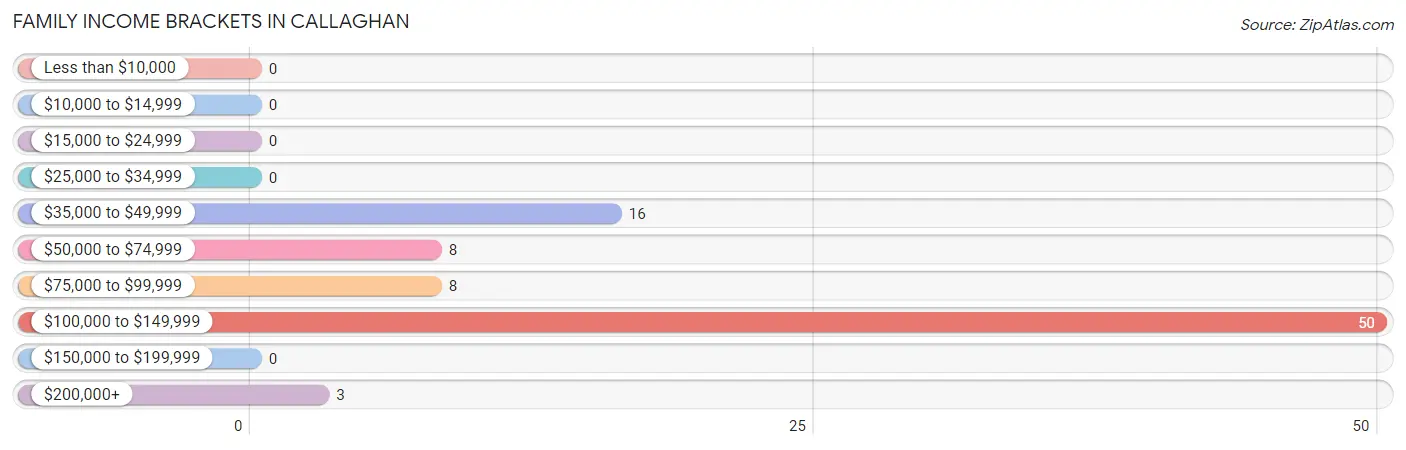
| Income Bracket | # Families | % Families |
| Less than $10,000 | 0 | 0.0% |
| $10,000 to $14,999 | 0 | 0.0% |
| $15,000 to $24,999 | 0 | 0.0% |
| $25,000 to $34,999 | 0 | 0.0% |
| $35,000 to $49,999 | 16 | 18.8% |
| $50,000 to $74,999 | 8 | 9.4% |
| $75,000 to $99,999 | 8 | 9.4% |
| $100,000 to $149,999 | 50 | 58.8% |
| $150,000 to $199,999 | 0 | 0.0% |
| $200,000+ | 3 | 3.5% |
Family Income by Famaliy Size in Callaghan
2-person families (57 | 67.1%) account for the highest median family income in Callaghan with $96,406 per family, while 2-person families (57 | 67.1%) have the highest median income of $48,203 per family member.
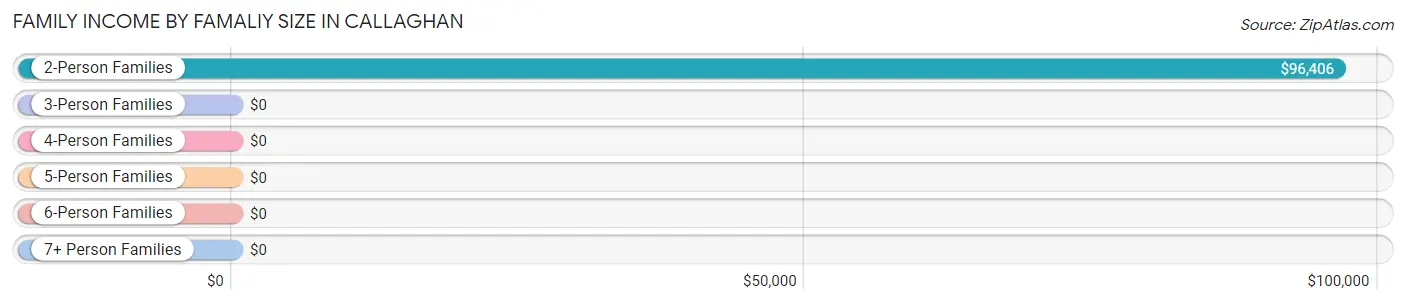
| Income Bracket | # Families | Median Income |
| 2-Person Families | 57 (67.1%) | $96,406 |
| 3-Person Families | 28 (32.9%) | $0 |
| 4-Person Families | 0 (0.0%) | $0 |
| 5-Person Families | 0 (0.0%) | $0 |
| 6-Person Families | 0 (0.0%) | $0 |
| 7+ Person Families | 0 (0.0%) | $0 |
| Total | 85 (100.0%) | $105,536 |
Family Income by Number of Earners in Callaghan
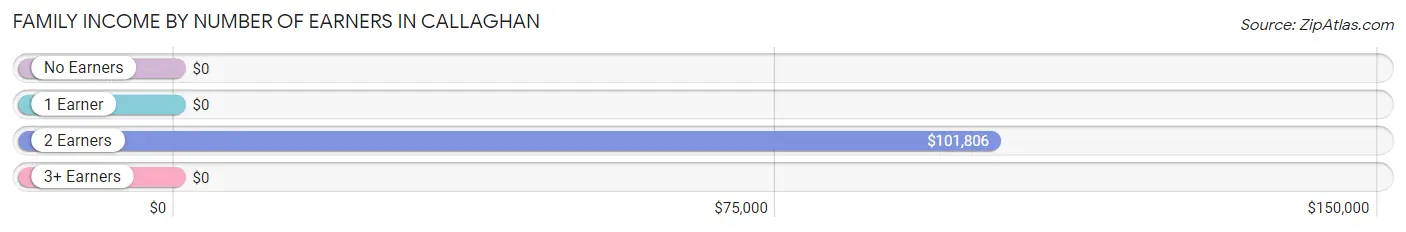
| Number of Earners | # Families | Median Income |
| No Earners | 4 (4.7%) | $0 |
| 1 Earner | 5 (5.9%) | $0 |
| 2 Earners | 69 (81.2%) | $101,806 |
| 3+ Earners | 7 (8.2%) | $0 |
| Total | 85 (100.0%) | $105,536 |
Household Income in Callaghan
Household Income Brackets in Callaghan
With 50 households falling in the category, the $100,000 to $149,999 income range is the most frequent in Callaghan, accounting for 51.0% of all households.
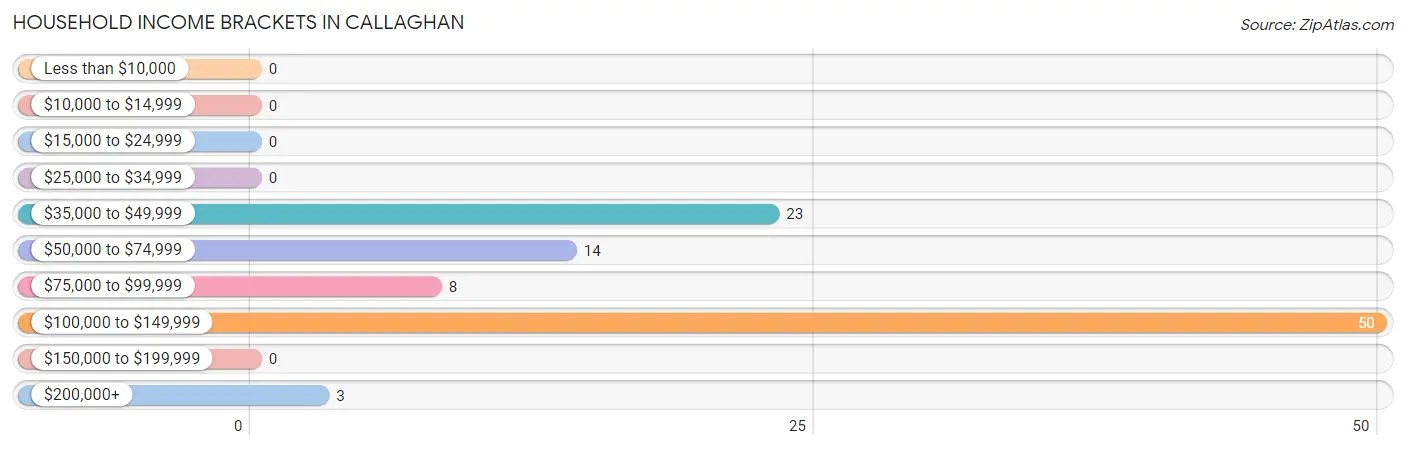
| Income Bracket | # Households | % Households |
| Less than $10,000 | 0 | 0.0% |
| $10,000 to $14,999 | 0 | 0.0% |
| $15,000 to $24,999 | 0 | 0.0% |
| $25,000 to $34,999 | 0 | 0.0% |
| $35,000 to $49,999 | 23 | 23.5% |
| $50,000 to $74,999 | 14 | 14.3% |
| $75,000 to $99,999 | 8 | 8.2% |
| $100,000 to $149,999 | 50 | 51.0% |
| $150,000 to $199,999 | 0 | 0.0% |
| $200,000+ | 3 | 3.1% |
Household Income by Householder Age in Callaghan
The median household income in Callaghan is $101,111, with the highest median household income of $102,083 found in the 45 to 64 years age bracket for the primary householder. A total of 85 households (86.7%) fall into this category.
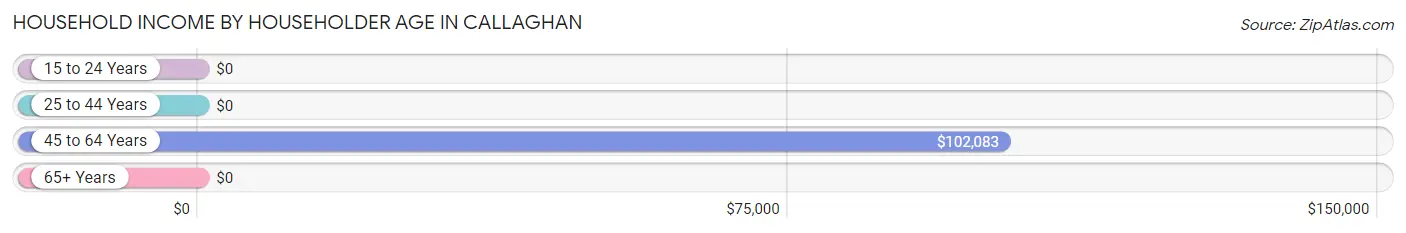
| Income Bracket | # Households | Median Income |
| 15 to 24 Years | 0 (0.0%) | $0 |
| 25 to 44 Years | 6 (6.1%) | $0 |
| 45 to 64 Years | 85 (86.7%) | $102,083 |
| 65+ Years | 7 (7.1%) | $0 |
| Total | 98 (100.0%) | $101,111 |
Poverty in Callaghan
Income Below Poverty by Sex and Age in Callaghan
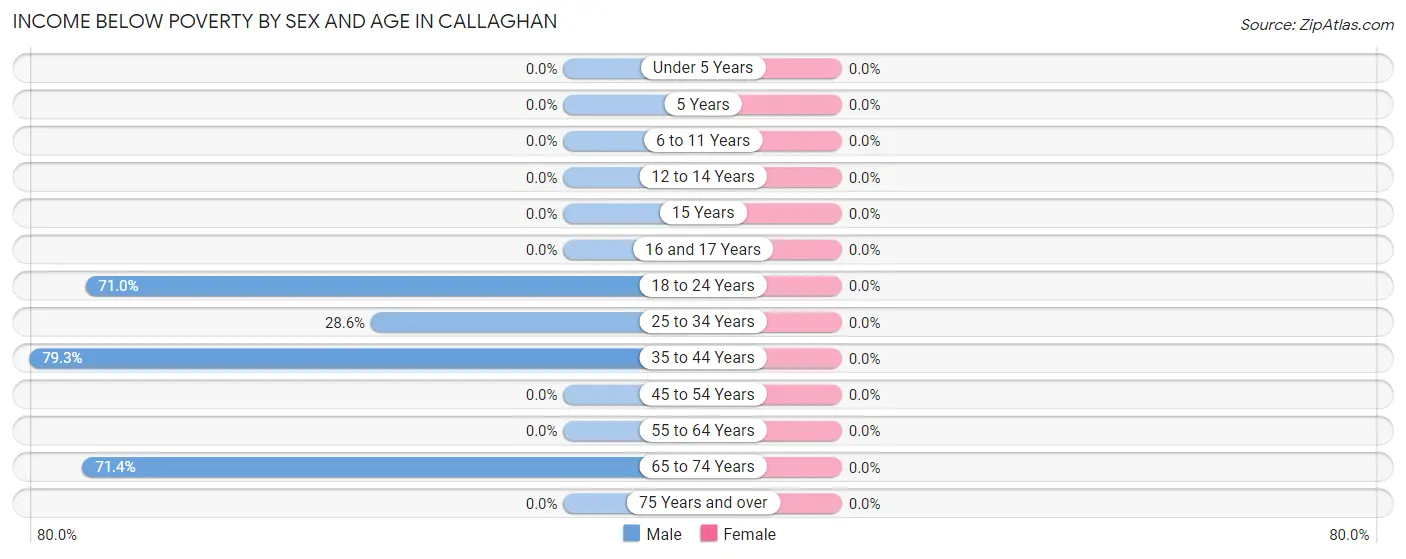
| Age Bracket | Male | Female |
| Under 5 Years | 0 (0.0%) | 0 (0.0%) |
| 5 Years | 0 (0.0%) | 0 (0.0%) |
| 6 to 11 Years | 0 (0.0%) | 0 (0.0%) |
| 12 to 14 Years | 0 (0.0%) | 0 (0.0%) |
| 15 Years | 0 (0.0%) | 0 (0.0%) |
| 16 and 17 Years | 0 (0.0%) | 0 (0.0%) |
| 18 to 24 Years | 22 (71.0%) | 0 (0.0%) |
| 25 to 34 Years | 8 (28.6%) | 0 (0.0%) |
| 35 to 44 Years | 23 (79.3%) | 0 (0.0%) |
| 45 to 54 Years | 0 (0.0%) | 0 (0.0%) |
| 55 to 64 Years | 0 (0.0%) | 0 (0.0%) |
| 65 to 74 Years | 20 (71.4%) | 0 (0.0%) |
| 75 Years and over | 0 (0.0%) | 0 (0.0%) |
| Total | 73 (32.3%) | 0 (0.0%) |
Income Above Poverty by Sex and Age in Callaghan
According to the poverty statistics in Callaghan, males aged 16 and 17 years and females aged 25 to 34 years are the age groups that are most secure financially, with 100.0% of males and 100.0% of females in these age groups living above the poverty line.
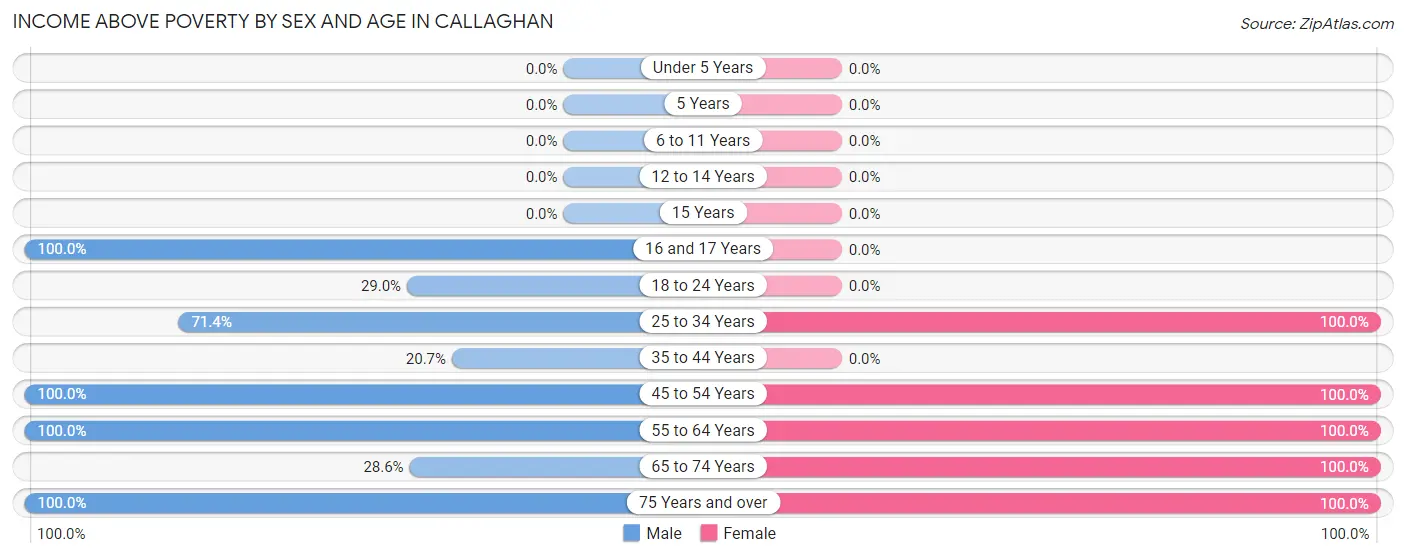
| Age Bracket | Male | Female |
| Under 5 Years | 0 (0.0%) | 0 (0.0%) |
| 5 Years | 0 (0.0%) | 0 (0.0%) |
| 6 to 11 Years | 0 (0.0%) | 0 (0.0%) |
| 12 to 14 Years | 0 (0.0%) | 0 (0.0%) |
| 15 Years | 0 (0.0%) | 0 (0.0%) |
| 16 and 17 Years | 24 (100.0%) | 0 (0.0%) |
| 18 to 24 Years | 9 (29.0%) | 0 (0.0%) |
| 25 to 34 Years | 20 (71.4%) | 8 (100.0%) |
| 35 to 44 Years | 6 (20.7%) | 0 (0.0%) |
| 45 to 54 Years | 28 (100.0%) | 29 (100.0%) |
| 55 to 64 Years | 57 (100.0%) | 40 (100.0%) |
| 65 to 74 Years | 8 (28.6%) | 9 (100.0%) |
| 75 Years and over | 1 (100.0%) | 5 (100.0%) |
| Total | 153 (67.7%) | 91 (100.0%) |
Income Below Poverty Among Married-Couple Families in Callaghan
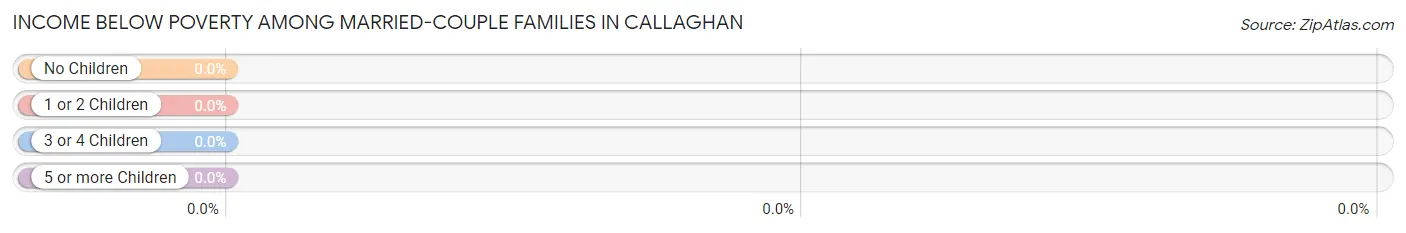
| Children | Above Poverty | Below Poverty |
| No Children | 61 (100.0%) | 0 (0.0%) |
| 1 or 2 Children | 21 (100.0%) | 0 (0.0%) |
| 3 or 4 Children | 0 (0.0%) | 0 (0.0%) |
| 5 or more Children | 0 (0.0%) | 0 (0.0%) |
| Total | 82 (100.0%) | 0 (0.0%) |
Income Below Poverty Among Single-Parent Households in Callaghan
| Children | Single Father | Single Mother |
| No Children | 0 (0.0%) | 0 (0.0%) |
| 1 or 2 Children | 0 (0.0%) | 0 (0.0%) |
| 3 or 4 Children | 0 (0.0%) | 0 (0.0%) |
| 5 or more Children | 0 (0.0%) | 0 (0.0%) |
| Total | 0 (0.0%) | 0 (0.0%) |
Income Below Poverty Among Married-Couple vs Single-Parent Households in Callaghan
| Children | Married-Couple Families | Single-Parent Households |
| No Children | 0 (0.0%) | 0 (0.0%) |
| 1 or 2 Children | 0 (0.0%) | 0 (0.0%) |
| 3 or 4 Children | 0 (0.0%) | 0 (0.0%) |
| 5 or more Children | 0 (0.0%) | 0 (0.0%) |
| Total | 0 (0.0%) | 0 (0.0%) |
Race in Callaghan
The most populous races in Callaghan are White / Caucasian (267 | 84.2%), Two or more Races (30 | 9.5%), and Black / African American (20 | 6.3%).
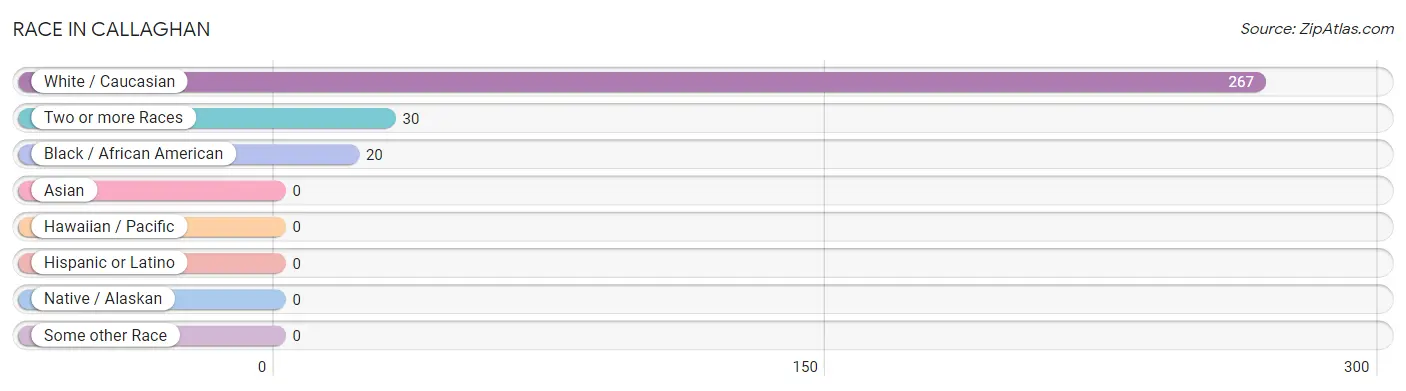
| Race | # Population | % Population |
| Asian | 0 | 0.0% |
| Black / African American | 20 | 6.3% |
| Hawaiian / Pacific | 0 | 0.0% |
| Hispanic or Latino | 0 | 0.0% |
| Native / Alaskan | 0 | 0.0% |
| White / Caucasian | 267 | 84.2% |
| Two or more Races | 30 | 9.5% |
| Some other Race | 0 | 0.0% |
| Total | 317 | 100.0% |
Ancestry in Callaghan
The most populous ancestries reported in Callaghan are American (59 | 18.6%), Greek (23 | 7.3%), German (19 | 6.0%), Dutch (15 | 4.7%), and Eastern European (13 | 4.1%), together accounting for 40.7% of all Callaghan residents.
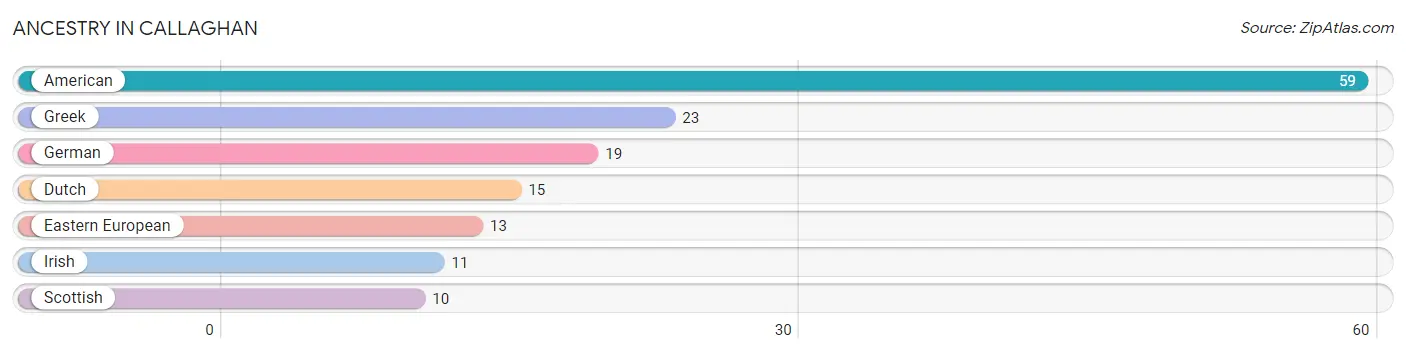
| Ancestry | # Population | % Population |
| American | 59 | 18.6% |
| Dutch | 15 | 4.7% |
| Eastern European | 13 | 4.1% |
| German | 19 | 6.0% |
| Greek | 23 | 7.3% |
| Irish | 11 | 3.5% |
| Scottish | 10 | 3.2% | View All 7 Rows |
Immigrants in Callaghan

| Immigration Origin | # Population | % Population | View All 0 Rows |
Sex and Age in Callaghan
Sex and Age in Callaghan
The most populous age groups in Callaghan are 55 to 59 Years (50 | 22.1%) for men and 55 to 59 Years (35 | 38.5%) for women.
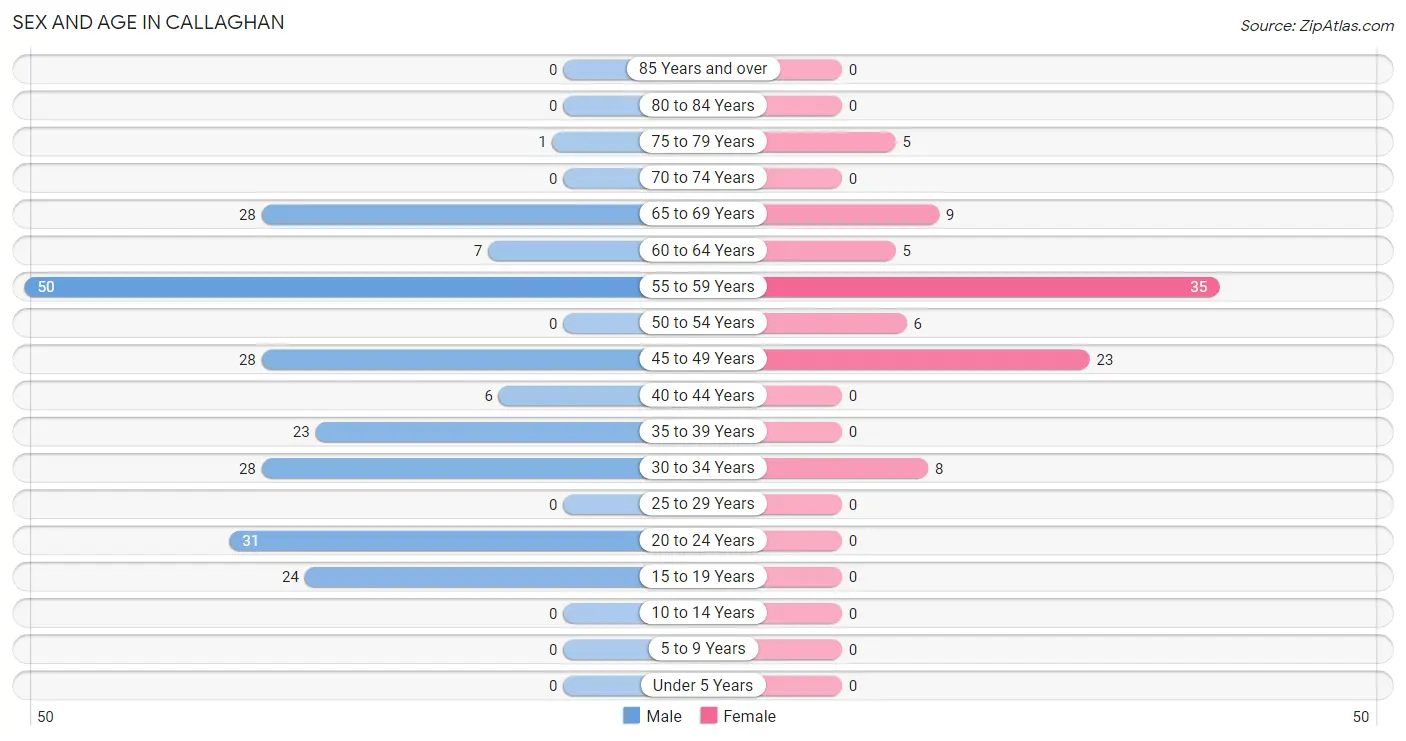
| Age Bracket | Male | Female |
| Under 5 Years | 0 (0.0%) | 0 (0.0%) |
| 5 to 9 Years | 0 (0.0%) | 0 (0.0%) |
| 10 to 14 Years | 0 (0.0%) | 0 (0.0%) |
| 15 to 19 Years | 24 (10.6%) | 0 (0.0%) |
| 20 to 24 Years | 31 (13.7%) | 0 (0.0%) |
| 25 to 29 Years | 0 (0.0%) | 0 (0.0%) |
| 30 to 34 Years | 28 (12.4%) | 8 (8.8%) |
| 35 to 39 Years | 23 (10.2%) | 0 (0.0%) |
| 40 to 44 Years | 6 (2.6%) | 0 (0.0%) |
| 45 to 49 Years | 28 (12.4%) | 23 (25.3%) |
| 50 to 54 Years | 0 (0.0%) | 6 (6.6%) |
| 55 to 59 Years | 50 (22.1%) | 35 (38.5%) |
| 60 to 64 Years | 7 (3.1%) | 5 (5.5%) |
| 65 to 69 Years | 28 (12.4%) | 9 (9.9%) |
| 70 to 74 Years | 0 (0.0%) | 0 (0.0%) |
| 75 to 79 Years | 1 (0.4%) | 5 (5.5%) |
| 80 to 84 Years | 0 (0.0%) | 0 (0.0%) |
| 85 Years and over | 0 (0.0%) | 0 (0.0%) |
| Total | 226 (100.0%) | 91 (100.0%) |
Families and Households in Callaghan
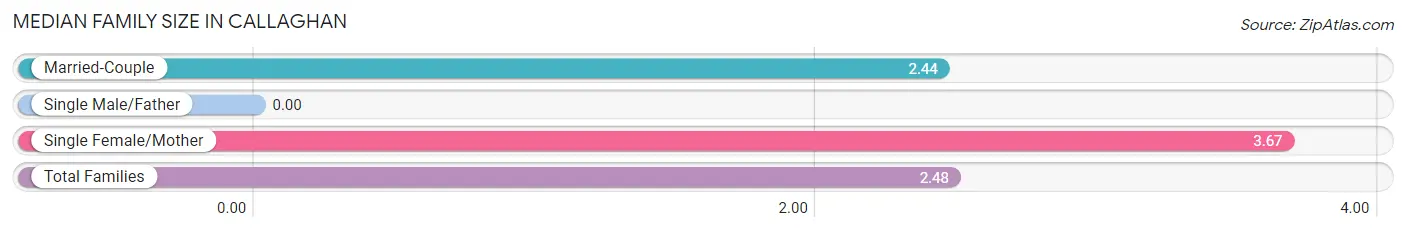
Median Family Size in Callaghan
| Family Type | # Families | Family Size |
| Married-Couple | 82 (96.5%) | 2.44 |
| Single Male/Father | 0 (0.0%) | - |
| Single Female/Mother | 3 (3.5%) | 3.67 |
| Total Families | 85 (100.0%) | 2.48 |
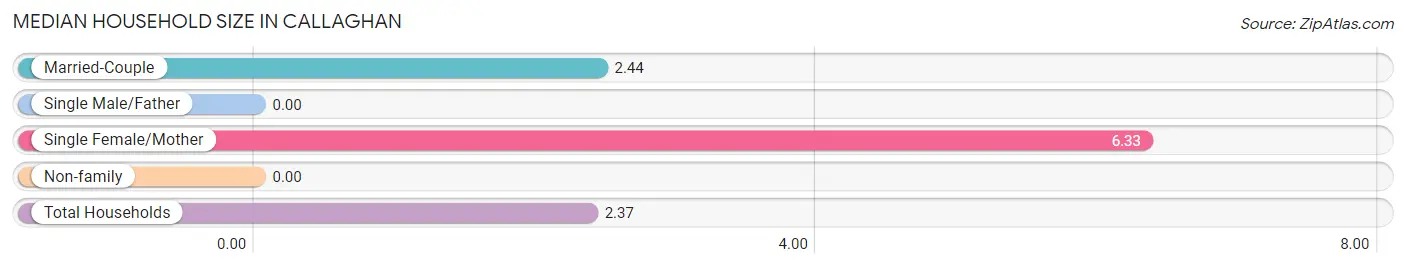
Median Household Size in Callaghan
| Household Type | # Households | Household Size |
| Married-Couple | 82 (83.7%) | 2.44 |
| Single Male/Father | 0 (0.0%) | - |
| Single Female/Mother | 3 (3.1%) | 6.33 |
| Non-family | 13 (13.3%) | - |
| Total Households | 98 (100.0%) | 2.37 |
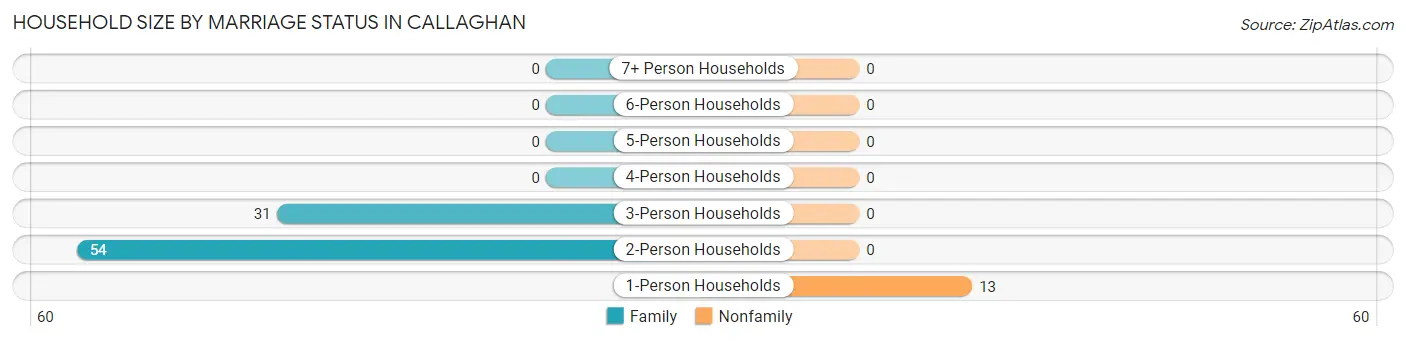
Household Size by Marriage Status in Callaghan
Out of a total of 98 households in Callaghan, 85 (86.7%) are family households, while 13 (13.3%) are nonfamily households. The most numerous type of family households are 2-person households, comprising 54, and the most common type of nonfamily households are 1-person households, comprising 13.
| Household Size | Family Households | Nonfamily Households |
| 1-Person Households | - | 13 (13.3%) |
| 2-Person Households | 54 (55.1%) | 0 (0.0%) |
| 3-Person Households | 31 (31.6%) | 0 (0.0%) |
| 4-Person Households | 0 (0.0%) | 0 (0.0%) |
| 5-Person Households | 0 (0.0%) | 0 (0.0%) |
| 6-Person Households | 0 (0.0%) | 0 (0.0%) |
| 7+ Person Households | 0 (0.0%) | 0 (0.0%) |
| Total | 85 (86.7%) | 13 (13.3%) |
Female Fertility in Callaghan
Fertility by Age in Callaghan
| Age Bracket | Women with Births | Births / 1,000 Women |
| 15 to 19 years | 0 (0.0%) | 0.0 |
| 20 to 34 years | 0 (0.0%) | 0.0 |
| 35 to 50 years | 0 (0.0%) | 0.0 |
| Total | 0 (0.0%) | 0.0 |
Fertility by Age by Marriage Status in Callaghan
| Age Bracket | Married | Unmarried |
| 15 to 19 years | 0 (0.0%) | 0 (0.0%) |
| 20 to 34 years | 0 (0.0%) | 0 (0.0%) |
| 35 to 50 years | 0 (0.0%) | 0 (0.0%) |
| Total | 0 (0.0%) | 0 (0.0%) |
Fertility by Education in Callaghan
| Educational Attainment | Women with Births | Births / 1,000 Women |
| Less than High School | 0 (0.0%) | 0.0 |
| High School Diploma | 0 (0.0%) | 0.0 |
| College or Associate's Degree | 0 (0.0%) | 0.0 |
| Bachelor's Degree | 0 (0.0%) | 0.0 |
| Graduate Degree | 0 (0.0%) | 0.0 |
| Total | 0 (0.0%) | 0.0 |
Fertility by Education by Marriage Status in Callaghan
| Educational Attainment | Married | Unmarried |
| Less than High School | 0 (0.0%) | 0 (0.0%) |
| High School Diploma | 0 (0.0%) | 0 (0.0%) |
| College or Associate's Degree | 0 (0.0%) | 0 (0.0%) |
| Bachelor's Degree | 0 (0.0%) | 0 (0.0%) |
| Graduate Degree | 0 (0.0%) | 0 (0.0%) |
| Total | 0 (0.0%) | 0 (0.0%) |
Employment Characteristics in Callaghan
Employment by Class of Employer in Callaghan
Among the 207 employed individuals in Callaghan, private company employees (152 | 73.4%), state government employees (23 | 11.1%), and local government employees (19 | 9.2%) make up the most common classes of employment.
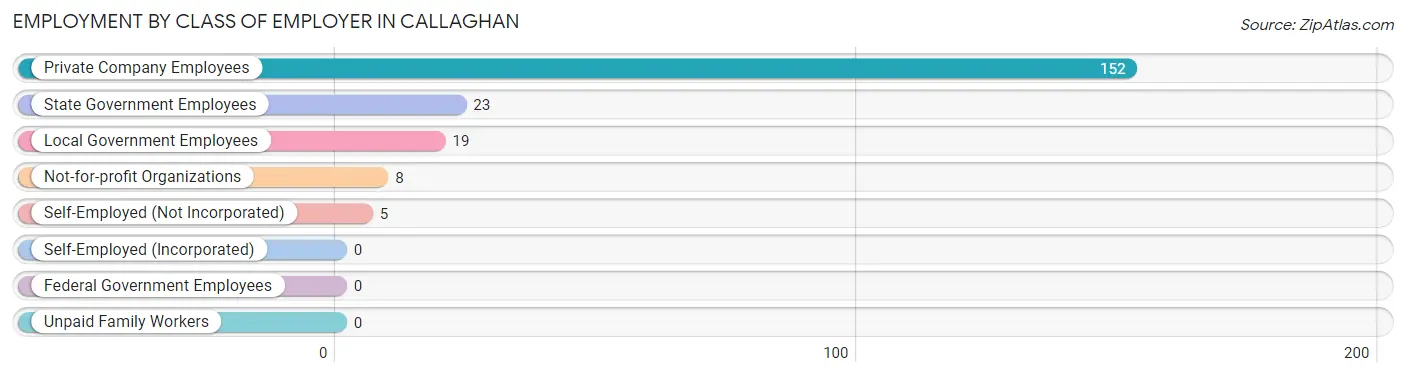
| Employer Class | # Employees | % Employees |
| Private Company Employees | 152 | 73.4% |
| Self-Employed (Incorporated) | 0 | 0.0% |
| Self-Employed (Not Incorporated) | 5 | 2.4% |
| Not-for-profit Organizations | 8 | 3.9% |
| Local Government Employees | 19 | 9.2% |
| State Government Employees | 23 | 11.1% |
| Federal Government Employees | 0 | 0.0% |
| Unpaid Family Workers | 0 | 0.0% |
| Total | 207 | 100.0% |
Employment Status by Age in Callaghan
According to the labor force statistics for Callaghan, out of the total population over 16 years of age (317), 66.2% or 210 individuals are in the labor force, with 1.4% or 3 of them unemployed. The age group with the highest labor force participation rate is 20 to 24 years, with 100.0% or 31 individuals in the labor force. Within the labor force, the 75 years and over age range has the highest percentage of unemployed individuals, with 100.0% or 3 of them being unemployed.
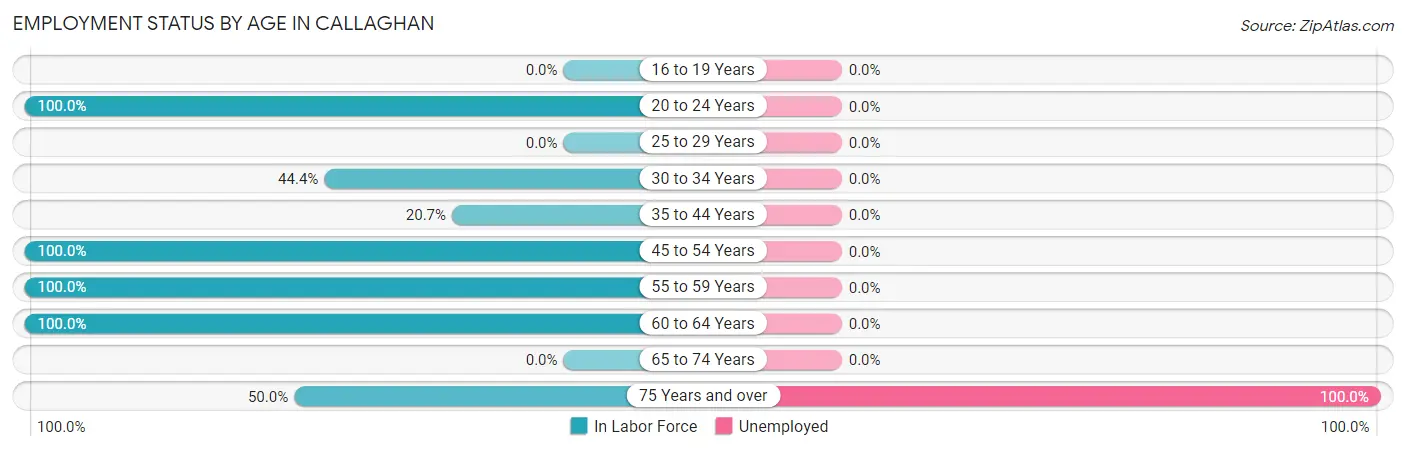
| Age Bracket | In Labor Force | Unemployed |
| 16 to 19 Years | 0 (0.0%) | 0 (0.0%) |
| 20 to 24 Years | 31 (100.0%) | 0 (0.0%) |
| 25 to 29 Years | 0 (0.0%) | 0 (0.0%) |
| 30 to 34 Years | 16 (44.4%) | 0 (0.0%) |
| 35 to 44 Years | 6 (20.7%) | 0 (0.0%) |
| 45 to 54 Years | 57 (100.0%) | 0 (0.0%) |
| 55 to 59 Years | 85 (100.0%) | 0 (0.0%) |
| 60 to 64 Years | 12 (100.0%) | 0 (0.0%) |
| 65 to 74 Years | 0 (0.0%) | 0 (0.0%) |
| 75 Years and over | 3 (50.0%) | 3 (100.0%) |
| Total | 210 (66.2%) | 3 (1.4%) |
Employment Status by Educational Attainment in Callaghan
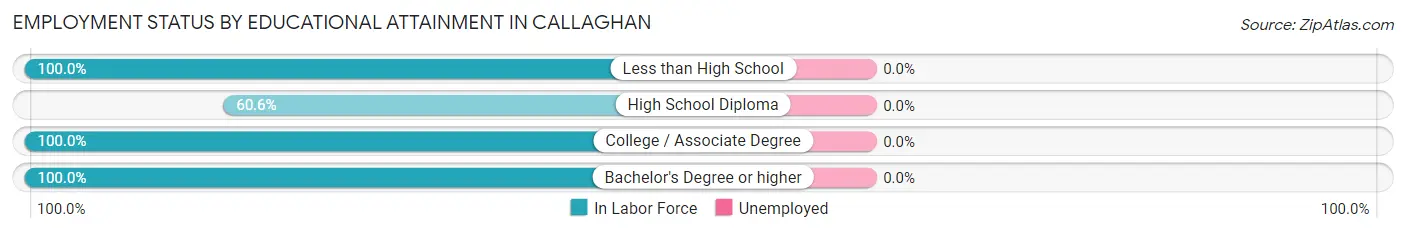
| Educational Attainment | In Labor Force | Unemployed |
| Less than High School | 8 (100.0%) | 0 (0.0%) |
| High School Diploma | 66 (60.6%) | 0 (0.0%) |
| College / Associate Degree | 74 (100.0%) | 0 (0.0%) |
| Bachelor's Degree or higher | 28 (100.0%) | 0 (0.0%) |
| Total | 176 (80.4%) | 0 (0.0%) |
Employment Occupations by Sex in Callaghan
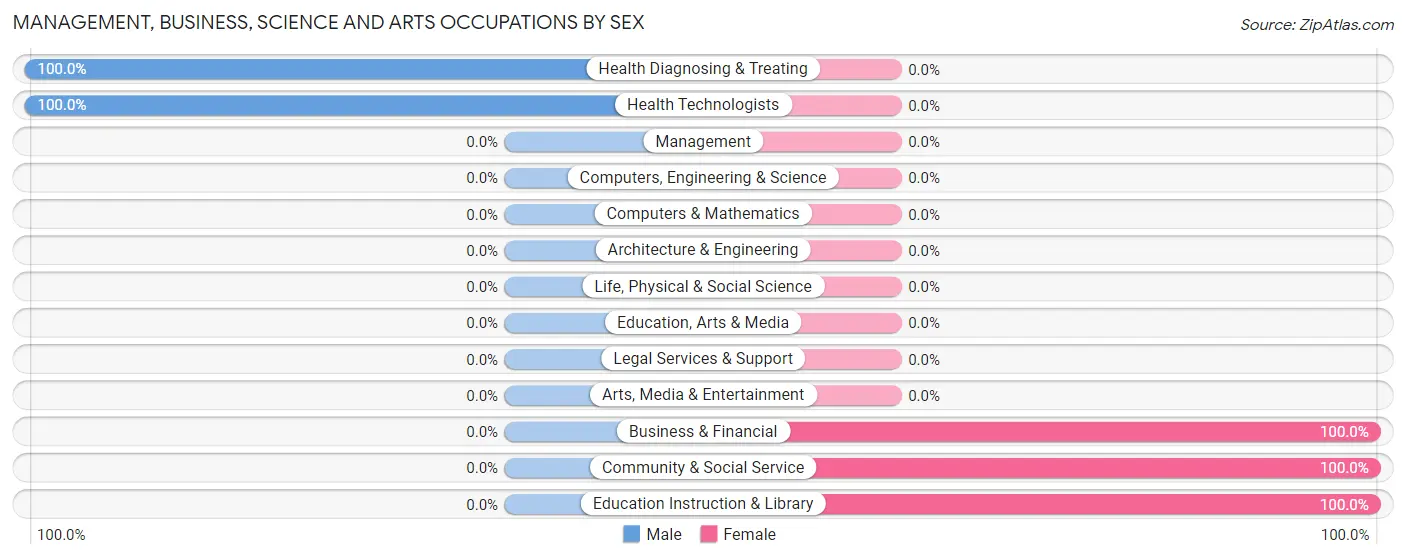
Management, Business, Science and Arts Occupations
The most common Management, Business, Science and Arts occupations in Callaghan are Community & Social Service (23 | 11.1%), Education Instruction & Library (23 | 11.1%), Health Diagnosing & Treating (8 | 3.9%), Health Technologists (8 | 3.9%), and Business & Financial (5 | 2.4%).
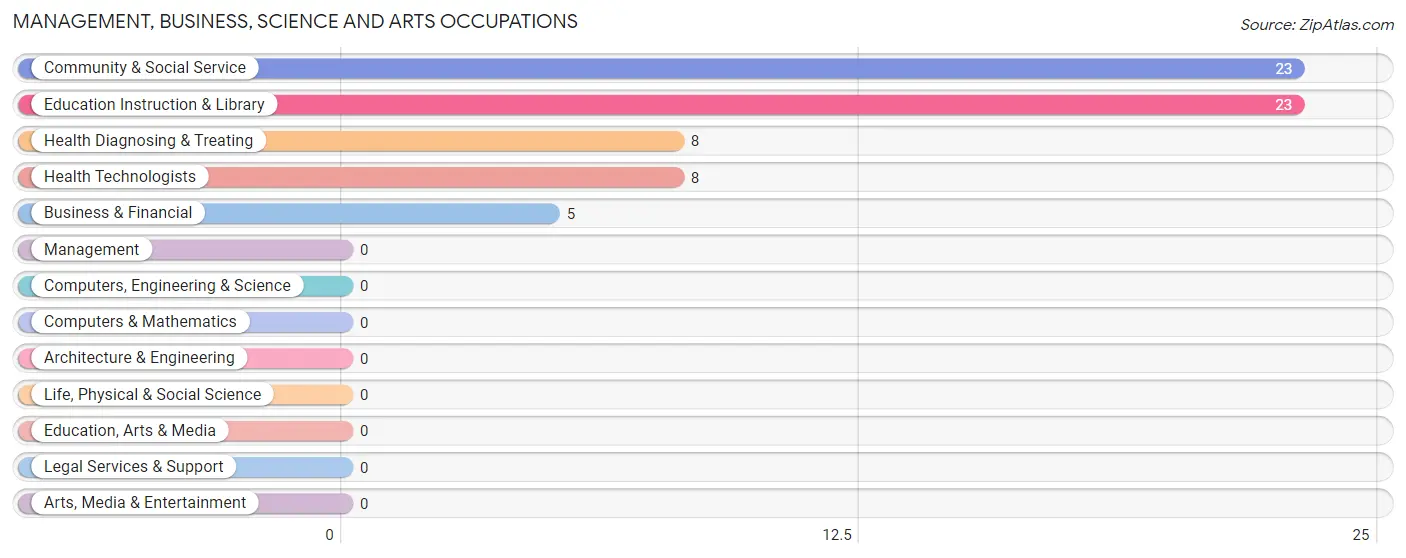
Management, Business, Science and Arts Occupations by Sex
Within the Management, Business, Science and Arts occupations in Callaghan, the most male-oriented occupations are Health Diagnosing & Treating (100.0%), and Health Technologists (100.0%), while the most female-oriented occupations are Business & Financial (100.0%), Community & Social Service (100.0%), and Education Instruction & Library (100.0%).
| Occupation | Male | Female |
| Management | 0 (0.0%) | 0 (0.0%) |
| Business & Financial | 0 (0.0%) | 5 (100.0%) |
| Computers, Engineering & Science | 0 (0.0%) | 0 (0.0%) |
| Computers & Mathematics | 0 (0.0%) | 0 (0.0%) |
| Architecture & Engineering | 0 (0.0%) | 0 (0.0%) |
| Life, Physical & Social Science | 0 (0.0%) | 0 (0.0%) |
| Community & Social Service | 0 (0.0%) | 23 (100.0%) |
| Education, Arts & Media | 0 (0.0%) | 0 (0.0%) |
| Legal Services & Support | 0 (0.0%) | 0 (0.0%) |
| Education Instruction & Library | 0 (0.0%) | 23 (100.0%) |
| Arts, Media & Entertainment | 0 (0.0%) | 0 (0.0%) |
| Health Diagnosing & Treating | 8 (100.0%) | 0 (0.0%) |
| Health Technologists | 8 (100.0%) | 0 (0.0%) |
| Total (Category) | 8 (22.2%) | 28 (77.8%) |
| Total (Overall) | 130 (62.8%) | 77 (37.2%) |
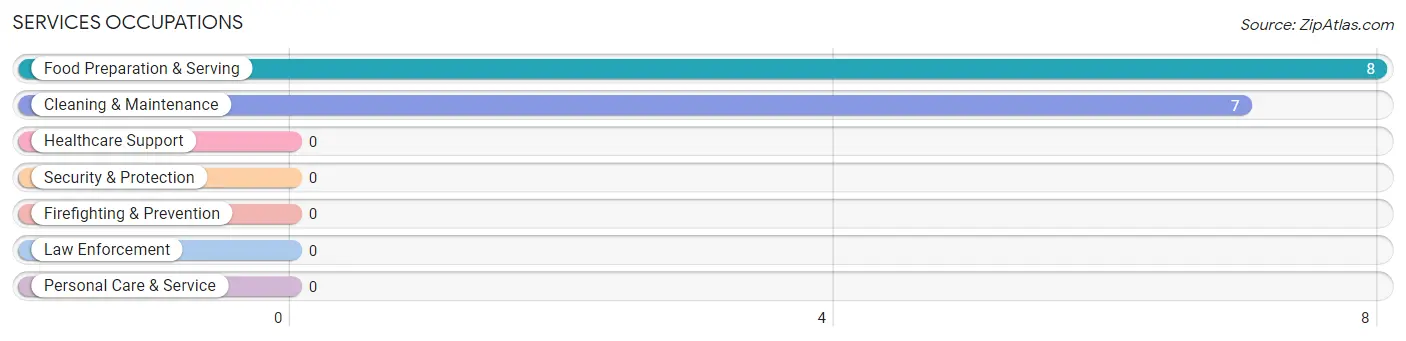
Services Occupations
The most common Services occupations in Callaghan are Food Preparation & Serving (8 | 3.9%), and Cleaning & Maintenance (7 | 3.4%).
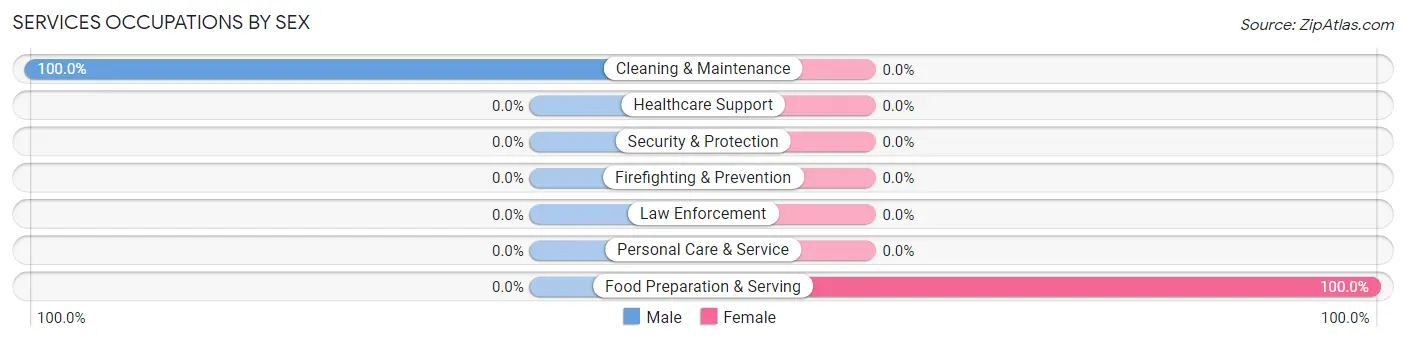
Services Occupations by Sex
| Occupation | Male | Female |
| Healthcare Support | 0 (0.0%) | 0 (0.0%) |
| Security & Protection | 0 (0.0%) | 0 (0.0%) |
| Firefighting & Prevention | 0 (0.0%) | 0 (0.0%) |
| Law Enforcement | 0 (0.0%) | 0 (0.0%) |
| Food Preparation & Serving | 0 (0.0%) | 8 (100.0%) |
| Cleaning & Maintenance | 7 (100.0%) | 0 (0.0%) |
| Personal Care & Service | 0 (0.0%) | 0 (0.0%) |
| Total (Category) | 7 (46.7%) | 8 (53.3%) |
| Total (Overall) | 130 (62.8%) | 77 (37.2%) |
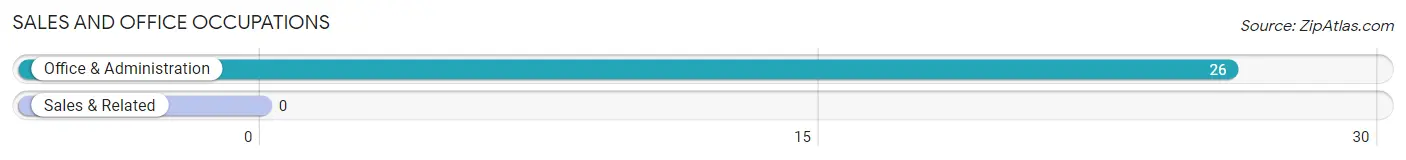
Sales and Office Occupations
The most common Sales and Office occupations in Callaghan are , and Office & Administration (26 | 12.6%).
Sales and Office Occupations by Sex
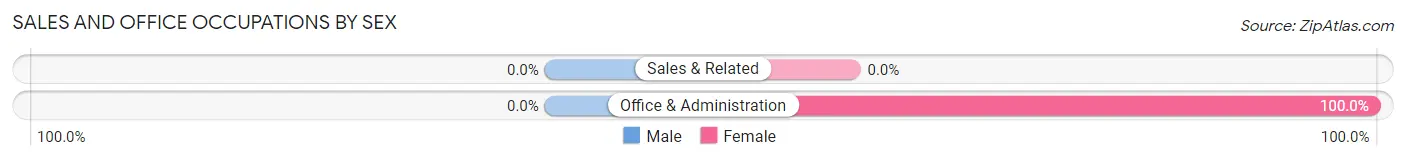
| Occupation | Male | Female |
| Sales & Related | 0 (0.0%) | 0 (0.0%) |
| Office & Administration | 0 (0.0%) | 26 (100.0%) |
| Total (Category) | 0 (0.0%) | 26 (100.0%) |
| Total (Overall) | 130 (62.8%) | 77 (37.2%) |
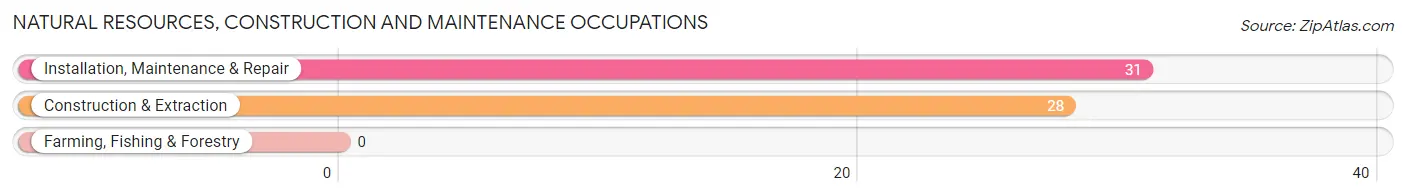
Natural Resources, Construction and Maintenance Occupations
The most common Natural Resources, Construction and Maintenance occupations in Callaghan are Installation, Maintenance & Repair (31 | 15.0%), and Construction & Extraction (28 | 13.5%).
Natural Resources, Construction and Maintenance Occupations by Sex
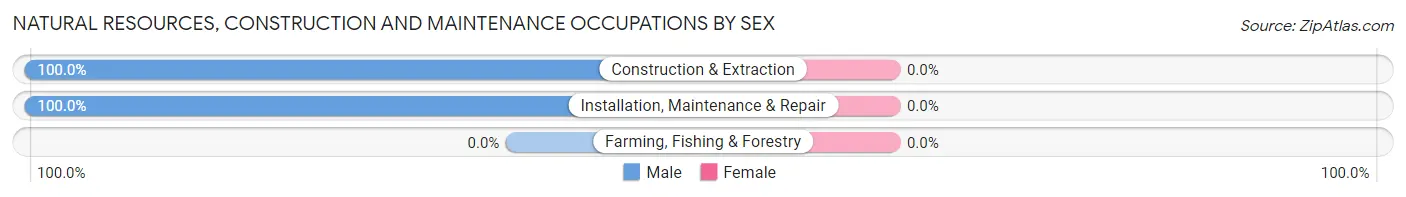
| Occupation | Male | Female |
| Farming, Fishing & Forestry | 0 (0.0%) | 0 (0.0%) |
| Construction & Extraction | 28 (100.0%) | 0 (0.0%) |
| Installation, Maintenance & Repair | 31 (100.0%) | 0 (0.0%) |
| Total (Category) | 59 (100.0%) | 0 (0.0%) |
| Total (Overall) | 130 (62.8%) | 77 (37.2%) |
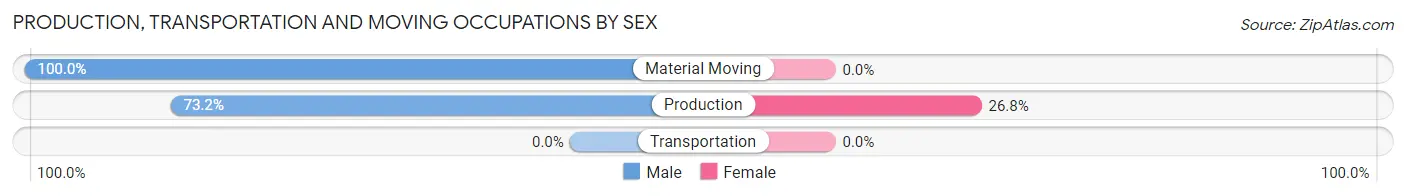
Production, Transportation and Moving Occupations
The most common Production, Transportation and Moving occupations in Callaghan are Production (56 | 27.1%), and Material Moving (15 | 7.2%).
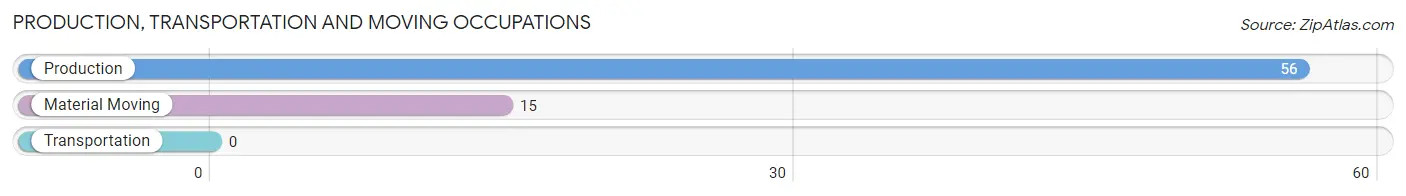
Production, Transportation and Moving Occupations by Sex
| Occupation | Male | Female |
| Production | 41 (73.2%) | 15 (26.8%) |
| Transportation | 0 (0.0%) | 0 (0.0%) |
| Material Moving | 15 (100.0%) | 0 (0.0%) |
| Total (Category) | 56 (78.9%) | 15 (21.1%) |
| Total (Overall) | 130 (62.8%) | 77 (37.2%) |
Employment Industries by Sex in Callaghan
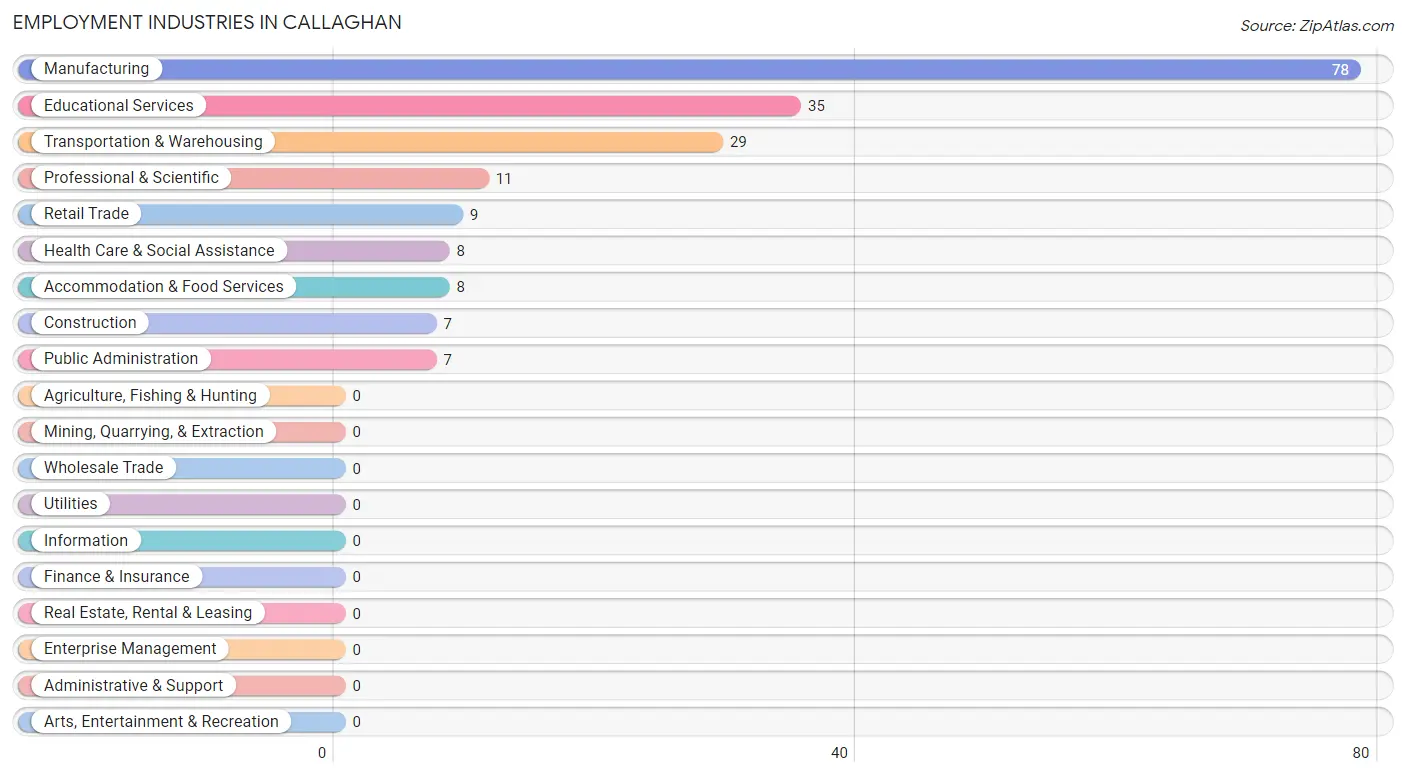
Employment Industries in Callaghan
The major employment industries in Callaghan include Manufacturing (78 | 37.7%), Educational Services (35 | 16.9%), Transportation & Warehousing (29 | 14.0%), Professional & Scientific (11 | 5.3%), and Retail Trade (9 | 4.3%).
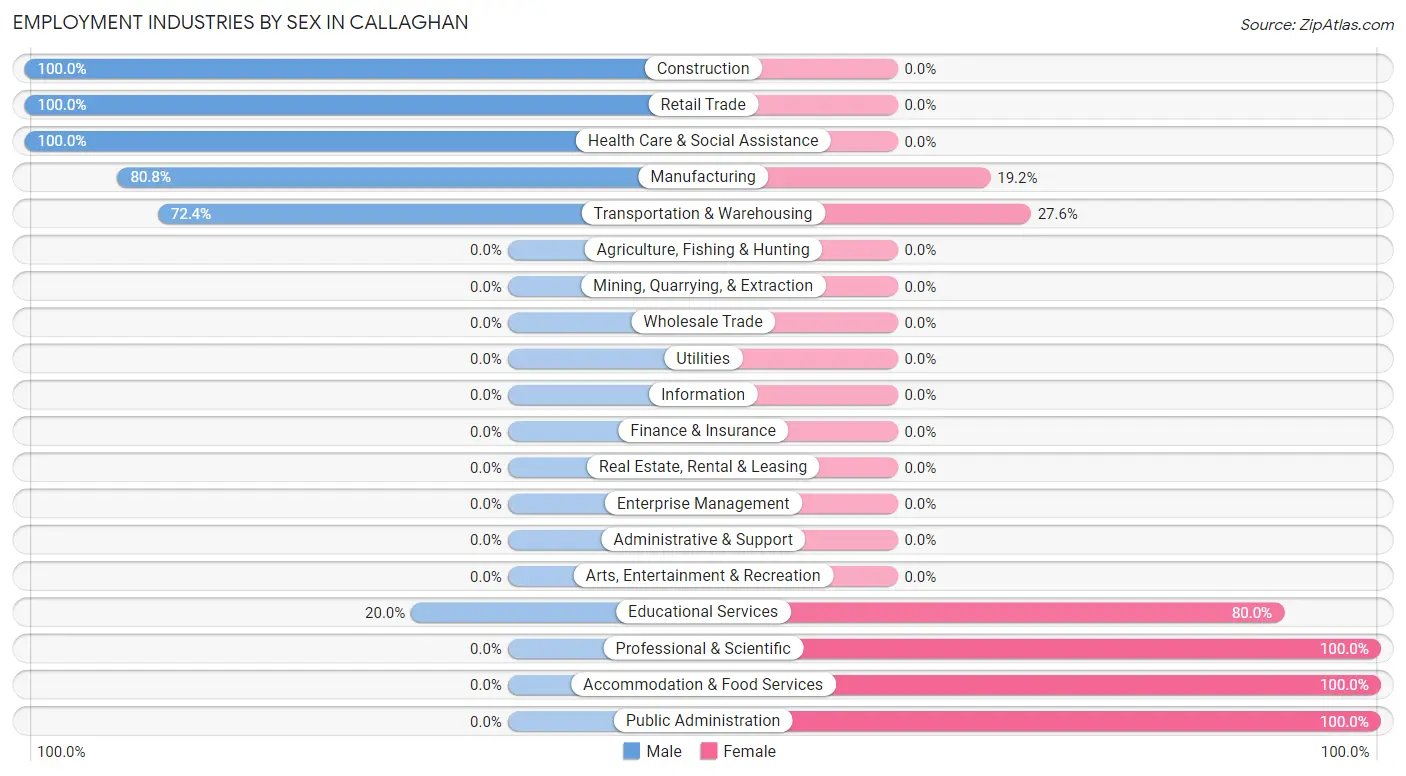
Employment Industries by Sex in Callaghan
The Callaghan industries that see more men than women are Construction (100.0%), Retail Trade (100.0%), and Health Care & Social Assistance (100.0%), whereas the industries that tend to have a higher number of women are Professional & Scientific (100.0%), Accommodation & Food Services (100.0%), and Public Administration (100.0%).
| Industry | Male | Female |
| Agriculture, Fishing & Hunting | 0 (0.0%) | 0 (0.0%) |
| Mining, Quarrying, & Extraction | 0 (0.0%) | 0 (0.0%) |
| Construction | 7 (100.0%) | 0 (0.0%) |
| Manufacturing | 63 (80.8%) | 15 (19.2%) |
| Wholesale Trade | 0 (0.0%) | 0 (0.0%) |
| Retail Trade | 9 (100.0%) | 0 (0.0%) |
| Transportation & Warehousing | 21 (72.4%) | 8 (27.6%) |
| Utilities | 0 (0.0%) | 0 (0.0%) |
| Information | 0 (0.0%) | 0 (0.0%) |
| Finance & Insurance | 0 (0.0%) | 0 (0.0%) |
| Real Estate, Rental & Leasing | 0 (0.0%) | 0 (0.0%) |
| Professional & Scientific | 0 (0.0%) | 11 (100.0%) |
| Enterprise Management | 0 (0.0%) | 0 (0.0%) |
| Administrative & Support | 0 (0.0%) | 0 (0.0%) |
| Educational Services | 7 (20.0%) | 28 (80.0%) |
| Health Care & Social Assistance | 8 (100.0%) | 0 (0.0%) |
| Arts, Entertainment & Recreation | 0 (0.0%) | 0 (0.0%) |
| Accommodation & Food Services | 0 (0.0%) | 8 (100.0%) |
| Public Administration | 0 (0.0%) | 7 (100.0%) |
| Total | 130 (62.8%) | 77 (37.2%) |
Education in Callaghan
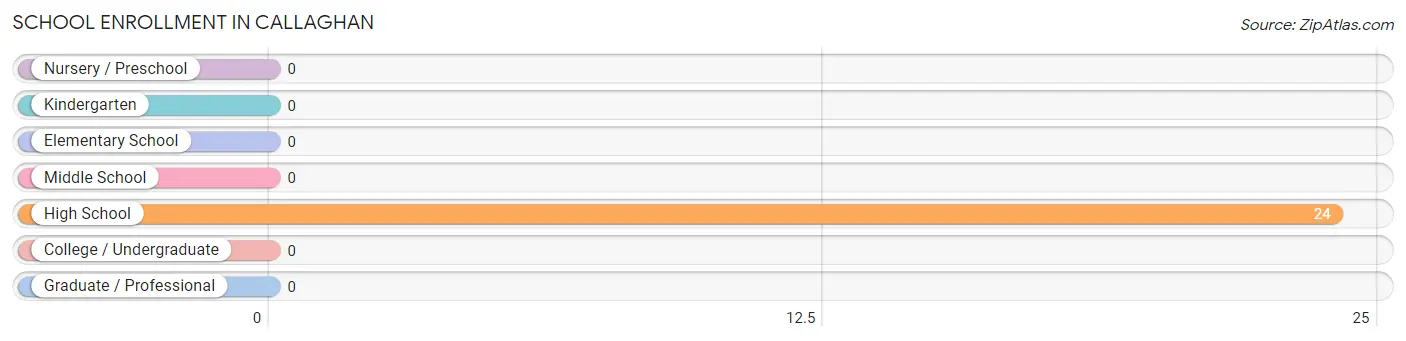
School Enrollment in Callaghan
| School Level | # Students | % Students |
| Nursery / Preschool | 0 | 0.0% |
| Kindergarten | 0 | 0.0% |
| Elementary School | 0 | 0.0% |
| Middle School | 0 | 0.0% |
| High School | 24 | 100.0% |
| College / Undergraduate | 0 | 0.0% |
| Graduate / Professional | 0 | 0.0% |
| Total | 24 | 100.0% |
School Enrollment by Age by Funding Source in Callaghan
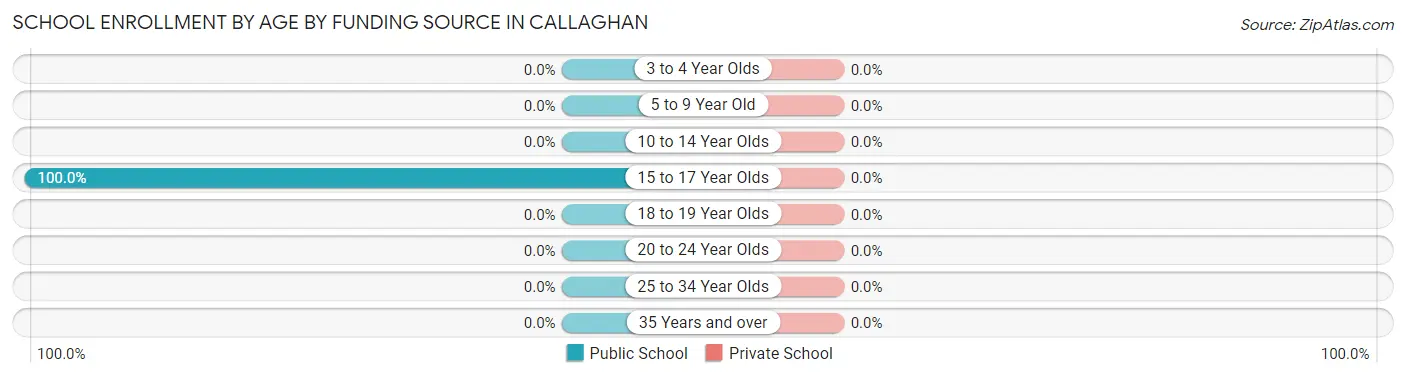
| Age Bracket | Public School | Private School |
| 3 to 4 Year Olds | 0 (0.0%) | 0 (0.0%) |
| 5 to 9 Year Old | 0 (0.0%) | 0 (0.0%) |
| 10 to 14 Year Olds | 0 (0.0%) | 0 (0.0%) |
| 15 to 17 Year Olds | 24 (100.0%) | 0 (0.0%) |
| 18 to 19 Year Olds | 0 (0.0%) | 0 (0.0%) |
| 20 to 24 Year Olds | 0 (0.0%) | 0 (0.0%) |
| 25 to 34 Year Olds | 0 (0.0%) | 0 (0.0%) |
| 35 Years and over | 0 (0.0%) | 0 (0.0%) |
| Total | 24 (100.0%) | 0 (0.0%) |
Educational Attainment by Field of Study in Callaghan
Education (23 | 47.9%), engineering (20 | 41.7%), and business (5 | 10.4%) are the most common fields of study among 48 individuals in Callaghan who have obtained a bachelor's degree or higher.
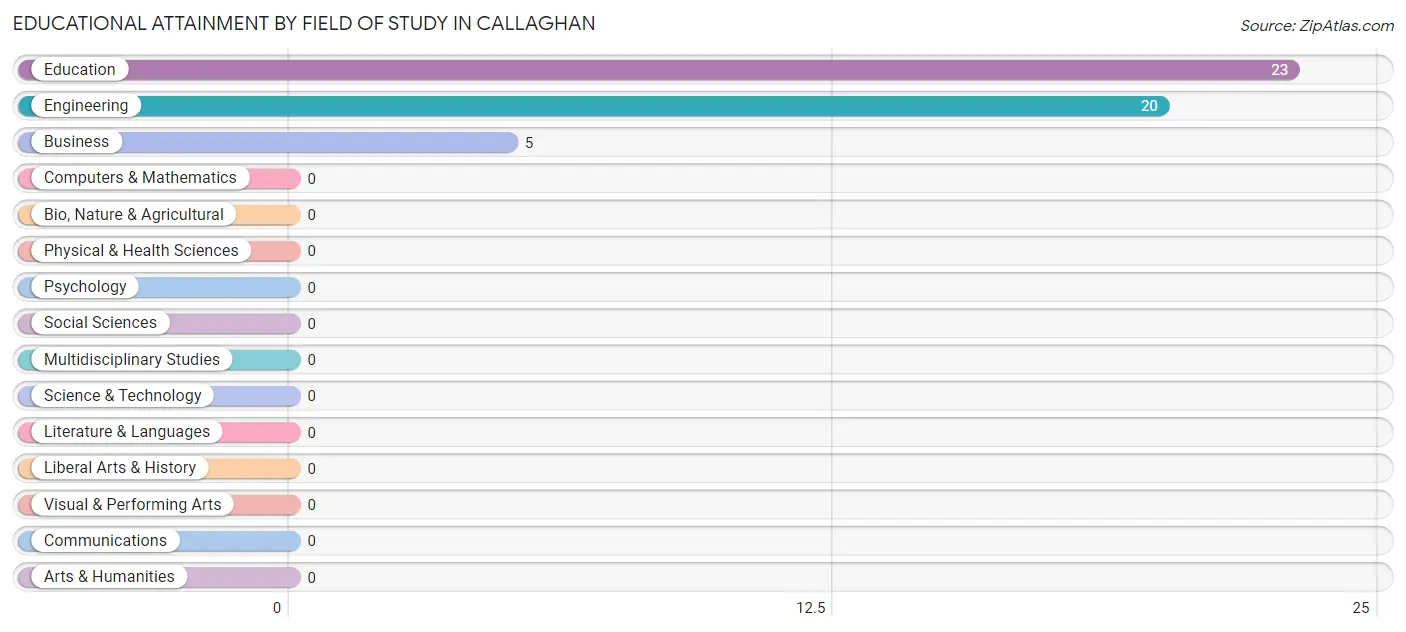
| Field of Study | # Graduates | % Graduates |
| Computers & Mathematics | 0 | 0.0% |
| Bio, Nature & Agricultural | 0 | 0.0% |
| Physical & Health Sciences | 0 | 0.0% |
| Psychology | 0 | 0.0% |
| Social Sciences | 0 | 0.0% |
| Engineering | 20 | 41.7% |
| Multidisciplinary Studies | 0 | 0.0% |
| Science & Technology | 0 | 0.0% |
| Business | 5 | 10.4% |
| Education | 23 | 47.9% |
| Literature & Languages | 0 | 0.0% |
| Liberal Arts & History | 0 | 0.0% |
| Visual & Performing Arts | 0 | 0.0% |
| Communications | 0 | 0.0% |
| Arts & Humanities | 0 | 0.0% |
| Total | 48 | 100.0% |
Transportation & Commute in Callaghan
Vehicle Availability by Sex in Callaghan
The most prevalent vehicle ownership categories in Callaghan are males with 3 vehicles (56, accounting for 51.8%) and females with 3 vehicles (44, making up 72.7%).
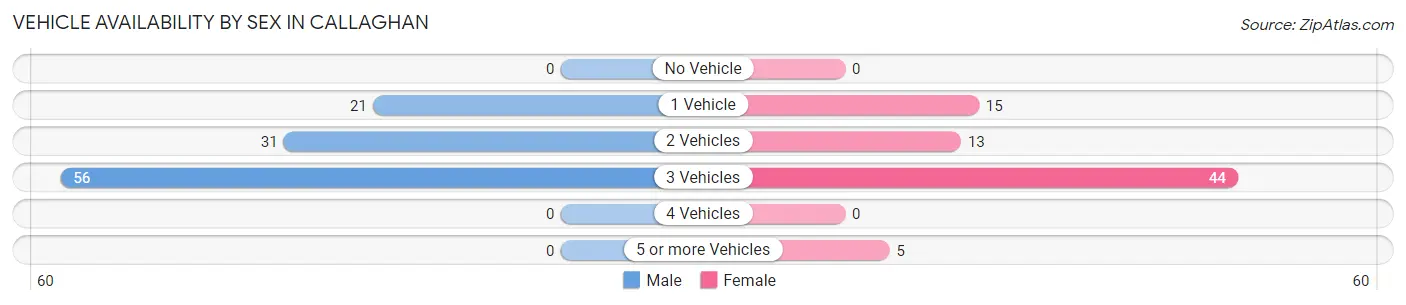
| Vehicles Available | Male | Female |
| No Vehicle | 0 (0.0%) | 0 (0.0%) |
| 1 Vehicle | 21 (19.4%) | 15 (19.5%) |
| 2 Vehicles | 31 (28.7%) | 13 (16.9%) |
| 3 Vehicles | 56 (51.8%) | 44 (57.1%) |
| 4 Vehicles | 0 (0.0%) | 0 (0.0%) |
| 5 or more Vehicles | 0 (0.0%) | 5 (6.5%) |
| Total | 108 (100.0%) | 77 (100.0%) |
Commute Time in Callaghan
The most frequently occuring commute durations in Callaghan are 10 to 14 minutes (73 commuters, 36.1%), 20 to 24 minutes (64 commuters, 31.7%), and 45 to 59 minutes (22 commuters, 10.9%).
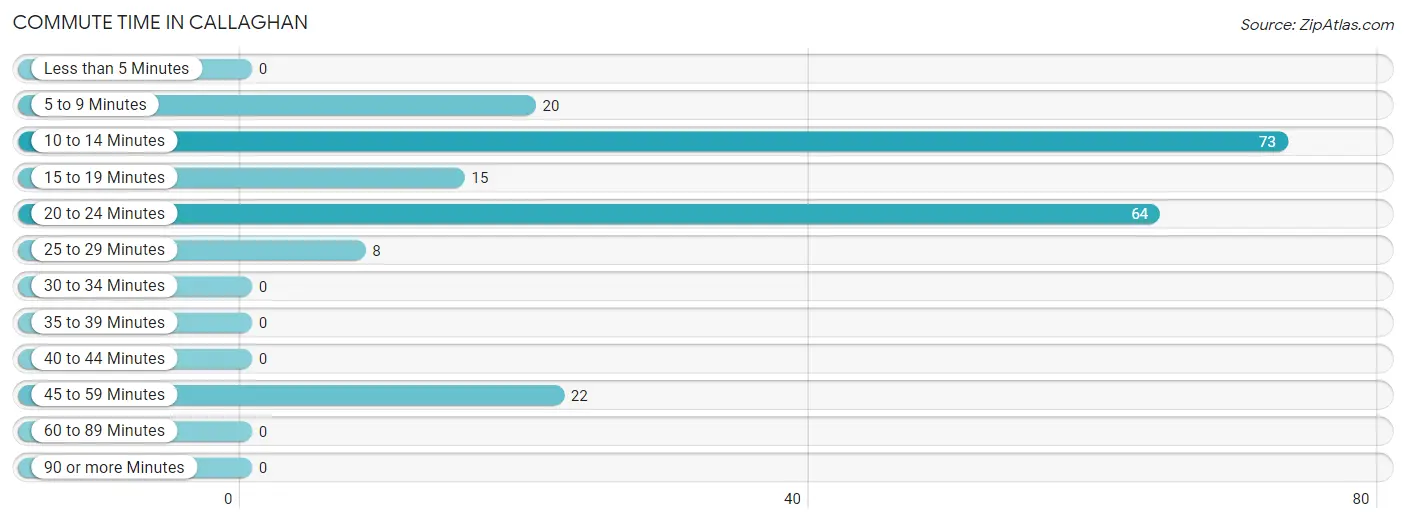
| Commute Time | # Commuters | % Commuters |
| Less than 5 Minutes | 0 | 0.0% |
| 5 to 9 Minutes | 20 | 9.9% |
| 10 to 14 Minutes | 73 | 36.1% |
| 15 to 19 Minutes | 15 | 7.4% |
| 20 to 24 Minutes | 64 | 31.7% |
| 25 to 29 Minutes | 8 | 4.0% |
| 30 to 34 Minutes | 0 | 0.0% |
| 35 to 39 Minutes | 0 | 0.0% |
| 40 to 44 Minutes | 0 | 0.0% |
| 45 to 59 Minutes | 22 | 10.9% |
| 60 to 89 Minutes | 0 | 0.0% |
| 90 or more Minutes | 0 | 0.0% |
Commute Time by Sex in Callaghan
The most common commute times in Callaghan are 10 to 14 minutes (42 commuters, 32.3%) for males and 10 to 14 minutes (31 commuters, 43.1%) for females.
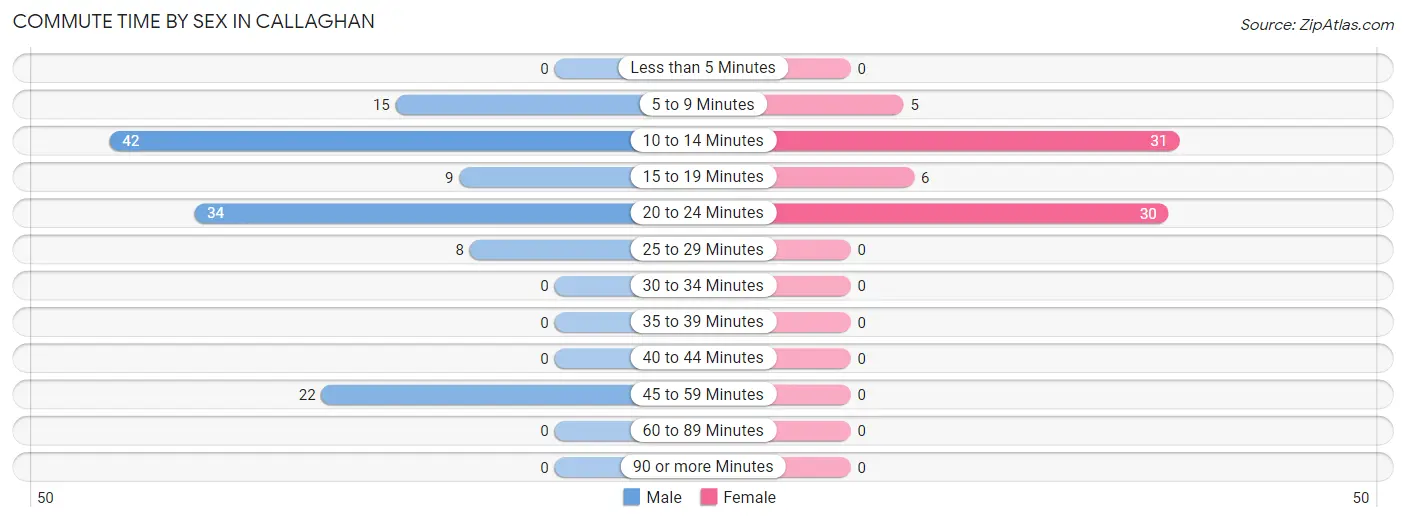
| Commute Time | Male | Female |
| Less than 5 Minutes | 0 (0.0%) | 0 (0.0%) |
| 5 to 9 Minutes | 15 (11.5%) | 5 (6.9%) |
| 10 to 14 Minutes | 42 (32.3%) | 31 (43.1%) |
| 15 to 19 Minutes | 9 (6.9%) | 6 (8.3%) |
| 20 to 24 Minutes | 34 (26.2%) | 30 (41.7%) |
| 25 to 29 Minutes | 8 (6.1%) | 0 (0.0%) |
| 30 to 34 Minutes | 0 (0.0%) | 0 (0.0%) |
| 35 to 39 Minutes | 0 (0.0%) | 0 (0.0%) |
| 40 to 44 Minutes | 0 (0.0%) | 0 (0.0%) |
| 45 to 59 Minutes | 22 (16.9%) | 0 (0.0%) |
| 60 to 89 Minutes | 0 (0.0%) | 0 (0.0%) |
| 90 or more Minutes | 0 (0.0%) | 0 (0.0%) |
Time of Departure to Work by Sex in Callaghan
The most frequent times of departure to work in Callaghan are 5:30 AM to 5:59 AM (45, 34.6%) for males and 8:00 AM to 8:29 AM (23, 31.9%) for females.
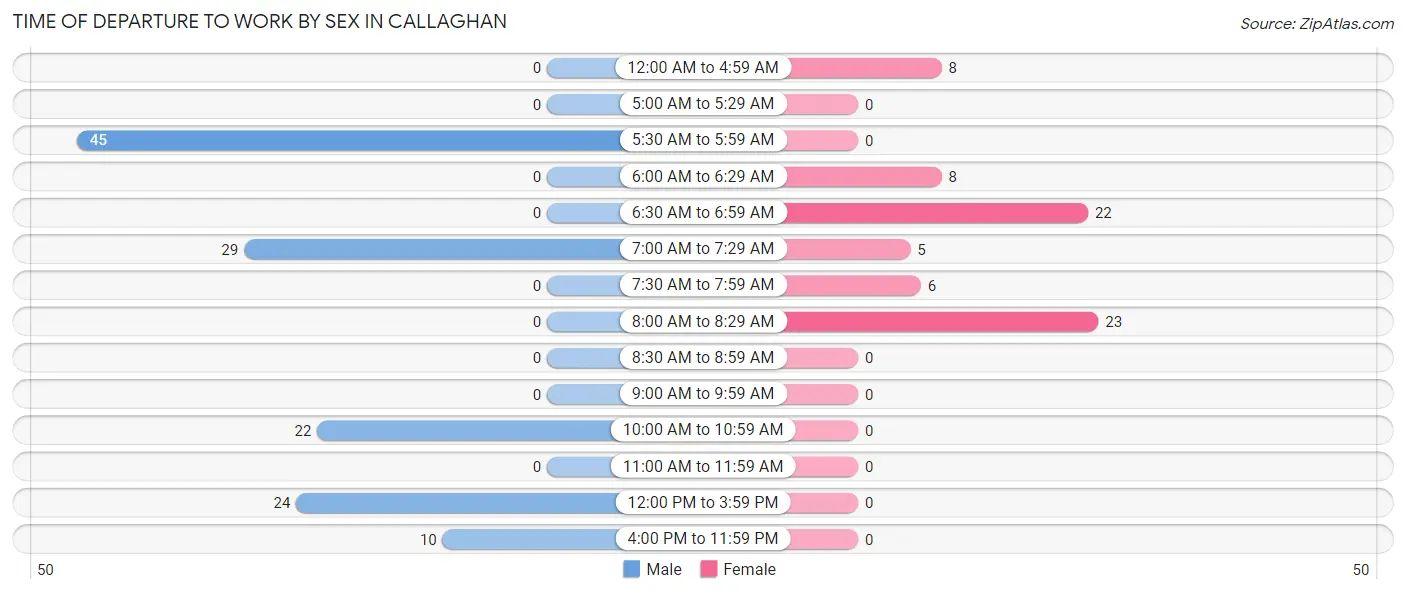
| Time of Departure | Male | Female |
| 12:00 AM to 4:59 AM | 0 (0.0%) | 8 (11.1%) |
| 5:00 AM to 5:29 AM | 0 (0.0%) | 0 (0.0%) |
| 5:30 AM to 5:59 AM | 45 (34.6%) | 0 (0.0%) |
| 6:00 AM to 6:29 AM | 0 (0.0%) | 8 (11.1%) |
| 6:30 AM to 6:59 AM | 0 (0.0%) | 22 (30.6%) |
| 7:00 AM to 7:29 AM | 29 (22.3%) | 5 (6.9%) |
| 7:30 AM to 7:59 AM | 0 (0.0%) | 6 (8.3%) |
| 8:00 AM to 8:29 AM | 0 (0.0%) | 23 (31.9%) |
| 8:30 AM to 8:59 AM | 0 (0.0%) | 0 (0.0%) |
| 9:00 AM to 9:59 AM | 0 (0.0%) | 0 (0.0%) |
| 10:00 AM to 10:59 AM | 22 (16.9%) | 0 (0.0%) |
| 11:00 AM to 11:59 AM | 0 (0.0%) | 0 (0.0%) |
| 12:00 PM to 3:59 PM | 24 (18.5%) | 0 (0.0%) |
| 4:00 PM to 11:59 PM | 10 (7.7%) | 0 (0.0%) |
| Total | 130 (100.0%) | 72 (100.0%) |
Housing Occupancy in Callaghan
Occupancy by Ownership in Callaghan
Of the total 98 dwellings in Callaghan, owner-occupied units account for 67 (68.4%), while renter-occupied units make up 31 (31.6%).
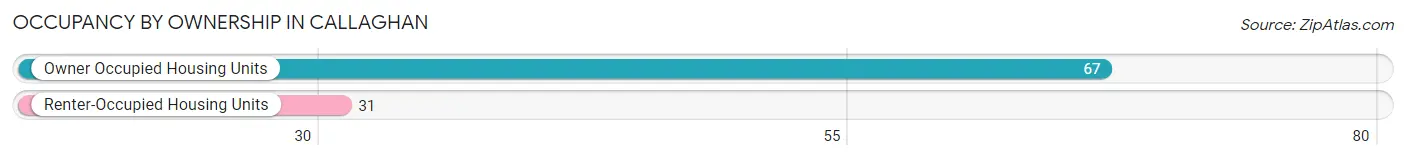
| Occupancy | # Housing Units | % Housing Units |
| Owner Occupied Housing Units | 67 | 68.4% |
| Renter-Occupied Housing Units | 31 | 31.6% |
| Total Occupied Housing Units | 98 | 100.0% |
Occupancy by Household Size in Callaghan
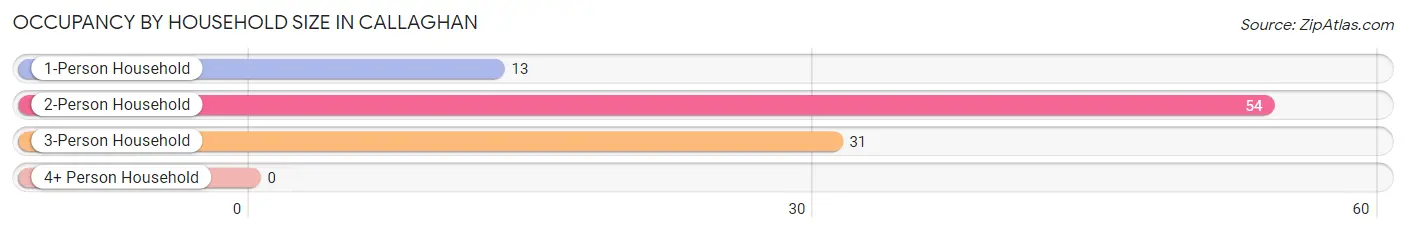
| Household Size | # Housing Units | % Housing Units |
| 1-Person Household | 13 | 13.3% |
| 2-Person Household | 54 | 55.1% |
| 3-Person Household | 31 | 31.6% |
| 4+ Person Household | 0 | 0.0% |
| Total Housing Units | 98 | 100.0% |
Occupancy by Ownership by Household Size in Callaghan
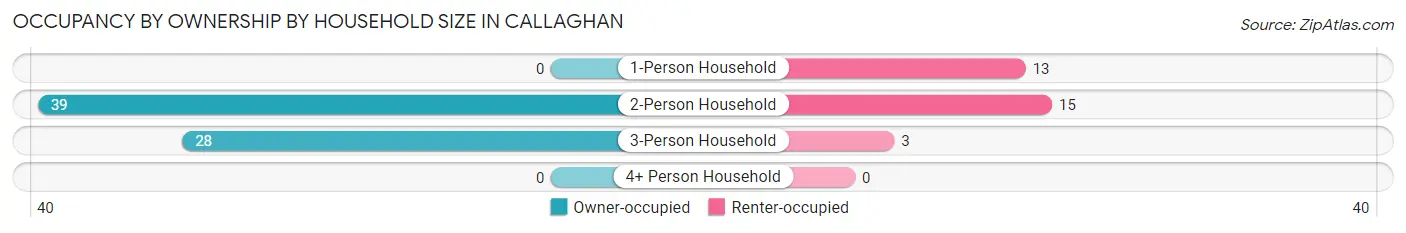
| Household Size | Owner-occupied | Renter-occupied |
| 1-Person Household | 0 (0.0%) | 13 (100.0%) |
| 2-Person Household | 39 (72.2%) | 15 (27.8%) |
| 3-Person Household | 28 (90.3%) | 3 (9.7%) |
| 4+ Person Household | 0 (0.0%) | 0 (0.0%) |
| Total Housing Units | 67 (68.4%) | 31 (31.6%) |
Occupancy by Educational Attainment in Callaghan
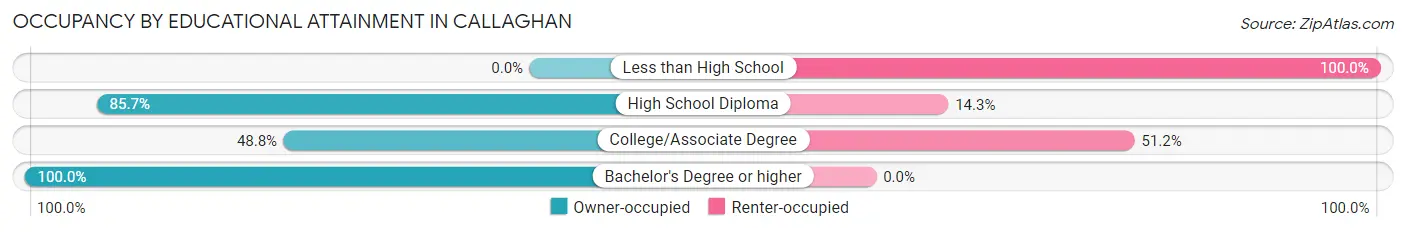
| Household Size | Owner-occupied | Renter-occupied |
| Less than High School | 0 (0.0%) | 3 (100.0%) |
| High School Diploma | 42 (85.7%) | 7 (14.3%) |
| College/Associate Degree | 20 (48.8%) | 21 (51.2%) |
| Bachelor's Degree or higher | 5 (100.0%) | 0 (0.0%) |
Occupancy by Age of Householder in Callaghan
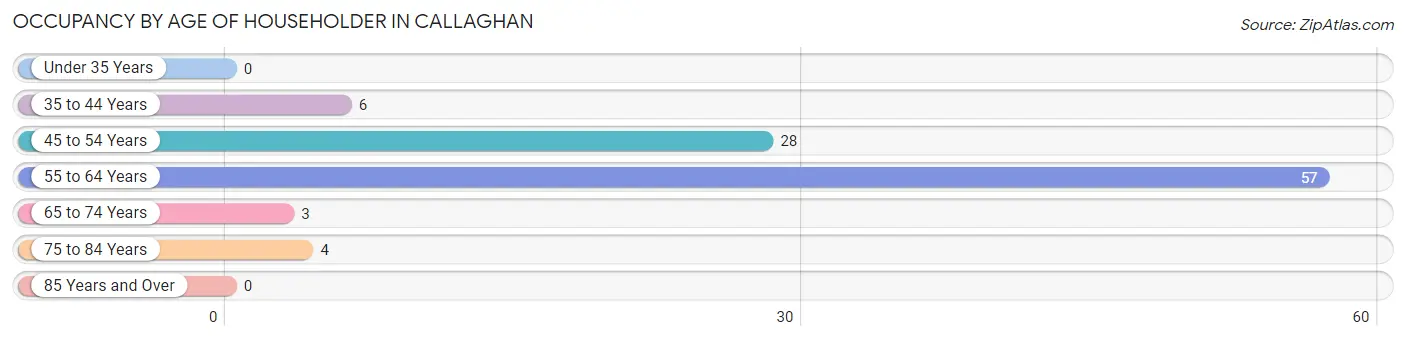
| Age Bracket | # Households | % Households |
| Under 35 Years | 0 | 0.0% |
| 35 to 44 Years | 6 | 6.1% |
| 45 to 54 Years | 28 | 28.6% |
| 55 to 64 Years | 57 | 58.2% |
| 65 to 74 Years | 3 | 3.1% |
| 75 to 84 Years | 4 | 4.1% |
| 85 Years and Over | 0 | 0.0% |
| Total | 98 | 100.0% |
Housing Finances in Callaghan
Median Income by Occupancy in Callaghan
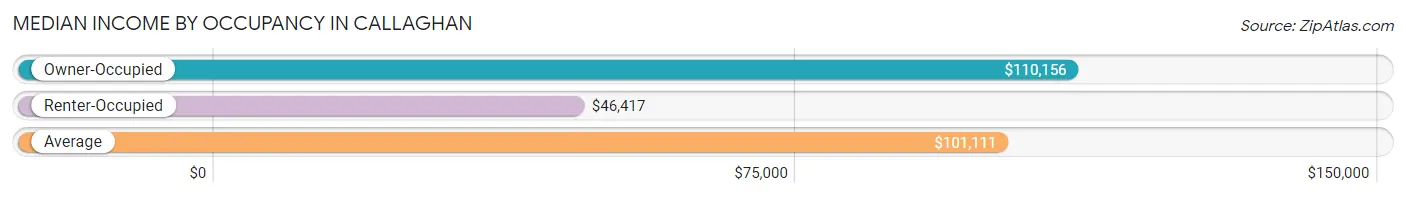
| Occupancy Type | # Households | Median Income |
| Owner-Occupied | 67 (68.4%) | $110,156 |
| Renter-Occupied | 31 (31.6%) | $46,417 |
| Average | 98 (100.0%) | $101,111 |
Occupancy by Householder Income Bracket in Callaghan
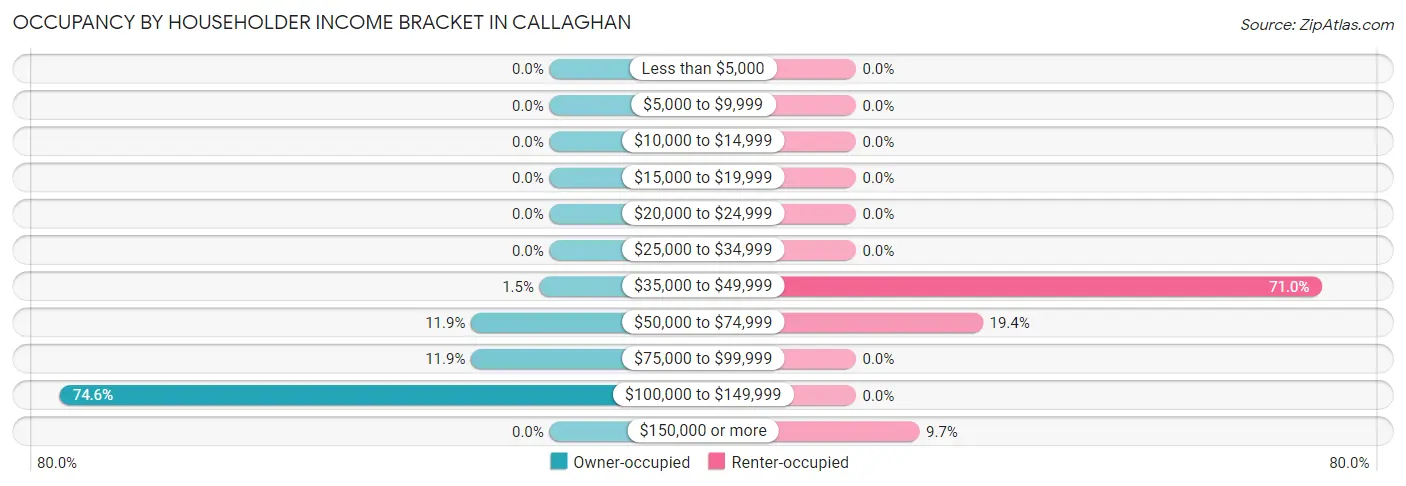
| Income Bracket | Owner-occupied | Renter-occupied |
| Less than $5,000 | 0 (0.0%) | 0 (0.0%) |
| $5,000 to $9,999 | 0 (0.0%) | 0 (0.0%) |
| $10,000 to $14,999 | 0 (0.0%) | 0 (0.0%) |
| $15,000 to $19,999 | 0 (0.0%) | 0 (0.0%) |
| $20,000 to $24,999 | 0 (0.0%) | 0 (0.0%) |
| $25,000 to $34,999 | 0 (0.0%) | 0 (0.0%) |
| $35,000 to $49,999 | 1 (1.5%) | 22 (71.0%) |
| $50,000 to $74,999 | 8 (11.9%) | 6 (19.4%) |
| $75,000 to $99,999 | 8 (11.9%) | 0 (0.0%) |
| $100,000 to $149,999 | 50 (74.6%) | 0 (0.0%) |
| $150,000 or more | 0 (0.0%) | 3 (9.7%) |
| Total | 67 (100.0%) | 31 (100.0%) |
Monthly Housing Cost Tiers in Callaghan
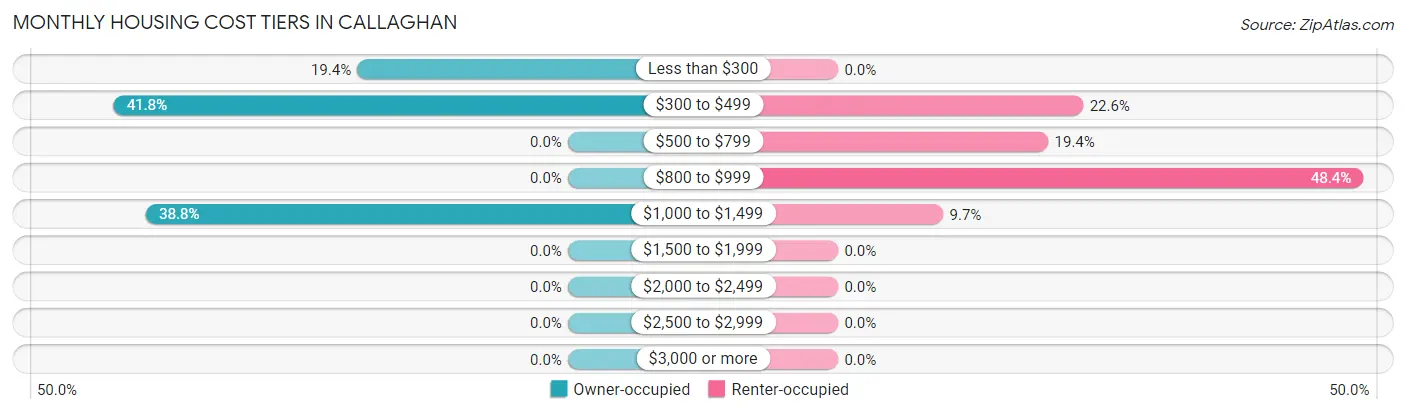
| Monthly Cost | Owner-occupied | Renter-occupied |
| Less than $300 | 13 (19.4%) | 0 (0.0%) |
| $300 to $499 | 28 (41.8%) | 7 (22.6%) |
| $500 to $799 | 0 (0.0%) | 6 (19.4%) |
| $800 to $999 | 0 (0.0%) | 15 (48.4%) |
| $1,000 to $1,499 | 26 (38.8%) | 3 (9.7%) |
| $1,500 to $1,999 | 0 (0.0%) | 0 (0.0%) |
| $2,000 to $2,499 | 0 (0.0%) | 0 (0.0%) |
| $2,500 to $2,999 | 0 (0.0%) | 0 (0.0%) |
| $3,000 or more | 0 (0.0%) | 0 (0.0%) |
| Total | 67 (100.0%) | 31 (100.0%) |
Physical Housing Characteristics in Callaghan
Housing Structures in Callaghan
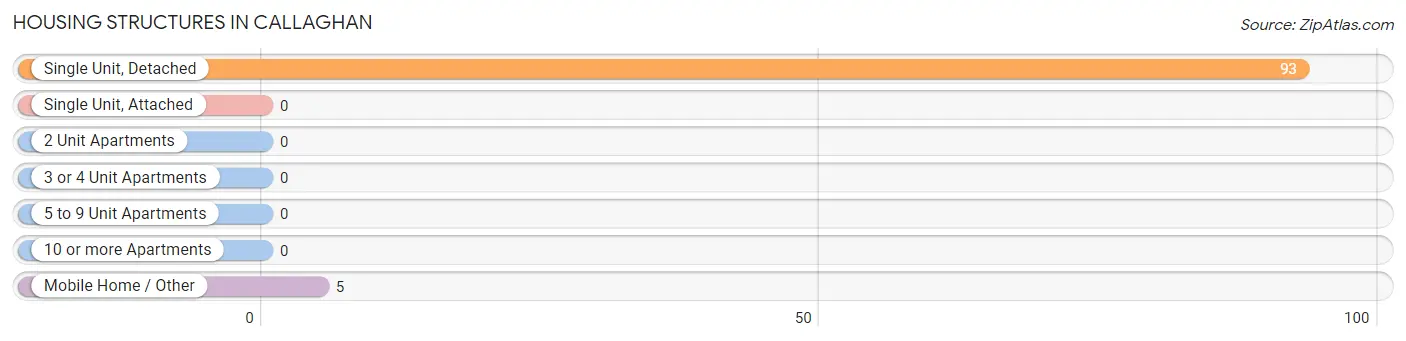
| Structure Type | # Housing Units | % Housing Units |
| Single Unit, Detached | 93 | 94.9% |
| Single Unit, Attached | 0 | 0.0% |
| 2 Unit Apartments | 0 | 0.0% |
| 3 or 4 Unit Apartments | 0 | 0.0% |
| 5 to 9 Unit Apartments | 0 | 0.0% |
| 10 or more Apartments | 0 | 0.0% |
| Mobile Home / Other | 5 | 5.1% |
| Total | 98 | 100.0% |
Housing Structures by Occupancy in Callaghan
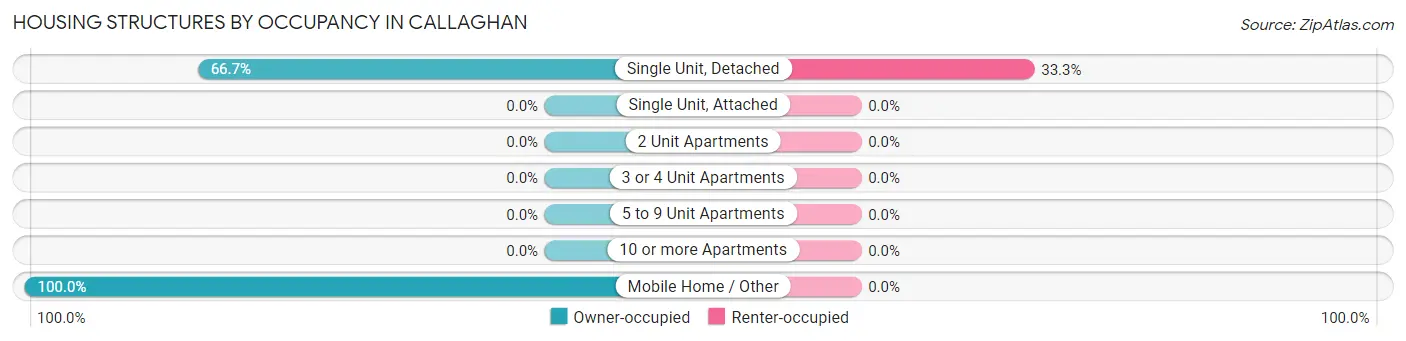
| Structure Type | Owner-occupied | Renter-occupied |
| Single Unit, Detached | 62 (66.7%) | 31 (33.3%) |
| Single Unit, Attached | 0 (0.0%) | 0 (0.0%) |
| 2 Unit Apartments | 0 (0.0%) | 0 (0.0%) |
| 3 or 4 Unit Apartments | 0 (0.0%) | 0 (0.0%) |
| 5 to 9 Unit Apartments | 0 (0.0%) | 0 (0.0%) |
| 10 or more Apartments | 0 (0.0%) | 0 (0.0%) |
| Mobile Home / Other | 5 (100.0%) | 0 (0.0%) |
| Total | 67 (68.4%) | 31 (31.6%) |
Housing Structures by Number of Rooms in Callaghan
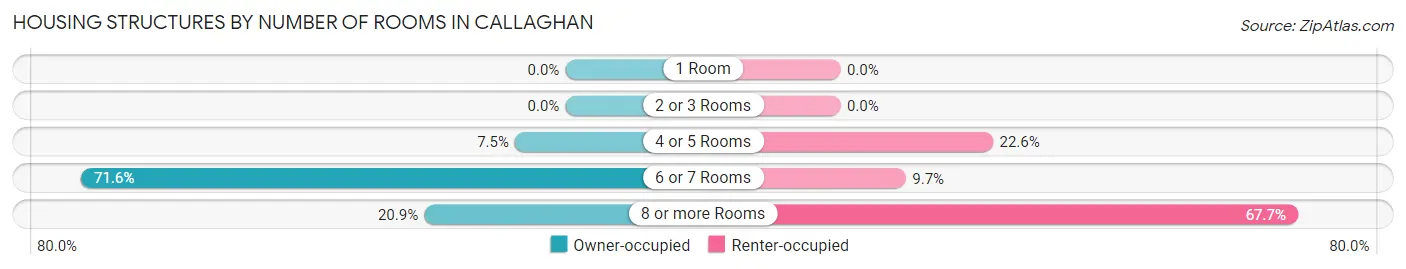
| Number of Rooms | Owner-occupied | Renter-occupied |
| 1 Room | 0 (0.0%) | 0 (0.0%) |
| 2 or 3 Rooms | 0 (0.0%) | 0 (0.0%) |
| 4 or 5 Rooms | 5 (7.5%) | 7 (22.6%) |
| 6 or 7 Rooms | 48 (71.6%) | 3 (9.7%) |
| 8 or more Rooms | 14 (20.9%) | 21 (67.7%) |
| Total | 67 (100.0%) | 31 (100.0%) |
Housing Structure by Heating Type in Callaghan
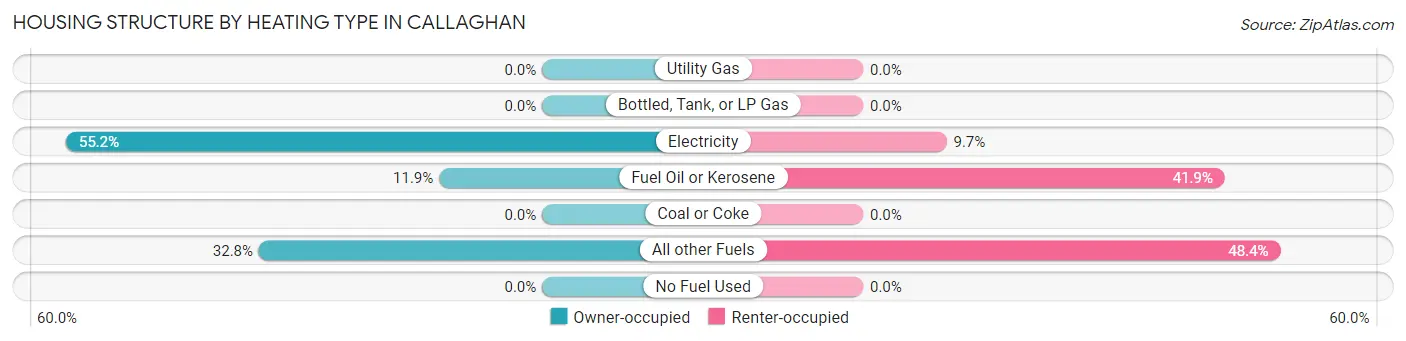
| Heating Type | Owner-occupied | Renter-occupied |
| Utility Gas | 0 (0.0%) | 0 (0.0%) |
| Bottled, Tank, or LP Gas | 0 (0.0%) | 0 (0.0%) |
| Electricity | 37 (55.2%) | 3 (9.7%) |
| Fuel Oil or Kerosene | 8 (11.9%) | 13 (41.9%) |
| Coal or Coke | 0 (0.0%) | 0 (0.0%) |
| All other Fuels | 22 (32.8%) | 15 (48.4%) |
| No Fuel Used | 0 (0.0%) | 0 (0.0%) |
| Total | 67 (100.0%) | 31 (100.0%) |
Household Vehicle Usage in Callaghan
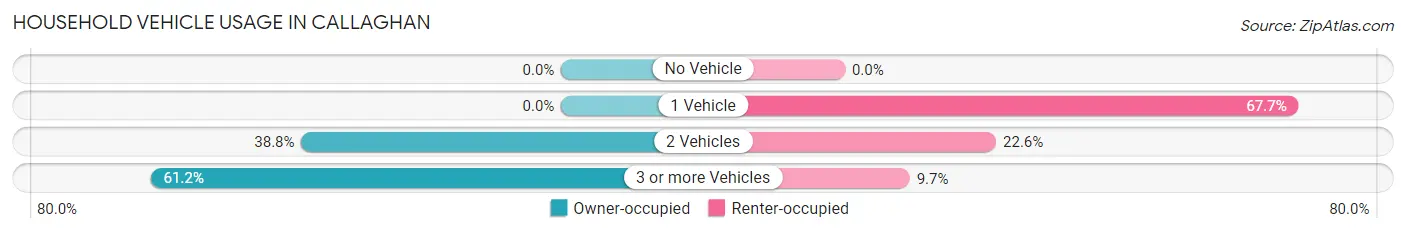
| Vehicles per Household | Owner-occupied | Renter-occupied |
| No Vehicle | 0 (0.0%) | 0 (0.0%) |
| 1 Vehicle | 0 (0.0%) | 21 (67.7%) |
| 2 Vehicles | 26 (38.8%) | 7 (22.6%) |
| 3 or more Vehicles | 41 (61.2%) | 3 (9.7%) |
| Total | 67 (100.0%) | 31 (100.0%) |
Real Estate & Mortgages in Callaghan
Real Estate and Mortgage Overview in Callaghan
| Characteristic | Without Mortgage | With Mortgage |
| Housing Units | 41 | 26 |
| Median Property Value | $153,800 | $0 |
| Median Household Income | $100,972 | $0 |
| Monthly Housing Costs | $322 | $0 |
| Real Estate Taxes | $782 | $0 |
Property Value by Mortgage Status in Callaghan
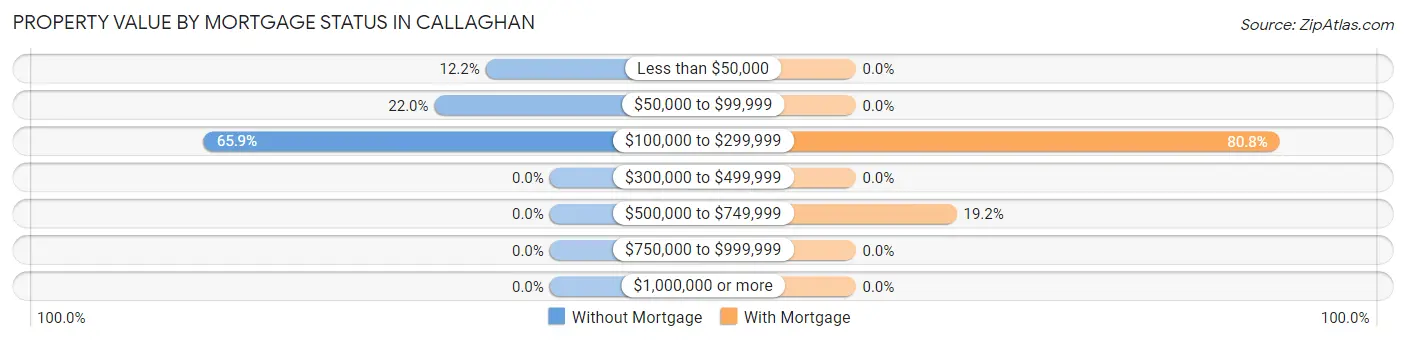
| Property Value | Without Mortgage | With Mortgage |
| Less than $50,000 | 5 (12.2%) | 0 (0.0%) |
| $50,000 to $99,999 | 9 (22.0%) | 0 (0.0%) |
| $100,000 to $299,999 | 27 (65.8%) | 21 (80.8%) |
| $300,000 to $499,999 | 0 (0.0%) | 0 (0.0%) |
| $500,000 to $749,999 | 0 (0.0%) | 5 (19.2%) |
| $750,000 to $999,999 | 0 (0.0%) | 0 (0.0%) |
| $1,000,000 or more | 0 (0.0%) | 0 (0.0%) |
| Total | 41 (100.0%) | 26 (100.0%) |
Household Income by Mortgage Status in Callaghan
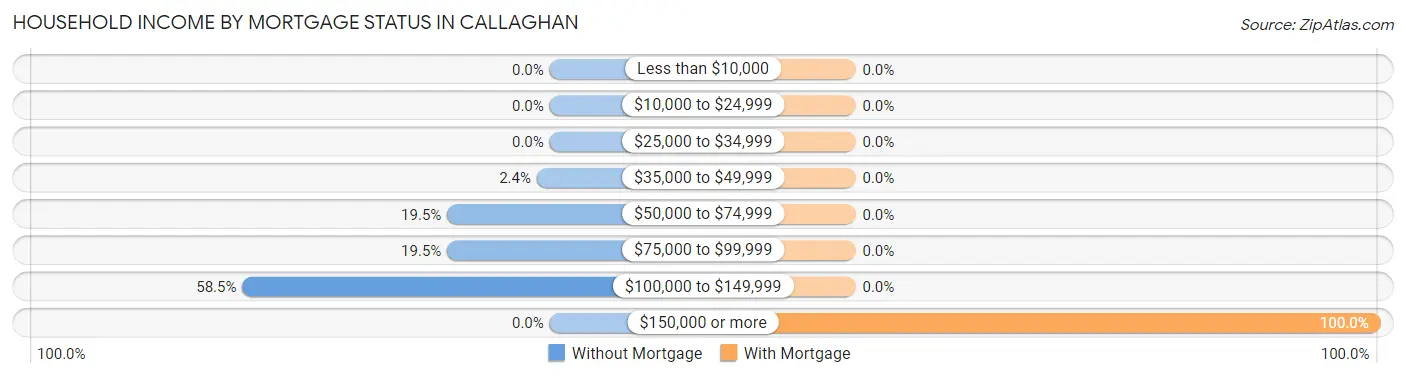
| Household Income | Without Mortgage | With Mortgage |
| Less than $10,000 | 0 (0.0%) | 0 (0.0%) |
| $10,000 to $24,999 | 0 (0.0%) | 0 (0.0%) |
| $25,000 to $34,999 | 0 (0.0%) | 0 (0.0%) |
| $35,000 to $49,999 | 1 (2.4%) | 0 (0.0%) |
| $50,000 to $74,999 | 8 (19.5%) | 0 (0.0%) |
| $75,000 to $99,999 | 8 (19.5%) | 0 (0.0%) |
| $100,000 to $149,999 | 24 (58.5%) | 0 (0.0%) |
| $150,000 or more | 0 (0.0%) | 26 (100.0%) |
| Total | 41 (100.0%) | 26 (100.0%) |
Property Value to Household Income Ratio in Callaghan
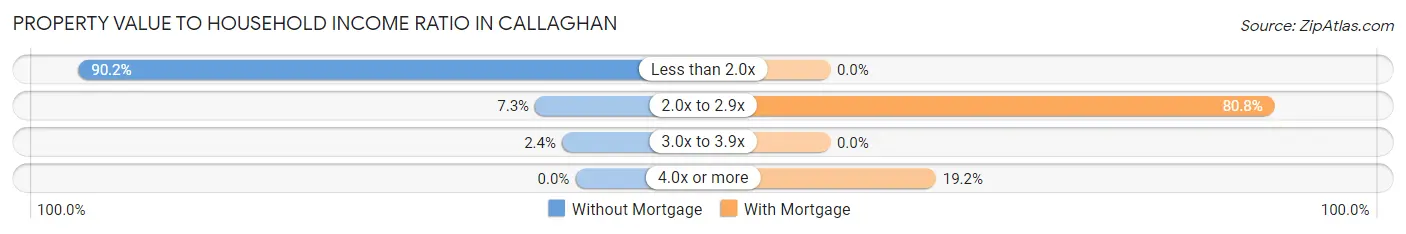
| Value-to-Income Ratio | Without Mortgage | With Mortgage |
| Less than 2.0x | 37 (90.2%) | 0 (0.0%) |
| 2.0x to 2.9x | 3 (7.3%) | 21 (80.8%) |
| 3.0x to 3.9x | 1 (2.4%) | 0 (0.0%) |
| 4.0x or more | 0 (0.0%) | 5 (19.2%) |
| Total | 41 (100.0%) | 26 (100.0%) |
Real Estate Taxes by Mortgage Status in Callaghan
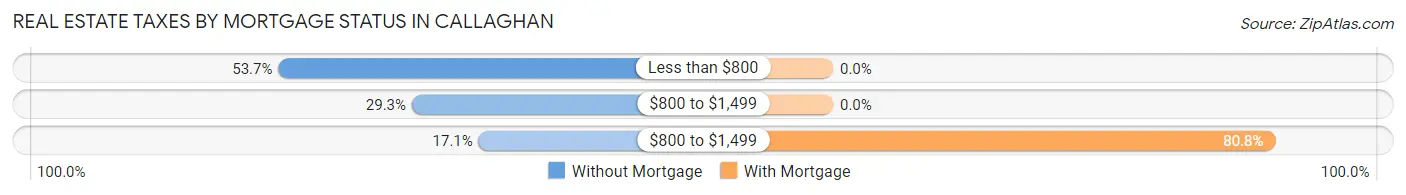
| Property Taxes | Without Mortgage | With Mortgage |
| Less than $800 | 22 (53.7%) | 0 (0.0%) |
| $800 to $1,499 | 12 (29.3%) | 0 (0.0%) |
| $800 to $1,499 | 7 (17.1%) | 21 (80.8%) |
| Total | 41 (100.0%) | 26 (100.0%) |
Health & Disability in Callaghan
Health Insurance Coverage by Age in Callaghan
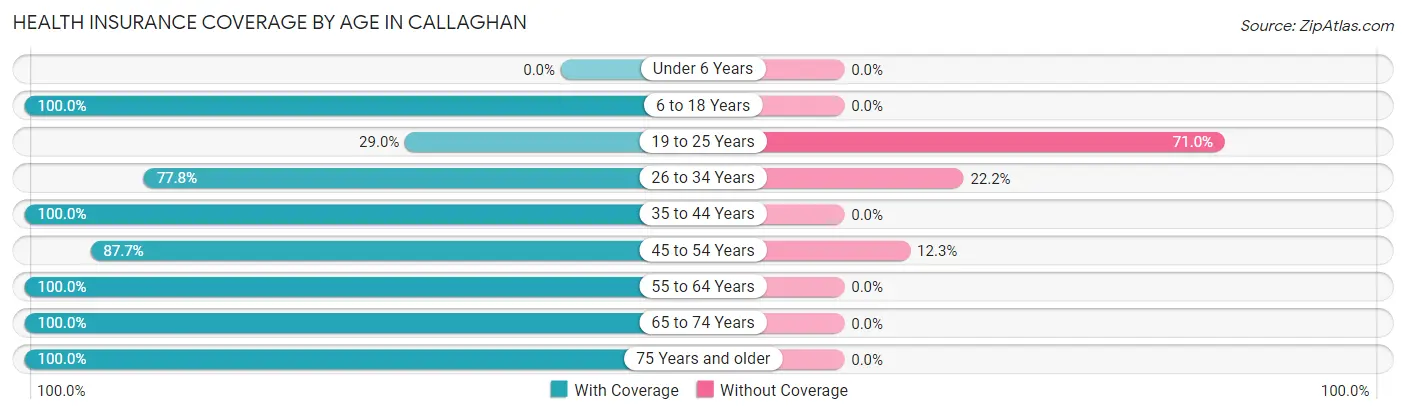
| Age Bracket | With Coverage | Without Coverage |
| Under 6 Years | 0 (0.0%) | 0 (0.0%) |
| 6 to 18 Years | 24 (100.0%) | 0 (0.0%) |
| 19 to 25 Years | 9 (29.0%) | 22 (71.0%) |
| 26 to 34 Years | 28 (77.8%) | 8 (22.2%) |
| 35 to 44 Years | 29 (100.0%) | 0 (0.0%) |
| 45 to 54 Years | 50 (87.7%) | 7 (12.3%) |
| 55 to 64 Years | 97 (100.0%) | 0 (0.0%) |
| 65 to 74 Years | 37 (100.0%) | 0 (0.0%) |
| 75 Years and older | 6 (100.0%) | 0 (0.0%) |
| Total | 280 (88.3%) | 37 (11.7%) |
Health Insurance Coverage by Citizenship Status in Callaghan
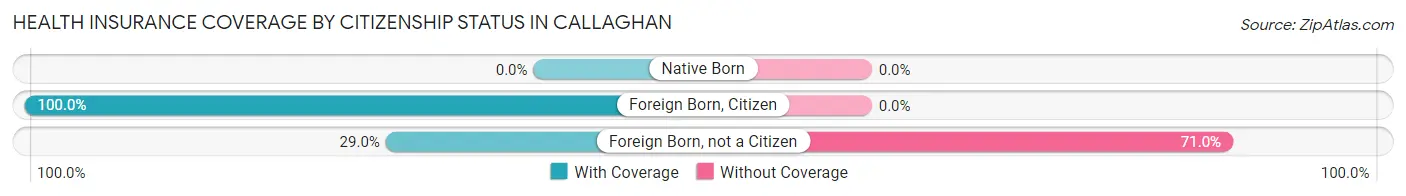
| Citizenship Status | With Coverage | Without Coverage |
| Native Born | 0 (0.0%) | 0 (0.0%) |
| Foreign Born, Citizen | 24 (100.0%) | 0 (0.0%) |
| Foreign Born, not a Citizen | 9 (29.0%) | 22 (71.0%) |
Health Insurance Coverage by Household Income in Callaghan
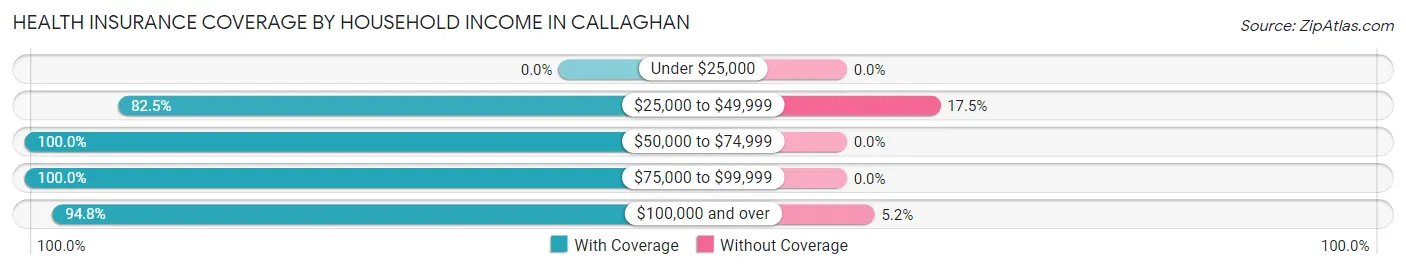
| Household Income | With Coverage | Without Coverage |
| Under $25,000 | 0 (0.0%) | 0 (0.0%) |
| $25,000 to $49,999 | 33 (82.5%) | 7 (17.5%) |
| $50,000 to $74,999 | 25 (100.0%) | 0 (0.0%) |
| $75,000 to $99,999 | 13 (100.0%) | 0 (0.0%) |
| $100,000 and over | 146 (94.8%) | 8 (5.2%) |
Public vs Private Health Insurance Coverage by Age in Callaghan
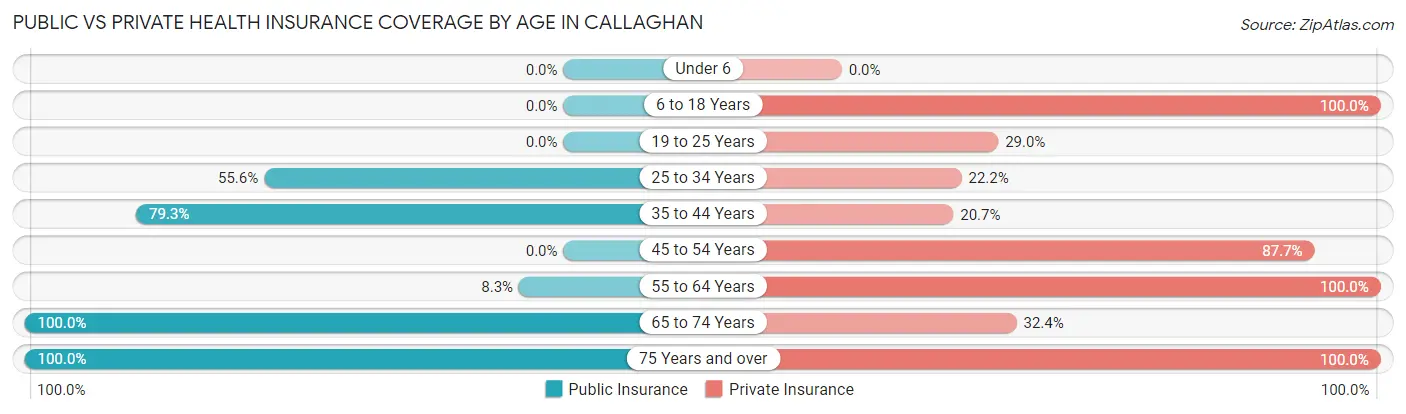
| Age Bracket | Public Insurance | Private Insurance |
| Under 6 | 0 (0.0%) | 0 (0.0%) |
| 6 to 18 Years | 0 (0.0%) | 24 (100.0%) |
| 19 to 25 Years | 0 (0.0%) | 9 (29.0%) |
| 25 to 34 Years | 20 (55.6%) | 8 (22.2%) |
| 35 to 44 Years | 23 (79.3%) | 6 (20.7%) |
| 45 to 54 Years | 0 (0.0%) | 50 (87.7%) |
| 55 to 64 Years | 8 (8.3%) | 97 (100.0%) |
| 65 to 74 Years | 37 (100.0%) | 12 (32.4%) |
| 75 Years and over | 6 (100.0%) | 6 (100.0%) |
| Total | 94 (29.6%) | 212 (66.9%) |
Disability Status by Sex by Age in Callaghan
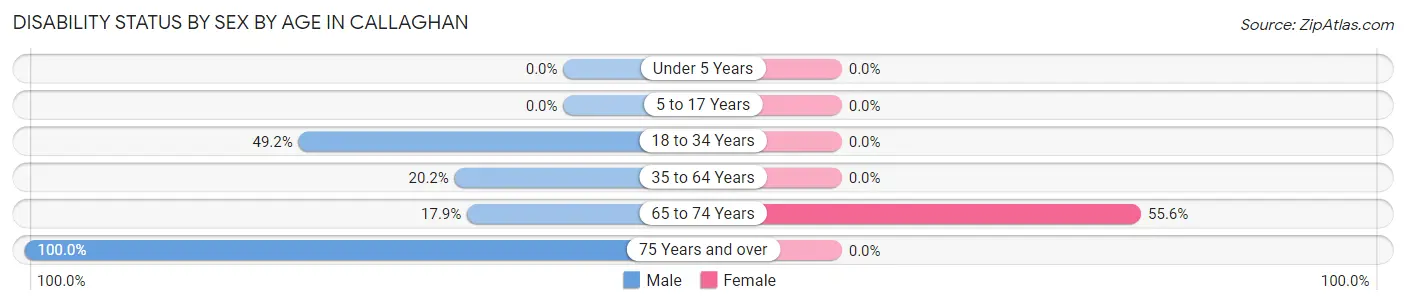
| Age Bracket | Male | Female |
| Under 5 Years | 0 (0.0%) | 0 (0.0%) |
| 5 to 17 Years | 0 (0.0%) | 0 (0.0%) |
| 18 to 34 Years | 29 (49.1%) | 0 (0.0%) |
| 35 to 64 Years | 23 (20.2%) | 0 (0.0%) |
| 65 to 74 Years | 5 (17.9%) | 5 (55.6%) |
| 75 Years and over | 1 (100.0%) | 0 (0.0%) |
Disability Class by Sex by Age in Callaghan
Disability Class: Hearing Difficulty
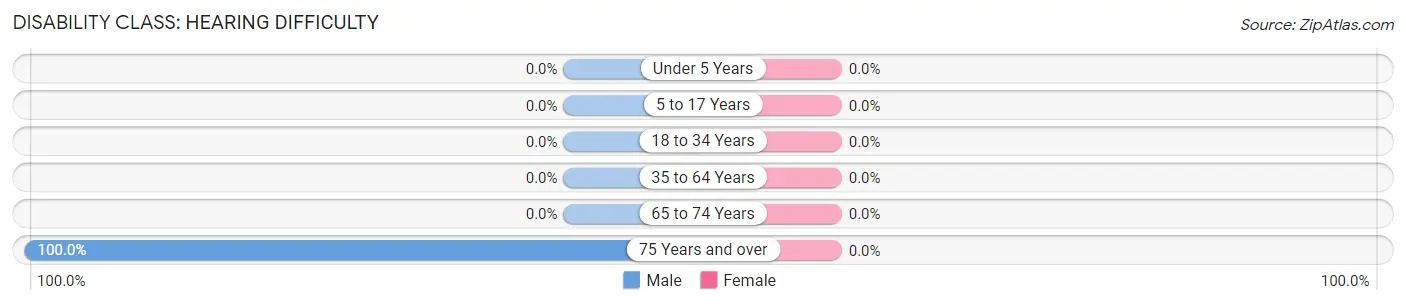
| Age Bracket | Male | Female |
| Under 5 Years | 0 (0.0%) | 0 (0.0%) |
| 5 to 17 Years | 0 (0.0%) | 0 (0.0%) |
| 18 to 34 Years | 0 (0.0%) | 0 (0.0%) |
| 35 to 64 Years | 0 (0.0%) | 0 (0.0%) |
| 65 to 74 Years | 0 (0.0%) | 0 (0.0%) |
| 75 Years and over | 1 (100.0%) | 0 (0.0%) |
Disability Class: Vision Difficulty
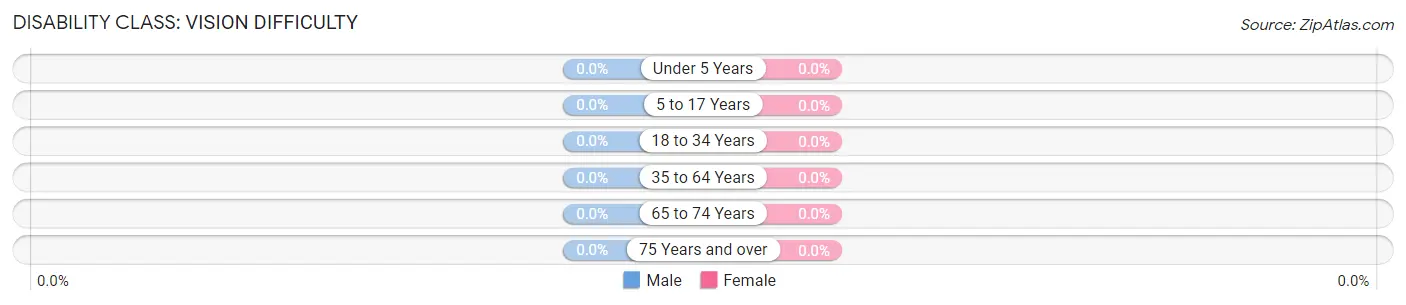
| Age Bracket | Male | Female |
| Under 5 Years | 0 (0.0%) | 0 (0.0%) |
| 5 to 17 Years | 0 (0.0%) | 0 (0.0%) |
| 18 to 34 Years | 0 (0.0%) | 0 (0.0%) |
| 35 to 64 Years | 0 (0.0%) | 0 (0.0%) |
| 65 to 74 Years | 0 (0.0%) | 0 (0.0%) |
| 75 Years and over | 0 (0.0%) | 0 (0.0%) |
Disability Class: Cognitive Difficulty
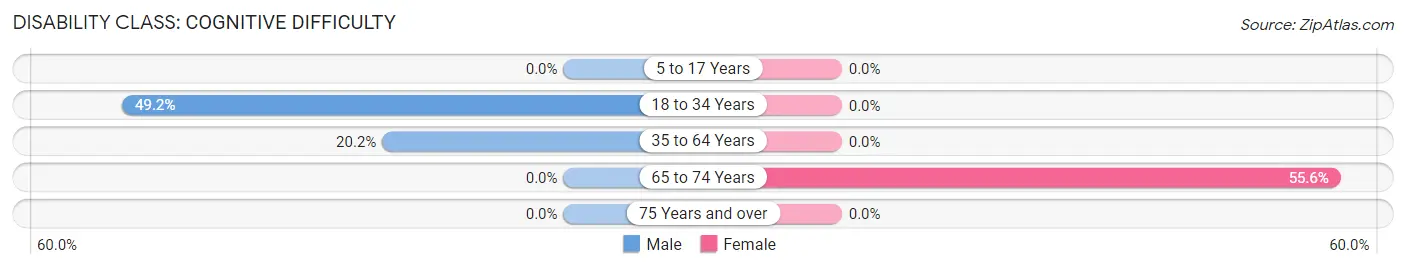
| Age Bracket | Male | Female |
| 5 to 17 Years | 0 (0.0%) | 0 (0.0%) |
| 18 to 34 Years | 29 (49.1%) | 0 (0.0%) |
| 35 to 64 Years | 23 (20.2%) | 0 (0.0%) |
| 65 to 74 Years | 0 (0.0%) | 5 (55.6%) |
| 75 Years and over | 0 (0.0%) | 0 (0.0%) |
Disability Class: Ambulatory Difficulty
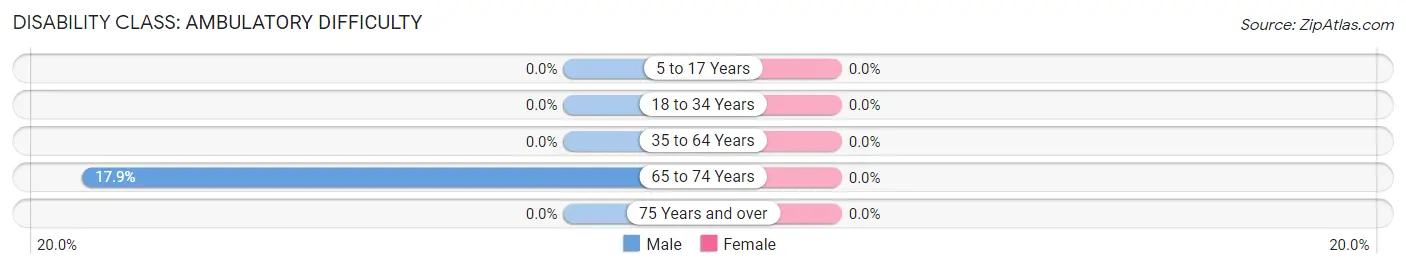
| Age Bracket | Male | Female |
| 5 to 17 Years | 0 (0.0%) | 0 (0.0%) |
| 18 to 34 Years | 0 (0.0%) | 0 (0.0%) |
| 35 to 64 Years | 0 (0.0%) | 0 (0.0%) |
| 65 to 74 Years | 5 (17.9%) | 0 (0.0%) |
| 75 Years and over | 0 (0.0%) | 0 (0.0%) |
Disability Class: Self-Care Difficulty
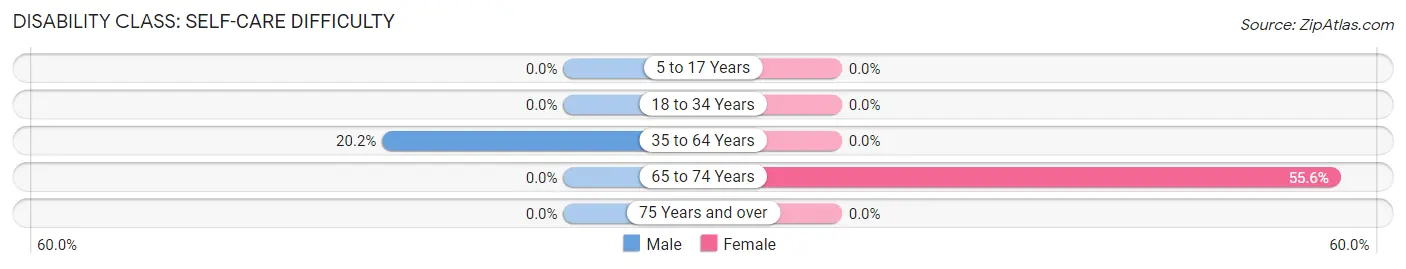
| Age Bracket | Male | Female |
| 5 to 17 Years | 0 (0.0%) | 0 (0.0%) |
| 18 to 34 Years | 0 (0.0%) | 0 (0.0%) |
| 35 to 64 Years | 23 (20.2%) | 0 (0.0%) |
| 65 to 74 Years | 0 (0.0%) | 5 (55.6%) |
| 75 Years and over | 0 (0.0%) | 0 (0.0%) |
Technology Access in Callaghan
Computing Device Access in Callaghan
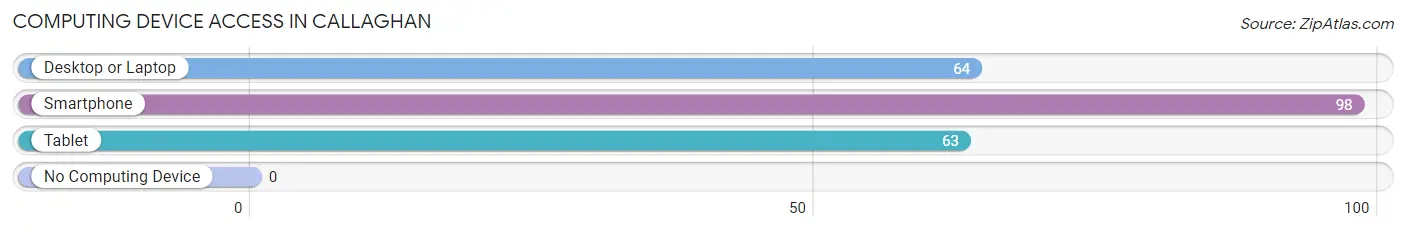
| Device Type | # Households | % Households |
| Desktop or Laptop | 64 | 65.3% |
| Smartphone | 98 | 100.0% |
| Tablet | 63 | 64.3% |
| No Computing Device | 0 | 0.0% |
| Total | 98 | 100.0% |
Internet Access in Callaghan
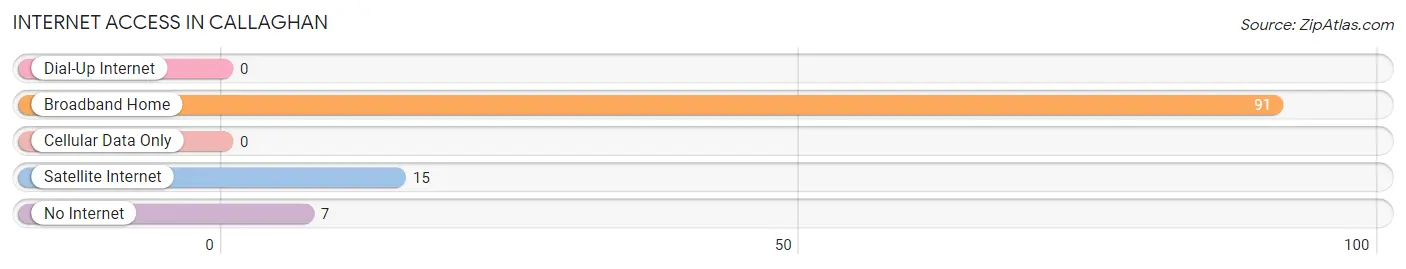
| Internet Type | # Households | % Households |
| Dial-Up Internet | 0 | 0.0% |
| Broadband Home | 91 | 92.9% |
| Cellular Data Only | 0 | 0.0% |
| Satellite Internet | 15 | 15.3% |
| No Internet | 7 | 7.1% |
| Total | 98 | 100.0% |
Callaghan Summary
Virginia, located in the Mid-Atlantic region of the United States, is a state with a rich history and a diverse population. It is the 12th most populous state in the country and the 35th largest in terms of land area. Virginia is bordered by Maryland and Washington, D.C. to the north, West Virginia to the west, North Carolina and Tennessee to the south, and the Atlantic Ocean to the east.
Geography
Virginia is divided into two distinct regions: the Coastal Plain and the Piedmont. The Coastal Plain is a flat, low-lying area that stretches from the Atlantic Ocean to the Fall Line, which marks the boundary between the Coastal Plain and the Piedmont. The Piedmont is a hilly region that covers the majority of the state. The Blue Ridge Mountains, part of the Appalachian Mountains, run through the western part of the state. The highest point in Virginia is Mount Rogers, which stands at 5,729 feet.
The climate of Virginia is generally mild, with hot summers and cold winters. The average temperature in the summer is around 80°F, while the average temperature in the winter is around 40°F. The state receives an average of 40 inches of precipitation per year, with most of it falling in the spring and summer months.
Economy
Virginia has a diverse economy that is driven by a variety of industries. The state’s largest industry is the federal government, which employs over 400,000 people in the state. Other major industries include agriculture, manufacturing, technology, and tourism.
Agriculture is a major part of the state’s economy, with the top crops being soybeans, corn, wheat, hay, and tobacco. The state is also home to a large number of wineries and breweries, which produce a variety of wines and beers.
Manufacturing is another important part of the state’s economy. Virginia is home to a number of large companies, such as General Electric, Northrop Grumman, and Newport News Shipbuilding. The state is also home to a number of technology companies, such as Amazon, Microsoft, and Oracle.
Tourism is also a major part of the state’s economy. Virginia is home to a number of popular tourist destinations, such as Colonial Williamsburg, the Blue Ridge Parkway, and Shenandoah National Park.
Demographics
As of 2019, Virginia had an estimated population of 8.5 million people. The state is racially and ethnically diverse, with the largest racial group being White (63.7%), followed by Black or African American (20.3%), Hispanic or Latino (8.7%), and Asian (5.7%).
The median household income in Virginia is $71,535, which is higher than the national median of $61,937. The state’s poverty rate is 11.2%, which is lower than the national rate of 13.1%.
Conclusion
Virginia is a state with a rich history and a diverse population. It has a diverse economy that is driven by a variety of industries, including agriculture, manufacturing, technology, and tourism. The state is racially and ethnically diverse, with the largest racial group being White. The median household income in Virginia is higher than the national median, and the state’s poverty rate is lower than the national rate.
Common Questions
What is Per Capita Income in Callaghan?
Per Capita income in Callaghan is $42,332.
What is the Median Family Income in Callaghan?
Median Family Income in Callaghan is $105,536.
What is the Median Household income in Callaghan?
Median Household Income in Callaghan is $101,111.
What is Inequality or Gini Index in Callaghan?
Inequality or Gini Index in Callaghan is 0.41.
What is the Total Population of Callaghan?
Total Population of Callaghan is 317.
What is the Total Male Population of Callaghan?
Total Male Population of Callaghan is 226.
What is the Total Female Population of Callaghan?
Total Female Population of Callaghan is 91.
What is the Ratio of Males per 100 Females in Callaghan?
There are 248.35 Males per 100 Females in Callaghan.
What is the Ratio of Females per 100 Males in Callaghan?
There are 40.27 Females per 100 Males in Callaghan.
What is the Median Population Age in Callaghan?
Median Population Age in Callaghan is 48.4 Years.
What is the Average Family Size in Callaghan
Average Family Size in Callaghan is 2.5 People.
What is the Average Household Size in Callaghan
Average Household Size in Callaghan is 2.4 People.
How Large is the Labor Force in Callaghan?
There are 210 People in the Labor Forcein in Callaghan.
What is the Percentage of People in the Labor Force in Callaghan?
66.2% of People are in the Labor Force in Callaghan.
What is the Unemployment Rate in Callaghan?
Unemployment Rate in Callaghan is 1.4%.