Motley, VA Map & Demographics
Motley Map
Motley Overview
$27,874
PER CAPITA INCOME
$67,692
AVG FAMILY INCOME
$43,125
AVG HOUSEHOLD INCOME
38.2%
WAGE / INCOME GAP [ % ]
61.8¢/ $1
WAGE / INCOME GAP [ $ ]
0.43
INEQUALITY / GINI INDEX
762
TOTAL POPULATION
389
MALE POPULATION
373
FEMALE POPULATION
104.29
MALES / 100 FEMALES
95.89
FEMALES / 100 MALES
56.4
MEDIAN AGE
2.6
AVG FAMILY SIZE
2.2
AVG HOUSEHOLD SIZE
336
LABOR FORCE [ PEOPLE ]
47.2%
PERCENT IN LABOR FORCE
0.6%
UNEMPLOYMENT RATE
Income in Motley
Income Overview in Motley
Per Capita Income in Motley is $27,874, while median incomes of families and households are $67,692 and $43,125 respectively.
| Characteristic | Number | Measure |
| Per Capita Income | 762 | $27,874 |
| Median Family Income | 208 | $67,692 |
| Mean Family Income | 208 | $79,947 |
| Median Household Income | 344 | $43,125 |
| Mean Household Income | 344 | $59,252 |
| Income Deficit | 208 | $0 |
| Wage / Income Gap (%) | 762 | 38.15% |
| Wage / Income Gap ($) | 762 | 61.85¢ per $1 |
| Gini / Inequality Index | 762 | 0.43 |
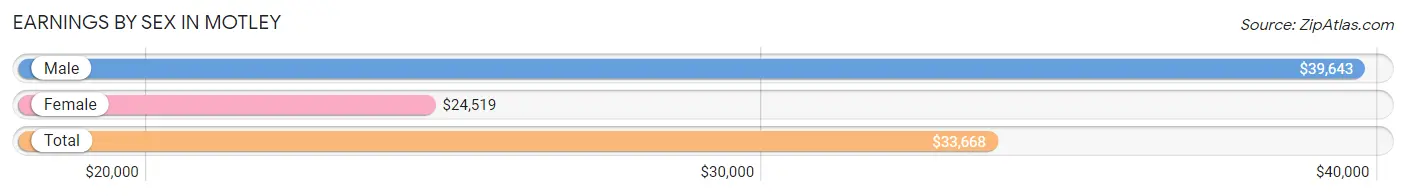
Earnings by Sex in Motley
Average Earnings in Motley are $33,668, $39,643 for men and $24,519 for women, a difference of 38.2%.
| Sex | Number | Average Earnings |
| Male | 148 (40.6%) | $39,643 |
| Female | 217 (59.5%) | $24,519 |
| Total | 365 (100.0%) | $33,668 |
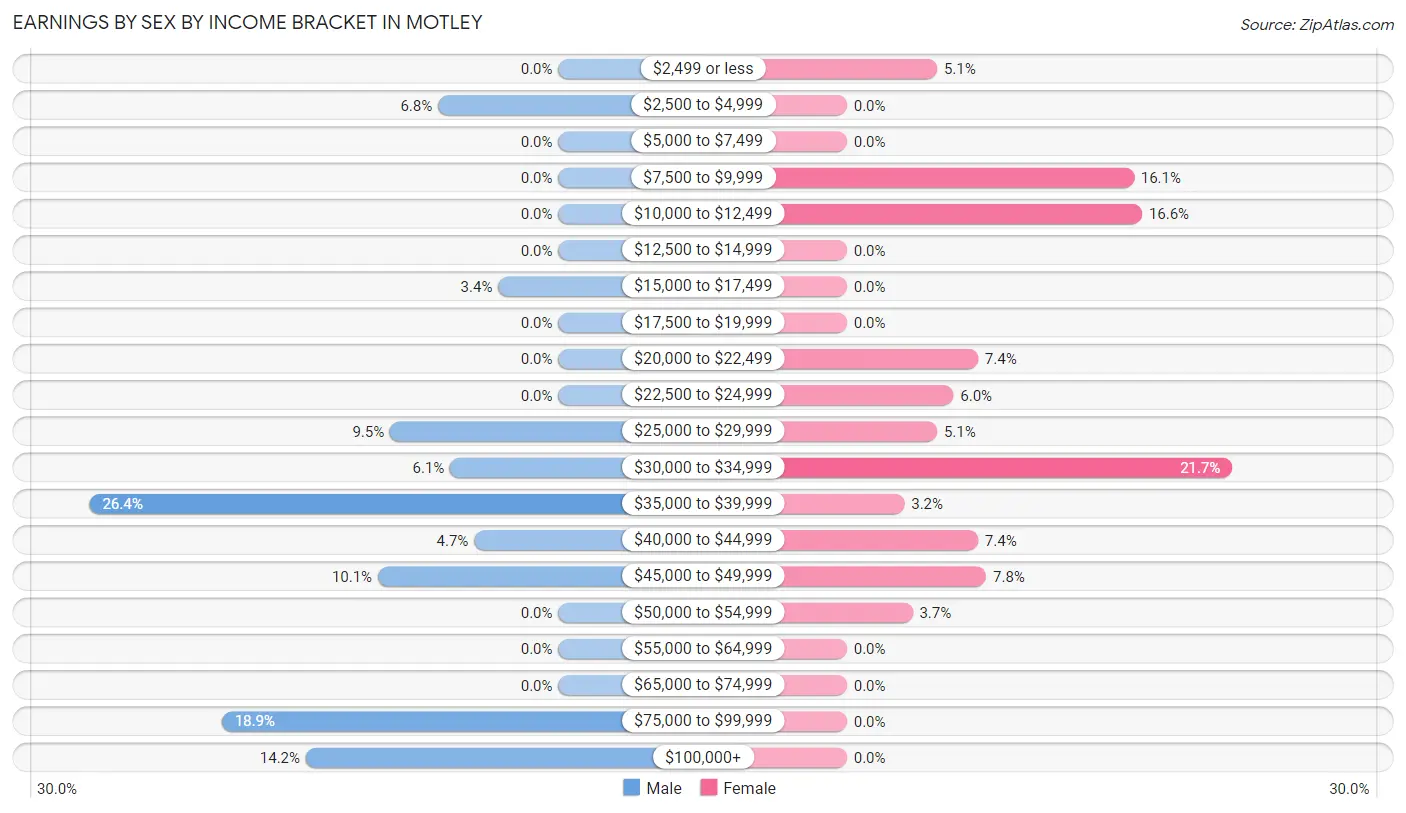
Earnings by Sex by Income Bracket in Motley
The most common earnings brackets in Motley are $35,000 to $39,999 for men (39 | 26.4%) and $30,000 to $34,999 for women (47 | 21.7%).
| Income | Male | Female |
| $2,499 or less | 0 (0.0%) | 11 (5.1%) |
| $2,500 to $4,999 | 10 (6.8%) | 0 (0.0%) |
| $5,000 to $7,499 | 0 (0.0%) | 0 (0.0%) |
| $7,500 to $9,999 | 0 (0.0%) | 35 (16.1%) |
| $10,000 to $12,499 | 0 (0.0%) | 36 (16.6%) |
| $12,500 to $14,999 | 0 (0.0%) | 0 (0.0%) |
| $15,000 to $17,499 | 5 (3.4%) | 0 (0.0%) |
| $17,500 to $19,999 | 0 (0.0%) | 0 (0.0%) |
| $20,000 to $22,499 | 0 (0.0%) | 16 (7.4%) |
| $22,500 to $24,999 | 0 (0.0%) | 13 (6.0%) |
| $25,000 to $29,999 | 14 (9.5%) | 11 (5.1%) |
| $30,000 to $34,999 | 9 (6.1%) | 47 (21.7%) |
| $35,000 to $39,999 | 39 (26.4%) | 7 (3.2%) |
| $40,000 to $44,999 | 7 (4.7%) | 16 (7.4%) |
| $45,000 to $49,999 | 15 (10.1%) | 17 (7.8%) |
| $50,000 to $54,999 | 0 (0.0%) | 8 (3.7%) |
| $55,000 to $64,999 | 0 (0.0%) | 0 (0.0%) |
| $65,000 to $74,999 | 0 (0.0%) | 0 (0.0%) |
| $75,000 to $99,999 | 28 (18.9%) | 0 (0.0%) |
| $100,000+ | 21 (14.2%) | 0 (0.0%) |
| Total | 148 (100.0%) | 217 (100.0%) |
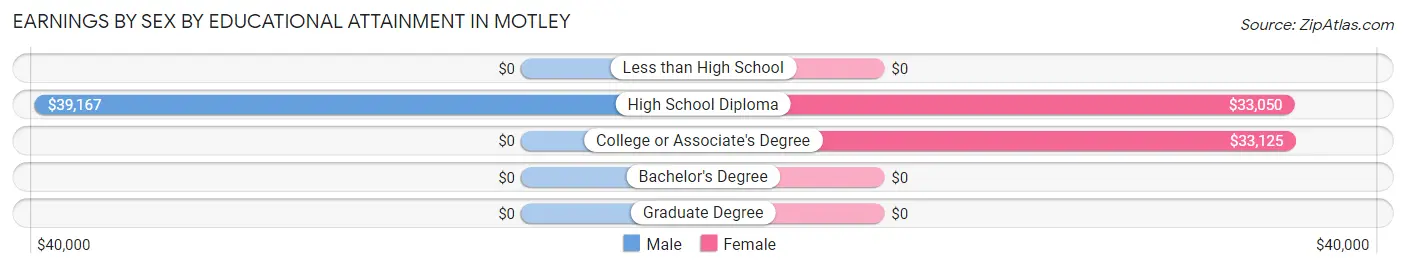
Earnings by Sex by Educational Attainment in Motley
Average earnings in Motley are $42,321 for men and $30,500 for women, a difference of 27.9%. Men with an educational attainment of high school diploma enjoy the highest average annual earnings of $39,167, while those with high school diploma education earn the least with $39,167. Women with an educational attainment of college or associate's degree earn the most with the average annual earnings of $33,125, while those with high school diploma education have the smallest earnings of $33,050.
| Educational Attainment | Male Income | Female Income |
| Less than High School | - | - |
| High School Diploma | $39,167 | $33,050 |
| College or Associate's Degree | - | - |
| Bachelor's Degree | - | - |
| Graduate Degree | - | - |
| Total | $42,321 | $30,500 |
Family Income in Motley
Family Income Brackets in Motley
According to the Motley family income data, there are 65 families falling into the $75,000 to $99,999 income range, which is the most common income bracket and makes up 31.2% of all families.
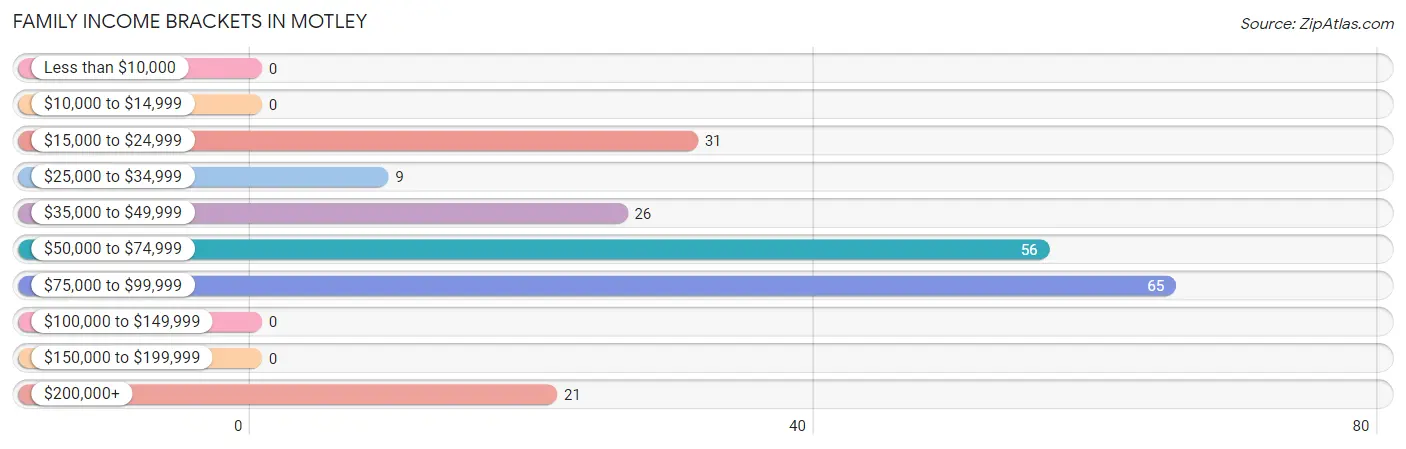
| Income Bracket | # Families | % Families |
| Less than $10,000 | 0 | 0.0% |
| $10,000 to $14,999 | 0 | 0.0% |
| $15,000 to $24,999 | 31 | 14.9% |
| $25,000 to $34,999 | 9 | 4.3% |
| $35,000 to $49,999 | 26 | 12.5% |
| $50,000 to $74,999 | 56 | 26.9% |
| $75,000 to $99,999 | 65 | 31.3% |
| $100,000 to $149,999 | 0 | 0.0% |
| $150,000 to $199,999 | 0 | 0.0% |
| $200,000+ | 21 | 10.1% |
Family Income by Famaliy Size in Motley
3-person families (94 | 45.2%) account for the highest median family income in Motley with $69,423 per family, while 2-person families (114 | 54.8%) have the highest median income of $31,250 per family member.
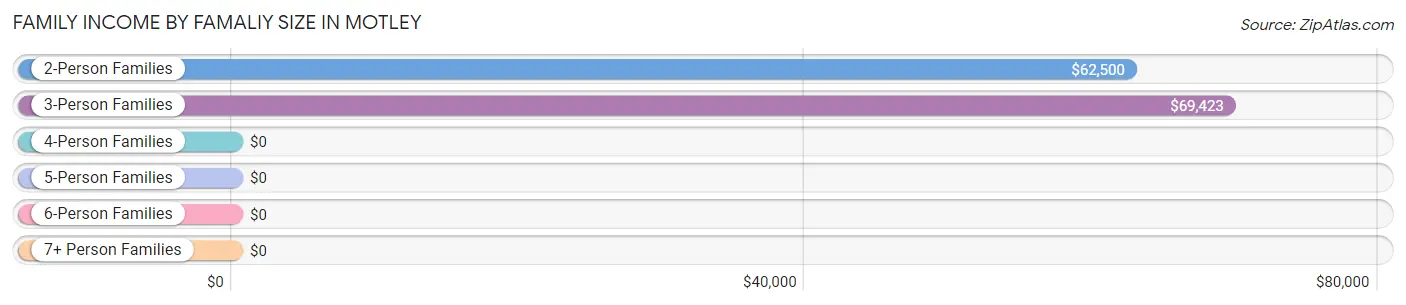
| Income Bracket | # Families | Median Income |
| 2-Person Families | 114 (54.8%) | $62,500 |
| 3-Person Families | 94 (45.2%) | $69,423 |
| 4-Person Families | 0 (0.0%) | $0 |
| 5-Person Families | 0 (0.0%) | $0 |
| 6-Person Families | 0 (0.0%) | $0 |
| 7+ Person Families | 0 (0.0%) | $0 |
| Total | 208 (100.0%) | $67,692 |
Family Income by Number of Earners in Motley
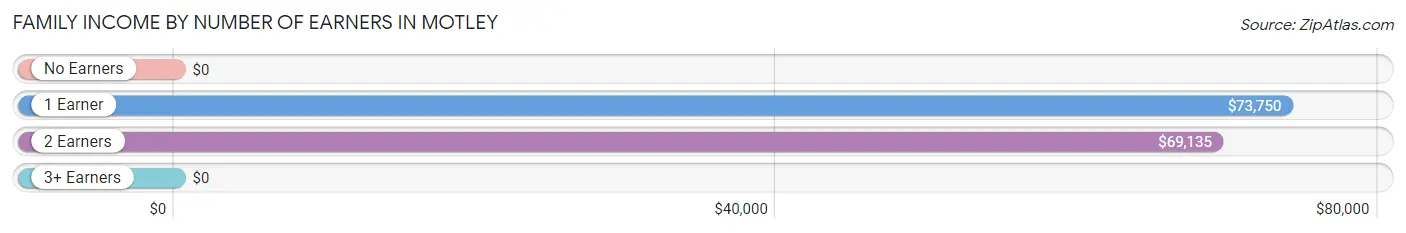
| Number of Earners | # Families | Median Income |
| No Earners | 34 (16.4%) | $0 |
| 1 Earner | 106 (51.0%) | $73,750 |
| 2 Earners | 61 (29.3%) | $69,135 |
| 3+ Earners | 7 (3.4%) | $0 |
| Total | 208 (100.0%) | $67,692 |
Household Income in Motley
Household Income Brackets in Motley
With 80 households falling in the category, the $35,000 to $49,999 income range is the most frequent in Motley, accounting for 23.3% of all households.
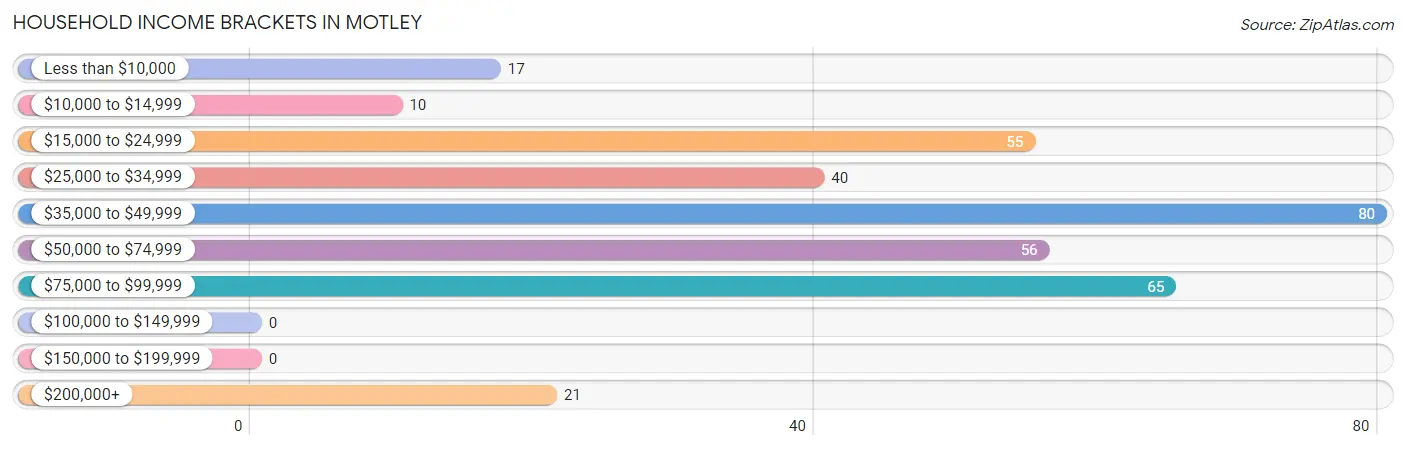
| Income Bracket | # Households | % Households |
| Less than $10,000 | 17 | 4.9% |
| $10,000 to $14,999 | 10 | 2.9% |
| $15,000 to $24,999 | 55 | 16.0% |
| $25,000 to $34,999 | 40 | 11.6% |
| $35,000 to $49,999 | 80 | 23.3% |
| $50,000 to $74,999 | 56 | 16.3% |
| $75,000 to $99,999 | 65 | 18.9% |
| $100,000 to $149,999 | 0 | 0.0% |
| $150,000 to $199,999 | 0 | 0.0% |
| $200,000+ | 21 | 6.1% |
Household Income by Householder Age in Motley
The median household income in Motley is $43,125, with the highest median household income of $61,250 found in the 45 to 64 years age bracket for the primary householder. A total of 192 households (55.8%) fall into this category. Meanwhile, the 15 to 24 years age bracket for the primary householder has the lowest median household income of $0, with 10 households (2.9%) in this group.
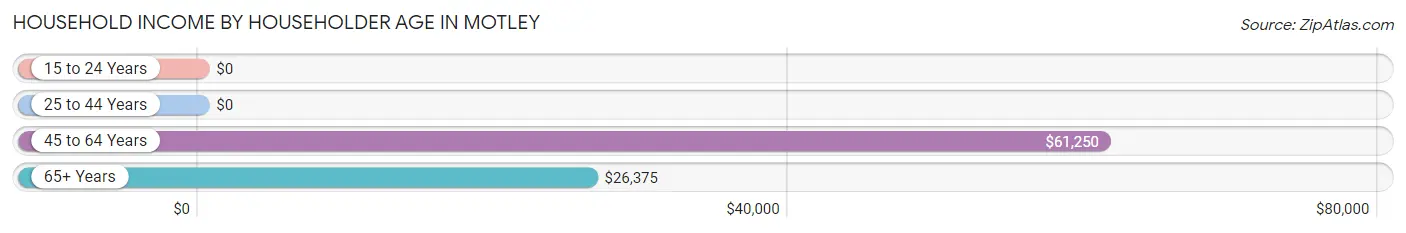
| Income Bracket | # Households | Median Income |
| 15 to 24 Years | 10 (2.9%) | $0 |
| 25 to 44 Years | 21 (6.1%) | $0 |
| 45 to 64 Years | 192 (55.8%) | $61,250 |
| 65+ Years | 121 (35.2%) | $26,375 |
| Total | 344 (100.0%) | $43,125 |
Poverty in Motley
Income Below Poverty by Sex and Age in Motley
With 17.7% poverty level for males and 11.5% for females among the residents of Motley, under 5 year old males and 35 to 44 year old females are the most vulnerable to poverty, with 8 males (100.0%) and 5 females (100.0%) in their respective age groups living below the poverty level.
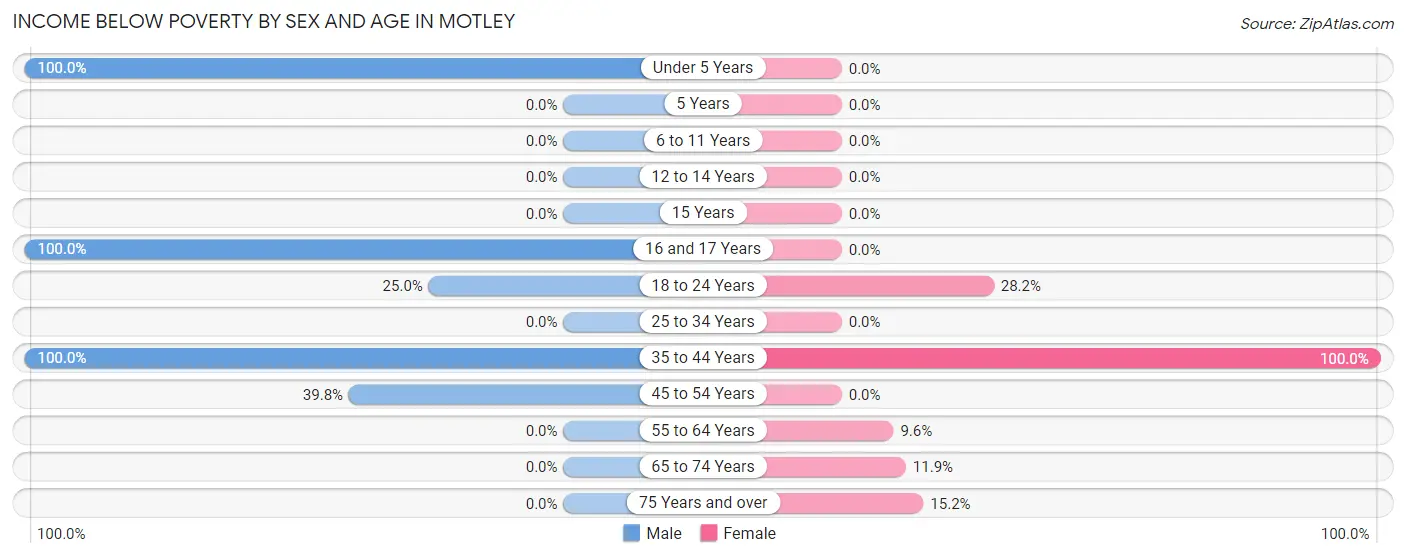
| Age Bracket | Male | Female |
| Under 5 Years | 8 (100.0%) | 0 (0.0%) |
| 5 Years | 0 (0.0%) | 0 (0.0%) |
| 6 to 11 Years | 0 (0.0%) | 0 (0.0%) |
| 12 to 14 Years | 0 (0.0%) | 0 (0.0%) |
| 15 Years | 0 (0.0%) | 0 (0.0%) |
| 16 and 17 Years | 7 (100.0%) | 0 (0.0%) |
| 18 to 24 Years | 10 (25.0%) | 11 (28.2%) |
| 25 to 34 Years | 0 (0.0%) | 0 (0.0%) |
| 35 to 44 Years | 5 (100.0%) | 5 (100.0%) |
| 45 to 54 Years | 39 (39.8%) | 0 (0.0%) |
| 55 to 64 Years | 0 (0.0%) | 7 (9.6%) |
| 65 to 74 Years | 0 (0.0%) | 10 (11.9%) |
| 75 Years and over | 0 (0.0%) | 10 (15.1%) |
| Total | 69 (17.7%) | 43 (11.5%) |
Income Above Poverty by Sex and Age in Motley
According to the poverty statistics in Motley, males aged 6 to 11 years and females aged 6 to 11 years are the age groups that are most secure financially, with 100.0% of males and 100.0% of females in these age groups living above the poverty line.
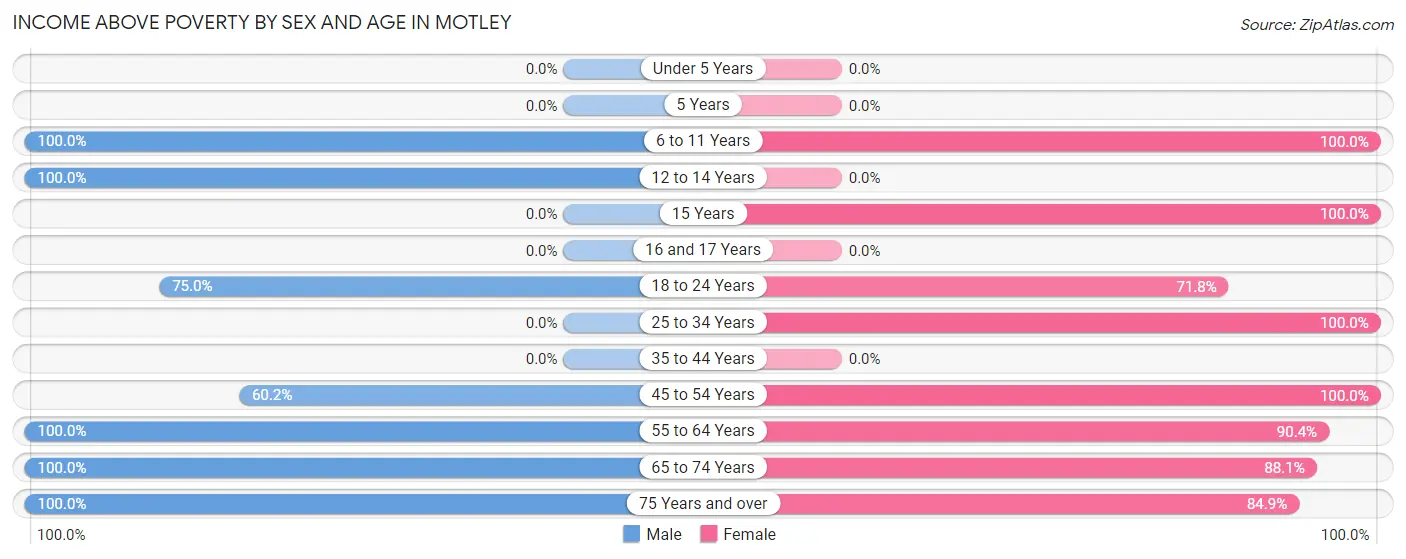
| Age Bracket | Male | Female |
| Under 5 Years | 0 (0.0%) | 0 (0.0%) |
| 5 Years | 0 (0.0%) | 0 (0.0%) |
| 6 to 11 Years | 17 (100.0%) | 11 (100.0%) |
| 12 to 14 Years | 7 (100.0%) | 0 (0.0%) |
| 15 Years | 0 (0.0%) | 7 (100.0%) |
| 16 and 17 Years | 0 (0.0%) | 0 (0.0%) |
| 18 to 24 Years | 30 (75.0%) | 28 (71.8%) |
| 25 to 34 Years | 0 (0.0%) | 16 (100.0%) |
| 35 to 44 Years | 0 (0.0%) | 0 (0.0%) |
| 45 to 54 Years | 59 (60.2%) | 72 (100.0%) |
| 55 to 64 Years | 121 (100.0%) | 66 (90.4%) |
| 65 to 74 Years | 28 (100.0%) | 74 (88.1%) |
| 75 Years and over | 58 (100.0%) | 56 (84.9%) |
| Total | 320 (82.3%) | 330 (88.5%) |
Income Below Poverty Among Married-Couple Families in Motley
The poverty statistics for married-couple families in Motley show that 4.0% or 5 of the total 126 families live below the poverty line. Families with 1 or 2 children have the highest poverty rate of 50.0%, comprising of 5 families. On the other hand, families with no children have the lowest poverty rate of 0.0%, which includes 0 families.
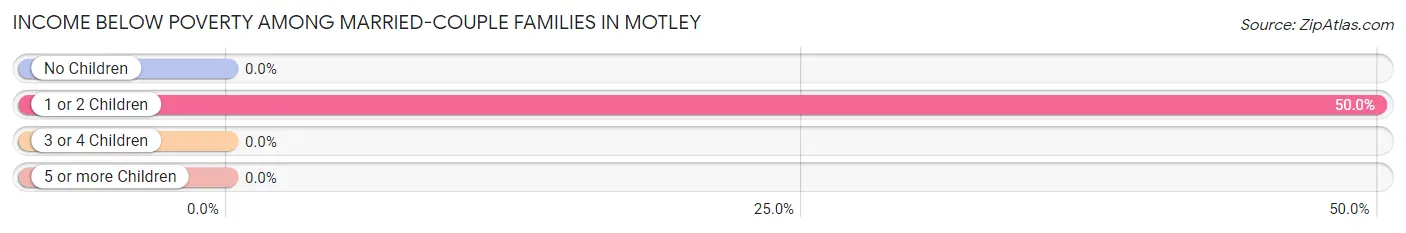
| Children | Above Poverty | Below Poverty |
| No Children | 116 (100.0%) | 0 (0.0%) |
| 1 or 2 Children | 5 (50.0%) | 5 (50.0%) |
| 3 or 4 Children | 0 (0.0%) | 0 (0.0%) |
| 5 or more Children | 0 (0.0%) | 0 (0.0%) |
| Total | 121 (96.0%) | 5 (4.0%) |
Income Below Poverty Among Single-Parent Households in Motley
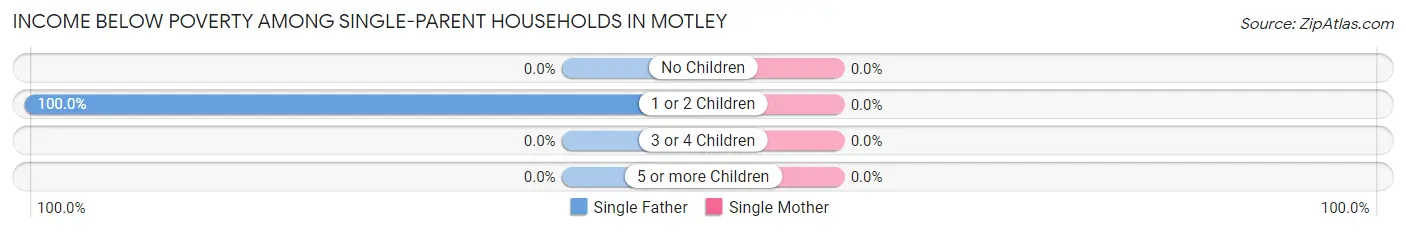
| Children | Single Father | Single Mother |
| No Children | 0 (0.0%) | 0 (0.0%) |
| 1 or 2 Children | 10 (100.0%) | 0 (0.0%) |
| 3 or 4 Children | 0 (0.0%) | 0 (0.0%) |
| 5 or more Children | 0 (0.0%) | 0 (0.0%) |
| Total | 10 (32.3%) | 0 (0.0%) |
Income Below Poverty Among Married-Couple vs Single-Parent Households in Motley
The poverty data for Motley shows that 5 of the married-couple family households (4.0%) and 10 of the single-parent households (12.2%) are living below the poverty level. Within the married-couple family households, those with 1 or 2 children have the highest poverty rate, with 5 households (50.0%) falling below the poverty line. Among the single-parent households, those with 1 or 2 children have the highest poverty rate, with 10 household (32.3%) living below poverty.
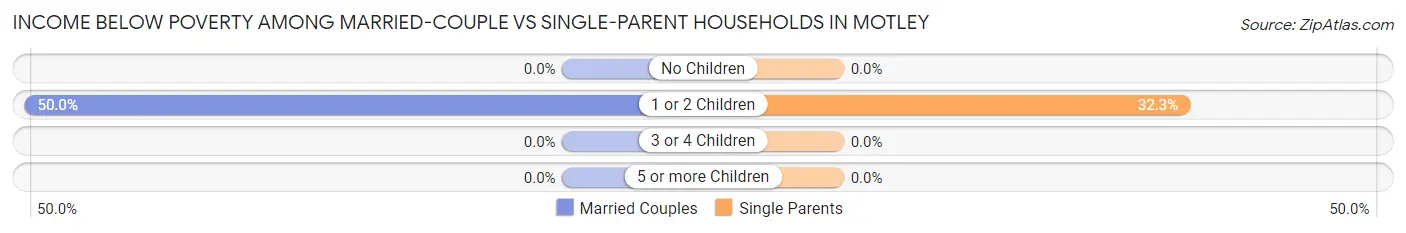
| Children | Married-Couple Families | Single-Parent Households |
| No Children | 0 (0.0%) | 0 (0.0%) |
| 1 or 2 Children | 5 (50.0%) | 10 (32.3%) |
| 3 or 4 Children | 0 (0.0%) | 0 (0.0%) |
| 5 or more Children | 0 (0.0%) | 0 (0.0%) |
| Total | 5 (4.0%) | 10 (12.2%) |
Race in Motley
The most populous races in Motley are White / Caucasian (586 | 76.9%), Black / African American (141 | 18.5%), and Two or more Races (35 | 4.6%).
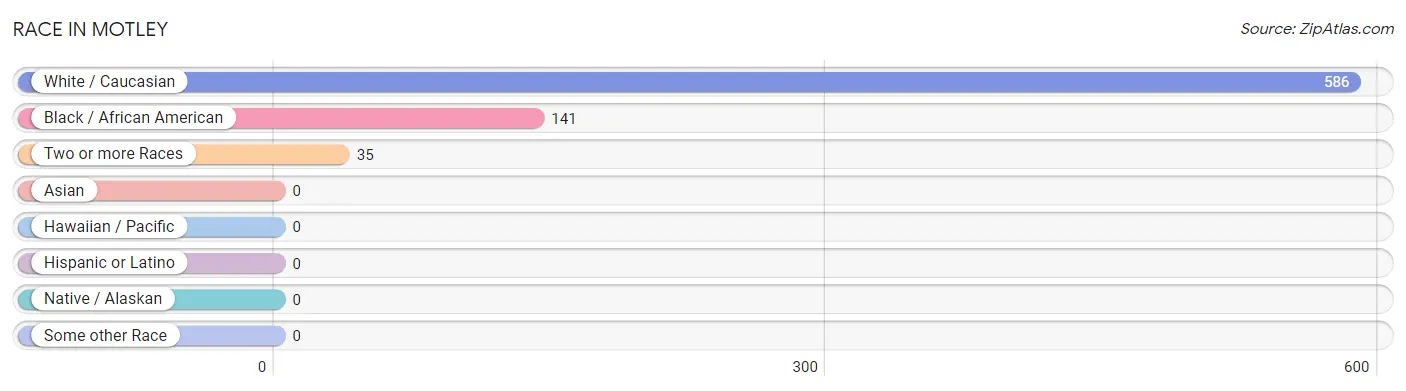
| Race | # Population | % Population |
| Asian | 0 | 0.0% |
| Black / African American | 141 | 18.5% |
| Hawaiian / Pacific | 0 | 0.0% |
| Hispanic or Latino | 0 | 0.0% |
| Native / Alaskan | 0 | 0.0% |
| White / Caucasian | 586 | 76.9% |
| Two or more Races | 35 | 4.6% |
| Some other Race | 0 | 0.0% |
| Total | 762 | 100.0% |
Ancestry in Motley
The most populous ancestries reported in Motley are American (233 | 30.6%), English (100 | 13.1%), Scottish (36 | 4.7%), Irish (22 | 2.9%), and French (19 | 2.5%), together accounting for 53.8% of all Motley residents.
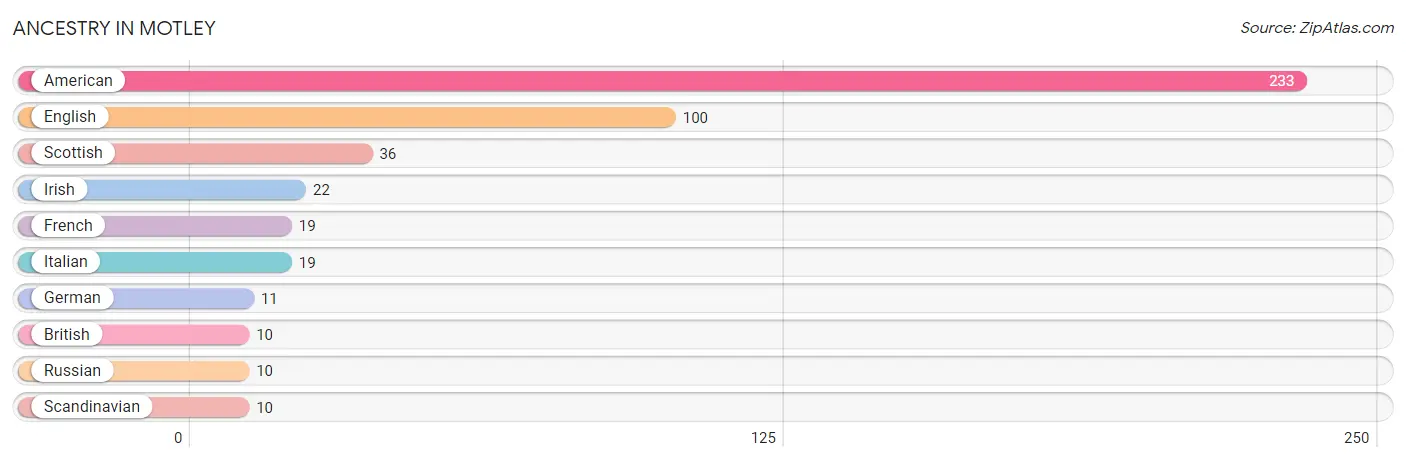
| Ancestry | # Population | % Population |
| American | 233 | 30.6% |
| British | 10 | 1.3% |
| English | 100 | 13.1% |
| French | 19 | 2.5% |
| German | 11 | 1.4% |
| Irish | 22 | 2.9% |
| Italian | 19 | 2.5% |
| Russian | 10 | 1.3% |
| Scandinavian | 10 | 1.3% |
| Scottish | 36 | 4.7% | View All 10 Rows |
Immigrants in Motley

| Immigration Origin | # Population | % Population | View All 0 Rows |
Sex and Age in Motley
Sex and Age in Motley
The most populous age groups in Motley are 55 to 59 Years (72 | 18.5%) for men and 65 to 69 Years (84 | 22.5%) for women.
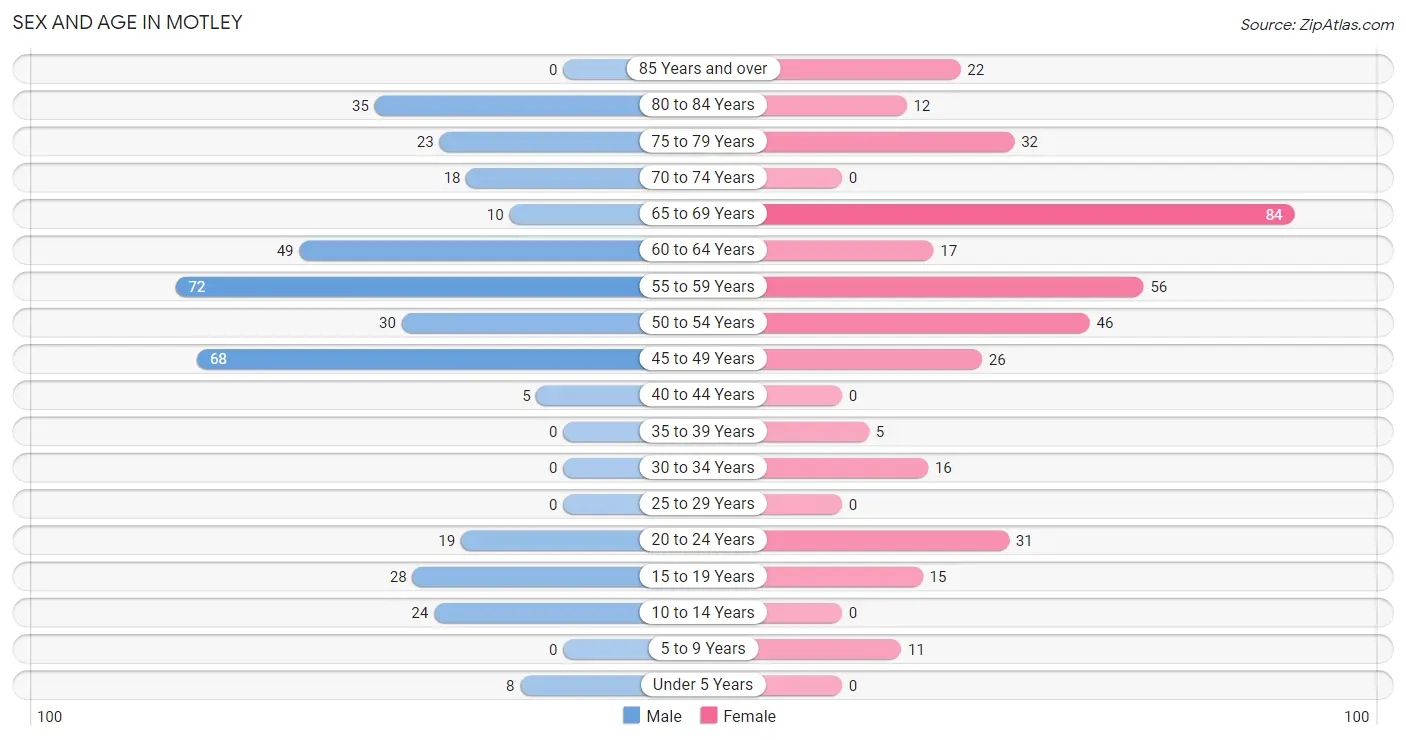
| Age Bracket | Male | Female |
| Under 5 Years | 8 (2.1%) | 0 (0.0%) |
| 5 to 9 Years | 0 (0.0%) | 11 (2.9%) |
| 10 to 14 Years | 24 (6.2%) | 0 (0.0%) |
| 15 to 19 Years | 28 (7.2%) | 15 (4.0%) |
| 20 to 24 Years | 19 (4.9%) | 31 (8.3%) |
| 25 to 29 Years | 0 (0.0%) | 0 (0.0%) |
| 30 to 34 Years | 0 (0.0%) | 16 (4.3%) |
| 35 to 39 Years | 0 (0.0%) | 5 (1.3%) |
| 40 to 44 Years | 5 (1.3%) | 0 (0.0%) |
| 45 to 49 Years | 68 (17.5%) | 26 (7.0%) |
| 50 to 54 Years | 30 (7.7%) | 46 (12.3%) |
| 55 to 59 Years | 72 (18.5%) | 56 (15.0%) |
| 60 to 64 Years | 49 (12.6%) | 17 (4.6%) |
| 65 to 69 Years | 10 (2.6%) | 84 (22.5%) |
| 70 to 74 Years | 18 (4.6%) | 0 (0.0%) |
| 75 to 79 Years | 23 (5.9%) | 32 (8.6%) |
| 80 to 84 Years | 35 (9.0%) | 12 (3.2%) |
| 85 Years and over | 0 (0.0%) | 22 (5.9%) |
| Total | 389 (100.0%) | 373 (100.0%) |
Families and Households in Motley
Median Family Size in Motley
The median family size in Motley is 2.60 persons per family, with single female/mother families (51 | 24.5%) accounting for the largest median family size of 2.76 persons per family. On the other hand, single male/father families (31 | 14.9%) represent the smallest median family size with 2.52 persons per family.
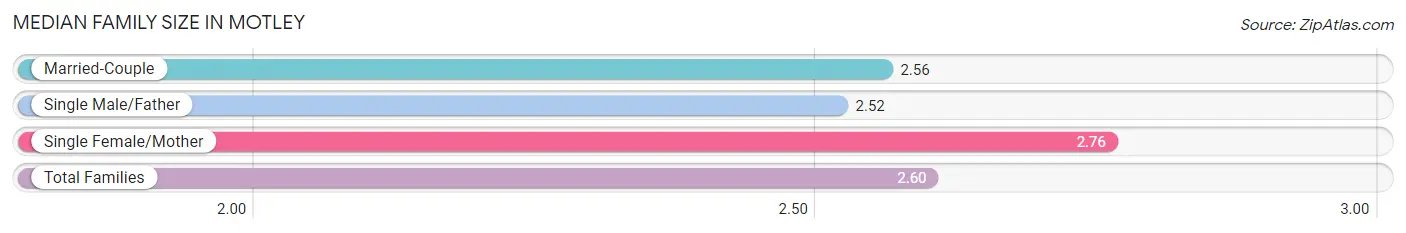
| Family Type | # Families | Family Size |
| Married-Couple | 126 (60.6%) | 2.56 |
| Single Male/Father | 31 (14.9%) | 2.52 |
| Single Female/Mother | 51 (24.5%) | 2.76 |
| Total Families | 208 (100.0%) | 2.60 |
Median Household Size in Motley
The median household size in Motley is 2.22 persons per household, with single male/father households (31 | 9.0%) accounting for the largest median household size of 2.87 persons per household. non-family households (136 | 39.5%) represent the smallest median household size with 1.53 persons per household.
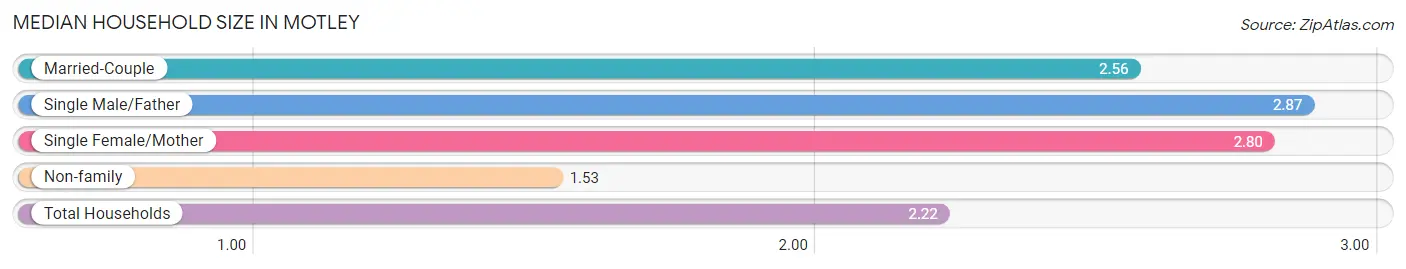
| Household Type | # Households | Household Size |
| Married-Couple | 126 (36.6%) | 2.56 |
| Single Male/Father | 31 (9.0%) | 2.87 |
| Single Female/Mother | 51 (14.8%) | 2.80 |
| Non-family | 136 (39.5%) | 1.53 |
| Total Households | 344 (100.0%) | 2.22 |
Household Size by Marriage Status in Motley
Out of a total of 344 households in Motley, 208 (60.5%) are family households, while 136 (39.5%) are nonfamily households. The most numerous type of family households are 3-person households, comprising 109, and the most common type of nonfamily households are 1-person households, comprising 105.
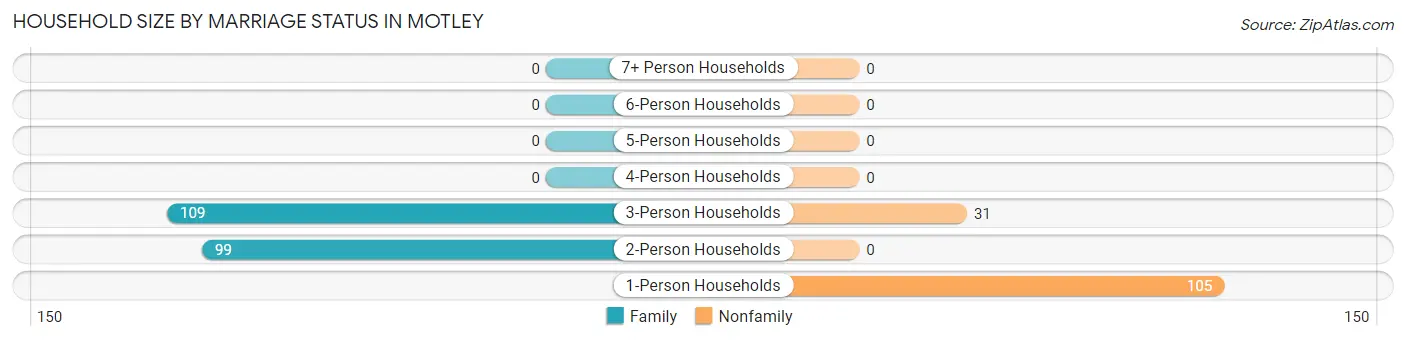
| Household Size | Family Households | Nonfamily Households |
| 1-Person Households | - | 105 (30.5%) |
| 2-Person Households | 99 (28.8%) | 0 (0.0%) |
| 3-Person Households | 109 (31.7%) | 31 (9.0%) |
| 4-Person Households | 0 (0.0%) | 0 (0.0%) |
| 5-Person Households | 0 (0.0%) | 0 (0.0%) |
| 6-Person Households | 0 (0.0%) | 0 (0.0%) |
| 7+ Person Households | 0 (0.0%) | 0 (0.0%) |
| Total | 208 (60.5%) | 136 (39.5%) |
Female Fertility in Motley
Fertility by Age in Motley
| Age Bracket | Women with Births | Births / 1,000 Women |
| 15 to 19 years | 0 (0.0%) | 0.0 |
| 20 to 34 years | 0 (0.0%) | 0.0 |
| 35 to 50 years | 0 (0.0%) | 0.0 |
| Total | 0 (0.0%) | 0.0 |
Fertility by Age by Marriage Status in Motley
| Age Bracket | Married | Unmarried |
| 15 to 19 years | 0 (0.0%) | 0 (0.0%) |
| 20 to 34 years | 0 (0.0%) | 0 (0.0%) |
| 35 to 50 years | 0 (0.0%) | 0 (0.0%) |
| Total | 0 (0.0%) | 0 (0.0%) |
Fertility by Education in Motley
| Educational Attainment | Women with Births | Births / 1,000 Women |
| Less than High School | 0 (0.0%) | 0.0 |
| High School Diploma | 0 (0.0%) | 0.0 |
| College or Associate's Degree | 0 (0.0%) | 0.0 |
| Bachelor's Degree | 0 (0.0%) | 0.0 |
| Graduate Degree | 0 (0.0%) | 0.0 |
| Total | 0 (0.0%) | 0.0 |
Fertility by Education by Marriage Status in Motley
| Educational Attainment | Married | Unmarried |
| Less than High School | 0 (0.0%) | 0 (0.0%) |
| High School Diploma | 0 (0.0%) | 0 (0.0%) |
| College or Associate's Degree | 0 (0.0%) | 0 (0.0%) |
| Bachelor's Degree | 0 (0.0%) | 0 (0.0%) |
| Graduate Degree | 0 (0.0%) | 0 (0.0%) |
| Total | 0 (0.0%) | 0 (0.0%) |
Employment Characteristics in Motley
Employment by Class of Employer in Motley
Among the 309 employed individuals in Motley, private company employees (217 | 70.2%), not-for-profit organizations (31 | 10.0%), and self-employed (not incorporated) (23 | 7.4%) make up the most common classes of employment.
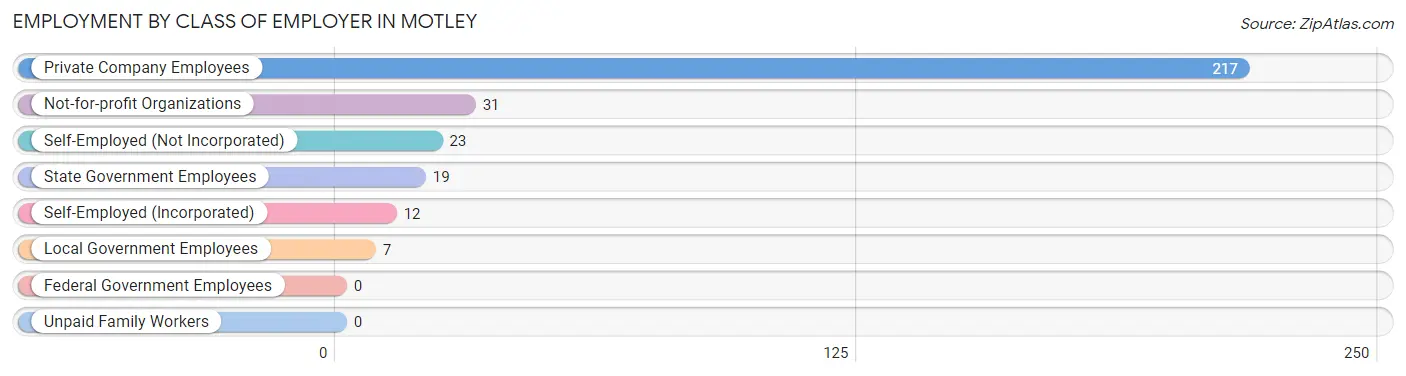
| Employer Class | # Employees | % Employees |
| Private Company Employees | 217 | 70.2% |
| Self-Employed (Incorporated) | 12 | 3.9% |
| Self-Employed (Not Incorporated) | 23 | 7.4% |
| Not-for-profit Organizations | 31 | 10.0% |
| Local Government Employees | 7 | 2.3% |
| State Government Employees | 19 | 6.1% |
| Federal Government Employees | 0 | 0.0% |
| Unpaid Family Workers | 0 | 0.0% |
| Total | 309 | 100.0% |
Employment Status by Age in Motley
According to the labor force statistics for Motley, out of the total population over 16 years of age (712), 47.2% or 336 individuals are in the labor force, with 0.6% or 2 of them unemployed. The age group with the highest labor force participation rate is 30 to 34 years, with 100.0% or 16 individuals in the labor force. Within the labor force, the 45 to 54 years age range has the highest percentage of unemployed individuals, with 2.2% or 2 of them being unemployed.
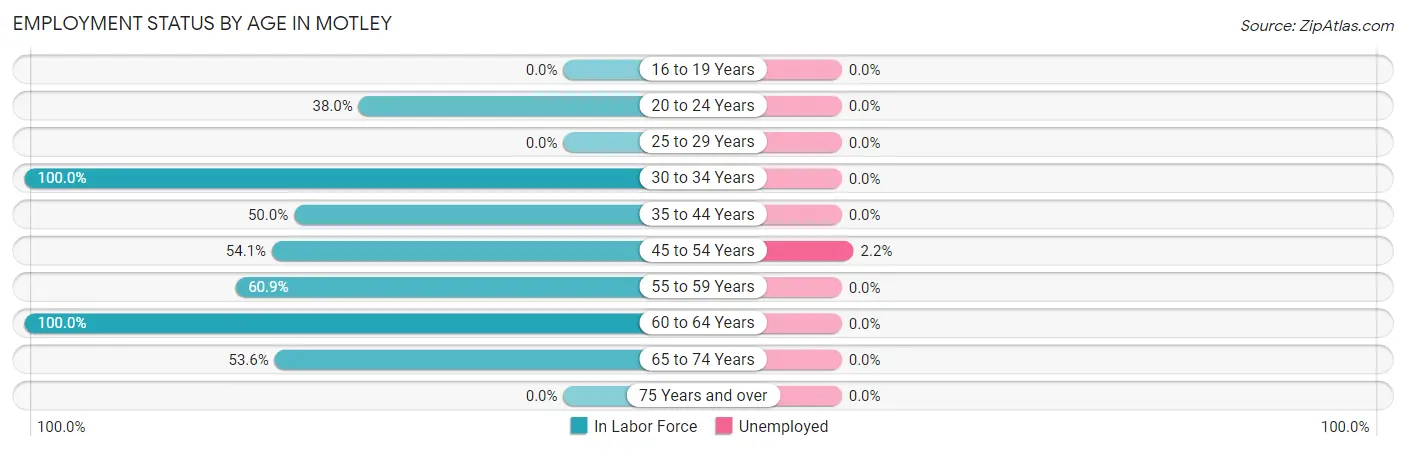
| Age Bracket | In Labor Force | Unemployed |
| 16 to 19 Years | 0 (0.0%) | 0 (0.0%) |
| 20 to 24 Years | 19 (38.0%) | 0 (0.0%) |
| 25 to 29 Years | 0 (0.0%) | 0 (0.0%) |
| 30 to 34 Years | 16 (100.0%) | 0 (0.0%) |
| 35 to 44 Years | 5 (50.0%) | 0 (0.0%) |
| 45 to 54 Years | 92 (54.1%) | 2 (2.2%) |
| 55 to 59 Years | 78 (60.9%) | 0 (0.0%) |
| 60 to 64 Years | 66 (100.0%) | 0 (0.0%) |
| 65 to 74 Years | 60 (53.6%) | 0 (0.0%) |
| 75 Years and over | 0 (0.0%) | 0 (0.0%) |
| Total | 336 (47.2%) | 2 (0.6%) |
Employment Status by Educational Attainment in Motley
According to labor force statistics for Motley, 65.9% of individuals (257) out of the total population between 25 and 64 years of age (390) are in the labor force, with 0.8% or 2 of them being unemployed. The group with the highest labor force participation rate are those with the educational attainment of bachelor's degree or higher, with 100.0% or 31 individuals in the labor force. Within the labor force, individuals with college / associate degree education have the highest percentage of unemployment, with 1.7% or 2 of them being unemployed.
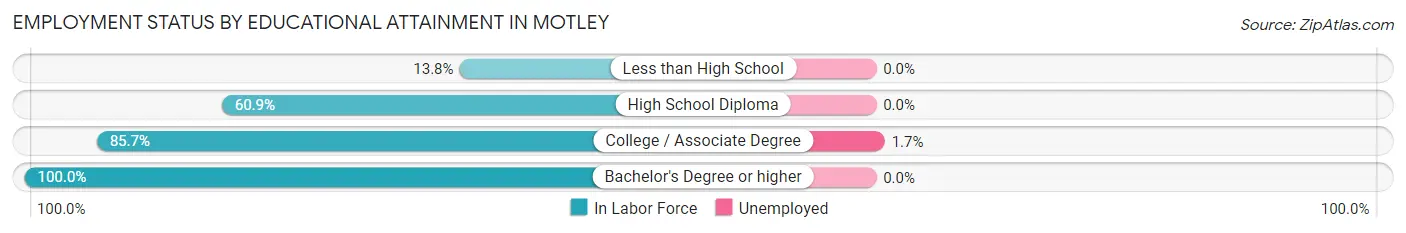
| Educational Attainment | In Labor Force | Unemployed |
| Less than High School | 8 (13.8%) | 0 (0.0%) |
| High School Diploma | 98 (60.9%) | 0 (0.0%) |
| College / Associate Degree | 120 (85.7%) | 2 (1.7%) |
| Bachelor's Degree or higher | 31 (100.0%) | 0 (0.0%) |
| Total | 257 (65.9%) | 3 (0.8%) |
Employment Occupations by Sex in Motley
Management, Business, Science and Arts Occupations
The most common Management, Business, Science and Arts occupations in Motley are Management (38 | 11.4%), Community & Social Service (5 | 1.5%), and Education, Arts & Media (5 | 1.5%).
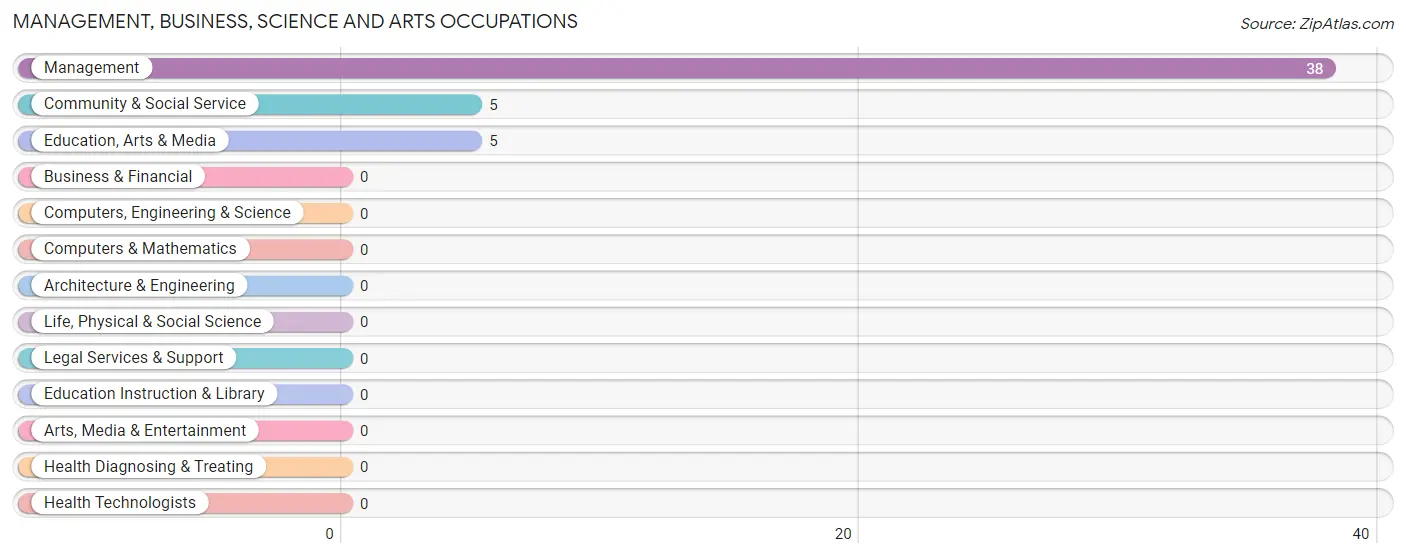
Management, Business, Science and Arts Occupations by Sex
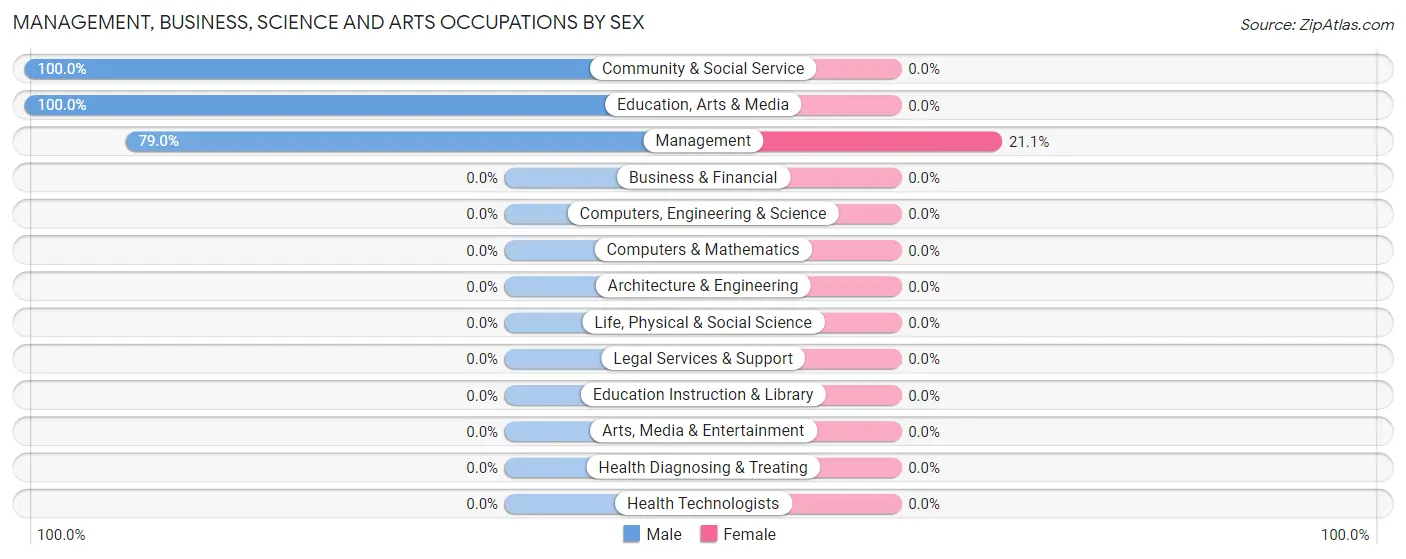
| Occupation | Male | Female |
| Management | 30 (78.9%) | 8 (21.0%) |
| Business & Financial | 0 (0.0%) | 0 (0.0%) |
| Computers, Engineering & Science | 0 (0.0%) | 0 (0.0%) |
| Computers & Mathematics | 0 (0.0%) | 0 (0.0%) |
| Architecture & Engineering | 0 (0.0%) | 0 (0.0%) |
| Life, Physical & Social Science | 0 (0.0%) | 0 (0.0%) |
| Community & Social Service | 5 (100.0%) | 0 (0.0%) |
| Education, Arts & Media | 5 (100.0%) | 0 (0.0%) |
| Legal Services & Support | 0 (0.0%) | 0 (0.0%) |
| Education Instruction & Library | 0 (0.0%) | 0 (0.0%) |
| Arts, Media & Entertainment | 0 (0.0%) | 0 (0.0%) |
| Health Diagnosing & Treating | 0 (0.0%) | 0 (0.0%) |
| Health Technologists | 0 (0.0%) | 0 (0.0%) |
| Total (Category) | 35 (81.4%) | 8 (18.6%) |
| Total (Overall) | 148 (44.3%) | 186 (55.7%) |
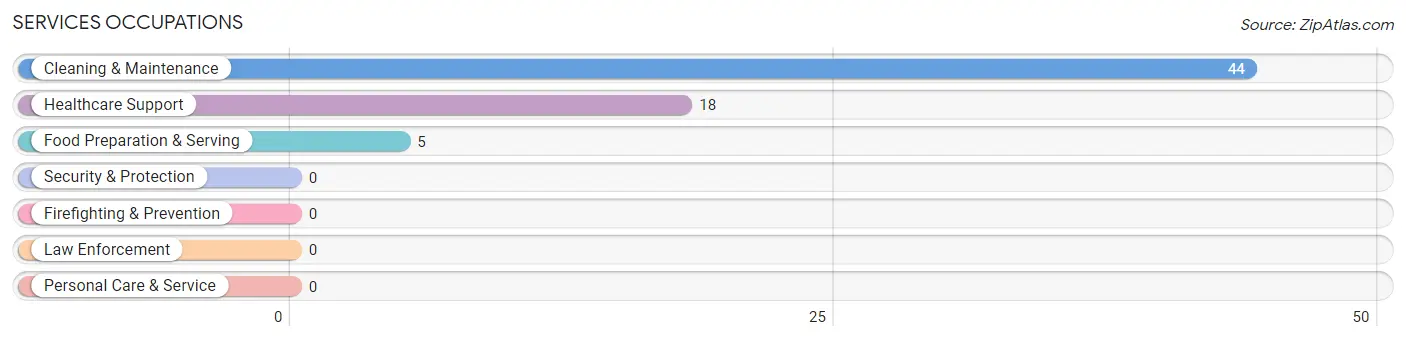
Services Occupations
The most common Services occupations in Motley are Cleaning & Maintenance (44 | 13.2%), Healthcare Support (18 | 5.4%), and Food Preparation & Serving (5 | 1.5%).
Services Occupations by Sex
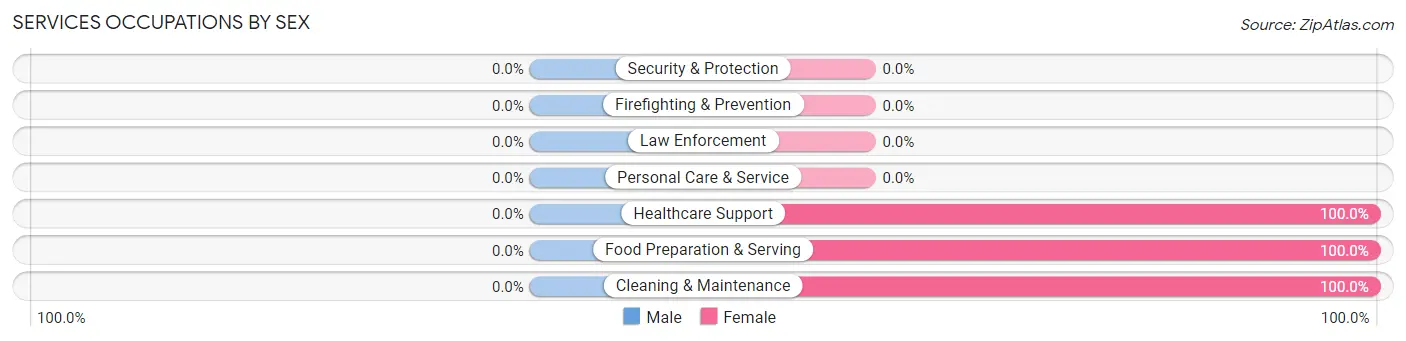
| Occupation | Male | Female |
| Healthcare Support | 0 (0.0%) | 18 (100.0%) |
| Security & Protection | 0 (0.0%) | 0 (0.0%) |
| Firefighting & Prevention | 0 (0.0%) | 0 (0.0%) |
| Law Enforcement | 0 (0.0%) | 0 (0.0%) |
| Food Preparation & Serving | 0 (0.0%) | 5 (100.0%) |
| Cleaning & Maintenance | 0 (0.0%) | 44 (100.0%) |
| Personal Care & Service | 0 (0.0%) | 0 (0.0%) |
| Total (Category) | 0 (0.0%) | 67 (100.0%) |
| Total (Overall) | 148 (44.3%) | 186 (55.7%) |
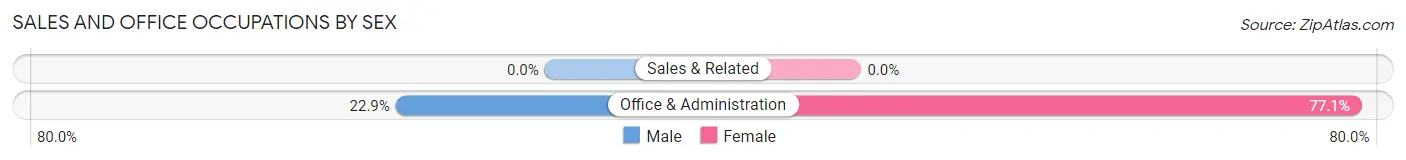
Sales and Office Occupations
The most common Sales and Office occupations in Motley are , and Office & Administration (96 | 28.7%).
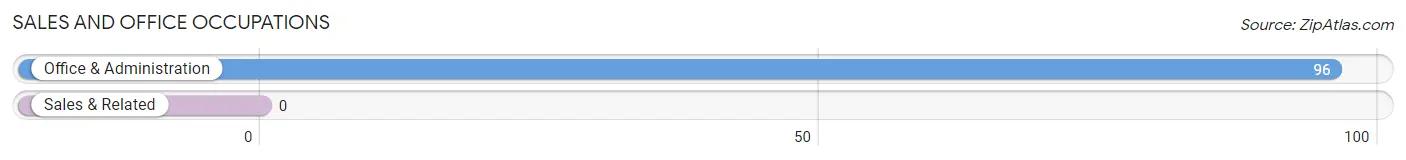
Sales and Office Occupations by Sex
| Occupation | Male | Female |
| Sales & Related | 0 (0.0%) | 0 (0.0%) |
| Office & Administration | 22 (22.9%) | 74 (77.1%) |
| Total (Category) | 22 (22.9%) | 74 (77.1%) |
| Total (Overall) | 148 (44.3%) | 186 (55.7%) |
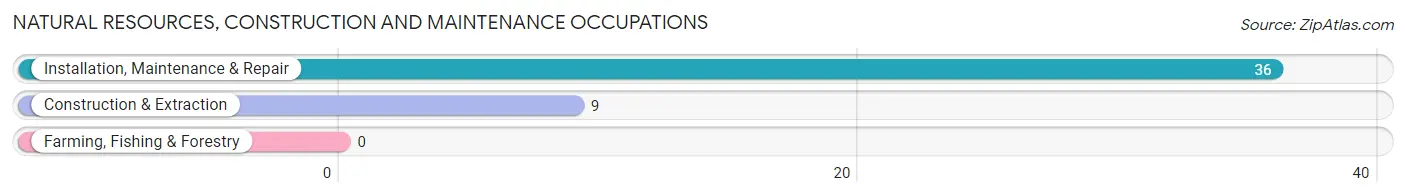
Natural Resources, Construction and Maintenance Occupations
The most common Natural Resources, Construction and Maintenance occupations in Motley are Installation, Maintenance & Repair (36 | 10.8%), and Construction & Extraction (9 | 2.7%).
Natural Resources, Construction and Maintenance Occupations by Sex
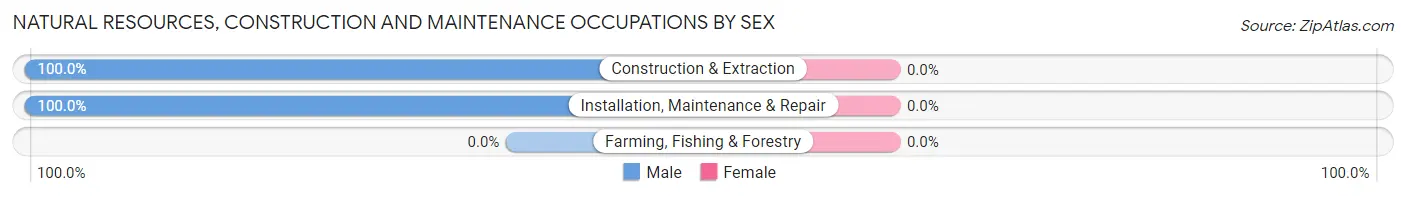
| Occupation | Male | Female |
| Farming, Fishing & Forestry | 0 (0.0%) | 0 (0.0%) |
| Construction & Extraction | 9 (100.0%) | 0 (0.0%) |
| Installation, Maintenance & Repair | 36 (100.0%) | 0 (0.0%) |
| Total (Category) | 45 (100.0%) | 0 (0.0%) |
| Total (Overall) | 148 (44.3%) | 186 (55.7%) |
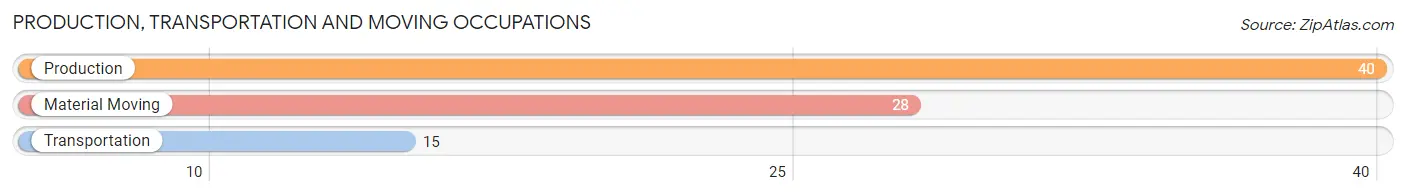
Production, Transportation and Moving Occupations
The most common Production, Transportation and Moving occupations in Motley are Production (40 | 12.0%), Material Moving (28 | 8.4%), and Transportation (15 | 4.5%).
Production, Transportation and Moving Occupations by Sex
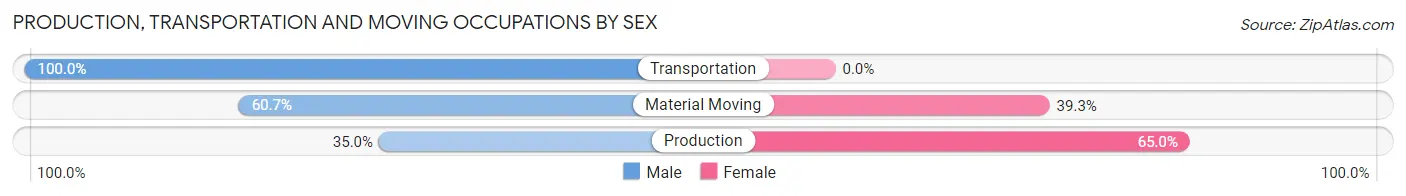
| Occupation | Male | Female |
| Production | 14 (35.0%) | 26 (65.0%) |
| Transportation | 15 (100.0%) | 0 (0.0%) |
| Material Moving | 17 (60.7%) | 11 (39.3%) |
| Total (Category) | 46 (55.4%) | 37 (44.6%) |
| Total (Overall) | 148 (44.3%) | 186 (55.7%) |
Employment Industries by Sex in Motley
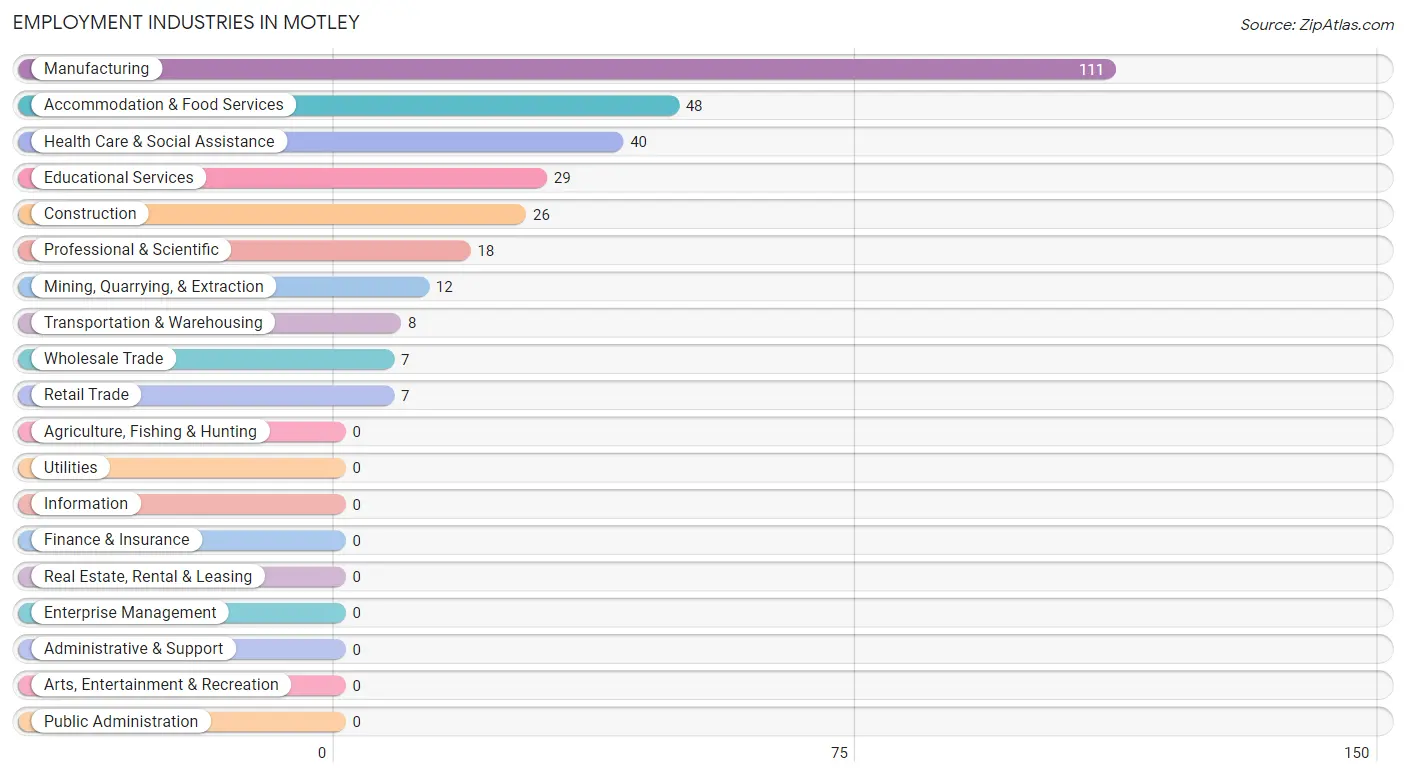
Employment Industries in Motley
The major employment industries in Motley include Manufacturing (111 | 33.2%), Accommodation & Food Services (48 | 14.4%), Health Care & Social Assistance (40 | 12.0%), Educational Services (29 | 8.7%), and Construction (26 | 7.8%).
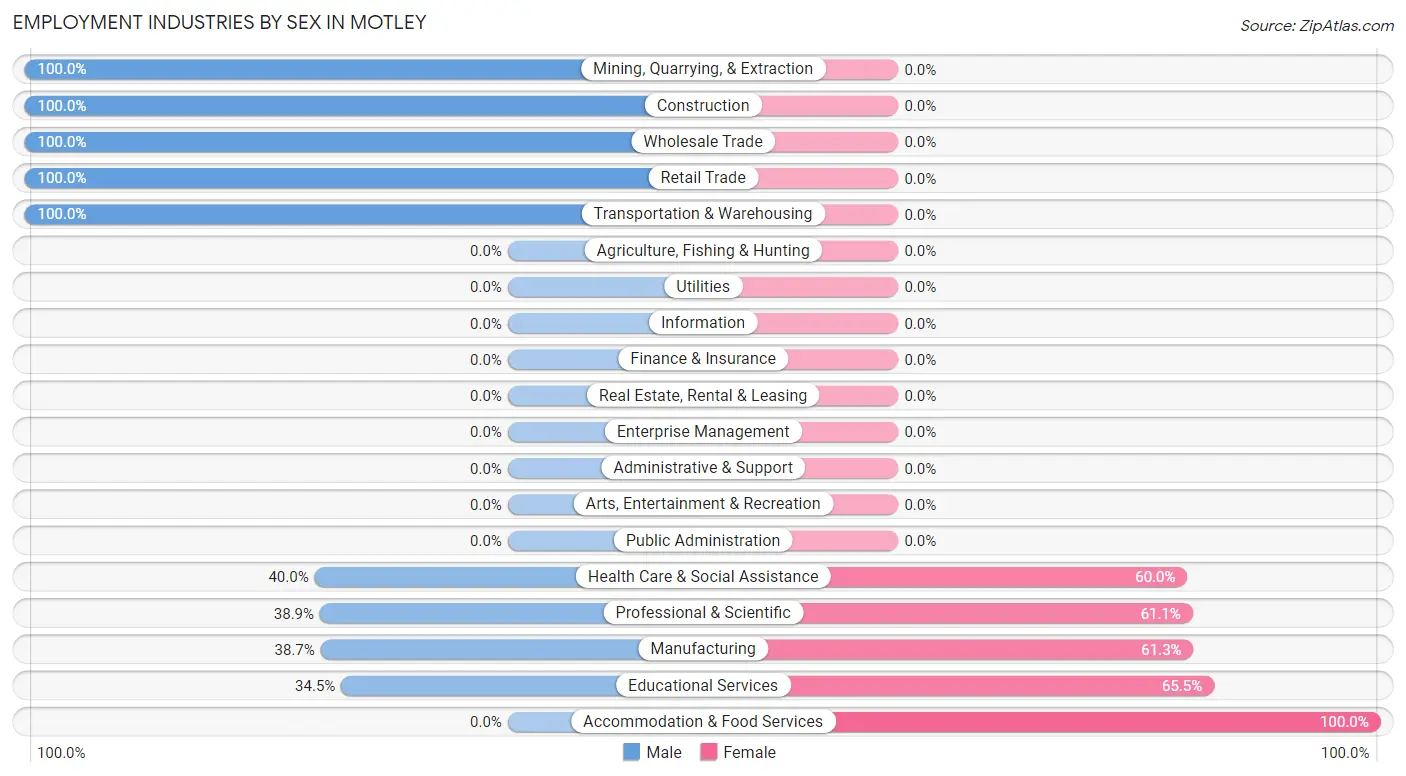
Employment Industries by Sex in Motley
The Motley industries that see more men than women are Mining, Quarrying, & Extraction (100.0%), Construction (100.0%), and Wholesale Trade (100.0%), whereas the industries that tend to have a higher number of women are Accommodation & Food Services (100.0%), Educational Services (65.5%), and Manufacturing (61.3%).
| Industry | Male | Female |
| Agriculture, Fishing & Hunting | 0 (0.0%) | 0 (0.0%) |
| Mining, Quarrying, & Extraction | 12 (100.0%) | 0 (0.0%) |
| Construction | 26 (100.0%) | 0 (0.0%) |
| Manufacturing | 43 (38.7%) | 68 (61.3%) |
| Wholesale Trade | 7 (100.0%) | 0 (0.0%) |
| Retail Trade | 7 (100.0%) | 0 (0.0%) |
| Transportation & Warehousing | 8 (100.0%) | 0 (0.0%) |
| Utilities | 0 (0.0%) | 0 (0.0%) |
| Information | 0 (0.0%) | 0 (0.0%) |
| Finance & Insurance | 0 (0.0%) | 0 (0.0%) |
| Real Estate, Rental & Leasing | 0 (0.0%) | 0 (0.0%) |
| Professional & Scientific | 7 (38.9%) | 11 (61.1%) |
| Enterprise Management | 0 (0.0%) | 0 (0.0%) |
| Administrative & Support | 0 (0.0%) | 0 (0.0%) |
| Educational Services | 10 (34.5%) | 19 (65.5%) |
| Health Care & Social Assistance | 16 (40.0%) | 24 (60.0%) |
| Arts, Entertainment & Recreation | 0 (0.0%) | 0 (0.0%) |
| Accommodation & Food Services | 0 (0.0%) | 48 (100.0%) |
| Public Administration | 0 (0.0%) | 0 (0.0%) |
| Total | 148 (44.3%) | 186 (55.7%) |
Education in Motley
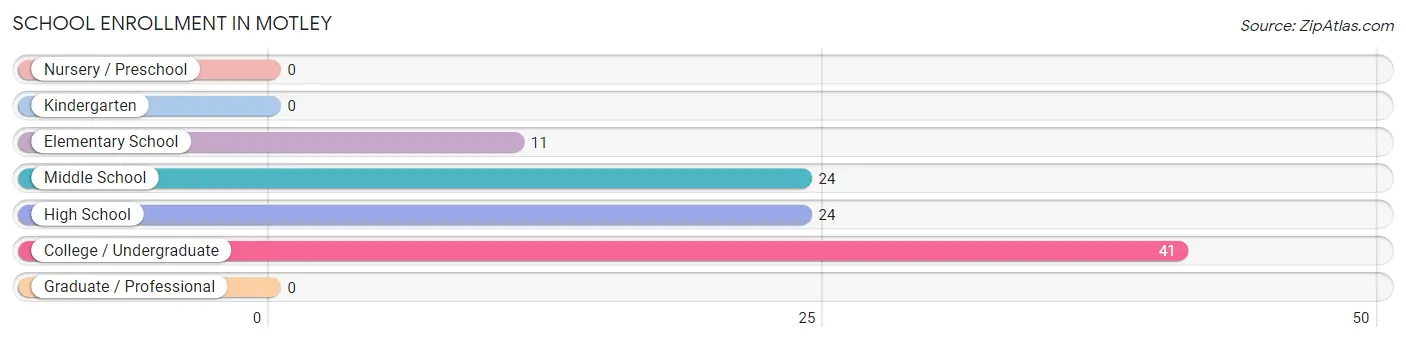
School Enrollment in Motley
The most common levels of schooling among the 100 students in Motley are college / undergraduate (41 | 41.0%), middle school (24 | 24.0%), and high school (24 | 24.0%).
| School Level | # Students | % Students |
| Nursery / Preschool | 0 | 0.0% |
| Kindergarten | 0 | 0.0% |
| Elementary School | 11 | 11.0% |
| Middle School | 24 | 24.0% |
| High School | 24 | 24.0% |
| College / Undergraduate | 41 | 41.0% |
| Graduate / Professional | 0 | 0.0% |
| Total | 100 | 100.0% |
School Enrollment by Age by Funding Source in Motley
Out of a total of 100 students who are enrolled in schools in Motley, 7 (7.0%) attend a private institution, while the remaining 93 (93.0%) are enrolled in public schools. The age group of 15 to 17 year olds has the highest likelihood of being enrolled in private schools, with 7 (50.0% in the age bracket) enrolled. Conversely, the age group of 5 to 9 year old has the lowest likelihood of being enrolled in a private school, with 11 (100.0% in the age bracket) attending a public institution.
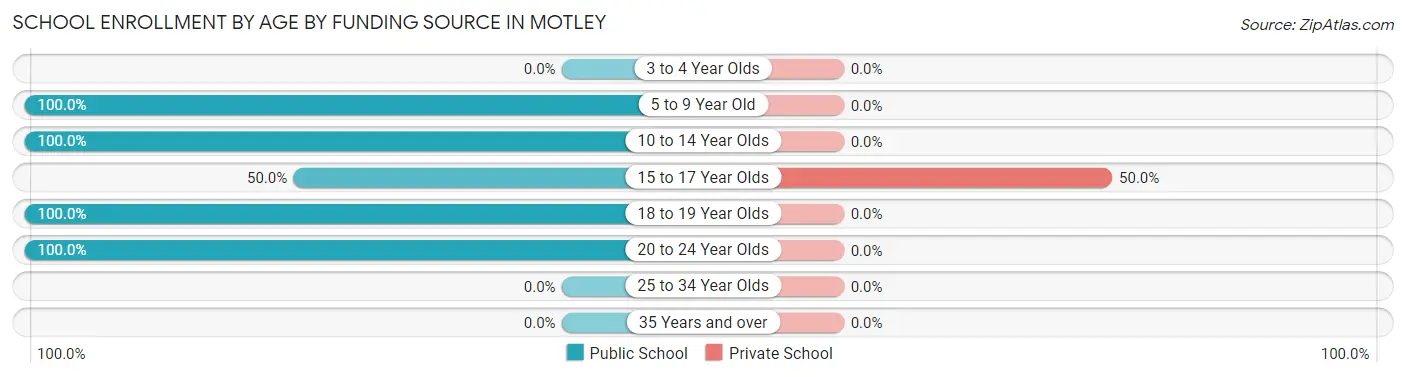
| Age Bracket | Public School | Private School |
| 3 to 4 Year Olds | 0 (0.0%) | 0 (0.0%) |
| 5 to 9 Year Old | 11 (100.0%) | 0 (0.0%) |
| 10 to 14 Year Olds | 24 (100.0%) | 0 (0.0%) |
| 15 to 17 Year Olds | 7 (50.0%) | 7 (50.0%) |
| 18 to 19 Year Olds | 21 (100.0%) | 0 (0.0%) |
| 20 to 24 Year Olds | 30 (100.0%) | 0 (0.0%) |
| 25 to 34 Year Olds | 0 (0.0%) | 0 (0.0%) |
| 35 Years and over | 0 (0.0%) | 0 (0.0%) |
| Total | 93 (93.0%) | 7 (7.0%) |
Educational Attainment by Field of Study in Motley
Business (11 | 29.7%), bio, nature & agricultural (7 | 18.9%), physical & health sciences (7 | 18.9%), education (7 | 18.9%), and engineering (5 | 13.5%) are the most common fields of study among 37 individuals in Motley who have obtained a bachelor's degree or higher.
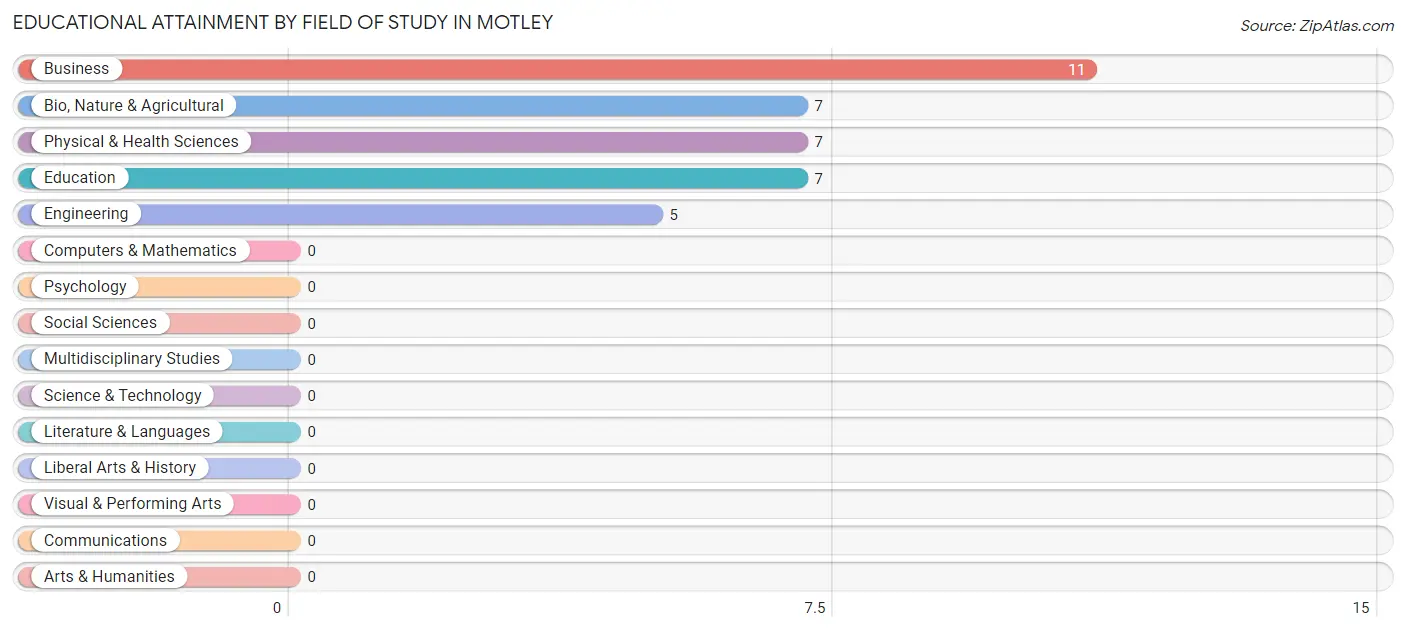
| Field of Study | # Graduates | % Graduates |
| Computers & Mathematics | 0 | 0.0% |
| Bio, Nature & Agricultural | 7 | 18.9% |
| Physical & Health Sciences | 7 | 18.9% |
| Psychology | 0 | 0.0% |
| Social Sciences | 0 | 0.0% |
| Engineering | 5 | 13.5% |
| Multidisciplinary Studies | 0 | 0.0% |
| Science & Technology | 0 | 0.0% |
| Business | 11 | 29.7% |
| Education | 7 | 18.9% |
| Literature & Languages | 0 | 0.0% |
| Liberal Arts & History | 0 | 0.0% |
| Visual & Performing Arts | 0 | 0.0% |
| Communications | 0 | 0.0% |
| Arts & Humanities | 0 | 0.0% |
| Total | 37 | 100.0% |
Transportation & Commute in Motley
Vehicle Availability by Sex in Motley
The most prevalent vehicle ownership categories in Motley are males with 1 vehicle (39, accounting for 28.1%) and females with 1 vehicle (38, making up 22.9%).
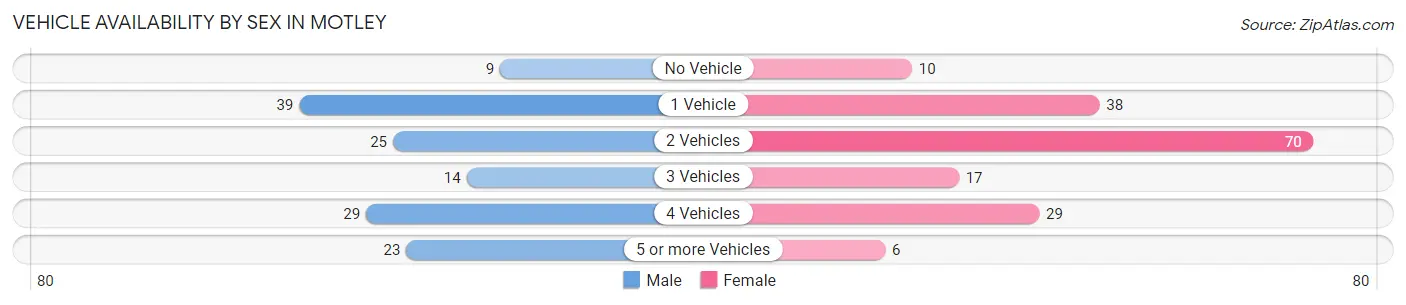
| Vehicles Available | Male | Female |
| No Vehicle | 9 (6.5%) | 10 (5.9%) |
| 1 Vehicle | 39 (28.1%) | 38 (22.4%) |
| 2 Vehicles | 25 (18.0%) | 70 (41.2%) |
| 3 Vehicles | 14 (10.1%) | 17 (10.0%) |
| 4 Vehicles | 29 (20.9%) | 29 (17.1%) |
| 5 or more Vehicles | 23 (16.6%) | 6 (3.5%) |
| Total | 139 (100.0%) | 170 (100.0%) |
Commute Time in Motley
The most frequently occuring commute durations in Motley are 45 to 59 minutes (77 commuters, 28.0%), 30 to 34 minutes (43 commuters, 15.6%), and 20 to 24 minutes (32 commuters, 11.6%).
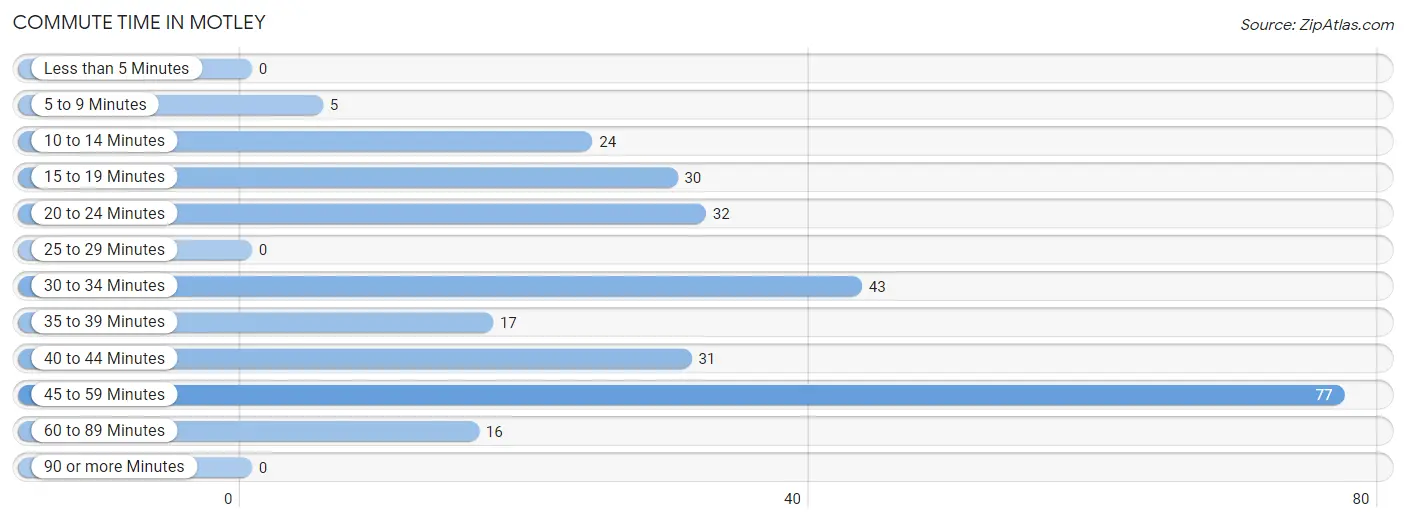
| Commute Time | # Commuters | % Commuters |
| Less than 5 Minutes | 0 | 0.0% |
| 5 to 9 Minutes | 5 | 1.8% |
| 10 to 14 Minutes | 24 | 8.7% |
| 15 to 19 Minutes | 30 | 10.9% |
| 20 to 24 Minutes | 32 | 11.6% |
| 25 to 29 Minutes | 0 | 0.0% |
| 30 to 34 Minutes | 43 | 15.6% |
| 35 to 39 Minutes | 17 | 6.2% |
| 40 to 44 Minutes | 31 | 11.3% |
| 45 to 59 Minutes | 77 | 28.0% |
| 60 to 89 Minutes | 16 | 5.8% |
| 90 or more Minutes | 0 | 0.0% |
Commute Time by Sex in Motley
The most common commute times in Motley are 45 to 59 minutes (33 commuters, 23.7%) for males and 45 to 59 minutes (44 commuters, 32.4%) for females.
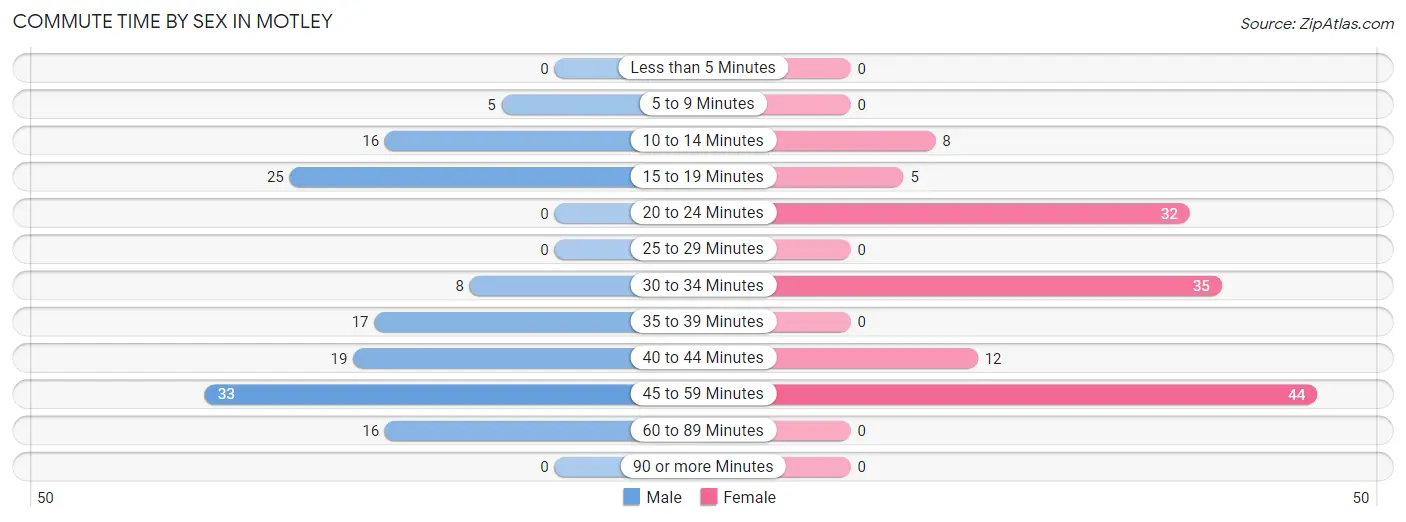
| Commute Time | Male | Female |
| Less than 5 Minutes | 0 (0.0%) | 0 (0.0%) |
| 5 to 9 Minutes | 5 (3.6%) | 0 (0.0%) |
| 10 to 14 Minutes | 16 (11.5%) | 8 (5.9%) |
| 15 to 19 Minutes | 25 (18.0%) | 5 (3.7%) |
| 20 to 24 Minutes | 0 (0.0%) | 32 (23.5%) |
| 25 to 29 Minutes | 0 (0.0%) | 0 (0.0%) |
| 30 to 34 Minutes | 8 (5.8%) | 35 (25.7%) |
| 35 to 39 Minutes | 17 (12.2%) | 0 (0.0%) |
| 40 to 44 Minutes | 19 (13.7%) | 12 (8.8%) |
| 45 to 59 Minutes | 33 (23.7%) | 44 (32.4%) |
| 60 to 89 Minutes | 16 (11.5%) | 0 (0.0%) |
| 90 or more Minutes | 0 (0.0%) | 0 (0.0%) |
Time of Departure to Work by Sex in Motley
The most frequent times of departure to work in Motley are 7:30 AM to 7:59 AM (31, 22.3%) for males and 7:00 AM to 7:29 AM (46, 33.8%) for females.
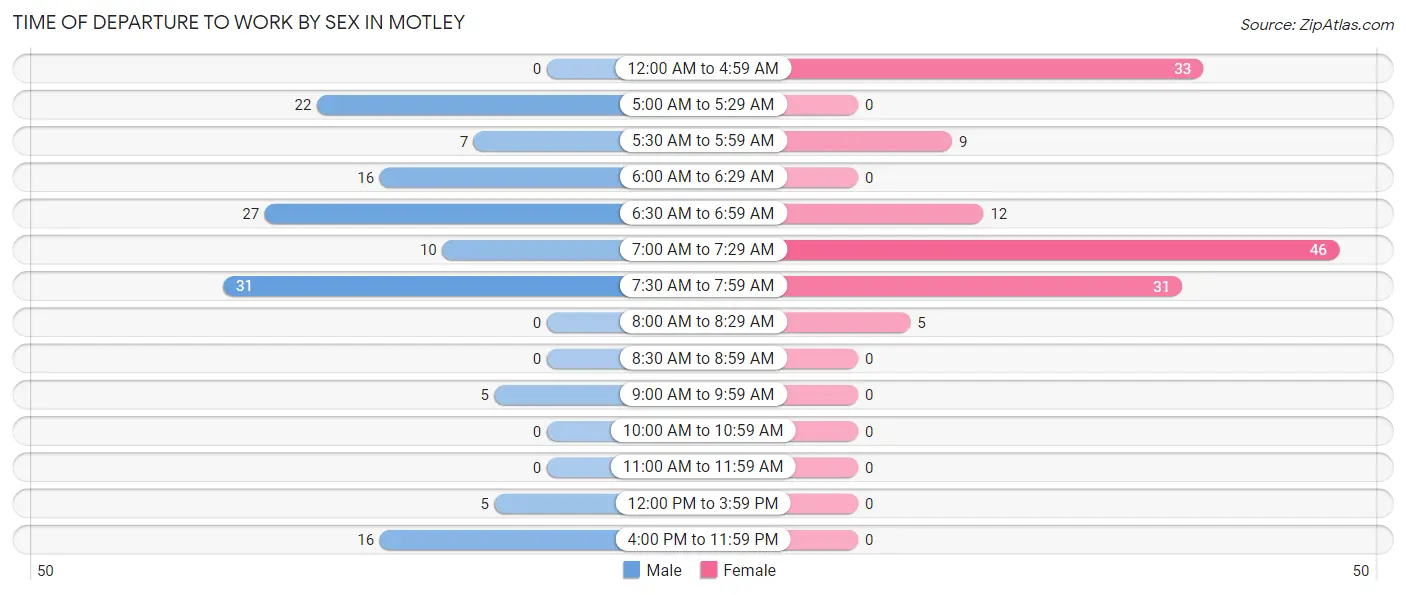
| Time of Departure | Male | Female |
| 12:00 AM to 4:59 AM | 0 (0.0%) | 33 (24.3%) |
| 5:00 AM to 5:29 AM | 22 (15.8%) | 0 (0.0%) |
| 5:30 AM to 5:59 AM | 7 (5.0%) | 9 (6.6%) |
| 6:00 AM to 6:29 AM | 16 (11.5%) | 0 (0.0%) |
| 6:30 AM to 6:59 AM | 27 (19.4%) | 12 (8.8%) |
| 7:00 AM to 7:29 AM | 10 (7.2%) | 46 (33.8%) |
| 7:30 AM to 7:59 AM | 31 (22.3%) | 31 (22.8%) |
| 8:00 AM to 8:29 AM | 0 (0.0%) | 5 (3.7%) |
| 8:30 AM to 8:59 AM | 0 (0.0%) | 0 (0.0%) |
| 9:00 AM to 9:59 AM | 5 (3.6%) | 0 (0.0%) |
| 10:00 AM to 10:59 AM | 0 (0.0%) | 0 (0.0%) |
| 11:00 AM to 11:59 AM | 0 (0.0%) | 0 (0.0%) |
| 12:00 PM to 3:59 PM | 5 (3.6%) | 0 (0.0%) |
| 4:00 PM to 11:59 PM | 16 (11.5%) | 0 (0.0%) |
| Total | 139 (100.0%) | 136 (100.0%) |
Housing Occupancy in Motley
Occupancy by Ownership in Motley
Of the total 344 dwellings in Motley, owner-occupied units account for 269 (78.2%), while renter-occupied units make up 75 (21.8%).
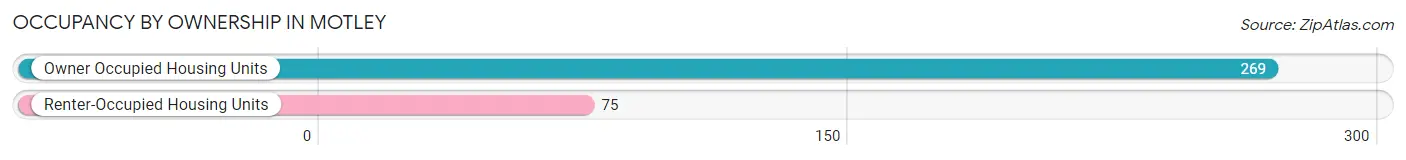
| Occupancy | # Housing Units | % Housing Units |
| Owner Occupied Housing Units | 269 | 78.2% |
| Renter-Occupied Housing Units | 75 | 21.8% |
| Total Occupied Housing Units | 344 | 100.0% |
Occupancy by Household Size in Motley
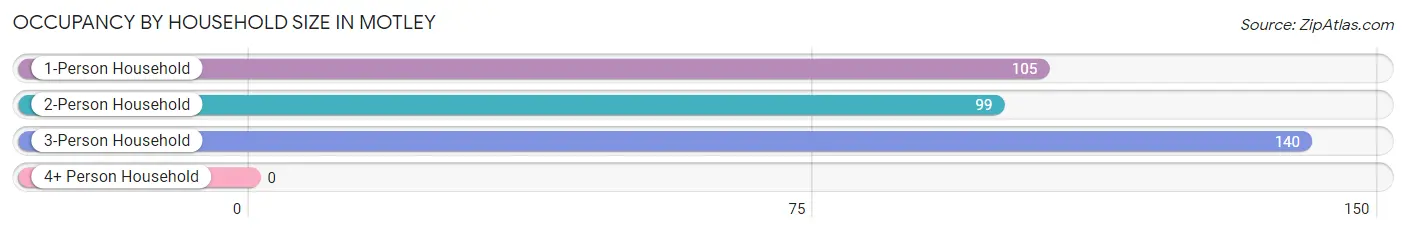
| Household Size | # Housing Units | % Housing Units |
| 1-Person Household | 105 | 30.5% |
| 2-Person Household | 99 | 28.8% |
| 3-Person Household | 140 | 40.7% |
| 4+ Person Household | 0 | 0.0% |
| Total Housing Units | 344 | 100.0% |
Occupancy by Ownership by Household Size in Motley
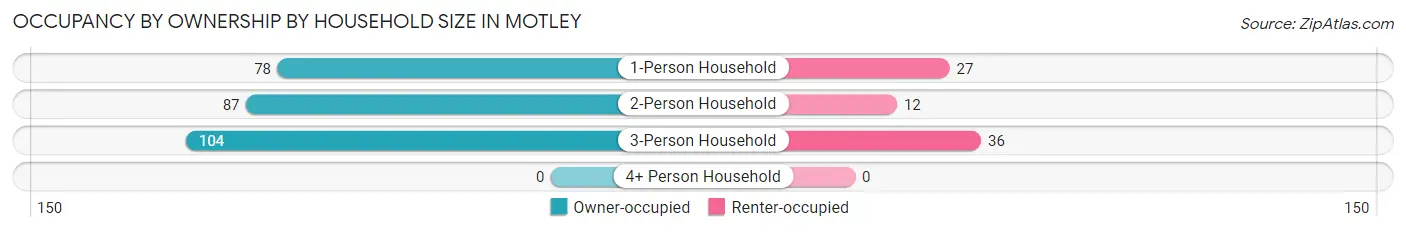
| Household Size | Owner-occupied | Renter-occupied |
| 1-Person Household | 78 (74.3%) | 27 (25.7%) |
| 2-Person Household | 87 (87.9%) | 12 (12.1%) |
| 3-Person Household | 104 (74.3%) | 36 (25.7%) |
| 4+ Person Household | 0 (0.0%) | 0 (0.0%) |
| Total Housing Units | 269 (78.2%) | 75 (21.8%) |
Occupancy by Educational Attainment in Motley
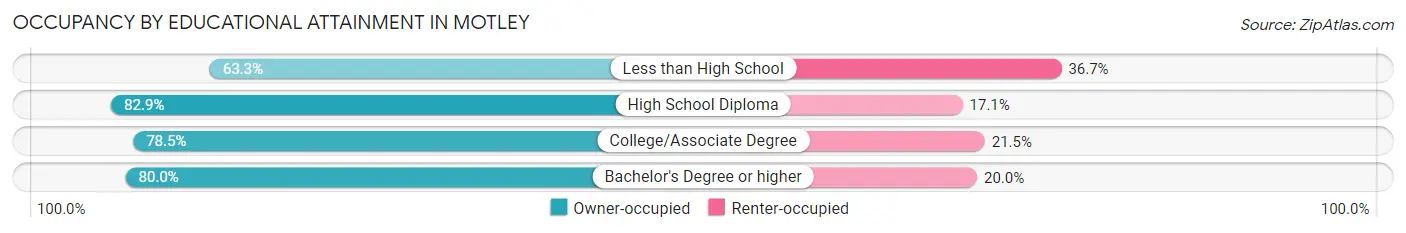
| Household Size | Owner-occupied | Renter-occupied |
| Less than High School | 31 (63.3%) | 18 (36.7%) |
| High School Diploma | 116 (82.9%) | 24 (17.1%) |
| College/Associate Degree | 102 (78.5%) | 28 (21.5%) |
| Bachelor's Degree or higher | 20 (80.0%) | 5 (20.0%) |
Occupancy by Age of Householder in Motley
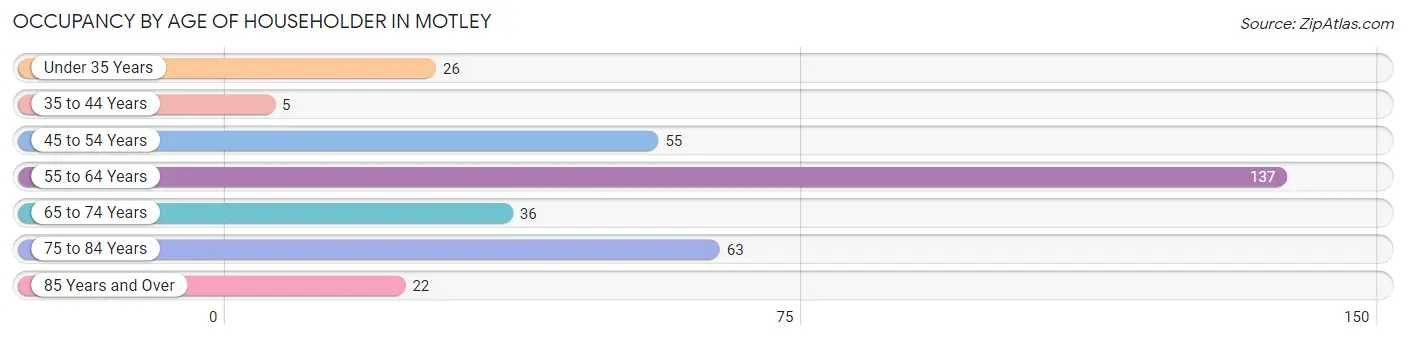
| Age Bracket | # Households | % Households |
| Under 35 Years | 26 | 7.6% |
| 35 to 44 Years | 5 | 1.5% |
| 45 to 54 Years | 55 | 16.0% |
| 55 to 64 Years | 137 | 39.8% |
| 65 to 74 Years | 36 | 10.5% |
| 75 to 84 Years | 63 | 18.3% |
| 85 Years and Over | 22 | 6.4% |
| Total | 344 | 100.0% |
Housing Finances in Motley
Median Income by Occupancy in Motley
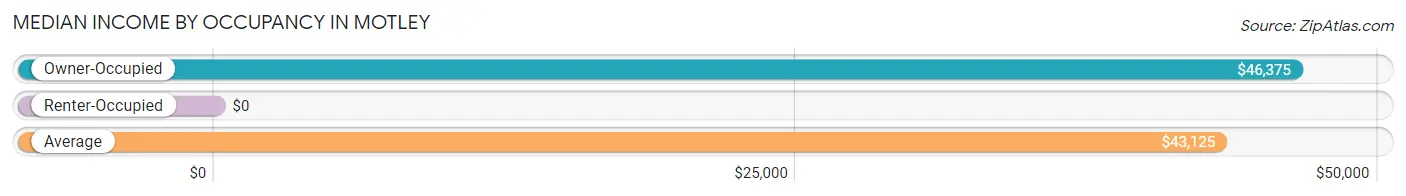
| Occupancy Type | # Households | Median Income |
| Owner-Occupied | 269 (78.2%) | $46,375 |
| Renter-Occupied | 75 (21.8%) | $0 |
| Average | 344 (100.0%) | $43,125 |
Occupancy by Householder Income Bracket in Motley
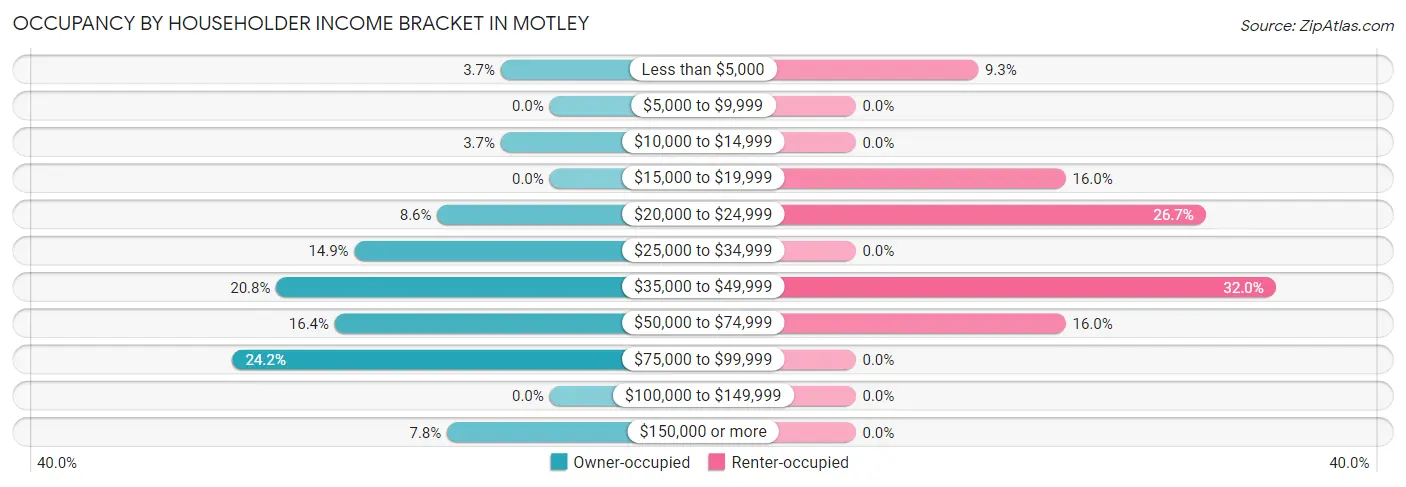
| Income Bracket | Owner-occupied | Renter-occupied |
| Less than $5,000 | 10 (3.7%) | 7 (9.3%) |
| $5,000 to $9,999 | 0 (0.0%) | 0 (0.0%) |
| $10,000 to $14,999 | 10 (3.7%) | 0 (0.0%) |
| $15,000 to $19,999 | 0 (0.0%) | 12 (16.0%) |
| $20,000 to $24,999 | 23 (8.6%) | 20 (26.7%) |
| $25,000 to $34,999 | 40 (14.9%) | 0 (0.0%) |
| $35,000 to $49,999 | 56 (20.8%) | 24 (32.0%) |
| $50,000 to $74,999 | 44 (16.4%) | 12 (16.0%) |
| $75,000 to $99,999 | 65 (24.2%) | 0 (0.0%) |
| $100,000 to $149,999 | 0 (0.0%) | 0 (0.0%) |
| $150,000 or more | 21 (7.8%) | 0 (0.0%) |
| Total | 269 (100.0%) | 75 (100.0%) |
Monthly Housing Cost Tiers in Motley
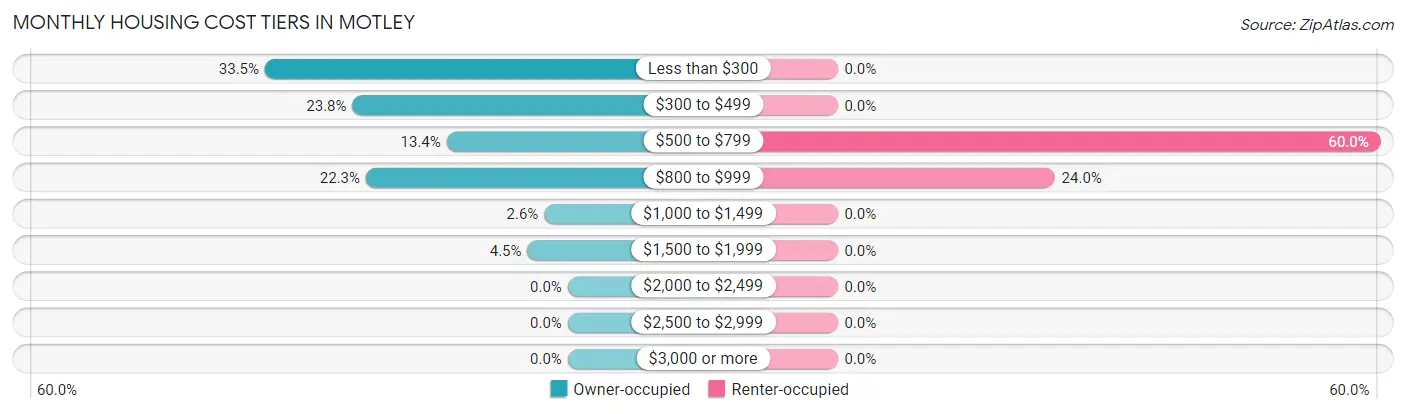
| Monthly Cost | Owner-occupied | Renter-occupied |
| Less than $300 | 90 (33.5%) | 0 (0.0%) |
| $300 to $499 | 64 (23.8%) | 0 (0.0%) |
| $500 to $799 | 36 (13.4%) | 45 (60.0%) |
| $800 to $999 | 60 (22.3%) | 18 (24.0%) |
| $1,000 to $1,499 | 7 (2.6%) | 0 (0.0%) |
| $1,500 to $1,999 | 12 (4.5%) | 0 (0.0%) |
| $2,000 to $2,499 | 0 (0.0%) | 0 (0.0%) |
| $2,500 to $2,999 | 0 (0.0%) | 0 (0.0%) |
| $3,000 or more | 0 (0.0%) | 0 (0.0%) |
| Total | 269 (100.0%) | 75 (100.0%) |
Physical Housing Characteristics in Motley
Housing Structures in Motley
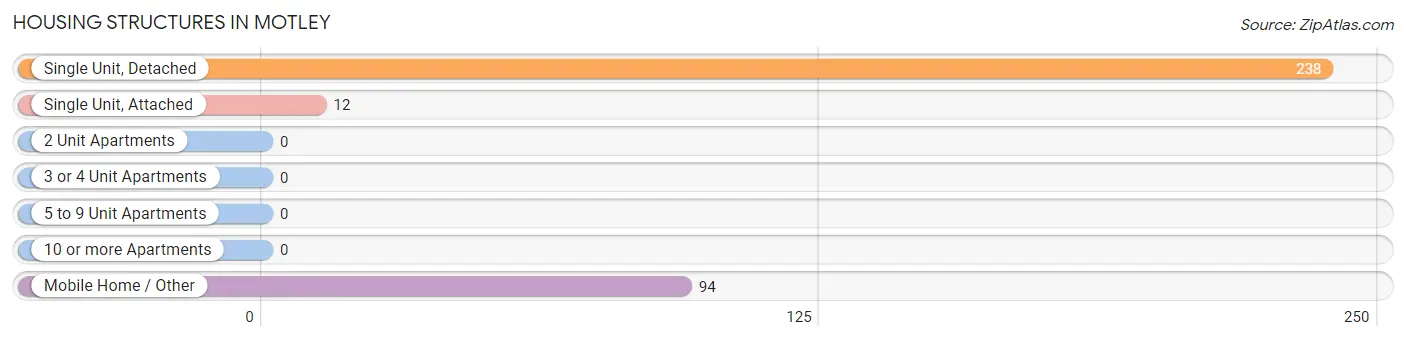
| Structure Type | # Housing Units | % Housing Units |
| Single Unit, Detached | 238 | 69.2% |
| Single Unit, Attached | 12 | 3.5% |
| 2 Unit Apartments | 0 | 0.0% |
| 3 or 4 Unit Apartments | 0 | 0.0% |
| 5 to 9 Unit Apartments | 0 | 0.0% |
| 10 or more Apartments | 0 | 0.0% |
| Mobile Home / Other | 94 | 27.3% |
| Total | 344 | 100.0% |
Housing Structures by Occupancy in Motley
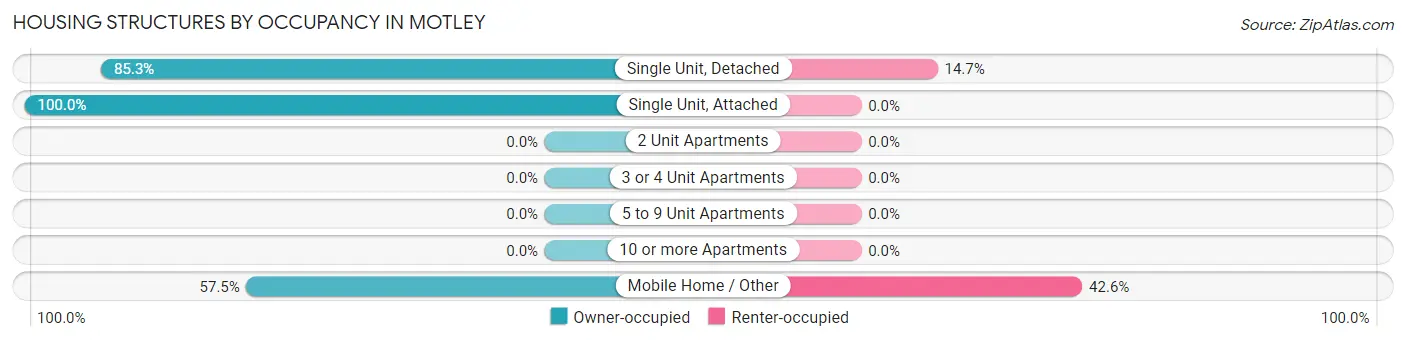
| Structure Type | Owner-occupied | Renter-occupied |
| Single Unit, Detached | 203 (85.3%) | 35 (14.7%) |
| Single Unit, Attached | 12 (100.0%) | 0 (0.0%) |
| 2 Unit Apartments | 0 (0.0%) | 0 (0.0%) |
| 3 or 4 Unit Apartments | 0 (0.0%) | 0 (0.0%) |
| 5 to 9 Unit Apartments | 0 (0.0%) | 0 (0.0%) |
| 10 or more Apartments | 0 (0.0%) | 0 (0.0%) |
| Mobile Home / Other | 54 (57.5%) | 40 (42.5%) |
| Total | 269 (78.2%) | 75 (21.8%) |
Housing Structures by Number of Rooms in Motley
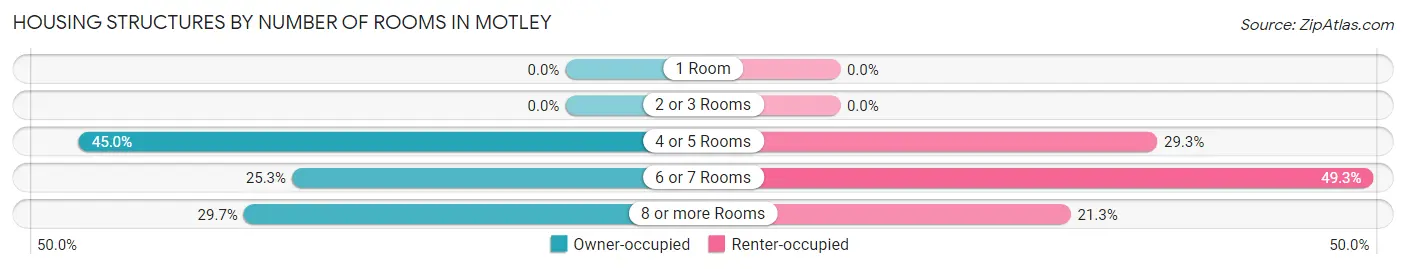
| Number of Rooms | Owner-occupied | Renter-occupied |
| 1 Room | 0 (0.0%) | 0 (0.0%) |
| 2 or 3 Rooms | 0 (0.0%) | 0 (0.0%) |
| 4 or 5 Rooms | 121 (45.0%) | 22 (29.3%) |
| 6 or 7 Rooms | 68 (25.3%) | 37 (49.3%) |
| 8 or more Rooms | 80 (29.7%) | 16 (21.3%) |
| Total | 269 (100.0%) | 75 (100.0%) |
Housing Structure by Heating Type in Motley
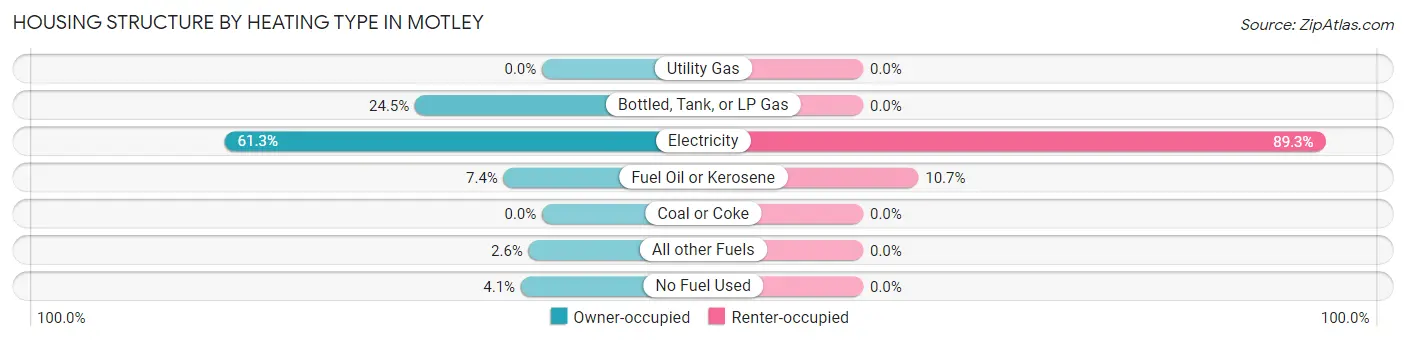
| Heating Type | Owner-occupied | Renter-occupied |
| Utility Gas | 0 (0.0%) | 0 (0.0%) |
| Bottled, Tank, or LP Gas | 66 (24.5%) | 0 (0.0%) |
| Electricity | 165 (61.3%) | 67 (89.3%) |
| Fuel Oil or Kerosene | 20 (7.4%) | 8 (10.7%) |
| Coal or Coke | 0 (0.0%) | 0 (0.0%) |
| All other Fuels | 7 (2.6%) | 0 (0.0%) |
| No Fuel Used | 11 (4.1%) | 0 (0.0%) |
| Total | 269 (100.0%) | 75 (100.0%) |
Household Vehicle Usage in Motley
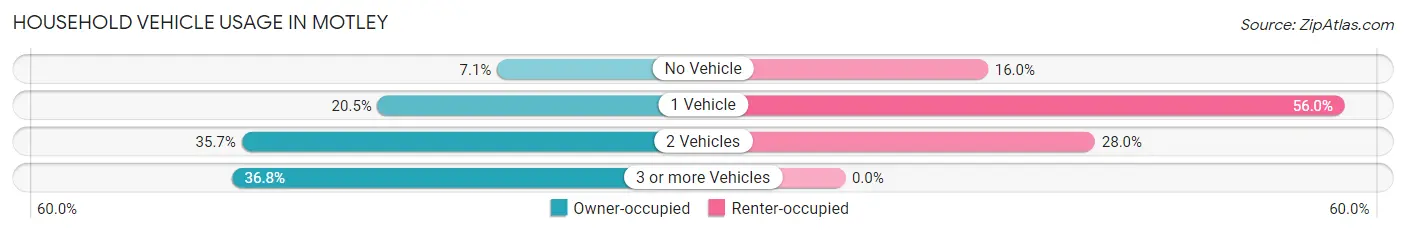
| Vehicles per Household | Owner-occupied | Renter-occupied |
| No Vehicle | 19 (7.1%) | 12 (16.0%) |
| 1 Vehicle | 55 (20.4%) | 42 (56.0%) |
| 2 Vehicles | 96 (35.7%) | 21 (28.0%) |
| 3 or more Vehicles | 99 (36.8%) | 0 (0.0%) |
| Total | 269 (100.0%) | 75 (100.0%) |
Real Estate & Mortgages in Motley
Real Estate and Mortgage Overview in Motley
| Characteristic | Without Mortgage | With Mortgage |
| Housing Units | 182 | 87 |
| Median Property Value | $98,500 | $155,500 |
| Median Household Income | $36,090 | $14 |
| Monthly Housing Costs | $301 | $0 |
| Real Estate Taxes | $689 | $20 |
Property Value by Mortgage Status in Motley
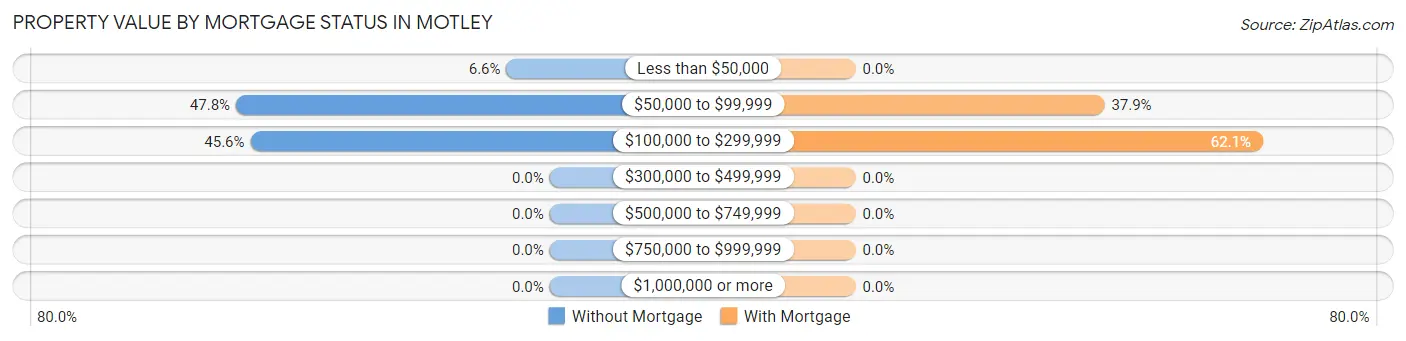
| Property Value | Without Mortgage | With Mortgage |
| Less than $50,000 | 12 (6.6%) | 0 (0.0%) |
| $50,000 to $99,999 | 87 (47.8%) | 33 (37.9%) |
| $100,000 to $299,999 | 83 (45.6%) | 54 (62.1%) |
| $300,000 to $499,999 | 0 (0.0%) | 0 (0.0%) |
| $500,000 to $749,999 | 0 (0.0%) | 0 (0.0%) |
| $750,000 to $999,999 | 0 (0.0%) | 0 (0.0%) |
| $1,000,000 or more | 0 (0.0%) | 0 (0.0%) |
| Total | 182 (100.0%) | 87 (100.0%) |
Household Income by Mortgage Status in Motley
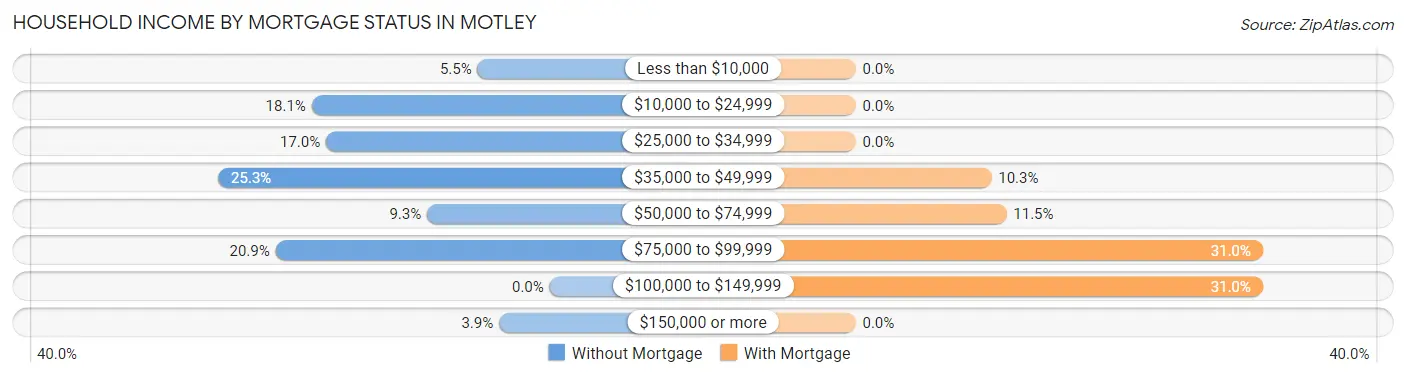
| Household Income | Without Mortgage | With Mortgage |
| Less than $10,000 | 10 (5.5%) | 0 (0.0%) |
| $10,000 to $24,999 | 33 (18.1%) | 0 (0.0%) |
| $25,000 to $34,999 | 31 (17.0%) | 0 (0.0%) |
| $35,000 to $49,999 | 46 (25.3%) | 9 (10.3%) |
| $50,000 to $74,999 | 17 (9.3%) | 10 (11.5%) |
| $75,000 to $99,999 | 38 (20.9%) | 27 (31.0%) |
| $100,000 to $149,999 | 0 (0.0%) | 27 (31.0%) |
| $150,000 or more | 7 (3.8%) | 0 (0.0%) |
| Total | 182 (100.0%) | 87 (100.0%) |
Property Value to Household Income Ratio in Motley
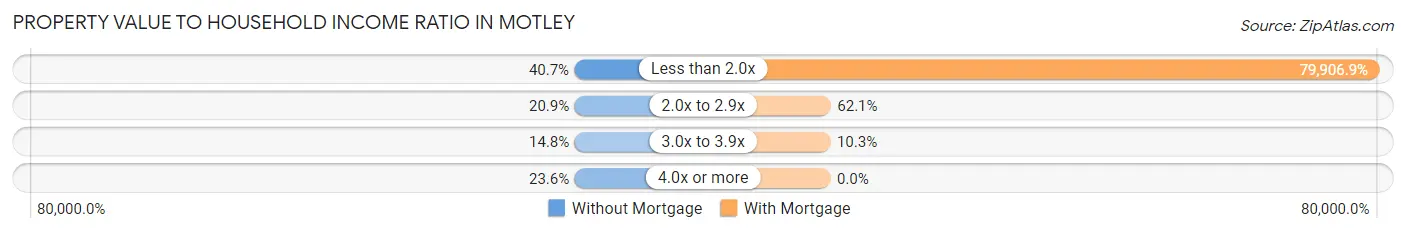
| Value-to-Income Ratio | Without Mortgage | With Mortgage |
| Less than 2.0x | 74 (40.7%) | 69,519 (79,906.9%) |
| 2.0x to 2.9x | 38 (20.9%) | 54 (62.1%) |
| 3.0x to 3.9x | 27 (14.8%) | 9 (10.3%) |
| 4.0x or more | 43 (23.6%) | 0 (0.0%) |
| Total | 182 (100.0%) | 87 (100.0%) |
Real Estate Taxes by Mortgage Status in Motley
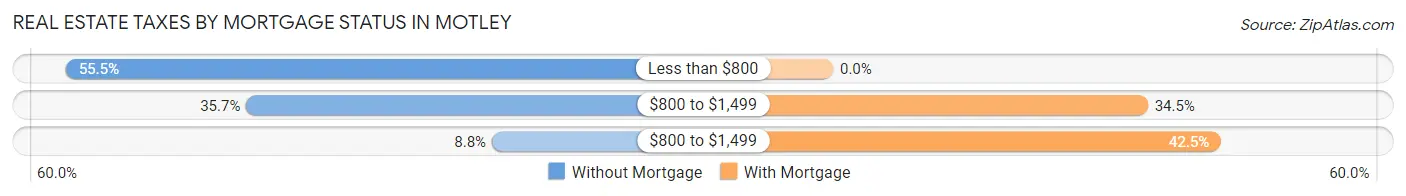
| Property Taxes | Without Mortgage | With Mortgage |
| Less than $800 | 101 (55.5%) | 0 (0.0%) |
| $800 to $1,499 | 65 (35.7%) | 30 (34.5%) |
| $800 to $1,499 | 16 (8.8%) | 37 (42.5%) |
| Total | 182 (100.0%) | 87 (100.0%) |
Health & Disability in Motley
Health Insurance Coverage by Age in Motley
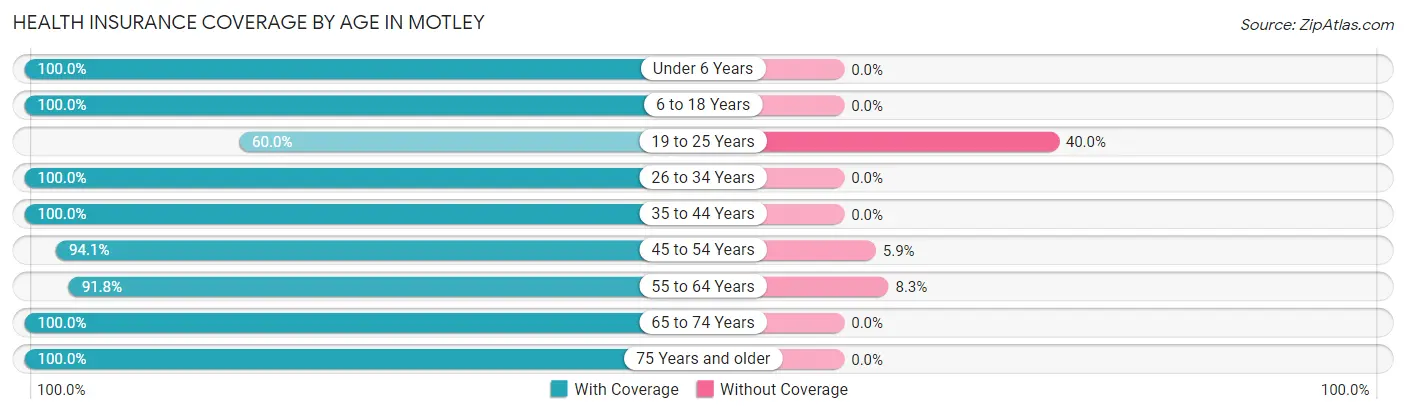
| Age Bracket | With Coverage | Without Coverage |
| Under 6 Years | 8 (100.0%) | 0 (0.0%) |
| 6 to 18 Years | 78 (100.0%) | 0 (0.0%) |
| 19 to 25 Years | 30 (60.0%) | 20 (40.0%) |
| 26 to 34 Years | 16 (100.0%) | 0 (0.0%) |
| 35 to 44 Years | 10 (100.0%) | 0 (0.0%) |
| 45 to 54 Years | 160 (94.1%) | 10 (5.9%) |
| 55 to 64 Years | 178 (91.7%) | 16 (8.3%) |
| 65 to 74 Years | 112 (100.0%) | 0 (0.0%) |
| 75 Years and older | 124 (100.0%) | 0 (0.0%) |
| Total | 716 (94.0%) | 46 (6.0%) |
Health Insurance Coverage by Citizenship Status in Motley
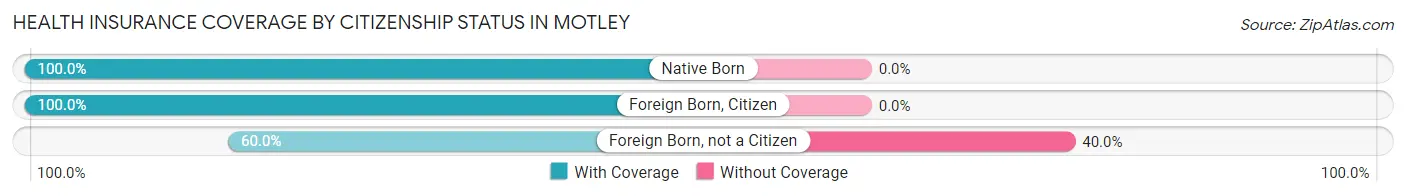
| Citizenship Status | With Coverage | Without Coverage |
| Native Born | 8 (100.0%) | 0 (0.0%) |
| Foreign Born, Citizen | 78 (100.0%) | 0 (0.0%) |
| Foreign Born, not a Citizen | 30 (60.0%) | 20 (40.0%) |
Health Insurance Coverage by Household Income in Motley

| Household Income | With Coverage | Without Coverage |
| Under $25,000 | 133 (98.5%) | 2 (1.5%) |
| $25,000 to $49,999 | 234 (96.7%) | 8 (3.3%) |
| $50,000 to $74,999 | 116 (76.3%) | 36 (23.7%) |
| $75,000 to $99,999 | 174 (100.0%) | 0 (0.0%) |
| $100,000 and over | 59 (100.0%) | 0 (0.0%) |
Public vs Private Health Insurance Coverage by Age in Motley
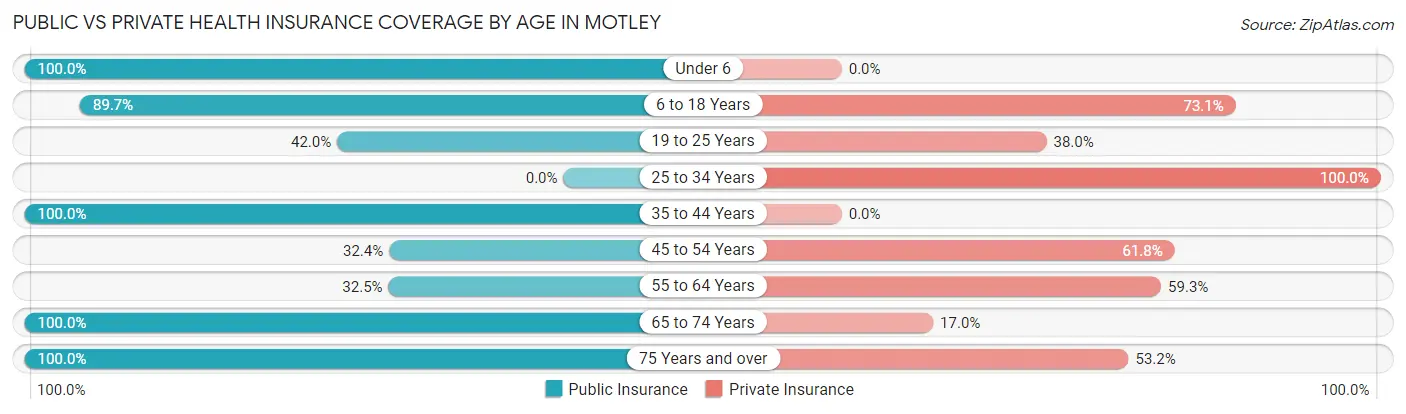
| Age Bracket | Public Insurance | Private Insurance |
| Under 6 | 8 (100.0%) | 0 (0.0%) |
| 6 to 18 Years | 70 (89.7%) | 57 (73.1%) |
| 19 to 25 Years | 21 (42.0%) | 19 (38.0%) |
| 25 to 34 Years | 0 (0.0%) | 16 (100.0%) |
| 35 to 44 Years | 10 (100.0%) | 0 (0.0%) |
| 45 to 54 Years | 55 (32.4%) | 105 (61.8%) |
| 55 to 64 Years | 63 (32.5%) | 115 (59.3%) |
| 65 to 74 Years | 112 (100.0%) | 19 (17.0%) |
| 75 Years and over | 124 (100.0%) | 66 (53.2%) |
| Total | 463 (60.8%) | 397 (52.1%) |
Disability Status by Sex by Age in Motley
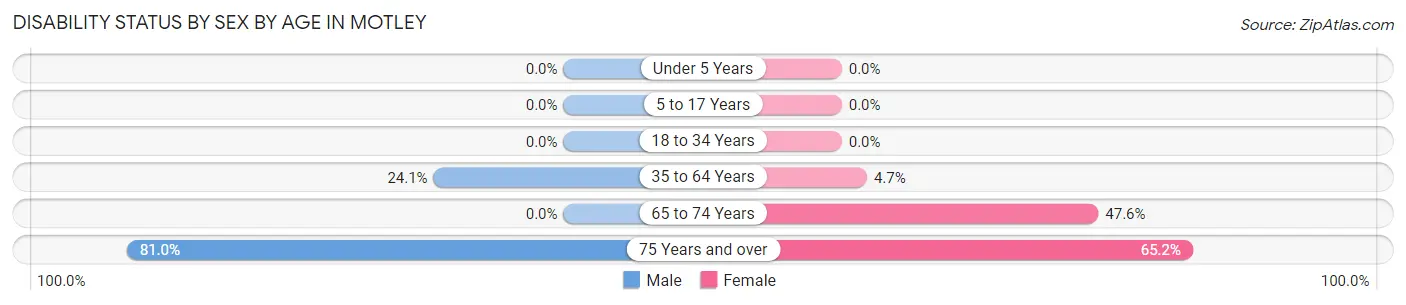
| Age Bracket | Male | Female |
| Under 5 Years | 0 (0.0%) | 0 (0.0%) |
| 5 to 17 Years | 0 (0.0%) | 0 (0.0%) |
| 18 to 34 Years | 0 (0.0%) | 0 (0.0%) |
| 35 to 64 Years | 54 (24.1%) | 7 (4.7%) |
| 65 to 74 Years | 0 (0.0%) | 40 (47.6%) |
| 75 Years and over | 47 (81.0%) | 43 (65.1%) |
Disability Class by Sex by Age in Motley
Disability Class: Hearing Difficulty
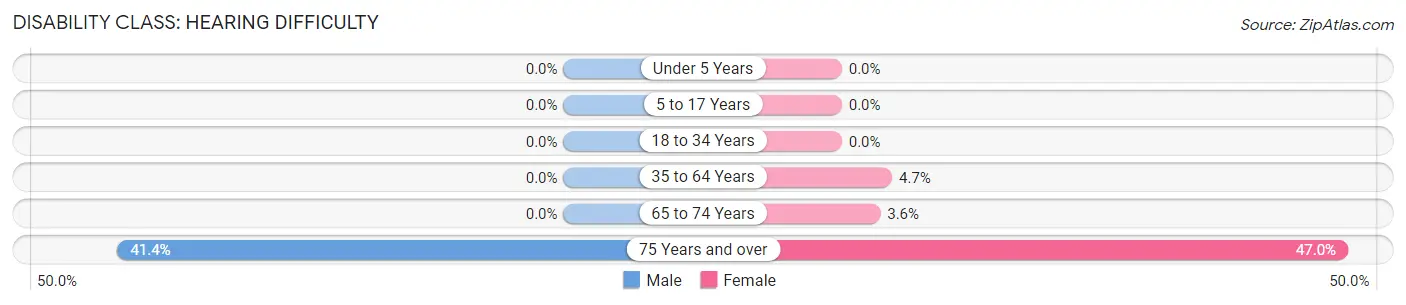
| Age Bracket | Male | Female |
| Under 5 Years | 0 (0.0%) | 0 (0.0%) |
| 5 to 17 Years | 0 (0.0%) | 0 (0.0%) |
| 18 to 34 Years | 0 (0.0%) | 0 (0.0%) |
| 35 to 64 Years | 0 (0.0%) | 7 (4.7%) |
| 65 to 74 Years | 0 (0.0%) | 3 (3.6%) |
| 75 Years and over | 24 (41.4%) | 31 (47.0%) |
Disability Class: Vision Difficulty
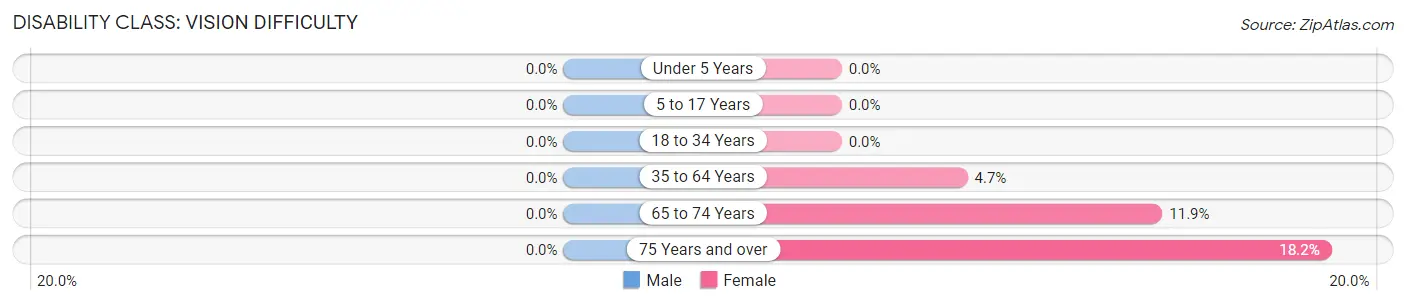
| Age Bracket | Male | Female |
| Under 5 Years | 0 (0.0%) | 0 (0.0%) |
| 5 to 17 Years | 0 (0.0%) | 0 (0.0%) |
| 18 to 34 Years | 0 (0.0%) | 0 (0.0%) |
| 35 to 64 Years | 0 (0.0%) | 7 (4.7%) |
| 65 to 74 Years | 0 (0.0%) | 10 (11.9%) |
| 75 Years and over | 0 (0.0%) | 12 (18.2%) |
Disability Class: Cognitive Difficulty
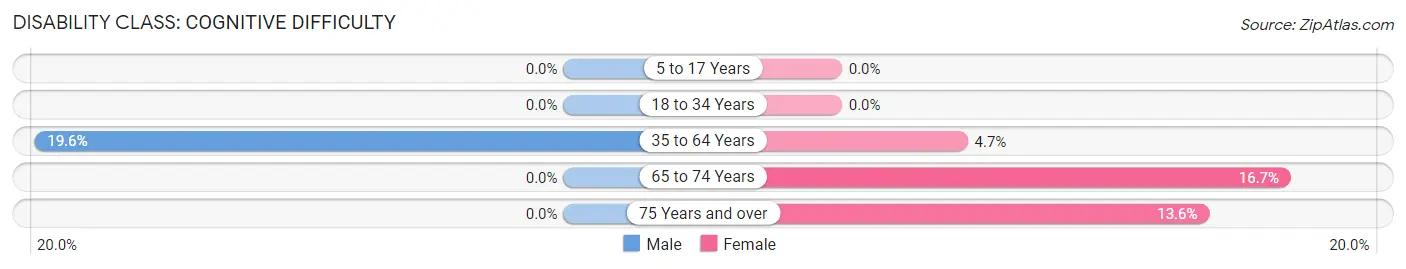
| Age Bracket | Male | Female |
| 5 to 17 Years | 0 (0.0%) | 0 (0.0%) |
| 18 to 34 Years | 0 (0.0%) | 0 (0.0%) |
| 35 to 64 Years | 44 (19.6%) | 7 (4.7%) |
| 65 to 74 Years | 0 (0.0%) | 14 (16.7%) |
| 75 Years and over | 0 (0.0%) | 9 (13.6%) |
Disability Class: Ambulatory Difficulty
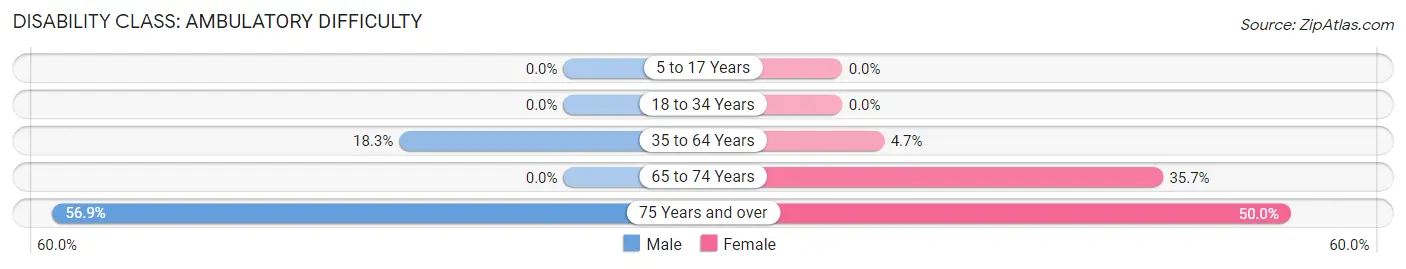
| Age Bracket | Male | Female |
| 5 to 17 Years | 0 (0.0%) | 0 (0.0%) |
| 18 to 34 Years | 0 (0.0%) | 0 (0.0%) |
| 35 to 64 Years | 41 (18.3%) | 7 (4.7%) |
| 65 to 74 Years | 0 (0.0%) | 30 (35.7%) |
| 75 Years and over | 33 (56.9%) | 33 (50.0%) |
Disability Class: Self-Care Difficulty
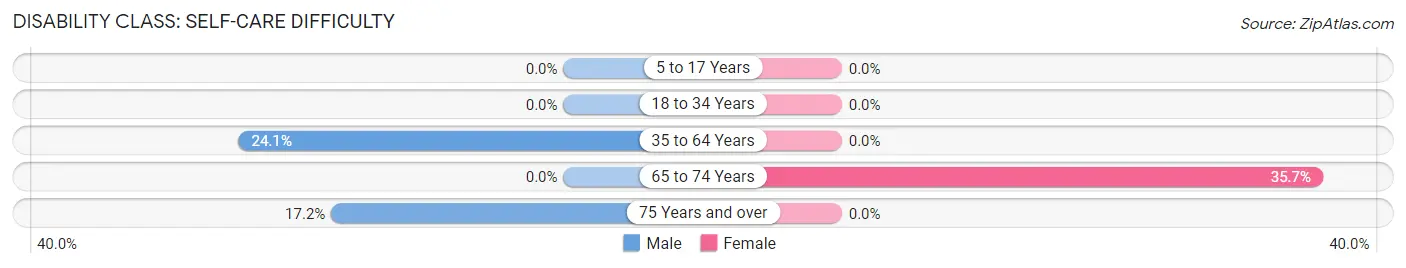
| Age Bracket | Male | Female |
| 5 to 17 Years | 0 (0.0%) | 0 (0.0%) |
| 18 to 34 Years | 0 (0.0%) | 0 (0.0%) |
| 35 to 64 Years | 54 (24.1%) | 0 (0.0%) |
| 65 to 74 Years | 0 (0.0%) | 30 (35.7%) |
| 75 Years and over | 10 (17.2%) | 0 (0.0%) |
Technology Access in Motley
Computing Device Access in Motley
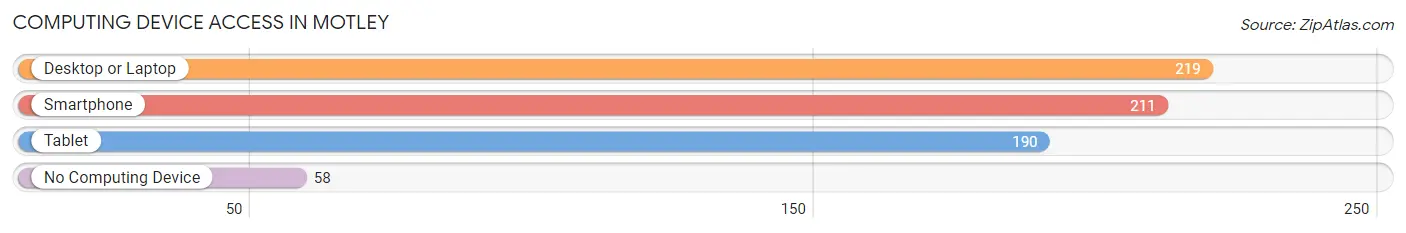
| Device Type | # Households | % Households |
| Desktop or Laptop | 219 | 63.7% |
| Smartphone | 211 | 61.3% |
| Tablet | 190 | 55.2% |
| No Computing Device | 58 | 16.9% |
| Total | 344 | 100.0% |
Internet Access in Motley
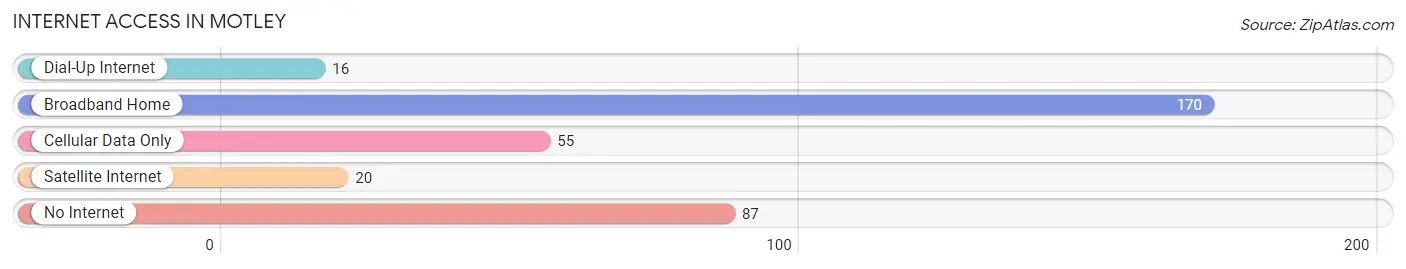
| Internet Type | # Households | % Households |
| Dial-Up Internet | 16 | 4.6% |
| Broadband Home | 170 | 49.4% |
| Cellular Data Only | 55 | 16.0% |
| Satellite Internet | 20 | 5.8% |
| No Internet | 87 | 25.3% |
| Total | 344 | 100.0% |
Motley Summary
MOTLEY VIRGINIA
Motley, Virginia is a small town located in the southwestern part of the state, in the Appalachian Mountains. It is situated in the county of Tazewell, and is part of the Blue Ridge Mountains region. The town has a population of just over 1,000 people, and is known for its rural charm and small-town atmosphere.
History
The town of Motley was first settled in the late 1700s by a group of settlers from North Carolina. The town was named after a local landowner, William Motley, who owned a large tract of land in the area. The town was officially incorporated in 1891, and has remained a small, rural community ever since.
The town was an important stop on the Norfolk and Western Railway, which ran through the area in the late 1800s and early 1900s. The railway brought a great deal of economic activity to the area, and the town grew rapidly. The railway also helped to connect the town to the larger cities of Virginia, such as Roanoke and Richmond.
The town was also home to a number of coal mines, which provided employment for many of the town’s residents. The coal industry was an important part of the town’s economy until the mid-1900s, when the mines began to close due to a decline in demand.
Geography
Motley is located in the Appalachian Mountains, in the southwestern part of the state. The town is situated in the county of Tazewell, and is part of the Blue Ridge Mountains region. The town is surrounded by rolling hills and mountains, and is located near the Appalachian Trail.
The town is located at an elevation of 1,400 feet, and has a total area of 1.2 square miles. The town is located near the Clinch River, which is a popular destination for fishing and other outdoor activities.
Economy
The economy of Motley is largely based on tourism and agriculture. The town is home to a number of small businesses, including restaurants, shops, and other services. The town is also home to a number of farms, which produce a variety of crops, including corn, soybeans, and hay.
The town is also home to a number of manufacturing companies, which produce a variety of products, including furniture, clothing, and other items. The town is also home to a number of coal mines, which provide employment for many of the town’s residents.
Demographics
As of the 2010 census, the population of Motley was 1,072. The town has a population that is predominantly white, with a small percentage of African Americans and other minorities. The median household income in the town is $30,000, and the median age is 40.
The town is home to a number of churches, including the First Baptist Church, the Church of God, and the Church of Jesus Christ of Latter-day Saints. The town is also home to a number of schools, including Motley Elementary School, Motley High School, and Motley Middle School.
Conclusion
Motley, Virginia is a small town located in the southwestern part of the state, in the Appalachian Mountains. The town has a population of just over 1,000 people, and is known for its rural charm and small-town atmosphere. The town’s economy is largely based on tourism and agriculture, and the town is home to a number of small businesses, farms, and manufacturing companies. The town is also home to a number of churches and schools.
Common Questions
What is Per Capita Income in Motley?
Per Capita income in Motley is $27,874.
What is the Median Family Income in Motley?
Median Family Income in Motley is $67,692.
What is the Median Household income in Motley?
Median Household Income in Motley is $43,125.
What is Income or Wage Gap in Motley?
Income or Wage Gap in Motley is 38.2%.
Women in Motley earn 61.8 cents for every dollar earned by a man.
What is Inequality or Gini Index in Motley?
Inequality or Gini Index in Motley is 0.43.
What is the Total Population of Motley?
Total Population of Motley is 762.
What is the Total Male Population of Motley?
Total Male Population of Motley is 389.
What is the Total Female Population of Motley?
Total Female Population of Motley is 373.
What is the Ratio of Males per 100 Females in Motley?
There are 104.29 Males per 100 Females in Motley.
What is the Ratio of Females per 100 Males in Motley?
There are 95.89 Females per 100 Males in Motley.
What is the Median Population Age in Motley?
Median Population Age in Motley is 56.4 Years.
What is the Average Family Size in Motley
Average Family Size in Motley is 2.6 People.
What is the Average Household Size in Motley
Average Household Size in Motley is 2.2 People.
How Large is the Labor Force in Motley?
There are 336 People in the Labor Forcein in Motley.
What is the Percentage of People in the Labor Force in Motley?
47.2% of People are in the Labor Force in Motley.
What is the Unemployment Rate in Motley?
Unemployment Rate in Motley is 0.6%.